Embed Size (px)
Citation preview

1
A Two-Stage Service Restoration Method forElectric Power Distribution Systems
Shiva Poudel, Student Member, IEEE and Anamika Dubey, Member, IEEE,
Abstract—Improving the reliability of power distribution sys-tems is critically important for both utilities and customers.This calls for an efficient service restoration module within adistribution management system to support the implementationof self-healing smart grid networks. The emerging smart gridtechnologies, including distributed generators (DGs) and remote-controlled switches, although enhance the self-healing capabilityand allow faster recovery, pose additional complexity to theservice restoration problem, especially under cold load pickup(CLPU) conditions. In this paper, we propose a novel two-stage restoration framework to generate restoration solutionswith a sequence of control actions. The first stage generatesa restoration plan that supports both the traditional servicerestoration using feeder reconfiguration and the grid-formingDG-assisted intentional islanding methods. The second stagegenerates an optimal sequence of switching operations to bringthe outaged system quickly to the final restored configuration.The problem is formulated as a mixed-integer linear programthat incorporates system connectivity, operating constraints, andCLPU models. It is demonstrated using a multi-feeder test casethat the proposed framework is effective in utilizing all availableresources to quickly restore the service and generates an optimalsequence of switching actions to be used by the operator to reachthe desired optimal configuration.
Index Terms—Distribution systems operations, distributionmanagement system, service restoration, cold load pick-up,switching sequence.
NOMENCLATURE
A. SetsEF Set of faulted or tripped switchesEtS Set of normally-open tie switchesEsS Set of normally-closed sectionalizing switchesΦ = {a, b, c}Set of phases of a busE Set of physical linesV Set of physical system busesVS Set of remotely switchable busesES Set of switchable lines. i.e. ErS ∪ EtSEc Set of switches in a cycle cEvS Set of virtual edges for DGs connectionER Set of voltage regulators
B. Variablesvi Bus energization variablePφe + jQφe Complex power flow from i to jδe Line or switch decision variablesi Load pick-up variablePe + jQe Three-phase complex power flow from i to j
S. Poudel and A. Dubey are with the School of Electrical Engineering andComputer Science, Washington State University, Pullman, WA 99164, USA.E-mail: [email protected], [email protected]
Ui Three-phase voltage magnitude square vectorVi Three-phase voltage vector for bus i
C. ParametersSratede Apparent power flow limit for e ∈ EPφLi + jQφLi Complex power demand at i for phase φ ∈ ΦSe Polygon based linearized equivalent of Sratede
PmaxG Maximum active power capacity of a DGQmaxG Maximum reactive power capacity of a DG|Ec| Number of switches in a cycle cre/xe Resistance/Reactance matrix of a line e :
(i, j) ∈ EPLi + jQLi Three-phase complex load demand at bus i
I. INTRODUCTION
The electric power grid is essential to modern society foreconomic prosperity, national security, and public health andsafety. The electric power distribution systems are the “lastmile” of the power supply that delivers electric power tothe end-users. It is worth mentioning that 90% of customeroutage-minutes are due to the damages in the local distributionsystems [1]. Although several efforts have been made and toimprove the distribution system reliability, the power outagesand faults in the distribution systems are inevitable. Further,natural disasters can cause significant damages to the mid-voltage and low-voltage power distribution systems resultingin economic losses due to lost productivity and increasedconcerns to customer safety due to power disruptions forextended periods. The increased dependence on electric powergrid coupled with the increasing number of natural disastersmotivates the need for improving the reliability and resilienceof the electric power distribution systems [2], [3].
In past few years, several efforts have been made towardsdeveloping self-healing power distribution systems that canautomatically identify, isolate, and restore the outaged area toimprove grid reliability, resilience, and security in responseto a wide variety of emergencies such as natural calamities,intentional attack, or human error [4], [5]. The highest levelsof service reliability are achieved when the distribution systemis designed and operated to minimize the effects of anyfault that may occur. Along these lines, the Fault LocationIsolation and Service Restoration (FLISR) is one of the mostcritical applications currently being adopted by the majorityof distribution utility companies and also made availableby most advanced distribution management system (ADMS)vendors to autonomously manage the system outages[6], [7]. Adistribution service restoration (DSR) algorithm is a part of the
arX
iv:2
004.
0792
1v1
[ee
ss.S
Y]
16
Apr
202
0

2
complete FLISR application that develops a service restorationplan in the aftermath of a disruption to restore the powersupply to the healthy feeders using feeder reconfigurationand intentional islanding using distributed generation (DGs)resources. This paper is focused on developing computation-ally tractable algorithms for distribution service restoration(DSR) by leveraging all available resources including DGswhile accounting for the critical connectivity and operatingconstraints.
A. Literature Review
There is an extensive literature on solving the DSR prob-lem for the power distribution systems. Earlier methods forDSR focused on designing expert systems, including heuristicsearch methods and use of soft-computing algorithms [8], [9],[10]. The use of feeder reconfiguration algorithms to restorethe system for local outages has been well-studied in theliterature, where DSR is normally modeled as a combinatorialoptimization problem with operational and topological con-straints [11], [12], [13]. To address the growing concerns ofnatural disasters, recently, some emerging DSR methods havebeen proposed to restore distribution systems during naturaldisasters using intentional islanding supported by microgridsand DGs [14], [15], [16], [17], [18], [19], [20].
To reduce the outage duration, a DSR algorithm must (1)incorporate all available resources including DGs to restore amaximum number of customers and (2) generate an efficientrestoration plan that allows the system operators to quicklyrestore the outaged system. Unfortunately, a majority of theexisting DSR methods are limited to finding the final restoredconfiguration for the given system. They formulate the DSRproblem as a single-stage optimization problem. The single-step methods do not generate the sequence of intermediatefeasible restored topologies that are required to reach thefinal restored configuration. Note that the system operatorscarry out a sequence of switching operations to restore thedistribution system from a post-fault configuration to thefinal restored configuration. Thus, an efficient restoration planshould generate a sequence of switching actions required tobring the disrupted system to a restored network configura-tion that maximizes the total number of loads picked-up byusing all available resources. Notice that the generation ofswitching sequence requires careful consideration of distribu-tion system’s operating constraints such that the intermediatetopologies are power flow feasible and do not violate voltageand thermal limit constraints especially due to cold-load pick-up (CLPU) issues following an extended outage in systemswith a high penetration of thermostatically controlled devices[21]. Besides, the consecutive switching sequences shouldnot interrupt the service to an already restored distributioncustomer.
A few have addressed the problem of switching sequencegeneration for DSR; prominent methods include genetic al-gorithm, dynamic programming, mixed-integer programming,and sequential optimization methods [22], [23], [24], [25]. Amajority of the existing algorithms employed to generate theswitching sequences work well for conventional distributionsystems that do not actively utilize DGs in the restoration
process [22], [23], [24]. Integrating the operation of DGs intothe DSR problem introduces both unprecedented opportunitiesand challenges when generating a restoration sequence forfeeder reconfiguration and active islanding using DGs. Anapproach based on particle swarm optimization is proposedfor DG allocation for a single-step restoration under CLPUcondition [26]. However, this approach is a single step restora-tion and cannot generate a feasible switching sequence for therestoration plan. To account for the time-critical operationswhen restoring the distribution grid, an approach based onsequential optimization is proposed in [25]; however, it poseslimitations to selecting the length of time-horizon to balancethe computation tractability of the algorithm and solutionquality.
B. Specific Contributions
To address the aforementioned challenges, we proposea two-stage service restoration framework for multi-feederdistribution systems with grid-forming DGs. The proposedDSR framework (1) utilizes all available resources includinghealthy feeders and grid forming DGs to restore a maximumnumber of distribution customers and (2) generates a sequenceof switching actions that leads to the final restored networkconfiguration via intermediate steps of restored networks thatdo not violate system operating constraints while consideringCLPU and do not disrupt the power supply to an alreadyrestored customer. The specific contributions are listed below:
1) Two-stage DG-assisted Restoration and Switching Se-quence Generation with Col Load Pick-up (CLPU):A two-stage DSR algorithm is proposed that considersfeeder reconfiguration and active islanding methods us-ing grid-forming DGs into one unified framework.
– The first stage of the problem effectively integratesDG-assisted restoration into traditional DSR prob-lem and enforces active islanding of distributionsystem, when required, thus ensuring the restorationof a maximum number of distribution customers. Itis ensured that the restored network and DG-assistedislands operate in a radial topology via optimal andpower-flow feasible restoration paths.
– The second stage of the problem generates a se-quence of switching actions such that the system cantransit from post-faulted condition to final restoredsystem configuration optimally and feasibly. Theloss of load diversity is taken into account whileconsidering the behavior of outage loads underCLPU conditions.
2) Scalable MILP formulation for the restoration of a three-phase unbalanced multi-feeder distribution system:Both stages of the proposed methodology are modeledas a mixed-integer linear program (MILP) such that theproposed framework easily scales for a large unbalancedthree-phase distribution system. The approach can eas-ily incorporate any new resource (DG/feeder) and/ornew switches without significantly increasing the overallcomputational complexity and generate the sequence of

3
Determine:
Restoration sequence
Maximize: Loads picked at
each operation
Crew
dispatch
DG
Distribution Management System
CIS
AMR/AMI
SCADA
IVR
Network Model
Load Estimation
DG information
Execute:
Restoration Plan
Closed switch
Tie switch
Load
Open switch
Feeder CB
Fault
DSR
Data
Control
Maximize: Total outaged
loads picked up
Generate:
Final Configuration
GIS and
Asset Registry
VVC
ECM
LSB
OMS
Advanced
Apps
Fig. 1: Proposed two-stage framework for distribution system restoration: work flow in a distribution management system (DMS)
switching operations to optimally restore the distributionsystems.
The rest of the paper is organized as the following. Section2 describes the overall architecture of the proposed DSRframework and its integration within a modern distributionmanagement system (DMS). Sections 3, 4 and 5 introducethe mathematical description and detail formulations for theStage 1 and Stage 2 of the proposed DSR algorithm. Section6 presents the simulation results on a 4-feeder 1069-bus dis-tribution test system. Finally, the summary and future researchdirections are stated in Section 7.
II. PROPOSED DSR FRAMEWORK: OVERALLARCHITECTURE
A Distribution Management System (DMS) supports gridmanagement and decision support applications for efficient andreliable operation of the electric power distribution systems.FLISR is a distribution automation application that networksgroups of switches and available distributed resources on afeeder to vastly improve the reliability of utility deliveredpower by “localizing outages” [27]. A FLISR applicationperforms four related actions to restore the power supplyafter an outage: senses trips in switches that are monitoredand controlled by SCADA, locate/identify the faulted sectionsusing triggered protection devices and smart meter pings orcustomer calls, isolates the faulted section by opening theappropriate switching devices and restores the power supplyto the healthy feeders using feeder reconfiguration and inten-tional islanding using DGs [2], [27]. A distribution servicerestoration (DSR) algorithm is employed to perform the fourthstep that is also most expensive in terms of computationalneeds. It is worth mentioning that FLISR does not avoidoutages but decreases the total outaged time experienced bythe distribution customers.
This article is focused on developing a computationallytractable DSR application for the distribution systems. Theproposed DSR application aims to advance the conventionalservice restoration techniques by coordinating emerging DGtechnology with other controllable devices (such as switches,breakers) to achieve more efficient restoration solutions. Morespecifically, the proposed two-stage framework within the DSR
will generate a sequence of control actions that optimallycoordinate feeder reconfiguration and DG islanding to restorethe maximum distribution loads.
For completeness, the implementation of the proposed DSRmethod within a DMS is depicted in Fig. 1. Once a poweroutage is detected, the OMS will collect information from thedistribution supervisory control and data acquisition (SCADA)system, customer information system (CIS), interactive voiceresponse (IVR), and smart meters, as well as the reports fromthe field crew. The network model, CLPU load estimation,and resources available for restoration are updated basedon the collected information and asset registry in the DMSdatabase. The proposed two-stage DSR algorithm will generatea restoration sequence that can be executed remotely throughSCADA or manually by the field crew. The two stages of theproposed DSR algorithm are briefly introduced in this section.The detailed model and formulation for the proposed two-stageDSR framework are described in Sections 4 and 5.
A. Stage 1: Generate Optimal Restoration Topology
During an outage, protection devices isolate certain partsof a distribution system including the faulty elements. Whilereplacing faulty elements may be time-consuming, existinghealthy switches could reconfigure the system to alleviate theoutage effect. Thus, in the first stage of the proposed algorithm,an optimal network configuration problem is solved assumingthe system transitions instantaneously from the post-fault tothe restored configuration. Specifically, given the post-faultstatus of the network, the first stage of the problem obtains anoptimal restored network topology that minimizes the impactsof the outages while complying with the system’s operationalconstraints. The restoration plan includes the possibility ofintentional DG-supplied islands (with the grid-forming capa-bility) to restore additional loads. The problem is formulatedas an MILP to maximize the restored loads subject to networkoperational and topological constraints. The decision variablesare switch (line/load) statuses and the statuses of grid-formingDGs.
B. Stage 2: Generate Optimal Switching Sequences
In practice, the transition from post-fault topology to newnetwork topology (with restored loads) requires a sequence of

4
Isolated areaFault
�e = 0
Substation
Feeder-1
Feeder-2
Feeder-3
��
Isolate Fault
Picked-up loads (si = 1, vi = 1)
Energized buses (vi = 1, si = 0)
Unenergized buses (vi = 0, si = 0)Regulator
Sectionalizing Switch Tie Switch
Open
Close
Open
Close
�� Distributed Generators
�e = 0
�e = 0
�e = 1
�e = 1�e = 1
Fig. 2: An example restoration scenario. The colors indicateenergized feeder sections and binary variables define thetopology.
reconfiguration/switching steps involving one control actionat a time. Note that the simultaneous action of multipleswitches is not recommended as it might lead to temporarymeshed/looped topologies that might be detrimental to thedistribution system protection scheme designed for radialtopologies. Further, due to cold-load pickup (CLPU), a stagedrestoration is preferred to ensure that the network thermaland voltage limit constraints are not violated. In the secondstage of the proposed DSR algorithm, we solve the problemof generating an optimal sequence of switching actions togenerate a sequence of power flow feasible restoration plan.The problem objective is to maximize the load restored at eachswitching step while ensuring that the operational constraintsare satisfied. This stage generates the optimal way to transi-tion the faulted system from post-fault condition to restoredtopology that was generated in Stage 1.
III. GRID MODELING, VARIABLES, AND ASSUMPTIONS
A. Graphical Representation for Distribution System
We represent the distribution system comprised of multiplefeeders and DGs using a connected graph, G(V, E), wherebuses are modeled as vertices and physical line sectionsincluding switches as edges. Any edge, e ∈ E , is defined by itsincident nodes (i, j) with (i, j) ∈ V where the binary decisionvariables for buses and edges are shown in Fig. 2.
The normal operating tree of a well-planned distributionnetwork is given as To = (Vo, Eo) where all tie-switchesare open, all grid-forming DGs are disconnected, and allsectionalizing-switches are closed. Once a fault occurs on anormal operating tree, the proposed DSR algorithm identifiesa desired tree/subtrees within the original graph, G, that max-imizes the given objective function of restoring loads subjectto various connectivity and operating constraints. After thesuitable switching scheme is implemented, the new operatingtree is defined as T = (V, E) where E ⊆ E and V ⊆ V
(See Fig. 3). The original graph search problem of findingthe new operational tree corresponding to the restored distri-bution system is combinatorial. In this paper, we transformthe combinatorial problem into a mathematical programmingproblem.
B. Decision Variables
In this section, we define the binary variables associatedwith the proposed DSR algorithm. Note that the Stage-1 ofthe algorithm solves for the binary decision variables definedin this section to obtain an optimal restoration plan. The Stage-2 then generate the sequence in which the decision variablesneed to be realized to obtain the desired restored distributionsystem.
1) Bus Energization Variable: A binary variable vi ={0, 1} is assigned to each bus, where vi = 1 implies thatbus i is energized, while vi = 0 implies bus i is not energizedduring the restoration process.
2) Load Pick-up Variable: Each load bus is assigned abinary variable si = {0, 1} that represents the switch status ofthe load connected to the particular bus. This variable helpsin the case when only a few critical loads are to be restoredwithout restoring all the loads in the path. Note that for a loadto be restored, both si and vi must be 1.
3) Switch Variable: The circuit reconfiguration for restora-tion requires selecting a subset of switches to be closedand opened to maintain a radial operational topology for therestored network. A binary variable {δe}e∈ES ∈ {0, 1}|ES |is associated with each switch, where δe = 1 implies thatswitch connecting buses i and j is closed, while δe = 0implies that the switch is open. The decision on the line/switchbinary variable helps maintain a radial configuration for therestored network. The line variable will be used to formulatepower flow constraints and connectivity constraints for thedistribution system.
4) Grid-forming DG Status Variable: The complexity ofthe restoration problem in the distribution system increasessignificantly in the presence of grid-forming DGs that canintentionally island to restore additional loads. To formulate aunified DSR problem that enables restoration using both DGislands and other feeders, a virtual edge, δe, is added betweenthe sub-transmission bus and each grid-forming DG as shownin Fig. 2. The state of this edge determines whether the DG isin isolation mode (OFF) or an island is formed. If the virtualedge is closed, i.e, δe = 1 (e = i → j), DG located at busj operates in islanded mode. Note that this DG is virtuallyconnected to sub-transmission bus and therefore can injectthree-phase apparent power PG+jQG to bus j. However, toavoid the possible loop configuration, one of the switches inthe distribution system needs to be opened. The proposed DSRalgorithm takes this constraint into account to enable islandedoperation (see Fig. 2).
C. Assumptions
The following relevant and justifiable assumptions are madefor solving the proposed DSR problem.
5
G = (�, ℰ) ��o = (�o, ℰo) � = (�, ℰ)^ ^
Planning
model
Normal
operating tree
New
operating tree
��
� 1, ∀� ∈ ℰ�
�
��
� 0, ∀� ∈ ℰ�
� ∪ ℰ�
�
��
� 0, ∀� ∈ ℰ��
�
��
� 1, ∀� ∈ ℰ��
� ∪ ℰ��
�
Fault
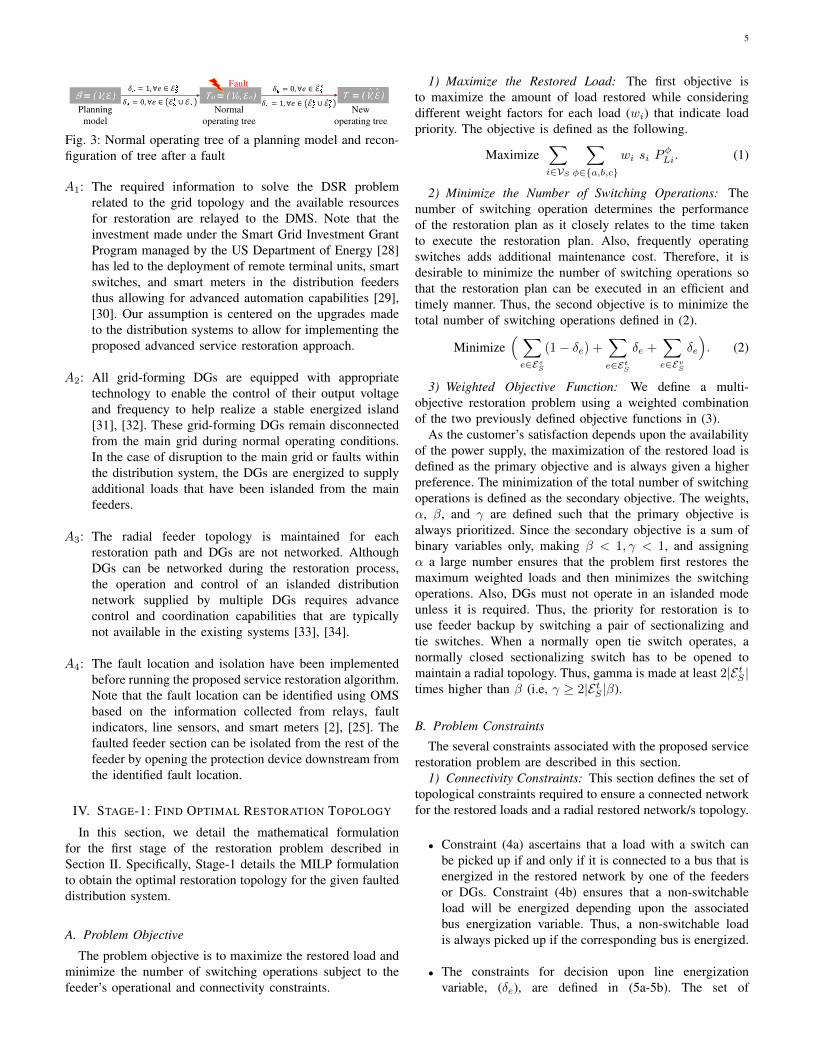
Fig. 3: Normal operating tree of a planning model and recon-figuration of tree after a fault
A1: The required information to solve the DSR problemrelated to the grid topology and the available resourcesfor restoration are relayed to the DMS. Note that theinvestment made under the Smart Grid Investment GrantProgram managed by the US Department of Energy [28]has led to the deployment of remote terminal units, smartswitches, and smart meters in the distribution feedersthus allowing for advanced automation capabilities [29],[30]. Our assumption is centered on the upgrades madeto the distribution systems to allow for implementing theproposed advanced service restoration approach.
A2: All grid-forming DGs are equipped with appropriatetechnology to enable the control of their output voltageand frequency to help realize a stable energized island[31], [32]. These grid-forming DGs remain disconnectedfrom the main grid during normal operating conditions.In the case of disruption to the main grid or faults withinthe distribution system, the DGs are energized to supplyadditional loads that have been islanded from the mainfeeders.
A3: The radial feeder topology is maintained for eachrestoration path and DGs are not networked. AlthoughDGs can be networked during the restoration process,the operation and control of an islanded distributionnetwork supplied by multiple DGs requires advancecontrol and coordination capabilities that are typicallynot available in the existing systems [33], [34].
A4: The fault location and isolation have been implementedbefore running the proposed service restoration algorithm.Note that the fault location can be identified using OMSbased on the information collected from relays, faultindicators, line sensors, and smart meters [2], [25]. Thefaulted feeder section can be isolated from the rest of thefeeder by opening the protection device downstream fromthe identified fault location.
IV. STAGE-1: FIND OPTIMAL RESTORATION TOPOLOGY
In this section, we detail the mathematical formulationfor the first stage of the restoration problem described inSection II. Specifically, Stage-1 details the MILP formulationto obtain the optimal restoration topology for the given faulteddistribution system.
A. Problem Objective
The problem objective is to maximize the restored load andminimize the number of switching operations subject to thefeeder’s operational and connectivity constraints.
1) Maximize the Restored Load: The first objective isto maximize the amount of load restored while consideringdifferent weight factors for each load (wi) that indicate loadpriority. The objective is defined as the following.
Maximize∑i∈VS
∑φ∈{a,b,c}
wi si PφLi. (1)
2) Minimize the Number of Switching Operations: Thenumber of switching operation determines the performanceof the restoration plan as it closely relates to the time takento execute the restoration plan. Also, frequently operatingswitches adds additional maintenance cost. Therefore, it isdesirable to minimize the number of switching operations sothat the restoration plan can be executed in an efficient andtimely manner. Thus, the second objective is to minimize thetotal number of switching operations defined in (2).
Minimize( ∑e∈EsS
(1− δe) +∑e∈EtS
δe +∑e∈EvS
δe
). (2)
3) Weighted Objective Function: We define a multi-objective restoration problem using a weighted combinationof the two previously defined objective functions in (3).
As the customer’s satisfaction depends upon the availabilityof the power supply, the maximization of the restored load isdefined as the primary objective and is always given a higherpreference. The minimization of the total number of switchingoperations is defined as the secondary objective. The weights,α, β, and γ are defined such that the primary objective isalways prioritized. Since the secondary objective is a sum ofbinary variables only, making β < 1, γ < 1, and assigningα a large number ensures that the problem first restores themaximum weighted loads and then minimizes the switchingoperations. Also, DGs must not operate in an islanded modeunless it is required. Thus, the priority for restoration is touse feeder backup by switching a pair of sectionalizing andtie switches. When a normally open tie switch operates, anormally closed sectionalizing switch has to be opened tomaintain a radial topology. Thus, gamma is made at least 2|EtS |times higher than β (i.e, γ ≥ 2|EtS |β).
B. Problem Constraints
The several constraints associated with the proposed servicerestoration problem are described in this section.
1) Connectivity Constraints: This section defines the set oftopological constraints required to ensure a connected networkfor the restored loads and a radial restored network/s topology.
• Constraint (4a) ascertains that a load with a switch canbe picked up if and only if it is connected to a bus that isenergized in the restored network by one of the feedersor DGs. Constraint (4b) ensures that a non-switchableload will be energized depending upon the associatedbus energization variable. Thus, a non-switchable loadis always picked up if the corresponding bus is energized.
• The constraints for decision upon line energizationvariable, (δe), are defined in (5a-5b). The set of

6
Stage 1: Final Optimal Configuration
Maximize:(α∑i∈VS
∑φ∈{a,b,c}
wi si PφLi − β
( ∑e∈Es
S
(1− δe)
−∑e∈Et
S
δe)− γ
∑e∈Ev
S
δe
).
(3)
Subject to: si ≤ vi, ∀i ∈ VS (4a)si = vi, ∀i ∈ V\VS . (4b)
δe ≤ vi, δe ≤ vj , ∀e ∈ ES\EF (5a)δe = 0, ∀e ∈ EF . (5b)
∑e∈Ec
δe ≤ |Ec| − 1, ∀e ∈ Ec. (6)∑e:(i,j)∈E
Pe = sj PLj +∑
e:(j,i)∈E
Pe (7a)
∑e:(i,j)∈E
Qe = sj QLj +∑
e:(j,i)∈E
Qe (7b)
Ui − Uj = 2(rePe + xeQe), ∀e ∈ E\(ES ∪ ER) (7c)
δe (Ui − Uj) = 2(rePe + xeQe), ∀e ∈ ES . (7d)
V φj = aφVφi , (8a)
Uj = AφUi, ∀e : (i, j) ∈ ER. (8b)
qφcap,i = uφcap,iqrated,φcap,i Uφi . (9)
viUmin ≤ Ui ≤ viUmax, ∀i ∈ V. (10)
(Pe)2 + (Qe)2 ≤
(Sratede
)2∀e ∈ E\ES . (11)
−√
3 (Pe + Se) ≤ Qe ≤ −√
3 (Pe − Se),
−√
3/2 Se ≤ Qe ≤√
3/2 Se,√3 (Pe − Se) ≤ Qe ≤
√3 (Pe + Se), ∀e ∈ E\ES .
(12)
δe[Mp Mq
]≤[Pe Qe
]≤ δe
[Mp Mq
], ∀e ∈ ES . (13)
∑φ∈{a,b,c}
Pφe ≤ δePmaxG ,∑
φ∈{a,b,c}
Qφe ≤ δeQmaxG , ∀e ∈ EvS .
(14)
where:re = Real{ααH} ⊗ re + Im{ααH} ⊗ xe,xe =Real{ααH}⊗xe+Im{ααH}⊗re, α = [1 e−j2π/3 ej2π/3]T
Se = Sratede
√(2π/n)/sin(2π/n) and n = 6
aφ =32∑i=1
biuφtap,i and
32∑i=1
uφtap,i = 1
equations implies that the decision on lines to be usedin the restoration depends upon the corresponding buses
and their energization statuses. Equation (5a) ensuresthat if a line with a switch is energized, the busesconnecting the line must be energized. The faults and theopen switches in the distribution network are modeledusing constraint (5b).
• A new radial configuration of the faulted distributionsystem is achieved by closing and opening the appropriatetie switches, sectionalizing switches, and virtual edges.A radial topology for restored network/s is ensured usingconstraint (6) that enforces at least one of the switches inany cycle to be open. All possible cycles in a distributionnetwork are enumerated using iterative loop countingalgorithm which is a “brute force” technique [35]. Then,(6) is written for each cycle. The number of cyclesin a graph increases with the increase in the numberof tie switches. Despite that, G is usually sparse for adistribution network where the total number of cyclesis much less than 2|V |. It is important to note that thisenumeration can be done offline by storing all the cyclesas it is fixed for a given planning model of a distributionnetwork. Thus, the enumeration approach does not affectthe real-time computational complexity.
2) Power Flow Constraints: A three-phase linearized ACpower flow model for the unbalanced distribution systemproposed in [36] is used in this work. The linearized modelis sufficiently accurate and applicable for restoration problems[36]. The restoration problem requires the decision upon whichlines are energized while accounting for network operatingconstraints. The power flow along a line is only valid if theline is energized. Therefore, to appropriately represent therestoration problem the branch flow equations are coupled withline and bus decision variables.• Constraints (7a-7d) represent three-phase unbalanced lin-
earized power flow equations and relates power injectionsand voltages. After ignoring the power losses, constraints(7a) and (7b) define active and reactive power flow foreach lines e ∈ E . Similarly, constraint (7c) defines voltageequations for non-switchable line while for switchablelines, the voltage drop applies only if the switch is closed(7d). Note that constraint (7d) is non-convex as it involvesproduct of variables. These constraints are linearized bydefining an auxiliary variable and using the big-M method[37]. The big-M method replaces the product of variablesby their linear convex envelopes to yield a relaxation ofthe original non-convex feasible set. Take for instance theproduct z = xy over a binary variable x ∈ {0, 1}, anda continuous variable y bounded within y ∈ [y, y]. Theconstraint z = xy can be equivalently expressed as fourlinear equality constraints.
xy ≤ z ≤ xy, (15a)
y + (x− 1)y ≤ z ≤ y + (x− 1)y. (15b)
To see the equivalence, substitute x = 0 in (15) to get z =0, and put x = 1 to get z = y. Note that all continuous-binary bilinear products encountered henceforth will behandled using the big-M method.

7
3) Voltage Regulator and Capacitor Banks Models: For alarge feeder, voltage regulators (VR) and capacitor banks (CB)may help restore additional loads that might not be possibledue to potential undervoltage issues. In this section, we detailthe mathematical model for VR and CB where VR tap positionand CB status are modeled as binary variables.
A 32-step VR with a voltage regulation range of ±10%is assumed. Let, aφ be the turn ratio for the VR connectedto phase φ of line e : (i, j) ∈ ER. Then aφ can take valuesbetween 0.9 to 1.1 with each step resulting in a change of0.00625 pu. Let, for uφtap,i ∈ {0, 1} be a binary variabledefined for each regulator step position i.e. i ∈ (1, 2, ..., 32).Define a vector bi ∈ {0.9, 0.90625, ..., 1.1}. Then, (8a) givesthe voltage relation between nodes i and j. Taking square ofvoltage equation, defining a2φ = Aφ, b2i = Bi, and realizingthat (uφtap,i)
2 = uφtap,i we obtain (8b) representing model forVR. Note that if a multi-phase VR is gang operated, a singleAφ, and uφtap,i variables are defined for each phase.
The reactive power generated by CB, qφcap,i, is defined as afunction of binary control variable uφcap,i ∈ {0, 1} indicatingthe status (On/Off) of the CB, its rated per-phase reactivepower qrated,φcap,i , and the square of the bus voltage at bus i forphase φ, Uφi in (9). The CB model is assumed to be voltagedependent and provides reactive power as a function of Uφiwhen connected, i.e. ucap,i = 1. For a three-phase CB, acommon control variable, uφcap,i, is defined for each phase.Both (8) and (9) include a product of binary and continuousvariables that can be easily linearized using the big-M method.
4) Network Operating Constraints: This section definesnodal voltage limit constraints and thermal limit constraintsfor lines and transformers.• The voltage of each bus should be within the limit as
specified in ANSI C84.1 and is ensured by equation(10). Umin and Umax are set to (0.95)2 and (1.05)2,respectively for each phase of the bus.
• The loading on the lines and transformers must notexceed the rated kVA capacity. The rated kVA capacityis specified for the transformers. The thermal limit for aline is, however, specified in terms of its ampacity. Weuse a nominal feeder voltage of 1 p.u. to convert lineampacity rating to their rated kVA capacity. The actualthermal limit constraint is specified using the quadraticequation in (11). We use the polygon-based linearizationapproach proposed in [38] to linearize (11) by a set oflinear constraints defined in (12). We use (12) instead of(11) in the MILP model.
• For reconfiguration purpose, it is required to forcethe line flow in open switches to be zero. If switchconnecting buses i and j is open (δe = 0), constraint(13) sets the power flow on the line (i, j) to 0. Else,box constraints on the power flow are enforced whereMp = −Mp and Mq = −Mq .
5) DG Operating Constraints: Constraint (14) ensures thatthe in-flow power of each DG from the sub-transmission busshould be less than or equal to the rated DG capacity. This is
Time to t1 t2
Duration of
outage
CLPU condition
Lo
adin
g f
acto
r
S
Load gaining
diversity
D pq (k)
u
S
d
Fig. 4: CLPU event for feeder demand
Stage 2: Optimal Switching Scheme
Maximize: ∑t∈T
∑i∈VS
∑φ∈{a,b,c}
wisi,tPφLi,t (16)
Subject to:T copies of Stage 1 constraints, variables indexed by t.
si,t ≥ si,t−1 ∀i ∈ VS , ∀t ∈ T (17a)
si,t = 1 ∀i ∈ VS , t = T|T | (17b)
δe,t−1 ≥ δe,t ∀e ∈ EsS , ∀t ∈ T (17c)
δe,t ≥ δe,t−1 ∀e ∈(EtS ∪ EvS
),∀t ∈ T (17d)∑
e∈EsS
(δe,t−1 − δe,t
)+
∑e∈(Et
S∪Ev
S)
(δe,t − δe,t−1
)<= 1, ∀t ∈ T
(17e)
δe,t = 0 ∀e ∈ EsS , t = T|T | (17f)
δe,t = 1 ∀e ∈(EtS ∪ EvS
), t = T|T | (17g)
δe,t = 0 ∀e ∈ {EtS − EtS}, t ∈ T (17h)
δe,t = 0 ∀e ∈ {EvS − EvS}, t ∈ T (17i)
δe,t = 1 ∀e ∈ {EsS − EsS}, t ∈ T. (17j)
where:EsS ⊆ EsS , EtS ⊆ EtS , and EvS ⊆ EvS are the set ofsectionalizing switches, tie switches, and DG switchesrespectively to operate to reach the final configuration.Similarly, VS is the set of nodes to be energizedby the final time step as per solution from Stage 1.
per the fact that all DGs are connected to the sub-transmissionbus using virtual edges to assist with intentional islanding viagrid forming DGs.
V. STAGE-2: FIND OPTIMAL SWITCHING SEQUENCE
In this section, we detail the problem formulation for theStage-2 of the proposed restoration algorithm. The Stage-2of the problem generates an optimal switching sequence tohelp realize the transition of the faulted system to the optimalrestoration topology obtained in the Stage-1. The formulationincludes the effects of cold load pick up (CPLU) constraints in

8
���
���
�
���
���
���
���
���
���
��
���
���
��� ���
�
�
��
���
��
��
��
���
���
�
��
�
�
��
��
���
���
���
��
��� ��
���
���
��
���
��� ���
���
��
�
���
��
��
���
���
�
���
���
���
��
��� ��� ���
���
�
���
���
���
���
���
��
��� �
�
���
��
��
���
��
���
���
���
��
���
���
���
���
���
��
��
��
���
���
�
��
���
��
��
��
���
�
�
���
���
��
���
��� ��
��
��
�� ��
��
���
��
�� ��
�� ���
���
���
�� ��
��
���
��
���
���
���
�
���
��
��� ���
��
���
���
�
�
���
��
��
��
��
��
��
�
���
���
��
���
��
���
��
���
��
��
��
��
��
�
��
��
��
�
���
���
��
��
��
��
��
���
���
��
��
��
��
��
���
�
��
��
�
��
��
�
�
��
���
�
��
��
���
�
��
�
��
���
��
��
���
��
���
��
��
��
��
�
�
���
��
�
��
�
��
��
��
���
�
��
�
��
��
�
��
��
��
���
��
���
���
��
�
��
��
��
�
��
��
���
���
��
���
���
��
�
��
��
���
��
��
�
��
���
��
��
��
��
��
�
1 181 259
255
262
233
234
232
244
243
236
237
240 245 241 249 252
261
256
254
75
230
235
238
260
239
251
229
264
250
263
266
77
246
24874257258
4 228
1 181 259
255
262
233
234
232
244
243
236
237
240 245 241 249 252
261
256
254
75
230
235
238
260
239
251
229
264
250
263
266
77
246
24874257258
4 228
1 181 259
255
262
233
234
232
244
243
236
237
240 245 241 249 252 256
254
75
230
235
238
260
239
251
229
264
250
263
266
77
246
24874257258
4 228
1 181 259
255
262
233
234
232
244
243
236
237
240 245 241 249 252
261
256
254
75
230
235
238
260
239
251
229
264
250
263
266
77
246
24874257258
4 228
261
Sub-
Transmission
node
��
��
��
��
F-a
F-b
F-c
F-d
4.56 MW
2.43 MVar
2.13 MW
0.72 MVar
1.58 MW
0.55 MVar
2.13 MW
0.92MVar
Detailed
Feeder
Sectionalizing switch
(Normally closed)
Voltage
Regulator
Tie switch
(Normally Open) FaultOverhead
LineService
TransformerSwitch
Underground
Line
Fig. 5: Simplified one-line diagram of the multi-feeder 1069-bus distribution system with seven additional tie switches andfour DGs.
generating the switching sequences. The problem objective isto obtain the sequence in which the sectionalizing switches, tieswitches, and load switches are to operate to enable the transi-tion of the distribution system from To to T without violatingsystem’s operating constraints during the intermediate steps. Inthe following section, first, we describe the load modeling forthe CPLU event. Next, we detail the MILP model to generatethe optimal switching sequence.
A. Load Modeling during CLPU Event
CLPU is observed when restoring the service to end-use loads specifically those with a regulated process suchas irrigation pumps or thermostatically controlled devices.In power distribution systems, due to the high penetrationof thermostatically and/or process controlled end-use loads,the distribution system can experience a significantly higherdemand when restoring the out-of-service area for outages asshort as 10 minutes. Out of the several causes for CLPU, lossof load diversity among the thermostatically controlled loads,which can persist for tens of minutes to hours is of greaterconcern as it increases the thermal loading of equipment andthus restricting the restoration of network due to the violationsin distribution system’s operating constraints [39], [26]. In ex-isting literature, several models have been proposed to estimatethe behavior of the loads under CLPU conditions includingphysical models, exponent models, probabilistic models, andregression-based models [21], [40]. However, the resultantCLPU characteristics are found to be in close agreement witha delayed exponential model [41], expressed mathematicallyin (18).
Dpq(k) =Sd + (Su − Sd).e−α(k−ti)
+Su[1− u(k − ti)].u(k − Ti).(18)
where, Dpq(k) is the scale factor on the CLPU curve atkth sample, Su is the undiversified loading factor, Sd is thediversified loading factor, α is the rate of load decay, Ti is therestoration time (t2), and u(.) is a step function. One of thechallenges with the formulation detailed in (18) is determiningthe correct delay time. This is especially challenging since
these values vary with time of day, season, and length of theoutage. One of the potential solutions is to use a stochasticmodeling approach. Note that estimating the parameters ofthe CLPU model described in (18) is beyond the scope ofthis paper. Please refer to [42], [43] for further information onCLPU models.
In this paper, we employ the delayed exponent CLPU modelas expressed in (18). We perform a piece-wise linearization ofthe given delayed exponent curve modeling the CLPU char-acteristics. The piece-wise linearization is done to avoid thenon-linearity in the resulting switching sequence generationproblem. Fig. 4 shows a delayed exponent model for a load.Note that in this model, the peak CLPU current is maintainedfor a specified amount of time following which the loaddemand decays exponentially. The outage occurs at t0, and theload is energized at t1. Due to the loss in load diversity, theundiversified loading factor at t1 is Su. The load starts to gaindiversity at t2 and decreases exponentially. The post-outagediversified loading factor is normally equal to the pre-outageloading level Sd. Note that the restoration time (t1) for eachload is not pre-determined. However, from the given CLPUcurve, we can calculate the load demand at each samplingtime. For simplicity, the CLPU curve is equally sampled andthe sampled values are picked up for the load at consecutivetime steps once the load energizing variable si becomes equalto 1. Assuming we discretize the CLPU curve for a particularload into total N equally sampled steps, the difference betweentwo scale factors at kth sample and (k− 1)th sample is givenby (19). Note that ∆Dpq(k) can be replaced with ∆PLi(k) and∆QLi(k) for formulating PLi,t and QLi,t respectively (Seeequation(20)).
∆Dpq(k) =
{0, k = 1
Dpq(k)− Dpq(k − 1), 1 < k ≤ N(19)
PLi,t = PLi(
Su si,t −N∑k=1
∆PLi(k) si,t−k+1
)(20a)
QLi,t = QLi(
Su si,t −N∑k=1
∆QLi(k) si,t−k+1
). (20b)

9
where, ∆PLi(k) and ∆QLi(k) are calculated using (18) and(19). Once CLPU demand is obtained for a particular time-step, t, i.e., PLi,t and QLi,t, the outaged load in (7) is replacedby the equivalent CLPU load demand for the Stage-2 problem.Note that to include CLPU effect in restoration problem,we coordinate the load control switch (si) along with thesectionalizing and tie-switches in the Stage-2 problem.
B. Optimal Switching Sequence
The restoration of the loads requires toggling of theswitches/devices whose initial and final positions differ as perthe solution from the Stage-1. This can easily be done withoutviolating the operational constraints simply by performing allof the opening actions before the closings. This naive orderingmay interrupt additional customers during the restoration pro-cess that need not be outaged thus resulting in a plan of poorutility. Therefore, instead, we optimally order the switchingactions in the Stage-2 of the proposed approach.
The Stage-2 is also formulated as an MILP model togenerate an optimal switching sequence over a horizon of Ttime steps. The T time steps are determined based on thetotal number of switching actions as obtained from the Stage-1 solution (T = {ts1, ts2, ts3, ...., tsn}). To accompany forstaged load picked up while including CLPU, each time stepis further divided into 5 smaller steps. Although increasing thenumber of time steps will allow restoration of additional loadsin the intermediate time steps, a higher value will increasethe number of variables. Therefore, the time steps should beselected carefully based on how many switching actions arerequired from the Stage-1 solution.
The problem variables and constraints include multiplecopies of those from the Stage-1, one per time-step. Theobjective of this stage is to maximize the total load restored ateach switching operation as defined in (16). This is to be ac-complished without disrupting the service to already restoredor uninterrupted customer loads. Constraint (17) updates thepositions of the line and load control switches at each timestep while taking into account all possible closing/openingoperations.• Constraint (17a) ensures that loads once picked are not
interrupted during the consecutive sequence of restorationactions.
• Equation (17b) ensures that the solution obtained inStage-1 is guaranteed to be realized at the end of theswitching sequence. That is, all loads that are energizedas per the Stage-1 solution are picked up by the end ofthe restoration switching sequence.
• If any switch is operated once, it should not againchange the status during the restoration. This is done tosave the cost of switching operations. Thus, (17c) and(17d) restrict the reverse operation of switches duringconsecutive switching operations.
• In Stage-2, we are required to operate one switch at atime. This is done to avoid the possibility of forminga loop configuration during switching operations. Theconstraint (17e) enforces at most one switching operationper time step.
• Constraints (17f) and (17g) ensures that all sectionalizing-switches and tie-switches are in desired statuses as per thesolution of Stage 1 in the final time-step of the switchingoperation.
• The switches that do not take part in the restorationprocess are frozen at their original state for the entireduration of switching operation (See (17h) - (17j)).
VI. RESULTS AND DISCUSSIONS
The effectiveness of the proposed approach is validatedusing a multi-feeder 1069-bus test system consisting of fourR3-12.47-2 PNNL taxonomy feeders connected using severaltie switches [44]. The restoration problem is formulated asan MILP that can be solved using off-the-shelf solvers. Therestoration formulation is developed in a python programminglanguage where optimization for service restoration is modeledusing PuLP modeling functions and solved using CPLEX 12.6solver. The simulation is carried out on a PC with 3.4 GHzCPU and 16 GB RAM. Note that any effective solvers can beused to solve the problem.
The taxonomy feeder R3-12.47-2 is a representation of amoderately populated urban area. The total load on the feederis 4366.955 kW and 1299.206 kVAr. Four identical feedersare replicated to obtain the four-feeder 1069-bus distributionsystem where feeders are interconnected using seven normallyopen tie switches (see Fig. 5). With a total of 1069 multi-phasephysical buses (3444 single-phase buses), 152 sectionalizingswitches, 190 possible cycles, and 122, 586 number of normaloperational radial topologies the 1069-bus test case is a suffi-ciently large-scale model. We also incorporate several grid-forming utility-owned DGs in test case and the generationcapacity limit of those DGs is shown in Fig. 5. To ensurethe ability to transfer the load to other feeders, the feederloading is limited to 70%, consequently, the feeder transformercapacity is 6.7 MVA. This system is assumed to be in a peakload condition. The allowable minimum single-phase voltagein this system is 259.698 V [15]. Thus, for a nominal voltageof 277.1 V, minimum voltage in p.u. is taken as 93.72% (i.e.,V φmin = 0.9372 pu).
A. Case Study
Three different scenarios are simulated to validate theeffectiveness of the proposed approach. For each study, therestoration is solved with and without DG. The Stage-1 solu-tions are presented in a tabular format and Stage-2 solutionsare shown graphically to describe how the loads are picked upat each switching operation.
1) Scenario 1: In this scenario, a fault is simulated in theline 241-159 in F-d. As a result, an upstream switch 7-241is tripped. Once the faulted zone is identified, an additionalswitch 164-249 in F-d is opened to isolate the fault fromall possible directions; this is to ensure that during circuitreconfiguration the fault is not fed from any other feeder. Afterisolating the fault, it is observed that 3627.56 kW of load inF-d is disconnected. The first stage solution of the problemfor this particular scenario is to open three sectionalizingswitches and close four tie switches. The switch list generated
10
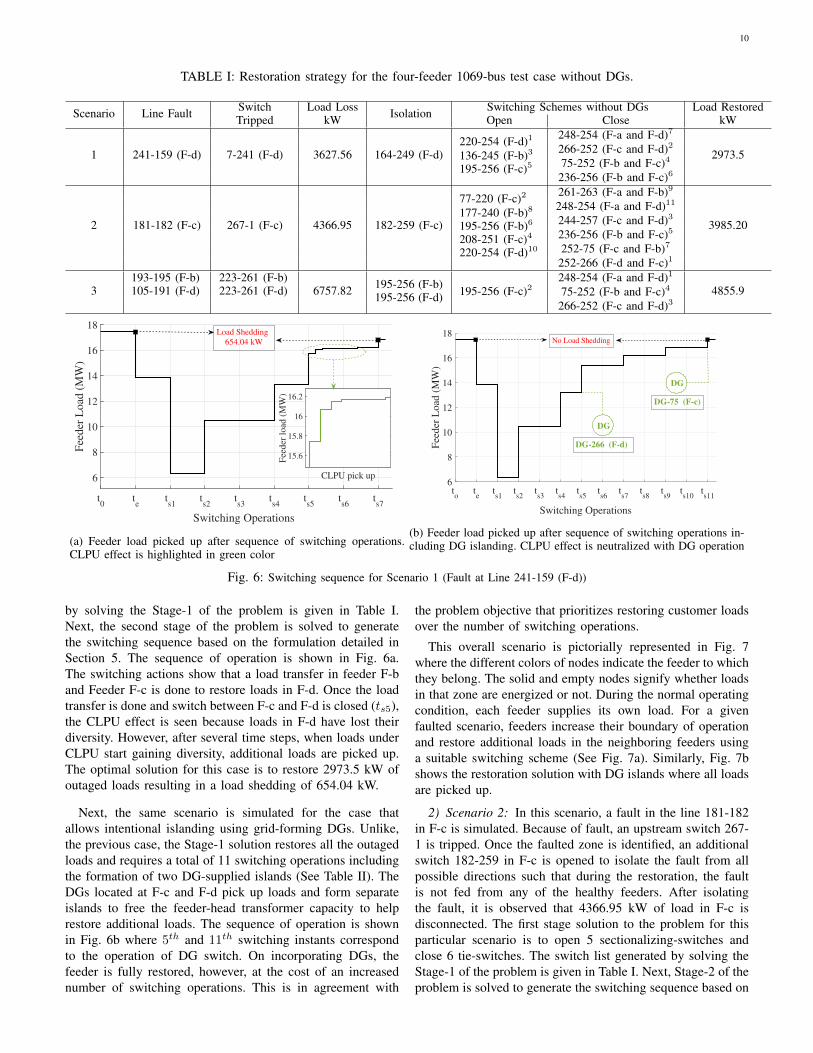
TABLE I: Restoration strategy for the four-feeder 1069-bus test case without DGs.
Scenario Line Fault Switch Load Loss Isolation Switching Schemes without DGs Load RestoredTripped kW Open Close kW
1 241-159 (F-d) 7-241 (F-d) 3627.56 164-249 (F-d)220-254 (F-d)1
136-245 (F-b)3
195-256 (F-c)5
248-254 (F-a and F-d)7
2973.5266-252 (F-c and F-d)2
75-252 (F-b and F-c)4
236-256 (F-b and F-c)6
2 181-182 (F-c) 267-1 (F-c) 4366.95 182-259 (F-c)
77-220 (F-c)2
177-240 (F-b)8
195-256 (F-b)6
208-251 (F-c)4
220-254 (F-d)10
261-263 (F-a and F-b)9
3985.20
248-254 (F-a and F-d)11
244-257 (F-c and F-d)3
236-256 (F-b and F-c)5
252-75 (F-c and F-b)7
252-266 (F-d and F-c)1
3193-195 (F-b)105-191 (F-d)
223-261 (F-b)223-261 (F-d) 6757.82 195-256 (F-b)
195-256 (F-d) 195-256 (F-c)2248-254 (F-a and F-d)1
4855.975-252 (F-b and F-c)4
266-252 (F-c and F-d)3
t0
te
ts1
ts2
ts3
ts4
ts5
ts6
ts7
Switching Operations
6
8
10
12
14
16
18
Fee
der
Load
(M
W)
CLPU pick up
15.6
15.8
16
16.2
Fee
der
lo
ad (
MW
)
Load Shedding
654.04 kW
(a) Feeder load picked up after sequence of switching operations.CLPU effect is highlighted in green color
to
te
ts1
ts2
ts3
ts4
ts5
ts6
ts7
ts8
ts9
ts10
ts11
Switching Operations
6
8
10
12
14
16
18
Fee
der
Lo
ad (
MW
)
DG-75 (F-c)
DG
DG
DG-266 (F-d)
No Load Shedding
(b) Feeder load picked up after sequence of switching operations in-cluding DG islanding. CLPU effect is neutralized with DG operation
Fig. 6: Switching sequence for Scenario 1 (Fault at Line 241-159 (F-d))
by solving the Stage-1 of the problem is given in Table I.Next, the second stage of the problem is solved to generatethe switching sequence based on the formulation detailed inSection 5. The sequence of operation is shown in Fig. 6a.The switching actions show that a load transfer in feeder F-band Feeder F-c is done to restore loads in F-d. Once the loadtransfer is done and switch between F-c and F-d is closed (ts5),the CLPU effect is seen because loads in F-d have lost theirdiversity. However, after several time steps, when loads underCLPU start gaining diversity, additional loads are picked up.The optimal solution for this case is to restore 2973.5 kW ofoutaged loads resulting in a load shedding of 654.04 kW.
Next, the same scenario is simulated for the case thatallows intentional islanding using grid-forming DGs. Unlike,the previous case, the Stage-1 solution restores all the outagedloads and requires a total of 11 switching operations includingthe formation of two DG-supplied islands (See Table II). TheDGs located at F-c and F-d pick up loads and form separateislands to free the feeder-head transformer capacity to helprestore additional loads. The sequence of operation is shownin Fig. 6b where 5th and 11th switching instants correspondto the operation of DG switch. On incorporating DGs, thefeeder is fully restored, however, at the cost of an increasednumber of switching operations. This is in agreement with
the problem objective that prioritizes restoring customer loadsover the number of switching operations.
This overall scenario is pictorially represented in Fig. 7where the different colors of nodes indicate the feeder to whichthey belong. The solid and empty nodes signify whether loadsin that zone are energized or not. During the normal operatingcondition, each feeder supplies its own load. For a givenfaulted scenario, feeders increase their boundary of operationand restore additional loads in the neighboring feeders usinga suitable switching scheme (See Fig. 7a). Similarly, Fig. 7bshows the restoration solution with DG islands where all loadsare picked up.
2) Scenario 2: In this scenario, a fault in the line 181-182in F-c is simulated. Because of fault, an upstream switch 267-1 is tripped. Once the faulted zone is identified, an additionalswitch 182-259 in F-c is opened to isolate the fault from allpossible directions such that during the restoration, the faultis not fed from any of the healthy feeders. After isolatingthe fault, it is observed that 4366.95 kW of load in F-c isdisconnected. The first stage solution to the problem for thisparticular scenario is to open 5 sectionalizing-switches andclose 6 tie-switches. The switch list generated by solving theStage-1 of the problem is given in Table I. Next, Stage-2 of theproblem is solved to generate the switching sequence based on

11
1 181 259
255
262
233
234
232
244
243
236
237
240 245 241 249 252
261
256
254
75
230
235
238
260
239
251
229
264
250
263
266
77
246
24874
257258
4 228
1 181 259
255
262
233
234
232
244
243
236
237
240 245 241 249 252
261
256
254
75
230
235
238
260
239
251
229
264
250
263
266
77
246
248
74
257258
4 228
1 181 259
255
262
233
234
232
244
243
236
237
240 245 241 249 252 256
254
75
230
235
238
260
239
251
229
264
250
263
266
77
246
24874
257258
4 228
1 181 259
255
262
233
234
232
244
243
236
237
240 245 241 249 252
261
256
254
75
230
235
238
260
239
251
229
264
250
263
266
77
246
24874
257258
4 228
261
Sub-
Transmission
node
(a) Circuit reconfiguration for Scenario 1
1 181 259
255
262
233
234
232
244
243
236
237
240 245 241 249 252
261
256
254
75
230
235
238
260
239
251
229
264
250
263
266
77
246
24874
257258
4 228
1 181 259
255
262
233
234
232
244
243
236
237
240 245 241 249 252
261
256
254
75
230
235
238
260
239
251
229
264
250
263
266
77
246
248
74
257258
4 228
1 181 259
255
262
233
234
232
244
243
236
237
240 245 241 249 252 256
254
75
230
235
238
260
239
251
229
264
250
263
266
77
246
24874
257258
4 228
1 181 259
255
262
233
234
232
244
243
236
237
240 245 241 249 252
261
256
254
75
230
235
238
260
239
251
229
264
250
263
266
77
246
24874
257258
4 228
261
Sub-
Transmission
node
��
��
��
��
(b) Circuit reconfiguration and DG islanding for Scenario 1
Fig. 7: Restoration results with and without DGs. Different Color indicate the feeder reach for laods
TABLE II: Restoration strategy for the four-feeder 1069-bus test case with DGs.
Scenario Line Fault Switch Load Loss Isolation Switching Schemes without DGs Load RestoredTripped kW Open Close kW
1 241-159 (F-d) 7-241 (F-d) 3627.56 164-249 (F-d)
220-254 (F-d)220-77 (F-d)136-245 (F-b)220-254 (F-c)195-256 (F-c)
DG-75 (F-c)
3627.56
DG-266 (F-d)75-252 (F-b and F-c)248-254 (F-a and F-d)266-252 (F-c and F-d)236-256 (F-b and F-c)
2 181-182 (F-c) 267-1 (F-c) 4366.95 182-259 (F-c)
219-74 (F-a)222-75 (F-b)164-249 (F-b)219-74 (F-b)
DG-248 (F-b)
4366.95261-263 (F-a and F-b)248-254 (F-a and F-d)236-256 (F-b and F-c)75-252 (F-b and F-c)
3193-195 (F-b)105-191 (F-d)
223-261 (F-b)223-261 (F-d) 6757.82 195-256 (F-b)
195-256 (F-d)223-261 (F-c)220-254 (F-d)
DG-266 (F-d)
6089.04248-254 (F-a and F-d)75-252 (F-b and F-c)236-256 (F-b and F-c)
formulation detailed in Section 5. The sequence of operationis shown in Fig. 8a. The switching actions show that the loadtransfer from feeder F-c to feeders F-a, F-b and F-d is doneto restore the outaged loads in F-c. The optimal solution forthis case is to restore 3985.20 kW of outaged load resultingin a load shedding of 381.75 kW. It is important to note thatbecause of several switching actions, the load in feeder F-cload is picked up without observing any CLPU effect. Thus,one of the methods of address CLPU is to restore distributionfeeders sequentially in several switching steps.
Next, the same scenario is simulated in the presence of DGs.Unlike, the previous case, the restoration solution restores allthe outaged loads with a total of 9 switching operations and theformation of one DG-supplied intentional island (See Table II).The DGs located in feeder F-b picks-up the additional loadsand forms a separate island. This frees up the feeder trans-former to restore additional loads. The sequence of operationis shown in Fig. 8b, where, 5th switching instant correspondsto the operation of the DG switch. On incorporating DGs, thefeeder is fully restored. However, the CLPU effect is observedhere between the switching instances s1 and s2.
3) Scenario 3: In this scenario, a case with multiple faultsis simulated. Similar to the previous two cases, the switchestripped because of faults. The switching operations requiredto isolate the corresponding faults are shown in Table I. Afterisolating the faults, it is observed that 6757.82 kW of the loadsin feeders F-b and F-d are out-of-supply. The Stage-1 solutionfor this scenario is to open one sectionalizing switch and closethree tie switches. The switch list is shown in Table I. Next,the Stage-2 of the problem is solved to generate the sequenceof switching operation for the switch list that was obtained inStage-1. The switching sequence is shown in Fig. 9a where6089.04 kW of the load is gradually picked up.
Next, the same scenario is simulated in the presence of DGs.The number of switching operations is increased to six. TheDG located in feeder F-d picks up additional loads and formsone island. This allows feeder F-d to pick-up additional loadsthus reducing the total amount of load shedding from 1901.09kW to 668.78 kW compared to the case without DGs. Thesequence of operation is shown in Fig. 9b. CLPU effect isseen when the DG is restoring the outaged loads during thelast switching event. Note that the effect of CLPU is takeninto account by operating the load control switch at different

12
t0
te
ts1
ts2
ts3
ts4
ts5
ts6
ts7
ts8
ts9
ts10
ts11
Switching Operations
10
12
14
16
18F
eed
er L
oad
(M
W)
Load Shedding
381.75 kW
(a) Feeder load picked up after sequence of switching operations.
t0
te
ts1
ts2
ts3
ts4
ts5
ts6
ts7
ts8
ts9
Switching Operations
10
12
14
16
18
Fee
der
Lo
ad (
MW
)
DG
No Load- Shedding
DG-248 (F-b)
(b) Feeder load picked up after sequence of switching operationsincluding DG islanding. No load shedding
Fig. 8: Switching sequence for Scenario 2 (Fault at Line 181-182 (F-c))
t0
te
ts1
ts2
ts3
ts4
Switching Operations
8
10
12
14
16
18
Fee
der
Lo
ad (
MW
)
Load Shedding
1901.99 kW
(a) Feeder load picked up after sequence of switching operations.
t0
te
ts1
ts2
ts3
ts4
ts5
ts6
Switching Operations
8
10
12
14
16
18
Fee
der
Lo
ad (
MW
)
Load Shedding
668.78 kW
DG
DG-266 (F-d)
(b) Feeder load picked up after sequence of switching operationsincluding DG islanding. Load shedding reduced to 668.78 kW
Fig. 9: Switching sequence for Scenario 3 (Fault at Line 193-195 (F-b) and Line 105-191 (F-d))
intermediate time-steps.
B. Computational Complexity
Table III shows the algorithm execution time for threedifferent scenarios tested on the multi-feeder test case thatis representative of a real-world distribution system. On anaverage, the proposed approach takes 26.01 seconds to solvethe first stage and 256.95 seconds to solve the second stageof the problem.
TABLE III: Simulation time for different cases
ScenarioSimulation time (Seconds)
With DG Without DGStage 1 Stage 2 Stage 1 Stage 2
1 37.25 410.23 10.83 320.452 38.73 365.56 35.25 240.563 9.70 261.41 24.31 43.45
The ability to scale a research project to a commercialdeployment successfully is a critical piece that the methodspresent in the existing literature overlook. The real-worldpower distribution network has thousands of buses and lineswith several possible combinations for reconfiguration. Thus,
the number of possible topologies for the multi-stage process issignificantly high. Along these lines, a non-linear problem for-mulation is known to not scale for the multi-stage formulationto generate a sequence of switching actions for restoration fora real-world distribution system. Similarly, although heuristic-based methods will always result in an optimal restorationplan, they require an exhaustive search of all possible optionsat each switching instant thus limiting their applicability forlarge distribution systems with numerous options for recon-figuration. Given the existing methods, the proposed MILPmodel is scalable for the real-world distribution system andprovides an operationally feasible restoration plan along withthe switching sequence in a computationally tractable manner.
C. Validation of Linear Power Flow
Since the formulation discussed in Section 4 approximatespower flow equations, the results obtained from the proposedlinear and nonlinear power flow models are compared with thepower flow solution obtained using OpenDSS, a distributionsystem simulator that solves the nonlinear power flow model.The largest errors in apparent power flow and bus voltages arereported for the R3-12.47-2 in Table IV for different loading

13
(a)0.952
0.954
0.956
0.958
0.96
0.962V
olt
age
(p.u
.)w/o DG
w/ DG
(b)0.95
0.95
0.955
0.96
Volt
age
(p.u
.) w/o DG
w/ DG
(c)0.945
0.95
0.955
0.96
Volt
age
(p.u
.)
w/o DG
w/ DG
Switching Operations
Fig. 10: Voltage in p.u. at different switching instant for different scenarios. The grid (x-axis) in the plot corresponds to eachswitching instant.
conditions. Note that the three-phase linear power model issufficiently accurate in modeling power flow equations foran unbalanced system. Since the losses are ignored in flowequations (equations 7a and 7b), the linear model incurs highererror in flow quantities. However, since the voltage drop dueto flow quantities is included in the linear model (equation(7c) and (7d)), the bus voltages are well approximated.
TABLE IV: Comparison of linear power flow formulationsagainst OpenDSS
Feeder % Loading Sflow(%) V (p.u.)
R3-12.47-2 75 3.24 0.001100 2.84 0.002
In addition to the verification of approximate power flowformulations, an exact power flow analysis is done for eachscenario in OpenDSS. Each tree is simulated in OpenDSSwith a detailed line and load model. As mentioned in Section5.2, each switching instant should be operationally feasible,OpenDSS model is modified accordingly to simulated thedetailed model of the distribution network at each switchinginstant. The actual power flow results are obtained and theminimum node voltage is reported (See Fig. 10). It is observedthat for each scenario, the minimal node voltage is within thespecified limit at every switching instant.
D. Comparison with the State-of-the-art
In this sub-section, the proposed approach is compared withtwo state-of-art methods for DSR from references [15] and[24]. The approach presented in [15] is based on spanningtree search method while [24] presents a MILP model for theservice restoration.
The approach detailed in [15] applies a spanning tree searchalgorithm to generate all possible network topologies to restoreloads in an outaged area. Several candidate network topologiesare generated based on possible switching operations and foreach topology, a power flow feasibility analysis is done. An op-timal network topology that satisfies the operating constraintsis identified next and appropriate switches are opened/closedto reach the desired network configuration. Note that theapproach is based on selective cyclic interchange operationwhich is borrowed from [45]. Given an operating tree To, someother trees can be obtained by replacing an edge of tree with
to
te
ts1
ts2
ts3
ts4
ts5
ts6
ts7
ts8
ts9
ts10
ts11
Switching Operations
6
8
10
12
14
16
18
Fee
der
Lo
ad (
MW
)
Approach in [9]
Proposed approach
Pres
= 1098.1 kW
Fig. 11: Comparison of total load picked up for Scenario 1.
another edge in the fundamental cutset Se(T0). The set ofdistinct trees is given by (21).{
t|t = To ⊕ {e, ei}, ei ∈ Se(T0), ei 6= e}. (21)
where, Se(T0) is the fundamental cutset defined by edge e ∈To.
The spanning tree-based approach relies on an exhaustivesearch of all possible spanning trees. It then stores the listof all spanning trees and for a given outage scenario selectsthe optimal restoration topology from the stored list. First, asthe system complexity grows with the integration of additionalgrid-forming DGs and switches, searching and storing all pos-sible spanning trees will become computationally expensive.Further, the stored set of spanning trees need updating everytime a new resource that can help with restoration is addedto the system. Further, the spanning tree-based approach in itscurrent form as proposed in [15] only works for a single faultscenario. This is because a separate repository of spanningtrees needs to be stored as multiple fault scenarios that canbe cumbersome as the combinations for multiple faults grow.This further complicates the implementation of the spanningtree-based algorithms for a practical distribution network. Onthe contrary, the approach proposed in this paper dynamicallyobtains the optimal network configuration using mathematicaloptimization techniques for any number of faults seen by theunderlying system. Further, the proposed MILP model can beeasily expanded to included new devices (DGs and switches).
The approach detailed in [24] presents an MILP frameworkfor DSR for switching sequence generation. However, the

14
TABLE V: Comparison of proposed approach with [15] and[24]
Attributes Proposed Mathematical Graph-theoreticapproach optimization [24] [15]
Methodology MILP MILP Spanning treeTest System Size 1069-bus 207-bus 1069-busMultiple faults ×DG-islanding ×CLPU effects × ×
method proposed in [24] does not take into account the DG-assisted restoration and ignores the loss in load diversity afteran outage due to the CLPU effect. This may lead to sub-optimal restoration schemes especially when the CLPU effectis present and when DG can be used to pick-up additionalloads. We simulated Scenario #1 using the method proposedin [24]. The difference in the solutions for load restorationusing our approach and the one proposed in [24] is shownin Fig. V. It is observed that our approach is better able torestore the distribution system and restores larger MWs of loadat the cost of increased switching operations. This is per theobjective function where the primary objective is to restore asmuch load as possible. Since the formulation in [24] ignoresthe loss in load diversity after an outage, the size of loadshedding is 1098.1 kW (∆Pres) as opposed to 654.04 kWas per our approach (See Fig. 6a). This is because the loadsare underestimated while formulating the problem in [24] andoperational constraints are violated thus requiring additionalloads to be shed.
The overall comparison of the proposed approach againststate-of-art methods in [15] and [24] is summarized in TableV.
VII. SUMMARY
In this paper, we proposed a generalized framework forservice restoration for an unbalanced three-phase power distri-bution system that uses all available resources (healthy feedersand DGs) for maximizing the total restored loads. A two-stage framework is proposed where (1) Stage-1 generates theswitching operations required to restore a maximum amount ofcustomer loads using all available resources, and (2) Stage-2generates the sequence of switching actions that help faultedsystem in transitioning from the post-fault condition to re-stored configuration without violation feeder’s operating con-straints during consecutive switching operations. The stage-2 takes the loss in load diversity due to cold-load pick-up(CPLU) into account and coordinates the feeder reconfigura-tion and active DG islanding under CLPU conditions. Thesimulation results demonstrate that grid-forming DGs helprestores additional loads for the distribution system. Usingthe Stage-2 solution, one can energize the distribution systemsequentially without violating the operational and topologicalconstraints. The results indicate that our approach can findoptimal switching sequences for a large unbalanced distribu-tion system with thousands of buses on an average within 5mins. This helps the operator to safely execute the restorationsolution promptly.
Finally, it is worth mentioning that reliability indices suchas System Average Interruption Duration Index (SAIDI), Cus-tomer Minutes of Interruptions (CMI), and Customer Average
Interruption Duration Index (CAIDI) depend on restorationtime after the fault has occurred. Therefore, with the executionof the restoration solution generated by the proposed approach,the utility companies can quickly restore the faulted feedersthat can help significantly improve the reliability indices.
REFERENCES
[1] R. J. Campbell, “Weather-related power outages and electric systemresiliency,” in Congressional Research Service Report for Congress,Library of Congress Washington, DC, 2012.
[2] U.S. Department of Energy (SGIG), “Fault location, isolation, andservice restoration technologies reduce outage impact and dura-tion. [online]. available:https://www.smartgrid.gov/files/b5_draft_report-12-18-2014.pdf,” Electric Delivery and Energy Reliability), 2014.
[3] National Academies of Sciences, Engineering, and Medicine, “En-hancing the Resilience of the Nation’s Electricity System”. NationalAcademies Press, 2017.
[4] B. Renz, J. Miller, and J. Harmon, “Anticipates and responds to systemdisturbances (self-heals),” National Energy Technology Laboratory, USDepartment of Energy DOE/NETL-2010/1421, 2010.
[5] S. M. Amin and A. M. Giacomoni, “Smart grid, safe grid,” IEEE Powerand Energy Magazine, vol. 10, no. 1, pp. 33–40, 2011.
[6] U.S. Department of Energy, Advanced DistributionManagement System (ADMS) Program, “[online]. avail-able:http://sourceforge.net/projects/electricdss,” Office of ElectricityDelivery and Energy Reliability), 2016.
[7] A. Dubey, A. Bose, M. Liu, and L. N. Ochoa, “Paving the way foradvanced distribution management systems applications: Making themost of models and data,” IEEE Power and Energy Magazine, vol. 18,no. 1, pp. 63–75, 2020.
[8] C.-C. Liu, S. J. Lee, and S. Venkata, “An expert system operationalaid for restoration and loss reduction of distribution systems,” IEEETransactions on Power Systems, vol. 3, no. 2, pp. 619–626, 1988.
[9] K. N. Miu, H.-D. Chiang, and R. J. McNulty, “Multi-tier servicerestoration through network reconfiguration and capacitor control forlarge-scale radial distribution networks,” IEEE Transactions on PowerSystems, vol. 15, no. 3, pp. 1001–1007, 2000.
[10] Y. Kumar, B. Das, and J. Sharma, “Service restoration in distributionsystem using non-dominated sorting genetic algorithm,” Electric PowerSystems Research, vol. 76, no. 9-10, pp. 768–777, 2006.
[11] Q. Zhou, D. Shirmohammadi, and W.-H. Liu, “Distribution feeder recon-figuration for service restoration and load balancing,” IEEE Transactionson Power Systems, vol. 12, no. 2, pp. 724–729, 1997.
[12] K. L. Butler-Purry and N. Sarma, “Self-healing reconfiguration forrestoration of naval shipboard power systems,” IEEE Transactions onPower Systems, vol. 19, no. 2, pp. 754–762, 2004.
[13] S. Khushalani, J. M. Solanki, and N. N. Schulz, “Optimized restora-tion of unbalanced distribution systems,” IEEE Transactions on PowerSystems, vol. 22, no. 2, pp. 624–630, 2007.
[14] T. T. H. Pham, Y. Bésanger, and N. Hadjsaid, “New challenges in powersystem restoration with large scale of dispersed generation insertion,”IEEE Transactions on Power Systems, vol. 24, no. 1, pp. 398–406, 2009.
[15] J. Li, X.-Y. Ma, C.-C. Liu, and K. P. Schneider, “Distribution systemrestoration with microgrids using spanning tree search,” IEEE Transac-tions on Power Systems, vol. 29, no. 6, pp. 3021–3029, 2014.
[16] Z. Wang and J. Wang, “Self-healing resilient distribution systemsbased on sectionalization into microgrids,” IEEE Transactions on PowerSystems, vol. 30, no. 6, pp. 3139–3149, 2015.
[17] C. Chen, J. Wang, F. Qiu, and D. Zhao, “Resilient distribution systemby microgrids formation after natural disasters,” IEEE Transactions onsmart grid, vol. 7, no. 2, pp. 958–966, 2015.
[18] A. Sharma, D. Srinivasan, and A. Trivedi, “A decentralized multiagentsystem approach for service restoration using dg islanding,” IEEETransactions on smart grid, vol. 6, no. 6, pp. 2784–2793, 2015.
[19] B. Chen, C. Chen, J. Wang, and K. L. Butler-Purry, “Multi-time stepservice restoration for advanced distribution systems and microgrids,”IEEE Transactions on Smart Grid, vol. 9, no. 6, pp. 6793–6805, 2017.
[20] S. Poudel and A. Dubey, “Critical load restoration using distributedenergy resources for resilient power distribution system,” IEEE Trans-actions on Power Systems, vol. 34, no. 1, pp. 52–63, 2018.
[21] K. P. Schneider, E. Sortomme, S. Venkata, M. T. Miller, and L. Ponder,“Evaluating the magnitude and duration of cold load pick-up on resi-dential distribution using multi-state load models,” IEEE Transactionson Power Systems, vol. 31, no. 5, pp. 3765–3774, 2015.

15
[22] I. Watanabe and M. Nodu, “A genetic algorithm for optimizing switchingsequence of service restoration in distribution systems,” in Proceedingsof the 2004 Congress on Evolutionary Computation (IEEE Cat. No.04TH8753), vol. 2, pp. 1683–1690, IEEE, 2004.
[23] R. Pérez-Guerrero, G. T. Heydt, N. J. Jack, B. K. Keel, and A. R.Castelhano, “Optimal restoration of distribution systems using dynamicprogramming,” IEEE Transactions on Power Delivery, vol. 23, no. 3,pp. 1589–1596, 2008.
[24] S. Thiébaux, C. Coffrin, H. Hijazi, and J. Slaney, “Planning with mipfor supply restoration in power distribution systems,” in Twenty-ThirdInternational Joint Conference on Artificial Intelligence, 2013.
[25] B. Chen, C. Chen, J. Wang, and K. L. Butler-Purry, “Sequential servicerestoration for unbalanced distribution systems and microgrids,” IEEETransactions on Power Systems, vol. 33, no. 2, pp. 1507–1520, 2017.
[26] A. El-Zonkoly, “Power system single step restoration incorporating coldload pickup aided by distributed generation,” International Journal ofElectrical Power & Energy Systems, vol. 35, no. 1, pp. 186–193, 2012.
[27] M. Vadari, Electric System Operations: Evolving to the Modern Grid.Artech House, 2013.
[28] U.S. Department of Energy, Smart Grid Investments Improve GridReliability, Resilience, and Storm Responses, “[online]. available:https://www.smartgrid.gov/files/b2-master-file-with-edits_120114.pdf,”Office of Electricity Delivery and Energy Reliability), 2014.
[29] Post Sandy Enhancement Plan. (New York: Consolidated Edison Co. ofNew York, “[online]. available: http://www.coned.com/publicissues/pdf/post_sandy_enhancement_plan.pdf,” Consolidated Edison Co. of NewYork), 2013.
[30] Pacific Northwest Smart Grid Demonstration Project - 2013 AnnualReport, “[online]. available: http://www.pnwsmartgrid.org/docs/2013 an-nual report.pdf,” Pacific Northwest National Laboratory), 2013.
[31] J. Rocabert, A. Luna, F. Blaabjerg, and P. Rodriguez, “Control of powerconverters in ac microgrids,” IEEE transactions on power electronics,vol. 27, no. 11, pp. 4734–4749, 2012.
[32] S. F. Zarei, H. Mokhtari, M. A. Ghasemi, and F. Blaabjerg, “Reinforcingfault ride through capability of grid forming voltage source convertersusing an enhanced voltage control scheme,” IEEE Transactions on PowerDelivery, 2018.
[33] C. Chen, J. Wang, F. Qiu, and D. Zhao, “Resilient distribution system
by microgrids formation after natural disasters,” IEEE Transactions onSmart Grid, vol. 7, no. 2, pp. 958–966, 2016.
[34] H. Gao, Y. Chen, Y. Xu, and C.-C. Liu, “Resilience-oriented critical loadrestoration using microgrids in distribution systems,” IEEE Transactionson Smart Grid, vol. 7, no. 6, pp. 2837–2848, 2016.
[35] Count Loops in a Graph, J.kirk, “[online]. available:https://www.mathworks.com/matlabcentral/fileexchange/10722-count-loops-in-a-graph,” MathWorks), 2020.
[36] L. Gan and S. H. Low, “Convex relaxations and linear approximation foroptimal power flow in multiphase radial networks,” in Power SystemsComputation Conference (PSCC), 2014, pp. 1–9, IEEE, 2014.
[37] W. L. Winston, M. Venkataramanan, and J. B. Goldberg, Introductionto mathematical programming, vol. 1. Thomson/Brooks/Cole Duxbury;Pacific Grove, CA, 2003.
[38] H. Ahmadi, J. R. Martı, and A. von Meier, “A linear power flowformulation for three-phase distribution systems,” IEEE Transactions onPower Systems, vol. 31, no. 6, pp. 5012–5021, 2016.
[39] F. Friend, “Cold load pickup issues,” in 2009 62nd Annual Conferencefor Protective Relay Engineers, pp. 176–187, IEEE, 2009.
[40] R. Leou, Z. Gaing, C. Lu, B. Chang, and C. Cheng, “Distributionsystem feeder cold load pickup model,” Electric power systems research,vol. 36, no. 3, pp. 163–168, 1996.
[41] W. W. Lang, M. D. Anderson, and D. R. Fannin, “An analytical methodfor quantifying the electrical space heating component of a cold loadpick up,” IEEE Transactions on Power Apparatus and Systems, no. 4,pp. 924–932, 1982.
[42] R. E. Mortensen and K. P. Haggerty, “A stochastic computer model forheating and cooling loads,” IEEE Transactions on Power Systems, vol. 3,no. 3, pp. 1213–1219, 1988.
[43] D. Athow and J. Law, “Development and applications of a randomvariable model for cold load pickup,” IEEE transactions on powerdelivery, vol. 9, no. 3, pp. 1647–1653, 1994.
[44] K. P. Schneider, Y. Chen, D. Engle, and D. Chassin, “A taxonomyof north american radial distribution feeders,” in IEEE PES GeneralMeeting, 2009, pp. 1–5, IEEE, 2009.
[45] W. Mayeda and S. Seshu, “Generation of trees without duplications,”IEEE Transactions on Circuit Theory, vol. 12, no. 2, pp. 181–185, 1965.


![River Restoration to Achieve a Stage 0 Conditionapproach to floodplain restoration often referred to as “Stage 0 [zero]” stream restoration. This term is commonly applied to actions](https://img.pdfslide.net/doc/110x75/611feaa807e6c379a344c880/river-restoration-to-achieve-a-stage-0-condition-approach-to-floodplain-restoration.jpg)