Embed Size (px)
Citation preview
Sustainability: Science, Practice, & Policy http://sspp.proquest.com
2016 Altaweel et al. CC-BY Attribution 4.0 License. Fall 2015 | Volume 11 | Issue 2 1
ARTICLE
A typology for complex social-ecological systems in mountain communities Mark Altaweel1, Arika Virapongse2, David Griffith2, Lilian Alessa2, & Andrew Kliskey2 1 Institute of Archaeology, University College London, 31-34 Gordon Square, London, WC1H 0PY UK (email: [email protected]) 2 Center for Resilient Communities, University of Idaho, Moscow, ID 83844 USA (email: [email protected];
[email protected]; [email protected]; [email protected]) Effective and standardized assessment of social-ecological systems is crucial for supporting increased resilience of human communities and for developing adaptation strategies. However, few analytical frameworks exist to assess the social-ecological resilience and vulnerability of different landscapes. To help fill the gap in this literature, we inves-tigated the utility of a conceptual social-ecological systems typology by assessing 21 mountain communities in the western United States. Our results show that larger cities or urban areas are generally more resilient than smaller communities, but the variation is not particularly notable. Resilience differences are found most often among com-munities of different population sizes. In our sample, no community was deemed to be highly vulnerable to social-ecological change. More broadly, development of standardized social-ecological systems typologies can be applied toward accommodating unique environmental niches while allowing for cross-comparisons among regions on a broader continental scale. KEYWORDS: classification, local communities, montane environments, ecosystem resilience, environmental sociology
Introduction
Classification of social-ecological systems is an
important first step for identifying and assessing fac-tors that affect resilience and vulnerability of commu-nities and their resources (Alessa et al. 2009; Ostrom, 2009; Ostrom & Cox, 2010) and determining poten-tial interventions, such as those intended to enhance a system’s resiliency (Cumming et al. 2005). A social-ecological system (SES) consists of human and bio-physical components that are interconnected and linked through complex system feedbacks and de-pendencies (Berkes et al. 2003). Mismatch in the scales of SESs, in whole or in part and ranging from community- to landscape-level systems, is often an obstacle to comparative studies (Cumming et al. 2006; 2013). Existing typologies focus on SESs at such a broad level that it is not clear if unique quali-ties of environmental niches and community specific-ity can be easily addressed (e.g., Alessa et al. 2009; Ostrom, 2009; Ostrom & Cox, 2010). Information derived from large-scale studies is often not informa-tive when assessing community resilience in specific regions, such as mountainous areas that are varying and complex landscapes characterized by large bio-physical gradients and great fluxes in resource quality and quantity. Without robust tools to comparatively assess the resilience of communities located in spe-
cific types of landscapes, it remains a challenge to sustainably manage available valuable natural re-sources and the social and environmental changes that are expected in the near future.
Typologies of SESs have been developed as practical tools that can be used to classify SESs by applying information generated through conceptual models and existing datasets. By testing such concep-tual models in the real world, typologies can help identify key characteristics, drivers, and dependen-cies within and among systems (Blair et al. 2014; Buergelt & Paton, 2014). Typologies allow for stand-ardized characterization by using specific metrics, so that characteristics (e.g., vulnerability to environmen-tal change) can be compared among communities and management decisions and planning can be conduct-ed with greater standardization. Standardizing the metrics used to assess SESs makes possible scaling up from community to landscape levels so that cross-comparisons can be conducted at broader scales. As an analytical framework, SES typologies are effective in contrasting communities located in specific land-scapes with shared biophysical features (e.g., moun-tains) as well as among landscape types (e.g., moun-tains and coastal areas) on much broader scales. To develop such a tool, existing SES typologies must be examined and refined in accordance with specific landscapes (e.g., Alessa et al. 2009; Ostrom, 2009).
Altaweel et al.: Typology for Mountain Communities
Sustainability: Science, Practice, & Policy | http://sspp.proquest.com Fall 2015 | Volume 11 | Issue 2
2
This article’s main goal is to evaluate the resili-ence of mountain-system communities using a modi-fied version of the “Messy SES” typology (Alessa et al. 2009) and to offer recommendations for further development of typologies as a framework. The unit of analysis used to characterize SESs is a community and its associated resources. We apply the typology in this study to evaluate the resilience of 21 mountain communities located in the western United States. Based on our analysis, we offer recommendations for how the SES typology can be further refined for use in specific types of landscapes. With more enhance-ment and development, such typologies can be valu-able for conducting cross-comparisons among differ-ent landscapes so that assessments of SESs can occur on a continental and global scale. Background Why Typologies?
Human-environmental interactions are integral components of interconnected, large-scale systems—the “ecological macrosystem” (Brondizio & Chowdhury, 2013; Heffernan et al. 2014). Such mac-rosystem processes, for instance climate change, have been linked to accelerating rates of natural disasters, economic crises, and livelihood vulnerabilities (Alley et al. 2003; Skoufias, 2003). To improve social pre-paredness for large-scale change, scientists have for-mulated high-level frameworks to address communi-ty resilience in practice, such as toolkits that enable resilience self-assessment (e.g., U.S. Climate Resilience Toolkit, 2015). Offering a more region-specific framework, typologies provide a template for researchers and managers to systematically identify resilience/vulnerability levels for communities in a comparable and scalable manner.
The most challenging aspect of developing an SES typology is to identify appropriate social, bio-physical, and integrated metrics for capturing resili-ence or vulnerability, as well as finding accessible long-term datasets to support such metrics. Typolo-gies for community-level resilience have focused on aspects of social metrics, such as change in settle-ment structure, institutions, and livelihoods (Carney, 1998; Berkes et al. 2003; Krausmann et al. 2008). They also can investigate relationships among stake-holders, decision makers, and sociocultural values regarding economic concerns (Wallace, 2007; Reed et al. 2009). Biophysical metrics used in typologies have included presence of different ecosystems, land-cover change, and availability of ecosystem services (Adger et al. 2002; de Groot et al. 2002; Lambin et al. 2003). Integrated metrics include activities of rural landholders and land use (Emtage et al. 2006; Nuissl et al. 2009). To address community-level adaptation
and resilience, different social scales (e.g., individual to community level; Buergelt & Paton, 2014), rela-tionships between governance and ecosystem ser-vices (Ostrom, 2005; 2009), and community size and resource connectivity (Alessa et al. 2009) are as-sessed and included in typologies. The applied typol-ogy considered here studies the heterogeneity that exists across SESs in their given landscapes by inves-tigating different SES elements. Mountain System Communities
Mountain SESs require special attention because of their position in the upstream-downstream gradi-ent, unique ecosystem characteristics, changing hu-man demographics, effects on resource and manage-ment decisions, and cultural and political aspects. As the location of intensive exploitation or as the source of renewable and nonrenewable resources—such as timber, minerals, and water—mountainous regions and their associated watersheds are critical for most societies (Messerli et al. 2004; Winkler et al. 2007; Emelko et al. 2011). As in other systems, mountain-based human communities are subject not only to pressure from macro-environmental drivers such as climate change, but also from human-driven factors such as population growth/decline, economic devel-opment, migration, and urbanization. In contrast to other types of SESs, however, extreme biophysical gradients within mountain landscapes can create unique vulnerabilities to disturbance, availability of ecosystem services, and patterns of ecological and natural-resource exploitation (MtnSEON, 2015).
Considered unique and understudied from eco-logical and biogeographical perspectives (Beniston, 2003), mountain landscapes are defined by high-contrast biophysical and ecological characteristics, such as steep physical gradients (e.g., elevation, pre-cipitation, temperature), ecotones (abrupt ecological transition zones), and highly varied ecosystems and physical characteristics (Haslett, 1997; Gardner & Dekens, 2007). Mountains have extreme and varying topographies along a large continuum; for example, consider the differences between Snowdon in Wales (high precipitation, heavily forested, anciently vol-canic, and standing 1,085 meters) and Mount Kili-manjaro in Tanzania (dry, sparsely forested, many endemic plants, actively volcanic, and standing 5,149 meters). Extreme, but local, spatial heterogeneity also differentiates mountains from surrounding lowland areas, so that mountainous regions are often defined according to relative prominence (vertical differentia-tion from surrounding landscapes). For example, the town of Browning, Montana (USA) is considered to be on the “high plains” at 1,334 meters; this can be contrasted with Mount Rogers in Virginia (USA), identified as a mountain at 1,746 meters, and the
Altaweel et al.: Typology for Mountain Communities
Sustainability: Science, Practice, & Policy | http://sspp.proquest.com Fall 2015 | Volume 11 | Issue 2
3
aforementioned Snowdon in Wales, unquestionably a mountain at only 1,085 meters.
High-contrast biophysical characteristics also subject mountain landscapes to hazards that are unique or more pronounced than in other landscapes. For example, landslides, avalanches, flash floods, forest fires, and extreme cold events are characteristic of mountain SESs, but largely absent from lowland temperate regions where most of the world’s popula-tions resides (Gardner & Dekens, 2007; Hewitt, 2014). Due to the great biophysical, microclimatic, and ecological variability of mountain areas, their ecosystems are reservoirs for biodiversity and highly vulnerable to global change. Prominence and separa-tion of peaks by lowlands with inhospitable biophysi-cal characteristics results in many mountains acting as ecological “sky-islands,” with unique fauna and flora that are susceptible to environmental and cli-mate change and physically unable to migrate to more suitable habitat as conditions change (Holycross & Douglas, 2007). Mountains also serve as refuges for many endangered species, such as large carnivores (Weaver, 2001). Global climate change is predicted to have greater effects on mountain ecosys-tems, and other high-latitude ecosystems, than on most landscapes (a prediction that is actually begin-ning to occur) (Kullman, 2004).
The biophysical and geographical characteristics of mountainous landscapes contribute to pronounced cultural, socioeconomic, and political diversity and significance for these regions. Mountain ecosystems, especially in Europe, have been modified, molded, and tended by self-organizing and self-regulating cultures at the fringes of larger polities and societies (Rescia et al. 2008). Due to historical patterns of for-est use and resource extraction in many mountainous regions of the world, mountain landscapes and asso-ciated communities experience (and in some instanc-es engage in activities that directly cause) more de-forestation, related flooding, and extreme erosion than comparably sized lowland SESs (Gibon et al. 2010). Mountain ranges have been used to define political frontiers between nations (Stoddard, 1991), and the enforcement of law and effective governance by states is typically weaker in mountainous regions (Ratner, 2000). Often, in mountainous areas minority groups are isolated (e.g., India), natural resources are heavily exploited (e.g., logging and mining), and military conflict persists (e.g., Afghanistan, Yemen; Blaikei & Sadeque, 2000). In addition, mountains regularly serve as sacred sites of cultural importance and these features have been correlated with higher biodiversity (Anderson et al. 2005). As a result of different or unique characteristics for mountain sys-tems and communities, researchers and stakeholders have suggested specific guidelines for protecting the
biological and cultural diversity of these regions (Wild et al. 2008).
Mountain systems are critical for understanding watersheds and their connectivity from high elevation to the sea (Kaneshiro et al. 2005). This importance is exemplified in the ancient Hawaiian managed land-scape, or ahupua’a, a land division stretching from upland mountains to the near shore that formed the basis for agro-ecological management and acted as a foundation for local cultural and political economies (Kamehameha Schools, 1994; Kliskey et al. 2009). In temperate environments, mountain-to-sea connectivi-ty has been extended to icefield-to-ocean linkages, given changes in elevation and moisture, similarly highlighting the critical roles of downstream connec-tivity, transitions, and gradients for mountain land-scapes in entire watersheds (O’Neel et al. 2015). Methods Analytical Approach
We use the “Messy SES” typology as a starting point to assess community-level resilience in the western United States mountain system (Alessa et al. 2009). Resilience and vulnerability are designated as two ends of a continuum in this typology, which em-phasizes community size, resource use, and commu-nity connectivity, acknowledging that SESs are inher-ently difficult to categorize or assess (Folke, 2006). In comparison to the SES typology proposed by Ostrom (2005; 2009), Alessa et al. (2009) requires fewer proxies, so it is more manageable in practice. Our analysis assessed the Alessa et al. (2009) typolo-gy to improve its utility for providing information helpful to making management and community-planning decisions. The unit of analysis in our study is a community, defined as an area and population associated with an organized and commonly gov-erned collection of households.
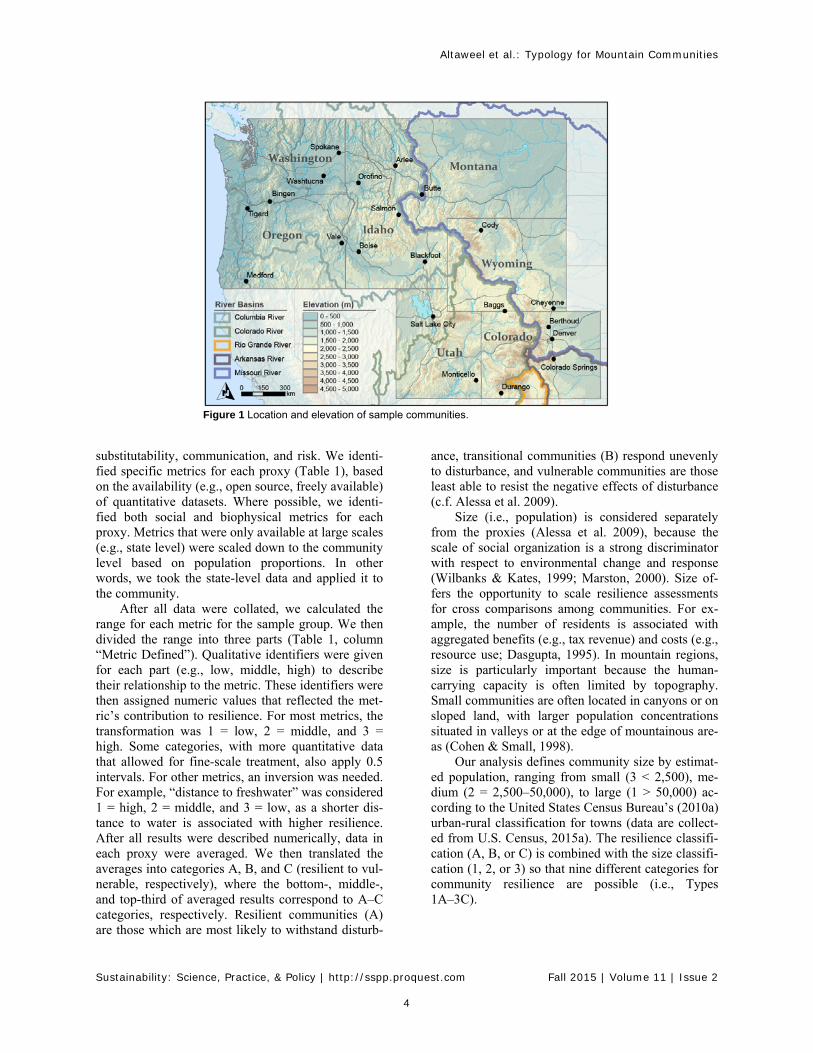
To assess the typology, we first selected 21 com-munities from the western mountainous region of the United States (Intermountain and Rocky Mountains) as a sample group (Figure 1). We defined a moun-tainous region as a landscape with significant promi-nence, sloping terrain, valleys, and human communi-ties. We studied communities located in such land-scapes in the states of Colorado, Idaho, Montana, Oregon, Utah, Washington, and Wyoming, with pop-ulation sizes ranging from 204 people (Washtucna, Washington) to 663,900 residents (Denver, Colora-do).
We next considered the eleven resilience proxies used in Alessa et al. (2009) and their relevance to our mountain-system communities (see the next section). Resilience proxies are diversity, distance, retention, distribution, persistence, collectivism, variability,
Altaweel et al.: Typology for Mountain Communities
Sustainability: Science, Practice, & Policy | http://sspp.proquest.com Fall 2015 | Volume 11 | Issue 2
4
substitutability, communication, and risk. We identi-fied specific metrics for each proxy (Table 1), based on the availability (e.g., open source, freely available) of quantitative datasets. Where possible, we identi-fied both social and biophysical metrics for each proxy. Metrics that were only available at large scales (e.g., state level) were scaled down to the community level based on population proportions. In other words, we took the state-level data and applied it to the community.
After all data were collated, we calculated the range for each metric for the sample group. We then divided the range into three parts (Table 1, column “Metric Defined”). Qualitative identifiers were given for each part (e.g., low, middle, high) to describe their relationship to the metric. These identifiers were then assigned numeric values that reflected the met-ric’s contribution to resilience. For most metrics, the transformation was 1 = low, 2 = middle, and 3 = high. Some categories, with more quantitative data that allowed for fine-scale treatment, also apply 0.5 intervals. For other metrics, an inversion was needed. For example, “distance to freshwater” was considered 1 = high, 2 = middle, and 3 = low, as a shorter dis-tance to water is associated with higher resilience. After all results were described numerically, data in each proxy were averaged. We then translated the averages into categories A, B, and C (resilient to vul-nerable, respectively), where the bottom-, middle-, and top-third of averaged results correspond to A‒C categories, respectively. Resilient communities (A) are those which are most likely to withstand disturb-
ance, transitional communities (B) respond unevenly to disturbance, and vulnerable communities are those least able to resist the negative effects of disturbance (c.f. Alessa et al. 2009).
Size (i.e., population) is considered separately from the proxies (Alessa et al. 2009), because the scale of social organization is a strong discriminator with respect to environmental change and response (Wilbanks & Kates, 1999; Marston, 2000). Size of-fers the opportunity to scale resilience assessments for cross comparisons among communities. For ex-ample, the number of residents is associated with aggregated benefits (e.g., tax revenue) and costs (e.g., resource use; Dasgupta, 1995). In mountain regions, size is particularly important because the human-carrying capacity is often limited by topography. Small communities are often located in canyons or on sloped land, with larger population concentrations situated in valleys or at the edge of mountainous are-as (Cohen & Small, 1998).
Our analysis defines community size by estimat-ed population, ranging from small (3 < 2,500), me-dium (2 = 2,500‒50,000), to large (1 > 50,000) ac-cording to the United States Census Bureau’s (2010a) urban-rural classification for towns (data are collect-ed from U.S. Census, 2015a). The resilience classifi-cation (A, B, or C) is combined with the size classifi-cation (1, 2, or 3) so that nine different categories for community resilience are possible (i.e., Types 1A‒3C).
Figure 1 Location and elevation of sample communities.
Altaweel et al.: Typology for Mountain Communities
Sustainability: Science, Practice, & Policy | http://sspp.proquest.com Fall 2015 | Volume 11 | Issue 2
5
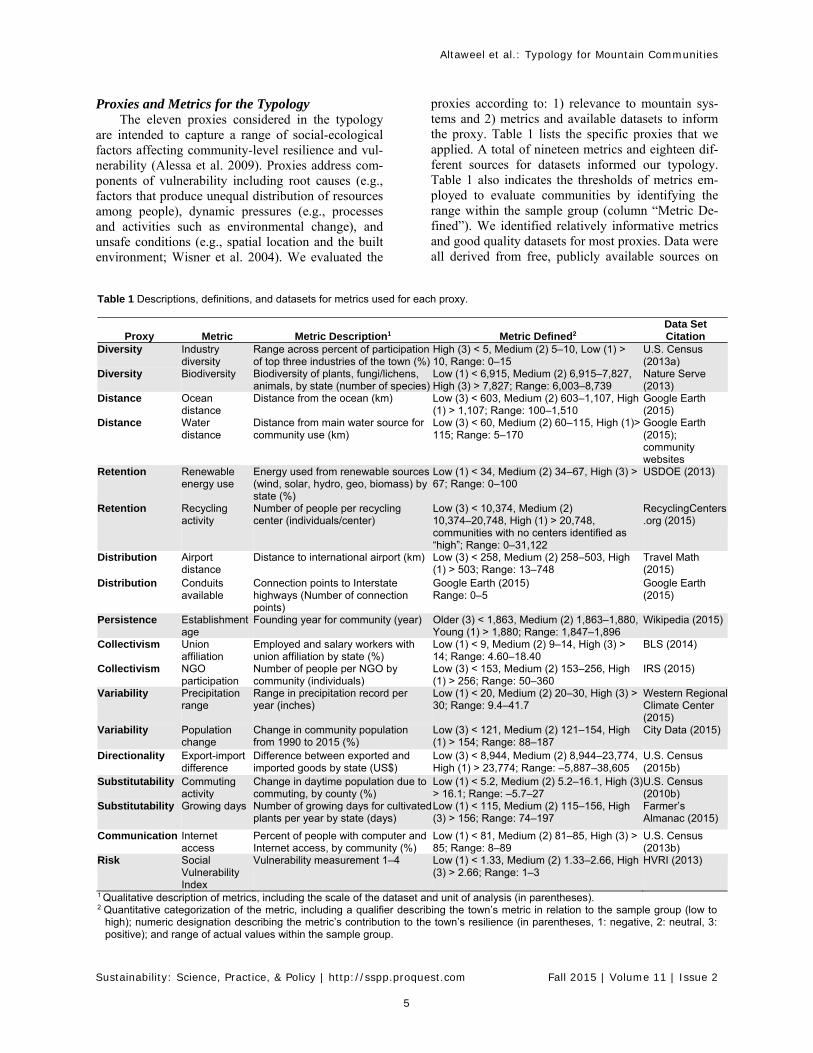
Proxies and Metrics for the Typology The eleven proxies considered in the typology
are intended to capture a range of social-ecological factors affecting community-level resilience and vul-nerability (Alessa et al. 2009). Proxies address com-ponents of vulnerability including root causes (e.g., factors that produce unequal distribution of resources among people), dynamic pressures (e.g., processes and activities such as environmental change), and unsafe conditions (e.g., spatial location and the built environment; Wisner et al. 2004). We evaluated the
proxies according to: 1) relevance to mountain sys-tems and 2) metrics and available datasets to inform the proxy. Table 1 lists the specific proxies that we applied. A total of nineteen metrics and eighteen dif-ferent sources for datasets informed our typology. Table 1 also indicates the thresholds of metrics em-ployed to evaluate communities by identifying the range within the sample group (column “Metric De-fined”). We identified relatively informative metrics and good quality datasets for most proxies. Data were all derived from free, publicly available sources on
Table 1 Descriptions, definitions, and datasets for metrics used for each proxy.
Proxy Metric Metric Description1 Metric Defined2 Data Set Citation
Diversity Industry diversity
Range across percent of participation of top three industries of the town (%)
High (3) < 5, Medium (2) 5–10, Low (1) > 10, Range: 0‒15
U.S. Census (2013a)
Diversity Biodiversity Biodiversity of plants, fungi/lichens, animals, by state (number of species)
Low (1) < 6,915, Medium (2) 6,915‒7,827, High (3) > 7,827; Range: 6,003–8,739
Nature Serve (2013)
Distance Ocean distance
Distance from the ocean (km) Low (3) < 603, Medium (2) 603‒1,107, High (1) > 1,107; Range: 100‒1,510
Google Earth (2015)
Distance Water distance
Distance from main water source for community use (km)
Low (3) < 60, Medium (2) 60‒115, High (1)> 115; Range: 5‒170
Google Earth (2015); community websites
Retention Renewable energy use
Energy used from renewable sources (wind, solar, hydro, geo, biomass) by state (%)
Low (1) < 34, Medium (2) 34‒67, High (3) > 67; Range: 0‒100
USDOE (2013)
Retention Recycling activity
Number of people per recycling center (individuals/center)
Low (3) < 10,374, Medium (2) 10,374‒20,748, High (1) > 20,748, communities with no centers identified as “high”; Range: 0‒31,122
RecyclingCenters.org (2015)
Distribution Airport distance
Distance to international airport (km) Low (3) < 258, Medium (2) 258‒503, High (1) > 503; Range: 13‒748
Travel Math (2015)
Distribution Conduits available
Connection points to Interstate highways (Number of connection points)
Google Earth (2015) Google Earth (2015) Range: 0‒5
Persistence Establishment age
Founding year for community (year) Older (3) < 1,863, Medium (2) 1,863‒1,880, Young (1) > 1,880; Range: 1,847‒1,896
Wikipedia (2015)
Collectivism Union affiliation
Employed and salary workers with union affiliation by state (%)
Low (1) < 9, Medium (2) 9‒14, High (3) > 14; Range: 4.60‒18.40
BLS (2014)
Collectivism NGO participation
Number of people per NGO by community (individuals)
Low (3) < 153, Medium (2) 153‒256, High (1) > 256; Range: 50‒360
IRS (2015)
Variability Precipitation range
Range in precipitation record per year (inches)
Low (1) < 20, Medium (2) 20‒30, High (3) > 30; Range: 9.4‒41.7
Western RegionalClimate Center (2015)
Variability Population change
Change in community population from 1990 to 2015 (%)
Low (3) < 121, Medium (2) 121‒154, High (1) > 154; Range: 88‒187
City Data (2015)
Directionality Export-import difference
Difference between exported and imported goods by state (US$)
Low (3) < 8,944, Medium (2) 8,944‒23,774, High (1) > 23,774; Range: ‒5,887‒38,605
U.S. Census (2015b)
Substitutability Commuting activity
Change in daytime population due to commuting, by county (%)
Low (1) < 5.2, Medium (2) 5.2‒16.1, High (3) > 16.1; Range: ‒5.7‒27
U.S. Census (2010b)
Substitutability Growing days Number of growing days for cultivated plants per year by state (days)
Low (1) < 115, Medium (2) 115‒156, High (3) > 156; Range: 74‒197
Farmer’s Almanac (2015)
Communication Internet access
Percent of people with computer and Internet access, by community (%)
Low (1) < 81, Medium (2) 81‒85, High (3) > 85; Range: 8‒89
U.S. Census (2013b)
Risk Social Vulnerability Index
Vulnerability measurement 1‒4 Low (1) < 1.33, Medium (2) 1.33‒2.66, High (3) > 2.66; Range: 1‒3
HVRI (2013)
1 Qualitative description of metrics, including the scale of the dataset and unit of analysis (in parentheses). 2 Quantitative categorization of the metric, including a qualifier describing the town’s metric in relation to the sample group (low to
high); numeric designation describing the metric’s contribution to the town’s resilience (in parentheses, 1: negative, 2: neutral, 3: positive); and range of actual values within the sample group.
Altaweel et al.: Typology for Mountain Communities
Sustainability: Science, Practice, & Policy | http://sspp.proquest.com Fall 2015 | Volume 11 | Issue 2
6
the Internet. Diversity (the first of the eleven proxies), which
considers a community’s varying access to both local and distant resources, is a measure of a community’s social and biophysical options for meeting livelihood needs, such as mechanisms for accessing resources (e.g., livelihood activities) and availability of re-sources (e.g., timber, energy deposits). Economic di-versity, such as the presence of different industries, helps to inform how communities might adapt to shifts and stresses arising from evolving economic circumstances (Chapin et al. 2004). Diversification promotes livelihood security by helping households overcome crises and abrupt change (Shackleton & Shackleton, 2004). Similarly, biophysical diversity, such as biological, ecological, and natural resource diversity, offers a great range of options and alterna-tives for communities to be more adaptive to change (Adams et al. 2004, Reyers et al. 2012). In mountain systems, diversity is linked to distance and distribu-tion and provides different options for livelihood strategies.
Distance refers to the physical distance to essen-tial resources (e.g., water, goods, trade). For example, communities located near headwaters have great po-tential for environmental impact on downstream communities. Mountain communities are often iso-lated; steep gradients can cause distribution of re-sources to be more sensitive to change than in more homogeneous topography. Climate change, for ex-ample, is expected to affect mountain regions by making some natural resources either physically more distant, scarce, or no longer available (Hope, 2014). Therefore, distance is linked to the proxies of topography, diversity, and distribution.
Retention is defined as efficiency in resource utilization, such as through renewable and recycled materials. In mountainous regions in the western United States, renewable natural resources that con-tribute directly to livelihoods include, but are not lim-ited to, arable soil, trees and plants, fish and game, and wind for power generation. More varied and nu-merous renewable resources provide long-term secu-rity for mountain communities (Forman, 2008). Secu-rity can be measured based on how much renewable energy or how many resources are used in a commu-nity, including the capacity and infrastructure for recycling resources. Retention is linked to distance, as isolation can drive higher retention or prevent re-cycling of materials through lack of infrastructure.
Distribution is a measure of a community’s level of connectivity to a broader economy, such as through transportation conduits. In terms of infra-structural resilience, a community with easy access to highways, major airports, and rail interconnections is
more resilient than an isolated community (Cutter et al. 2010). Strong connections to surrounding com-munities and a broader region enhance community resilience by allowing more access to resources and emergency aid while being responsive to external factors or shocks.
Persistence is measured based on a community’s previous history in facing threats and overcoming and adapting to social-ecological stresses (Assche & Lo, 2011). Historical records can form a baseline indicat-ing how effectively communities have dealt with social-ecological stress in the past. For mountain communities, this is particularly important for antici-pating and adapting to natural threats, such as floods. This proxy helps to measure a community’s experi-ences recovering from major ecological disturbances such as pine-beetle infestations. As a metric for per-sistence, community age can be informative, with historical memory being preserved through records and traditional, generational knowledge.
Collectivism represents how community-driven processes and institutions, such as governmental, pri-vate, and public organizations, respond to social-ecological change (Buduru & Pal, 2010). This char-acteristic indicates how well communities are able to respond to endogenous or exogenous stresses through local cooperation and systems of organization. A high number of community-based programs and in-stitutions [such as labor-union affiliation and the presence of nongovernmental organizations (NGOs)] relative to population can determine if organizational systems enable resilience. High levels of collectivism help to shape more rapid and flexible responses among communities through such processes as adap-tive governance (Folke et al. 2005).
Variability refers to the consistency of environ-mental factors and resource availability for a commu-nity over time. Environmental variability, for ex-ample, has been identified as an important determi-nant of community vulnerability in traditional agri-cultural systems throughout the world (Altieri, 2004). Variability can be measured in several ways: the World Meteorological Organization (WMO), for ex-ample, has used change in precipitation, river dis-charge, and air temperature over a minimum of 30 years to monitor environmental variability. In moun-tain systems, variability is often determined by the location of a community along different gradients (e.g., elevation, location in watershed, slope). As cli-mate change begins to have greater effects on spe-cific landscapes over the next century, variability in environmental factors such as precipitation is ex-pected to increase, greatly affecting agriculture and other activities (Beniston & Stoffel, 2014).
Altaweel et al.: Typology for Mountain Communities
Sustainability: Science, Practice, & Policy | http://sspp.proquest.com Fall 2015 | Volume 11 | Issue 2
7
Directionality refers to the input or output of re-sources due to trade or environmental change. Some mountain communities are more self-sufficient due to local natural resources (e.g., timber), but industrial goods and services needed to capture more value from these resources may be outsourced to other lo-cales. For example, a mountain-ski town imports goods and services to earn revenue through visitors to the resort, gaining resources. A mining town, on the other hand, may extract and export natural resources (removing resources). Directionality informs how (negative or positive) communities are able to accu-mulate resources that promote resilience and adapta-tion related to proxies of distance, distribution, and retention (Carpenter & Brock, 2008).
Substitutability measures a community’s range of available resource options and gauges its ability to adapt under social-ecological stress by having access to redundant and multiple social-ecological resources (Folke et al. 2005). Metrics to inform this proxy can include the availability of nearby work opportunities (e.g., percentage of local residents that commute to jobs) and growing days for agricultural and cultivated plants.
Communication relates to a community’s ability to access knowledge to help promote resilience and adaptation, which can be in the form of mass media or social networks that spread ideas (Vogel et al.
2007). Quantifying the population’s level of access to the Internet and other communication (e.g., libraries, archives) informs this proxy.
Risk is important for determining how likely it is that communities will be affected by disturbance events (e.g., flooding, economic crisis, or disease out-break). Depending on their specific location, higher elevation communities may experience major shocks such as shifts in the quantity and timing of precipita-tion due to climate change, while lower elevation communities may be less affected. Meaningful risk metrics for mountain systems include predicted change in precipitation and snowpack, which can increase due to storm events. Distance from contami-nation sources, such as elevation and location along a watershed gradient, can affect pollution spread (Briggs, 2003). While ambient temperature generally varies with altitude and latitude, variation in meteoro-logical conditions due to climate change is expected to be inconsistent across time and space. The Social Vulnerability Index (HVRI, 2015) is a useful meas-urement of risk that considers susceptibility to envi-ronmental hazards by categories such as race, ethnici-ty, and age, as different cohorts may have greater risk due to socio-economic status.
Based on an SES science approach, all of the proxies inform and affect each other through feed-back loops. However, some proxies are more closely
Table 2 Values of the resilience proxy measures for the 21 sample communities, including size and analysis results. Resilience level category ranges are as follows: A = 3.0–2.4; B = 2.3–1.7; C = 1.6–1.0.
Community / Proxy Siz
e
Div
ersi
ty
Dis
tan
ce
Ret
enti
on
Dis
trib
uti
on
Per
sist
enc
e
Co
llec
tivi
sm
Var
iab
ility
Dir
ecti
on
alit
y
Su
bst
itu
tab
ility
Co
mm
un
icat
ion
Ris
k
Ave
rag
e o
f re
silie
nce
pro
xies
Res
ilien
ce
leve
l
Res
ilien
ce
Ty
pe
Denver, CO 1 2.5 2 2 3 3 2 1.5 3 3 2 2 2.4 A 1A Colorado Springs, CO 1 2.5 1 2 2.5 3 1.5 1 3 1.5 3 3 2.2 B 1B Durango, CO 2 2 2 2 1.5 1 2.5 2 3 1 2 3 2 B 2B Berthoud, CO 2 2 2 2 2 2 2.5 1 3 1.5 2 3 2.1 B 2B Orofino, ID 2 2 3 3 1 3 2 2.5 3 2 2 2 2.3 B 2B Salmon, ID 2 1.5 2.5 3 1 2 2 2 3 1.5 2 2 2.1 B 2B Blackfoot, ID 2 2 2.5 3 2 2 1 1.5 3 1 2 2 2 B 2B Boise , ID 1 1.5 2.5 2 1.5 3 1.5 1 3 1.5 1 2 1.9 B 1B Butte, MT 2 2.5 2.5 2 1.5 1 2.5 2 3 1 1 2 1.9 B 2B Arlee, MT 3 2 2.5 1 1 2 3 2 3 1.5 1 1 1.8 B 3B Tigard, OR 1 3 3 3 2.5 3 2 2 3 2 2 2 2.5 A 1A Vale, OR 3 3 3 3 1 1 3 2 3 2 2 2 2.3 A 3A Medford, OR 1 2.5 3 3 2 1 2.5 1.5 3 1.5 1 2 2.1 B 1B Monticello, UT 3 2.5 2 2 1.5 1 1 2 3 1.5 2 1 1.8 B 3B Salt Lake City, UT 1 2.5 2.5 2 3 3 2 2 3 2.5 2 2 2.4 A 1A Washtucna, WA 3 2 3 2 1.5 2 2.5 2 1 1.5 2 2 2 B 3B Spokane, WA 1 1 3 3 2 2 2.5 2 1 1.5 2 2 2 B 1B Bingen, WA 3 1.5 3 3 2.5 1 2 2 1 2 2 2 2 B 3B Cheyenne, WY 1 2.5 1.5 1.5 3 2 1.5 1.5 3 1.5 2 2 2 B 1B Baggs, WY 3 2 2.5 1 1 2 2 1 3 1 1 2 1.7 B 3B Cody, WY 2 3 2.5 1 1 1 2 2 3 1.5 1 3 1.9 B 2B
Altaweel et al.: Typology for Mountain Communities
Sustainability: Science, Practice, & Policy | http://sspp.proquest.com Fall 2015 | Volume 11 | Issue 2
8
related than others. Diversity, variability, distance, retention, distribution, and directionality are all based on a community’s physical features. Size, persis-tence, and collectivism focus on social aspects of local history and social organization. Risk stands alone because it is based on the prediction of future events, according to an analysis of all other proxies. Topography is not included as a proxy, although it affects many of the proxies, including size, distance, risk, and distribution. Results
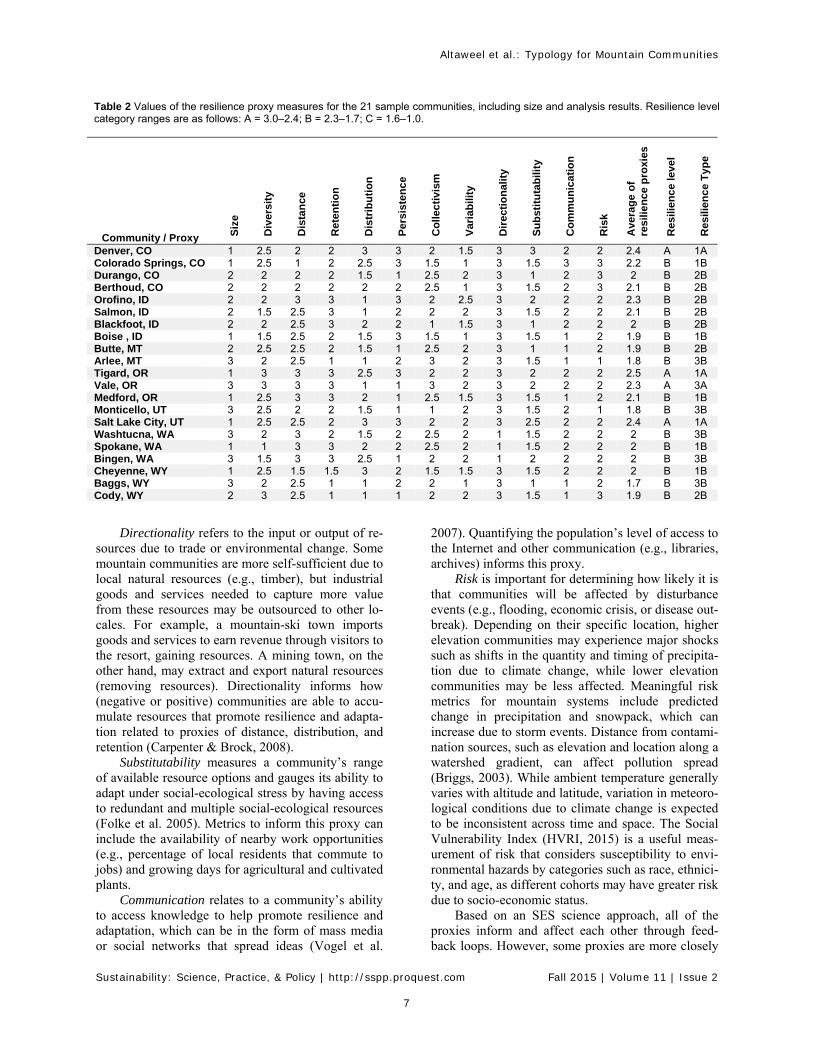
Table 2 displays the size of the communities and aggregate measures of the metrics for each resilience proxy so that they can be compared across communi-ties. The table also shows the final combined size and resilience score for each community. Communities typed A to C are more to less resilient, respectively; community sizes 1 to 3 are large to small, respective-ly.
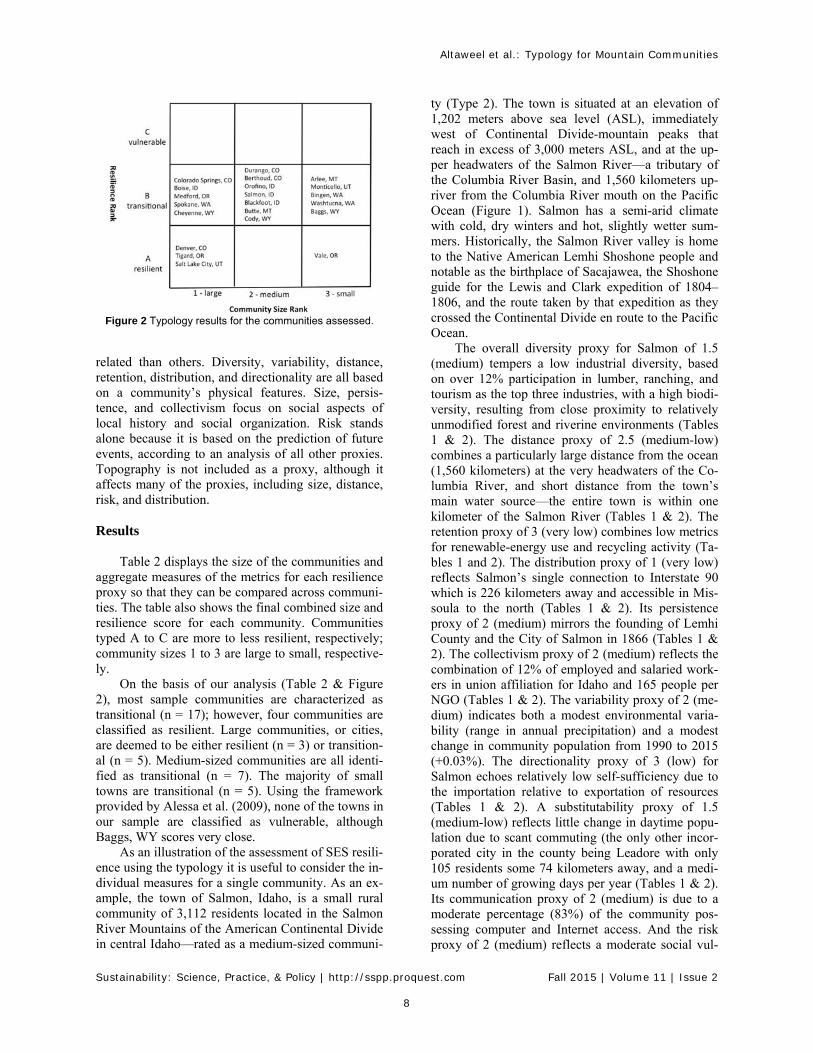
On the basis of our analysis (Table 2 & Figure 2), most sample communities are characterized as transitional (n = 17); however, four communities are classified as resilient. Large communities, or cities, are deemed to be either resilient (n = 3) or transition-al (n = 5). Medium-sized communities are all identi-fied as transitional (n = 7). The majority of small towns are transitional (n = 5). Using the framework provided by Alessa et al. (2009), none of the towns in our sample are classified as vulnerable, although Baggs, WY scores very close.
As an illustration of the assessment of SES resili-ence using the typology it is useful to consider the in-dividual measures for a single community. As an ex-ample, the town of Salmon, Idaho, is a small rural community of 3,112 residents located in the Salmon River Mountains of the American Continental Divide in central Idaho—rated as a medium-sized communi-
ty (Type 2). The town is situated at an elevation of 1,202 meters above sea level (ASL), immediately west of Continental Divide-mountain peaks that reach in excess of 3,000 meters ASL, and at the up-per headwaters of the Salmon River—a tributary of the Columbia River Basin, and 1,560 kilometers up-river from the Columbia River mouth on the Pacific Ocean (Figure 1). Salmon has a semi-arid climate with cold, dry winters and hot, slightly wetter sum-mers. Historically, the Salmon River valley is home to the Native American Lemhi Shoshone people and notable as the birthplace of Sacajawea, the Shoshone guide for the Lewis and Clark expedition of 1804–1806, and the route taken by that expedition as they crossed the Continental Divide en route to the Pacific Ocean.
The overall diversity proxy for Salmon of 1.5 (medium) tempers a low industrial diversity, based on over 12% participation in lumber, ranching, and tourism as the top three industries, with a high biodi-versity, resulting from close proximity to relatively unmodified forest and riverine environments (Tables 1 & 2). The distance proxy of 2.5 (medium-low) combines a particularly large distance from the ocean (1,560 kilometers) at the very headwaters of the Co-lumbia River, and short distance from the town’s main water source—the entire town is within one kilometer of the Salmon River (Tables 1 & 2). The retention proxy of 3 (very low) combines low metrics for renewable-energy use and recycling activity (Ta-bles 1 and 2). The distribution proxy of 1 (very low) reflects Salmon’s single connection to Interstate 90 which is 226 kilometers away and accessible in Mis-soula to the north (Tables 1 & 2). Its persistence proxy of 2 (medium) mirrors the founding of Lemhi County and the City of Salmon in 1866 (Tables 1 & 2). The collectivism proxy of 2 (medium) reflects the combination of 12% of employed and salaried work-ers in union affiliation for Idaho and 165 people per NGO (Tables 1 & 2). The variability proxy of 2 (me-dium) indicates both a modest environmental varia-bility (range in annual precipitation) and a modest change in community population from 1990 to 2015 (+0.03%). The directionality proxy of 3 (low) for Salmon echoes relatively low self-sufficiency due to the importation relative to exportation of resources (Tables 1 & 2). A substitutability proxy of 1.5 (medium-low) reflects little change in daytime popu-lation due to scant commuting (the only other incor-porated city in the county being Leadore with only 105 residents some 74 kilometers away, and a medi-um number of growing days per year (Tables 1 & 2). Its communication proxy of 2 (medium) is due to a moderate percentage (83%) of the community pos-sessing computer and Internet access. And the risk proxy of 2 (medium) reflects a moderate social vul-
Figure 2 Typology results for the communities assessed.
Altaweel et al.: Typology for Mountain Communities
Sustainability: Science, Practice, & Policy | http://sspp.proquest.com Fall 2015 | Volume 11 | Issue 2
9
nerability index score (2.0) for the community (Ta-bles 1 & 2). The average resilience for Salmon of 2.1 is in the range of transitional resilience—an uneven response to disturbance resulting in an overall rating for the community as a type 2B transitional com-munity (Table 2 & Figure 2).
Discussion Benefits and Limitations
The Alessa et al. (2009) typology offers descrip-tions of proxies, but does not specify the metrics that should be used. The categories in the typology are not unique to mountain systems, but mountain char-acteristics such as precipitation, temperature, transport, and diversity of available resources do af-fect results by influencing resilience. As such, the ty-pology allows for flexibility to use different region-specific metrics for capturing resilience in mountain systems. By testing the utility of the typology with mountain communities, we were able to assess the challenges, benefits, and limitations of the typology, so that more robust taxonomies can be developed and data gaps identified. Our proxies were not weighted, as the intent was to identify the communities that showed more or less vulnerability within this particu-lar framework.
Datasets are generally available to capture the size and proxies for resilience reasonably well. Since each of our datasets came from a different source, it was time consuming to collect the appropriate data to inform each metric. As other SES studies have noted, the different scales used for each dataset (e.g., coun-ty, zip code, state levels) present challenges, because there is a need to scale down some datasets to the town level (e.g., per capita) (Cumming et al. 2006). To improve quantitative capacity to evaluate the re-silience of communities, datasets should be collected at the community level.
As an evolving field, resilience science continues to test conceptual SES models that identify metrics of resilience as well as relationships among metrics (Berkley & Gunderson, 2015). In the absence of guidance from a foundation of literature that defines specific metrics to be used in a typology, we select measures that are able to demonstrate the typology’s workability using publically available data. Among the proxies, persistence proves to be the least in-formative in our analysis, as all of the communities were established at roughly the same time. For varia-bility, we use population change from 1990 until the present, which demonstrates that communities can leverage human capital into infrastructure improve-ment (Short & Mussman, 2014). Although less than ideal, the data were readily available and could be used to highlight the relative ability of communities
to address variable resource or ecological conditions. We use the number of growing days for the substitut-ability proxy, as this shows the range of crops that can be grown given prevailing climatic advantage. While mountain communities in the United States are not often known for large-scale commercial agricul-ture, food production does enable local residents to provide for themselves during disruption. For our assessment of risk, we use the Social Vulnerability Index (HVRI, 2013), which we recognize does not include the biophysical aspect of vulnerability, but offers a straightforward way to differentiate risks among communities.
Our typology has potential to be more readily ap-plied using quantitative—rather than qualitative—data, as they provide values that can be directly trans-lated to resilience categories. However, some proxies like collectivism may best be informed through quali-tative documentation of activities conducted by gov-ernment, nongovernmental, and private-public part-nerships. The current typology framework is not very conducive for such qualitative datasets. To under-stand the context that underlies community resilience, better ways to assess qualitative data, such as through the deployment of historical perspectives, are needed to improve typologies. In addition, data sources for metrics are not available in a central repository, so time-consuming online searches in a dispersed and changing digital landscape are needed. We suggest that future typologies consider better ways to include qualitative datasets. While qualitative databases are often inherently difficult to work with, relative measures within such qualitative understanding can at least provide information on what is more or less important from the perspective of resilience.
In this study, we relied only on publically availa-ble data rather than community-based information (e.g., local knowledge, unpublished municipal man-agement information). These data, which are labor in-tensive to collect, could be used in analyses after spe-cific communities of interest have been identified through applying the typology. Depending on open-access data makes the typology useful for managers and planners, who can efficiently allocate their lim-ited resources by more quickly identifying vulnerable communities that may warrant further investigation. In our current study, we emphasize access to data over a more comprehensive approach because we believe that typologies must be easy to populate and implement to be useful in land, resource, and com-munity management. Science often fails to translate results into methodologies that can be utilized by managers and applied researchers, resulting in a research-implementation gap that this study attempts to fill (Walsh et al. 2014).
Altaweel et al.: Typology for Mountain Communities
Sustainability: Science, Practice, & Policy | http://sspp.proquest.com Fall 2015 | Volume 11 | Issue 2
10
Another limitation of our approach is that the metric scores are calculated based on our sample. However, we selected this approach because our main goal was to demonstrate the potential utility of the typology as one step in a more encompassing process toward vulnerability assessment of a large number of communities. One benefit of our approach, nevertheless, is that the resilience score is adaptable to changing circumstances within the sample itself. As new resilience typologies and assessments are developed and tested, more rigorous comparisons will be possible. This was attempted for this study but proved difficult for the given data values that were available. In any case, we contend that our analysis offers valuable perspective on advancing SES typologies.
Relevance of Results
Our assessed communities indicate that larger cities are slightly more resilient than smaller commu-nities, where Size 1 settlements average a 2.18 resili-ence score vs. 2.06 for all other settlements. On one hand, the higher resilience result could be because relatively larger communities generally have more diversified economies; more efficient connections to national and international transportation networks; use of resources; and ability to leverage social, knowledge, and financial capital. In advanced econ-omies, cities tend to have social and economic capac-ity to develop increasingly resilient infrastructures (Pretty & Ward, 2001; Vugrin et al. 2010; Walker & Cooper, 2010; Smith & Stirling, 2011). In compari-son to larger cities, smaller mountain communities, particularly those with populations of less than a few thousand, are slightly more vulnerable (Size 3 com-munities have a 1.98 resilience average). Interesting-ly, no communities are classified as Type C (vulnera-ble). There are a number of possible explanations, such as that no communities in the sample group are vulnerable, the United States is simply relatively wealthier and better able to address resilience, and the typology is not specific enough to inform the re-silience context of mountains (e.g., mountain system may represent a nested typology within the typology that we used). Instead of adjusting scores so that some communities are assigned to each of the re-silience categories (e.g., centering proxy scores at “2”), we chose to maintain the original protocol, so that the results could be comparable to future typo-logical analyses.
Unfortunately, we were unable to find many oth-er studies similar to the approach that we have em-ployed here, making comparison to previous work difficult. Pickett et al. (2014) propose some relevant ideas of urban adaptation and how it could benefit types (large to small) of communities, but this does
not include a practical implementation of a typology to case studies. Although comparable current re-search efforts have been produced to investigate cit-ies and their capacity for resilience (e.g., Arup Group, 2015; BRR, n.d.), we find that these studies do not account sufficiently for environmental, geo-graphical, or biogeographic effects.
Future Direction
This study offers yet one more step in improving typologies so that they can provide useful infor-mation for stakeholders seeking to make decisions regarding community- and landscape-level resilience. A next step entails more rigorous analysis and identi-fication of appropriate metrics. Even among monitor-ing initiatives, it is unclear what indicators should be assessed to support improvements in community re-silience (Carpenter et al. 2001), a situation that remains a major challenge for the broader monitoring community (Schimel & Keller, 2015).
We applied our typology to mountain communi-ties in the western United States, where data are more available than for less developed nations (Sunderlin et al. 2005). A major obstacle for all managers is data availability, which has led to advocacy for open-access publishing (Fuller et al. 2014). With a new push for large-scale, standardized, and publicly ac-cessible data around the world (e.g., observatories, census data, satellite maps), data will likely become more accessible in the future, making possible global-scale analyses. Remote-sensing data is another attractive and simple resource useful for providing quick proxy measurements until more adequate re-sources are obtained from ground-based sources.
Based on our experience, we have some concrete recommendations for the next steps needed to devel-op an effective and useful SES typology. Researchers should strive to:
Develop a portal that assembles datasets for met-
rics in one place, so that the mining of data can be made more efficient.
Define best practices, particularly in regard to the unit analysis and scales used among different datasets, so that the data can be more interopera-ble and easier to use.
Increase testing of SES and resilience science theories, conceptual models, and typologies to better define the metrics and relationships among metrics.
Increase the sample size used to test typologies to better define the range and thresholds for met-rics.
Altaweel et al.: Typology for Mountain Communities
Sustainability: Science, Practice, & Policy | http://sspp.proquest.com Fall 2015 | Volume 11 | Issue 2
11
Test the limits of the typology in other mountain systems, ecosystems and landscapes, and geopo-litical and sociopolitical contexts.
Foster better partnerships with data- and informatics-science communities to help over-come data challenges in the typology, such as the need to identify better ways to include qualitative data and community-based data.
Conclusion
We present an application of the Alessa et al. (2009) SES typology to evaluate its utility for as-sessing resilience of communities located in moun-tain landscapes. We offer suggestions to further re-fine a conceptual SES typology so that better assess-ment of the resilience of communities in specific landscapes can occur. With such refinement, SES typologies can provide useful information for region-al planners, for instance at the state level, as a way to compare vulnerability of multiple communities. For researchers, typologies offer a useful tool and ap-proach to better evaluate conceptual SES models and to analyze patterns and causes of resilience or vulner-ability to change. Efforts to standardize data and ana-lytical approaches for SESs and resilience science will help to advance these fields toward new frontiers and increase their application in practice.
Our study offers a starting point for further de-velopment of typologies. Taxonomic tools are critical for identifying communities and regions or geograph-ic areas that are more or less resilient, but these pro-vide a coarse-level diagnostic, so that more compre-hensive assessment and data collection can be applied more efficiently. With growing global population, changing climate, and increasing pressures on limited natural resources and infrastructure, an SES approach is needed in land and natural resource management, so that the landscape and its components can be treat-ed as an interconnected system with shared goals toward greater resilience. Acknowledgments This work was supported by the Mountain Social Ecologi-cal Observatory Network (MtnSEON; NSF award #DEB 1231233), the Dynamics of Coupled Natural Human Sys-tems: Water-use Decisions in a Dynamic Environment Pro-ject (CNH; NSF Award #BCS 1114851), and the Idaho EPSCoR Program (MILES; NSF award #IIA-1301792). The views expressed here do not necessarily represent those of the funders. We also express our gratitude to Kacy Kreiger (University of Alaska Anchorage) for the carto-graphic design on Figure 1.
References Adams, W., Aveling, R., Brockington, D., Dickson, B., Elliott, J.,
Hutton, J., Roe, D., Vira, B., & Wolmer, W. 2004. Biodiver-sity conservation and the eradication of poverty. Science 306 (5699):1146–1149.
Adger, W., Kelley, P., Winkels, A., Huy, L., & Locke, C. 2002. Migration, remittances, livelihood trajectories, and social re-silience. Ambio 31(4):358–366.
Alessa, L., Kliskey, A., & Altaweel, M. 2009. Toward a typology for social-ecological systems. Sustainability: Science, Prac-tice, and Policy 5(1):31–41.
Alley, R., Marotzke, J., Nordhaus, W., Overpeck, J., Peteet, D., Pielke, R., Pierrehumbert, R., Rhine, P., Stocker, T., Talley, L., & Wallace, J. 2003. Abrupt climate change. Science 299 (5615):2005–2010.
Altieri, M. 2004. Linking ecologists and traditional farmers in the search for sustainable agriculture. Frontiers in Ecology and the Environment 2(1):35–42.
Anderson, D., Salick, J., Moseley, R., & Xiaokun, O. 2005. Con-serving the sacred medicine mountains: a vegetation analysis of Tibetan sacred sites in Northwest Yunnan. Biodiversity & Conservation 14(13):3065–3091.
Arup Group. 2015. City Resilience Framework. http://www.arup. com/cri. November 23, 2015.
Assche, K. & Lo, M. 2011. Planning, preservation and place branding: a tale of sharing assets and narratives. Place Branding and Public Diplomacy 7:116–126.
Beniston, M. 2003. Climatic change in mountain regions: a review of possible impacts. Climatic Change 59(1):5–31.
Beniston, M. & Stoffel, M. 2014. Assessing the impacts of climatic change on mountain water resources. Science of the Total En-vironment 493:1129–1137.
Berkes, F., Colding, J., & Folke, C. 2003. Navigating Social-Ecological Systems: Building Resilience for Complexity and Change. New York: Cambridge University Press.
Berkley, J. & Gunderson, L. 2015. Practical resilience: building networks of adaptive management. In C. Allen & A. Garmestani (Eds.), Adaptive Management of Social-Ecological Systems. pp. 201–216. London: Springer.
Blaikie, P. & Sadeque, S. 2000. Policy in High Places: Environ-ment and Development in the Himalayan Region. Kathman-du: International Centre for Integrated Mountain Develop-ment.
Blair, B., Lovecraft, A., & Kofinas, G. 2014. Meeting institutional criteria for social resilience: a nested risk system model. Ecology and Society 19(4):36.
Briggs, D. 2003. Environmental pollution and the global burden of disease. British Medical Bulletin 68(1):1–24.
Brondizio, E. & Chowdhury, R. 2013. Human-environmental re-search: past trends, current challenges, and future directions. In E. Brondizio & E. Moran (Eds.), Human-Environmental Interactions: Current and Future Directions. pp. 391–400. London: Springer.
Buduru, B. & Pal, L. 2010. The globalized state: measuring and monitoring governance. European Journal of Cultural Stud-ies 13(4):511–530.
Buergelt, P. & Paton, D. 2014. An ecological risk management and capacity building model. Human Ecology 42(4):591–603.
Building Resilient Regions (BRR). n.d. Resilience Capacity Index. http://brr.berkeley.edu/rci/. November 23, 2015.
Bureau of Labor Statistics (BLS). 2014. Union Affiliation of Em-ployed Wage and Salary Workers by State, 2013–2014 An-nual Averages. http://www.bls.gov/news.release/union2. t05.htm. May 25, 2015.
Carney D. 1998. Sustainable Rural Livelihoods: What Contribu-tion Can We Make? Nottingham, UK: Russell Press.
Carpenter, S. & Brock, W. 2008. Adaptive capacity and traps. Ecology and Society 13(2):40.
Altaweel et al.: Typology for Mountain Communities
Sustainability: Science, Practice, & Policy | http://sspp.proquest.com Fall 2015 | Volume 11 | Issue 2
12
Carpenter, S., Walker, B., Anderies, M., & Abel, N. 2001. From metaphor to measurement: resilience of what to what? Eco-systems 4(8):765–781.
Chapin, F., Peterson, G., Berkes, F., Callaghan, T., Angelstam, P., Apps, M., Beier, C., Bergeron, Y., Crépin,A.-S., Danell, K., Elmqvist,T., Folke, C., Forbes, B., Fresco, N., Juday, G., Niemelä, J., Shvidenko, A., & Whiteman, G. 2004. Resili-ence and vulnerability of northern regions to social and envi-ronmental change. AMBIO 33(6):344–349.
City Data. 2015. City Data. http://www.City-Data.com. May 25, 2015.
Cohen, J. & Small, J. 1998. Hypsographic demography: the distri-bution of human population by altitude. Proceedings of the National Academy of Sciences 95(24):14009–14014.
Cutter, S., Burton, C., & Emrich, C. 2010. Disaster resilience indi-cators for benchmarking baseline conditions. Journal of Homeland Security and Emergency Management 7(1):1547–7355.
Cumming, G., Barnes, G., Perz, S., Schmink, M., Sieving, K., Southworth, J., Binford, M., Holt, R., Stickler, C., & Van Holt, T. 2005. An exploratory framework for the empirical measurement of resilience. Ecosystems 8(8):975–987.
Cumming, G., Cumming, D., & Redman, C. 2006. Scale mis-matches in social-ecological systems: causes, consequences, and solutions. Ecology and Society 11(1):14.
Cumming, G., Olsson, P., Chapin, F., & Holling, C. 2013. Resili-ence, experimentation, and scale mismatches in social-ecological landscapes. Landscape Ecology 28(6):1139–1150.
Dasgupta, P. 1995. The population problem: theory and evidence. Journal of Economic Literature 33(4):1879–1902.
Emelko, M., Silins,U., Bladon, K., & Stone, M. 2011. Implications of land disturbance on drinking water treatability in a chang-ing climate: demonstrating the need for “source water supply and protection” strategies. Water Research 45(2):461–472.
Emtage, N., Herbohn, J., & Harrison, S. 2006. Landholder typolo-gies used in the development of natural resources manage-ment programs in Australia: a review. Australasian Journal of Environmental Management 13(2):79–94.
Farmer’s Almanac. 2015. Frost Dates Calculator for Places in Cali-fornia. http://www.almanac.com/content/frost-chart-united states/CA. May 25, 2015.
Folke, C., Hahn, T., Olsson, P., & Norberg, J. 2005. Adaptive gov-ernance of social-ecological systems. Annual Review of Envi-ronment and Resources 30(1):441–73.
Folke, C. 2006. Resilience: the emergence of a perspective for so-cial-ecological systems analyses. Global Environmental Change 16(3):253–267.
Forman, R. 2008. Land Mosaics: The Ecology of Landscapes and Regions. New York: Cambridge University Press.
Fuller, R., Lee, J., & Watson, J. 2014. Achieving open access to conservation science. Conservation Biology 28(6):1550–1557.
Gardner, J. & Dekens, J. 2007. Mountain hazards and the resili-ence of social-ecological systems: lessons learned in India and Canada. Natural Hazards 41(2):317–336.
Gibon, A., Sheeren, D., Monteil, C., Ladet, S., & Balent, G. 2010. Modelling and simulating change in reforesting mountain landscapes using a social-ecological framework. Landscape Ecology 25(2):267‒285.
Google Earth. (2015). Western United States. 40°02’54.14”N 111°03’25.02”W. Landstat: http://www.earth.google.com. January 18, 2016.
de Groot, R., Wilson, M., & Boumans, R. 2002. A typology for the classification, description and valuation of ecosystem func-tions, goods and services. Ecological Economics 41(3):393–408.
Heffernan, J., Soranno, P., Angilletta, M., Buckley, L., Gruner, D., Keitt, T., & Kellner, J. 2014. Macrosystems ecology: under-standing ecological patterns and processes at continental
scales. Frontiers in Ecology and the Environment 12(1):5–14.
Haslett, J. 1997. Mountain ecology: organism responses to envi-ronmental change–an introduction. Global Ecology and Bio-geography 6(1):3–6.
Hazards & Vulnerability Research Institute (HVRI). 2013. Social Vulnerability Index for the United States: 2006–10. http://webra.cas.sc.edu/hvri/products/sovi.aspx. January 14, 2015.
Hewitt, K. 2014. Regions of Risk: A Geographical Introduction to Disasters. New York: Routledge.
Holycross, A. & Douglas, M. 2007. Geographic isolation, genetic divergence, and ecological non-exchangeability define con-servation units in a threatened sky-island rattlesnake. Biolog-ical Conservation 134(1):142–154.
Hope, G. 2014. The sensitivity of the high mountain ecosystems of New Guinea to climatic change and anthropogenic impact. Arctic, Antarctic, and Alpine Research 46(4):777–786.
Internal Revenue Service (IRS). 2015. Exempt Organizations Select Check. http://apps.irs.gov/app/eos/forwardToPub78 Download.do. May 25, 2015.
Kaneshiro, K., Chinn, P., Duin, K., Hood, A., Maly, K., & Wilcox, B. 2005. Hawai’i’s mountain-to-sea ecosystems: social-ecological microcosms for sustainability science and practice. EcoHealth 2(4):349–360.
Kamehameha Schools. 1994. Life in Early Hawai’i: The Ahupua’a, 3rd Ed. Honolulu: Kamehameha Schools Press.
Kliskey, A., Alessa, L., & Barr, B. 2009. Integrating local and tra-ditional ecological knowledge for marine resilience. In K. McLeo & H. Leslie (Eds.), Managing for Resilience: New Directions for Marine Ecosystem-Based Management. pp. 145–161. Washington, DC: Island Press.
Krausmann, F., Fischer-Kowalski, M., Schandel, H., & Eisenmenger, N. 2008. The global sociometabolic transition: past and present metabolic profiles and their future trajecto-ries. Journal of Industrial Ecology 12(5–6):637–656.
Kullman, L. 2004. The changing face of the alpine world. Global Change Newsletter 57(1):12–14.
Lambin, E., Geist, H., & Lepers, E. 2003. Dynamics of land-use and land-cover change in tropical regions. Annual Review of Environment and Resources 28(1):205–241.
Marston, S. 2000. The social construction of scale. Progress in Hu-man Geography 24(2):219–242.
Messerli, B., Viviroli, D., & Weingartner, R. 2004. Mountains of the world: vulnerable water towers for the 21st century. Am-bio 13(1):29–34.
Mountain Social Ecological Observatory Network (MtnSEON). 2015. What’s MtnSEON? http://webpages.uidaho.edu/ mtnseon. May 11, 2015.
Nature Serve. 2015 NatureServe Explorer: Plants/Animals. http://explorer.natureserve.org/servlet/NatureServe. May 25, 2015.
Nuissl, H., Haase, D., Lanzendorf, M., & Wittmer, H. 2009. Envi-ronmental impact assessment of urban land use transitions: a context-sensitive approach. Land Use Policy 26(2):414–424.
O’Neel, S., Hood, E., Bidlack, A., Fleming, S., Arimitsu, M., Arendt, A., Burgess, E., Sergeant, C., Beaudreau, A., Timm, K., Hayward, G., Reynolds, J., & Pyare, S. 2015. Icefield-to-ocean linkages across the Northern Pacific Coastal Temper-ate Rainforest. BioScience 65(5):499–512.
Ostrom, E. 2005. Understanding Institutional Diversity. Princeton, NJ: Princeton University Press.
Ostrom, E. 2009. A general framework for analyzing sustainability of social-ecological systems. Science 325(5939):419–422.
Ostrom, E. & Cox, M. 2010. Moving beyond panaceas: a multi-tiered diagnostic approach for social-ecological analysis. En-vironmental Conservation 37(4):451–63.
Pickett, S., McGrath, B., Cadenasso, M., & Felson, A. 2014. Eco-logical resilience and resilient cities. Building Research & In-formation 42(2):143–157.
Altaweel et al.: Typology for Mountain Communities
Sustainability: Science, Practice, & Policy | http://sspp.proquest.com Fall 2015 | Volume 11 | Issue 2
13
Pretty, J. & Ward, H. 2001. Social capital and the environment. World Development 29(2):209–227.
Ratner, B. 2000. Watershed Governance: Livelihoods and Re-source Competition in the Mountains of Mainland Southeast Asia. Washington, DC: World Resources Institute.
RecyclingCenters.org. 2015. Find a Recycling Centers and Busi-nesses that Recycle by State. http://www.recycling centers.org/Recycling_Centers_by_State.php. May 25, 2015.
Reed, M., Graves, A., Dandy, N., Posthumus, H., Hubacek, K., Morris, J., Prell, C., Quinn, C., & Stringer, L. 2009. Who’s in and why? A typology of stakeholder analysis methods for natural resource management. Journal of Environmental Management 90(5):1933–1949.
Rescia, A., Pons, A., Lomba, I., Esteban, C., & Dover, J. 2008. Re-formulating the social-ecological system in a cultural rural mountain landscape in the Picos de Europa region (northern Spain). Landscape and Urban Planning 88(1):23–33.
Reyers, B., Polasky, S., Tallis, H., Mooney, H., & Larigauderie, A. 2012. Finding common ground for biodiversity and ecosys-tem services. BioScience 62(5):503–507.
Schimel, D. & Keller, M. 2015. Big questions, big science: meet-ing the challenges of global ecology. Oecologia 177(4):925–934
Shackleton, C. & Shackleton, S. 2004. The importance of non-timber forest products in rural livelihood security and as safe-ty nets: a review of evidence from South Africa. South Afri-can Journal of Science 100(11–12):658–664.
Short, J. & Mussman, M. 2014. Population change in U.S. cities: estimating and explaining the extent of decline and level of resurgence. The Professional Geographer 66(1):112–123.
Skoufias, E. 2003. Economic crises and natural disasters: coping strategies and policy implications. World Development 31(7): 1087–1102.
Smith, A. & Stirling, A. 2010. The politics of social-ecological re-silience and sustainable socio-technical transitions. Ecology and Society 15(1):11.
Stoddard, E. 1991. Frontiers, border and border segmentation: to-ward a conceptual clarification. Journal of Borderlands Stud-ies 6(1):1–22.
Sunderlin, W., Angelsen, A., Belcher, B., Burgers, P., Nasi, R., Santoso, L., & Wunder, S. 2005. Livelihoods, forests, and conservation in developing countries: an overview. World Development 33(9):1383–1402.
Travel Math. 2015. TravelMath.com. http://www.travelmath.com. May 25, 2015.
United States Census Bureau (U.S. Census). 2010a. 2010 Census Urban and Rural Classification and Urban Area Criteria. https://www.census.gov/geo/reference/ua/urban-rural-2010.html. May 25, 2015.
United States Census Bureau (U.S. Census). 2010b. U.S. Census: Commuter Adjusted Daytime Population: 2006–2010. https://www.census.gov/hhes/commuting/data/acs2006_2010.html. May 25, 2015.
United States Census Bureau (U.S. Census). 2013a. County Busi-ness Patterns. http://www.census.gov/econ/cbp/index.html. May 25, 2015.
United States Census Bureau (U.S. Census). 2013b. Computer and Internet Access in the United States. http://www.census.gov/ hhes/computer/publications/2013.html. May 25, 2015.
United States Census Bureau (U.S. Census). 2015a. Annual Esti-mates of the Resident Population for Incorporated Places: April 1, 2010 to July 1, 2014. http://www.census.gov/popest /data/cities/totals/2014/SUB-EST2014-3.html. May 25, 2015.
United States Census Bureau (U.S. Census). 2015b. Foreign Trade: State Export and Import. https://www.census.gov/foreign-trade/statistics/state/data/index.html. January 18, 2016.
United States Department of Energy (USDOE). 2013. Energy Pro-duction by State. http://www.energy.gov/maps/renewable-energy-production-state. May 25, 2015.
U.S. Climate Resilience Toolkit. 2015. Homepage. https://toolkit. climate.gov/. May 25, 2015.
Vogel, C., Moser, S., Kasperson, R., & Dabelko, G. 2007. Linking vulnerability, adaptation, and resilience science to practice: pathways, players, and partnerships. Global Environmental Change 17(3–4):349–364.
Vugrin, E., Warren, D., Ehlen, M., Camphouse, R. 2010. A frame-work for assessing the resilience of infrastructure and eco-nomic systems. In K. Gopalakrishnan & S. Peeta (Eds.), Sus-tainable & Resilient Critical Infrastructure Systems. pp. 77–116. Berlin: Springer-Verlag.
Walker, J. & Cooper, M. 2011. Genealogies of resilience: from systems ecology to the political economy of crisis adaptation. Security Dialogue 42(2):143–160.
Wallace, K. 2007. Classification of ecosystem services: problems and solutions. Biological Conservation 139(3–4):235–246.
Walsh, J., Dicks, L., & Sutherland, W. 2014. The effect of scien-tific evidence on conservation practitioners’ management de-cisions. Conservation Biology 29(1):88–98.
Weaver, J. 2001. The Transboundary Flathead: A Critical Land-scape for Carnivores in the Rocky Mountains (No. 18). Bo-zeman, MT: World Conservation Society.
Western Regional Climate Center. 2015. Mean Monthly and Annu-al Precipitation. http://www.wrcc.dri.edu/climatedata/clim tables/citycompppt/. May 25, 2015.
Wikipedia. 2015. List of United States Cities by Population. https://en.wikipedia.org/wiki/List_of_United_States_cities_by_population. January 23, 2016.
Wilbanks, T. & Kates, R. 1999. Global change in local places: how scale matters. Climatic Change 43(3):601–628.
Wild, R., C. McLeod, & P. Valentine (Eds.). 2008. Sacred Natural Sites: Guidelines for Protected Area Managers (No. 16). Gland, Switzerland: International Union for Conservation of Nature.
Winkler, R., Field, D., Luloff, A., Krannich, R., & Williams, T. 2007. Social landscapes of the inter-mountain West: a com-parison of “Old West” and “New West” communities. Rural Sociology 72(3):478–501.
Wisner, B., Blaikie, P., Cannon, T., & Davis, I. 2004. At Risk: Nat-ural Hazards, People’s Vulnerability and Disasters. New York: Routledge.