Embed Size (px)
Citation preview

A VALUE RELEVANCE EXAMINATION OF THE CURRENT LEASING STANDARD
Bradley P. Lindsey
A dissertation submitted to the faculty of the University of North Carolina at Chapel Hill in partial fulfillment of the requirements for the degree of Doctor of Philosophy in the Kenan-Flagler Business School (Accounting).
Chapel Hill 2006
Approved by
Co-Advisor: Wayne Landsman Co-Advisor: Edward Maydew
Reader: John Hand Reader: Matthias Kahl
Reader: Jana Smith Raedy
ii
ABSTRACT
BRADLEY P. LINDSEY: A Value Relevance Examination of the Current Leasing Standard (Under the direction of Wayne Landsman and Edward Maydew)
In the wake of the prominent accounting scandals of the past several years, investors and
standard setters are demanding increased corporate transparency. Nowhere is the demand for
transparency more salient than with off-balance-sheet financing, of which lease accounting
plays a major role. At the end of 2004, total rental commitments by U.S. firms from off-
balance-sheet operating leases exceeded $1 trillion. As standard setters reconsider leases as
part of their broad reexamination of off-balance-sheet financing, they do so without the
benefit of empirical research documenting whether capital market participants find the
current leasing standard value relevant. This paper examines whether as-if capitalized
operating lease liabilities and capital lease liabilities are both relevant and sufficiently
reliable to be priced and explores whether equity investors value operating and capital leases
differently. The results are consistent with the market viewing both operating and capital
leases as economic liabilities of the firm. However, the results also indicate that capital
market participants price operating and capital lease liabilities differently, consistent with the
bright-line tests of the current leasing standard identifying economic differences in operating
and capital leases. Thus, continuing to require lease disclosures by different lease
classifications would assure that equity investors will not suffer from a loss of value relevant
information in the pricing of leases.

iii
ACKNOWLEDGEMENTS
I am especially thankful for my amazing wife Camille who was willing to leave a
beautiful, new home and a comfortable lifestyle to embrace poverty and head back to school.
This gesture I will remember and be in awe of all the rest of the days of my life. Her
constant support coupled with the encouragement and empathy of wonderful parents and
family members on both sides of the family kept me motivated and focused on my dream to
be a college professor. I am also grateful for my amazing children Allison, Nathan, and
Rebecca for being a constant source of joy and perspective throughout this challenging and
rewarding episode in my life.
iv
TABLE OF CONTENTS
Page
LIST OF TABLES…………………………………………………………………………….v
Chapter
I INTRODUCTION…………………………………………………………….1
II BACKGROUND AND HYPOTHESIS DEVELOPMENT…………………..7
III RESEARCH DESIGN……………………………………………………….13
3.1 Estimating the As-if Capitalized Operating Lease Asset and Liability………………………………………………13
3.2 Empirical Specification………………………………………….17
IV SAMPLE SELECTION AND DESCRIPTIVE TATISTICS……………......20
4.1 Hand-collected Sample Selection and Summary Statistics……..20
4.2 Sample Selection and Descriptive Statistics for Hypothesis Testing………………………………………………22
V REGRESSION RESULTS………………………………………………..…27
5.1 Robustness Tests………………………………………………...30
VI CONCLUSION………………………………………………………………32
Appendix……………………………………………………………………………………..34
References…………………………………………………………………………………....49

v
LIST OF TABLES
Table Page
1. Estimation of The Operating Lease Asset and Liability………………………………….37
Panel A: Hand-collected Sample Selection Criteria………………………………...37
Panel B: Calibration of the Estimated As-if Capitalized Operating Lease Liability..37
Panel C: Total Rental Commitments by Disclosed Lease Classification Categories.38
Panel D: Estimation of the Operating Lease Asset with Capital Lease Data……….38
2. Sample Selection Criteria and Industry and Year Sample Representation……………….39
Panel A: Sample Selection Criteria………………………………………………….39
Panel B: Industry and Year Sample Representation………………………………...39
3. Sample and Compustat Industry Concentration………………………………………….40
4. Balance Sheet and Financial Statement Ratio Effects of Capitalizing Operating Leases..41
5. Descriptive Statistics of Regression Variables…………………………………………..42
6. Pearson and Spearman Correlation Coefficients…………………………………………44
7. Value Relevance of Operating and Capital Lease Liabilities…………………………….45
8. Descriptive Statistics of Regression Variables Based on Capital Lease Activity………..47
9. Robustness Tests: Value Relevance of Operating and Capital Lease Liabilities………..48
CHAPTER 1
INTRODUCTION
This paper examines the value relevance of operating and capital leases to investigate
whether equity investors price operating lease disclosures in the notes to the financial
statements differently than capital lease amounts recognized on the balance sheet. Ever since
Statement of Financial Accounting Standards No. 13 “Accounting for Leases” (SFAS 13)
became effective in 1976, leases that meet certain criteria have been required to be
capitalized on the balance sheet, creating both a capital lease asset and a capital lease
liability.1 Leases not meeting any of the capitalization criteria under
SFAS 13 are classified as operating leases, resulting in an annual rental expense over the
lease term and the disclosure of rental commitments related to future years in the notes to the
financial statements.2
At the end of 2004, total rental commitments by U.S. firms from off-balance sheet
operating leases equaled $1.05 trillion.3 Had these operating lease rental commitments been
1 The FASB issued SFAS 13 in 1976 requiring retroactive capitalization of all capital leases. In order to allow sufficient time for lessees with numerous lease contracts to analyze existing lease arrangements and to provide an opportunity for lessees to settle contractual violations resulting from the SFAS 13 capitalization criteria, the SEC required implementation of SFAS 13 by firm fiscal year-ends beginning in December 1978. 2 The appendix provides a brief summary of the lease classification criteria in SFAS 13 as well as a simple example illustrating the differing accounting treatment for operating and capital leases. 3 This is a conservative estimate of the extent of operating lease activity, comprising only minimum operating lease rental commitments from the footnote disclosures of publicly-traded firms with nonmissing leasing variables available in Compustat. In addition, the operating leases of private firms as well as contingent rental payments (percentage of sales or profits) and lease renewal options are also excluded from this total as prescribed under SFAS 13.
2
capitalized, I estimate that the as-if capitalized operating lease liabilities for U.S. firms at the
end of 2004 would exceed $625 billion. In comparison, long-term debt for U.S. firms totaled
more than $6.5 trillion at the end of 2004. Accordingly, operating lease rental commitments
that remain off the balance sheet account for approximately nine percent of corporate debt.
Utilizing a conservative estimate that all missing observations in Compustat represent no
leasing activity, more than 86 percent of firms listed on Compustat entered into operating
lease transactions with little variation across industries. Thus, not only does operating lease
activity generate significant cash outlays but these data suggest that operating leases are
pervasive.
The magnitude of leasing undertaken as operating leases dwarfs that undertaken as capital
leases. At the end of 2004, the total amount of capital lease liabilities recognized by
publicly-traded firms was $89.8 billion or $16.2 million per firm. In contrast to operating
leases, only 36 percent of firms report capital lease liabilities with the frequency varying
from 17 to 52 percent of firms across industries as measured by one-digit SIC codes. Simply
comparing the relative magnitudes of operating and capital lease activity reveals that
approximately 85 percent of leasing obligations take place under leases that avoid the lease
capitalization criteria of SFAS 13.
Concern over the magnitude and pervasiveness of leases, as well as the role of lease
accounting in alleged corporate accounting scandals, resulted in the requirements for
expanded lease disclosure in the Sarbanes-Oxley Act. Specifically, Section 401 mandates
increased disclosure of contractual obligations including capital and operating leases in the
management discussion and analysis portion of public filings. In Sarbanes-Oxley, Congress
also expressed concern over rules-based accounting standards and directed the Securities and
3
Exchange Commission (SEC) to study the feasibility of moving to principle-based standards.
The lease capitalization criteria in SFAS 13 are perhaps the most often mentioned examples
of rules-based standards.
In addition to requiring increased disclosure, Section 401 of the Sarbanes-Oxley Act also
called upon the SEC to conduct a study on the extent of off-balance sheet arrangements and
whether current financial statements transparently reflect the economics of off-balance sheet
arrangements. In its report recently issued to the President of the United States and to
Congress to satisfy this legislatively mandated requirement, the SEC recommended that “the
FASB should undertake a project to reconsider the standards for accounting for leases.”4 To
support this recommendation, the SEC states that “the current ‘all or nothing’ lease
accounting guidance is not designed to reflect the wide continuum of lease arrangements that
are used, and therefore, it cannot transparently and consistently reflect the varying economics
of the underlying arrangements.”
The FASB appears to be keenly aware of the current uneasiness associated with leasing
transactions and related off-balance sheet activities. In January 2003, the FASB addressed
some off-balance sheet arrangements by issuing Interpretation No. 46 “Consolidation of
Variable Interest Entities” (FIN 46).5 However, basic off-balance sheet financing, including
operating lease transactions that do not require a special purpose entity (SPE), have not yet
been re-evaluated. The FASB Board members, industry representatives, and academic
4 The SEC issued the “Report and Recommendations Pursuant to Section 401(c) of the Sarbanes-Oxley Act of 2002 On Arrangements with Off-Balance Sheet Implications, Special Purpose Entities, and Transparency of Filings by Issuers” on June 15, 2005. 5 In December 2003, the FASB issued FASB Interpretation No. 46 (revised December 2003), Consolidation of Variable Interest Entities (FIN 46R), which broadens the rules surrounding whether firms should consolidate an entity. FIN 46R replaced FASB Interpretation No. 46, Consolidation of Variable Interest Entities, and provided clarification on how the new consolidation rules should be applied and when they should be implemented by various entities.

4
participants that comprise the Financial Accounting Standards Advisory Council (FASAC)
recently prioritized in the 2005 FASAC survey the five specific, standard-setting
recommendations identified by the SEC in its June 2005 report. FASAC members ranked
lease accounting as the second most important standard-setting priority of the SEC
recommendations, and FASB Board members ranked lease accounting as the third most
important standard-setting priority. In a recent Wall Street Journal article (Lease Accounting
Draws Scrutiny; November 18, 2005), the FASB’s chairman Robert Herz stated that the
FASB “will decide early next year whether to add a formal project on lease accounting to its
agenda.” Mr. Herz also added that “if approved, the project he envisions would be ‘a
comprehensive relook at the whole model’ for lease accounting, which he said hasn’t had a
major overhaul since 1976.”
As standard setters gauge whether to reconsider SFAS 13 and the accounting for leases,
they do so without the benefit of empirical research documenting whether capital market
participants find the current leasing standard value relevant.6 To fill this gap, my paper
explores whether operating lease disclosures and recognized capital lease amounts under
SFAS 13 are both relevant and sufficiently reliable to be priced, and if so, whether the market
values operating and capital leases differently. In order to test my hypotheses, I construct an
as-if capitalized operating lease liability measure by discounting firms’ future operating lease
rental commitment amounts with a firm-specific discount rate. The results show a negative,
significant relation between as-if capitalized operating lease liabilities and market value of
equity. Likewise, the results reflect a negative, significant relation between capital lease
liabilities and market value of equity. Thus, the market seems to view both disclosed
6 Imhoff et al. (1993) document that equity investors incorporate operating lease disclosures in the airline and retail grocery industries into risk assessments over a six year period from 1984 to 1990. Additionally, Ely (1995) investigates whether the market views operating leases as property rights in assessing equity risk.

5
operating lease commitments and recognized capital lease liabilities as economic liabilities of
the firm. However, the results also indicate that the market prices as-if capitalized operating
lease liabilities and recognized capital lease liabilities differently, consistent with the current
leasing standard identifying economically different leases. Specifically, the pricing multiple
on the capital lease liability is significantly greater in magnitude than the pricing multiples on
the as-if capitalized operating lease liability and long-term debt. In addition, I find that the
pricing multiple on the as-if capitalized operating lease liability is not significantly different
from the pricing multiple on long-term debt.
This paper makes three contributions to the existing literature. First, it affirms that lease
accounting under SFAS 13 is value relevant, equipping standard setters with empirical
evidence of the current leasing standard as they reconsider lease accounting. Second, it
documents that operating and capital leases are priced differently, assisting standard setters in
crafting a new leasing standard. Specifically, requiring capitalization of all leases would
result in a loss of information to investors if recognized lease amounts and the associated
footnote disclosures were merely aggregated across all lease classifications. Third, this paper
utilizes descriptive evidence on the magnitude of as-if capitalized operating lease debt to
explain in part why firms appear underlevered. In particular, researchers have evaluated
firms’ capital structures to assess if firms are more highly leveraged to enjoy the favorable
tax benefits of debt as compared to equity (Graham 2000 among others). This paper raises
the question whether all debt, of which operating leases comprise a sizable portion, has been
accounted for in examining the relation between debt and marginal tax rates.
The paper proceeds as follows: Section 2 provides a review of prior lease accounting
research and develops the hypotheses; Section 3 describes the research design; Section 4

6
summarizes the sample selection and descriptive statistics; Section 5 presents the empirical
findings; and Section 6 concludes the study. An appendix provides a brief summary of the
lease classification criteria under SFAS 13 and illustrates the differences in accounting for
operating and capital leases.

CHAPTER 2
BACKGROUND AND HYPOTHESIS DEVELOPMENT
Leasing occurs when the user of an asset is not the most efficient owner of an asset.
Independent of the required accounting treatment, a lease commits firms to cash outlays in
the future in exchange for the right to use an asset. For many firms, these commitments are
substantial sums that span many years. The issuance of SFAS 13 resulted in the formation of
certain criteria (bright-line thresholds) that determine lease classification. These leasing
criteria establish whether the future cash outflows attributable to a lease and the use of a
related lease asset are recognized on the balance sheet as a capital lease asset and liability, or
whether the cash flows are disclosed in the notes to the financial statements as future rental
expense related to an operating lease.
Researchers have utilized the leasing arena to address a number of important research
questions; however, the value relevance of operating and capital leases under SFAS 13
remains an unresolved question in the literature.7 To address this question, my paper
explores whether operating lease disclosures and recognized capital lease amounts are both
relevant and sufficiently reliable to be priced. An understanding of the relevance and
reliability of operating and capital leases and an assessment of whether operating lease
disclosures and recognized capital lease amounts are priced differently under the current
leasing standard may prove useful to standard setters should SFAS 13 be re-evaluated. 7 Ge (2005) finds that greater off-balance-sheet operating lease activity leads to lower future earnings and documents that investors fail to fully anticipate this finding.
8
Prompted by the prominent accounting scandals of the past several years, standard setters
are focusing on corporate transparency. With respect to leasing, there is evidence that
managers use operating leases to achieve off-balance sheet financing, avoiding the lease
capitalization criteria of SFAS 13 (El-Gazzar et al. 1986, Imhoff et al. 1988).8 Indeed, a
large and specialized leasing industry has developed over time, supported by accountants and
attorneys adept at navigating the accounting and tax rules for leases. While SFAS 13 has
survived for more than twenty-nine years, it has come under increased scrutiny as a result of
the perceived growing manipulation of financial statements using leases.
Surprisingly, despite Sarbanes-Oxley and the emphasis on increased transparency and
improved accounting standards, over a trillion dollars of operating lease rental commitments
remain off corporate balance sheets. A Wall Street Journal article describes the current
leasing landscape as follows (How Leases Play A Shadowy Role In Accounting; September
22, 2004): “U.S. companies are still allowed to keep off their balance sheets billions of
dollars of lease obligations . . . The practice spans the entire spectrum of American business
and industry, relegating a key gauge of corporate health to obscure financial statement
footnotes, and leaving investors and analysts to do the math themselves. . . [T]he special
accounting treatment for many leases means that a big slice of corporate financing remains in
the shadows. For all the tough laws and regulations set up since Enron Corp’s 2001 collapse,
regulators have left lease accounting largely untouched.”
Determining whether investors and analysts peer into the “shadows” to value as-if-
capitalized operating lease liabilities is an empirical question. Numerous value relevance
8 Additionally, two lessor accounting empirical studies (Powers and Revsine 1989, Johnson et al. 1993) examine the incentive managers have to overestimate residual values so they can front-load income under either operating or capital lease accounting. In his review piece, Lipe (2001) notes that he knows of no other empirical research studies on lessor accounting.

9
studies have established a significant relation between accounting disclosures and the market
value of equity, (Landsman 1986, Barth 1991, Aboody 1996, Ayers, 1998 among others)
consistent with these accounting amounts being relevant to equity investors and sufficiently
reliable to be priced. Specific to leasing, researchers have found evidence that investors
appear to adjust risk for operating lease disclosures (Bowman 1980, Ely 1995, Imhoff et al.
1993, Marston et al. 1988) and to account for off-balance sheet operating leases in the pricing
of debt (Lim et al. 2005). To equity investors, the relevance of leases seems likely given the
pervasiveness and sheer magnitude of leases. However, the reliability of a current leasing
disclosure that aggregates lease commitments for one to five years into the future and a lump
sum amount beyond five years is uncertain.
Reliability plays a key role in equity investors’ valuation of accounting amounts. Barth et
al. (2003) develop a theoretical recognition and disclosure model and find that recognition of
a highly unreliable accounting amount can result in greater price informativeness.
Specifically, they find that reliability relative to relevance is more important than reliability
per se. Thus, as limited as the operating lease disclosures are under SFAS 13, the relevance
of leases given their sheer magnitude and pervasiveness may very well translate into
investors pricing a relatively unreliable disclosure.
Assuming that equity investors view capital lease liabilities and as-if capitalized operating
lease liabilities as economic liabilities of the firm, I make the following predictions (stated in
alternative form):
Hypothesis 1a: Ceteris paribus, there is a negative relation between capital lease liabilities and the market value of equity. Hypothesis 1b: Ceteris paribus, there is a negative relation between as-if capitalized operating lease liabilities and the market value of equity.
10
In addition to investigating whether operating and capital lease liabilities are value
relevant, I examine whether operating and capital lease liabilities are priced differently.
Some FASB Board members and FASAC members have called for increased transparency
and the capitalization of all leases (see FASAC surveys 2002 – 2005). International standard
setters have proposed the capitalization of all lease assets and liabilities included in lease
contracts (Lipe 2001). The popular business press echoes these same sentiments as well
(WSJ September 22, 2004; WSJ November 18, 2005). If operating and capital leases are
priced differently, standard setters should also consider maintaining lease classifications for
recognized amounts on the balance sheet and disclosed amounts in the notes to the financial
statements. Otherwise, aggregating capital and operating lease financial statement
information would result in a loss of information to investors (Lev 1968, Lev 1970 among
others).
Anecdotal evidence suggests that managers navigate the current rule-based leasing
standard to achieve the desired leasing treatment (Imhoff et al. 1988, Altamuro 2005). Thus,
managers are afforded the option of hugging-up against the bright-line tests of SFAS 13
without triggering the lease capitalization requirement. Alternatively, the bright-line tests of
the rule-based leasing standard could capture real economic differences in leasing activity.9
It is possible that the SFAS 13 lease criteria tend to capitalize some types of assets more
frequently than others, which could introduce real economic differences between capitalized
and operating lease liabilities merely from the underlying leased assets. For example, a lease 9 Graham et al. (1998) investigates the theoretical relation between marginal tax rates and lease classifications. The results show a negative, significant relation between true (operating) leases and marginal tax rates. With respect to financing (capital) leases, they find no relation with marginal tax rates and attribute the result to measurement error between tax and financial reporting lease classifications. Morsfield (2004) finds the hypothesized relation between both lease types and marginal tax rates in a private sample containing the actual tax lease classifications. Marginal tax rates may explain some of the pricing differences between operating and capital leases, but I suffer from the same measurement error issue as Graham et al. (1998) with financial accounting lease classifications.
11
term that equals or exceeds 75 percent of the economic life of land is impossible because
land has an indefinite life, whereas a lease term that exceeds 75 percent of the economic life
of computer equipment is likely given the rapid obsolescence of such equipment.
Additionally, real property assets are more likely to appreciate in value than shorter-lived
assets such as equipment. Thus, there is greater likelihood that the present value of the
minimum lease payments of leased equipment would exceed 90 percent of the fair value at
lease inception than would be true of a leased building. As such, economic characteristics of
the underlying lease assets influence the accounting lease classification.
The lease classification criteria under SFAS 13 are intended to capture the economic
effects of ownership, because “a lease that transfers substantially all of the benefits and risks
of ownership … is similar, in many respects, to that of an installment purchase.” Capital
leases by definition result from lessees holding a leased asset for 75 percent or more of the
remaining economic life of the asset or for a sufficiently long period of time that the lessor
recoups at least 90 percent of its fair value at lease inception during the lease term.10 Thus,
capital lease liabilities reflect relatively longer lease terms and could price differently than a
relatively shorter operating lease life because of the longer investment horizon.
In addition to the investment horizon, underlying leased assets that tend to appreciate in
value potentially result in economically different lease arrangements then those that
depreciate in value. Anecdotal evidence suggests that a large fraction of assets such as land
and buildings that are leased result in operating lease treatment. These assets tend to
appreciate on average. If a relatively larger fraction of operating leases consists of
10 The economic life capitalization criterion is waived if the leased asset is in the last quartile of its economic life.
12
appreciating assets as compared to capital leases, equity investors could price as-if
capitalized operating lease liabilities and capital lease liabilities differently.11
Under SFAS 13, only minimum lease payments are included in the capital lease liability
and disclosed operating lease rental commitments. These amounts include non-contingent
rental payments over the lease term, residual value guarantees, and any penalties paid for
failure to renew the lease. To the extent the minimum lease payments understate the true
economic lease liability because of contingent lease payments and lease renewal options, the
pricing of as-if capitalized operating lease liabilities and capitalized lease liabilities could
differ if contingent lease payments and lease renewal options reflect leasing transactions with
one lease type more than the other.12
Accordingly, I make the following prediction (stated in alternative form):
Hypothesis 2: Ceteris paribus, there is a significant difference between the pricing multiple on the as-if-capitalized operating lease liability and the market value of equity and the pricing multiple on the capital lease liability and the market value of equity.
11 Accordingly, residual value guarantees inserted into lease contracts to protect lessors from use and maintenance decisions of the lessees (Smith and Wakeman 1985) may be priced differently by equity investors depending on the probability of whether and how much the underlying lease asset appreciates or depreciates. 12 Generally, potential lessor and lessee bankruptcy should not result in pricing differences between operating and capital leases. Lessees are protected from lessor bankruptcies under both the old and new bankruptcy law (October 2005). Likewise, under the new and old lessee bankruptcy law, lessees have a specified period of time after filing bankruptcy to assume or reject lease contracts. The amount of time allotted depends on whether the underlying lease asset is commercial, personal, or residential property.
CHAPTER 3
RESEARCH DESIGN
Investigating the value relevance of disclosed operating lease rental commitment amounts
and whether operating and capital lease liabilities are priced differently requires an
estimation of the as-if capitalized operating lease liability. In addition, failure to include an
estimation of the operating lease asset in the model specification results in an omitted
correlated variable, resulting in the coefficient on the as-if capitalized operating lease liability
capturing the net economic effect of operating lease activity. Because capital lease assets are
included in the model, the coefficient on the capital lease liability reflects solely the
economic effect of the liability. Thus, I cannot compare the pricing of the as-if capitalized
operating lease liability and the capital lease liability without an estimation of the as-if
capitalized operating lease asset.
3.1 Estimating the As-if Capitalized Operating Lease Asset and Liability
To examine the value relevance of operating versus capital lease liabilities, I construct an
as-if capitalized lease liability for firms’ operating leases. Estimating the as-if capitalized
operating lease liability (OPLEASL) requires a discount rate. As a departure from other
studies (Imhoff et al. 1993, Graham et al. 1998) that assume a cross-sectional constant
discount rate over the sample period, I construct a firm-specific discount rate to reduce
measurement error. SFAS 13 requires firms to discount capital leases using the lesser of the
14
lessee’s incremental borrowing rate or, if known, the lessor’s implicit return on the lease
contract.13 In practice, the lessor’s implicit rate of return on the lease is rarely known by the
lessee. Thus, I estimate the lessees’ incremental borrowing rate or firm-specific discount rate
by dividing total interest expense by average total debt each year from 1994 through 2004
and computing the equal-weighted mean for each firm. For lump sum rental commitments, I
compute the firm-specific equal-weighted mean rate that the rental commitments increase or
decrease in years one through five (data items 96, 164-167) and apply that rate to the lump
sum rental commitments beyond the fifth year. OPLEASL equals the sum of the discounted
rental commitment amounts due in one, two, three, four, and five years as well as the
discounted rental commitment amounts estimated in six years and beyond.
As noted previously, estimating the as-if capitalized operating lease liability poses a
problem because of potential measurement error. To calibrate my operating lease
capitalization methodology, I hand-collected a small sample of rental commitments for
capital lease liabilities that exceeded $25M in 2001 and 2002. With the capital lease rental
commitment amounts hand-collected from the Form 10-K, I can compare the capital lease
amounts capitalized using my methodology with the actual reported capital lease liabilities.
Assuming the payment streams of capital lease rental commitments mirror that of operating
lease rental commitments, I can evaluate the amount of measurement error in my estimation
methodology.
To illustrate the methodology I use to estimate the as-if capitalized operating lease
liability, consider the discount electronics retailer Best Buy and the following rental
13 Although the lessee rarely knows the lessor’s rate of return on a lease contract, anecdotal evidence suggests that economic factors such as market interest rates, perceived lessee credit risk, lessor competition, asset collateral quality, and asset re-marketing prospects are some of the inputs into the lease terms and pricing function of lessors.
15
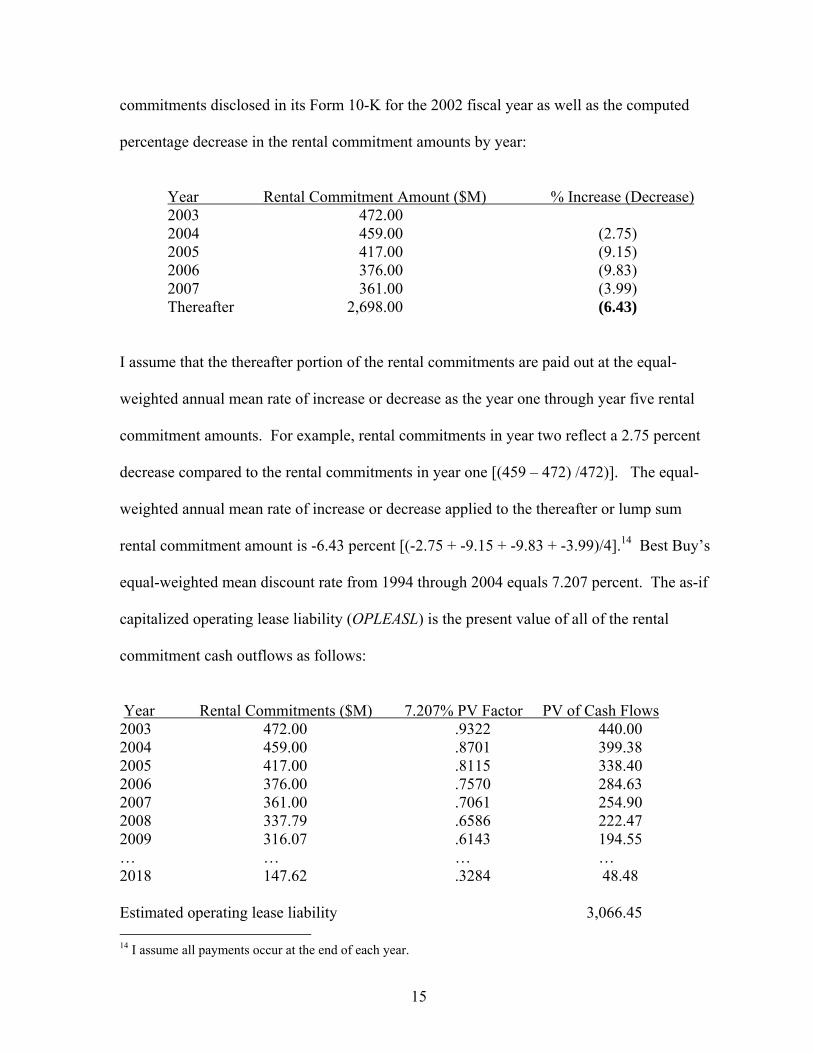
commitments disclosed in its Form 10-K for the 2002 fiscal year as well as the computed
percentage decrease in the rental commitment amounts by year:
Year Rental Commitment Amount ($M) % Increase (Decrease) 2003 472.00 2004 459.00 (2.75) 2005 417.00 (9.15) 2006 376.00 (9.83)
2007 361.00 (3.99) Thereafter 2,698.00 (6.43)
I assume that the thereafter portion of the rental commitments are paid out at the equal-
weighted annual mean rate of increase or decrease as the year one through year five rental
commitment amounts. For example, rental commitments in year two reflect a 2.75 percent
decrease compared to the rental commitments in year one [(459 – 472) /472)]. The equal-
weighted annual mean rate of increase or decrease applied to the thereafter or lump sum
rental commitment amount is -6.43 percent [(-2.75 + -9.15 + -9.83 + -3.99)/4].14 Best Buy’s
equal-weighted mean discount rate from 1994 through 2004 equals 7.207 percent. The as-if
capitalized operating lease liability (OPLEASL) is the present value of all of the rental
commitment cash outflows as follows:
Year Rental Commitments ($M) 7.207% PV Factor PV of Cash Flows 2003 472.00 .9322 440.00 2004 459.00 .8701 399.38 2005 417.00 .8115 338.40 2006 376.00 .7570 284.63 2007 361.00 .7061 254.90 2008 337.79 .6586 222.47 2009 316.07 .6143 194.55 … … … … 2018 147.62 .3284 48.48 Estimated operating lease liability 3,066.45 14 I assume all payments occur at the end of each year.

16
Developing a methodology to estimate the accompanying as-if capitalized operating lease
asset is more challenging than estimating the as-if capitalized operating lease liability.
Calculating an approximation of the as-if capitalized operating lease asset requires drawing
inferences about the weighted average total life of leased assets, the weighted average
remaining life of leased assets, and the appropriate weighted average depreciation method
from the scheduled cash outflows. However, failure to estimate the operating lease asset
translates into an omitted correlated variable in the regression model specification and makes
comparing the pricing of capital lease liabilities and the as-if-capitalized operating lease
liability a futile exercise.
To compute the as-if-capitalized operating lease asset, I first estimate the linear
combination of net capital lease asset book value as a function of capital lease rental
commitments in years 1 through 5 and the lump sum amount beyond year 5. These values
are from the same hand-collected sample used to calibrate the as-if capitalized operating
lease liability calculation. This step is detailed below in equation one as follows:
CAPLEASAit = β0 + β1CLRC1it + β2CLRC2it + β3CLRC3it + β4CLRC4it
+ β5CLRC5it + β6CLRCLSit + eit (1)
where CLRCn equals capital lease rental commitments in years 1 through 5 for firm i at time
t, CLRCLS equals the capital lease rental commitment lump sum amount beyond year 5 for
firm i at time t, and CAPLEASA equals the net book value of capital lease assets for firm i at
time t. I utilize this vector of estimated rental commitment coefficients to compute an as-if
capitalized operating lease asset as illustrated in equation two below:
OPLEASAit = 0B̂ + 1B̂ OLRC1it + 2B̂ OLRC2it + 3B̂ OLRC3it + 4B̂ OLRC4it + 5B̂ OLRC5it + 6B̂ OLRCLSit (2)

17
where OLRCn equals operating lease rental commitments in years 1 through 5 for firm i at
time t, OLRCLS equals the operating lease rental commitment lump sum amount beyond year
5 for firm i at time t, and OPLEASA equals the estimated net book value of operating lease
assets for firm i at time t.
This estimation methodology implicitly assumes that operating and capital lease assets
have the same depreciation methods and that the discount rate used under SFAS 13 for
financial reporting purposes is equivalent. Additionally, I presuppose that parameter
estimates from the hand-collected sample can be extended to all of the firms in the cross-
section over the sample period. To the extent these assumptions do not hold, the as-if
capitalized operating lease asset is measured with error. I focus my study on an examination
of operating and capital lease liabilities and include the estimated operating lease asset
amount in the adjusted book value of equity variable.
3.2 Empirical Specification
Because balance sheet treatment is central to lease accounting, the main tests in this paper
employ a model specification that expresses value as a function of earnings and book value
(balance sheet) information similar to the framework developed by Ohlson (1995).15 This
approach has been used widely in the literature; examples include Aboody (1996), Collins et
al (1997), Barth et al (1998), Aboody et al (1999), and Kallapur et al. (2004) among others.
Furthermore, I benefit from research by Barth et al. (1999, 2005) who disaggregate
accounting data to explore whether disaggregated accounting data have incremental
explanatory power to equity book value and net income. I also have the advantage of
drawing upon several prior studies that examine the value relevance of other obligation- 15 Similar to Barth et al. (1998) and Kallapur et al. (2004), I do not rely on the Ohlson model (1995) as a basis for my predictions because of its limiting assumptions such as linear information dynamics.

18
related disclosures such as deferred tax liabilities (Amir et al. 1997, Ayers 1998, Givoly et al.
1992) and pension obligations (Barth 1991, Barth et al. 1992). In particular, I utilize the
following regression framework:
MVEit = β0CONSTANTit + β1BVEit + β2NIit + β3NEGit + β4NEGNIit + β5CAPLEASLit + β6DEBTit + β7OPLEASLit + β8GROWTHit
+ β9ΣYEARit + β10ΣINDUSTRYit + eit (3) where i and t denote firms and years, respectively. MVE equals market value of common
equity, CONSTANT equals one divided by common shares outstanding, BVE is the book
value of equity adjusted to exclude capital lease liabilities and long-term debt and to include
the estimate for the as-if capitalized operating lease asset (OPLEASA) and the deferred tax
asset created by capitalizing operating leases computed with Graham’s (1996) computed
marginal tax rates (MTR), NI equals earnings after discontinued and extraordinary items,
NEG is an indicator variable equal to one for firm-year observations with a net loss, NEGNI
is an interaction variable (NEG*NEGNI), CAPLEASL is the capital lease liability, DEBT
equals long-term debt less capital lease liabilities (CAPLEASL), OPLEASL equals the
estimated as-if capitalized operating lease liability, GROWTH is the year ahead sales
revenue, ΣYEAR is a categorical variable equal to one if the firm-year observation is a given
year and zero otherwise, and ΣINDUSTRY is a categorical variable equal to one if the firm-
year observation is in a given one-digit SIC code and zero otherwise.16
To allow for lease-specific information from the annual report to be impounded in price,
the dependent variable MVE equals the market value of common equity three months after
the fiscal year-end. NEGNI is intended to capture the differential pricing effects of firms
16 Controlling for growth options is supported by the Ohlson (1995) model as the inclusion of other information relevant to investors. In addition to incorporating growth options, the one year ahead sales amount potentially controls for scale issues in this model specification (Barth et al. 1996).
19
with net losses as documented in Hayn (1995). Defining NI as net income after extraordinary
items and discontinued operations satisfies the clean surplus assumption of the Ohlson
model. It should be noted that I am unable to compute the net income effects of the as-if
capitalized operating lease liability and net them against the operating lease expense in a
firm-year. As such, in the valuation equation, the implicit assumption is that the net income
effects are zero. Assuming a ten to 20 year lease term and discount rate of eight to twelve
percent, the net income effects of capitalizing an operating lease are zero between 55 and 59
percent of the original useful life of the asset (Imhoff et al. 1991 and 1997).17 Thus, the no
income effect assumption inherent in my regression specification seems reasonable if firms
in the cross-section have roughly constant levels of leasing activity.
In order to establish a baseline to compare the pricing of the as-if capitalized operating
lease liability and the capital lease liability, I break out long-term debt (DEBT) from book
value of equity in the model specification (equation 3). Moreover, if long-term debt is priced
differently than the capital lease liabilities, I can triangulate my results with additional
empirical evidence that aggregating operating and capital lease data may result in an
information loss to investors. To control for heteroskedasticity, I report t-statistics that
reflect White-adjusted (1980) standard errors. Also, I include industry and year fixed effects
to control for industry-specific effects and time-specific macro-economic effects,
respectively. In order to control for potential scale issues, I deflate all of the regression
variables by common shares outstanding.
17 These amounts assume no down payment on the lease and straight-line depreciation.
CHAPTER 4
SAMPLE SELECTION AND DESCRIPTIVE STATISTICS
In order to apply my as-if capitalized operating lease asset estimation methodology, I
hand-collect a sample of capital lease intensive firms with disclosed capital lease rental
commitment amounts and capital lease asset net book values. The hand-collected sample
also allows me to calibrate my estimation of the as-if capitalized operating lease liability.
For the hypothesis tests, I utilize Compustat to compile a representative sample of the
economy to test the relations between lease liabilities and the market value of equity. The
sample selection and descriptive statistics for both samples are detailed below.
4.1 Hand-collected Sample Selection and Summary Statistics
The sample consists of firm-year observations from 2001 to 2002 pertaining to Compustat
firms with at least $25 million of capital lease liabilities (data item 84). Using the 2001 and
2002 Form 10-Ks, I hand-collected the net book value of capital lease asset information as
well as the capital lease rental commitment amounts for years 1 through 5 and the lump sum
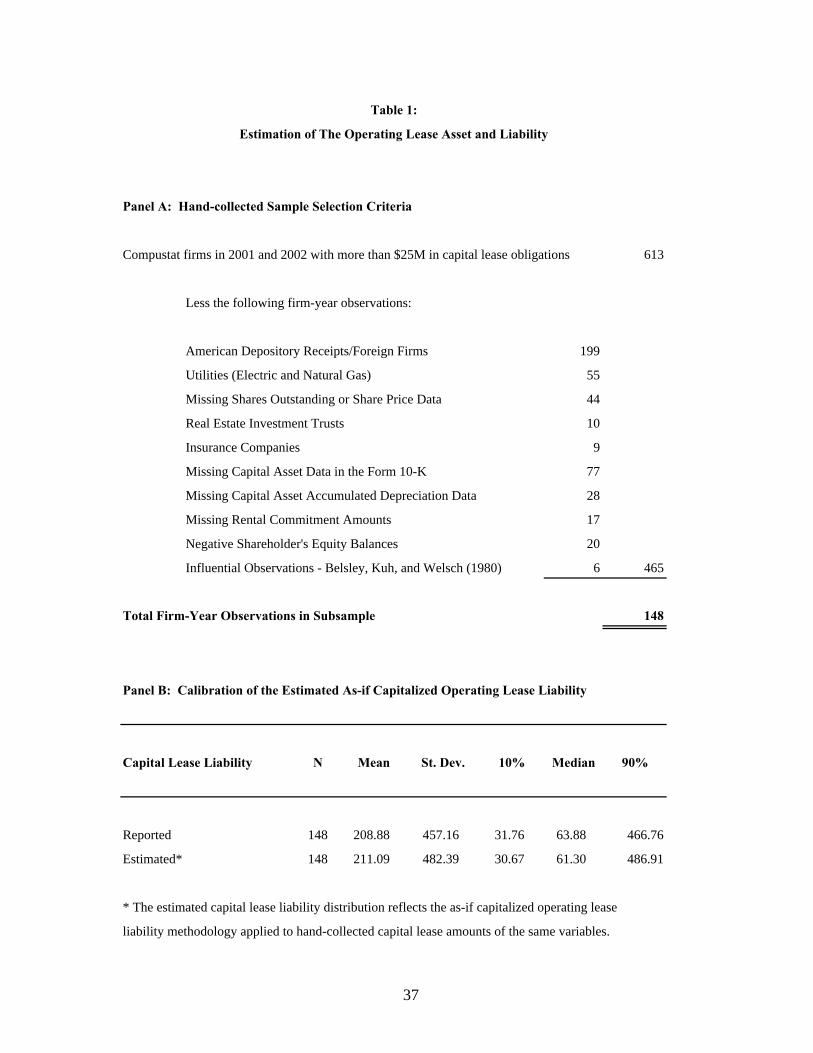
rental commitments beyond year 5. Panel A in Table 1 summarizes the sample selection
criteria. There are 613 firm-year observations with the minimum threshold of $25 million or
more in capital lease liabilities and positive total assets and sales. Deleting firm-year
observations attributable to foreign firms and American Depository Receipts (199), regulated
firms such as utilities and insurance companies (64), real estate investment trusts (10),
21
missing shares outstanding and price per share variables (44), missing firm-year observations
attributable to capital asset data in the Form 10-K (77), missing capital asset accumulated
depreciation data in the Form 10-K (28), missing rental commitment observations (17),
negative shareholder’s equity balances (20) and influential observations identified as
studentized residuals greater than three from the Belsley et al. (1980) criteria (6) results in a
final sample of 148 firm-year observations.
Panel B in Table 1 summarizes descriptive statistics for the estimated capital lease liability
computed using the as-if capitalized operating lease liability methodology employed in the
paper as well as the actual reported capital lease liability amount (data item 84) for the 148
hand-collected sample firm-year observations. The actual and estimated amounts from both
distributions are strikingly similar suggesting that the combination of the estimated discount
rate and the underlying assumption about the rate the lump sum capital lease rental
commitment amounts are realized estimate the capital lease liability accurately. Thus, it
appears that my method for estimating the as-if capitalized operating lease liability is sound
and yields reliable results.
The as-if capitalized operating lease asset methodology implies that in the cross-section
operating and capital leases have the same accounting discount rate when applying SFAS 13.
In order to test the reasonableness of this assumption, Panel C displays the operating lease
and capital lease rental commitment amounts by disclosed category for the hand-collected
sample. The percentages of rental commitments in each category across both lease
classifications are quite similar, but the percentage of capital lease rental commitments are
slightly more front-loaded than the operating lease rental commitments. Panel C is indirect
22
evidence that operating leases have longer lease terms, suggesting that operating leases are
attributable on average to longer-lived assets.18
Panel D presents the regression results for equation one. The high R-squared of 98.46
percent suggests that the rental lease commitment amounts capture almost all the variation in
the capital lease asset net book value. Thus, if operating and capital leases have similar
discount rates and are subject to similar depreciation methods, OPLEASA should be a
reasonable estimate of the as-if capitalized operating lease asset.
4.2 Sample Selection and Descriptive Statistics for Hypothesis Testing
I use Compustat data to examine the value relevance of as-if capitalized operating lease
liabilities and capital lease liabilities as well as the pricing differences between these
variables. Included in the main sample are firm-year observations from 2000 through 2003
for Compustat firms with positive net sales revenue (data item 12) and $10 million or more in
total assets (data item 6). In order to compute the as-if capitalized lease amounts, disclosed
amounts in the footnotes to the financial statements under SFAS 13 are needed. Specifically,
data for rental commitments one to five years in the future (data items 96, 164-167), the
disclosed lump sum amount for rental commitments more than five years into the future (data
item 389), and an estimated discount rate computed as the equally-weighted mean percentage
of interest expense to total debt for the years 1994 through 2004 serve as the relevant inputs
into the computations. The equal-weighted mean discount rate over the 11-year period from
1994 through 2004 is used because current year leasing amounts are influenced by prior year
lease investment decisions. The sample begins in 2000 because the thereafter portion of
operating lease rental commitments (data item 389) is not reliably collected and included in 18 The data are also consistent with operating leases being subject to larger and/or an increased percentage of residual value guarantees.

23
Compustat prior to that year. The GROWTH variable is defined as one-year-ahead sales
which eliminates 2004 from the sample. Additionally, the effects of FIN 46 could potentially
confound the results in 2004.
Table 2 summarizes the sample selection criteria. I remove foreign firms from the sample
to assure that I am testing the valuation relevance of SFAS 13 and not an international
leasing standard. Real estate investment trust (REIT) firm-year observations are deleted
from the sample because of unique institutional features including no corporate level taxation
and substantial distribution requirements. Utilities are removed because of regulatory
incentives, as well as the fact that operating leases are not included in the rate base. I also
remove firm-year observations for insurance companies because of regulatory incentives.
Financial institutions are deleted for regulatory incentives, as well as the fact that Compustat
does not compile capital lease liability data for banks. I exclude firm-year observations with
negative shareholder’s equity because my valuation model specification may not apply to
these firms and to be consistent with prior research (Collins et al. 1997).
After deleting firm-year observations attributable to foreign firms and American
Depository Receipts (3,832), real estate investment trusts (828), regulated firms such as
utilities (663), insurance companies (509), and financial institutions (336), missing shares
outstanding data (1,217) missing share price data (1,023), missing operating lease rental
commitment amount data (4,227), missing capital lease liability data (528), missing long-
term debt data (6), negative shareholder’s equity balances (648), missing one-year-ahead
sales revenue data (357), missing marginal tax rate data (351), and influential observations
24
identified from the Belsley et al. (1980) criteria (68), the final sample is comprised of 9,985
firm-year observations.19
Panel B of Table 2 presents the industry and year representation in the sample. The four-
year sample period is represented almost equally by the four years in the sample period.
Dividing the sample into one-digit SIC Codes, Panel B of Table 2 and Table 3 characterize
the industry representation in the sample and compare it to the industry representation for the
Compustat economy from 2000 through 2003 for the 24,578 firm-year observations that have
positive net sales revenue and $10 million or more in total assets. The sample representation
is lower for SIC 6 due to deleted REIT, insurance and financial institution firm-year
observations. Likewise, the sample contains fewer SIC 4 observations because of deleted
electric and natural gas utility firm-year observations. Table 3 also illustrates that substantial
leasing activity is prevalent in the transportation industry (SIC 4 with a capital and operating
lease mean liability of $60.97M and $479.63M respectively) and the wholesale and retail
industries (SIC 5 with a capital and operating lease mean liability of $25.30M and $315.53M
respectively).
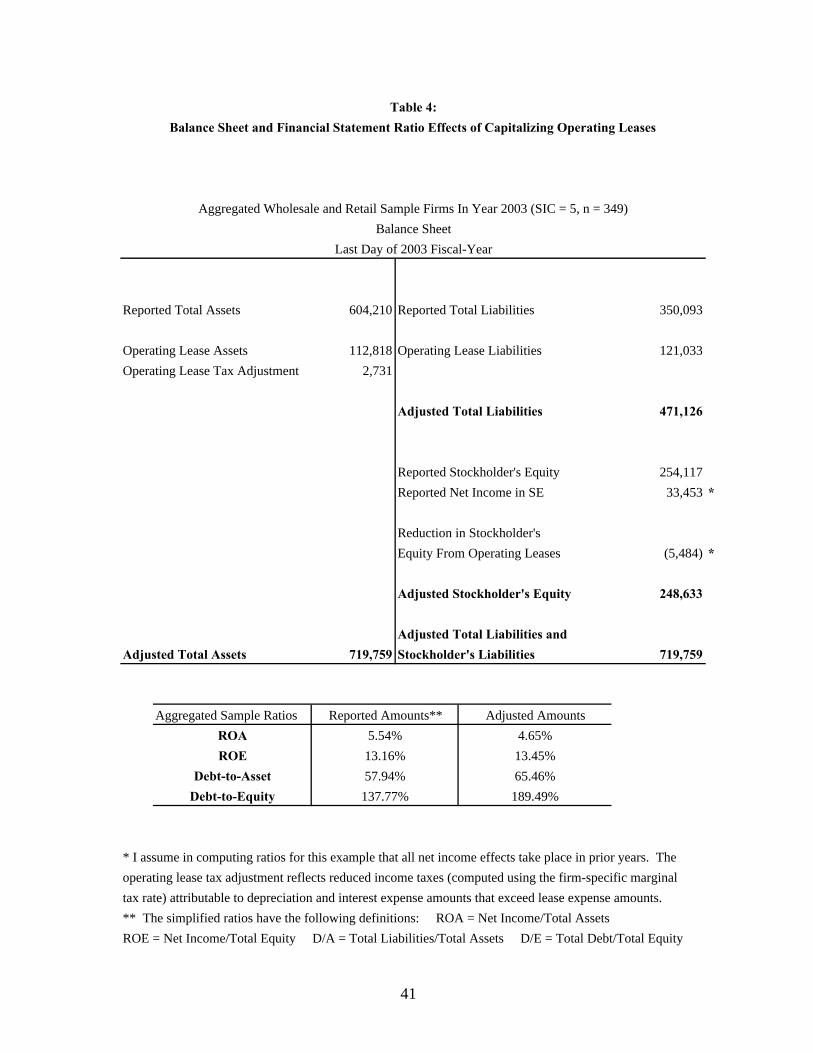
Table 4 illustrates the balance sheet and financial statement ratio effects of capitalizing
operating lease assets and liabilities. Anecdotal evidence suggests that financial accounting
incentives, including enhanced performance and leverage ratios, result in managers
navigating the bright-line tests of SFAS 13 to avoid the capitalization criteria. Accordingly,
Table 4 presents an aggregated sample balance sheet for all 349 firms in the wholesale and
retail industry (SIC 5) at the end of the 2003 fiscal year. The reported total assets, total
liabilities, and total equity amounts are provided. Utilizing the as-if capitalized operating
19 Specifically, I delete firm-year observations with studentized residuals in excess of the absolute value of three.
25
lease asset and liability methodologies detailed in the paper, over $121 million of liabilities
and over $112 million of assets escape balance sheet treatment. Thus, operating leases
explain in part why firms appear to be underlevered (Graham 2000). Assuming the same
lease classification for tax purposes as financial reporting purposes, firms trade off deferred
tax deductions for avoiding debt classification on the balance sheet for financial reporting
purposes.20
The tax adjustment noted in Table 4 illustrates this trade-off. Specifically, a tax
adjustment is made (over $2.7 million) to account for a deferred tax asset resulting from
interest and depreciation tax deductions that exceed lease expense deductions utilizing firm-
specific marginal tax rates (MTR). Factoring in the tax adjustment and assuming that all net
income effects take place in prior years, stockholder’s equity is reduced by over $5 million.
Utilizing simplified measures of return on assets, return on equity, debt, and debt-to-equity
ratios, the reported amounts result in a higher aggregated return on assets measure, a lower
aggregated debt-to-asset ratio, and a lower aggregated debt-to-equity ratio. Ignoring net
income effects, the return on equity measure is higher because of the reduction in equity from
capitalizing operating leases. Thus, Table 4 supplies empirical evidence that in the
aggregate, wholesale and retail sample firms in 2003 enjoyed enhanced performance and
leverage ratios from operating lease activity.
Table 5 presents descriptive statistics for the main regression variables in equation three,
as well as for variables used to compute the regression variables. Despite deflating by
common shares outstanding, the regression variables have skewed distributions as evidenced
by different means and medians. Additionally, the magnitude and dispersion of operating
20 This is a crude assumption given the use of the synthetic leasing structure to achieve capital lease treatment for tax purposes (increased tax deductions from depreciation and interest in the early life of the lease) and operating lease treatment for financial reporting purposes (less debt and assets on the balance sheet).

26
leases compared to capital leases differ markedly. The mean (median) of the as-if capitalized
operating lease liability (OPLEASL) is $1.85M ($0.51M) compared to $0.12M ($0.00M) for
the capital lease liability. The variables used to compute the as-if capitalized operating lease
liability are also presented in Table 5. The estimated discount rate appears reasonable with a
mean (median) estimate of 0.089 (0.073) percent. Also, Table 5 includes descriptive
statistics for the as-if capitalized operating lease asset (OPLEASA). The mean ($1.51M) and
median ($0.02M) values for OPLEASA are less than the corresponding mean ($1.85M) and
median ($0.51M) values for OPLEASL, which is expected given that lease liability amounts
exceed lease asset amounts except at lease inception and lease termination when these
amounts are generally equal. Thus, these lease descriptive statistics affirm that the as-if
capitalized operating lease asset and liability estimation methodologies employed in the
paper appear reasonable. I include the Stockholder’s Equity and MTR descriptive statistics as
a barometer for the size and magnitude of the BVE variable and all variables that are
subtracted from and added to Stockholder’s Equity (data item 216).
Correlations among the regression variables for the regression model specification detailed
in equation one are presented in Table 6. The Pearson and Spearman correlation coefficients
detailed in Table 6 are all significantly different from zero at a significance level of five
percent with the exception of three correlation coefficients that are bolded. Generally, it
appears that firm investments in leasing capital and debt capital result in an increased market
value of equity. The correlation between the dependent variable, MVE, and capital lease
liability, CAPLEASL, has a different sign in the Pearson and Spearman correlation coefficient
specification highlighting the need for multivariate regression analysis.

CHAPTER 5
REGRESSION RESULTS
In order to examine the value relevance of operating and capital leases, I utilize the
multivariate regression model specification developed in equation three. Results are reported
in Table 7. All t-statistics are computed using White-adjusted (1980) standard errors from
the consistent, recomputed variance covariance matrix.
As a comparison to the equation three regression results presented in the final column, I
include additional model specifications to provide for varying levels of aggregation of the
three debt variables. Specifically, ALLDEBT is defined as the summation of all long-term
debt (DEBT), capital lease liabilities (CAPLEASL), and the as-if capitalized operating lease
liability (OPLEASL). LEASEDEBT equals capital lease liabilities (CAPLEASL) plus the as-if
capitalized operating lease liability (OPLEASL). NONCAPLEASL equals long-term debt
(DEBT) summed with the as-if capitalized operating lease liability (OPLEASL). Lastly,
NONOPLEASL equals long-term debt increased by capital lease liabilities (CAPLEASL). In
addition to providing robustness checks of the model specification in equation three, the
differing levels of data aggregation allow me to more directly evaluate and triangulate my
tests for the second hypothesis comparing the pricing multiples on the capital lease liabilities
(CAPLEASL) and the as-if capitalized operating lease liability (OPLEASL).
In all of the model specifications, the 9,985 firm-year observations identified in Table 2
are used. In each model, BVE is adjusted to reflect the appropriate disaggregated debt
28
variables. The coefficient estimates on BVE range from 0.85 to 0.87 (t-statistics equal or
exceed 17.02). Like BVE, the parameter estimates for NI exhibit little variation with values
ranging from 0.50 to 0.53 (t-statistics equal or exceed 2.47). The low magnitudes of the NI
variable and accompanying low values of the t-statistics likely reflect the losses incurred by
many firms during and surrounding the recession in the sample period. It should be noted
that the model specification assumes no net income effects on average from operating lease
capitalization. Also, in every model specification, the interaction variable NEGNI
approximates the magnitude of NI (-0.61 to -0.63) providing evidence that net loss firms are
valued differently than profitable firms (Hayn 1995). Lastly, the parameter estimate for
GROWTH ranges from 0.02 to 0.03. The t-statistics are all positive and significant at the five
percent level.
Combining all debt, the coefficient on ALLDEBT equals -0.90 with an associated t-statistic
of -19.48. Thus, on average, for every dollar per share of financial statement debt the market
value of equity decreases by $0.90 per share. Separating out each firm’s debt into lease
(LEASEDEBT) and non-lease amounts (DEBT), the coefficient on lease debt equals -1.04 (t-
statistic = -14.35) as compared to the coefficient on non-lease debt of -0.86 (t-statistic = -
17.42). These parameter estimates are significantly different from each other at the five
percent significance level. Disaggregating capital lease debt (CAPLEASL) from long-term
debt and the as-if capitalized operating lease liability (NONCAPLEASL) results in parameter
estimates that are significantly different from each other at the five percent significance level.
Referring to Table 7, the parameter estimate on CAPLEASL equals -2.03 (t-statistic = -6.25)
contrasted with the parameter estimate of -0.88 (t-statistic = -19.21) for NONCAPLEASL.
29
With the as-if capitalized operating lease asset and liability included in BVE, I can assess
whether equity investors price capital lease liabilities and long-term debt the same.
Combined, the parameter estimate for NONOPLEASL equals -0.88 (t-statistic =
-15.92). When capital lease liabilities are disaggregated from long-term debt, the result is a
parameter estimate of -2.08 (t-statistic = -6.17) for CAPLEASL and a coefficient of
-0.87 (t-statistic = -16.20) for long-term debt (DEBT) suggesting that equity investors utilize
footnote disclosures to price capital lease liabilities and long-term debt differently.21 These
variables are significantly different from each other at the significance level of five percent.
Solely separating out the as-if capitalized operating lease liability (OPLEASL) results in a
parameter estimate of -1.02 (t-statistic = -12.79).
Turning to the focal point of the study, consider the model specification from equation
three presented in the final column. In this specification, all three debt variables are
disaggregated. The parameter estimate for capital lease liabilities (CAPLEASL) equals -1.86
(t-statistic -5.31). DEBT has a coefficient of -0.86 (t-statistic = -17.26). Additionally, the
parameter estimate for the as-if capitalized operating lease liability (OPLEASL) is -0.95 (t-
statistic = -13.31). Using a Chi-Square distribution with White-corrected standard errors, the
probability that OPLEASL and CAPLEASL are equal is 1.70 percent. Also, the probability
that DEBT and CAPLEASL are equal is 0.32 percent. Lastly, the probability that DEBT and
OPLEASL are equal is 26.59 percent signifying that equity investors view long-term debt and
as-if capitalized operating lease liabilities as economically similar on average.
Given the empirical findings, I find evidence consistent with equity market participants
viewing capital lease liabilities and the as-if capitalized operating lease liability as economic
21 It should be noted that some capital lease intensive firms report capital lease assets and/or capital lease liabilities on the balance sheet disaggregated from property, plant, and equipment and long-term debt, respectively.
30
liabilities of the firm similar to long-term debt. As limited as the current operating lease
disclosures may be, it appears that investors, in addition to pricing the recognized capital
lease liabilities, deem the operating lease disclosures adequately relevant and reliable to be
impounded in price. The results also provide empirical evidence that capital lease liabilities
and the as-if capitalized operating lease liabilities are priced differently. Thus, as standard
setters contemplate whether and how best to revisit SFAS 13, they should consider the
potential harm of aggregating data. Continuing to require lease disclosures by different lease
classifications would assure that equity investors do not suffer from a loss of value relevant
information in order to price leases.
5.1 Robustness Tests
The results presented in Table 7 provide evidence consistent with operating and capital
leases being priced differently by equity investors. As a robustness test, I examine whether
firms with capital leases are fundamentally different than firms without capital leases. Table
8 presents descriptive statistics for regression variables by dividing the sample based on
whether CAPLEASL is positive or equal to zero. Of the 9,985 firm-year observations in the
main sample, 3,384 firm-year observations represent firms with capital leases and 6,601
observations represent firms that not. Comparing the means in each subsample, the
differences in means of the regression variables are statistically insignificant. In order to
evaluate whether firms with capital leases price operating leases differently than firms
without capital leases, I create a categorical variable CAPOP that is equal to one if
CAPLEASL is positive and zero otherwise. Additionally, CAPOPEASL is an interaction
variable equal to CAPOP*OPLEASL. The regression results are presented in column one of
Table 9. The coefficient on the variable CAPOPLEASL equals -0.22 with a statistically

31
insignificant t-statistic of -1.67. However, the probability that operating and capital leases
are priced the same for firms with both operating and capital leases increases to 10.48
percent.
As a second robustness test, I examine the pricing of operating and capital leases for the
transportation industry (SIC = 4), the most lease-intensive industry. Results for the most part
mirror the main sample. The probability that operating and capital leases are priced the same
equals 1.98 percent. The third robustness test is motivated by FIN 46. Already-existing
synthetic lease transactions were subject to the revised consolidation rules under FIN 46
beginning at the end of 2003. In the third column, I evaluate my model specification for the
first three years of the sample period from 2000 through 2002. Again, the results for this
third robustness test in column three are similar to the column one results. The probability
that operating and capital leases are priced the same equals 0.43 percent. The coefficient on
CAPOPLEASL equals -0.18 with a statistically insignificant t-statistic of -1.15. The
associated probability that operating and capital leases are priced the same by firms with both
leases equals 2.33 percent. Comparing the results from sample period with and without
2003, firm-year observations from 2003 increased the probability from 2.33 percent to 10.48
percent that operating and capital leases are priced the same by firms with both operating and
capital leases. Thus, it appears that future research could evaluate how FIN 46 affected the
pricing of operating and capital leases.

CHAPTER 6
CONCLUSION
The vast majority of leasing activity by publicly traded U.S. firms escapes capitalization
under Generally Accepted Accounting Principles. In the wake of the alleged corporate
accounting abuses the past several years, off-balance sheet financing, including operating
lease accounting under SFAS 13, has come under increased scrutiny. Congress passed the
Sarbanes-Oxley Act in the summer of 2002, which mandated the SEC to evaluate and report
on the extent of off-balance sheet financing. In its report dated June 15, 2005, the SEC
recommended that the FASB reconsider SFAS 13, concluding that they believe “that the
potential benefits in terms of increased transparency of financial reporting would be
substantial enough to justify the time and effort required.”
As standard setters assess whether to re-evaluate SFAS 13 and the lease capitalization
criteria, they do so without the benefit of empirical research examining whether capital
market participants find the current leasing disclosure value relevant. The purpose of this
paper is to help fill that void by documenting the value relevance of capital lease liabilities
and current operating lease disclosures.
The results show a negative, significant relation between capital lease liabilities and the
market value of equity. In addition, I construct an as-if capitalized operating lease liability
and examine the relation between operating lease activity and market value. The results
show a negative, significant relation between operating lease activity and the market value of
33
equity consistent with equity investors viewing as-if capitalized operating lease liabilities and
capital lease liabilities as true economic liabilities of the firm. Moreover, the results provide
evidence that current lease disclosures, as limited as they may be, supply sufficiently relevant
and reliable information to be impounded into price by investors. The results also show that
equity investors price operating and capital lease liabilities differently. Thus, should the
FASB require the capitalization of all leases, separate (and hopefully enhanced) leasing
disclosures by lease classification would assure that equity investors do not suffer from a loss
of valuation relevant information in the pricing of leases.

34
Appendix:
Review of Lease Capitalization Criteria
A capital lease is defined as any noncancelable lease meeting one or more of the following
four bright-line tests (SFAS 13 paragraphs 6-7):
1. Transfer of Ownership. The lease transfers ownership to the lessee by the end of
the lease term.
2. Bargain Purchase Option. The lease contains a bargain purchase option.
Specifically, a bargain purchase option is defined as the lessee having the option to purchase
leased property for a price sufficiently lower than the expected fair value of the property on
the date the option vests such that exercise of the option is reasonably assured.
3. 75 Percent of Economic Life. The lease term equals or exceeds 75 percent of the
estimated economic life of the leased property.
4. 90 Percent of Asset’s Value. The present value at the beginning of the lease term
of the minimum lease payments to be paid to the lessor equals or exceeds 90 percent of the
leased asset’s value to the lessor at the inception of the lease.
Capital leases are capitalized using the lower of the lessee’s incremental borrowing rate or
the lessor’s rate of return on the lease if known. In addition, leased assets that are classified
as capital leases because they meet the transfer of ownership or bargain purchase option
criteria are depreciated over the useful life of the asset whereas leased assets that are
classified as capital leases because they meet the 75 percent of economic life or 90 percent of
asset value criteria are depreciated over the life of the lease term.
Leases that are not capitalized under SFAS 13 are classified as operating leases, resulting
in an annual rental expense in the year incurred and disclosure of the rental commitments in
35
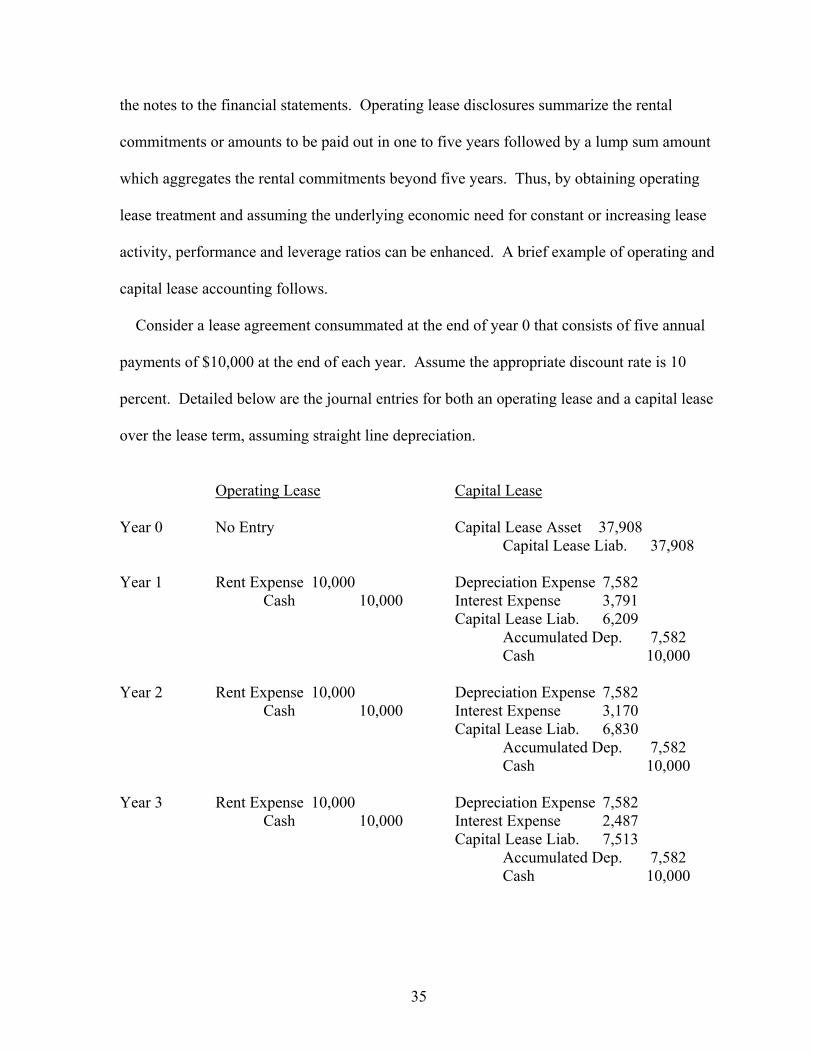
the notes to the financial statements. Operating lease disclosures summarize the rental
commitments or amounts to be paid out in one to five years followed by a lump sum amount
which aggregates the rental commitments beyond five years. Thus, by obtaining operating
lease treatment and assuming the underlying economic need for constant or increasing lease
activity, performance and leverage ratios can be enhanced. A brief example of operating and
capital lease accounting follows.
Consider a lease agreement consummated at the end of year 0 that consists of five annual
payments of $10,000 at the end of each year. Assume the appropriate discount rate is 10
percent. Detailed below are the journal entries for both an operating lease and a capital lease
over the lease term, assuming straight line depreciation.
Operating Lease Capital Lease
Year 0 No Entry Capital Lease Asset 37,908 Capital Lease Liab. 37,908 Year 1 Rent Expense 10,000 Depreciation Expense 7,582 Cash 10,000 Interest Expense 3,791 Capital Lease Liab. 6,209 Accumulated Dep. 7,582 Cash 10,000 Year 2 Rent Expense 10,000 Depreciation Expense 7,582 Cash 10,000 Interest Expense 3,170 Capital Lease Liab. 6,830 Accumulated Dep. 7,582 Cash 10,000 Year 3 Rent Expense 10,000 Depreciation Expense 7,582 Cash 10,000 Interest Expense 2,487 Capital Lease Liab. 7,513 Accumulated Dep. 7,582 Cash 10,000

36
Year 4 Rent Expense 10,000 Depreciation Expense 7,581 Cash 10,000 Interest Expense 1,736 Capital Lease Liab. 8,264 Accumulated Dep. 7,581 Cash 10,000 Year 5 Rent Expense 10,000 Depreciation Expense 7,581 Cash 10,000 Interest Expense 909 Capital Lease Liab. 9,091 Accumulated Dep. 7,581
Cash 10,000
Panel A: Hand-collected Sample Selection Criteria
Compustat firms in 2001 and 2002 with more than $25M in capital lease obligations 613
Less the following firm-year observations:
American Depository Receipts/Foreign Firms 199
Utilities (Electric and Natural Gas) 55
Missing Shares Outstanding or Share Price Data 44
Real Estate Investment Trusts 10
Insurance Companies 9
Missing Capital Asset Data in the Form 10-K 77
Missing Capital Asset Accumulated Depreciation Data 28
Missing Rental Commitment Amounts 17
Negative Shareholder's Equity Balances 20
Influential Observations - Belsley, Kuh, and Welsch (1980) 6 465
Total Firm-Year Observations in Subsample 148
Panel B: Calibration of the Estimated As-if Capitalized Operating Lease Liability
Capital Lease Liability N Mean St. Dev. 10% Median 90%
Reported 148 208.88 457.16 31.76 63.88 466.76
Estimated* 148 211.09 482.39 30.67 61.30 486.91
* The estimated capital lease liability distribution reflects the as-if capitalized operating lease
liability methodology applied to hand-collected capital lease amounts of the same variables.
Table 1:
Estimation of The Operating Lease Asset and Liability
37
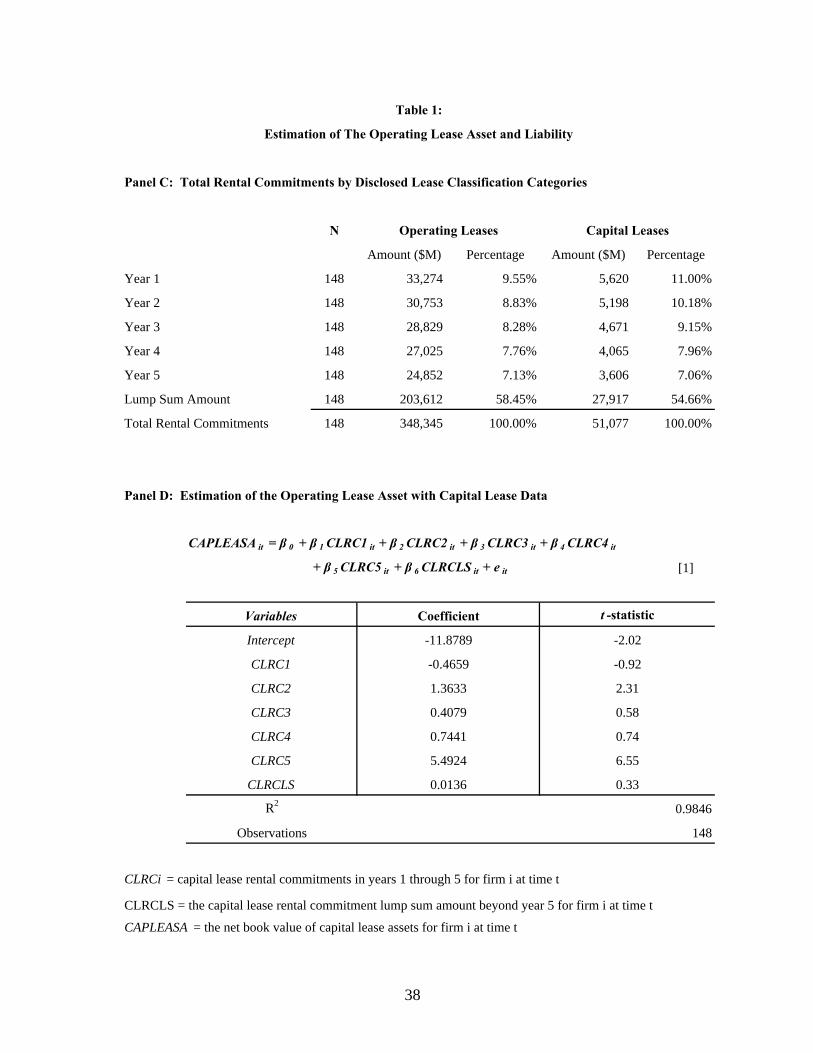
Panel C: Total Rental Commitments by Disclosed Lease Classification Categories
N
Amount ($M) Percentage Amount ($M) Percentage
Year 1 148 33,274 9.55% 5,620 11.00%
Year 2 148 30,753 8.83% 5,198 10.18%
Year 3 148 28,829 8.28% 4,671 9.15%
Year 4 148 27,025 7.76% 4,065 7.96%
Year 5 148 24,852 7.13% 3,606 7.06%
Lump Sum Amount 148 203,612 58.45% 27,917 54.66%
Total Rental Commitments 148 348,345 100.00% 51,077 100.00%
Panel D: Estimation of the Operating Lease Asset with Capital Lease Data
CAPLEASA it = β 0 + β 1 CLRC1 it + β 2 CLRC2 it + β 3 CLRC3 it + β 4 CLRC4 it
+ β 5 CLRC5 it + β 6 CLRCLS it + e it [1]
0.9846
148
CLRCi = capital lease rental commitments in years 1 through 5 for firm i at time t
CLRCLS = the capital lease rental commitment lump sum amount beyond year 5 for firm i at time t
CAPLEASA = the net book value of capital lease assets for firm i at time t
Operating Leases Capital Leases
Variables Coefficient t -statistic
Intercept -11.8789 -2.02
CLRC1 -0.4659 -0.92
CLRC2 1.3633 2.31
CLRC3 0.4079 0.58
0.7441 0.74
CLRC5 5.4924 6.55
Table 1:
Estimation of The Operating Lease Asset and Liability
Observations
CLRCLS 0.0136 0.33
R2
CLRC4
38

Panel A: Sample Selection Criteria
Compustat firm-year observations in years 2000 through 2003 with positive net sales revenue and $10 million or more in total assets 24,578
Less the following firm-year observations:
American Depository Receipts/Foreign Firms 3,832Real Estate Investment Trusts 828Utilities (Electric and Natural Gas) 663Insurance Companies 509Financial Institutions 336Missing Shares Outstanding Data 1,217Missing Share Price Data 1,023Missing Operating Lease Rental Commitment Amount Data 4,227Missing Capital Lease Obligation Data 528Missing Long-term Debt Data 6Negative Shareholder's Equity Balances 648Missing One-year Ahead Sales Revenue Data (GROWTH ) 357Missing Marginal Tax Rate Data 351Influential Observations - Belsley, Kuh, and Welsch (1980) 68 14,593
Total Firm-Year Observations in Sample 9,985
Panel B: Industry and Year Sample Representation
Year N Percentage SIC Code N Percentage2000 2,452 24.56% 0 32 0.32%2001 2,522 25.26% 1 526 5.27%2002 2,553 25.57% 2 1,733 17.36%2003 2,458 24.62% 3 3,167 31.72%Total 9,985 100.00% 4 600 6.01%
5 1,402 14.04%6 422 4.23%7 1,537 15.39%8 529 5.30%9 37 0.37%
Total 9,985 100.00%
Table 2:Sample Selection Criteria and Industry and Year Sample Representation
39
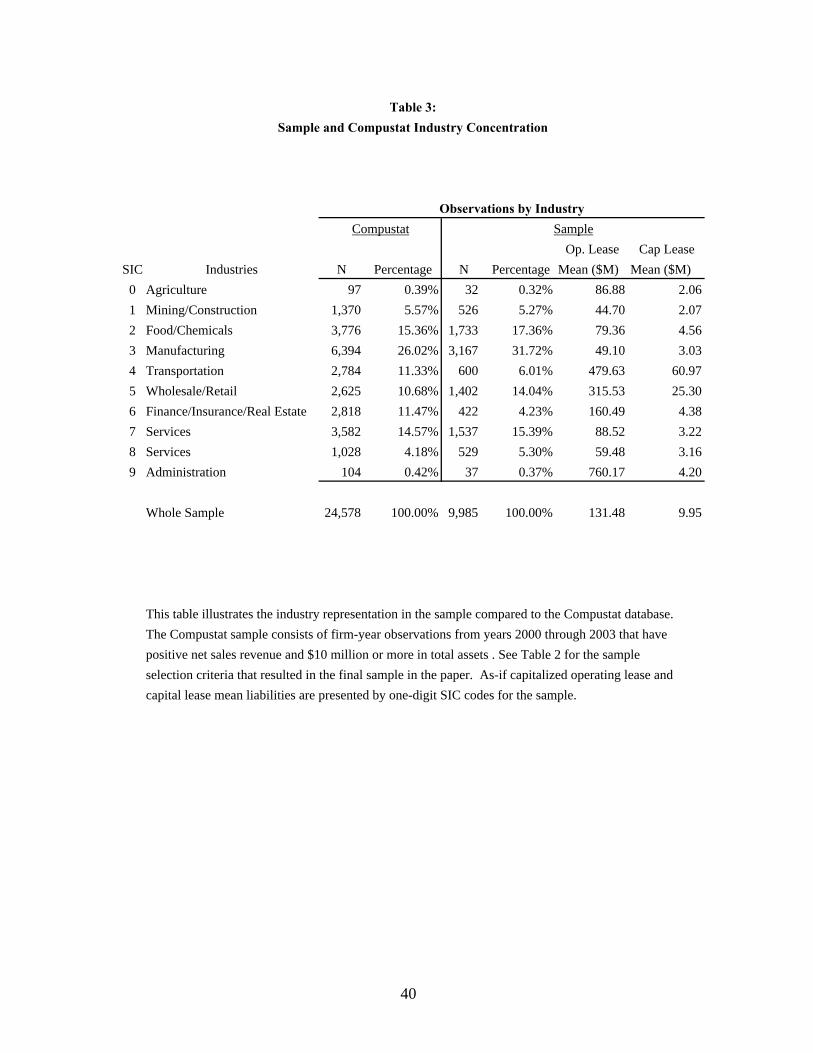
Op. Lease Cap LeaseSIC Industries N Percentage N Percentage Mean ($M) Mean ($M)
0 Agriculture 97 0.39% 32 0.32% 86.88 2.061 Mining/Construction 1,370 5.57% 526 5.27% 44.70 2.072 Food/Chemicals 3,776 15.36% 1,733 17.36% 79.36 4.563 Manufacturing 6,394 26.02% 3,167 31.72% 49.10 3.034 Transportation 2,784 11.33% 600 6.01% 479.63 60.975 Wholesale/Retail 2,625 10.68% 1,402 14.04% 315.53 25.306 Finance/Insurance/Real Estate 2,818 11.47% 422 4.23% 160.49 4.387 Services 3,582 14.57% 1,537 15.39% 88.52 3.228 Services 1,028 4.18% 529 5.30% 59.48 3.169 Administration 104 0.42% 37 0.37% 760.17 4.20
Whole Sample 24,578 100.00% 9,985 100.00% 131.48 9.95
This table illustrates the industry representation in the sample compared to the Compustat database.The Compustat sample consists of firm-year observations from years 2000 through 2003 that havepositive net sales revenue and $10 million or more in total assets . See Table 2 for the sample selection criteria that resulted in the final sample in the paper. As-if capitalized operating lease and capital lease mean liabilities are presented by one-digit SIC codes for the sample.
Compustat Sample
Table 3:
Observations by Industry
Sample and Compustat Industry Concentration
40
Reported Total Assets 604,210 Reported Total Liabilities 350,093
Operating Lease Assets 112,818 Operating Lease Liabilities 121,033Operating Lease Tax Adjustment 2,731
Adjusted Total Liabilities 471,126
Reported Stockholder's Equity 254,117Reported Net Income in SE 33,453 *
Reduction in Stockholder's Equity From Operating Leases (5,484) *
Adjusted Stockholder's Equity 248,633
Adjusted Total Liabilities andAdjusted Total Assets 719,759 Stockholder's Liabilities 719,759
Aggregated Sample Ratios
* I assume in computing ratios for this example that all net income effects take place in prior years. Theoperating lease tax adjustment reflects reduced income taxes (computed using the firm-specific marginaltax rate) attributable to depreciation and interest expense amounts that exceed lease expense amounts.** The simplified ratios have the following definitions: ROA = Net Income/Total AssetsROE = Net Income/Total Equity D/A = Total Liabilities/Total Assets D/E = Total Debt/Total Equity
ROAROE
Debt-to-AssetDebt-to-Equity
57.94%137.77%
4.65%13.45%65.46%
189.49%
Reported Amounts** Adjusted Amounts5.54%
13.16%
Table 4:
Aggregated Wholesale and Retail Sample Firms In Year 2003 (SIC = 5, n = 349)Balance Sheet
Last Day of 2003 Fiscal-Year
Balance Sheet and Financial Statement Ratio Effects of Capitalizing Operating Leases
41
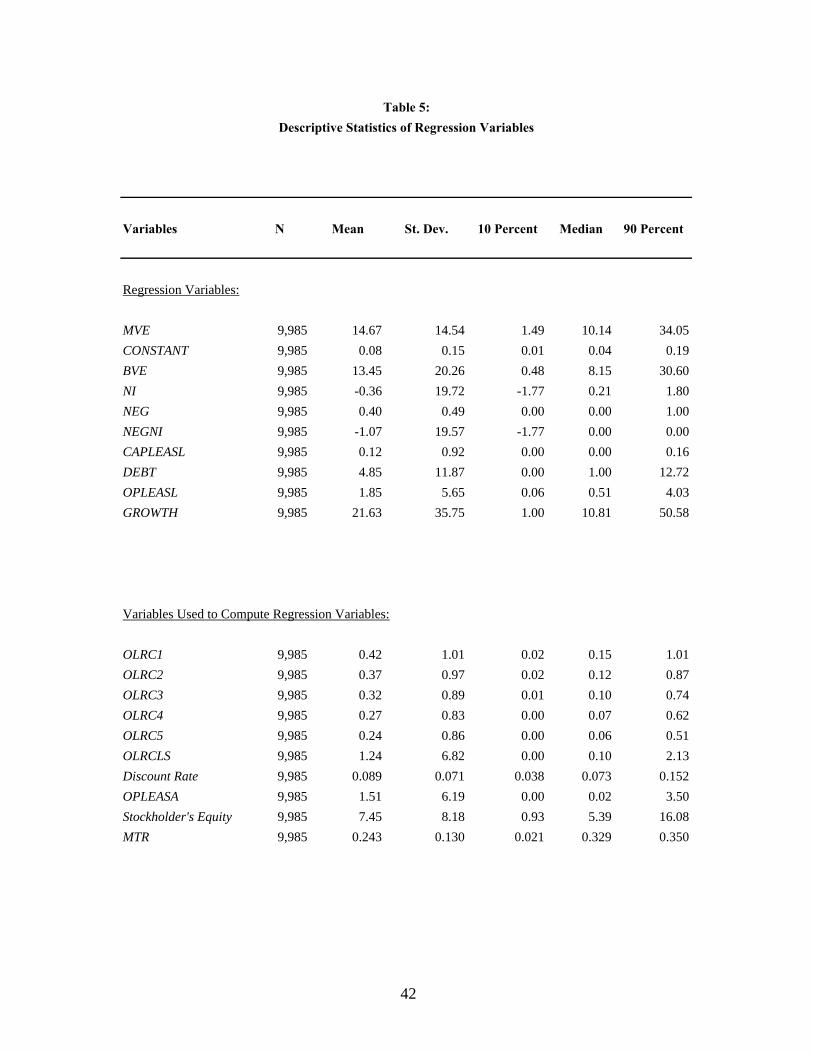
Variables N Mean St. Dev. 10 Percent Median 90 Percent
Regression Variables:
MVE 9,985 14.67 14.54 1.49 10.14 34.05CONSTANT 9,985 0.08 0.15 0.01 0.04 0.19BVE 9,985 13.45 20.26 0.48 8.15 30.60NI 9,985 -0.36 19.72 -1.77 0.21 1.80NEG 9,985 0.40 0.49 0.00 0.00 1.00NEGNI 9,985 -1.07 19.57 -1.77 0.00 0.00CAPLEASL 9,985 0.12 0.92 0.00 0.00 0.16DEBT 9,985 4.85 11.87 0.00 1.00 12.72OPLEASL 9,985 1.85 5.65 0.06 0.51 4.03GROWTH 9,985 21.63 35.75 1.00 10.81 50.58
Variables Used to Compute Regression Variables:
OLRC1 9,985 0.42 1.01 0.02 0.15 1.01OLRC2 9,985 0.37 0.97 0.02 0.12 0.87OLRC3 9,985 0.32 0.89 0.01 0.10 0.74OLRC4 9,985 0.27 0.83 0.00 0.07 0.62OLRC5 9,985 0.24 0.86 0.00 0.06 0.51OLRCLS 9,985 1.24 6.82 0.00 0.10 2.13Discount Rate 9,985 0.089 0.071 0.038 0.073 0.152OPLEASA 9,985 1.51 6.19 0.00 0.02 3.50Stockholder's Equity 9,985 7.45 8.18 0.93 5.39 16.08MTR 9,985 0.243 0.130 0.021 0.329 0.350
Table 5:Descriptive Statistics of Regression Variables
42

Variable Definitions:
MVE = market value of common equity three months after the fiscal year-endCONSTANT = one divided by common shares outstandingBVE = book value of total stockholder's equity increased by CAPLEASL , DEBT , OPLEASA, and the deferred tax asset from capitalizing operating leases (OPLEASL - OPLEASA)*MTRNI = net income after extraordinary and discontinued items (Compustat data item 172)NEG = categorical variable equal to one if NI is negative and zero otherwiseNEGNI = interaction variable equal to NI*NEGCAPLEASL = capital lease obligations (Compustat data item 84)DEBT = long-term debt less CAPLEASLOPLEASL = estimated as-if capitalized operating lease liabilityGROWTH = one-year ahead actual total net sales (Compustat data item 12)OLRCi = operating lease rental commitment in years 1, 2, 3, 4, or 5 (Compustat data items 96,164-167)OLRCLS = operating lease rental commitment lump sum amount beyond year 5 (Compustat data item 389)Discount Rate = the estimated firm-specific discount rateOPLEASA = estimated as-if capitalized operating lease assetStockholder's Equity = total stockholder's equity (Compustat data item 216)MTR = the computed firm specific marginal tax rate (Graham 1996)
All variables are deflated by common shares outstanding. All dollar amounts are in millions.
Table 5:Descriptive Statistics of Regression Variables
43
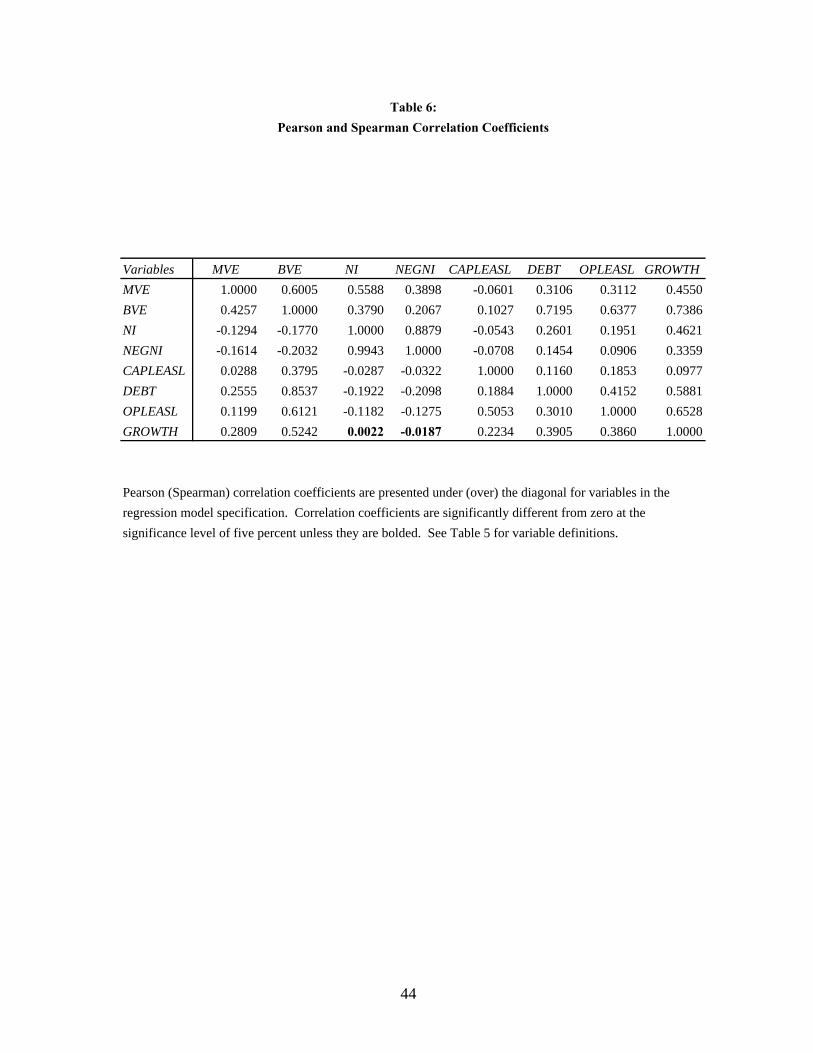
Variables MVE BVE NI NEGNI CAPLEASL DEBT OPLEASL GROWTHMVE 1.0000 0.6005 0.5588 0.3898 -0.0601 0.3106 0.3112 0.4550BVE 0.4257 1.0000 0.3790 0.2067 0.1027 0.7195 0.6377 0.7386NI -0.1294 -0.1770 1.0000 0.8879 -0.0543 0.2601 0.1951 0.4621NEGNI -0.1614 -0.2032 0.9943 1.0000 -0.0708 0.1454 0.0906 0.3359CAPLEASL 0.0288 0.3795 -0.0287 -0.0322 1.0000 0.1160 0.1853 0.0977DEBT 0.2555 0.8537 -0.1922 -0.2098 0.1884 1.0000 0.4152 0.5881OPLEASL 0.1199 0.6121 -0.1182 -0.1275 0.5053 0.3010 1.0000 0.6528GROWTH 0.2809 0.5242 0.0022 -0.0187 0.2234 0.3905 0.3860 1.0000
Pearson (Spearman) correlation coefficients are presented under (over) the diagonal for variables in the regression model specification. Correlation coefficients are significantly different from zero at the significance level of five percent unless they are bolded. See Table 5 for variable definitions.
Table 6:Pearson and Spearman Correlation Coefficients
44
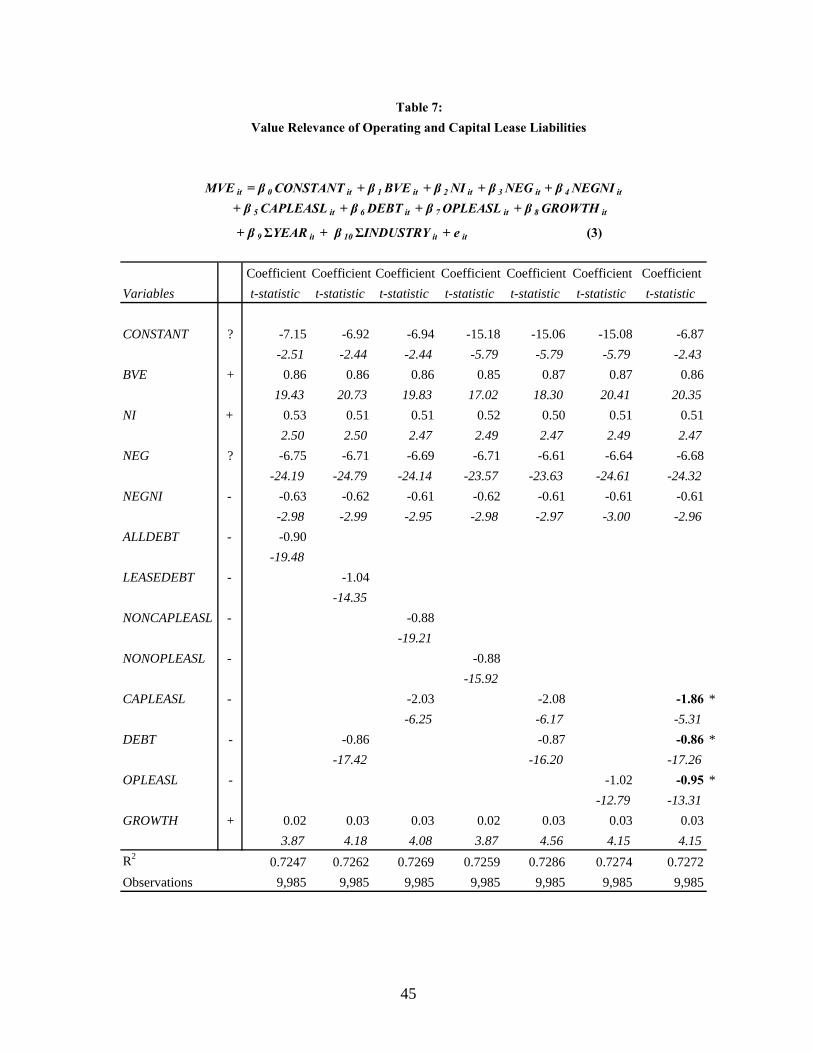
+ β 9 ΣYEAR it + β 10 ΣINDUSTRY it + e it (3)
Coefficient Coefficient Coefficient Coefficient Coefficient Coefficient CoefficientVariables t-statistic t-statistic t-statistic t-statistic t-statistic t-statistic t-statistic
CONSTANT ? -7.15 -6.92 -6.94 -15.18 -15.06 -15.08 -6.87-2.51 -2.44 -2.44 -5.79 -5.79 -5.79 -2.43
BVE + 0.86 0.86 0.86 0.85 0.87 0.87 0.8619.43 20.73 19.83 17.02 18.30 20.41 20.35
NI + 0.53 0.51 0.51 0.52 0.50 0.51 0.512.50 2.50 2.47 2.49 2.47 2.49 2.47
NEG ? -6.75 -6.71 -6.69 -6.71 -6.61 -6.64 -6.68-24.19 -24.79 -24.14 -23.57 -23.63 -24.61 -24.32
NEGNI - -0.63 -0.62 -0.61 -0.62 -0.61 -0.61 -0.61-2.98 -2.99 -2.95 -2.98 -2.97 -3.00 -2.96
ALLDEBT - -0.90-19.48
LEASEDEBT - -1.04-14.35
NONCAPLEASL - -0.88-19.21
NONOPLEASL - -0.88-15.92
CAPLEASL - -2.03 -2.08 -1.86 *-6.25 -6.17 -5.31
DEBT - -0.86 -0.87 -0.86 *-17.42 -16.20 -17.26
OPLEASL - -1.02 -0.95 *-12.79 -13.31
GROWTH + 0.02 0.03 0.03 0.02 0.03 0.03 0.033.87 4.18 4.08 3.87 4.56 4.15 4.15
R2 0.7247 0.7262 0.7269 0.7259 0.7286 0.7274 0.7272Observations 9,985 9,985 9,985 9,985 9,985 9,985 9,985
Table 7:Value Relevance of Operating and Capital Lease Liabilities
MVE it = β 0 CONSTANT it + β 1 BVE it + β 2 NI it + β 3 NEG it + β 4 NEGNI it
+ β 5 CAPLEASL it + β 6 DEBT it + β 7 OPLEASL it + β 8 GROWTH it
45

* Using a Chi-Square distribution with White-corrected standard errors, the probability that OPLEASL and CAPLEASL are equal is 1.70 percent, the probability that DEBT and CAPLEASL are equal is 0.32 percent, and the probability that DEBT and OPLEASL are equal is 26.59 percent.
Fixed-year and fixed-industry effects are included in the model but not reported. See Table 5 for variabledefinitions included in equation three. Additional variables with tabulated regression results are definedas follows:
ALLDEBT = long-term debt (DEBT) plus capital lease obligations (CAPLEASL) plus the as-if capitalized operating lease liability (OPLEASL )LEASEDEBT = capital lease obligations (CAPLEASL) plus the as-if capitalized operating lease liabilityNONCAPLEASL = long-term debt (DEBT) plus the as-if capitalized operating lease liability (OPLEASL)NONOPLEASL = long-term debt (DEBT) plus capital lease obligations (CAPLEASL)
Where necessary, I recompute the BVE variable to account for varying levels of disaggregation.
Table 7:Value Relevance of Operating and Capital Lease Liabilities
46
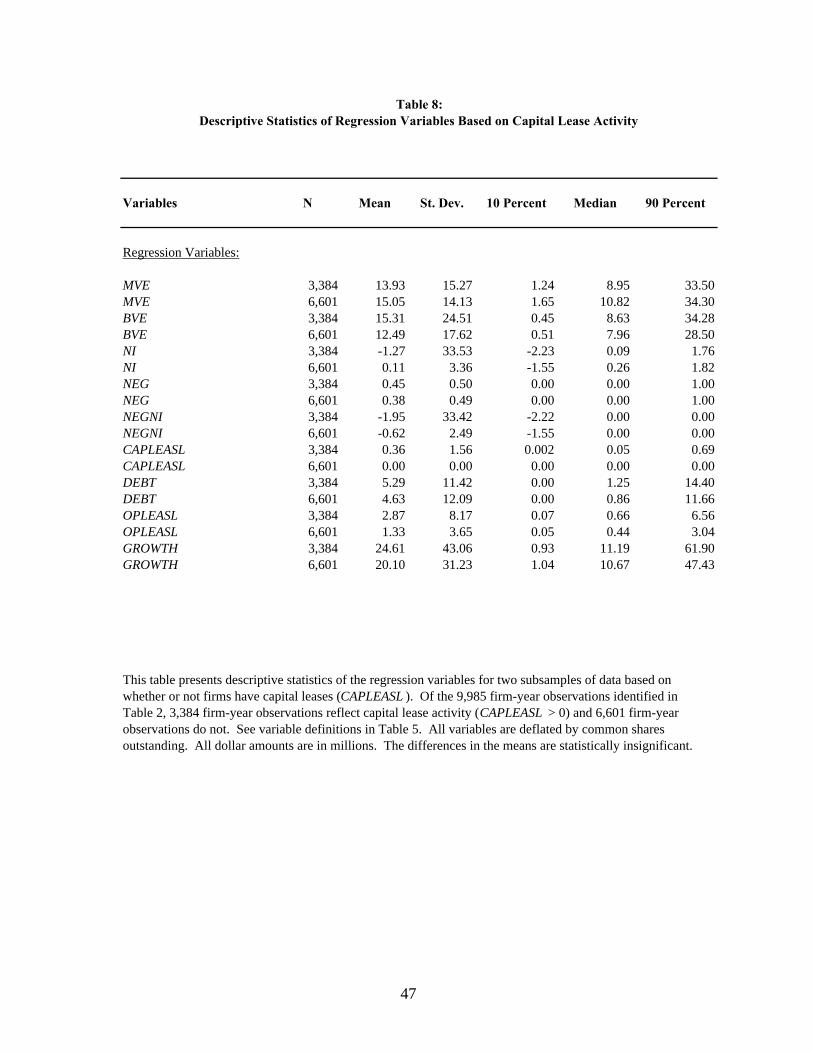
Variables N Mean St. Dev. 10 Percent Median 90 Percent
Regression Variables:
MVE 3,384 13.93 15.27 1.24 8.95 33.50MVE 6,601 15.05 14.13 1.65 10.82 34.30BVE 3,384 15.31 24.51 0.45 8.63 34.28BVE 6,601 12.49 17.62 0.51 7.96 28.50NI 3,384 -1.27 33.53 -2.23 0.09 1.76NI 6,601 0.11 3.36 -1.55 0.26 1.82NEG 3,384 0.45 0.50 0.00 0.00 1.00NEG 6,601 0.38 0.49 0.00 0.00 1.00NEGNI 3,384 -1.95 33.42 -2.22 0.00 0.00NEGNI 6,601 -0.62 2.49 -1.55 0.00 0.00CAPLEASL 3,384 0.36 1.56 0.002 0.05 0.69CAPLEASL 6,601 0.00 0.00 0.00 0.00 0.00DEBT 3,384 5.29 11.42 0.00 1.25 14.40DEBT 6,601 4.63 12.09 0.00 0.86 11.66OPLEASL 3,384 2.87 8.17 0.07 0.66 6.56OPLEASL 6,601 1.33 3.65 0.05 0.44 3.04GROWTH 3,384 24.61 43.06 0.93 11.19 61.90GROWTH 6,601 20.10 31.23 1.04 10.67 47.43
This table presents descriptive statistics of the regression variables for two subsamples of data based onwhether or not firms have capital leases (CAPLEASL ). Of the 9,985 firm-year observations identified inTable 2, 3,384 firm-year observations reflect capital lease activity (CAPLEASL > 0) and 6,601 firm-year observations do not. See variable definitions in Table 5. All variables are deflated by common shares outstanding. All dollar amounts are in millions. The differences in the means are statistically insignificant.
Table 8:Descriptive Statistics of Regression Variables Based on Capital Lease Activity
47
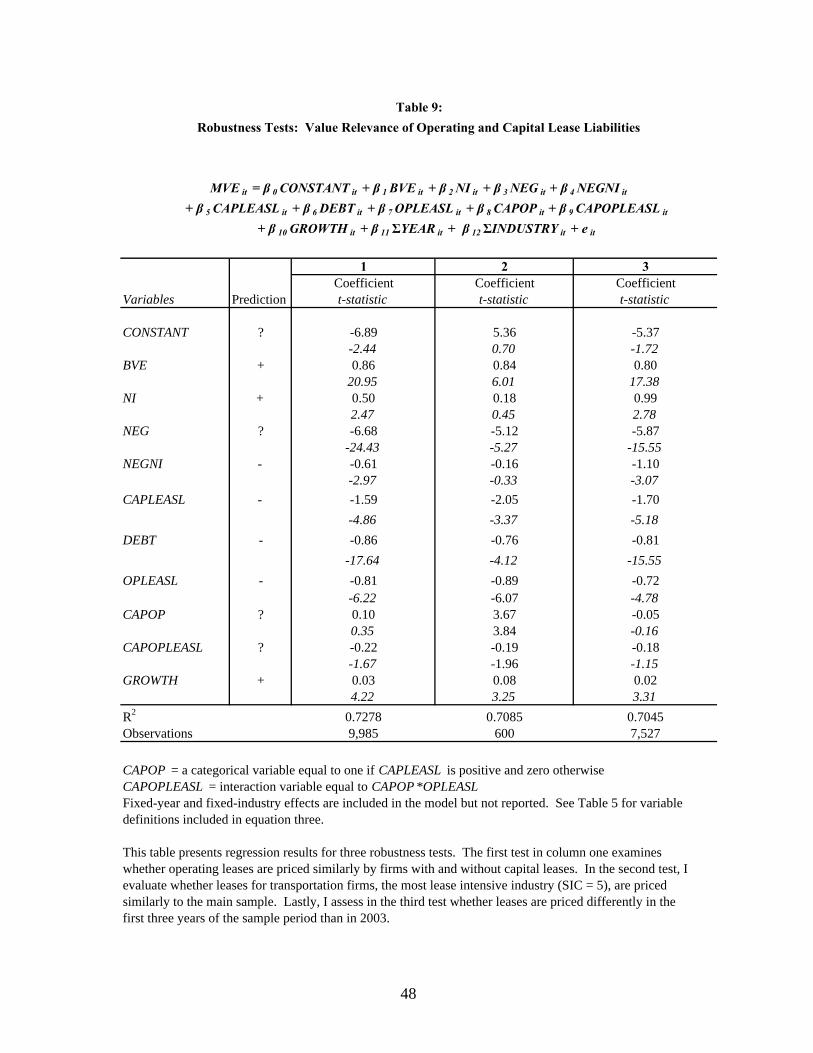
1 2 3Coefficient Coefficient Coefficient
Variables Prediction t-statistic t-statistic t-statistic
CONSTANT ? -6.89 5.36 -5.37-2.44 0.70 -1.72
BVE + 0.86 0.84 0.8020.95 6.01 17.38
NI + 0.50 0.18 0.992.47 0.45 2.78
NEG ? -6.68 -5.12 -5.87-24.43 -5.27 -15.55
NEGNI - -0.61 -0.16 -1.10-2.97 -0.33 -3.07
CAPLEASL - -1.59 -2.05 -1.70-4.86 -3.37 -5.18
DEBT - -0.86 -0.76 -0.81-17.64 -4.12 -15.55
OPLEASL - -0.81 -0.89 -0.72-6.22 -6.07 -4.78
CAPOP ? 0.10 3.67 -0.050.35 3.84 -0.16
CAPOPLEASL ? -0.22 -0.19 -0.18-1.67 -1.96 -1.15
GROWTH + 0.03 0.08 0.024.22 3.25 3.31
R2 0.7278 0.7085 0.7045Observations 9,985 600 7,527
CAPOP = a categorical variable equal to one if CAPLEASL is positive and zero otherwiseCAPOPLEASL = interaction variable equal to CAPOP *OPLEASLFixed-year and fixed-industry effects are included in the model but not reported. See Table 5 for variable definitions included in equation three.
This table presents regression results for three robustness tests. The first test in column one examines whether operating leases are priced similarly by firms with and without capital leases. In the second test, I evaluate whether leases for transportation firms, the most lease intensive industry (SIC = 5), are priced similarly to the main sample. Lastly, I assess in the third test whether leases are priced differently in the first three years of the sample period than in 2003.
MVE it = β 0 CONSTANT it + β 1 BVE it + β 2 NI it + β 3 NEG it + β 4 NEGNI it
+ β 5 CAPLEASL it + β 6 DEBT it + β 7 OPLEASL it + β 8 CAPOP it + β 9 CAPOPLEASL it
+ β 10 GROWTH it + β 11 ΣYEAR it + β 12 ΣINDUSTRY it + e it
Table 9:Robustness Tests: Value Relevance of Operating and Capital Lease Liabilities
48

49
REFERENCES
Aboody, D., 1996. Market valuation of employee stock options. Journal of Accounting and
Economics 22, 357-391. Aboody, D., M. Barth, and R. Kasznik, 1999. Revaluations of fixed assets and future firm
performance: Evidence from the UK. Journal of Accounting and Economics 26, 149-178.
“Accounting for Leases,” SFAS No. 13 (Stamford, CT: Financial Accounting Standards
Board [FASB], 1976). Altamuro, J., 2005. The economic, financial accounting and governance determinants of
synthetic lease financing. Working Paper, Massachusetts Institute of Technology. Amir, E., M. Kirschenheiler, and K. Willard, 1997. The valuation of deferred taxes.
Contemporary Accounting Research 14, 597-622. Ayers, B.C., 1998. Deferred tax accounting under SFAS No. 109: An empirical investigation
of its incremental value relevance relative to APB No. 11. Accounting Review 73, 195-212.
Barth, M., 1991. Relative measurement errors among alternative pension asset and liability
measures. Accounting Review 66, 433-463. Barth, M., W. Beaver, J. Hand, and W. Landsman, 1999. Accruals, cash flow, and equity
values. Review of Accounting Studies 3, 205-229. Barth, M., W. Beaver, J. Hand, and W. Landsman, 2005. Accruals, accounting-based
valuation models, and the prediction of equity values. Journal of Accounting, Auditing, and Finance, forthcoming.
Barth, M., W. Beaver, and W. Landsman, 1992. The market valuation implications of net
periodic pension cost components. Journal of Accounting and Economics 15, 27-62. Barth, M., W. Beaver, and W. Landsman, 1998. Relative valuation roles of equity book
value and net income as a function of financial health. Journal of Accounting and Economics 25, 1-34.
Barth, M., G. Clinch, and T. Shibano, 2003. Market effects of recognition and disclosure.
Journal of Accounting Research 41, 581-609. Barth, M., and S. Kallapur, 1996. The effects of cross-sectional scale differences on
regression results in empirical accounting research. Contemporary Accounting Research 13, 527-567.

50
Belsley, D., E. Kuh, and R. Welsch, 1980. Regression Diagnostics, New York: John Wiley and Sons, Inc.
Bowman, R., 1980. The debt equivalence of leases: an empirical investigation. Accounting
Review 55, 237-253. Collins, D., E. Maydew, and I. Weiss, 1997. Changes in the value relevance of earnings and
book values over the past forty years. Journal of Accounting and Economics 25, 39-67.
El-Gazzar, S., S. Lilien, and V. Pastena. 1986. Accounting for leases by lessees. Journal of
Accounting and Economics 8, 217-237. Ely, K., 1995. Operating lease accounting and the market’s assessment of equity risk.
Journal of Accounting Research 33, 397-415. Financial Accounting Standards Board., 2003. Interpretation No. 46, Consolidation of
variable interest entities. (January 17, 2003, revised December 24, 2003 as FIN 46R) Norwalk, CT.
Ge, W., 2005. Off-balance sheet activities, earnings persistence and stock prices: Evidence
from operating leases. Working paper, University of Michigan. Givoly, D., and C. Hayn, 1992. The valuation of the deferred tax liability: Evidence from the
stock market. Accounting Review 67, 394-410. Graham, J., 1996. Debt and the marginal tax rate, Journal of Financial Economics 41, 41-73. Graham, J., 2000. How big are the tax benefits of debt? Journal of Finance, 1901-1941. Graham, J., M. Lemmon, and J. Schallheim, 1998. Debt, leases, taxes, and the endogeneity
of corporate tax status. The Journal of Finance 53, 131-162. Hayn, C., 1995. The information content of losses. Journal of Accounting and Economics
20, 125-153. Imhoff, E., and J. Thomas, 1988. Economic consequences of accounting standards: The lease
disclosure rule change. Journal of Accounting and Economics 10, 277-310. Imhoff, E., R. Lipe, and D. Wright, 1991. Operating leases: Impact of constructive
capitalization. Accounting Horizons 5, 51-63. Imhoff, E., R. Lipe, and D. Wright, 1993. The effects of recognition versus disclosure on
shareholder risk and executive compensation. Journal of Accounting, Auditing and Finance 8, 335-368.
51
Imhoff, E., R. Lipe, and D. Wright, 1997. Operating leases: Income effects of constructive capitalization. Accounting Horizons 11, 12-32.
Kallapur, S., and S. Kwan, 2004. The value relevance and reliability of brand assets
recognized by U.K. firms. Accounting Review, 79, 151-172. Johnson, J., R. Dowen, and C. Norton, 1993. An assessment of lessor accounting for
residual values. Accounting Horizons, 7, 55-65. Landsman, W., 1986. An empirical investigation of pension fund property rights.
Accounting Review, 61, 662-691. Lev, B., 1968. The aggregation problem in financial statements: An information approach.
Journal of Accounting Research, 6, 247-261. Lev, B., 1970. The informational approach to aggregation in financial statements:
Extensions. Journal of Accounting Research, 8, 78-94. Lim, S., S. Mann, and V. Mihov, 2005. Pricing of off-balance sheet debt: How do Bond
market participants use the footnote disclosures on operating leases and postretirement benefit plans? Working Paper, Texas Christian University.
Lipe, R., 2001. Lease Accounting Research and the G4+1 Proposal. Accounting Horizons,
15, 299-310. Marston, F., and R. Harris, 1988. Substitutability of leases and debt in corporate capital
structures. Journal of Accounting, Auditing and Finance 3, 147-165. Morsfield, S., 2004. New evidence regarding lessee tax status and lease type: The role of
synthetic leases. Working Paper, New York University. Ohlson, J., 1995. Earnings, equity book values, and dividends in equity valuation.
Contemporary Accounting Research 11, 661-687. Powers, M., and L. Revsine, 1989. Lessors’ accounting and residual values: Comdisco,
Barron’s, and GAAP. Accounting Review, 64, 346-368. “Priorities of the Financial Accounting Standards Board,” Summary of Responses to the
Annual FASAC Survey (Stamford, CT: Financial Accounting Standards Advisory Council [FASAC], 2002 - 2005).
Smith, C., and M. Wakeman, 1985. Determinants of corporate leasing policy. The Journal
of Finance, 50, 895-908.
52
U.S. Securities and Exchange Commission, 2005. Report and recommendations pursuant to Section 401(c) of the Sarbanes-Oxley Act of 2002 on arrangements with off-balance sheet implications, special purpose entities, and transparency of filings by issuers. (June 15), Washington, D.C.
White, H., 1980. A heteroskedasticity-consistent covariance matrix estimator and a direct
test for heteroskedasticity. Econometrica, 48, 817-838.