Embed Size (px)
Citation preview
ORIGINAL ARTICLE
Diego Perugini Æ Maurizio Petrelli Æ Giampiero Poli
A virtual voyage through 3D structures generated by chaotic mixingof magmas and numerical simulations: a new approach for understandingspatial and temporal complexity of magma dynamics
Received: 12 March 2005 / Revised: 20 September 2006 / Accepted: 15 October 2006 / Published online: 13 February 2007� Springer-Verlag 2007
Abstract In this contribution, we present a virtual voy-age through 3D structures generated by chaotic mixingof magmas and numerical simulations with the aim tohighlight the power of 3D representations in theunderstanding of this geological phenomenon. In par-ticular, samples of mixed juveniles from Salina island(Southern Italy) are reconstructed in 3D by serial lap-ping and digital montage and numerical simulations areperformed by using a 3D chaotic dynamical system.Natural and simulated magma mixing structures arevisualized by using several multimedia tools includinganimations and ‘‘virtual reality’’ models. It is shown thatmagma interaction processes can generate large spatialand temporal compositional heterogeneities in magmaticsystems. The same topological structures are observed inboth 3D reconstructed rock samples and chaoticnumerical simulations, indicating that the mixing ofmagmas is governed by chaotic dynamics. The use of 3Dmultimedia models gives the opportunity to penetrateinto magma mixing structures and to understand theirsignificance in the context of magma dynamics. Such anapproach is very powerful since multimedia tools canstrongly capture the attention of the reader bringinghim/her into an interactive and memorable geologicalexperience.
Keywords Magma mixing Æ 3D reconstruction ÆChaotic dynamics Æ 3D simulations Æ Virtual reality
Introduction
Textural heterogeneity due to magma mixing/mingling isa common feature of igneous rocks (e.g. Bacon 1986;Calanchi et al. 1993; Perugini et al. 2003a), and theprocesses responsible for them have been discussedextensively (e.g. Eichelberger 1990; Snyder 2000; Peru-gini et al. 2004). Studies on the mineralogical and geo-chemical features of mixed rocks are abundant (e.g.Lesher 1994; Bateman 1995; Poli et al. 1996; Peruginiet al. 2003b) and the number of works focused onquantitative analyses of morphologies related to texturalheterogeneity is increasing quickly (e.g. Perugini et al.2004; Ventura 2004; Gonnerman and Manga 2005),mainly because of the growing power of computers toperform analyses and simulations.
Studies on the fluid-dynamics of interacting liquids(e.g. Ottino 1990), as well as analogue models of magmamixing (e.g. De Campos et al. 2004), and analysis ofnatural patterns (e.g. Ventura 2004; Gonnermann andManga 2005), have shown that different morphologicalstructures (e.g. folds, blobs, filaments, vortexes) giveuseful information about the flow regime and the com-plex dynamics characterizing this igneous process. Inparticular, the fingerprint of chaotic dynamics and theproduction of fractal patterns has been widely docu-mented in both volcanic and plutonic rocks (e.g. Flin-ders and Clemens 1996; De Rosa et al. 2002; Poli andPerugini 2002; Perugini et al. 2003a, 2004). These studiesfocused on the analysis of magmatic enclaves (e.g.Petrelli et al. 2005), filament-like structures (e.g. Peru-gini et al. 2003a; Wada 1995), or disequilibrium inmineral phases (e.g. Perugini et al. 2005), and allowed toobtain important information about the interplay be-tween geochemical and mineralogical evolution of mix-ing processes and magma dynamics.
Although much has been learned about magmainteraction, most works are based on analysis of 2Dsections of rock volumes (e.g. 2D outcrops, 2D samples,
Electronic supplementary material enclosed: http://dx.doi.org/10.1007/s10069-006-0004-x
D. Perugini (&) Æ M. Petrelli Æ G. PoliDepartment of Earth Sciences, University of Perugia,Piazza Universita, 06100 Perugia, ItalyE-mail: [email protected].: +39-075-5852610Fax: +39-075-5852603
Vis Geosci (2008) 13: 1–24DOI 10.1007/s10069-006-0004-x
or thin sections). However, as with any physical process,magma mixing processes occur in four dimensionalspace where three dimensions are the coordinates of theEuclidean space (x, y, z) and the fourth is time (t). Thefact that geological observations and analyses are mostlyrestricted to two dimensional outcrops or thin sectionsnecessarily generates a loss of information, since at leastone of the spatial dimensions and the temporal dimen-sion are missing. For many geological processes there isusually no chance of solving problems related to thetemporal dimension since they occur in extremely longtimes. However, it is possible to recover information onthe third spatial dimension using tomographic tech-niques that may give the opportunity to visualize andquantify structures and features in 3D (e.g. Petford et al.1993; Pugliese and Petford 2001).
In this contribution, we present a virtual voyagethrough 3D structures generated by chaotic mixing ofmagmas and numerical simulations with the aim tohighlight the power of 3D representations in theunderstanding of this geological phenomenon. In par-ticular, samples of mixed juveniles from Salina island(Southern Italy) are reconstructed in 3D by serial lap-ping and digital montage and numerical simulations areperformed by using a 3D chaotic dynamical system.Natural and simulated magma mixing structures arevisualized by using several tools including 3D anima-tions sequences and ‘‘virtual reality’’ models.
The paper is organized as follows: the first part re-ports a general introduction on some basic conceptsconcerning chaos theory and chaotic mixing; such con-cepts will be extensively used in the various sections andtheir discussion is intended to help the reader to followbetter presented arguments. The second and third partsdeal with the 3D reconstruction and visualization ofnatural magma mixing structures and structures gener-ated by 3D numerical simulations, respectively.Throughout the paper the reader is continuously invitedto access multimedia animations and models; we believethat this is a fundamental operation in order to fullyappreciate presented arguments. Each animation or 3Dmodel is indicated in the text by a specific code (e.g.MV_01 for a movie or VRML_01 for a 3D virtualreality interactive model) and can be accessed from thestarting hypertext page (i.e. index.htm) present in themultimedia contents accompanying the paper. In thispage the reader can also find information about softwarerequired to use interactive contents.
Basic concepts of chaos theory and chaotic mixing
Chaos theory and fractal geometry
The evolution of chaos theory can be historically tracedfrom the pioneering work of Lorenz (1963) who realisedwith the aid of computer techniques, that apparentlysimple systems, such as atmospheric convection, canexhibit very complex behaviour. Lorenz observed that
arbitrarily close particles diverged exponentially fastafter few cycles of calculation depicting completely dif-ferent orbits and making practically impossible to fore-cast the long-term evolution of the entire system. Thelong-term unpredictability of the Lorenz system wascalled ‘‘sensitive dependence on initial conditions’’ and isthe basic property of chaotic systems (e.g. Turcotte1992; Addison 1997).
One important property of structures generated bychaotic systems is that they exhibit the same statisticalproperties at many scales of magnification. Such a fea-ture is known as ‘‘self-similarity’’ and is a basic propertyof fractal structures. Basically, a ‘‘fractal’’ is a structurethat can be subdivided in parts, each of which is, sta-tistically, a reduced-size copy of the whole (e.g. Man-delbrot 1982).
Chaotic systems have been recognized in a widevariety of natural processes such as atmospheric con-vection (e.g. Binson 1996), plankton distribution inoceans (e.g. Abraham and Bowen 2002), the dynamics ofearthquakes (e.g. Turcotte 1992), and the mixing ofmagmas (e.g. Poli and Perugini 2002).
Stretching and folding: the recipe for ‘‘chaos’’and for ‘‘mixing’’
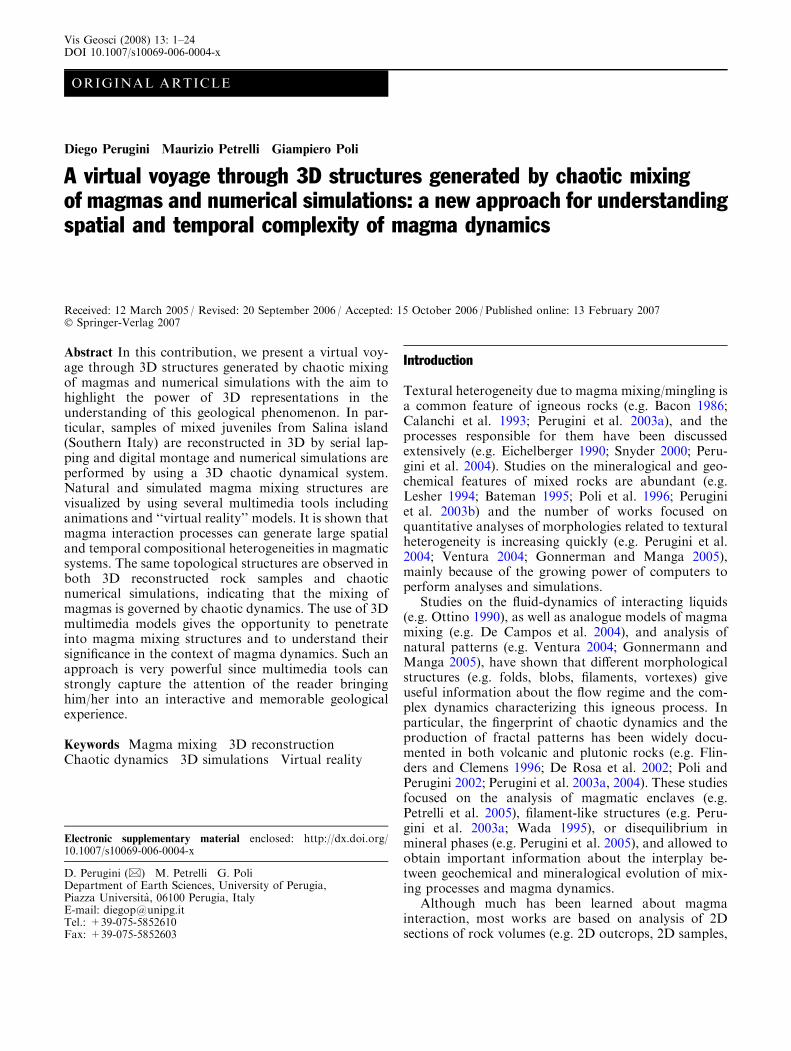
In the last years a lot of attention has been focused onthe application of chaos theory in the study of fluidmixing processes. The reason is that the basic forcespromoting fluid mixing are ‘‘stretching and folding’’dynamics between interacting fluids and, stretching andfolding are also the basic dynamics leading to chaoticbehaviours (Ottino et al. 1988, 1993). To visualize thisconcept in the framework of fluid mixing Fig. 1 reportsthe outcome of a fluid dynamic experiment in which a
a
dc
b
Fig. 1 Stretching and folding dynamics acting on a black colouredsquare element of fluid (from Welander 1955). Intensity of mixingincreases from a to d
2
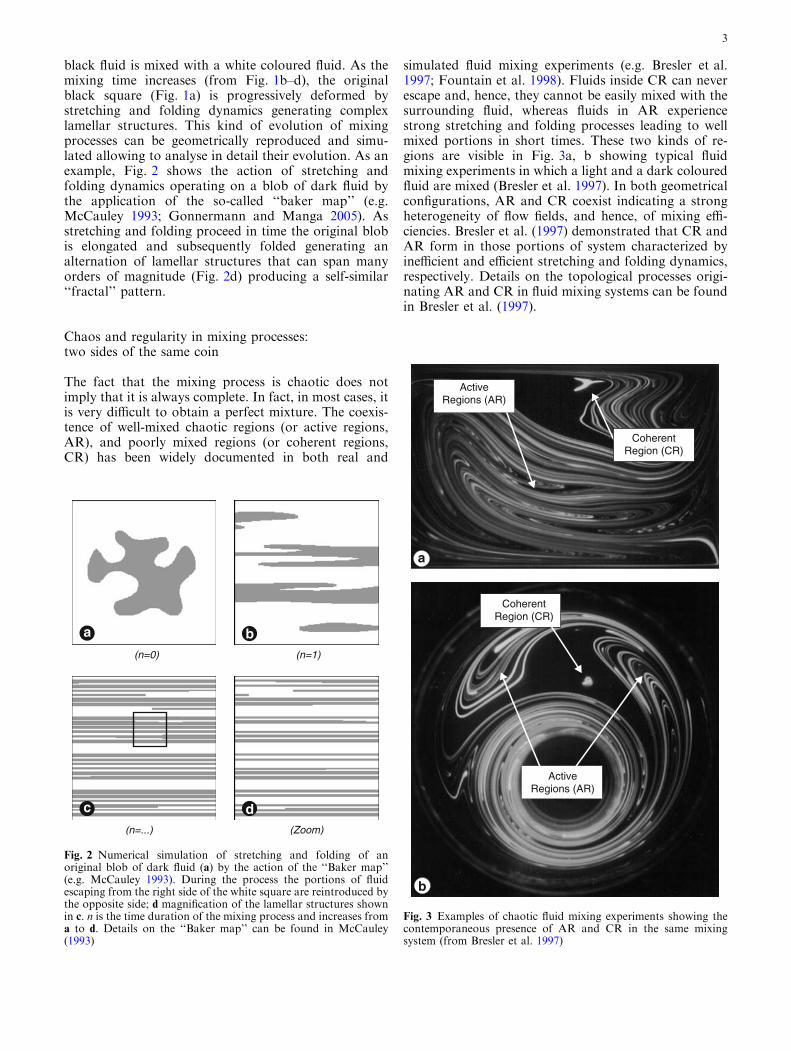
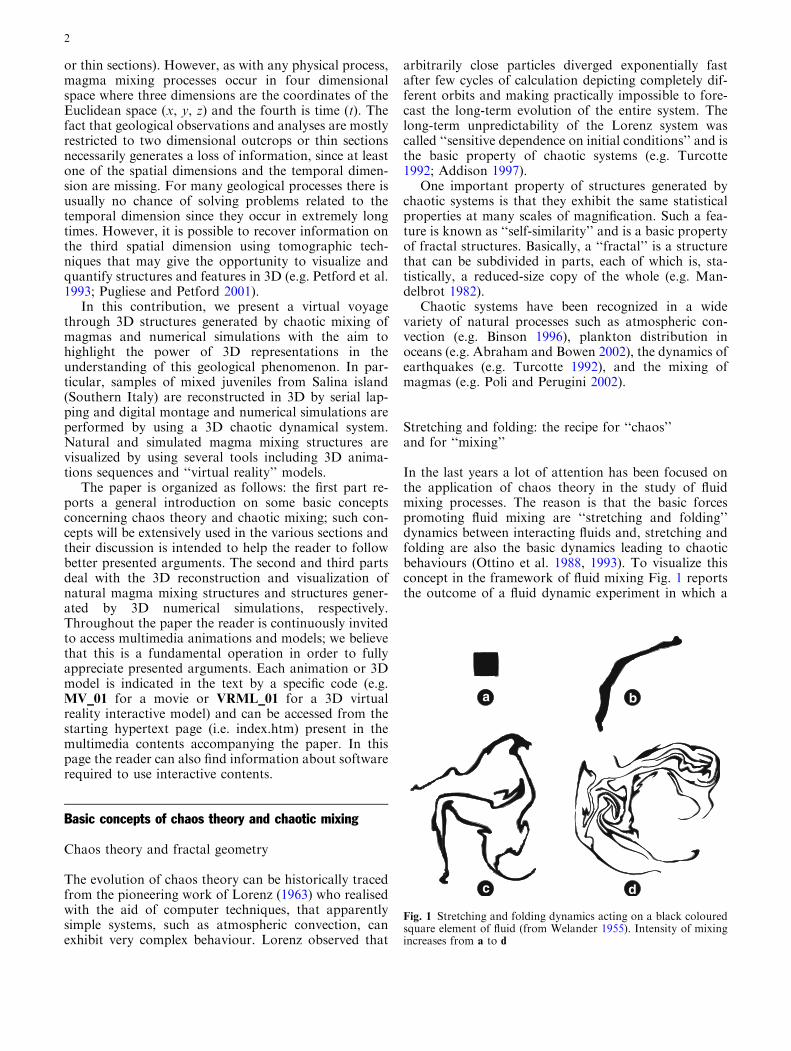
black fluid is mixed with a white coloured fluid. As themixing time increases (from Fig. 1b–d), the originalblack square (Fig. 1a) is progressively deformed bystretching and folding dynamics generating complexlamellar structures. This kind of evolution of mixingprocesses can be geometrically reproduced and simu-lated allowing to analyse in detail their evolution. As anexample, Fig. 2 shows the action of stretching andfolding dynamics operating on a blob of dark fluid bythe application of the so-called ‘‘baker map’’ (e.g.McCauley 1993; Gonnermann and Manga 2005). Asstretching and folding proceed in time the original blobis elongated and subsequently folded generating analternation of lamellar structures that can span manyorders of magnitude (Fig. 2d) producing a self-similar‘‘fractal’’ pattern.
Chaos and regularity in mixing processes:two sides of the same coin
The fact that the mixing process is chaotic does notimply that it is always complete. In fact, in most cases, itis very difficult to obtain a perfect mixture. The coexis-tence of well-mixed chaotic regions (or active regions,AR), and poorly mixed regions (or coherent regions,CR) has been widely documented in both real and
simulated fluid mixing experiments (e.g. Bresler et al.1997; Fountain et al. 1998). Fluids inside CR can neverescape and, hence, they cannot be easily mixed with thesurrounding fluid, whereas fluids in AR experiencestrong stretching and folding processes leading to wellmixed portions in short times. These two kinds of re-gions are visible in Fig. 3a, b showing typical fluidmixing experiments in which a light and a dark colouredfluid are mixed (Bresler et al. 1997). In both geometricalconfigurations, AR and CR coexist indicating a strongheterogeneity of flow fields, and hence, of mixing effi-ciencies. Bresler et al. (1997) demonstrated that CR andAR form in those portions of system characterized byinefficient and efficient stretching and folding dynamics,respectively. Details on the topological processes origi-nating AR and CR in fluid mixing systems can be foundin Bresler et al. (1997).
(n=0) (n=1)
(n=...) (Zoom)
a b
c d
Fig. 2 Numerical simulation of stretching and folding of anoriginal blob of dark fluid (a) by the action of the ‘‘Baker map’’(e.g. McCauley 1993). During the process the portions of fluidescaping from the right side of the white square are reintroduced bythe opposite side; d magnification of the lamellar structures shownin c. n is the time duration of the mixing process and increases froma to d. Details on the ‘‘Baker map’’ can be found in McCauley(1993)
CoherentRegion (CR)
ActiveRegions (AR)
ActiveRegions (AR)
CoherentRegion (CR)
a
b
Fig. 3 Examples of chaotic fluid mixing experiments showing thecontemporaneous presence of AR and CR in the same mixingsystem (from Bresler et al. 1997)
3
Simulation of chaotic mixing processes
In the study of mixing processes major problems occurbecause of the sensitive dependence on initial conditionstypical of chaotic systems. This feature limits the num-ber of techniques that can be utilised to performnumerical simulations since the prediction of the long-term evolution of the systems is denied. For instance, asreported by Metcalfe et al. (1995), using conventionalintegration procedures in tracking individual particletrajectories during numerical experiments, differences inthe velocity field greater than 0.1% can produce, afteronly two or three circulation times, deviations of tra-jectories larger than the whole geometry of the systemmaking the computation useless.
To overcome such difficulties several other techniqueshave been suggested and in particular the calculation ofadvection patterns has been recognised as one of themost suitable to simulate mixing processes (e.g. Metcalfeet al. 1995; Cerbelli et al. 2000). Underlying the conceptof advection pattern is what is known as a ‘‘pointtransformation’’ (or ‘‘map’’), a mathematical operationthat enables to identify a particle of fluid and to specifyits position at some time in the future. With this tech-nique each fluid particle is ‘‘mapped’’ to a new positionby the application of a transformation (or map) withextremely good precision avoiding the above-mentionedproblems.
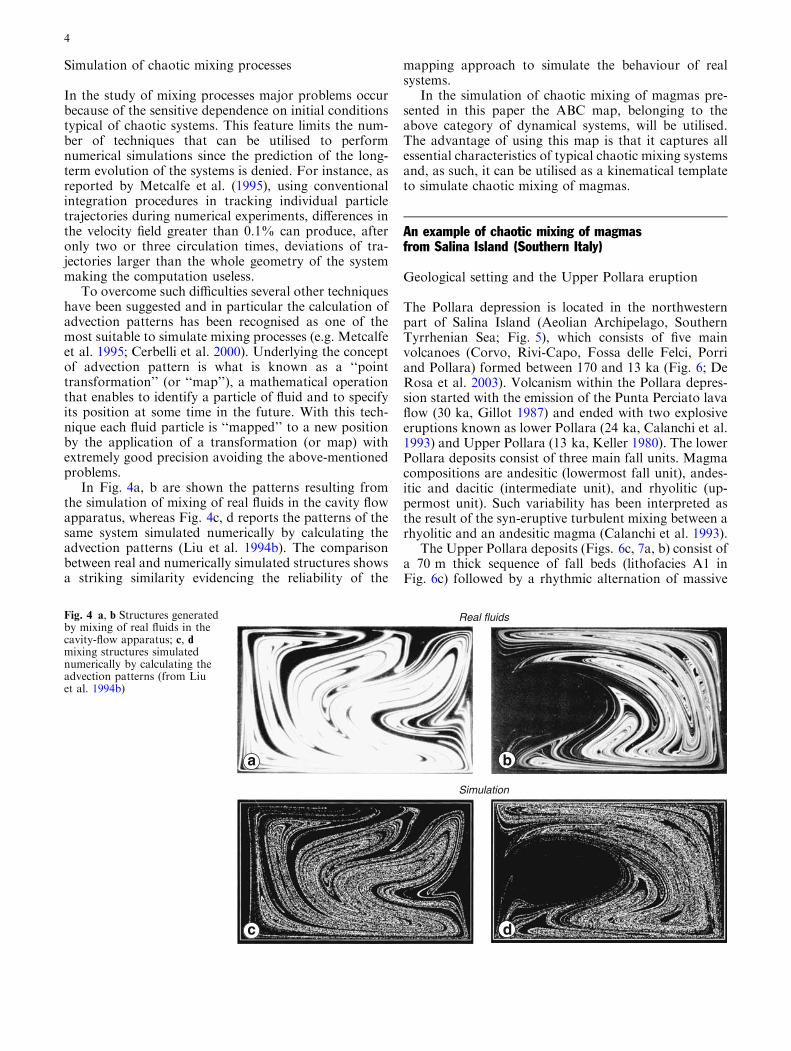
In Fig. 4a, b are shown the patterns resulting fromthe simulation of mixing of real fluids in the cavity flowapparatus, whereas Fig. 4c, d reports the patterns of thesame system simulated numerically by calculating theadvection patterns (Liu et al. 1994b). The comparisonbetween real and numerically simulated structures showsa striking similarity evidencing the reliability of the
mapping approach to simulate the behaviour of realsystems.
In the simulation of chaotic mixing of magmas pre-sented in this paper the ABC map, belonging to theabove category of dynamical systems, will be utilised.The advantage of using this map is that it captures allessential characteristics of typical chaotic mixing systemsand, as such, it can be utilised as a kinematical templateto simulate chaotic mixing of magmas.
An example of chaotic mixing of magmasfrom Salina Island (Southern Italy)
Geological setting and the Upper Pollara eruption
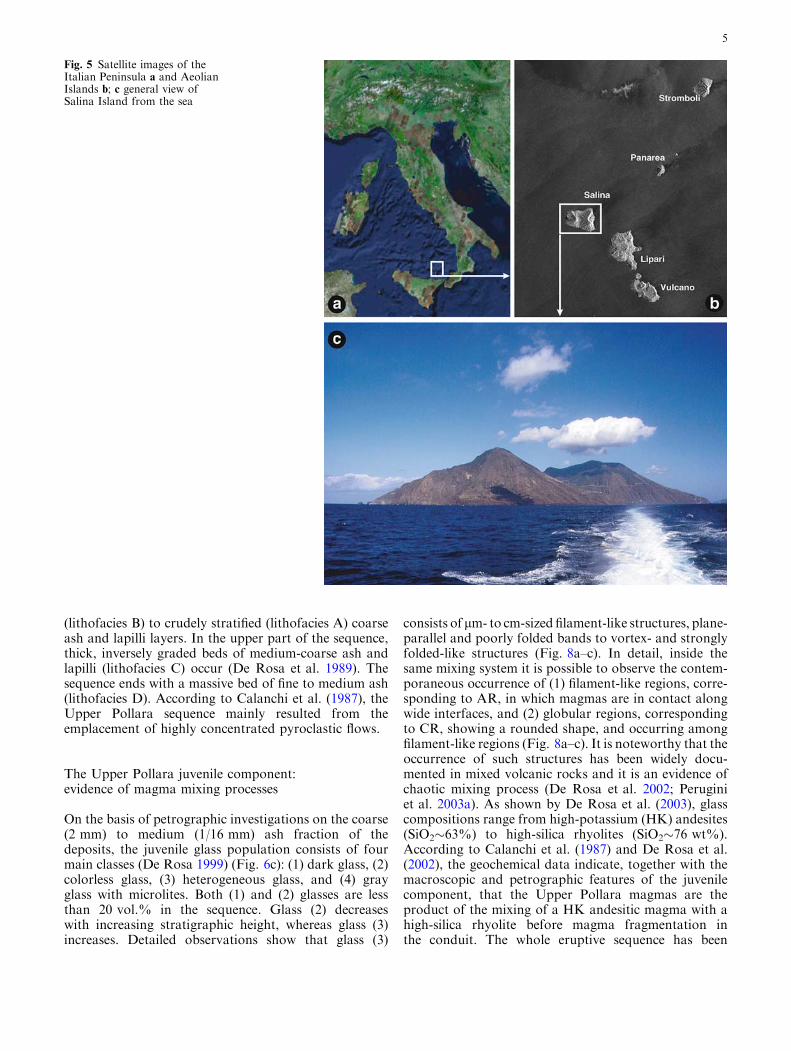
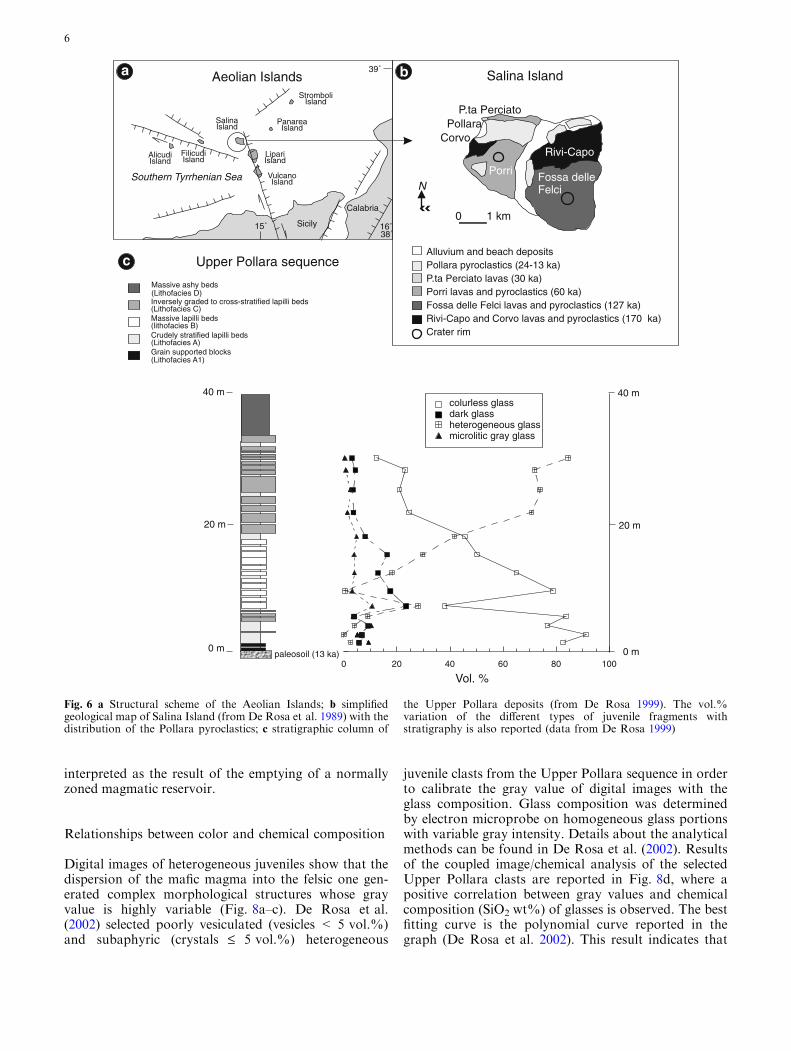
The Pollara depression is located in the northwesternpart of Salina Island (Aeolian Archipelago, SouthernTyrrhenian Sea; Fig. 5), which consists of five mainvolcanoes (Corvo, Rivi-Capo, Fossa delle Felci, Porriand Pollara) formed between 170 and 13 ka (Fig. 6; DeRosa et al. 2003). Volcanism within the Pollara depres-sion started with the emission of the Punta Perciato lavaflow (30 ka, Gillot 1987) and ended with two explosiveeruptions known as lower Pollara (24 ka, Calanchi et al.1993) and Upper Pollara (13 ka, Keller 1980). The lowerPollara deposits consist of three main fall units. Magmacompositions are andesitic (lowermost fall unit), andes-itic and dacitic (intermediate unit), and rhyolitic (up-permost unit). Such variability has been interpreted asthe result of the syn-eruptive turbulent mixing between arhyolitic and an andesitic magma (Calanchi et al. 1993).
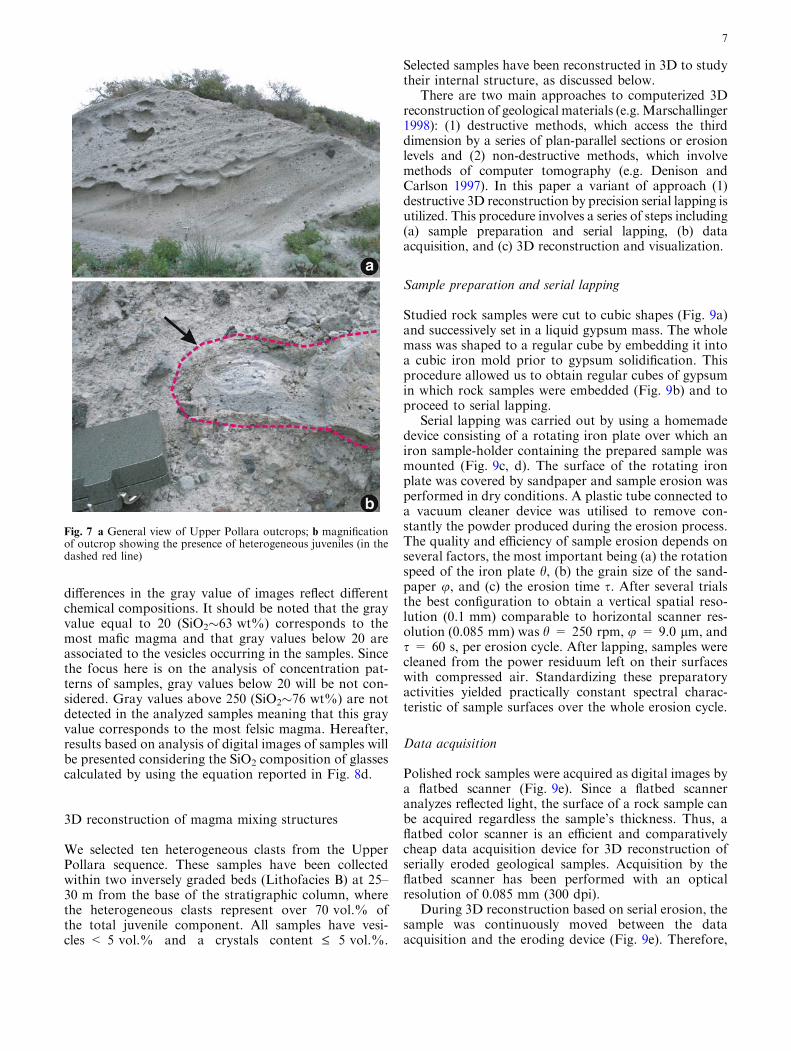
The Upper Pollara deposits (Figs. 6c, 7a, b) consist ofa 70 m thick sequence of fall beds (lithofacies A1 inFig. 6c) followed by a rhythmic alternation of massive
Simulation
Real fluids
dc
a b
Fig. 4 a, b Structures generatedby mixing of real fluids in thecavity-flow apparatus; c, dmixing structures simulatednumerically by calculating theadvection patterns (from Liuet al. 1994b)
4
(lithofacies B) to crudely stratified (lithofacies A) coarseash and lapilli layers. In the upper part of the sequence,thick, inversely graded beds of medium-coarse ash andlapilli (lithofacies C) occur (De Rosa et al. 1989). Thesequence ends with a massive bed of fine to medium ash(lithofacies D). According to Calanchi et al. (1987), theUpper Pollara sequence mainly resulted from theemplacement of highly concentrated pyroclastic flows.
The Upper Pollara juvenile component:evidence of magma mixing processes
On the basis of petrographic investigations on the coarse(2 mm) to medium (1/16 mm) ash fraction of thedeposits, the juvenile glass population consists of fourmain classes (De Rosa 1999) (Fig. 6c): (1) dark glass, (2)colorless glass, (3) heterogeneous glass, and (4) grayglass with microlites. Both (1) and (2) glasses are lessthan 20 vol.% in the sequence. Glass (2) decreaseswith increasing stratigraphic height, whereas glass (3)increases. Detailed observations show that glass (3)
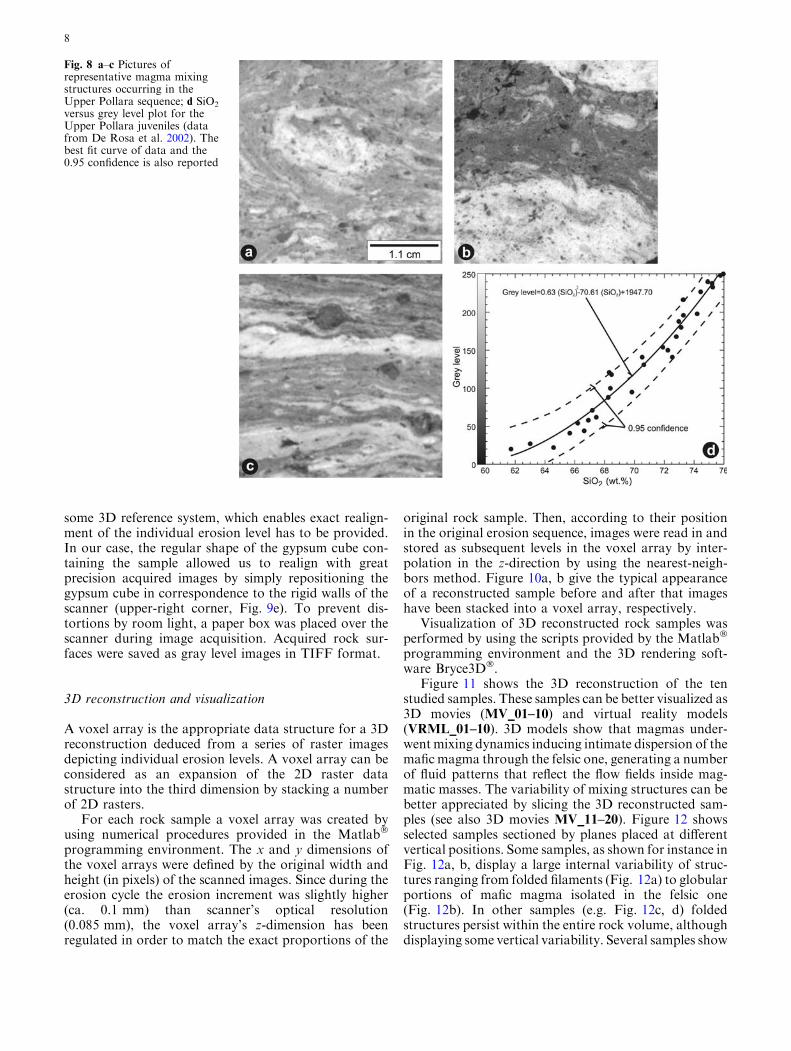
consists oflm- to cm-sized filament-like structures, plane-parallel and poorly folded bands to vortex- and stronglyfolded-like structures (Fig. 8a–c). In detail, inside thesame mixing system it is possible to observe the contem-poraneous occurrence of (1) filament-like regions, corre-sponding to AR, in which magmas are in contact alongwide interfaces, and (2) globular regions, correspondingto CR, showing a rounded shape, and occurring amongfilament-like regions (Fig. 8a–c). It is noteworthy that theoccurrence of such structures has been widely docu-mented in mixed volcanic rocks and it is an evidence ofchaotic mixing process (De Rosa et al. 2002; Peruginiet al. 2003a). As shown by De Rosa et al. (2003), glasscompositions range from high-potassium (HK) andesites(SiO2�63%) to high-silica rhyolites (SiO2�76 wt%).According to Calanchi et al. (1987) and De Rosa et al.(2002), the geochemical data indicate, together with themacroscopic and petrographic features of the juvenilecomponent, that the Upper Pollara magmas are theproduct of the mixing of a HK andesitic magma with ahigh-silica rhyolite before magma fragmentation inthe conduit. The whole eruptive sequence has been
Fig. 5 Satellite images of theItalian Peninsula a and AeolianIslands b; c general view ofSalina Island from the sea
5
interpreted as the result of the emptying of a normallyzoned magmatic reservoir.
Relationships between color and chemical composition
Digital images of heterogeneous juveniles show that thedispersion of the mafic magma into the felsic one gen-erated complex morphological structures whose grayvalue is highly variable (Fig. 8a–c). De Rosa et al.(2002) selected poorly vesiculated (vesicles < 5 vol.%)and subaphyric (crystals £ 5 vol.%) heterogeneous
juvenile clasts from the Upper Pollara sequence in orderto calibrate the gray value of digital images with theglass composition. Glass composition was determinedby electron microprobe on homogeneous glass portionswith variable gray intensity. Details about the analyticalmethods can be found in De Rosa et al. (2002). Resultsof the coupled image/chemical analysis of the selectedUpper Pollara clasts are reported in Fig. 8d, where apositive correlation between gray values and chemicalcomposition (SiO2 wt%) of glasses is observed. The bestfitting curve is the polynomial curve reported in thegraph (De Rosa et al. 2002). This result indicates that
Massive ashy beds(Lithofacies D)
40 m
0 m
20 m
paleosoil (13 ka)0 20 40 60 80 100
40 m
0 m
20 m
Vol. %
colurless glassdark glassheterogeneous glassmicrolitic gray glass
39˚
38˚15˚ 16˚
AlicudiIsland
FilicudiIsland
VulcanoIsland
LipariIsland
SalinaIsland
PanareaIsland
StromboliIsland
Southern Tyrrhenian Sea
Sicily
Calabria
Aeolian Islands
Pollara
PorriFossa delleFelci
CorvoRivi-Capo
P.ta Perciato
Alluvium and beach deposits
Rivi-Capo and Corvo lavas and pyroclastics (170 ka)Crater rim
Pollara pyroclastics (24-13 ka)P.ta Perciato lavas (30 ka)Porri lavas and pyroclastics (60 ka)Fossa delle Felci lavas and pyroclastics (127 ka)
N
0 1 km
Upper Pollara sequence
Salina Island
Grain supported blocks(Lithofacies A1)
Crudely stratified lapilli beds(Lithofacies A)
Massive lapilli beds(lithofacies B)
Inversely graded to cross-stratified lapilli beds(Lithofacies C)
a
c
b
Fig. 6 a Structural scheme of the Aeolian Islands; b simplifiedgeological map of Salina Island (from De Rosa et al. 1989) with thedistribution of the Pollara pyroclastics; c stratigraphic column of
the Upper Pollara deposits (from De Rosa 1999). The vol.%variation of the different types of juvenile fragments withstratigraphy is also reported (data from De Rosa 1999)
6
differences in the gray value of images reflect differentchemical compositions. It should be noted that the grayvalue equal to 20 (SiO2�63 wt%) corresponds to themost mafic magma and that gray values below 20 areassociated to the vesicles occurring in the samples. Sincethe focus here is on the analysis of concentration pat-terns of samples, gray values below 20 will be not con-sidered. Gray values above 250 (SiO2�76 wt%) are notdetected in the analyzed samples meaning that this grayvalue corresponds to the most felsic magma. Hereafter,results based on analysis of digital images of samples willbe presented considering the SiO2 composition of glassescalculated by using the equation reported in Fig. 8d.
3D reconstruction of magma mixing structures
We selected ten heterogeneous clasts from the UpperPollara sequence. These samples have been collectedwithin two inversely graded beds (Lithofacies B) at 25–30 m from the base of the stratigraphic column, wherethe heterogeneous clasts represent over 70 vol.% ofthe total juvenile component. All samples have vesi-cles < 5 vol.% and a crystals content £ 5 vol.%.
Selected samples have been reconstructed in 3D to studytheir internal structure, as discussed below.
There are two main approaches to computerized 3Dreconstruction of geological materials (e.g. Marschallinger1998): (1) destructive methods, which access the thirddimension by a series of plan-parallel sections or erosionlevels and (2) non-destructive methods, which involvemethods of computer tomography (e.g. Denison andCarlson 1997). In this paper a variant of approach (1)destructive 3D reconstruction by precision serial lapping isutilized. This procedure involves a series of steps including(a) sample preparation and serial lapping, (b) dataacquisition, and (c) 3D reconstruction and visualization.
Sample preparation and serial lapping
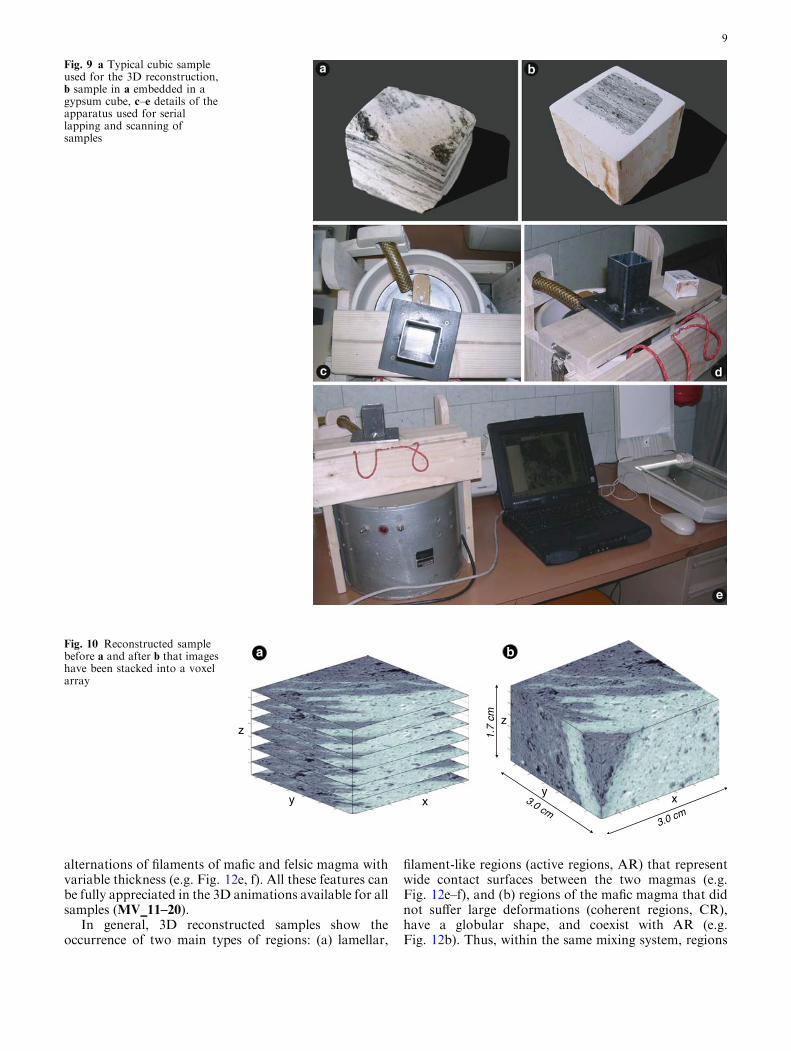
Studied rock samples were cut to cubic shapes (Fig. 9a)and successively set in a liquid gypsum mass. The wholemass was shaped to a regular cube by embedding it intoa cubic iron mold prior to gypsum solidification. Thisprocedure allowed us to obtain regular cubes of gypsumin which rock samples were embedded (Fig. 9b) and toproceed to serial lapping.
Serial lapping was carried out by using a homemadedevice consisting of a rotating iron plate over which aniron sample-holder containing the prepared sample wasmounted (Fig. 9c, d). The surface of the rotating ironplate was covered by sandpaper and sample erosion wasperformed in dry conditions. A plastic tube connected toa vacuum cleaner device was utilised to remove con-stantly the powder produced during the erosion process.The quality and efficiency of sample erosion depends onseveral factors, the most important being (a) the rotationspeed of the iron plate h, (b) the grain size of the sand-paper u, and (c) the erosion time s. After several trialsthe best configuration to obtain a vertical spatial reso-lution (0.1 mm) comparable to horizontal scanner res-olution (0.085 mm) was h = 250 rpm, u = 9.0 lm, ands = 60 s, per erosion cycle. After lapping, samples werecleaned from the power residuum left on their surfaceswith compressed air. Standardizing these preparatoryactivities yielded practically constant spectral charac-teristic of sample surfaces over the whole erosion cycle.
Data acquisition
Polished rock samples were acquired as digital images bya flatbed scanner (Fig. 9e). Since a flatbed scanneranalyzes reflected light, the surface of a rock sample canbe acquired regardless the sample’s thickness. Thus, aflatbed color scanner is an efficient and comparativelycheap data acquisition device for 3D reconstruction ofserially eroded geological samples. Acquisition by theflatbed scanner has been performed with an opticalresolution of 0.085 mm (300 dpi).
During 3D reconstruction based on serial erosion, thesample was continuously moved between the dataacquisition and the eroding device (Fig. 9e). Therefore,
Fig. 7 a General view of Upper Pollara outcrops; b magnificationof outcrop showing the presence of heterogeneous juveniles (in thedashed red line)
7
some 3D reference system, which enables exact realign-ment of the individual erosion level has to be provided.In our case, the regular shape of the gypsum cube con-taining the sample allowed us to realign with greatprecision acquired images by simply repositioning thegypsum cube in correspondence to the rigid walls of thescanner (upper-right corner, Fig. 9e). To prevent dis-tortions by room light, a paper box was placed over thescanner during image acquisition. Acquired rock sur-faces were saved as gray level images in TIFF format.
3D reconstruction and visualization
A voxel array is the appropriate data structure for a 3Dreconstruction deduced from a series of raster imagesdepicting individual erosion levels. A voxel array can beconsidered as an expansion of the 2D raster datastructure into the third dimension by stacking a numberof 2D rasters.
For each rock sample a voxel array was created byusing numerical procedures provided in the Matlab�
programming environment. The x and y dimensions ofthe voxel arrays were defined by the original width andheight (in pixels) of the scanned images. Since during theerosion cycle the erosion increment was slightly higher(ca. 0.1 mm) than scanner’s optical resolution(0.085 mm), the voxel array’s z-dimension has beenregulated in order to match the exact proportions of the
original rock sample. Then, according to their positionin the original erosion sequence, images were read in andstored as subsequent levels in the voxel array by inter-polation in the z-direction by using the nearest-neigh-bors method. Figure 10a, b give the typical appearanceof a reconstructed sample before and after that imageshave been stacked into a voxel array, respectively.
Visualization of 3D reconstructed rock samples wasperformed by using the scripts provided by the Matlab�
programming environment and the 3D rendering soft-ware Bryce3D�.
Figure 11 shows the 3D reconstruction of the tenstudied samples. These samples can be better visualized as3D movies (MV_01–10) and virtual reality models(VRML_01–10). 3D models show that magmas under-went mixing dynamics inducing intimate dispersion of themafic magma through the felsic one, generating a numberof fluid patterns that reflect the flow fields inside mag-matic masses. The variability of mixing structures can bebetter appreciated by slicing the 3D reconstructed sam-ples (see also 3D movies MV_11–20). Figure 12 showsselected samples sectioned by planes placed at differentvertical positions. Some samples, as shown for instance inFig. 12a, b, display a large internal variability of struc-tures ranging from folded filaments (Fig. 12a) to globularportions of mafic magma isolated in the felsic one(Fig. 12b). In other samples (e.g. Fig. 12c, d) foldedstructures persist within the entire rock volume, althoughdisplaying some vertical variability. Several samples show
Fig. 8 a–c Pictures ofrepresentative magma mixingstructures occurring in theUpper Pollara sequence; d SiO2
versus grey level plot for theUpper Pollara juveniles (datafrom De Rosa et al. 2002). Thebest fit curve of data and the0.95 confidence is also reported
8
alternations of filaments of mafic and felsic magma withvariable thickness (e.g. Fig. 12e, f). All these features canbe fully appreciated in the 3D animations available for allsamples (MV_11–20).
In general, 3D reconstructed samples show theoccurrence of two main types of regions: (a) lamellar,
filament-like regions (active regions, AR) that representwide contact surfaces between the two magmas (e.g.Fig. 12e–f), and (b) regions of the mafic magma that didnot suffer large deformations (coherent regions, CR),have a globular shape, and coexist with AR (e.g.Fig. 12b). Thus, within the same mixing system, regions
Fig. 9 a Typical cubic sampleused for the 3D reconstruction,b sample in a embedded in agypsum cube, c–e details of theapparatus used for seriallapping and scanning ofsamples
xy
z
3.0 cm3.0 cm
1.7
cm
ba
xy
z
Fig. 10 Reconstructed samplebefore a and after b that imageshave been stacked into a voxelarray
9
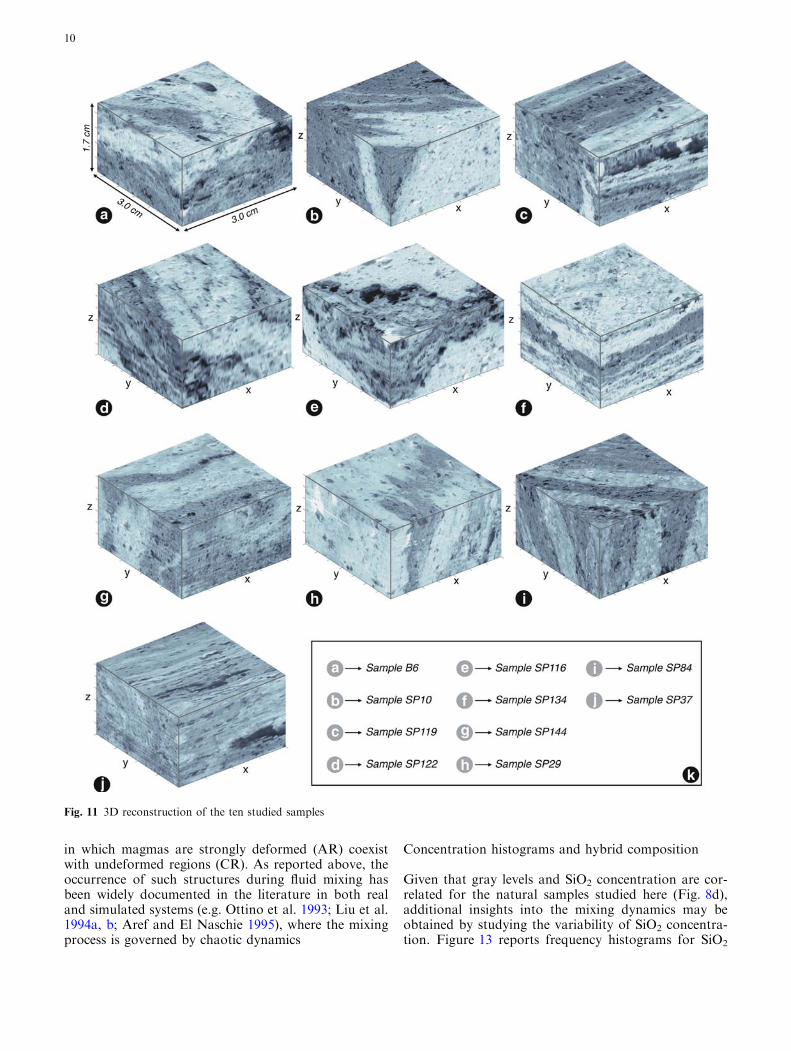
in which magmas are strongly deformed (AR) coexistwith undeformed regions (CR). As reported above, theoccurrence of such structures during fluid mixing hasbeen widely documented in the literature in both realand simulated systems (e.g. Ottino et al. 1993; Liu et al.1994a, b; Aref and El Naschie 1995), where the mixingprocess is governed by chaotic dynamics
Concentration histograms and hybrid composition
Given that gray levels and SiO2 concentration are cor-related for the natural samples studied here (Fig. 8d),additional insights into the mixing dynamics may beobtained by studying the variability of SiO2 concentra-tion. Figure 13 reports frequency histograms for SiO2
Fig. 11 3D reconstruction of the ten studied samples
10
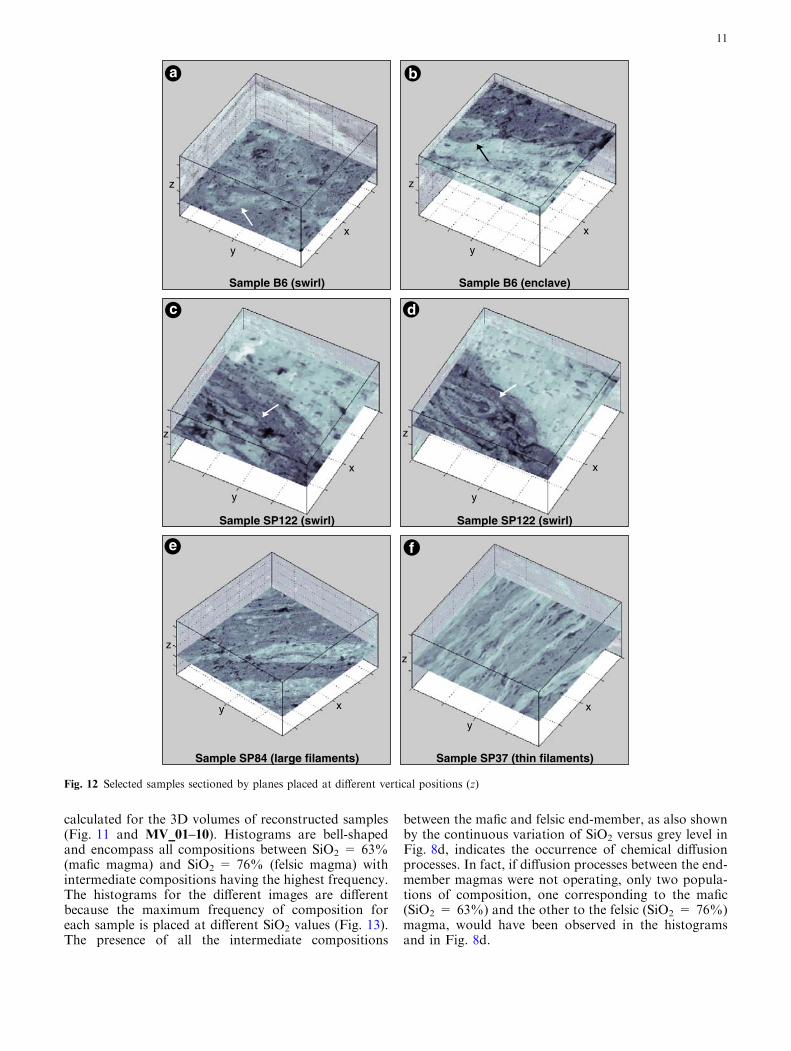
calculated for the 3D volumes of reconstructed samples(Fig. 11 and MV_01–10). Histograms are bell-shapedand encompass all compositions between SiO2 = 63%(mafic magma) and SiO2 = 76% (felsic magma) withintermediate compositions having the highest frequency.The histograms for the different images are differentbecause the maximum frequency of composition foreach sample is placed at different SiO2 values (Fig. 13).The presence of all the intermediate compositions
between the mafic and felsic end-member, as also shownby the continuous variation of SiO2 versus grey level inFig. 8d, indicates the occurrence of chemical diffusionprocesses. In fact, if diffusion processes between the end-member magmas were not operating, only two popula-tions of composition, one corresponding to the mafic(SiO2 = 63%) and the other to the felsic (SiO2 = 76%)magma, would have been observed in the histogramsand in Fig. 8d.
Sample B6 (enclave)Sample B6 (swirl)
a b
Sample SP122 (swirl)Sample SP122 (swirl)
Figure 7
Sample SP84 (large filaments) Sample SP37 (thin filaments)
a
dc
b
e f
z
y
x
z
y
x
z
y
x
z
y
x
z
y x
z
y
x
Fig. 12 Selected samples sectioned by planes placed at different vertical positions (z)
11
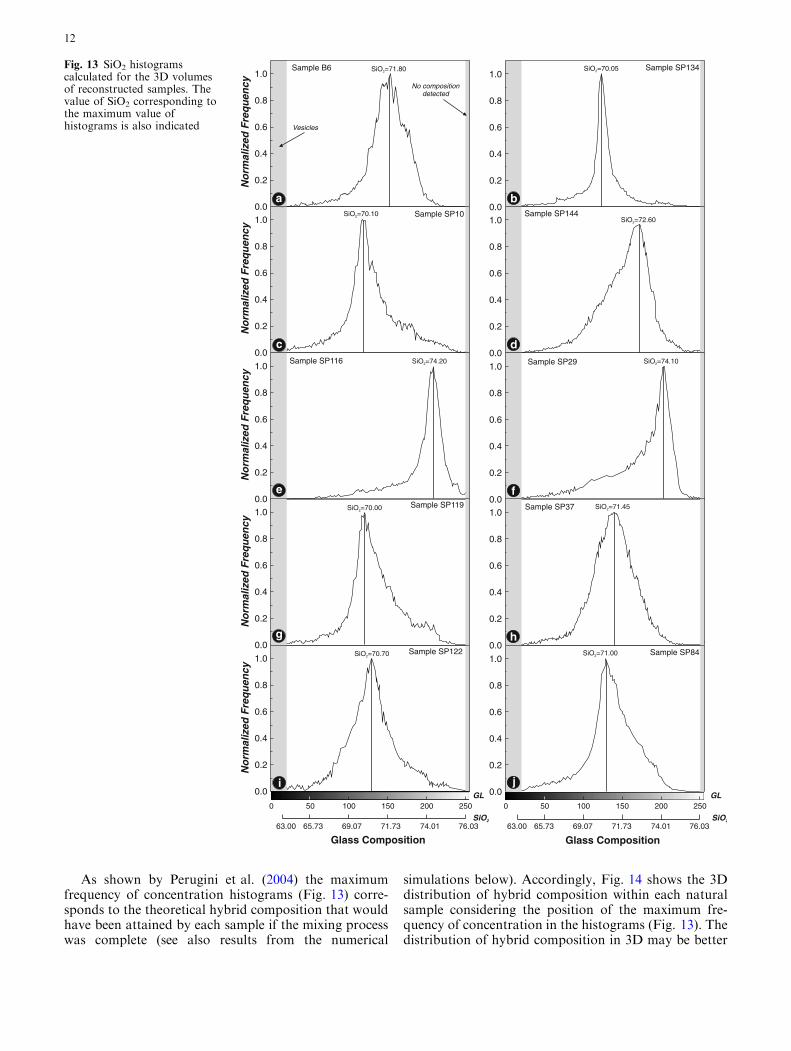
As shown by Perugini et al. (2004) the maximumfrequency of concentration histograms (Fig. 13) corre-sponds to the theoretical hybrid composition that wouldhave been attained by each sample if the mixing processwas complete (see also results from the numerical
simulations below). Accordingly, Fig. 14 shows the 3Ddistribution of hybrid composition within each naturalsample considering the position of the maximum fre-quency of concentration in the histograms (Fig. 13). Thedistribution of hybrid composition in 3D may be better
0.0
0.2
0.4
0.6
0.8
1.0Sample SP10
0.0
0.2
0.4
0.6
0.8
1.0Sample SP116
0.0
0.2
0.4
0.6
0.8
1.0Sample SP119
0.0
0.2
0.4
0.6
0.8
1.0Sample SP122
0.0
0.2
0.4
0.6
0.8
1.0Sample SP134
0.0
0.2
0.4
0.6
0.8
1.0Sample SP144
0.0
0.2
0.4
0.6
0.8
1.0 Sample SP29
0.0
0.2
0.4
0.6
0.8
1.0Sample SP37
0.0
0.2
0.4
0.6
0.8
1.0Sample SP84
0.0
0.2
0.4
0.6
0.8
1.0Sample B6
GL
SiO2
GL
SiO2
63.00 76.0365.73 71.73 74.01
Glass Composition69.07
0 50 100 150 200 250 0 50 100 150 200 250
63.00 76.0365.73 71.73 74.01
Glass Composition69.07
No
rmal
ized
Fre
qu
ency
No
rmal
ized
Fre
qu
ency
No
rmal
ized
Fre
qu
ency
No
rmal
ized
Fre
qu
ency
No
rmal
ized
Fre
qu
ency
Vesicles
No compositiondetected
SiO =71.802
SiO =70.102
SiO =74.202
SiO =70.002
SiO =70.702
SiO =70.052
SiO =72.602
SiO =74.102
SiO =71.452
SiO =71.002
j
d
a
c
b
e f
g h
i
Fig. 13 SiO2 histogramscalculated for the 3D volumesof reconstructed samples. Thevalue of SiO2 corresponding tothe maximum value ofhistograms is also indicated
12
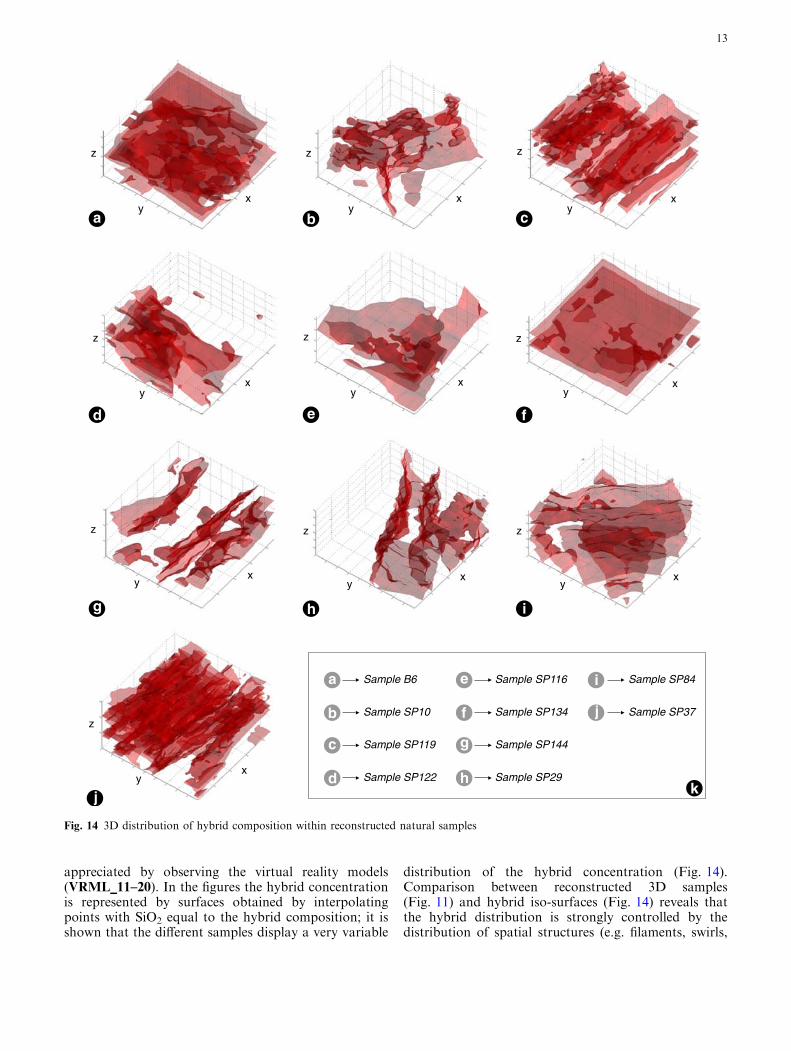
appreciated by observing the virtual reality models(VRML_11–20). In the figures the hybrid concentrationis represented by surfaces obtained by interpolatingpoints with SiO2 equal to the hybrid composition; it isshown that the different samples display a very variable
distribution of the hybrid concentration (Fig. 14).Comparison between reconstructed 3D samples(Fig. 11) and hybrid iso-surfaces (Fig. 14) reveals thatthe hybrid distribution is strongly controlled by thedistribution of spatial structures (e.g. filaments, swirls,
j
xy
z
d
a cb
e f
g h i
xy
z
xy
z
xy
z
xy
z
xy
z
xy
z
xy
z
xy
z
d
a
c
b
e
f
g
h
j
i
Sample SP10
Sample B6
Sample SP119
Sample SP122
Sample SP116
Sample SP134
Sample SP144
Sample SP29
Sample SP84
Sample SP37
k
xy
z
Fig. 14 3D distribution of hybrid composition within reconstructed natural samples
13
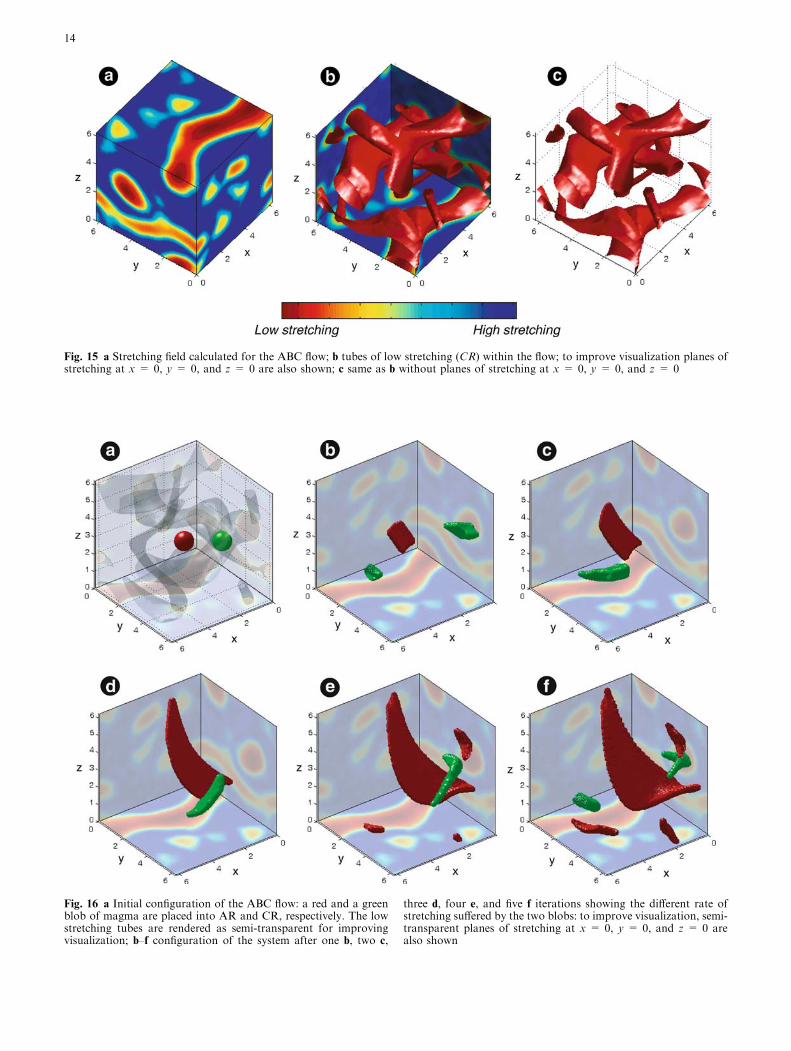
Fig. 15 a Stretching field calculated for the ABC flow; b tubes of low stretching (CR) within the flow; to improve visualization planes ofstretching at x = 0, y = 0, and z = 0 are also shown; c same as b without planes of stretching at x = 0, y = 0, and z = 0
Fig. 16 a Initial configuration of the ABC flow: a red and a greenblob of magma are placed into AR and CR, respectively. The lowstretching tubes are rendered as semi-transparent for improvingvisualization; b–f configuration of the system after one b, two c,
three d, four e, and five f iterations showing the different rate ofstretching suffered by the two blobs: to improve visualization, semi-transparent planes of stretching at x = 0, y = 0, and z = 0 arealso shown
14
etc.) in the samples. As an example, Fig. 11f shows asample constituted by planar surfaces of mafic magmainter-layered by felsic magma; the distribution of hybridcomposition in the sample (Fig. 14f) is also distributedalong these surfaces evidencing the role played by thepresence of wide surface areas in promoting chemicalexchanges between the two magmas. As a furtherexample, consider the sample in Fig. 11h: here the dis-tribution of the mafic and felsic magma follows anundulated morphology; the same morphology is fol-lowed by the hybrid concentration, as it can be seen inFig. 14h. Analogous considerations can be made for allother 3D samples. All these features can be fullyappreciated by using 3D animations and virtual realitymodels (i.e. MV_01–20 and VRML_01–20).
These results indicate that there is a strong controlof mixing dynamics on the production and spatialdistribution of the hybrid composition in the studiedsamples. Natural samples, however, represent only an
instantaneous picture of the mixing process and cannotbe used to extrapolate its time evolution. To this aimwe need to move from natural samples and considernumerical simulations. As discussed above, morpho-logical structures occurring within Upper Pollara juve-nile fragments are identical to those generated bychaotic mixing of fluids and, therefore, a 3D numericalmodel of chaotic mixing involving both advection (i.e.stretching and folding) and diffusion is presented in thenext sections.
3D numerical simulations of chaotic mixing of magmas
To study in detail how chaotic dynamics can be relatedto magma interaction processes, we simulated the pro-cess of dispersion of a mafic magma inside a felsic oneby using a 3D chaotic dynamical system consisting ofrepeated stretching and folding processes.
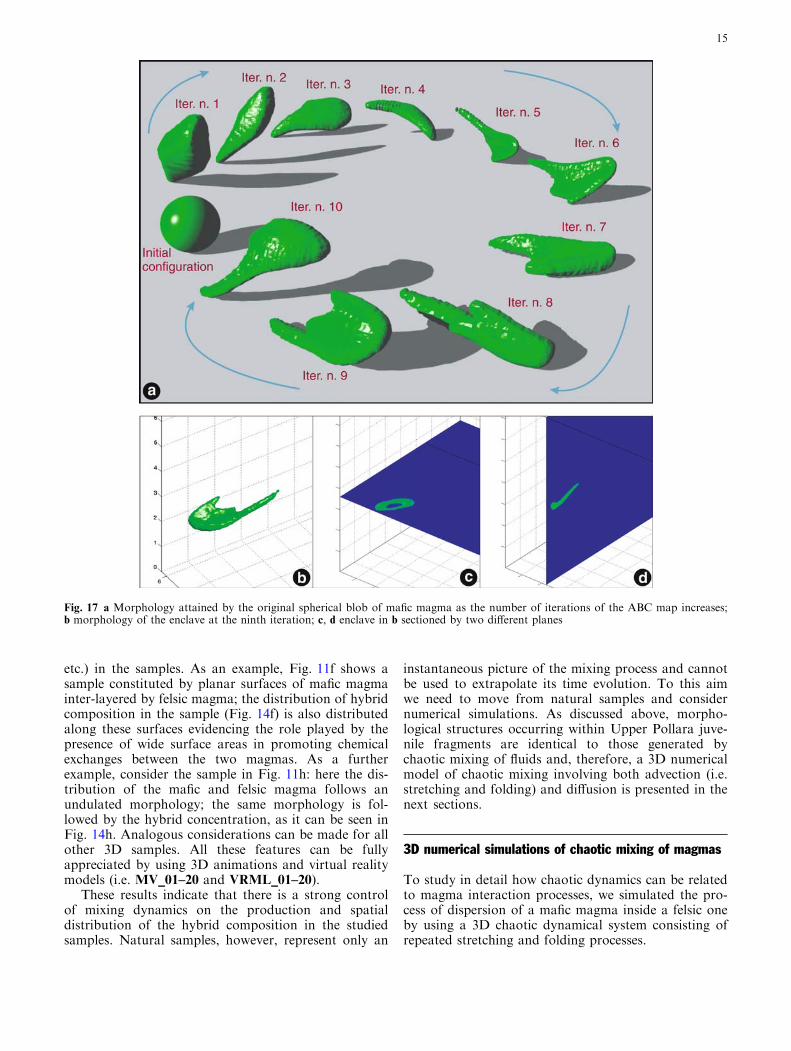
Fig. 17 a Morphology attained by the original spherical blob of mafic magma as the number of iterations of the ABC map increases;b morphology of the enclave at the ninth iteration; c, d enclave in b sectioned by two different planes
15
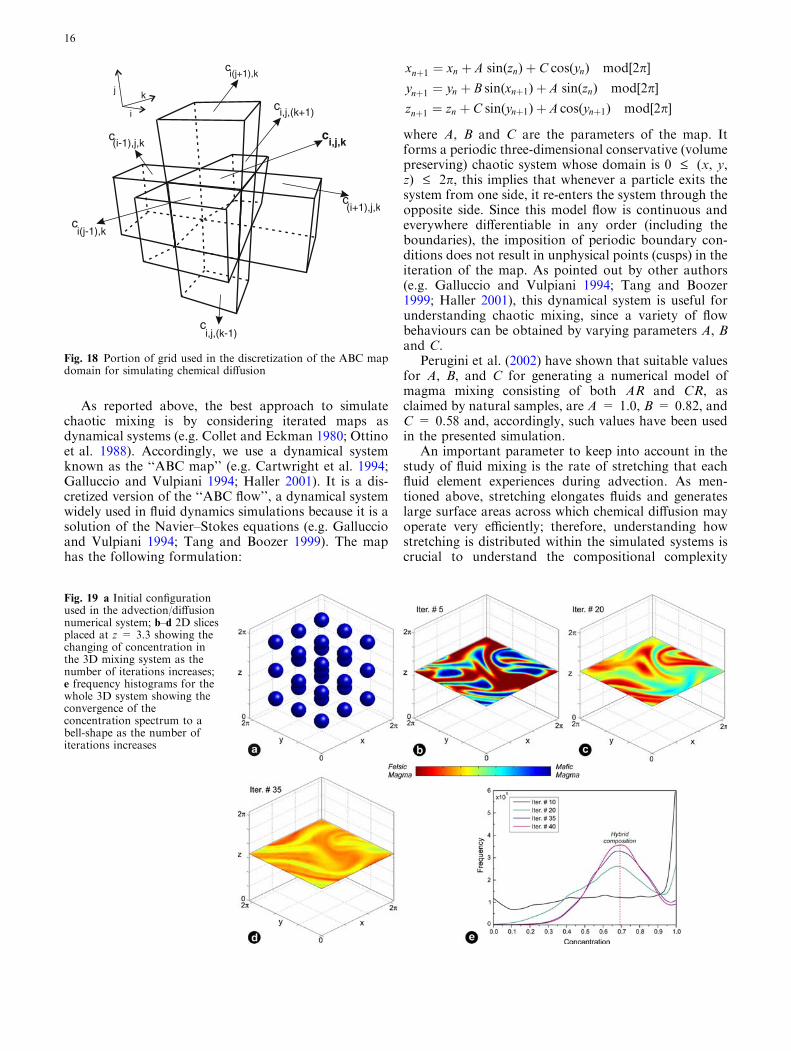
As reported above, the best approach to simulatechaotic mixing is by considering iterated maps asdynamical systems (e.g. Collet and Eckman 1980; Ottinoet al. 1988). Accordingly, we use a dynamical systemknown as the ‘‘ABC map’’ (e.g. Cartwright et al. 1994;Galluccio and Vulpiani 1994; Haller 2001). It is a dis-cretized version of the ‘‘ABC flow’’, a dynamical systemwidely used in fluid dynamics simulations because it is asolution of the Navier–Stokes equations (e.g. Galluccioand Vulpiani 1994; Tang and Boozer 1999). The maphas the following formulation:
xnþ1 ¼ xn þ A sin(zn)þ C cos(yn) mod[2p]
ynþ1 ¼ yn þ B sin(xnþ1)þ A sin(zn) mod[2p]
znþ1 ¼ zn þ C sin(ynþ1)þ A cos(ynþ1) mod[2p]
where A, B and C are the parameters of the map. Itforms a periodic three-dimensional conservative (volumepreserving) chaotic system whose domain is 0 £ (x, y,z) £ 2p, this implies that whenever a particle exits thesystem from one side, it re-enters the system through theopposite side. Since this model flow is continuous andeverywhere differentiable in any order (including theboundaries), the imposition of periodic boundary con-ditions does not result in unphysical points (cusps) in theiteration of the map. As pointed out by other authors(e.g. Galluccio and Vulpiani 1994; Tang and Boozer1999; Haller 2001), this dynamical system is useful forunderstanding chaotic mixing, since a variety of flowbehaviours can be obtained by varying parameters A, Band C.
Perugini et al. (2002) have shown that suitable valuesfor A, B, and C for generating a numerical model ofmagma mixing consisting of both AR and CR, asclaimed by natural samples, are A = 1.0, B = 0.82, andC = 0.58 and, accordingly, such values have been usedin the presented simulation.
An important parameter to keep into account in thestudy of fluid mixing is the rate of stretching that eachfluid element experiences during advection. As men-tioned above, stretching elongates fluids and generateslarge surface areas across which chemical diffusion mayoperate very efficiently; therefore, understanding howstretching is distributed within the simulated systems iscrucial to understand the compositional complexity
c(i+1),j,k
ci,j,k
c
ci(j+1),k
c(i-1),j,k
c
i,j,(k-1)c
i(j-1),k
i,j,(k+1)
j k
i
Fig. 18 Portion of grid used in the discretization of the ABC mapdomain for simulating chemical diffusion
Fig. 19 a Initial configurationused in the advection/diffusionnumerical system; b–d 2D slicesplaced at z = 3.3 showing thechanging of concentration inthe 3D mixing system as thenumber of iterations increases;e frequency histograms for thewhole 3D system showing theconvergence of theconcentration spectrum to abell-shape as the number ofiterations increases
16
generated by mixing. The stretching field within theABC map has been calculated by following the variationin length of an infinitesimal vector I as it is advected bythe flow (see Liu et al. 1994a for details). This variationis given by:
dIdn¼ (rv)I ; I ¼ I0 at n ¼ 0:
The stretching undergone by the vector is defined ask = I/I0 (Liu et al. 1994a). k is calculated by consideringa set of 22,500 initial vectors located on each cell of the150 · 150 · 150 grid used to perform numerical simula-tions, after 100 iterations of the map. Figure 15a displaysthe distribution of stretching within the ABC flow andshows the coexistence of CR (red in colour) and AR (bluein colour). In particular, the 3D models show that lowstretching regions (CR) are formed by tubes (Fig. 15b, c)passing through the 3D volume; these are surrounded byhigh stretching regions (AR), indicating that a largevariability of mixing dynamics characterize the system.The distribution of stretching in the ABC map and thelocation of low stretching regions can be explored inter-actively by using 3D movies (MV_21 and MV_22) andvirtual reality models (VRML_21 and VRML _22).
Chaotic advection
The effect of AR and CR on the deformation of magmasin the simulated system is shown in Fig. 16b–f for two
spherical portions of mafic magma positioned initiallyinto CR (in green colour) and AR (in red colour),respectively (Fig. 16a; MV_23 and VRML_23). Thechoice of using initially spherical blobs of mafic magmais motivated by the observation that the most poorlymingled magmas are characterised by blobs of maficmagma in a felsic host (e.g. Blake and Fink 2000; Bacon1986). Then, this initial configuration fits well with fieldobservations in which the mingling process has been‘‘frozen’’ at its initial stages.
Figure 16b–f shows that the blob in AR undergoesstrong deformation generating a wide surface, whereasthe blob in CR maintains a globular morphology expe-riencing lower deformation. These features can be ob-served and explored interactively by using 3D movies(MV_24–28) and virtual reality models (VRML_24–28).Perugini et al. (2003a) suggested that AR and CR playan important role in magma mixing processes in that ARare volumes of magmatic system where efficient mixingdynamics may promote fast hybridization of magmas(see below), whereas CR are volumes in which magmaticenclaves, commonly observed in both plutonic andvolcanic rocks, are generated. Magmatic enclavesattracted the attention of many researchers since theyare, especially in the plutonic environment (where theyare known as Mafic Microgranular Enclaves, MME, e.g.Didier and Barbarin 1991), the only portions of mag-matic system where potential information about the‘‘original’’ mafic magma can be gained. In addition,several authors suggested that enclave morphologies
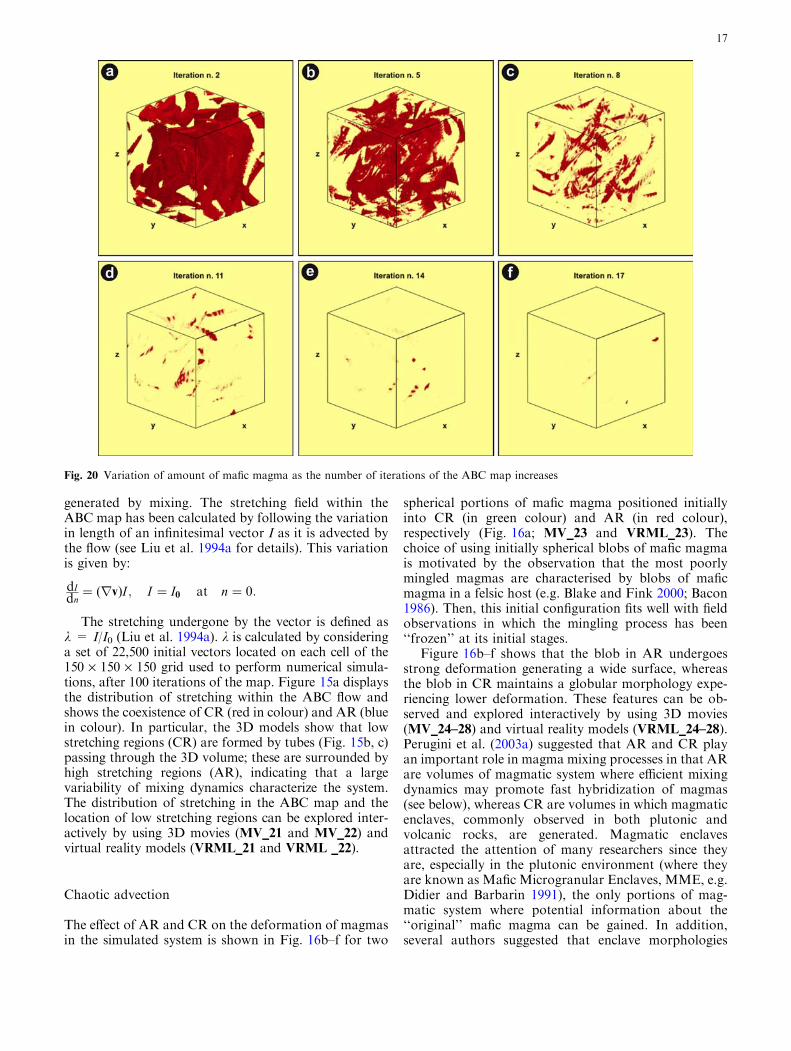
Fig. 20 Variation of amount of mafic magma as the number of iterations of the ABC map increases
17
may be utilised to reconstruct the deformation sufferedby the different portions of magmatic system and,therefore, they may be used as dynamic markers (e.g.Paterson et al. 2004; Ventura 2004). Thus, understand-ing the deformation that enclaves may have suffered intime by the action of advection dynamics is importantand some additional discussion may be useful. On thisrespect, Fig. 17a shows the variation of morphology ofthe originally spherical blob of mafic magma as thenumber of iterations of the ABC map increases. Inter-active visualization of individual 3D shapes attained bythe enclave, as well as a fly-through animation across allenclave morphologies can be made by using 3D movies(MV_29–39) and virtual reality models (VRML_29–39).It is shown that the enclave behaves as a pulsating masschanging morphology iteration after iteration, but
always maintaining its coherent structure. In some casesthe enclave appears to be stretched, flattened, or folded,until its morphology is partially recovered in the fol-lowing iteration. Regarding the enclave shown inFig. 17, after some iterations its morphology acquires aspoon-like shape (Fig. 17b), a feature due to the com-bined action of rotational and weakly extensional com-ponents of the flow in CR. Since usually our observationof enclaves in constrained to 2D views, it is interesting todiscuss how such an enclave would appear if observedon 2D outcrops. To this aim, the morphology of theenclave can be virtually sliced by 2D planes and theresulting morphology can be visualized. As an example,Fig. 17c, d show the enclave (at the ninth iteration,Fig. 17b) sectioned by two different orthogonal planes.In one case the outcrop would display an enclave with a
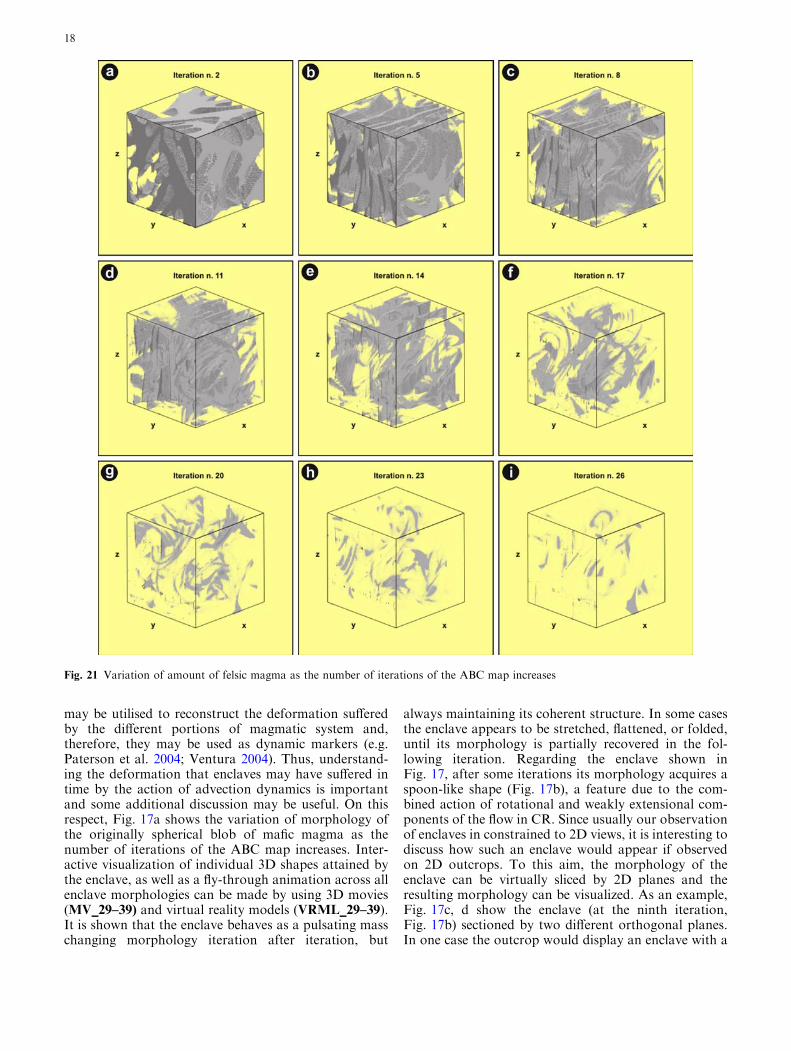
Fig. 21 Variation of amount of felsic magma as the number of iterations of the ABC map increases
18
ring-like shape (Fig. 17c) whereas, in the other case, afilament-like structure would be observed (Fig. 17d). Byobserving such structures during field work one iscommonly tempted to give them a dynamic significance,for instance regarding pluton assembly processes,emplacement style, dynamics of mixing, etc. In the caseof Fig. 17c, for instance, it could be said that a portionof felsic magma penetrated the enclave during mixingand discussions could be made about the possible pro-cesses inducing such a geometric configuration, and thepotential implications on the geochemical significance ofthe enclave. Regarding the filament structure inFig. 17d, instead, it could be argued that the observedportion of magma volume experienced some shear strainand the enclave morphology could be used to performsome quantitative kinematic analyses.
As we know from the true shape of the enclave(Fig. 17b), all these hypotheses are only speculationsand a careful field work should be always performed toavoid optical aberrations associated to 2D outcrops.
Chaotic advection and chemical diffusion
The above results provide information on the flow fieldsacting during advection of magmas and their influenceon the morphology of generated structures. However,physical dispersion and chemical processes cannot bethought to act independently. In general, the higher thephysical dispersion, the higher the chemical exchanges,since magmas are more easily carried into contact (e.g.Ottino 1990).
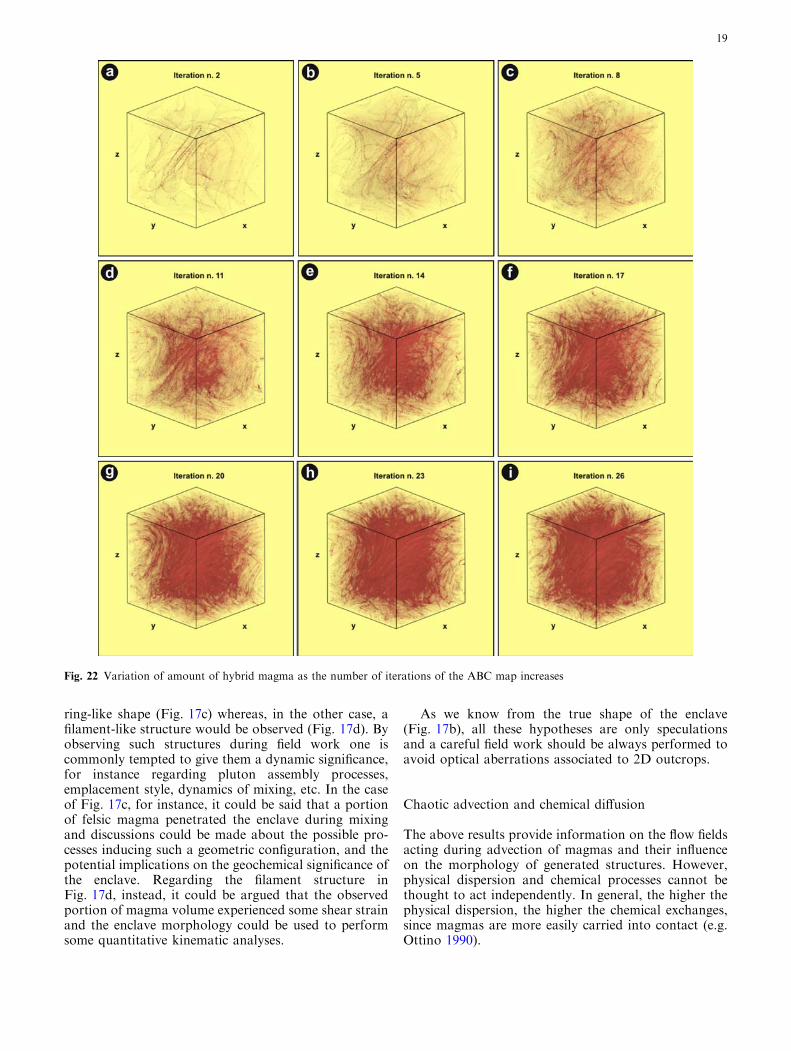
Fig. 22 Variation of amount of hybrid magma as the number of iterations of the ABC map increases
19
To simulate the onset of chemical diffusion processesduring magma interaction we coupled the ABC mapnumerical model of chaotic advection with chemicaldiffusion processes by using the algorithmic approachdeveloped by Pierrehumbert (1995), but in 3D (Fig. 18).
We defined a continuous concentration field c(x,y,z),and spatially discretised it to a regular 3D gridcijk = c(xi,yj,zk). The simulation was performed byusing the initial configuration of Fig. 19 where thespherical blobs of mafic magma have a concentrationequal to zero, whereas the host felsic magma has aconcentration equal to one. Spherical blobs have beenhomogeneously distributed within the 3D volume. Themap was first used to rearrange c(x,y,z) through map-ping (x,y,z) and re-interpolating to the grid.
This iteration was followed by the diffusion step:
cijk ¼ (1� Adiff) cijk þ1
6Adiff [cðiþ1Þjk þ cði�1Þjk þ ciðjþ1Þk
þ ciðj�1Þk þ cijðkþ1Þ þ cijðk�1Þ]
where 0 < Adiff < 1 plays the role of the diffusion coef-ficient. During this step, cijk = c(xi,yj,zk) is updated tonew values ranging from zero to one according to thediffusion that each cell underwent calculated using theabove equation (Fig. 18). After several iterations of themap coupled with the diffusion step, the concentrationfield c(x,y,z) on the plane will have changed. Since thefocus here is on the relative difference in the rate ofchemical diffusion in relationship to variability of flow
0 4 8 12 16 20 24 28 32 36 401E-6
1E-5
1E-4
1E-3
0.01
0.1
1
Hybrid compositionOriginal mafic magmaOriginal felsic magma
Vol
ume
frac
tion
Numberof Iterations
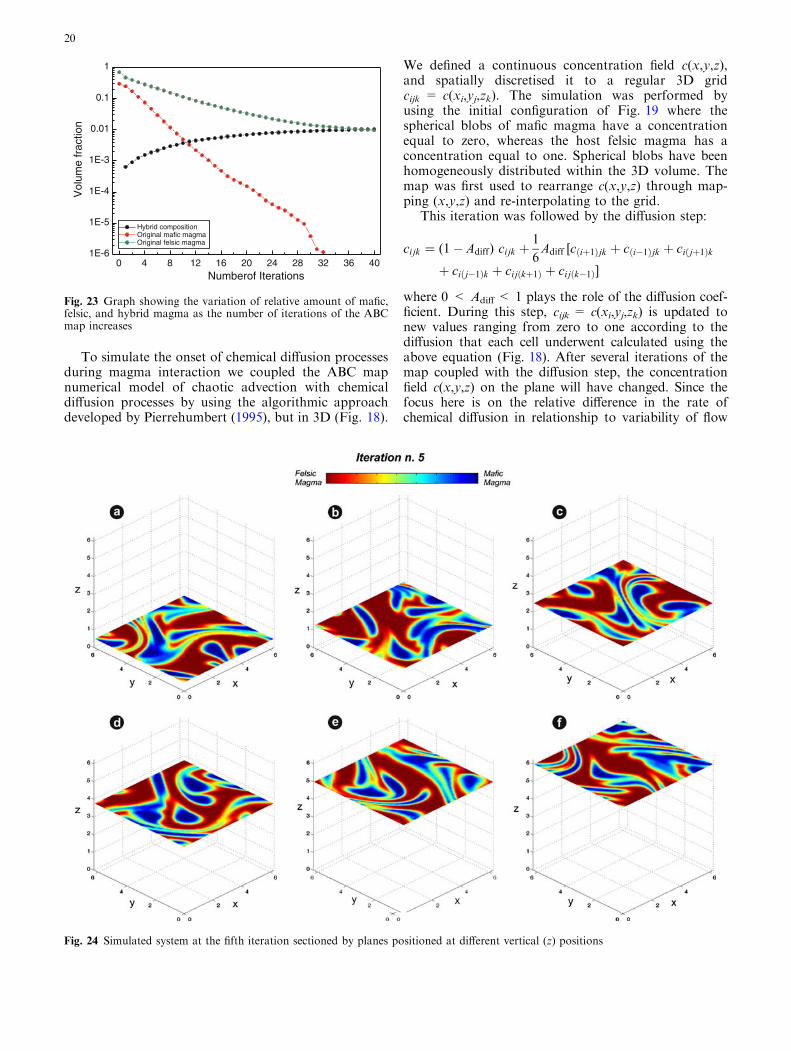
Fig. 23 Graph showing the variation of relative amount of mafic,felsic, and hybrid magma as the number of iterations of the ABCmap increases
Fig. 24 Simulated system at the fifth iteration sectioned by planes positioned at different vertical (z) positions
20
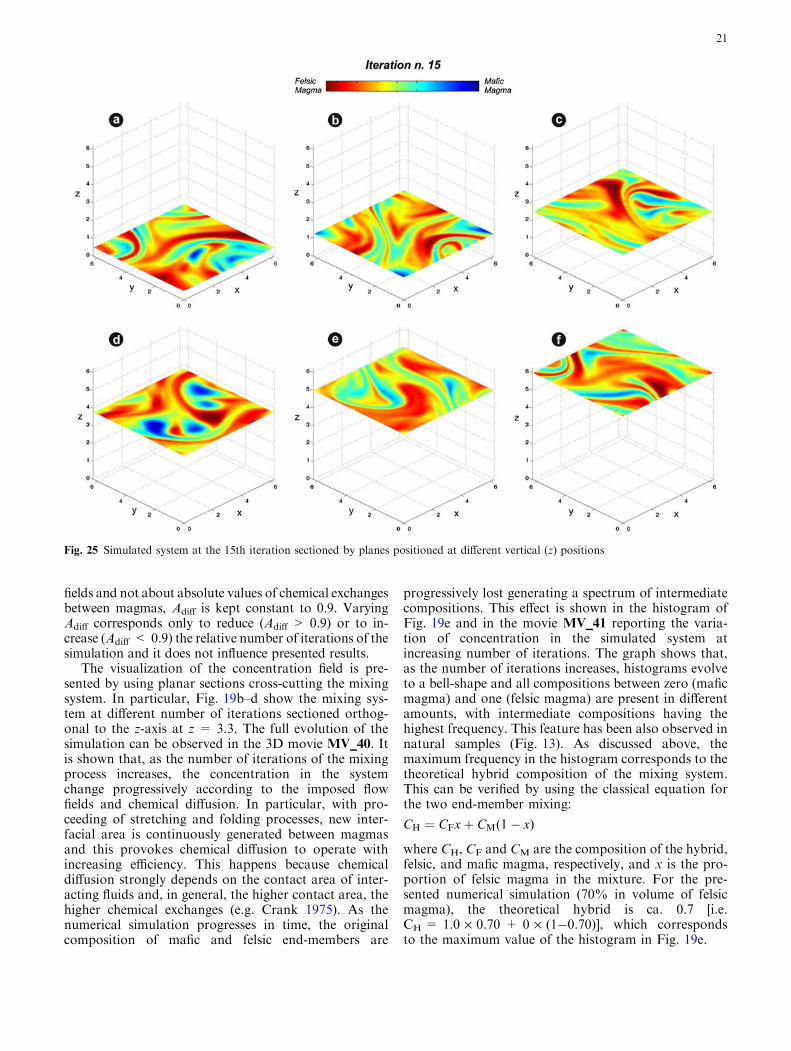
fields and not about absolute values of chemical exchangesbetween magmas, Adiff is kept constant to 0.9. VaryingAdiff corresponds only to reduce (Adiff > 0.9) or to in-crease (Adiff < 0.9) the relative number of iterations of thesimulation and it does not influence presented results.
The visualization of the concentration field is pre-sented by using planar sections cross-cutting the mixingsystem. In particular, Fig. 19b–d show the mixing sys-tem at different number of iterations sectioned orthog-onal to the z-axis at z = 3.3. The full evolution of thesimulation can be observed in the 3D movie MV_40. Itis shown that, as the number of iterations of the mixingprocess increases, the concentration in the systemchange progressively according to the imposed flowfields and chemical diffusion. In particular, with pro-ceeding of stretching and folding processes, new inter-facial area is continuously generated between magmasand this provokes chemical diffusion to operate withincreasing efficiency. This happens because chemicaldiffusion strongly depends on the contact area of inter-acting fluids and, in general, the higher contact area, thehigher chemical exchanges (e.g. Crank 1975). As thenumerical simulation progresses in time, the originalcomposition of mafic and felsic end-members are
progressively lost generating a spectrum of intermediatecompositions. This effect is shown in the histogram ofFig. 19e and in the movie MV_41 reporting the varia-tion of concentration in the simulated system atincreasing number of iterations. The graph shows that,as the number of iterations increases, histograms evolveto a bell-shape and all compositions between zero (maficmagma) and one (felsic magma) are present in differentamounts, with intermediate compositions having thehighest frequency. This feature has been also observed innatural samples (Fig. 13). As discussed above, themaximum frequency in the histogram corresponds to thetheoretical hybrid composition of the mixing system.This can be verified by using the classical equation forthe two end-member mixing:
CH ¼ CFxþ CM(1� x)
where CH, CF and CM are the composition of the hybrid,felsic, and mafic magma, respectively, and x is the pro-portion of felsic magma in the mixture. For the pre-sented numerical simulation (70% in volume of felsicmagma), the theoretical hybrid is ca. 0.7 [i.e.CH = 1.0 · 0.70 + 0 · (1�0.70)], which correspondsto the maximum value of the histogram in Fig. 19e.
Fig. 25 Simulated system at the 15th iteration sectioned by planes positioned at different vertical (z) positions
21
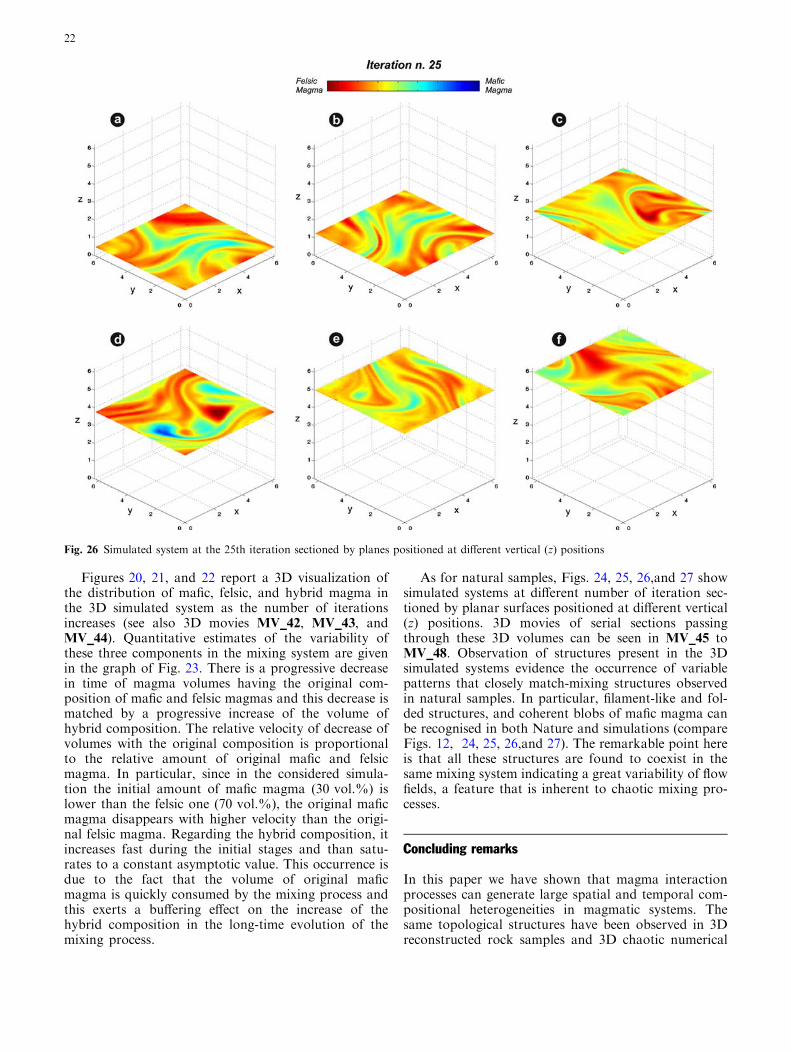
Figures 20, 21, and 22 report a 3D visualization ofthe distribution of mafic, felsic, and hybrid magma inthe 3D simulated system as the number of iterationsincreases (see also 3D movies MV_42, MV_43, andMV_44). Quantitative estimates of the variability ofthese three components in the mixing system are givenin the graph of Fig. 23. There is a progressive decreasein time of magma volumes having the original com-position of mafic and felsic magmas and this decrease ismatched by a progressive increase of the volume ofhybrid composition. The relative velocity of decrease ofvolumes with the original composition is proportionalto the relative amount of original mafic and felsicmagma. In particular, since in the considered simula-tion the initial amount of mafic magma (30 vol.%) islower than the felsic one (70 vol.%), the original maficmagma disappears with higher velocity than the origi-nal felsic magma. Regarding the hybrid composition, itincreases fast during the initial stages and than satu-rates to a constant asymptotic value. This occurrence isdue to the fact that the volume of original maficmagma is quickly consumed by the mixing process andthis exerts a buffering effect on the increase of thehybrid composition in the long-time evolution of themixing process.
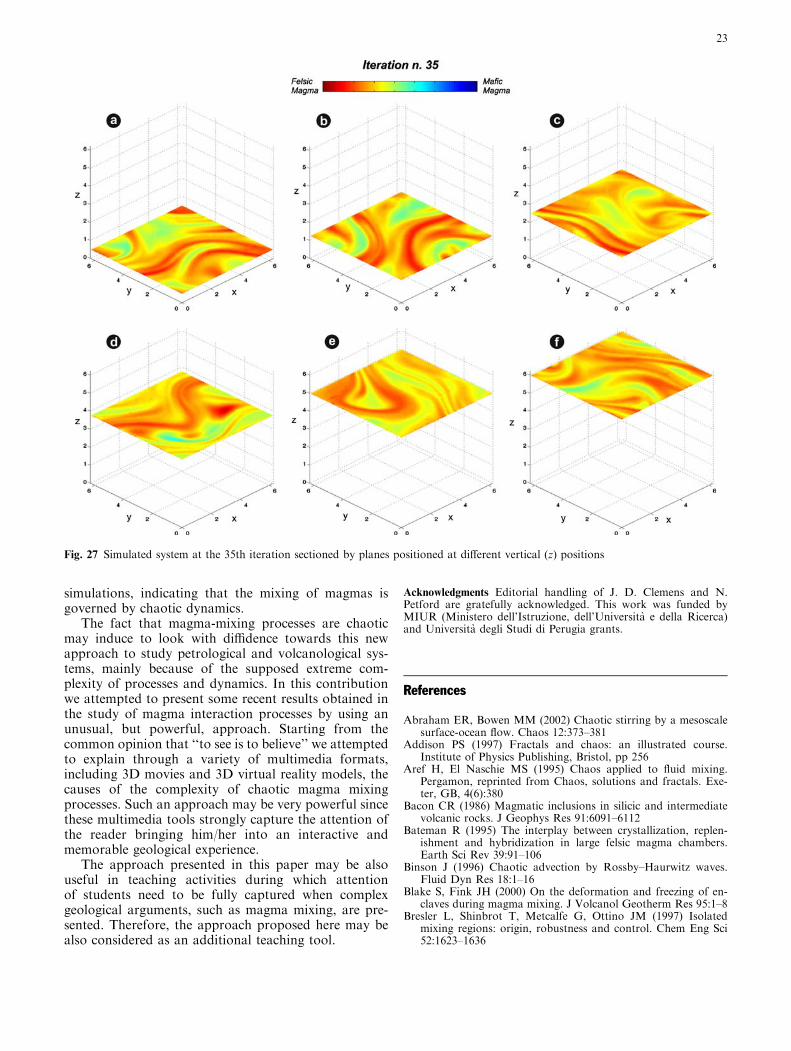
As for natural samples, Figs. 24, 25, 26,and 27 showsimulated systems at different number of iteration sec-tioned by planar surfaces positioned at different vertical(z) positions. 3D movies of serial sections passingthrough these 3D volumes can be seen in MV_45 toMV_48. Observation of structures present in the 3Dsimulated systems evidence the occurrence of variablepatterns that closely match-mixing structures observedin natural samples. In particular, filament-like and fol-ded structures, and coherent blobs of mafic magma canbe recognised in both Nature and simulations (compareFigs. 12, 24, 25, 26,and 27). The remarkable point hereis that all these structures are found to coexist in thesame mixing system indicating a great variability of flowfields, a feature that is inherent to chaotic mixing pro-cesses.
Concluding remarks
In this paper we have shown that magma interactionprocesses can generate large spatial and temporal com-positional heterogeneities in magmatic systems. Thesame topological structures have been observed in 3Dreconstructed rock samples and 3D chaotic numerical
Fig. 26 Simulated system at the 25th iteration sectioned by planes positioned at different vertical (z) positions
22
simulations, indicating that the mixing of magmas isgoverned by chaotic dynamics.
The fact that magma-mixing processes are chaoticmay induce to look with diffidence towards this newapproach to study petrological and volcanological sys-tems, mainly because of the supposed extreme com-plexity of processes and dynamics. In this contributionwe attempted to present some recent results obtained inthe study of magma interaction processes by using anunusual, but powerful, approach. Starting from thecommon opinion that ‘‘to see is to believe’’ we attemptedto explain through a variety of multimedia formats,including 3D movies and 3D virtual reality models, thecauses of the complexity of chaotic magma mixingprocesses. Such an approach may be very powerful sincethese multimedia tools strongly capture the attention ofthe reader bringing him/her into an interactive andmemorable geological experience.
The approach presented in this paper may be alsouseful in teaching activities during which attentionof students need to be fully captured when complexgeological arguments, such as magma mixing, are pre-sented. Therefore, the approach proposed here may bealso considered as an additional teaching tool.
Acknowledgments Editorial handling of J. D. Clemens and N.Petford are gratefully acknowledged. This work was funded byMIUR (Ministero dell’Istruzione, dell’Universita e della Ricerca)and Universita degli Studi di Perugia grants.
References
Abraham ER, Bowen MM (2002) Chaotic stirring by a mesoscalesurface-ocean flow. Chaos 12:373–381
Addison PS (1997) Fractals and chaos: an illustrated course.Institute of Physics Publishing, Bristol, pp 256
Aref H, El Naschie MS (1995) Chaos applied to fluid mixing.Pergamon, reprinted from Chaos, solutions and fractals. Exe-ter, GB, 4(6):380
Bacon CR (1986) Magmatic inclusions in silicic and intermediatevolcanic rocks. J Geophys Res 91:6091–6112
Bateman R (1995) The interplay between crystallization, replen-ishment and hybridization in large felsic magma chambers.Earth Sci Rev 39:91–106
Binson J (1996) Chaotic advection by Rossby–Haurwitz waves.Fluid Dyn Res 18:1–16
Blake S, Fink JH (2000) On the deformation and freezing of en-claves during magma mixing. J Volcanol Geotherm Res 95:1–8
Bresler L, Shinbrot T, Metcalfe G, Ottino JM (1997) Isolatedmixing regions: origin, robustness and control. Chem Eng Sci52:1623–1636
Fig. 27 Simulated system at the 35th iteration sectioned by planes positioned at different vertical (z) positions
23
Calanchi N, De Rosa R, Mazzuoli R, Ricci Lucchi F, Rossi PL,Santacroce R (1987) L’attivita’ del centro di Pollara (Salina,Isole Eolie). Boll. GNV, pp187–213
Calanchi N, De Rosa R, Mazzuoli R, Rossi PL, Santacroce R,Ventura G (1993) Silicic magma entering a basaltic magmachamber: eruptive dynamics and magma mixing—an examplefrom Salina (Aeolian Islands, Southern Tyrrhenian Sea). BullVolcanol 55:504–522
Cartwright JHE, Feingold M, Piro O (1994) Passive scalars andthree-dimensional Liouvillian maps. Physica D 76:22–33
Cerbelli S, Zalc JM, Muzzio FJ (2000) The evolution of materiallines curvature in deterministic chaotic flows. Chem Eng Sci55:363–371
Collet P,Eckman JP (1980) Iteratedmapson the interval as dynamicalsystems. Progress in physics. Birkhauser, Basel, pp 256
Crank J (1975) The mathematics of diffusion. Clarendon, Oxford,pp 424
De Campos CP, Dingwell DB, Fehr KT (2004) Decoupled con-vection cells from mixing experiments with alkaline melts fromPhlegrean fields. Chem Geol 213:227–251
De Rosa R (1999) Compositional modes in the ash fraction of somemodern pyroclastic deposits: their determination and signifi-cance. Bull Volcanol 3:162–173
De Rosa R, Mazzuoli R, Rossi PL, Santacroce R, Ventura G (1989)Nuovi dati ed ipotesi per la ricostruzione della storia eruttivadell’Isola di Salina (Isole Eolie). Boll GNV-CNR 2:791–809
De Rosa R, Donato P, Ventura G (2002) Fractal analysis ofmingled/mixed magmas: an example from the Upper Pollaraeruption (Salina Island, southern Tyrrhenian Sea, Italy). Lithos65:299–311
De Rosa R, Guillou H, Mazzuoli R, Ventura G (2003) New Un-spiked K-Ar ages of volcanic rocks of the central and westernsector of the Aeolian Islands: reconstruction of the volcanicstages. J Volcanol Geotherm Res 120:161–178
Denison C, Carlson WD (1997) Three-dimensional quantitativetextural analysis of metamorphic rocks using high-resolutioncomputed X-ray tomography: part II. Application to naturalsamples. J Met Geol 15:45–58
Didier J, Barbarin B (1991) Enclaves and granite petrology,developments in petrology, 13. Elsevier, Amsterdam, pp 625
Eichelberger JC (1990). Vesiculation of mafic magma duringreplenishment of silicic magma reservoir. Nature 288:446–450
Flinders J, Clemens JD (1996) Non-linear dynamics, chaos, com-plexity and enclaves in granitoid magmas. Trans R Soc Edin-burgh Earth Sci 87:225–232
Fountain GO, Khakhar DV, Ottino JM (1998) Visualization ofthree-dimensional chaos. Science 281:683–686
Galluccio S, Vulpiani A (1994) Stretching of material lines andsurfaces in systems with Lagrangian chaos. Physica A 212:75–98
Gillot PY (1987) Histoire volcanique des Iles Eoliennes: arc insu-laire or complexe orogenique anulaire? DT IGAL 11:35–42
Gonnermann HM, Manga M (2005) Flow banding in obsidian: arecord of evolving textural heterogeneity during magmadeformation. Earth Planet Sci Lett 236:135–147
Haller G (2001) Distinguished material surfaces and coherent struc-tures in three-dimensional fluid flows. Physica D 149:248–277
Keller J (1980) The Island of Salina. Rend Soc It Miner Petrol36:489–524
Lesher CE (1994) Kinetics of Sr and Nd exchange in silicate liquids:theory, experiments, and application to uphill diffusion, isoto-pic equilibration, and irreversible mixing of magmas. J GeophysRes 99:9585–9604
Liu M, Muzzio FJ, Peskin RL (1994a) Quantification of mixing inaperiodic chaotic flows. Chaos Solitions Fractals 4:869–893
Liu M, Peskin RL, Muzzio FJ, Leong CW (1994b) Structure of thestretching field in chaotic cavity flows. Am Inst Chem EnginAIChE J 40:1273–1286
Lorenz E (1963) Deterministic non-periodic flow. J Atm Sci20:130–141
Mandelbrot BB (1982) The fractal geometry of nature. W.H.Freeman, New York, pp 480
Marschallinger R (1998) A method for three-dimensional recon-struction of macroscopic features in geological materials. CompGeosci 24:875–883
McCauley JL (1993) Chaos, dynamics and fractals: an algorithmicapproach to deterministic chaos. Cambridge University Press,Cambridge, p 347
Metcalfe G, Bina CR, Ottino JM (1995) Kinematic considerationsfor mantle mixing. Geophys Res Lett 22:743–746
Ottino JM (1990) Mixing, chaotic advection and turbulence. AnnRev Fluid Mech 22:207–254
Ottino JM, Leong CW, Rising H, Swanson PD (1988) Morpho-logical structures produced by mixing in chaotic flows. Nature333:419–425
Ottino JM, Muzzio FJ, Tjahjadi M, Franjione JG, Jana SC, KuschHA (1993) Chaos, symmetry, and self-similarity: exploitingorder and disorder in mixing processes. Science 257:754–760
Paterson SR, Pignotta, Geoffrey S, Vernon RH (2004) The signif-icance of microgranitoid enclave shapes and orientations. JStruct Geol 26:1465–1481
Perugini D, Poli G, Gatta G (2002) Analysis and simulation ofmagma mixing processes in 3D. Lithos 65:313–330
Perugini D, Poli G, Mazzuoli R (2003a) Chaotic advection, fractalsand diffusion during mixing of magmas: evidence from lavaflows. J Volcanol Geotherm Res 124:255–279
Perugini D, Poli G, Christofides G, Eleftheriadis G (2003b) Magmamixing in the Sithonia Plutonic complex, Greece: evidence frommafic microgranular enclaves. Mineral Petrol 78:173–200
Perugini D, Ventura G, Petrelli M, Poli G (2004) Kinematic sig-nificance of morphological structures generated by mixing ofmagmas: a case study from Salina Island (Southern Italy).Earth Planet Sci Lett 222:1051–1066
Perugini D, Poli G, Valentini L (2005) Strange attractors in pla-gioclase oscillatory zoning: petrological implications. ContribMineral Petrol 149:482–497
Petford N, Bryon D, Atherton MP, Hunter RH (1993) Fractalanalysis in granitoid petrology—a means of quantifying irreg-ular grain morphologies. Eur J Mineral 5:593–598
Petrelli M, Perugini D, Poli G (2005) Time-scales of hybridisationof magmatic enclaves in regular and chaotic flow fields: petro-logic and volcanologic implications. Bull Volcanol 68(3):285–293
Pierrehumbert RT (1995) Tracer microstructures in the large-eddydominated regime. In: Aref H, El Naschie MS (eds) Chaosapplied to fluid mixing. Pergamon, reprinted from Chaos,solutions and fractals 4, 6, Exeter, G.B, pp 347–366
Poli G Perugini D (2002) Strange attractors in magmas: evidencefrom lava flows. Lithos 65:287–297
Poli G, Tommasini S, Halliday AN (1996) Trace elements andisotopic exchange during acid-basic magma interaction pro-cesses. Trans R Soc Edinb Earth Sci 87:225–232
Pugliese S, Petford N (2001) Reconstruction and visualisation ofmelt topology in veined microdiorite enclaves. Electron Geosci6, 1 (vol 6, article no. 3)
Snyder D (2000) Thermal effects of the intrusion of basaltic magmainto a more silicic magma chamber and implications for erup-tion triggering. Earth Planet Sci Lett 175:257–273
Tang XZ, Boozer AH (1999) A Lagrangian analysis of advection-diffusion equation for a three dimensional chaotic flow. PhysFluids 11:1418–1434
Turcotte DL (1992) Fractals and chaos in geology and geophysics.Cambridge University Press, Cambridge, p 412
Ventura G (2004) The strain path and kinematics of lava domes: anexample from Lipari (Aeolian Islands, Southern TyrrhenianSea, Italy). J Geophys Res 109 No.B1 doi:B0120310.1029 /2003JB002740
Wada K (1995) Fractal structure of heterogeneous ejecta from theMe-akan volcano, eastern Hokkaido, Japan: implications formixing mechanism in a volcanic conduit. J Volcanol GeothermRes 66:69–79
Welander P (1955) Studies on the general development of motion ina twodimensional, ideal fluid. Tellus 7:141–156
24


![Bubble growth processes in magma surrounded by an elastic ...zisin.geophys.tohoku.ac.jp/~sato/satoHP2012/... · magmas: isothermal case. J. Geophys. Res. 98, 22283–22307] to describe](https://img.pdfslide.net/doc/110x75/5f956e9b94e0dc462f7ed583/bubble-growth-processes-in-magma-surrounded-by-an-elastic-zisin-satosatohp2012.jpg)


![Explosive volcanism on Venus: Transient volcanic explosions · magmas [Basaltic Volcanism Study Project, 1981]. Even if a magma on Venus contains sufficient volatiles for the will](https://img.pdfslide.net/doc/110x75/5fd1a3e72b05ce448c253b02/explosive-volcanism-on-venus-transient-volcanic-explosions-magmas-basaltic-volcanism.jpg)