Embed Size (px)
Citation preview

A Vital Force in Our Nation’s Economy

32
Economic Impacts
Welcome to the Cleveland Clinic Economic Impact Report. It contains detailed information about the impact that Cleveland Clinic has made on local and national economies across the United States.
This year, Cleveland Clinic celebrates its 100th anniversary of providing quality healthcare services. Our mission is patient care, research and education. In addition, we are committed to continually improving the overall well-being of the communities we serve.
Everywhere we operate, we are a leading employer and an economic generator. We strive to invest in local businesses through the purchase of goods and services, and we help cities and neighborhoods thrive through tax revenues that support critical services and infrastructure.
Our recent economic study measured the impact of Cleveland Clinic at the state and national level. In 2019, Cleveland Clinic supported:
· 192,656 jobs nationally.
· $3.5 billion in federal taxes.
· 86,682 households in Ohio.
· $181.1 million in state and local taxes in Florida.
· $22 million in total labor income in Nevada.
During the COVID-19 pandemic, Cleveland Clinic has been a stabilizing economic influence. I am proud of the many ways we have been able to support our caregivers, their families, and the communities in which they live during this challenging time.
Thank you for your interest in Cleveland Clinic. More information on our organization, finances and community impact is available at clevelandclinic.org.
Sincerely,
Tomislav Mihaljevic, MD CEO and President, Cleveland Clinic
Tomislav Mihaljevic, MDCEO and President
Contents
Economic Impacts .......................... 3
Economic Impact Overviews
United States ......................... 4
Ohio ..................................... 6
Florida ................................ 11
Nevada ............................... 16
Study Methodology ........................ 19
Report Definitions ......................... 19
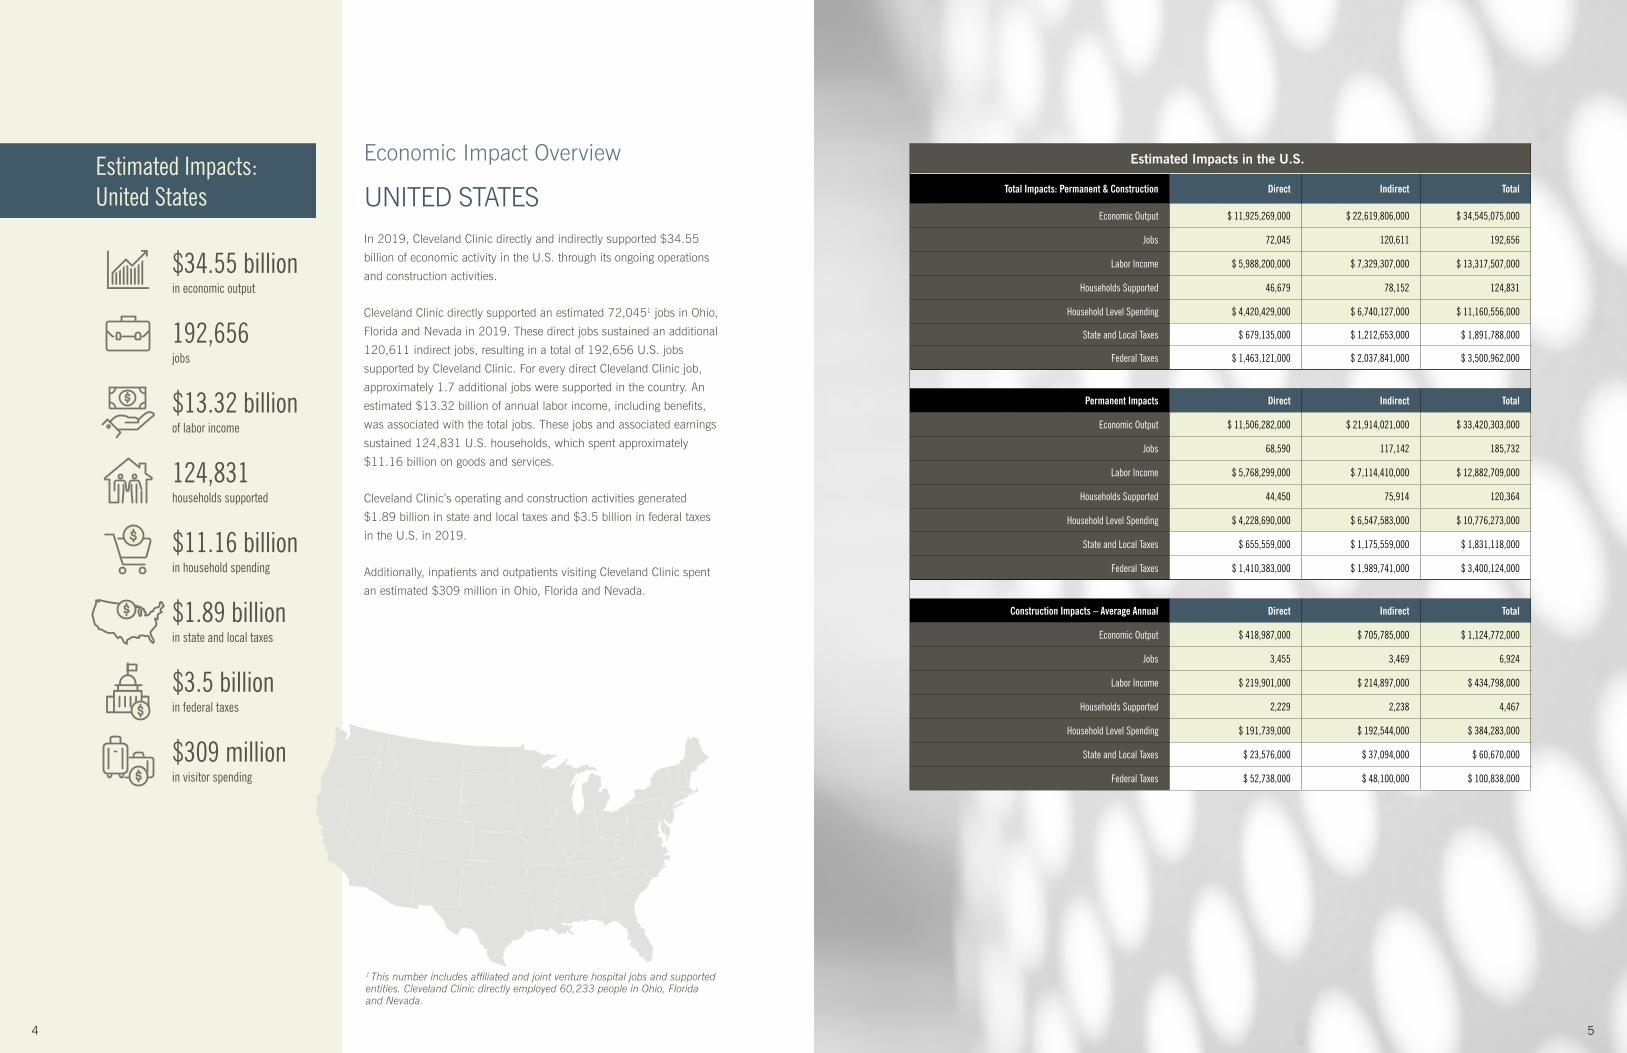
$34.55 billion in economic output
192,656 jobs
$13.32 billion of labor income
124,831 households supported
$11.16 billion in household spending
$1.89 billion in state and local taxes
$3.5 billion in federal taxes
$309 million in visitor spending
Estimated Impacts: United States
54
Estimated Impacts in the U.S.
Total Impacts: Permanent & Construction Direct Indirect Total
Economic Output $ 11,925,269,000 $ 22,619,806,000 $ 34,545,075,000
Jobs 72,045 120,611 192,656
Labor Income $ 5,988,200,000 $ 7,329,307,000 $ 13,317,507,000
Households Supported 46,679 78,152 124,831
Household Level Spending $ 4,420,429,000 $ 6,740,127,000 $ 11,160,556,000
State and Local Taxes $ 679,135,000 $ 1,212,653,000 $ 1,891,788,000
Federal Taxes $ 1,463,121,000 $ 2,037,841,000 $ 3,500,962,000
Permanent Impacts Direct Indirect Total
Economic Output $ 11,506,282,000 $ 21,914,021,000 $ 33,420,303,000
Jobs 68,590 117,142 185,732
Labor Income $ 5,768,299,000 $ 7,114,410,000 $ 12,882,709,000
Households Supported 44,450 75,914 120,364
Household Level Spending $ 4,228,690,000 $ 6,547,583,000 $ 10,776,273,000
State and Local Taxes $ 655,559,000 $ 1,175,559,000 $ 1,831,118,000
Federal Taxes $ 1,410,383,000 $ 1,989,741,000 $ 3,400,124,000
Construction Impacts – Average Annual Direct Indirect Total
Economic Output $ 418,987,000 $ 705,785,000 $ 1,124,772,000
Jobs 3,455 3,469 6,924
Labor Income $ 219,901,000 $ 214,897,000 $ 434,798,000
Households Supported 2,229 2,238 4,467
Household Level Spending $ 191,739,000 $ 192,544,000 $ 384,283,000
State and Local Taxes $ 23,576,000 $ 37,094,000 $ 60,670,000
Federal Taxes $ 52,738,000 $ 48,100,000 $ 100,838,000
Economic Impact Overview
UNITED STATESIn 2019, Cleveland Clinic directly and indirectly supported $34.55
billion of economic activity in the U.S. through its ongoing operations
and construction activities.
Cleveland Clinic directly supported an estimated 72,0451 jobs in Ohio,
Florida and Nevada in 2019. These direct jobs sustained an additional
120,611 indirect jobs, resulting in a total of 192,656 U.S. jobs
supported by Cleveland Clinic. For every direct Cleveland Clinic job,
approximately 1.7 additional jobs were supported in the country. An
estimated $13.32 billion of annual labor income, including benefits,
was associated with the total jobs. These jobs and associated earnings
sustained 124,831 U.S. households, which spent approximately
$11.16 billion on goods and services.
Cleveland Clinic’s operating and construction activities generated
$1.89 billion in state and local taxes and $3.5 billion in federal taxes
in the U.S. in 2019.
Additionally, inpatients and outpatients visiting Cleveland Clinic spent
an estimated $309 million in Ohio, Florida and Nevada.
1 This number includes affiliated and joint venture hospital jobs and supported entities. Cleveland Clinic directly employed 60,233 people in Ohio, Florida and Nevada.

76
In 2019, Cleveland Clinic directly and indirectly generated
$20.19 billion of economic activity in Northeast Ohio
through its ongoing operations and construction activities.
The nine-county region encompasses Cuyahoga, Lorain,
Lake, Ashtabula, Geauga, Portage, Summit, Medina and
Tuscarawas counties.
Cleveland Clinic directly supported an estimated 60,5612
people in Northeast Ohio in 2019. These direct jobs
sustained an additional 63,476 indirect jobs, resulting
in a total of 124,037 Northeast Ohio jobs supported by
Cleveland Clinic. An estimated $8.4 billion of annual labor
income, including benefits, was associated with the total
jobs. These jobs and associated earnings sustained 80,827
households in the region, which spent approximately $7.33
billion on goods and services.
Cleveland Clinic’s operating and construction activities
generated $1.17 billion in state and local taxes and $2.17
billion in federal taxes in 2019.
The organization supported the regional economy by
purchasing $887.2 million in goods and services from
Northeast Ohio companies. Additionally, inpatients and
outpatients visiting Cleveland Clinic spent an estimated
$281.7 million in the nine-county region.
Between 2017 and 2019, Cleveland Clinic invested an
average of $304.1 million per year in Northeast Ohio to
construct and improve facilities. This investment supported
nearly 3,859 construction and other jobs and an estimated
$239.7 million in total labor income annually. The
construction activity generated over $33.4 million in state
and local taxes and more than $49.9 million in federal taxes
per year.
2 This number includes affiliated and joint venture hospital jobs and supported entities. Cleveland Clinic directly employed 50,113 people in Northeast Ohio.
Economic Impact Overview
NORTHEAST OHIO REGION STATE OF OHIOIn 2019, Cleveland Clinic directly and indirectly supported $21.63 billion of economic activity in the state of Ohio through its ongoing operations and construction activities.
Cleveland Clinic, Ohio’s largest employer, directly supported an estimated 61,2213 jobs in Ohio in 2019. These direct jobs sustained an additional 71,801 indirect jobs, resulting in a total of 133,022 Ohio jobs supported by Cleveland Clinic. For every direct Cleveland Clinic job, approximately 1.2 additional jobs were supported in Ohio. An estimated $8.78 billion of annual labor income, including benefits, was associated with the total jobs. These jobs and associated earnings sustained 86,682 Ohio households, which spent approximately $7.84 billion on goods and services.
Cleveland Clinic’s operating and construction activities generated $1.27 billion in state and local taxes and $2.29 billion in federal taxes in 2019. Based on the Ohio Department of Education’s average expenditure per pupil for the 2018-2019 school year of $9,883, the permanent residential property taxes supported by the presence of Cleveland Clinic were enough to fund the educational costs of more than 51,500 K-12 public school students in Ohio.
The organization supported the state economy through the purchase of $2.34 billion in goods and services from Ohio companies. Additionally, inpatients and outpatients visiting Cleveland Clinic spent an estimated $281.7 million in the state of Ohio.
Between 2017 and 2019, Cleveland Clinic invested an average of $306 million per year in Ohio to construct and improve facilities. This investment supported nearly 4,192 construction and other jobs and generated an estimated $253.6 million in total labor income annually. The construction activity generated nearly $36.4 million in state and local taxes and almost $58.7 million in federal taxes per year.
Ohio3 This number includes affiliated and joint venture hospital jobs
and supported entities. Cleveland Clinic directly employed 50,572 people in Ohio.

$20.19 billion in economic output
124,037 jobs
$8.4 billion of labor income
80,827 households supported
$7.33 billion in household spending
$1.17 billion in state and local taxes
$2.17 billion in federal taxes
$281.7 million in visitor spending
$887.2 million in goods and services
Estimated Impacts: Northeast Ohio Region
$21.63 billion in economic output
133,022 jobs
$8.78 billion of labor income
86,682 households supported
$7.84 billion in household spending
$1.27 billion in state and local taxes
$2.29 billion in federal taxes
$281.7 million in visitor spending
$2.34 billion in goods and services
Estimated Impacts: State of Ohio
98

1110
Estimated Impacts in Ohio
Total Impacts: Permanent & Construction
Northeast Ohio Region State of Ohio
Direct Indirect Total Direct Indirect Total
Economic Output $ 10,067,994,000 $ 10,118,774,000 $ 20,186,768,000 $ 10,131,732,000 $ 11,496,398,000 $ 21,628,130,000
Jobs 60,561 63,476 124,037 61,221 71,801 133,022
Labor Income $ 5,003,962,000 $ 3,397,989,000 $ 8,401,951,000 $ 5,053,008,000 $ 3,728,756,000 $ 8,781,764,000
Households Supported 39,464 41,363 80,827 39,894 46,788 86,682
Household Level Spending $ 3,747,645,000 $ 3,582,160,000 $ 7,329,805,000 $ 3,788,038,000 $ 4,051,981,000 $ 7,840,019,000
Total State and Local Taxes $ 603,471,000 $ 571,097,000 $ 1,174,568,000 $ 613,022,000 $ 652,850,000 $ 1,265,872,000
State Personal Income Taxes $ 133,034,000 $ 79,862,000 $ 212,896,000 $ 134,416,000 $ 86,551,000 $ 220,967,000
Local Personal Income Taxes $ 92,234,000 $ 65,411,000 $ 157,645,000 $ 92,859,000 $ 71,219,000 $ 164,078,000
Residential Property Taxes $ 286,347,000 $ 225,800,000 $ 512,147,000 $ 289,381,000 $ 236,043,000 $ 525,424,000
Other State and Local Taxes $ 91,856,000 $ 200,024,000 $ 291,880,000 $ 96,366,000 $ 259,037,000 $ 355,403,000
Federal Taxes $ 1,220,305,000 $ 950,724,000 $ 2,171,029,000 $ 1,236,331,000 $ 1,049,868,000 $ 2,286,199,000
Permanent Impacts Direct Indirect Total Direct Indirect Total
Economic Output $ 9,763,889,000 $ 9,874,976,000 $ 19,638,865,000 $ 9,825,683,000 $ 11,209,228,000 $ 21,034,911,000
Jobs 58,129 62,049 120,178 58,685 70,145 128,830
Labor Income $ 4,844,348,000 $ 3,317,943,000 $ 8,162,291,000 $ 4,888,940,000 $ 3,639,211,000 $ 8,528,151,000
Households Supported 37,879 40,433 78,312 38,241 45,709 83,950
Household Level Spending $ 3,610,379,000 $ 3,501,619,000 $ 7,111,998,000 $ 3,644,883,000 $ 3,958,537,000 $ 7,603,420,000
Total State and Local Taxes $ 585,139,000 $ 556,018,000 $ 1,141,157,000 $ 594,040,000 $ 635,439,000 $ 1,229,479,000
State Personal Income Taxes $ 129,016,000 $ 77,913,000 $ 206,929,000 $ 130,304,000 $ 84,439,000 $ 214,743,000
Local Personal Income Taxes $ 89,161,000 $ 63,870,000 $ 153,031,000 $ 89,725,000 $ 69,509,000 $ 159,234,000
Residential Property Taxes $ 276,460,000 $ 220,724,000 $ 497,184,000 $ 279,071,000 $ 230,599,000 $ 509,670,000
Other State and Local Taxes $ 90,502,000 $ 193,511,000 $ 284,013,000 $ 94,940,000 $ 250,892,000 $ 345,832,000
Federal Taxes $ 1,187,046,000 $ 934,044,000 $ 2,121,090,000 $ 1,198,386,000 $ 1,029,158,000 $ 2,227,544,000
Construction Impacts – Average Annual Direct Indirect Total Direct Indirect Total
Economic Output $ 304,105,000 $ 243,798,000 $ 547,903,000 $ 306,049,000 $ 287,170,000 $ 593,219,000
Jobs 2,432 1,427 3,859 2,536 1,656 4,192
Labor Income $ 159,614,000 $ 80,046,000 $ 239,660,000 $ 164,068,000 $ 89,545,000 $ 253,613,000
Households Supported 1,585 930 2,515 1,653 1,079 2,732
Household Level Spending $ 137,266,000 $ 80,541,000 $ 217,807,000 $ 143,155,000 $ 93,444,000 $ 236,599,000
Total State and Local Taxes $ 18,332,000 $ 15,079,000 $ 33,411,000 $ 18,982,000 $ 17,411,000 $ 36,393,000
State Personal Income Taxes $ 4,018,000 $ 1,949,000 $ 5,967,000 $ 4,112,000 $ 2,112,000 $ 6,224,000
Local Personal Income Taxes $ 3,073,000 $ 1,541,000 $ 4,614,000 $ 3,134,000 $ 1,710,000 $ 4,844,000
Residential Property Taxes $ 9,887,000 $ 5,076,000 $ 14,963,000 $ 10,310,000 $ 5,444,000 $ 15,754,000
Other State and Local Taxes $ 1,354,000 $ 6,513,000 $ 7,867,000 $ 1,426,000 $ 8,145,000 $ 9,571,000
Federal Taxes $ 33,259,000 $ 16,680,000 $ 49,939,000 $ 37,945,000 $ 20,710,000 $ 58,655,000 Florida

1312
$4.12 billion in economic output
25,347 jobs
$1.66 billion of labor income
15,891 households supported
$1.4 billion in household spending
$181.1 million in state and local taxes
$428.6 million in federal taxes
$26.3 million in visitor spending
$190.3 million in goods and services
Estimated Impacts:State of FloridaSTATE OF FLORIDA
$3.95 billion in economic output
24,503 jobs
$1.62 billion of labor income
15,361 households supported
$1.35 billion in household spending
$172.8 million in state and local taxes
$414.4 million in federal taxes
$26.3 million in visitor spending
$133.3 million in goods and services
Estimated Impacts: Southeast Florida Region
Economic Impact Overview
SOUTHEAST FLORIDA REGION
In 2019, Cleveland Clinic directly and indirectly generated
$3.95 billion of economic activity in the Southeast Florida region
through its ongoing operations and construction activities. The
seven-county region encompasses Brevard, Indian River, St.
Lucie, Martin, Palm Beach, Broward and Miami-Dade counties.
All Cleveland Clinic Florida facilities are located in these
counties.
Cleveland Clinic directly supported an estimated 10,6684 jobs
in the Southeast Florida region in 2019. These direct jobs
sustained an additional 13,835 indirect jobs, resulting in a
total of 24,503 regional jobs supported by Cleveland Clinic.
An estimated $1.62 billion of annual labor income, including
benefits, was associated with the total jobs. These jobs and
associated earnings sustained 15,361 regional households,
which spent approximately $1.35 billion on goods and services.
Cleveland Clinic’s operating and construction activities generated
$172.8 million in state and local taxes and $414.4 million in
federal taxes in 2019.
The organization supported the regional economy through
purchasing $133.3 million in goods and services from
southeastern Florida companies. Additionally, inpatients and
outpatients visiting Cleveland Clinic spent an estimated $26.3
million in the region.
Between 2017 and 2019, Cleveland Clinic invested an average
of $112.9 million per year in the Southeast Florida region to
construct and improve facilities. This investment supported
nearly 1,461 construction and other jobs and an estimated
$83.8 million in total labor income annually. The construction
activity generated nearly $9.3 million in state and local taxes
and almost $22.2 million in federal taxes per year.
4 This number includes affiliated entities. Cleveland Clinic directly employed 9,513 people in the Florida Region.
In 2019, Cleveland Clinic directly and indirectly generated
$4.12 billion of economic activity in Florida through its ongoing
operations and construction activities. Cleveland Clinic Florida
includes Cleveland Clinic Indian River Hospital, Cleveland Clinic
Martin Health, Cleveland Clinic Weston Hospital and numerous
other facilities.
Cleveland Clinic directly supported an estimated 10,6685 jobs
in Florida in 2019. These direct jobs sustained an additional
14,679 indirect jobs, resulting in a total of 25,347 Florida jobs
supported by Cleveland Clinic. For every direct Cleveland Clinic
job, approximately 1.4 additional jobs were supported in Florida.
An estimated $1.66 billion of annual labor income, including
benefits, was associated with the total jobs. These jobs and
associated earnings sustained 15,891 Florida households,
which spent approximately $1.4 billion on goods and services.
Cleveland Clinic’s operating and construction activities generated
$181.1 million in state and local taxes and $428.6 million in
federal taxes in 2019.
The organization supported the state economy through
purchasing $190.3 million in goods and services from Florida
companies. Additionally, inpatients and outpatients visiting
Cleveland Clinic spent an estimated $26.3 million in the state
of Florida.
Between 2017 and 2019, Cleveland Clinic invested an average
of $112.9 million per year in Florida to construct and improve
facilities. This investment supported nearly 1,499 construction
and other jobs and generated an estimated $85.8 million in total
labor income annually. The construction activity generated nearly
$9.7 million in state and local taxes and over $22.7 million in
federal taxes per year.
5 This number includes affiliated entities. Cleveland Clinic directly employed 9,513 people in the state of Florida.

1514
Estimated Impacts in Florida
Total Impacts: Permanent & Construction
Southeast Florida Region State of Florida
Direct Indirect Total Direct Indirect Total
Economic Output $ 1,775,803,000 $ 2,175,524,000 $ 3,951,327,000 $ 1,775,803,000 $ 2,342,066,000 $ 4,117,869,000
Jobs 10,668 13,835 24,503 10,668 14,679 25,347
Labor Income $ 922,178,000 $ 697,737,000 $ 1,619,915,000 $ 922,178,000 $ 742,811,000 $ 1,664,989,000
Households Supported 6,688 8,673 15,361 6,688 9,203 15,891
Household Level Spending $ 622,559,000 $ 731,551,000 $ 1,354,110,000 $ 622,559,000 $ 776,256,000 $ 1,398,815,000
Total State and Local Taxes $ 64,846,000 $ 107,950,000 $ 172,796,000 $ 65,541,000 $ 115,600,000 $ 181,141,000
Residential Property Taxes $ 55,232,000 $ 51,861,000 $ 107,093,000 $ 55,927,000 $ 55,024,000 $ 110,951,000
Other State and Local Taxes $ 9,614,000 $ 56,089,000 $ 65,703,000 $ 9,614,000 $ 60,576,000 $ 70,190,000
Federal Taxes $ 223,718,000 $ 190,674,000 $ 414,392,000 $ 223,726,000 $ 204,922,000 $ 428,648,000
Permanent Impacts Direct Indirect Total Direct Indirect Total
Economic Output $ 1,662,865,000 $ 2,083,754,000 $ 3,746,619,000 $ 1,662,865,000 $ 2,242,864,000 $ 3,905,729,000
Jobs 9,749 13,293 23,042 9,749 14,099 23,848
Labor Income $ 866,345,000 $ 669,782,000 $ 1,536,127,000 $ 866,345,000 $ 712,813,000 $ 1,579,158,000
Households Supported 6,112 8,333 14,445 6,112 8,839 14,951
Household Level Spending $ 573,975,000 $ 702,873,000 $ 1,276,848,000 $ 573,975,000 $ 745,553,000 $ 1,319,528,000
Total State and Local Taxes $ 60,252,000 $ 103,212,000 $ 163,464,000 $ 60,947,000 $ 110,520,000 $ 171,467,000
Residential Property Taxes $ 51,295,000 $ 49,829,000 $ 101,124,000 $ 51,990,000 $ 52,850,000 $ 104,840,000
Other State and Local Taxes $ 8,957,000 $ 53,383,000 $ 62,340,000 $ 8,957,000 $ 57,670,000 $ 66,627,000
Federal Taxes $ 208,933,000 $ 183,271,000 $ 392,204,000 $ 208,933,000 $ 196,974,000 $ 405,907,000
Construction Impacts – Average Annual Direct Indirect Total Direct Indirect Total
Economic Output $ 112,938,000 $ 91,770,000 $ 204,708,000 $ 112,938,000 $ 99,202,000 $ 212,140,000
Jobs 919 542 1,461 919 580 1,499
Labor Income $ 55,833,000 $ 27,955,000 $ 83,788,000 $ 55,833,000 $ 29,998,000 $ 85,831,000
Households Supported 576 340 916 576 364 940
Household Level Spending $ 48,584,000 $ 28,678,000 $ 77,262,000 $ 48,584,000 $ 30,703,000 $ 79,287,000
Total State and Local Taxes $ 4,594,000 $ 4,738,000 $ 9,332,000 $ 4,594,000 $ 5,080,000 $ 9,674,000
Residential Property Taxes $ 3,937,000 $ 2,032,000 $ 5,969,000 $ 3,937,000 $ 2,174,000 $ 6,111,000
Other State and Local Taxes $ 657,000 $ 2,706,000 $ 3,363,000 $ 657,000 $ 2,906,000 $ 3,563,000
Federal Taxes $ 14,785,000 $ 7,403,000 $ 22,188,000 $ 14,793,000 $ 7,948,000 $ 22,741,000

1716
Economic Impact Overview
STATE OF NEVADA
$48.9 million in economic output
341 jobs
$22 million of labor income
213 households supported
$20.5 million in household spending
$2.5 million in state and local taxes
$5.7 million in federal taxes
$1 million in visitor spending
$6.3 million in goods and services
Estimated Impacts:State of Nevada
In 2019, Cleveland Clinic directly and indirectly generated $48.9
million of economic activity in Nevada through its ongoing operations
activities. The Lou Ruvo Center for Brain Health, which celebrated
its 10th anniversary in 2019, is located in the Las Vegas area in
Clark County.
Cleveland Clinic directly supported an estimated 1566 jobs in Nevada
in 2019. These direct jobs sustained an additional 185 indirect jobs,
resulting in a total of 341 Nevada jobs supported by Cleveland Clinic.
For every direct Cleveland Clinic job, approximately 1.2 additional jobs
were supported in Nevada. An estimated $22 million of annual labor
income, including benefits, was associated with the total jobs. These
jobs and associated earnings sustained 213 Nevada households,
which spent approximately $20.5 million on goods and services.
Cleveland Clinic’s operating activities rgenerated $2.5 million in state
and local taxes and $5.7 million in federal taxes in 2019.
The organization supported the state economy through purchasing
$6.3 million in goods and services from Nevada companies.
Additionally, inpatients and outpatients visiting Cleveland Clinic spent
an estimated $1 million in Nevada.
Cleveland Clinic’s construction spending in Nevada was modest
between 2017 and 2019. Therefore, construction impacts are not
presented here.
Nevada5 This number includes affiliated entities. Cleveland Clinic directly employed 148 people in Nevada.

Study MethodologyAbout IMPLAN Portions of this analysis were completed using the IMPLAN (Impact Analysis for Planning) economic impact modeling system. IMPLAN is an input-output model that was originally developed by the U.S. Forest Service in the 1970s and is one of the most respected and widely used approaches to regional economic impact analysis. IMPLAN is used by more than 1,000 universities, government agencies and consultants to estimate the economic and fiscal impacts of investments and/or changes in one or more industries. Data underlying the IMPLAN model are partially derived from industry surveys conducted periodically by the U.S. Bureau of Economic Analysis, as well as other sources.
Terminology A direct effect describes an initial or first-round change in the economy and is the starting point for economic impact analysis. Changes in an economy create “ripples” of economic activity throughout the region being analyzed. These ripples are described as indirect and induced effects. A positive direct effect causes increased purchases within the economy being modeled, as well as “leakage” of economic activity out of the economy being studied in the form of imports into the economy from other areas outside the economy. Generally speaking, “direct” describes activity attributable to the economic activity being modeled.
In this report, direct jobs comprise those held by Cleveland Clinic employees, as well as the employees of its joint venture partners and supported entities. Direct jobs data were provided by Cleveland Clinic and its joint venture partners.
Indirect effects represent changes in the industries that provide goods and services to the economic activity being modeled (suppliers, service providers, etc.). Indirect effects occur in a repeating cycle but diminish in each round as economic activity “leaks” from the region being modeled. Indirect effects cease when the last dollar of economic activity leaks from the economy being studied. Indirect effects are estimated using IMPLAN.
Induced effects represent the impact of changes in household spending resulting from the direct and indirect effects. Like indirect effects, induced effects occur in repeating cycles, but diminish in each round as economic activity “leaks” from the region being modeled. Induced effects cease when the last dollar of economic activity leaks from the economy being studied. Induced effects are estimated using IMPLAN. For ease of presentation in this report, induced effects are combined with indirect effects and referred to simply as “indirect.”
Total impact refers to the final cumulative result of all rounds of direct, indirect and induced economic activity.
Direct Indirect and Induced
Economic Output The total value of goods and services produced by the activity being modeled. Output is roughly equivalent to sales or revenue associated with the direct activity.
IMPLAN estimate of the total value of goods and services produced by indirect and induced economic activity. Output is roughly equivalent to sales or revenue associated with this activity.
Jobs Jobs directly engaged in the activity being analyzed.
IMPLAN estimate of the number of jobs supported by the purchase of goods and services by the activity being modeled (indirect) as well as by changes in household spending (induced).
Labor Income Wages and benefits associated with direct jobs.
IMPLAN estimate of the wages, benefits and proprietor income associated with the indirect and induced economic activity.
Households Supported
IMPLAN estimate of the number of households supported by the economic activity being analyzed.
IMPLAN estimate of the number of households supported by indirect and induced economic activity.
Household Level Spending
IMPLAN estimate of consumer spending by affected households on goods and services.
IMPLAN estimate of consumer spending by affected households on goods and services.
State and Local Taxes
IMPLAN estimate of all taxes paid to state and local units of government as a direct result of the economic activity being analyzed.
IMPLAN estimate of all taxes paid to state and local units of government due to indirect and induced economic activity.
Federal Taxes IMPLAN estimate of all taxes paid to the federal government as a direct result of the economic activity being analyzed.
IMPLAN estimate of all taxes paid to the federal government due to indirect and induced economic activity.
1918
Report DefinitionsThe table below provides definitions for the items included in the summary tables and infographics of this report.
Estimated Impacts in Nevada
Total Impacts: Permanent Direct Indirect Total
Economic Output $ 17,734,000 $ 31,208,000 $ 48,942,000
Jobs 156 185 341
Labor Income $ 13,014,000 $ 8,970,000 $ 21,984,000
Households Supported 97 116 213
Household Level Spending $ 9,832,000 $ 10,680,000 $ 20,512,000
Total State and Local Taxes $ 572,000 $ 1,902,000 $ 2,474,000
Residential Property Taxes $ 545,000 $ 446,000 $ 991,000
Other State and Local Taxes $ 27,000 $ 1,456,000 $ 1,483,000
Federal Taxes $ 3,064,000 $ 2,591,000 $ 5,655,000

21-CCC-2149158
9500 Euclid Ave., Cleveland, OH 44195
Cleveland Clinic is a nonprofit, multispecialty academic medical center integrating outpatient and hospital care with research and education for better patient outcomes and experience. More than 4,500 staff physicians and researchers provide services through 20 patient-centered institutes. Cleveland Clinic is a 6,026-bed healthcare system with a main campus in Cleveland, 18 hospitals and over 220 outpatient locations. The health system includes five hospitals in Southeast Florida with more than 1,000 beds, a medical center for brain health in Las Vegas, a sports and executive health center in Toronto and a 364-bed hospital in Abu Dhabi. Cleveland Clinic London, a 184-bed hospital, will open in 2022. Cleveland Clinic is currently ranked as one of the nation’s top hospitals by U.S. News & World Report.clevelandclinic.org
©2021 The Cleveland Clinic Foundation
Prepared by: