Embed Size (px)
Citation preview
vv
A voyAge through scAles
est. 2002
A voyAge th
rou
gh
scAles Blöschl
thybo savenije
the earth system in space and tim
e
günter Blöschl hans thybohubert savenije
est. 2002
A voyAge through scAles Zoom into a cloud. Zoom out of a rock. Watch the volcano explode, the lightning strike, an aurora undulate. Imagine ice sheets expanding, retreating – pulsating – while continents continue their leisurely collisions. Everywhere there are structures within structures … within structures. A Voyage Through Scales is an invitation to contemplate the Earth’s extraordinary variability extending from milliseconds to billions of years, from microns to the size of the universe.
the earth system in space and time
2 A Voyage Through Scales A Voyage Through Scales 3
T
L
4 A Voyage Through Scales A Voyage Through Scales 1
A voyAge through scAles the earth system in space and time
T
L
2 A Voyage Through Scales A Voyage Through Scales 3
Preface
Patterns of billions of stars on the night skies, cloud patterns, sea ice whirling in the ocean, rivers meandering in the landscape, vegetation patterns on hillslopes, minerals glittering in the sun, and the remains of miniature crea-tures in rocks – they all reveal themselves as complex patterns from the scale of the universe down to the molecu-lar level. A voyage through space scales.
From a molten Earth to a solid crust, the evolution and extinction of species, climate fluctuations, continents moving around, the growth and decay of ice sheets, the water cycle wearing down mountain ranges, volcanoes exploding, forest fires, avalanches, sudden chemical reactions – constant change taking place over billions of years down to milliseconds. A voyage through time scales.
A Voyage Through Scales is an invitation to contemplate the Earth’s extraordinary variability across space and time scales. Depending on the view point, different features are revealed. Big structures and small structures, elongated in shape, connected, regular sinusoidal forms, vortices, branching structures or the more geometric shapes imposed by humans. They are a legacy of the intertwined processes of the Earth on its voyage through time. We can use them to understand how we arrived at what we see now, or we can use them to predict where we will go in the future.
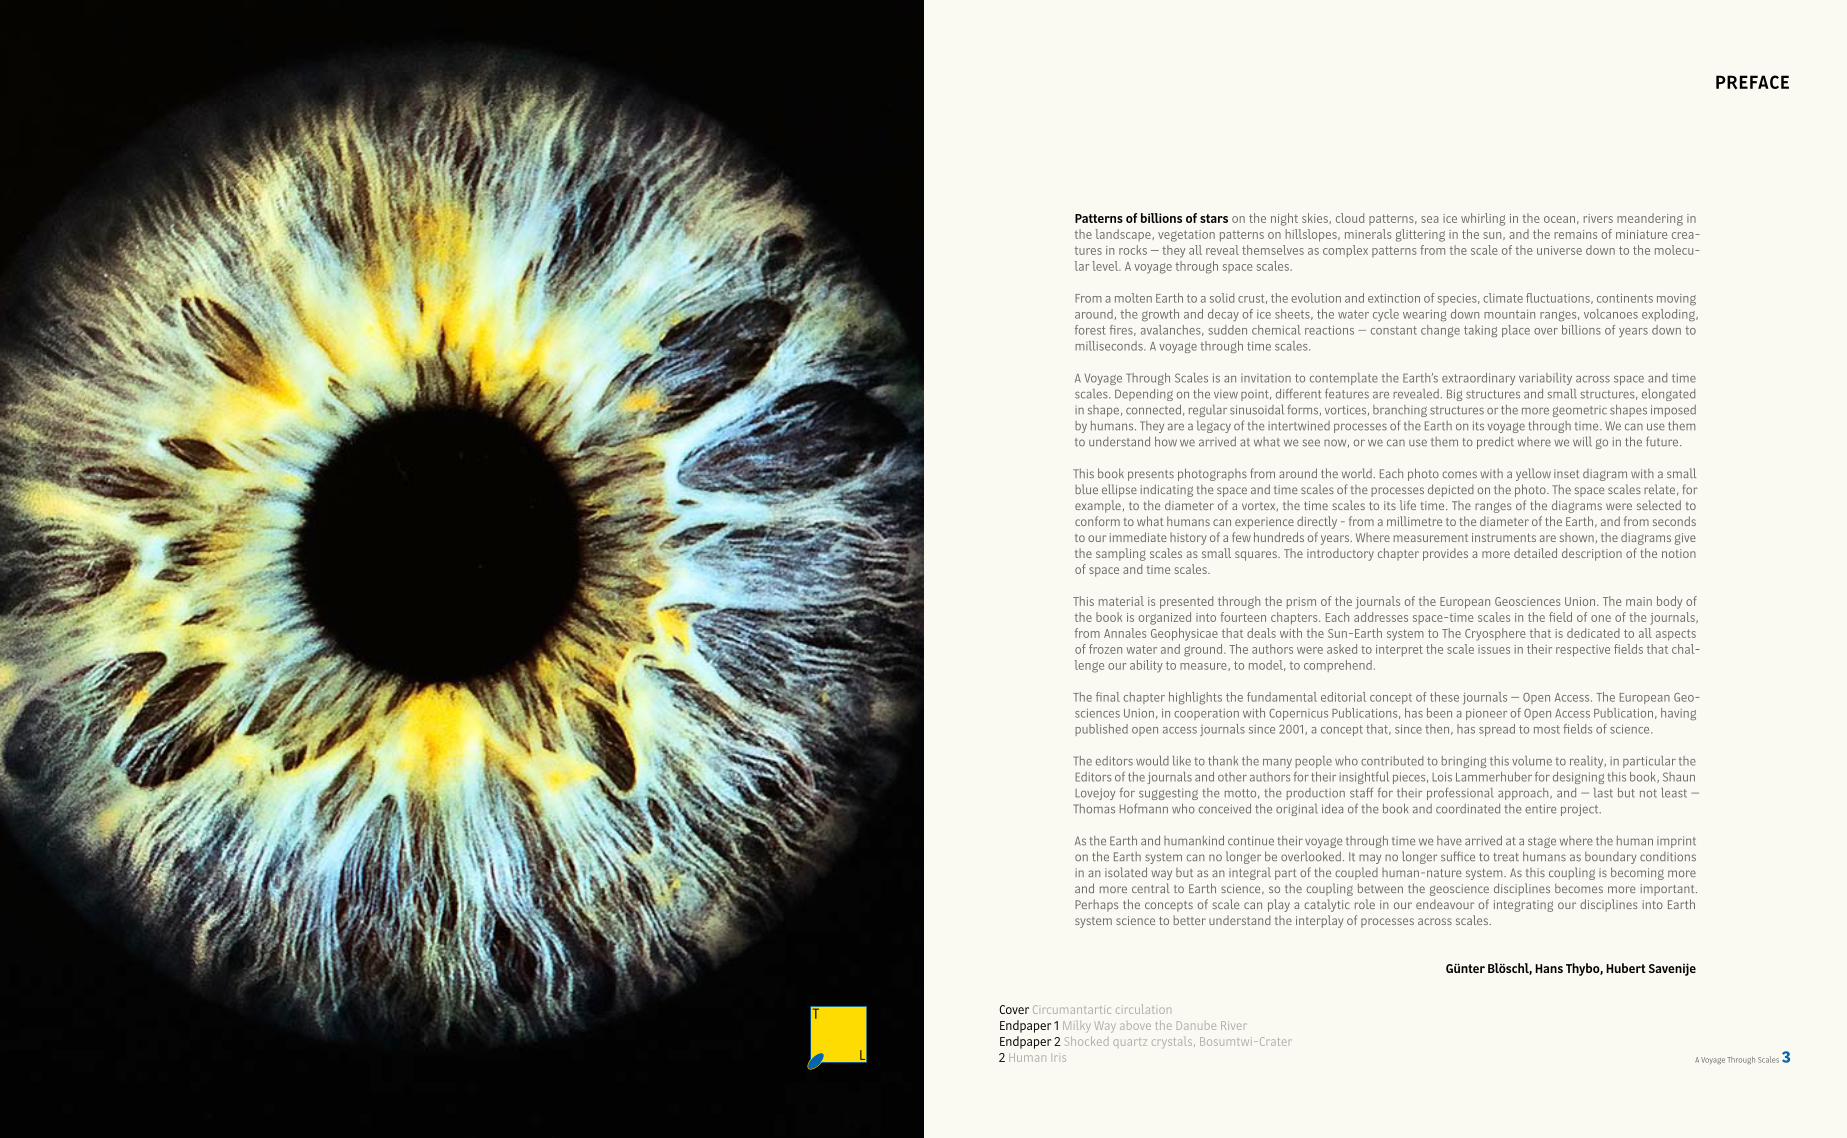
This book presents photographs from around the world. Each photo comes with a yellow inset diagram with a small blue ellipse indicating the space and time scales of the processes depicted on the photo. The space scales relate, for example, to the diameter of a vortex, the time scales to its life time. The ranges of the diagrams were selected to conform to what humans can experience directly - from a millimetre to the diameter of the Earth, and from seconds to our immediate history of a few hundreds of years. Where measurement instruments are shown, the diagrams give the sampling scales as small squares. The introductory chapter provides a more detailed description of the notion of space and time scales.
This material is presented through the prism of the journals of the European Geosciences Union. The main body of the book is organized into fourteen chapters. Each addresses space-time scales in the field of one of the journals, from Annales Geophysicae that deals with the Sun-Earth system to The Cryosphere that is dedicated to all aspects of frozen water and ground. The authors were asked to interpret the scale issues in their respective fields that chal-lenge our ability to measure, to model, to comprehend.
The final chapter highlights the fundamental editorial concept of these journals – Open Access. The European Geo-sciences Union, in cooperation with Copernicus Publications, has been a pioneer of Open Access Publication, having published open access journals since 2001, a concept that, since then, has spread to most fields of science.
The editors would like to thank the many people who contributed to bringing this volume to reality, in particular the Editors of the journals and other authors for their insightful pieces, Lois Lammerhuber for designing this book, Shaun Lovejoy for suggesting the motto, the production staff for their professional approach, and – last but not least – Thomas Hofmann who conceived the original idea of the book and coordinated the entire project.
As the Earth and humankind continue their voyage through time we have arrived at a stage where the human imprint on the Earth system can no longer be overlooked. It may no longer suffice to treat humans as boundary conditions in an isolated way but as an integral part of the coupled human-nature system. As this coupling is becoming more and more central to Earth science, so the coupling between the geoscience disciplines becomes more important. Perhaps the concepts of scale can play a catalytic role in our endeavour of integrating our disciplines into Earth system science to better understand the interplay of processes across scales.
Günter Blöschl, Hans Thybo, Hubert Savenije
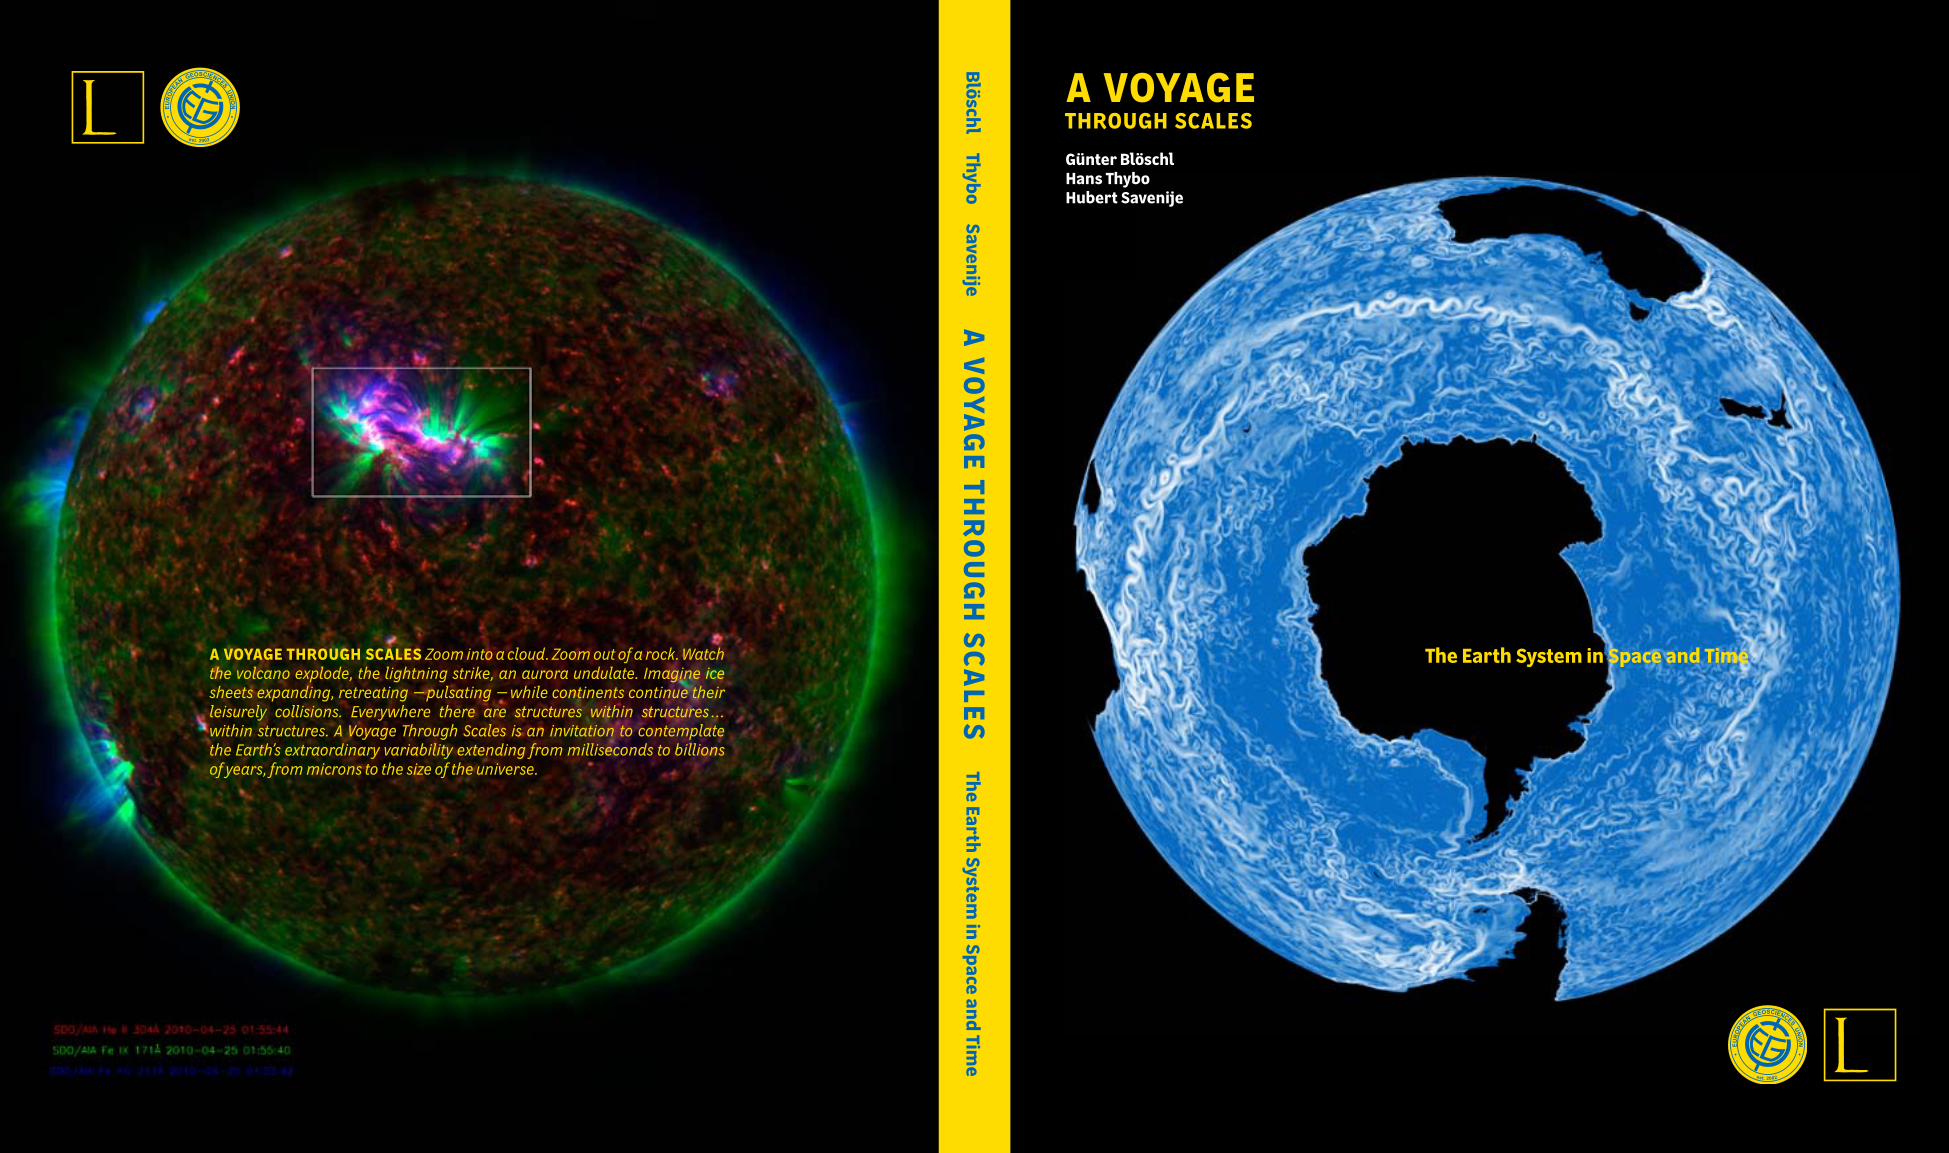
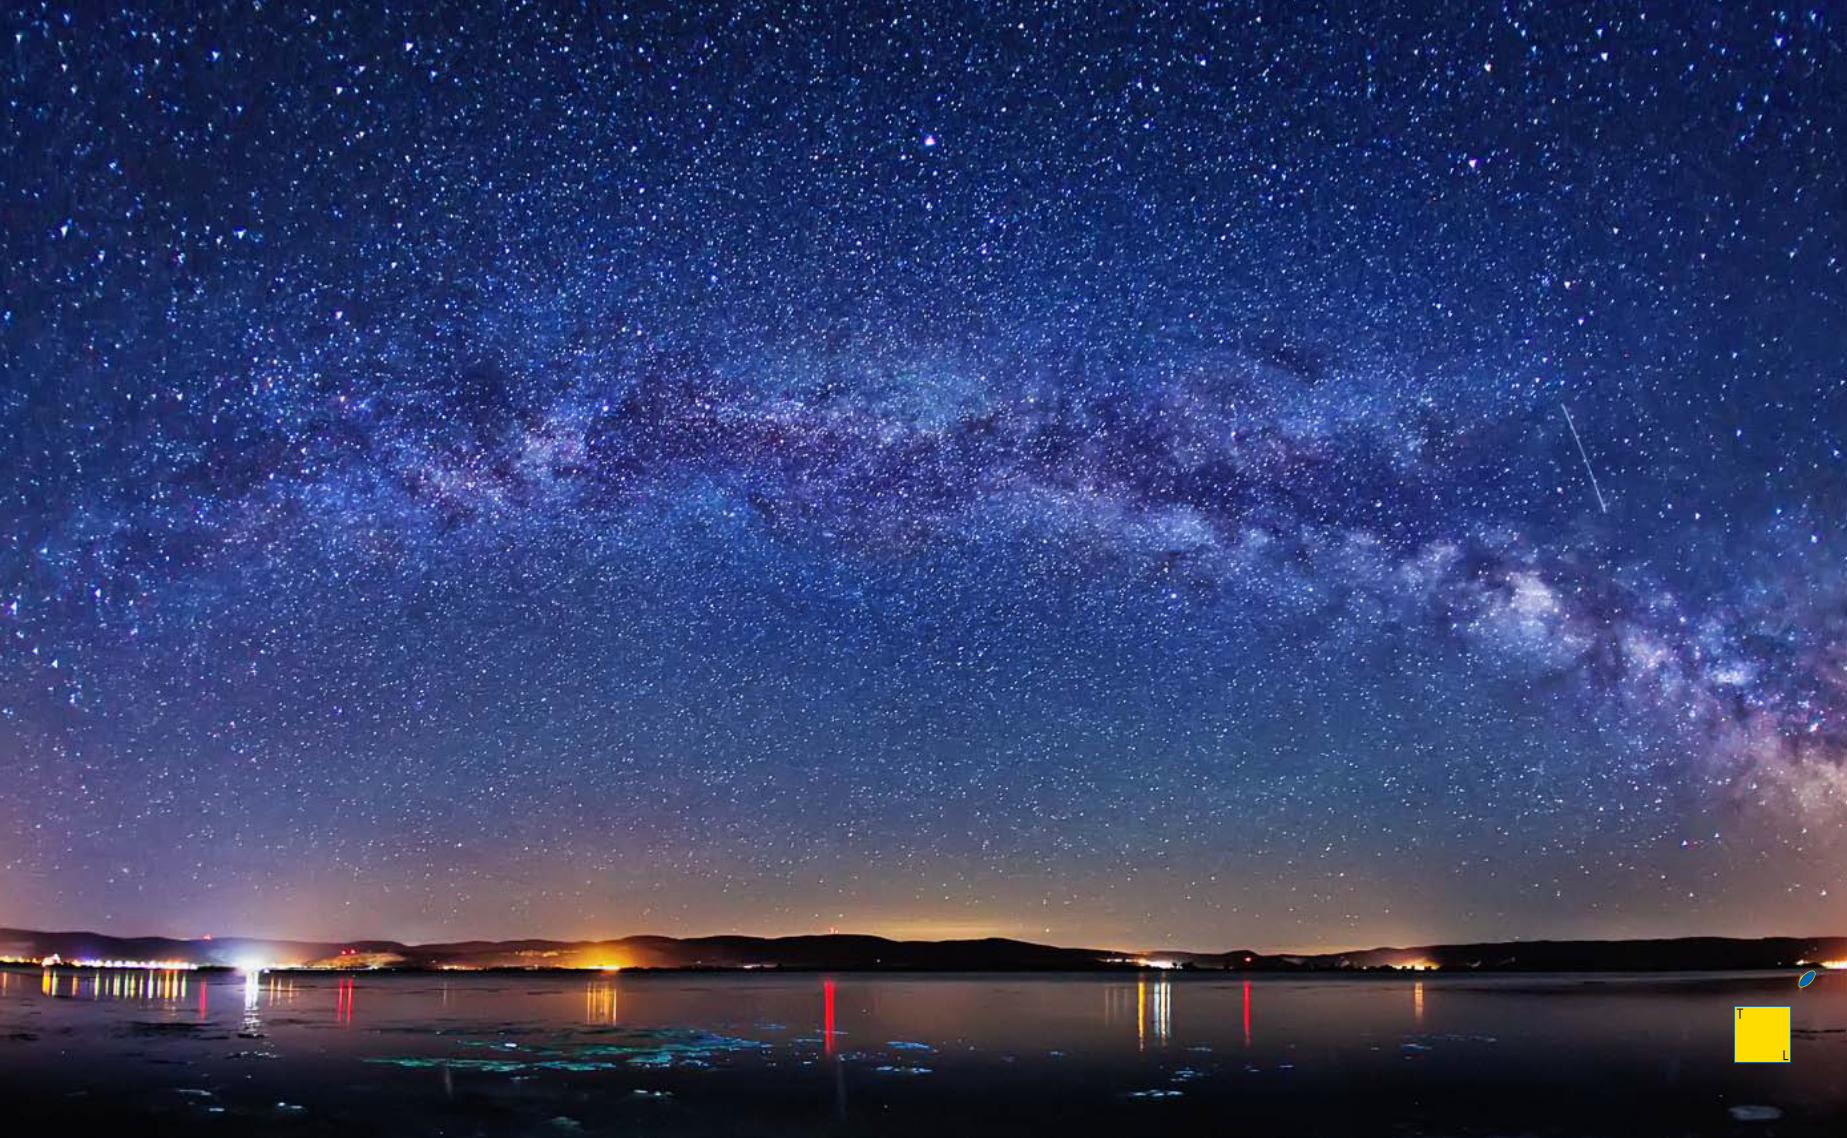
Cover Circumantartic circulation Endpaper 1 Milky Way above the Danube RiverEndpaper 2 Shocked quartz crystals, Bosumtwi-Crater2 Human Iris
T
L
4 A Voyage Through Scales A Voyage Through Scales 5
est. 2002
günter Blöschl hans thybo hubert savenije
A voyAge through scAlesthe earth system in space and time
T
L
6 A Voyage Through Scales A Voyage Through Scales 7
T
L
8 A Voyage Through Scales A Voyage Through Scales 9
T
L
10 A Voyage Through Scales A Voyage Through Scales 11
A Voyage 12
Living with a Star 26
Up into the Sky 32
Scales and Atmospheric Measurements 38
Biogeosciences Connecting Earth’s Spheres from Microscopic to Global Scales 44
Sculpting the Surface of the Earth 50
Earth System Dynamics: “The Whole Is More Than the Sum of Its Parts” (Aristotle) 56
Scales in Atmospheric Remote Sensing Instruments, Measurements and Scientifi c Products 62
Hydrology, a Science of Water Flow at Many Scales 68
Scales and Scaling in Natural Hazards 74
Beautiful Geometries Underlying Ocean Nonlinear Processes 80
Ocean Science 86
Soil: A Journey through Time and Space 92
The Mobile Solid Earth: A Question of Perception 98
From Microscopic Ice Crystals to Global Ice Ages: Scales of Cryosphere Phenomena and Research 104
Open Access – What Else ? 112
The EGU Journals 116
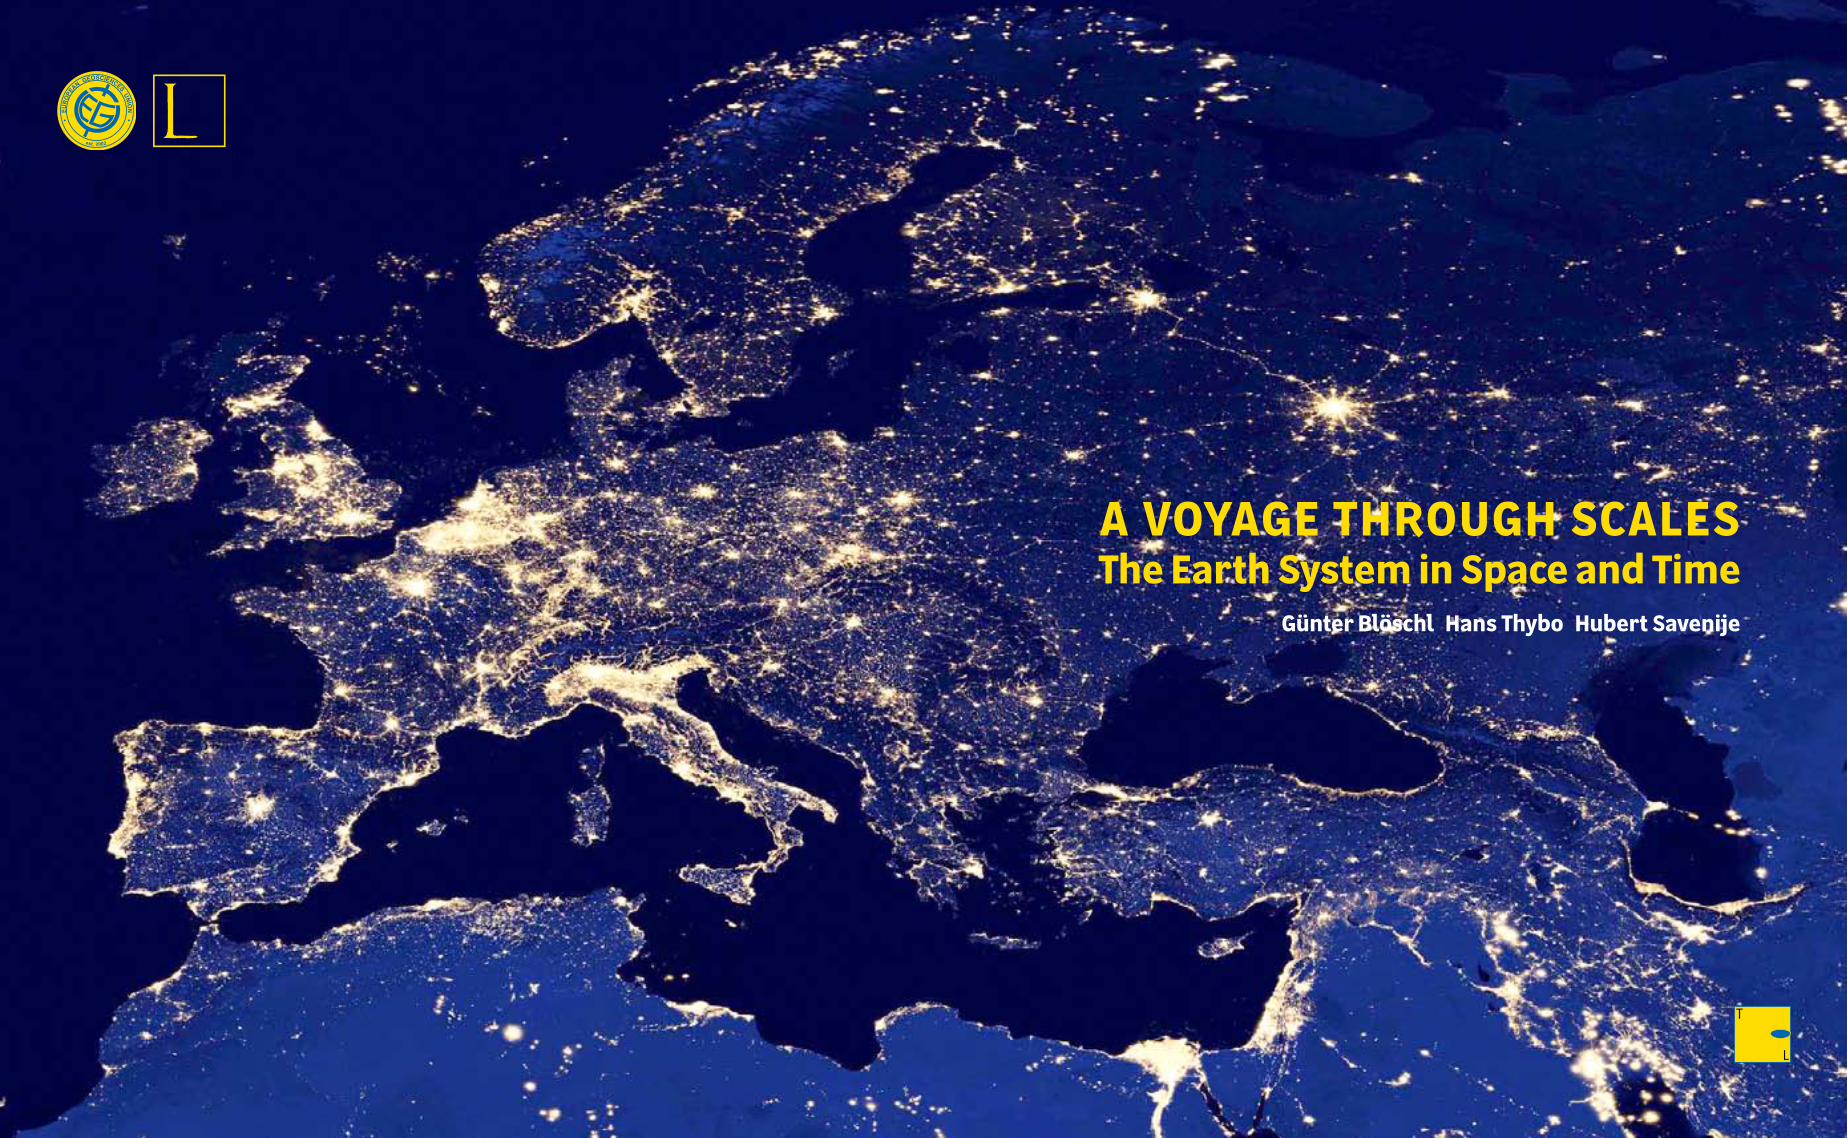
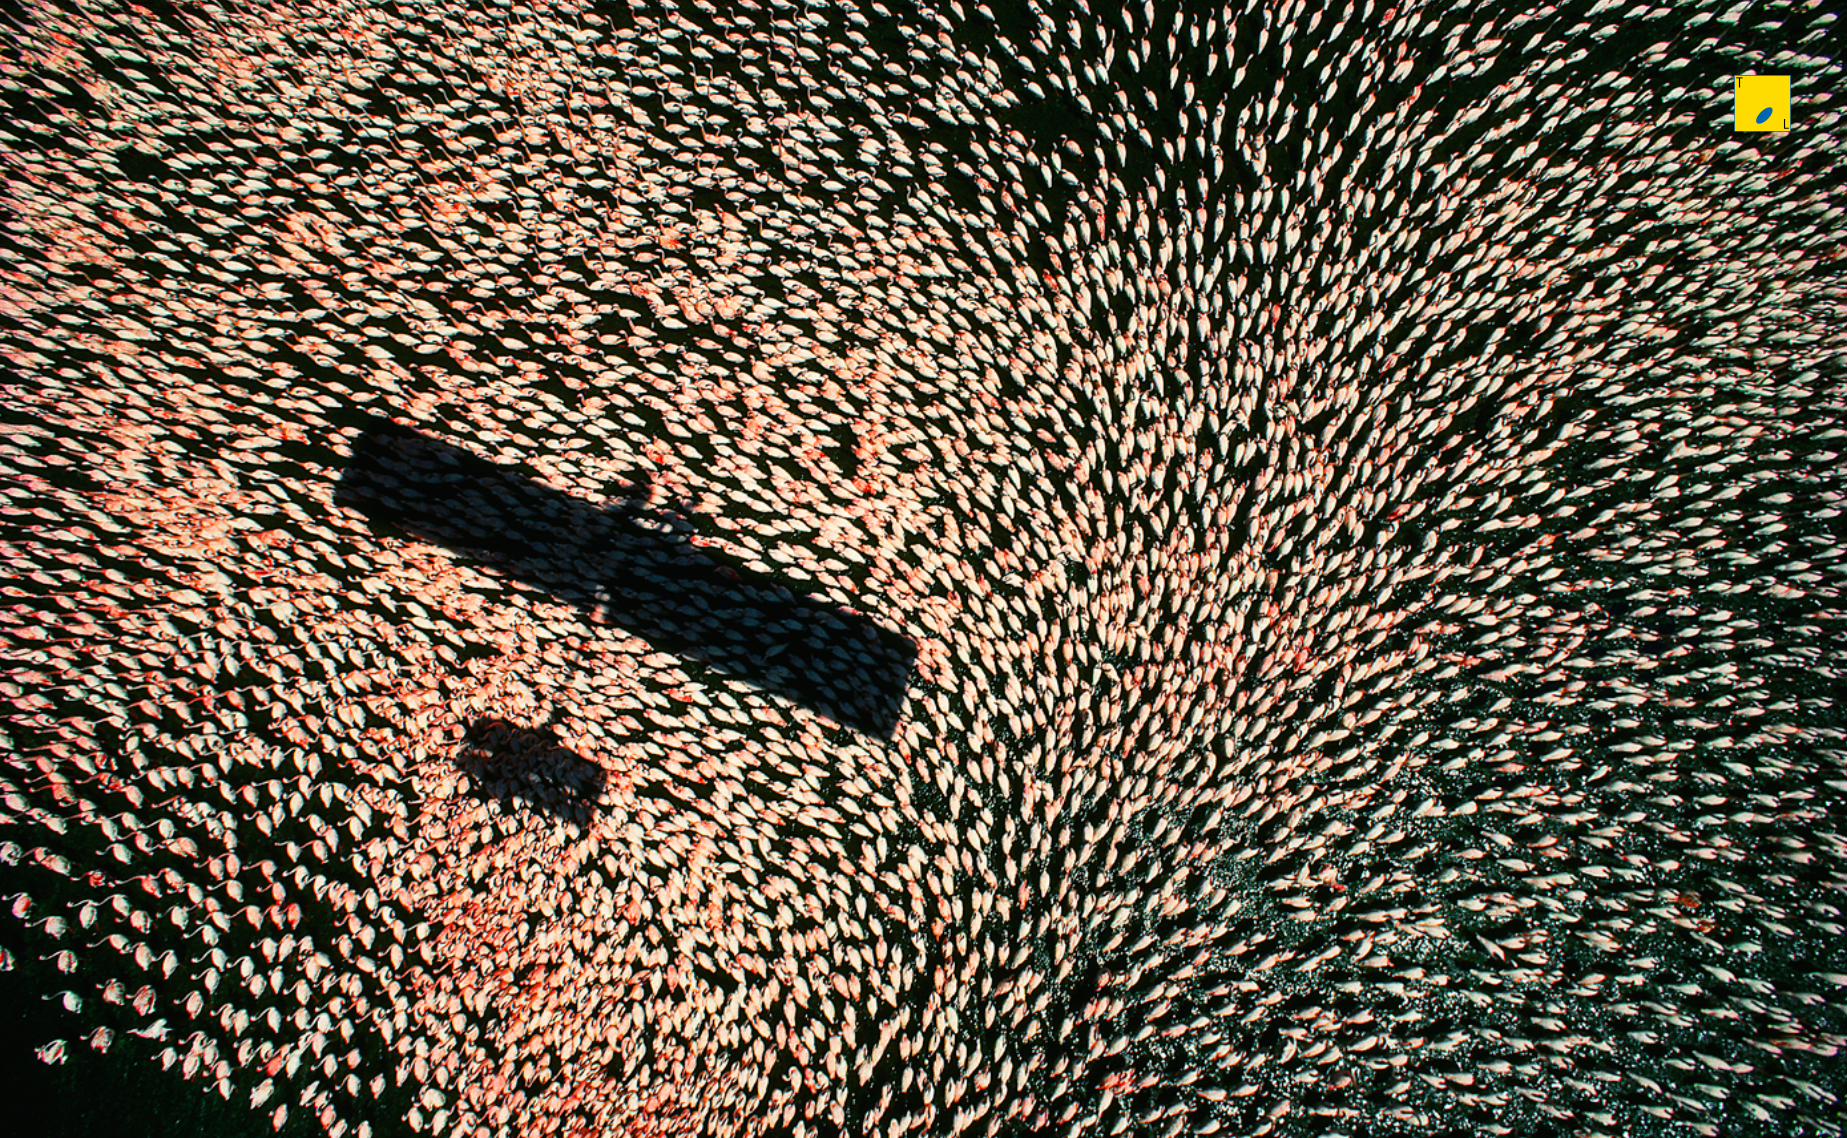
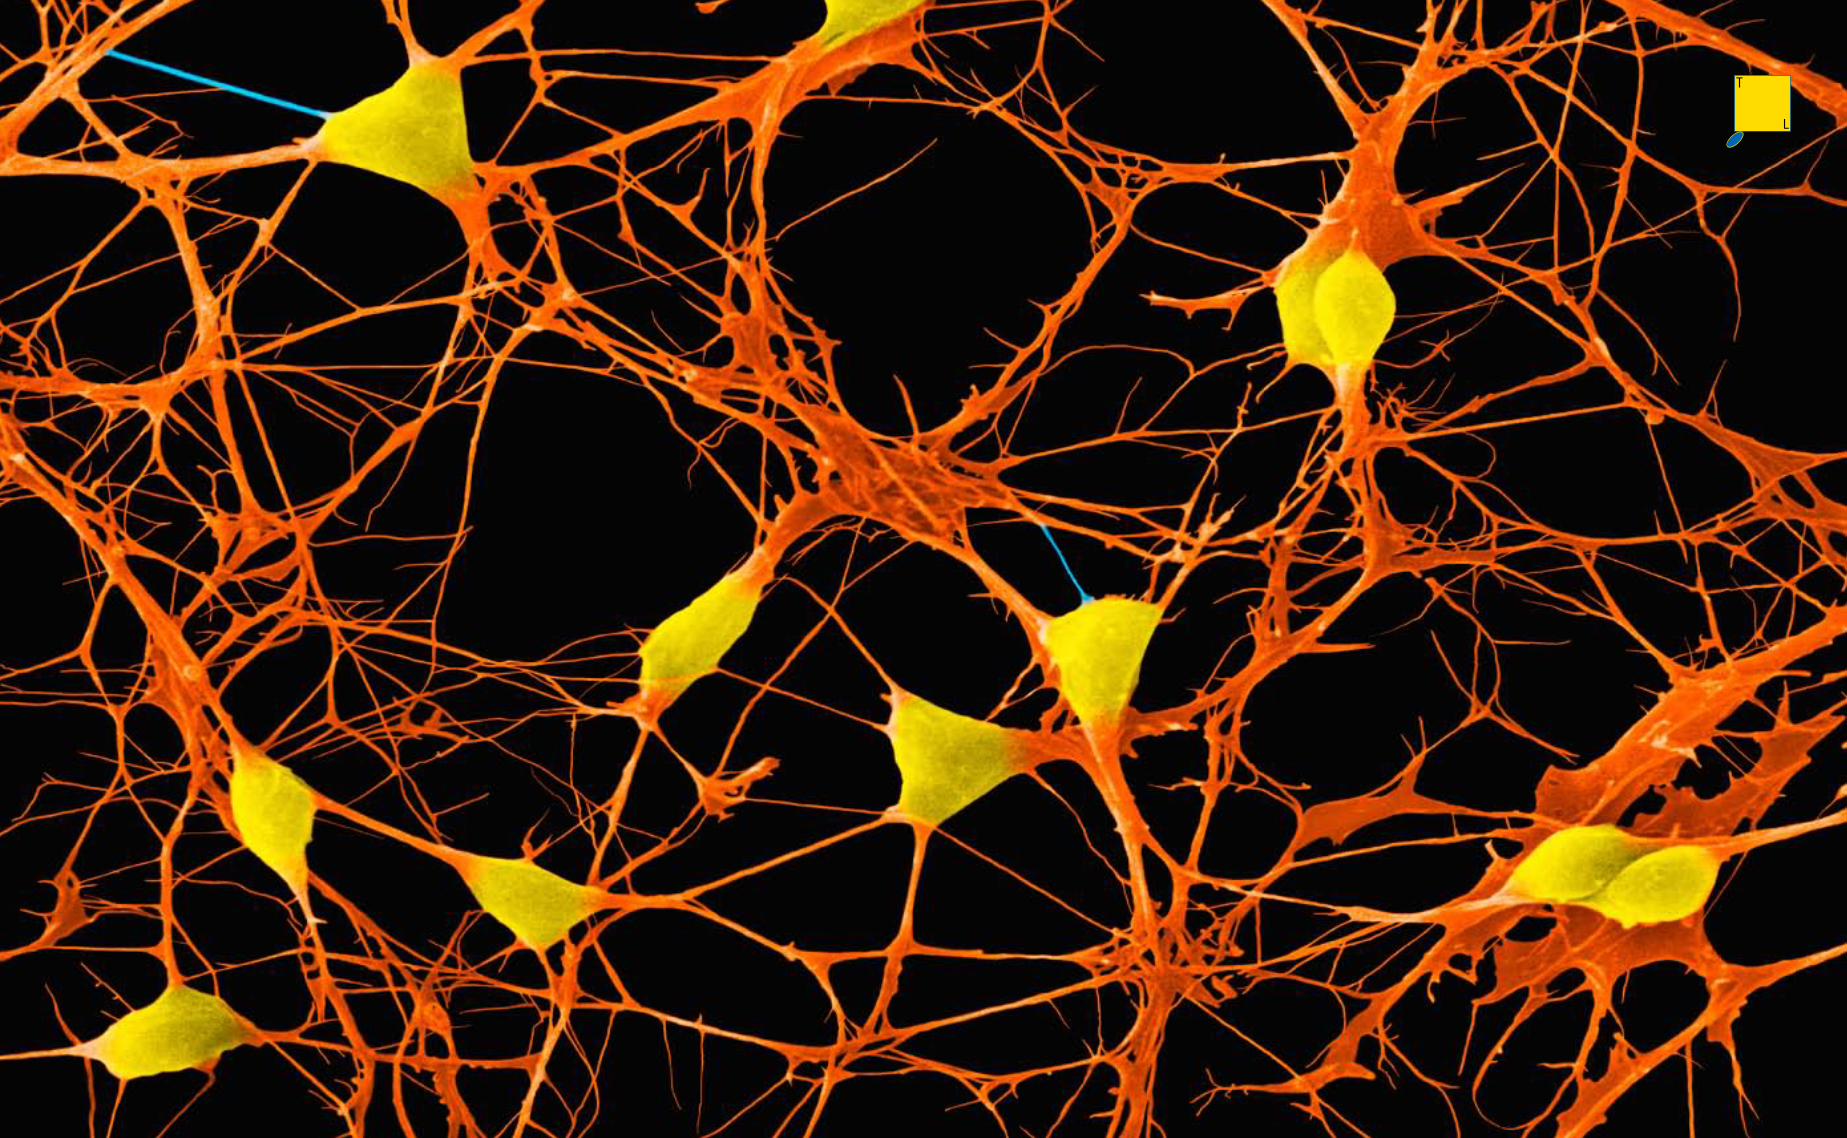
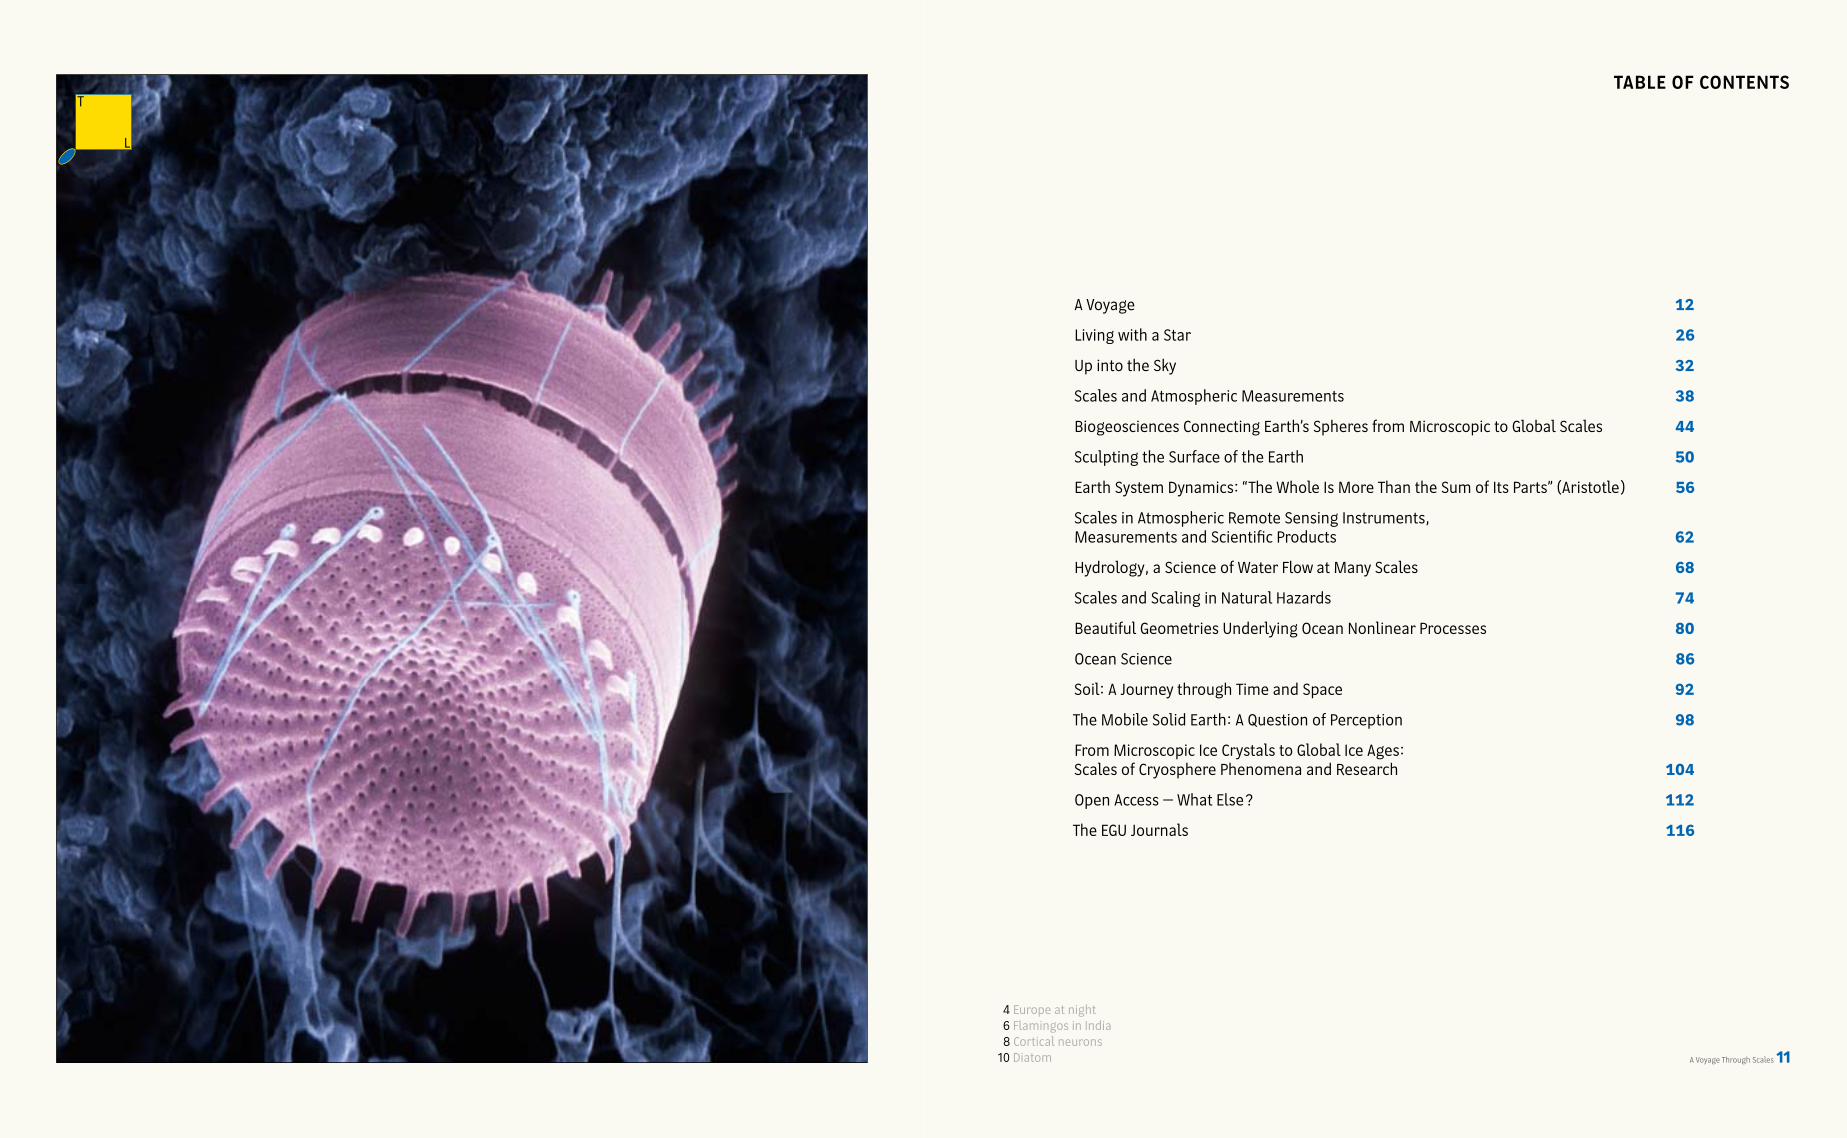
14 Europe at night16 Flamingos in India18 Cortical neurons10 Diatom
T
L
TaBLe of conTenTS
12 A Voyage Through Scales A Voyage Through Scales 13
T
L
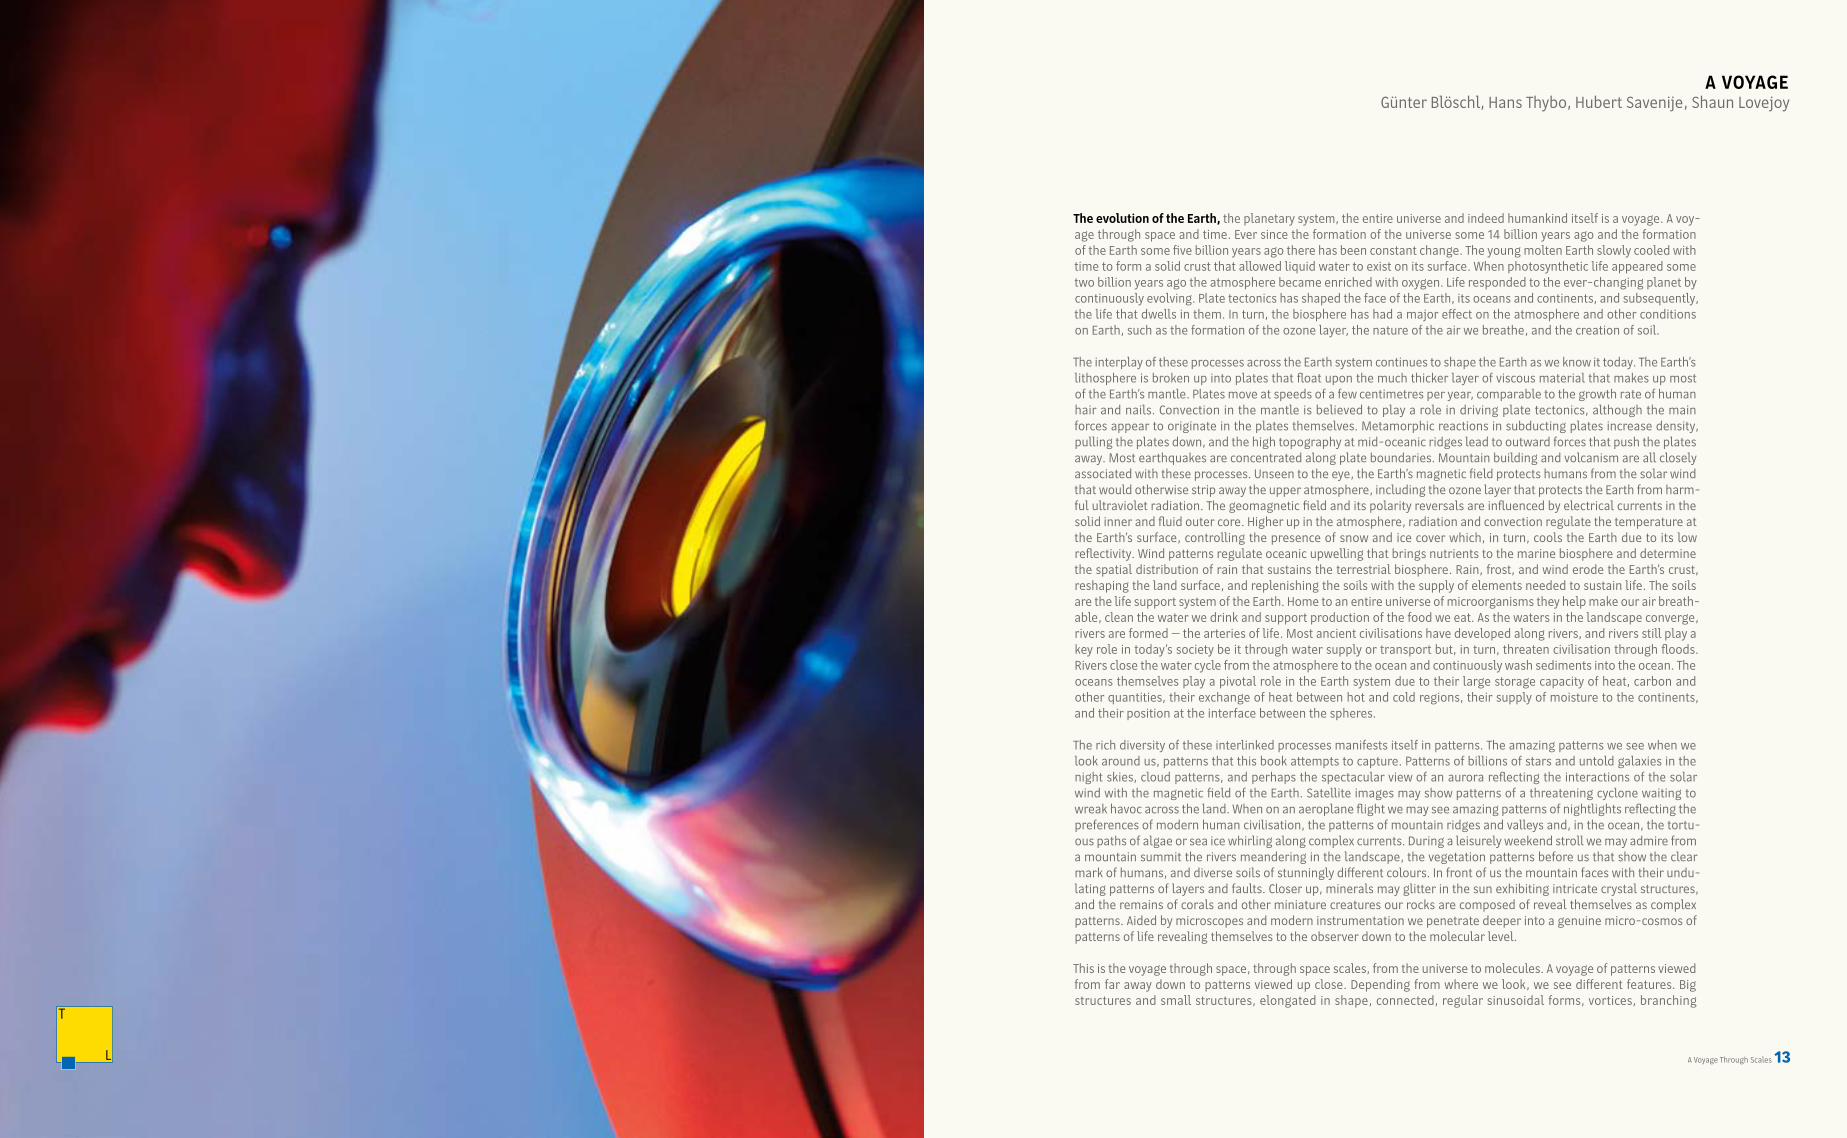
a voyaGeGünter Blöschl, Hans Thybo, Hubert Savenije, Shaun Lovejoy
The evolution of the earth, the planetary system, the entire universe and indeed humankind itself is a voyage. A voy-age through space and time. Ever since the formation of the universe some 14 billion years ago and the formation of the Earth some five billion years ago there has been constant change. The young molten Earth slowly cooled with time to form a solid crust that allowed liquid water to exist on its surface. When photosynthetic life appeared some two billion years ago the atmosphere became enriched with oxygen. Life responded to the ever-changing planet by continuously evolving. Plate tectonics has shaped the face of the Earth, its oceans and continents, and subsequently, the life that dwells in them. In turn, the biosphere has had a major effect on the atmosphere and other conditions on Earth, such as the formation of the ozone layer, the nature of the air we breathe, and the creation of soil.
The interplay of these processes across the Earth system continues to shape the Earth as we know it today. The Earth’s lithosphere is broken up into plates that float upon the much thicker layer of viscous material that makes up most of the Earth’s mantle. Plates move at speeds of a few centimetres per year, comparable to the growth rate of human hair and nails. Convection in the mantle is believed to play a role in driving plate tectonics, although the main forces appear to originate in the plates themselves. Metamorphic reactions in subducting plates increase density, pulling the plates down, and the high topography at mid-oceanic ridges lead to outward forces that push the plates away. Most earthquakes are concentrated along plate boundaries. Mountain building and volcanism are all closely associated with these processes. Unseen to the eye, the Earth’s magnetic field protects humans from the solar wind that would otherwise strip away the upper atmosphere, including the ozone layer that protects the Earth from harm-ful ultraviolet radiation. The geomagnetic field and its polarity reversals are influenced by electrical currents in the solid inner and fluid outer core. Higher up in the atmosphere, radiation and convection regulate the temperature at the Earth’s surface, controlling the presence of snow and ice cover which, in turn, cools the Earth due to its low reflectivity. Wind patterns regulate oceanic upwelling that brings nutrients to the marine biosphere and determine the spatial distribution of rain that sustains the terrestrial biosphere. Rain, frost, and wind erode the Earth’s crust, reshaping the land surface, and replenishing the soils with the supply of elements needed to sustain life. The soils are the life support system of the Earth. Home to an entire universe of microorganisms they help make our air breath-able, clean the water we drink and support production of the food we eat. As the waters in the landscape converge, rivers are formed – the arteries of life. Most ancient civilisations have developed along rivers, and rivers still play a key role in today’s society be it through water supply or transport but, in turn, threaten civilisation through floods. Rivers close the water cycle from the atmosphere to the ocean and continuously wash sediments into the ocean. The oceans themselves play a pivotal role in the Earth system due to their large storage capacity of heat, carbon and other quantities, their exchange of heat between hot and cold regions, their supply of moisture to the continents, and their position at the interface between the spheres.
The rich diversity of these interlinked processes manifests itself in patterns. The amazing patterns we see when we look around us, patterns that this book attempts to capture. Patterns of billions of stars and untold galaxies in the night skies, cloud patterns, and perhaps the spectacular view of an aurora reflecting the interactions of the solar wind with the magnetic field of the Earth. Satellite images may show patterns of a threatening cyclone waiting to wreak havoc across the land. When on an aeroplane flight we may see amazing patterns of nightlights reflecting the preferences of modern human civilisation, the patterns of mountain ridges and valleys and, in the ocean, the tortu-ous paths of algae or sea ice whirling along complex currents. During a leisurely weekend stroll we may admire from a mountain summit the rivers meandering in the landscape, the vegetation patterns before us that show the clear mark of humans, and diverse soils of stunningly different colours. In front of us the mountain faces with their undu-lating patterns of layers and faults. Closer up, minerals may glitter in the sun exhibiting intricate crystal structures, and the remains of corals and other miniature creatures our rocks are composed of reveal themselves as complex patterns. Aided by microscopes and modern instrumentation we penetrate deeper into a genuine micro-cosmos of patterns of life revealing themselves to the observer down to the molecular level.
This is the voyage through space, through space scales, from the universe to molecules. A voyage of patterns viewed from far away down to patterns viewed up close. Depending from where we look, we see different features. Big structures and small structures, elongated in shape, connected, regular sinusoidal forms, vortices, branching
14 A Voyage Through Scales A Voyage Through Scales 15
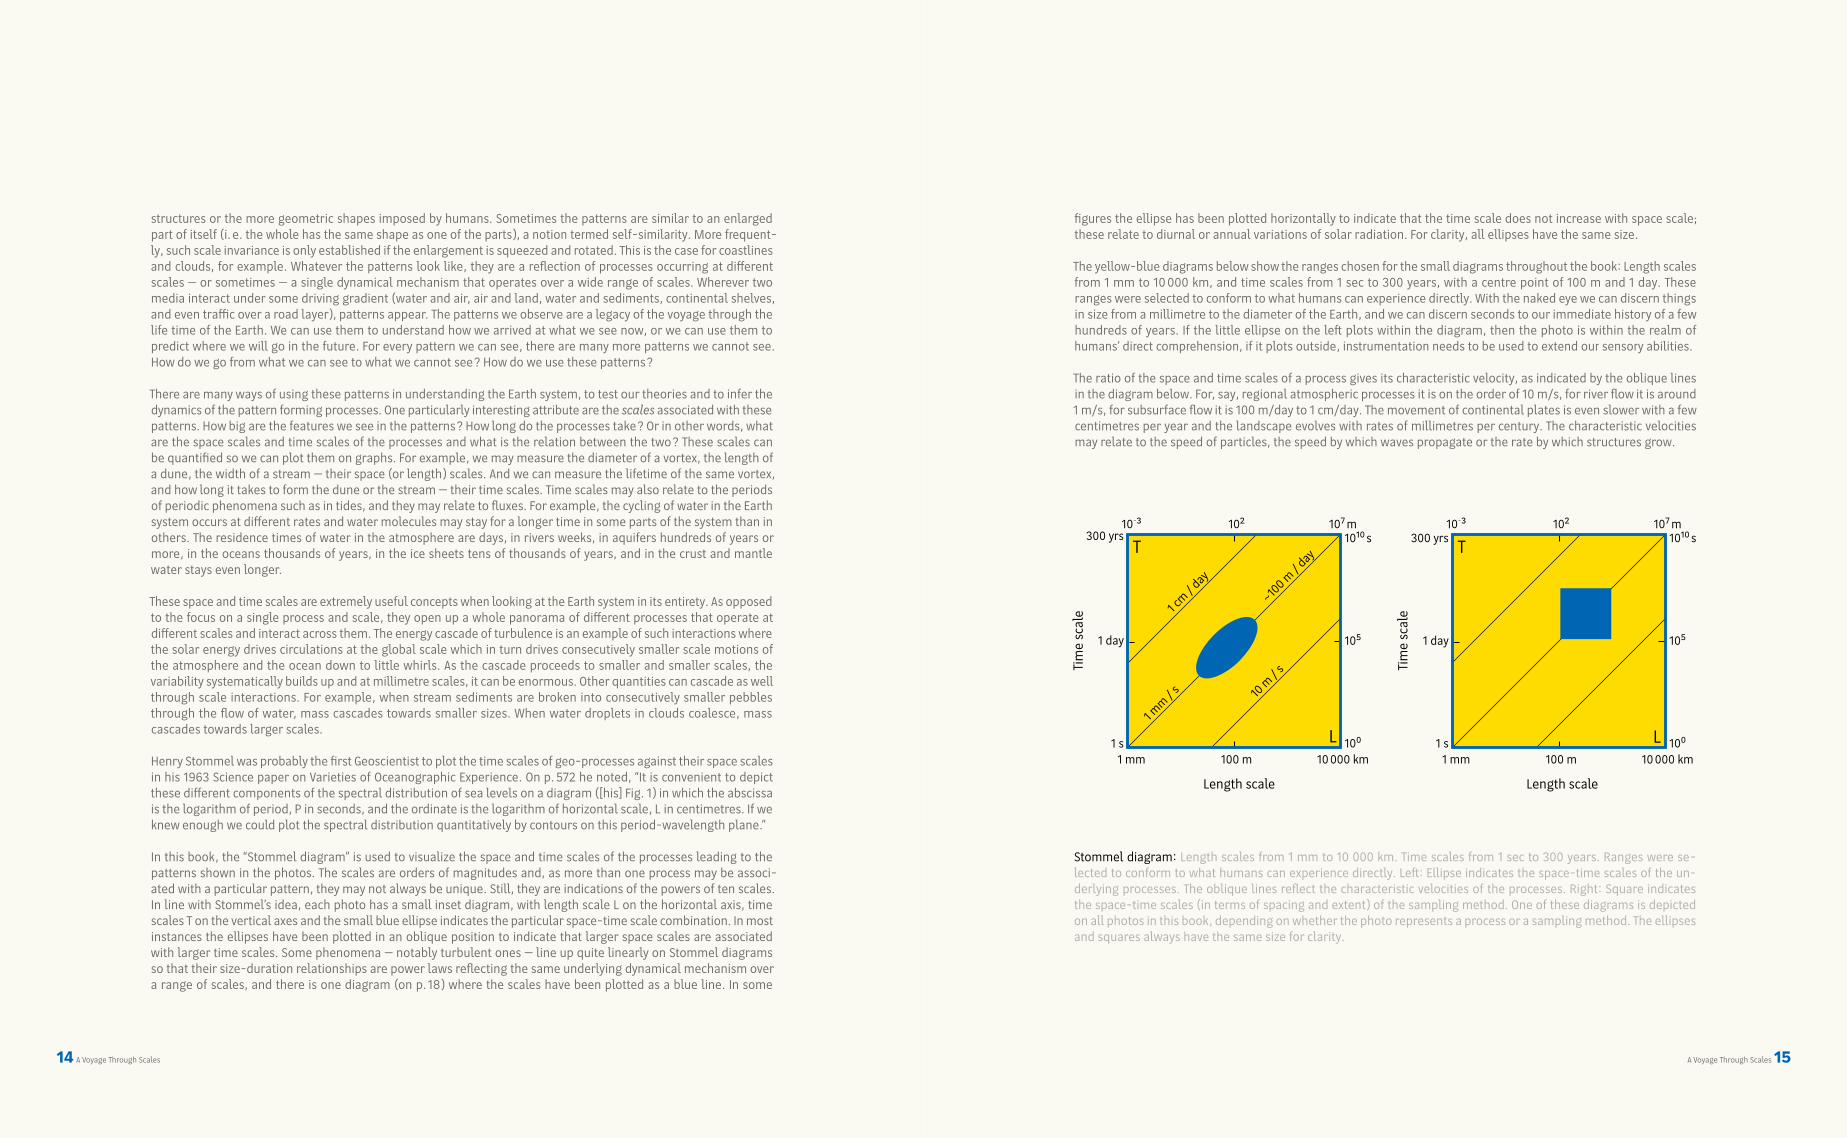
figures the ellipse has been plotted horizontally to indicate that the time scale does not increase with space scale; these relate to diurnal or annual variations of solar radiation. For clarity, all ellipses have the same size.
The yellow-blue diagrams below show the ranges chosen for the small diagrams throughout the book: Length scales from 1 mm to 10 000 km, and time scales from 1 sec to 300 years, with a centre point of 100 m and 1 day. These ranges were selected to conform to what humans can experience directly. With the naked eye we can discern things in size from a millimetre to the diameter of the Earth, and we can discern seconds to our immediate history of a few hundreds of years. If the little ellipse on the left plots within the diagram, then the photo is within the realm of humans’ direct comprehension, if it plots outside, instrumentation needs to be used to extend our sensory abilities.
The ratio of the space and time scales of a process gives its characteristic velocity, as indicated by the oblique lines in the diagram below. For, say, regional atmospheric processes it is on the order of 10 m/s, for river flow it is around 1 m/s, for subsurface flow it is 100 m/day to 1 cm/day. The movement of continental plates is even slower with a few centimetres per year and the landscape evolves with rates of millimetres per century. The characteristic velocities may relate to the speed of particles, the speed by which waves propagate or the rate by which structures grow.
structures or the more geometric shapes imposed by humans. Sometimes the patterns are similar to an enlarged part of itself (i. e. the whole has the same shape as one of the parts), a notion termed self-similarity. More frequent-ly, such scale invariance is only established if the enlargement is squeezed and rotated. This is the case for coastlines and clouds, for example. Whatever the patterns look like, they are a reflection of processes occurring at different scales – or sometimes – a single dynamical mechanism that operates over a wide range of scales. Wherever two media interact under some driving gradient (water and air, air and land, water and sediments, continental shelves, and even traffic over a road layer), patterns appear. The patterns we observe are a legacy of the voyage through the life time of the Earth. We can use them to understand how we arrived at what we see now, or we can use them to predict where we will go in the future. For every pattern we can see, there are many more patterns we cannot see. How do we go from what we can see to what we cannot see? How do we use these patterns?
There are many ways of using these patterns in understanding the Earth system, to test our theories and to infer the dynamics of the pattern forming processes. One particularly interesting attribute are the scales associated with these patterns. How big are the features we see in the patterns? How long do the processes take? Or in other words, what are the space scales and time scales of the processes and what is the relation between the two? These scales can be quantified so we can plot them on graphs. For example, we may measure the diameter of a vortex, the length of a dune, the width of a stream – their space (or length) scales. And we can measure the lifetime of the same vortex, and how long it takes to form the dune or the stream – their time scales. Time scales may also relate to the periods of periodic phenomena such as in tides, and they may relate to fluxes. For example, the cycling of water in the Earth system occurs at different rates and water molecules may stay for a longer time in some parts of the system than in others. The residence times of water in the atmosphere are days, in rivers weeks, in aquifers hundreds of years or more, in the oceans thousands of years, in the ice sheets tens of thousands of years, and in the crust and mantle water stays even longer.
These space and time scales are extremely useful concepts when looking at the Earth system in its entirety. As opposed to the focus on a single process and scale, they open up a whole panorama of different processes that operate at different scales and interact across them. The energy cascade of turbulence is an example of such interactions where the solar energy drives circulations at the global scale which in turn drives consecutively smaller scale motions of the atmosphere and the ocean down to little whirls. As the cascade proceeds to smaller and smaller scales, the variability systematically builds up and at millimetre scales, it can be enormous. Other quantities can cascade as well through scale interactions. For example, when stream sediments are broken into consecutively smaller pebbles through the flow of water, mass cascades towards smaller sizes. When water droplets in clouds coalesce, mass cascades towards larger scales.
Henry Stommel was probably the first Geoscientist to plot the time scales of geo-processes against their space scales in his 1963 Science paper on Varieties of Oceanographic Experience. On p. 572 he noted, “It is convenient to depict these different components of the spectral distribution of sea levels on a diagram ([his] Fig. 1) in which the abscissa is the logarithm of period, P in seconds, and the ordinate is the logarithm of horizontal scale, L in centimetres. If we knew enough we could plot the spectral distribution quantitatively by contours on this period-wavelength plane.”
In this book, the “Stommel diagram” is used to visualize the space and time scales of the processes leading to the patterns shown in the photos. The scales are orders of magnitudes and, as more than one process may be associ-ated with a particular pattern, they may not always be unique. Still, they are indications of the powers of ten scales. In line with Stommel’s idea, each photo has a small inset diagram, with length scale L on the horizontal axis, time scales T on the vertical axes and the small blue ellipse indicates the particular space-time scale combination. In most instances the ellipses have been plotted in an oblique position to indicate that larger space scales are associated with larger time scales. Some phenomena – notably turbulent ones – line up quite linearly on Stommel diagrams so that their size-duration relationships are power laws reflecting the same underlying dynamical mechanism over a range of scales, and there is one diagram (on p. 18) where the scales have been plotted as a blue line. In some
T
L
Tim
e sc
ale
Length scale
1 mm 100 m 10 000 km
1 cm / d
ay
1 mm / s 10 m
/ s
~100 m / d
ay
10-3 102 107 m300 yrs
1 day
1 s
1010 s
105
100
Stommel diagram: Length scales from 1 mm to 10 000 km. Time scales from 1 sec to 300 years. Ranges were se-lected to conform to what humans can experience directly. Left: Ellipse indicates the space-time scales of the un-derlying processes. The oblique lines reflect the characteristic velocities of the processes. Right: Square indicates the space-time scales (in terms of spacing and extent) of the sampling method. One of these diagrams is depicted on all photos in this book, depending on whether the photo represents a process or a sampling method. The ellipses and squares always have the same size for clarity.
T
L
Tim
e sc
ale
Length scale
1 mm 100 m 10 000 km
10-3 102 107 m300 yrs
1 day
1 s
1010 s
105
100
16 A Voyage Through Scales A Voyage Through Scales 17
Stommel’s motivation for his diagram was the sampling design of oceanographic expeditions. As he pointed out, ex-peditions are scientific experiments that need to answer specific questions, so the space and time scales of the sam-pling need to be commensurate to the processes to be captured. If the sampling is too far apart (i. e. their spacing is too large) the small scale variability (in space and time) will fall through the cracks. If the sampling is too short (i. e. their extent is too small) the large scale variability will not be mapped. Finally, if the measurement volume (also termed the support or footprint) is too large, as is the case, e. g. with some satellite sensors, too much of the small scale variability will be smoothed out. In other words, we need to sample at the right space-time scale, otherwise we miss important information. These considerations will help in designing the strategy of explorations with a particular process in mind, similar to Stommel’s strategy of deploying ships and buoys. The fantastic instrumentation depicted in this book all sample at different space and time scales and these are, again, visualized by small diagrams where the spacings and extents of the sampling are represented by squares. For example, a satellite sensor with pixel sizes of 100 m and 30 km coverage, and daily revisits over a period of one year would plot as a rectangle in the Stommel diagram as shown in the right panel on the previous page. Only processes with space-time scales within the rectangle will be captured by the sampling. In the example of the diagram, processes with characteristic velocities of 100 m/day will be captured, while faster (10 m/s) and slower (1 cm/day) processes will not be captured. Generally, the sampling scales plot as rectangles on the diagram but, for clarity, they have been plotted as same-sized squares in this book. Over the years, the Stommel diagram has found its way to essentially all the geoscience disciplines and has been widely used both for visualising process dynamics across scales and for sampling design. The scale concepts have themselves voyaged across the geoscience disciplines.
The usefulness of the scale concepts extends beyond measurements to modelling and predictions. In fact there is a scale problem common to most geosciences: the samples are taken at small scales but we would like to make pre-dictions at much larger scales, a problem termed upscaling. An example are the measurements of carbon fluxes by a flux tower that has a footprint (or sampling volume) of about one hundred metres across. Yet we are interested in the carbon flux of an entire continent. Another example is the measurement of the hydraulic characteristics of a soil that has a sampling volume of a few centimetres across. Yet we are interested in the water fluxes from entire river basins. Similarly, ice cores have a typical diameter of a decimetre, yet we are interested in the characteristics of an entire ice shelf. How do we get from these small sample scales to the scales at which predictions are required? How do we upscale?
The geoscience disciplines have developed a range of methods to do the upscaling. First, there is the statistical ap-proach to relate, say, the soil properties across scales. Geostatistical methods based on spatial correlations are often assisted by auxiliary pattern data of surrogates of the variables of interest as can be obtained by remote sensing methods. The idea is to link the space scales through the observed patterns of the surrogates. The shape of the spatial correlation functions themselves is also of interest, in particular when they span many orders of magnitude. If the patterns are self-similar – or more generally if they are scale invariant – the correlations obey power laws, and (with some “squashing”) the whole of the correlation function has the same shape as a part of it. There are more elaborate methods such as random cascades that exploit other aspects of scale invariance to create fractal patterns at different scales whose degrees of filling space can be quantified by hierarchies of fractional dimensions.
Alternatively, there are deterministic, spatially explicit models of the dynamics of the underlying processes. The incomplete data are fed into the models by methods termed data assimilation and the models themselves are used to fill the gaps between measurements. Often, a scale problem remains if the model cell size is bigger than the sampling volume. The methodological question then is how to get model parameters at larger scales that are con-sistent with the underlying model dynamics from the parameters at smaller scales. Effective parameters are one such way to obtain the consistency. Sub-grid parameterizations and closure relationships are other possibilities. There are fantastic modelling examples in this book that all address the scale issue in some way and simulate ac-curate patterns.
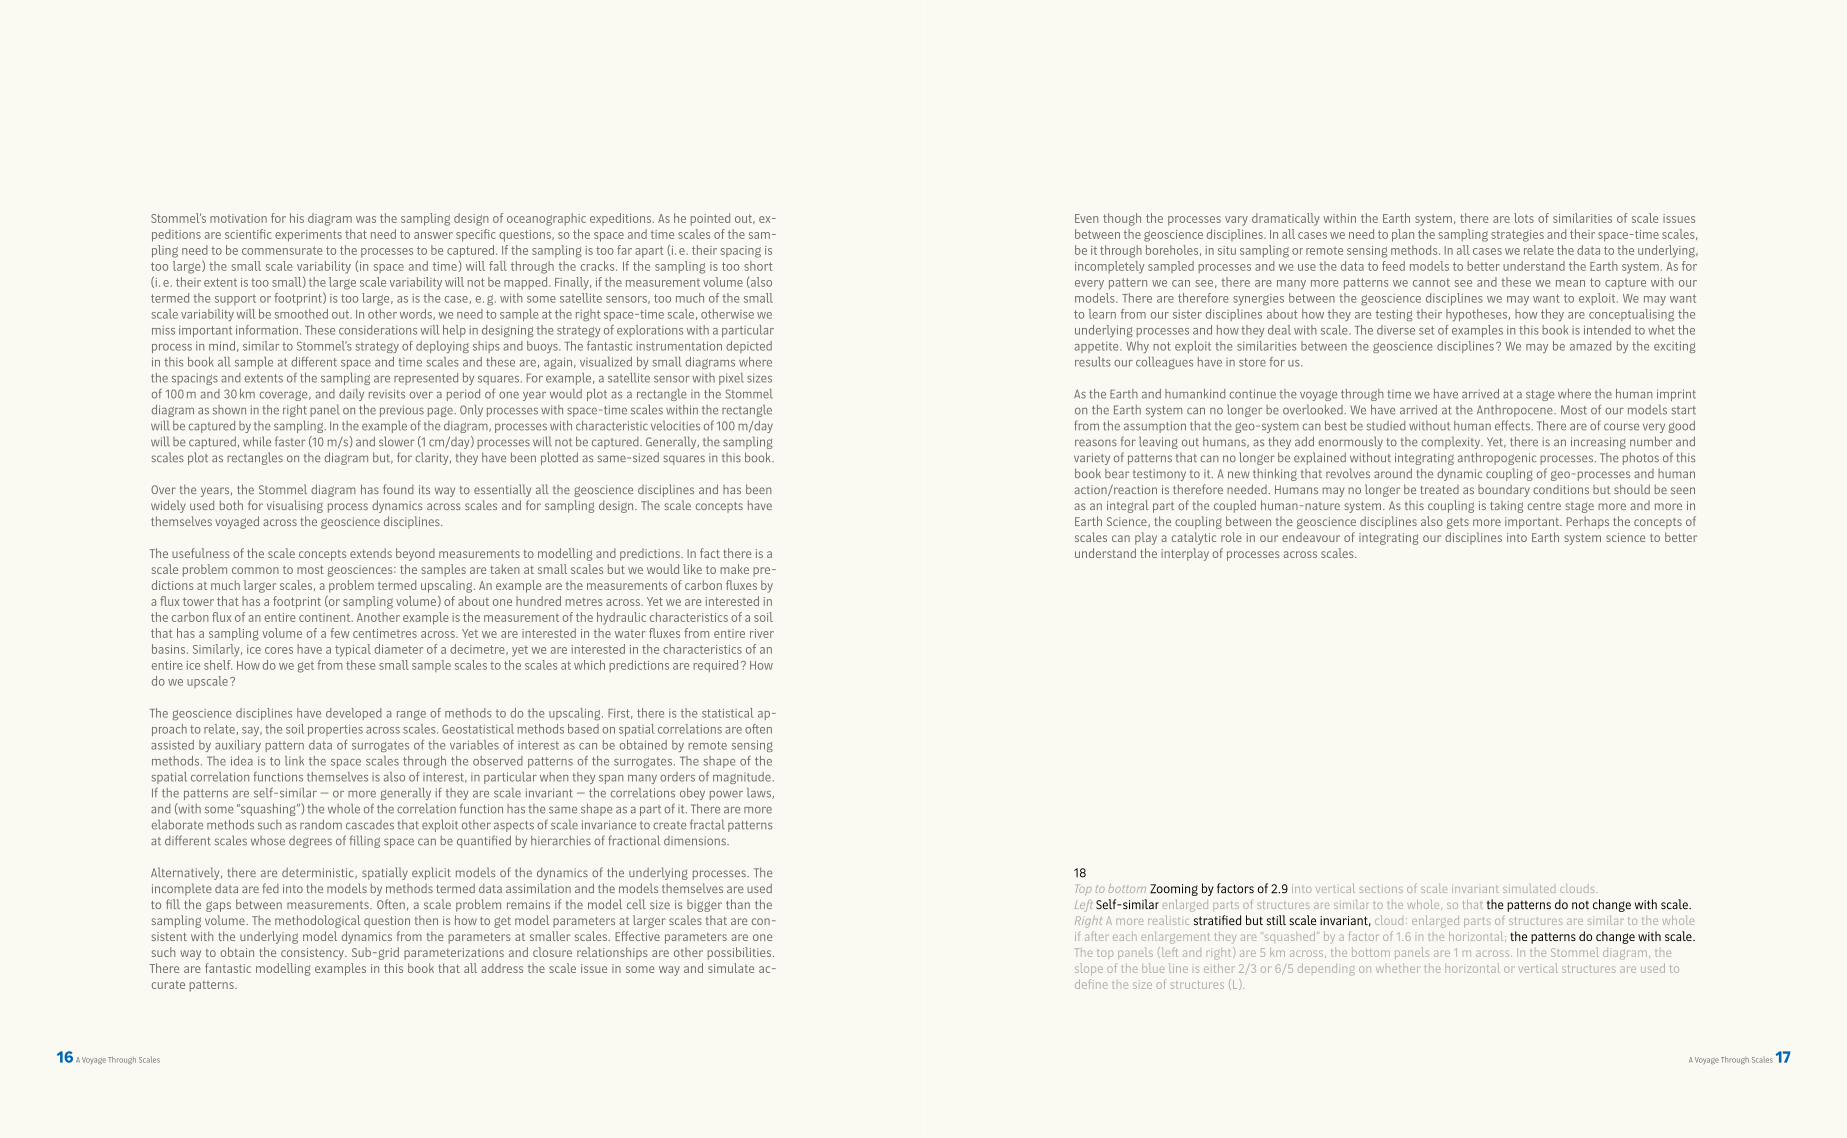
18 Top to bottom Zooming by factors of 2.9 into vertical sections of scale invariant simulated clouds. Left Self-similar enlarged parts of structures are similar to the whole, so that the patterns do not change with scale. Right A more realistic stratified but still scale invariant, cloud: enlarged parts of structures are similar to the whole if after each enlargement they are “squashed” by a factor of 1.6 in the horizontal; the patterns do change with scale. The top panels (left and right) are 5 km across, the bottom panels are 1 m across. In the Stommel diagram, the slope of the blue line is either 2/3 or 6/5 depending on whether the horizontal or vertical structures are used to define the size of structures (L).
Even though the processes vary dramatically within the Earth system, there are lots of similarities of scale issues between the geoscience disciplines. In all cases we need to plan the sampling strategies and their space-time scales, be it through boreholes, in situ sampling or remote sensing methods. In all cases we relate the data to the underlying, incompletely sampled processes and we use the data to feed models to better understand the Earth system. As for every pattern we can see, there are many more patterns we cannot see and these we mean to capture with our models. There are therefore synergies between the geoscience disciplines we may want to exploit. We may want to learn from our sister disciplines about how they are testing their hypotheses, how they are conceptualising the underlying processes and how they deal with scale. The diverse set of examples in this book is intended to whet the appetite. Why not exploit the similarities between the geoscience disciplines? We may be amazed by the exciting results our colleagues have in store for us.
As the Earth and humankind continue the voyage through time we have arrived at a stage where the human imprint on the Earth system can no longer be overlooked. We have arrived at the Anthropocene. Most of our models start from the assumption that the geo-system can best be studied without human effects. There are of course very good reasons for leaving out humans, as they add enormously to the complexity. Yet, there is an increasing number and variety of patterns that can no longer be explained without integrating anthropogenic processes. The photos of this book bear testimony to it. A new thinking that revolves around the dynamic coupling of geo-processes and human action/reaction is therefore needed. Humans may no longer be treated as boundary conditions but should be seen as an integral part of the coupled human-nature system. As this coupling is taking centre stage more and more in Earth Science, the coupling between the geoscience disciplines also gets more important. Perhaps the concepts of scales can play a catalytic role in our endeavour of integrating our disciplines into Earth system science to better understand the interplay of processes across scales.
18 A Voyage Through Scales A Voyage Through Scales 19
When Will i cease to be amazed and begin to comprehend ? W H a T a m I ? What is the World in Which i live ?
galileo galilei
T
L20 Aurora borealis in Norway 22 Intensive agriculture in Beaumont, Australia 24 Licmophora flabellata, a sessile diatom