Embed Size (px)
Citation preview

A Water Quality Trading How To Manual
Guidance on developing a water quality trading strategy based on protocols specified in “Guidance for Implementing Water Quality Trading in WPDES Permits”
Guidance Number: 3400-2013-03
Wisconsin Department of Natural Resources
09/09/2013
This document is intended solely as guidance, and does not contain any mandatory requirements except where requirements found in statute or administrative rule are referenced. This guidance does not establish or affect legal rights or obligations, and is not finally determinative of any of the issues addressed. This guidance does not create any rights enforceable by any party in litigation with the State of Wisconsin or the Department of Natural Resources. Any regulatory decisions made by the Department of Natural Resources in any matter addressed by this guidance will be made by applying the governing statutes and administrative rules to the relevant facts.

2 | P a g e
Table of Contents List of Figures ................................................................................................................................................ 4
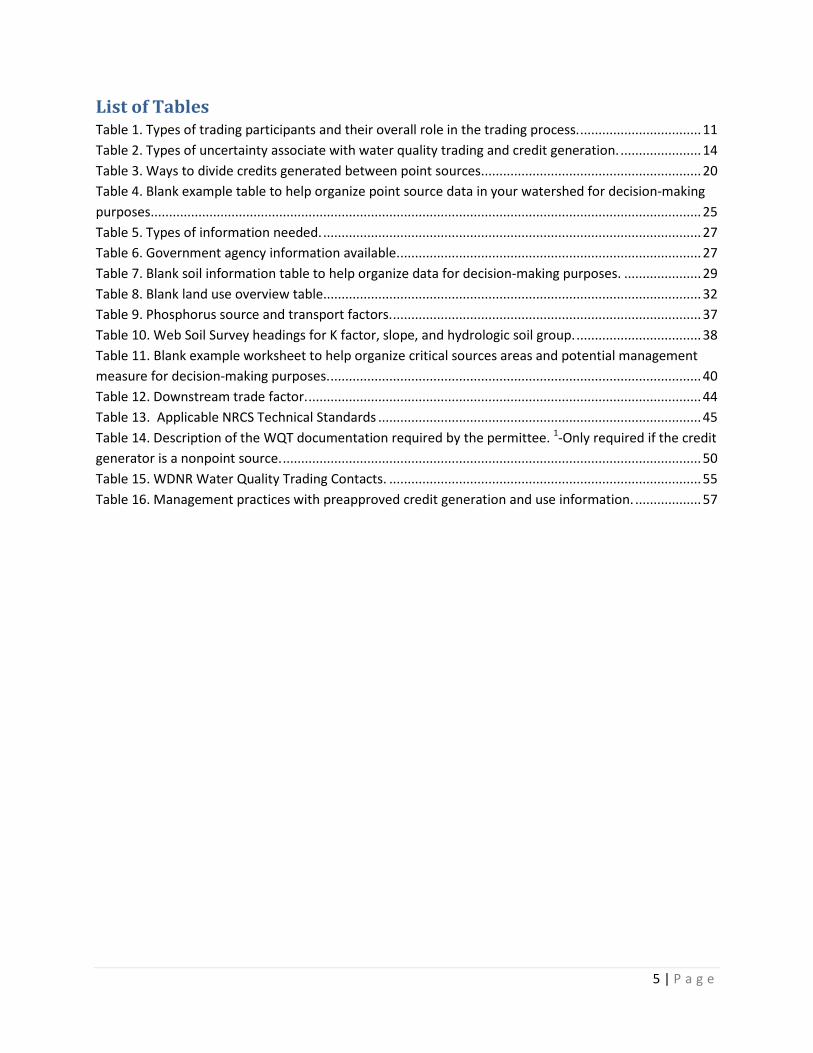
List of Tables ................................................................................................................................................. 5
Abbreviations/Acronyms .............................................................................................................................. 6
Background ................................................................................................................................................... 7
Section 1. Introduction ................................................................................................................................. 8
Deciding to Select Trading .................................................................................................................... 8
Adaptive Management vs. Water Quality Trading ............................................................................... 8
Section 2. Components of Water Quality Trading ...................................................................................... 10
Pollutant .............................................................................................................................................. 10
Participants ......................................................................................................................................... 10
Credit ................................................................................................................................................... 11
Credit Threshold .................................................................................................................................. 12
Trade Ratio .......................................................................................................................................... 13
Location ............................................................................................................................................... 15
Timing .................................................................................................................................................. 15
Section 3. Selecting Trading as a Compliance Option ................................................................................. 16
Trading for Lagoons and Other Small Discharges ............................................................................... 17
Section 4. Trading Feasibility in Your Watershed ....................................................................................... 18
1. Calculate pollutant offset needed................................................................................................... 18
2. Identify credit broker or exchange, if applicable ............................................................................ 22
3. Identify potential credit generators ................................................................................................ 24
4. Assess Availability of Credit ............................................................................................................ 33
Section 5. Developing a Trading Strategy ................................................................................................... 34
Targeting Willing Partnerships ............................................................................................................ 34
Working with Significant Sources of Pollution .................................................................................... 35
Credit Economics ................................................................................................................................ 41
Section 6. Implementing a Trading Strategy ............................................................................................... 46

3 | P a g e
Quantifying Reductions ....................................................................................................................... 46
Documentation ................................................................................................................................... 48
Section 7. Contact Information ................................................................................................................... 54
Appendix A. Uncertainty Ratios .................................................................................................................. 56
Appendix B. Notice of Intent Form ............................................................................................................. 61
Appendix C. Water Quality Trading Checklist ............................................................................................. 64
Appendix D: Eight Easy Steps to Finding Your 12‐digit Hydrologic Unit Code (HUC) ................................. 67
Appendix E. Example Trade Agreement for Point to Point Source Trades ................................................. 74
Appendix F. Example Trade Agreement for Point to Nonpoint Source Trades .......................................... 77
Appendix G. Management Practice Registration ........................................................................................ 82
Appendix H. Notice of Termination ............................................................................................................ 84

4 | P a g e
List of Figures Figure 1. Brief comparison between adaptive management and water quality trading. ............................ 9 Figure 2. Water quality trading components. ............................................................................................. 10 Figure 3. Conceptual diagram of credit thresholds. ................................................................................... 12 Figure 4. Process a point source would follow to select trading as their compliance option. ................... 16 Figure 5. Example HUC 12 watersheds. ...................................................................................................... 19 Figure 6. Example map of soil erodibility (K) factor within a given watershed.. ........................................ 29 Figure 7. Example land use map of the Yellow River Watershed. .............................................................. 31 Figure 8. Factors that make an ideal trading scenario. ............................................................................... 34 Figure 9. Example source and transport factors to identify critical source areas for phosphorus. ............ 40 Figure 10. Factors that affect the cost of trading credits. .......................................................................... 41 Figure 11. Process to successfully implement a management practice. .................................................... 42 Figure 12. Method for quantifying credits generated by a traditional point source discharge. ................ 46 Figure 13. Method for quantifying credits generated by nonpoint or other point sources. ...................... 47 Figure 14. Documentation required for trading. ........................................................................................ 49
5 | P a g e
List of Tables Table 1. Types of trading participants and their overall role in the trading process. ................................. 11 Table 2. Types of uncertainty associate with water quality trading and credit generation. ...................... 14 Table 3. Ways to divide credits generated between point sources. ........................................................... 20 Table 4. Blank example table to help organize point source data in your watershed for decision‐making purposes. ..................................................................................................................................................... 25 Table 5. Types of information needed. ....................................................................................................... 27 Table 6. Government agency information available. .................................................................................. 27 Table 7. Blank soil information table to help organize data for decision‐making purposes. ..................... 29 Table 8. Blank land use overview table....................................................................................................... 32 Table 9. Phosphorus source and transport factors. .................................................................................... 37 Table 10. Web Soil Survey headings for K factor, slope, and hydrologic soil group. .................................. 38 Table 11. Blank example worksheet to help organize critical sources areas and potential management measure for decision‐making purposes. ..................................................................................................... 40 Table 12. Downstream trade factor. ........................................................................................................... 44 Table 13. Applicable NRCS Technical Standards ........................................................................................ 45 Table 14. Description of the WQT documentation required by the permittee. 1‐Only required if the credit generator is a nonpoint source. .................................................................................................................. 50 Table 15. WDNR Water Quality Trading Contacts. ..................................................................................... 55 Table 16. Management practices with preapproved credit generation and use information. .................. 57

6 | P a g e
Abbreviations/Acronyms This list contains the most common abbreviations used in this document.
BCC Bioaccumulative Chemicals of Concern BMP “Best Management Practice”; management practices utilized to target and reduce pollution
runoff DATCP Department of Agriculture, Trade and Consumer Protection DMR Discharge Monitoring Report EPA United States Environmental Protection Agency GIS Geographic Information System HUC “Hydrologic Unit Code”; Hydrologic Unit Codes are a standardized watershed classification
system developed by USGS used to identify individual watersheds LCD Land Conservation Department MOU “Memorandum of Understanding”; a document describing a bilateral or multilateral
agreement between parties MGD Million gallons per day mg/L “Milligrams per liter”; common metric measurement used in measuring amount of
phosphorus in liquid, 1000 mg/L equals 1 gram/L or 1000 parts per million (ppm) MS4 Municipal Separate Storm Sewer System NPS “Nonpoint Sources”; sources of phosphorus pollution from sources other than municipal and
industrial discharges NRCS Natural Resources Conservation Service P Phosphorus P Index “Phosphorus Index”; a planning and assessment tool for managing runoff phosphorus losses
from cropland that estimates average runoff P delivery to the nearest surface water PRESTO “Pollutant load Ratio EStimation Tool”; a GIS‐based model that compares the average annual
phosphorus loads originating from point and nonpoint sources within a watershed PS “Point Sources”; pollution from municipal wastewater, industry, or other permitted discharges POTW Publicly Owned Treatment Works SWDV “Surface Water Data Viewer”; WDNR’s external data delivery system that provides interactive
webmapping tools for a wide variety of datasets TBEL Technology‐Based Effluent Limit TMDL Total Maximum Daily Load TSS Total Suspended Solids μg/L “Micrograms per liter”; common metric measurement used in measuring amount of
phosphorus in liquid, 1000 µg/L equals 1 mg/L or 1000 parts per billion (ppb) USGS United States Geological Survey WDNR Wisconsin Department of Natural Resources WPDES Wisconsin Pollutant Discharge Elimination System WQBEL Water Quality‐Based Effluent Limits WQT Water Quality Trading WWTF Wastewater Treatment Facility

7 | P a g e
Background The purpose of this document is to help point sources and their consultants as well as other interested entities understand water quality trading, with an emphasis on developing a successful trading strategy. This document summarizes guidance and protocols specified in “Guidance for Implementing Water Quality Trading in WPDES Permits (2013)”, which is available for download at http://dnr.wi.gov/topic/SurfaceWater/WaterQualityTrading.html. This document will not contain a detailed description of the rules and protocols surrounding water quality trading, nor will it discuss, in detail, the reasoning behind them. For a more complete discussion of these details, see the internal guidance document as well as the regulatory requirements for water quality trading as specified in s. 283.84, Wis. Stats. This guidance document will be updated as experience is gained in developing and implementing water quality trading strategies.
This document is broken up into 7 main sections, with additional information provided in various appendices, to allow for straightforward navigation within the document. The following hyperlinks are also available to take you directly to the section(s) you are most interested in:
Information you may be seeking Hyperlink to direct you Components of Water Quality Trading Section 2. Components of Trading Benefits of Water Quality Trading Section 3. Selecting Water Quality Trading Determining Trading Feasibility Section 4. Trading Feasibility Developing a Water Quality Trade Section 5. Developing the Trade Calculating a Trade Ratio Section 5. Credit Economics Implementing a Trading Strategy Section 6. Implementation Quantifying Credits Reductions Section 6. Quantify Reductions Contact Information for Additional Help Section 7. Contact Information Uncertainty Ratios to Calculate a Trade Ratio Appendix A. Uncertainty Ratios Notice of Intent Appendix B. Notice of Intent Form

8 | P a g e
Section 1. Introduction Water Quality Trading (WQT or “trading”) may be used by municipal and industrial Wisconsin Pollutant Discharge Elimination System (WPDES) permit holders to demonstrate compliance with water quality‐based effluent limitations (WQBELs). Generally, trading involves a point source facing relatively high pollutant reduction costs compensating another party to achieve less costly pollutant reduction with the same or greater water quality benefit. In other words, trading provides point sources with the flexibility to acquire pollutant reductions from other sources in the watershed to offset their point source load so that they will comply with their own permit requirements. Trading is not a mandatory program or regulatory requirement, but rather a market‐based option that may enable some industrial and municipal facilities to meet regulatory requirements more cost‐effectively. Trading is not a new compliance option but has historically been underutilized, perhaps because there were insufficient economic incentives to warrant its use. Now that more restrictive water quality standards are effective in Wisconsin, such as those for phosphorus, trading may be economically preferable to other compliance options.
Deciding to Select Trading Trading allows point source dischargers to work with nonpoint sources and other facilities in the same watershed to achieve compliance with WPDES permit limits. There are many benefits to trading:
1. Permit compliance through trading may be economically preferable to other compliance options.
2. New and expanding point source discharges can utilize trading to develop new economic opportunities in a region, while still meeting water quality goals.
3. Permittees, and the point and nonpoint sources that work cooperatively with them, can demonstrate their commitment to the community and to the environment by working together to protect and restore local water resources.
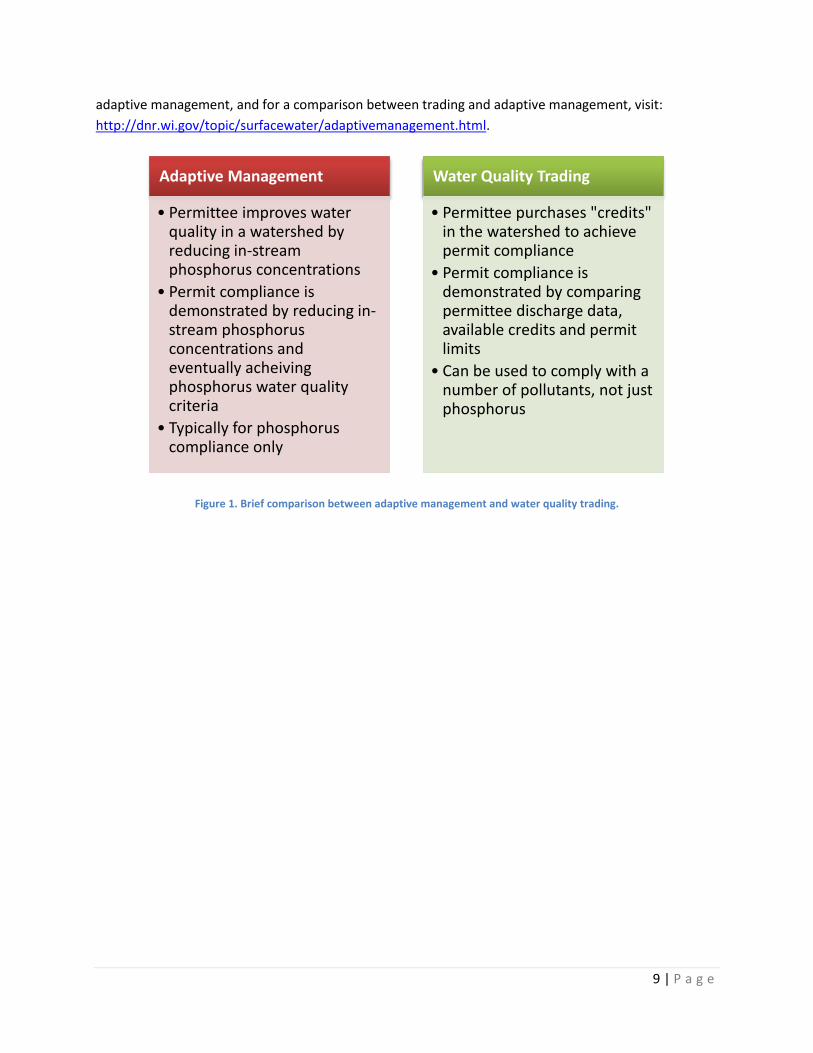
Adaptive Management vs. Water Quality Trading Adaptive management is often confused with trading, as both options allow permittees to work with nonpoint or other point sources of phosphorus in a watershed to reduce the overall phosphorus load to a given waterbody. However, these options are not the same (Figure 1). Adaptive management is solely focused on phosphorus compliance and improving water quality so that the applicable phosphorus criterion is met. Trading is not limited to phosphorus and may be used to meet limits for various compounds. Trading must result in improved water quality (according to s. 283.84 (1m)(a), Wis. Stats.), which is achieved by requiring a greater pollutant load reduction than would otherwise be achieved without trading.
In other words, trading focuses on compliance with a discharge limit (offsetting the amount of a given pollutant in the effluent); while adaptive management focuses on compliance with phosphorus criteria (meeting an acceptable in‐stream phosphorus concentration). More detailed information about adaptive management has been presented in the Adaptive Management Handbook. Please refer to that document if you are interested in learning more about this option. For additional information on
9 | P a g e
adaptive management, and for a comparison between trading and adaptive management, visit: http://dnr.wi.gov/topic/surfacewater/adaptivemanagement.html.
Figure 1. Brief comparison between adaptive management and water quality trading.
Adaptive Management
• Permittee improves water quality in a watershed by reducing in‐stream phosphorus concentrations
• Permit compliance is demonstrated by reducing in‐stream phosphorus concentrations and eventually acheiving phosphorus water quality criteria
• Typically for phosphorus compliance only
Water Quality Trading
• Permittee purchases "credits" in the watershed to achieve permit compliance
• Permit compliance is demonstrated by comparing permittee discharge data, available credits and permit limits
• Can be used to comply with a number of pollutants, not just phosphorus

10 | P a g e
Section 2. Components of Water Quality Trading Before a successful trading strategy can be developed, it is important to have a clear understanding of water quality trading components (Figure 2). There are seven main components to a trade: pollutant, trading participants, pollution reduction credit, credit threshold, trade ratio, location, and timing. Each of these components must be adequately addressed in a trading strategy. For a detailed description of these components, see the “Guidance for Implementing Water Quality Trading in WPDES Permits (2013)”. A summary of each component is provided:
Pollutant The trading pollutant, or simply “pollutant”, refers to the regulated contaminant being traded. Any pollutant can be traded, except for bioaccumulative chemicals of concern (BCCs) as identified in ch. NR 105, Wis. Adm. Code. However, the Wisconsin Department of Natural Resources (WDNR) anticipates that phosphorus and total suspended solids (TSS) will be the parameters most frequently traded.
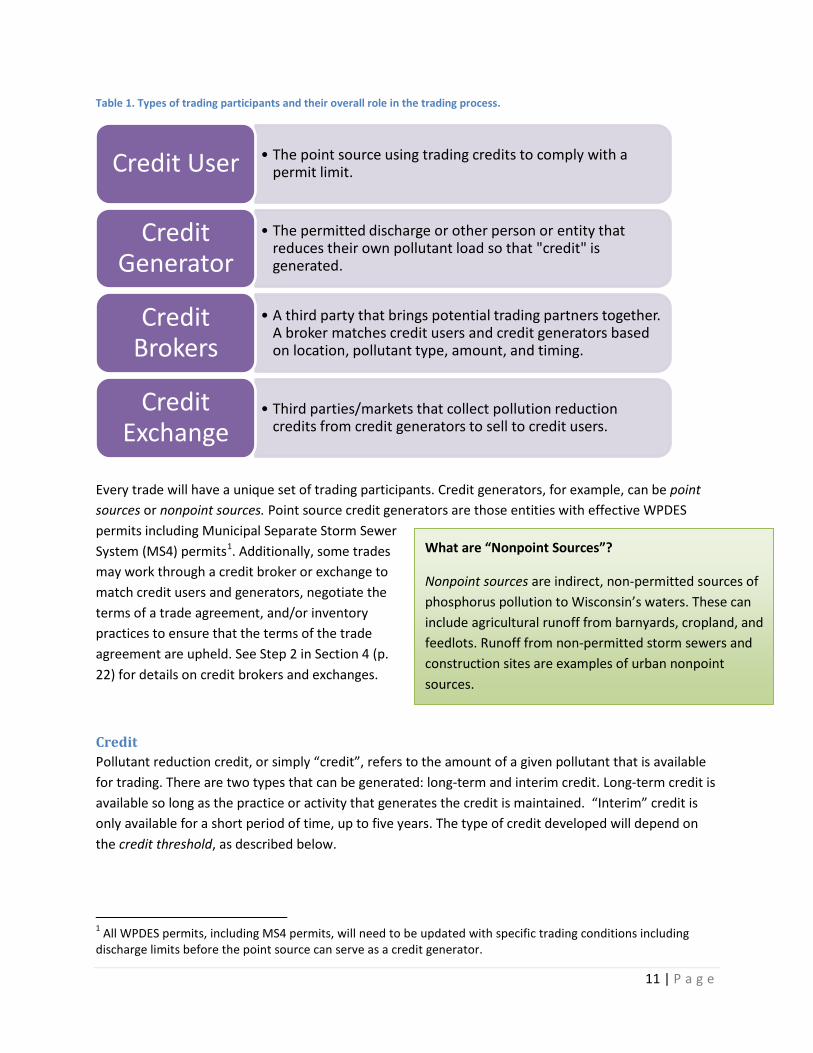
Participants “Trading participants” refers to the persons or entities involved in the trade. There are several potential roles for trading participants (Table 1).
Trading Components
Pollutant
Participants
Credit
Credit Threshold Trade Ratio
Location
Timing
Figure 2. Water quality trading components.
11 | P a g e
Table 1. Types of trading participants and their overall role in the trading process.
Every trade will have a unique set of trading participants. Credit generators, for example, can be point sources or nonpoint sources. Point source credit generators are those entities with effective WPDES permits including Municipal Separate Storm Sewer System (MS4) permits1. Additionally, some trades may work through a credit broker or exchange to match credit users and generators, negotiate the terms of a trade agreement, and/or inventory practices to ensure that the terms of the trade agreement are upheld. See Step 2 in Section 4 (p. 22) for details on credit brokers and exchanges.
Credit Pollutant reduction credit, or simply “credit”, refers to the amount of a given pollutant that is available for trading. There are two types that can be generated: long‐term and interim credit. Long‐term credit is available so long as the practice or activity that generates the credit is maintained. “Interim” credit is only available for a short period of time, up to five years. The type of credit developed will depend on the credit threshold, as described below.
1 All WPDES permits, including MS4 permits, will need to be updated with specific trading conditions including discharge limits before the point source can serve as a credit generator.
• The point source using trading credits to comply with a permit limit. Credit User
• The permitted discharge or other person or entity that reduces their own pollutant load so that "credit" is generated.
Credit Generator
• A third party that brings potential trading partners together. A broker matches credit users and credit generators based on location, pollutant type, amount, and timing.
Credit Brokers
• Third parties/markets that collect pollution reduction credits from credit generators to sell to credit users.
Credit Exchange
What are “Nonpoint Sources”?
Nonpoint sources are indirect, non‐permitted sources of phosphorus pollution to Wisconsin’s waters. These can include agricultural runoff from barnyards, cropland, and feedlots. Runoff from non‐permitted storm sewers and construction sites are examples of urban nonpoint sources.

12 | P a g e
Credit Threshold “Credit threshold” refers to the amount of pollutant reduction that needs to be achieved before credits are actually generated. Figure 3 illustrates the basic concept behind credit thresholds.
Figure 3. Conceptual diagram of credit thresholds.
The credit threshold for a point source credit generator is based on the applicable water quality‐based effluent limit (WQBEL) or technology‐based effluent limit (TBEL), whichever is more stringent. Simply put, any reduction that exceeds the amount needed to comply with the applicable WQBEL or TBEL is available to trade2.
Example: A point source discharge has a phosphorus WQBEL of 0.5 mg/L, expressed as a monthly average. At current effluent flows, the WQBEL represents a mass of 6 lbs/day. The point source discharge is able to achieve an average monthly phosphorus concentration of 0.3 mg/L after minor improvements to its treatment system. To serve as a credit generator, the point source in question accepts revised limits of 0.3 mg/L and 3.6 lbs/day as monthly averages in their WPDES permit so that 2.4 lbs/day as a monthly average of phosphorus is available to sell as a trade. Again, this credit is long‐term, and will be available as long as the point source maintains compliance with the 0.3 mg/L limit in their permit, and the phosphorus WQBEL remains the same over time.
For urban stormwater systems with a WPDES permit (permitted MS4s), the credit threshold typically equals the statewide performance standard (the calculated 20% TSS reduction in accordance with s. NR 151(2)(b)1.b, Wis. Adm. Code). In areas with an approved TMDL, the credit threshold for permitted MS4s is equal to the more restrictive of the wasteload allocation (WLA) or the 20% TSS reduction. This can be expressed either on a mass basis (lbs/yr) or on a percent reduction basis.
The credit threshold for the generation of credits by a nonpoint source, which includes both agricultural sources and non‐permitted urban sources, typically equals the current pollutant load. All trades that
2 The credit generator and credit user must have specific language in their WPDES permits before credit can be exchanged. Additionally, the credit generator will need to reduce the amount of the pollutant they are currently discharging to ensure that water quality improvements result from the trade. See Section 6, p. 47, for details.
Credits are not being generated
Credits are being generated
Credit Threshold

13 | P a g e
reduce nonpoint source pollution loads from their current level, and occur with nonpoint sources outside of a TMDL watershed, will generate credits for the life of the management practice (aka are considered “long‐term” trades).
In watersheds with an approved TMDL, the credit threshold is set equal to the TMDL load allocation. If a credit user works with a nonpoint source credit generator to comply with the TMDL load allocation, “interim” credit is generated, meaning the point source will receive credit for these reductions for five years. “Long‐term” credit is given for reductions that go above and beyond the load allocation in TMDL areas.
Example: A farm field has a Phosphorus Index (P Index) of 9. The TMDL load allocation (LA) is equivalent to a P Index of 4. In order to sell credits to a point source discharge, a farmer reduces the P Index from 9 to 2 through conservation and best management practices. Because the LA is 4, there are 2 lbs/ac/year available for trading as long‐term credit. The remaining 5 lbs/ac/year is also available for trading, but as interim credit3, available for the first 5 years only.
Trade Ratio WQBELs are calculated using actual ambient and effluent data for a specific point on the receiving water. All trades have some margin of uncertainty associated with them and therefore require a trade ratio (Table 2).
3 See “Guidance for Implementing Water Quality Trading in WPDES Permits (2013)” for further details about interim credit compared to long‐term credit.
What is the “Phosphorus Index” or “P Index”?
The Wisconsin P Index is a planning and assessment tool for managing runoff phosphorus losses from cropland. The P Index is calculated by estimating average runoff P delivery (in lbs/ac/yr) from each field to the nearest surface water in a year given the soil and crop conditions. The higher the P‐index value, the greater the likelihood that that field is contributing P to local water bodies.

14 | P a g e
Table 2. Types of uncertainty associated with trading and credit generation.
Trade ratios are designed to account for the uncertainties specified in Table 2 using the equation below:
Trade Ratio = Delivery + Downstream + Equivalency + Uncertainty – Habitat Adjustment : 1
Trade ratios vary given site-specific conditions and the relative location of the trade. To make trading as economically efficient as possible, credit users should seek out trades that result in the smallest trade ratio possible. There are several ways to reduce the trade ratio:
• Avoid a downstream factor by trading with a credit generator located upstream of your discharge point
• Avoid a delivery factor by trading within the same HUC‐12 watershed (see Figure 5, p. 19 for details on watershed size)
• Use practices with a high margin of certainty, i.e., those practices with a low uncertainty ratio (Appendix A, p. 56)
• Consider point to point source trades before trading with nonpoint sources
Trade Ratio Example: A nonpoint source chooses to generate phosphorus credits using filter strips for a point source on the same stream segment. There are no equivalency or delivery concerns associated with phosphorus, so these components can be dropped from the trade ratio calculation. The uncertainty ratio for filter strips is 2:1 (Appendix A, p. 56). Given the above, the applicable trade ratio is 2:1, meaning 2 pounds of phosphorus reduction is equivalent to 1 pound of pollutant reduction credit.
•Accounts for the distance between the credit generator and the credit user, and the impact that this distance can have on fate and transport of the pollutant. Delivery
•Accounts for local water quality impacts if the credit user is upstream of the credit generator. Downstream
•Accounts for situations where trading partners discharge different forms of the traded pollutant. (Example: Total Nitrogen vs. Nitrate‐Nitrogen). Equivalency
•Accounts for modeling inaccuracies used to quantify load reductions. For trades with nonpoint source credit generators only (see Appendix A). Uncertainty
•Used to capture ancillary benefits from select practices that benefit habitat in addition to capturing the pollutant of concern. Only applies to wetland creation, wetland restoration, and stream habitat, improvement and management practices.
Habitat Adjustment

15 | P a g e
The minimum trade ratio for point to point source trades is 1.1:1, while the minimum trade ratio for point to nonpoint source trades is 1.2:1. See “Guidance for Implementing Water Quality Trading in WPDES Permits (2013)” for details on calculating trade ratios. Specific questions about trade ratios can also be directed to local or statewide Water Quality Trading Coordinators (see Section 7, p. 54 for contact information).
Location In order to conform to the requirements of the federal Clean Water Act and EPA, the credit user and generator must discharge, either directly or indirectly, to the same waterbody. To minimize the credit ratio, it is also strongly encouraged that the credit user be downstream of the credit generator(s). For example, a credit user on the Fox River should trade with a credit generator at an upstream location on the Fox River, or on an upstream tributary to the Fox River.
Timing As mentioned, trading focuses on offsetting the amount of a pollutant in the effluent discharge. Credits must be generated before they can be used to offset this pollution. In other words, credits must be generated before the water quality‐based effluent limit takes effect in the WPDES permit. Credits must also continue to be generated throughout the permit term to maintain permit compliance through trading. Credit generated by nonpoint sources can be used throughout the calendar year to comply with a WQBEL. Credits generated by point sources need to be used in the same month they are generated in. As previously mentioned, credit will not be given for those practices being used to comply with permit requirements.
Can I take credit for practices recently installed?
In some situations, point source discharges may be able take credit for practices that the point source has previously installed or previously funded, if expressly approved by WDNR. Ineligible historical practices include practices that are no longer generating credits, are being used to comply with permit requirements or state performance standards, or were funded through Targeted Runoff Management grants or other grants with similar restrictions. Other restrictions may also apply. Contact your local trading coordinator to discuss specific practices of interest (Section 7, p. 54).

16 | P a g e
Section 3. Selecting Trading as a Compliance Option If you represent a municipality, sewer district or an industry, you should review your compliance options now, before your permit is due for renewal so that you have enough time to make informed compliance decisions. WDNR anticipates that developing and implementing a successful trading strategy may take 3‐5 years to find credit generators, develop contracts, select and implement management practices, and begin generating credits with those practices. While time to consider options may be granted during the permit term through a compliance schedule, this should not be assumed, and may be insufficient to develop and implement an entire trading strategy (Figure 4). Compliance options can include treatment optimization, traditional facility upgrades, adaptive management, and trading, among other things. A facility should review all of these options to determine which will achieve compliance in the most economically efficient way possible. See Section 3 of the Adaptive Management Handbook for a more detailed comparison between trading and adaptive management: http://dnr.wi.gov/topic/surfacewater/adaptivemanagement.html. Section 4 (p. 18) of this guidance can help you evaluate the water quality trading option and determine its feasibility in your watershed. Once a facility chooses trading as its preferred compliance option, the facility should submit a Notice of Intent (located in Appendix B on p. 57) to their local WDNR wastewater engineer or specialist, or trading coordinator. WDNR will use the information in the Notice of Intent to confirm trading eligibility in writing to the applicant. Upon approval of the Notice of Intent, a facility should begin developing a trading plan. See Sections 5 and 6 (pp. 33 and 46, respectively) for more details on developing and implementing a trading plan. The completed plan should be submitted to WDNR for review and approval along with a checklist summarizing the plan (Appendix C, p. 64). The plan and checklist should be submitted to WDNR with the permit application, or with the Final Compliance Alternative Plan step in the phosphorus compliance schedule, if a compliance schedule extending beyond the term of the permit is granted. A permit modification request must also be submitted with the plan, if a facility was granted a traditional compliance schedule (less than 5 years). Permit modification is required in this scenario to allow public comment opportunities on the trading plan and to incorporate
Evaluate compliance options
Select trading as preferred compliance option
Submit Notice of Intent to WDNR
Develop a trading plan
Submit trading plan and checklist with either permit application or request for permit modification
Public comment period on final water quality trading strategy
Permit reissued, modified or revoked and reissued
Figure 4. Process a point source would follow to select trading as their compliance option.
17 | P a g e
trading conditions into the permit (see Section 5, p. 46). Some facilities may be granted an extended compliance schedule (5 years or more) for phosphorus. In these scenarios, the applicant is not required to submit a permit modification request. Rather, WDNR will use the permit reissuance process to allow public comment on the trading plan, and incorporate trading requirements into the reissued permit (permit term 2). All trading decisions will be public noticed at http://dnr.wi.gov/topic/wastewater/publicnotices.html. This will include the trading plan used to develop the WPDES permit, as well as any other trading decision that requires permit modification.
Trading for Lagoons and Other Small Discharges Municipal and industrial dischargers, no matter their size, should review all applicable compliance options, including trading, to determine which compliance option is best for them. There are no special eligibility requirements for small discharges like municipal lagoon systems. These dischargers must meet the same requirements and expectations as other discharges (see Section 2, p. 10, for details). Given this, trading may or may not be a viable compliance option for all discharges. For some, the costs associated with trading may not be economically feasible. For others, credit generators may not be available within their watershed.
In many cases, however, trading may be the preferable compliance option given the small amount of mass discharged from these facilities, and the small amount of credit that needs to be generated to offset this amount. To make trading more economically desirable, facilities should try to avoid trades that require high trade ratios.
If all available compliance options, including trading and adaptive management, are economically infeasible, the discharger may request a water quality standards variance. Requests for water quality standards variances are generally addressed in s. 283.15, Wis. Stats., and Subchapter III in ch. NR 200, Wis. Adm. Code. Lagoon discharges are also eligible for the streamlined phosphorus variance request process pursuant to Section NR 217.19, Wis. Adm. Code. See Section 3.03 of the Phosphorus Implementation Guidance for details: http://dnr.wi.gov/topic/surfacewater/phosphorus.html.

18 | P a g e
In this step you will: • Define your watershed boundaries and watershed area • Determine your applicable WPDES discharge limit(s) • Quantify the offset needed
Section 4. Trading Feasibility in Your Watershed This section contains guidance to help you confirm that sufficient credits are available in your watershed and that the administrative structure is in place to develop a successful trading strategy. There are four steps to determining the feasibility of trading in your watershed:
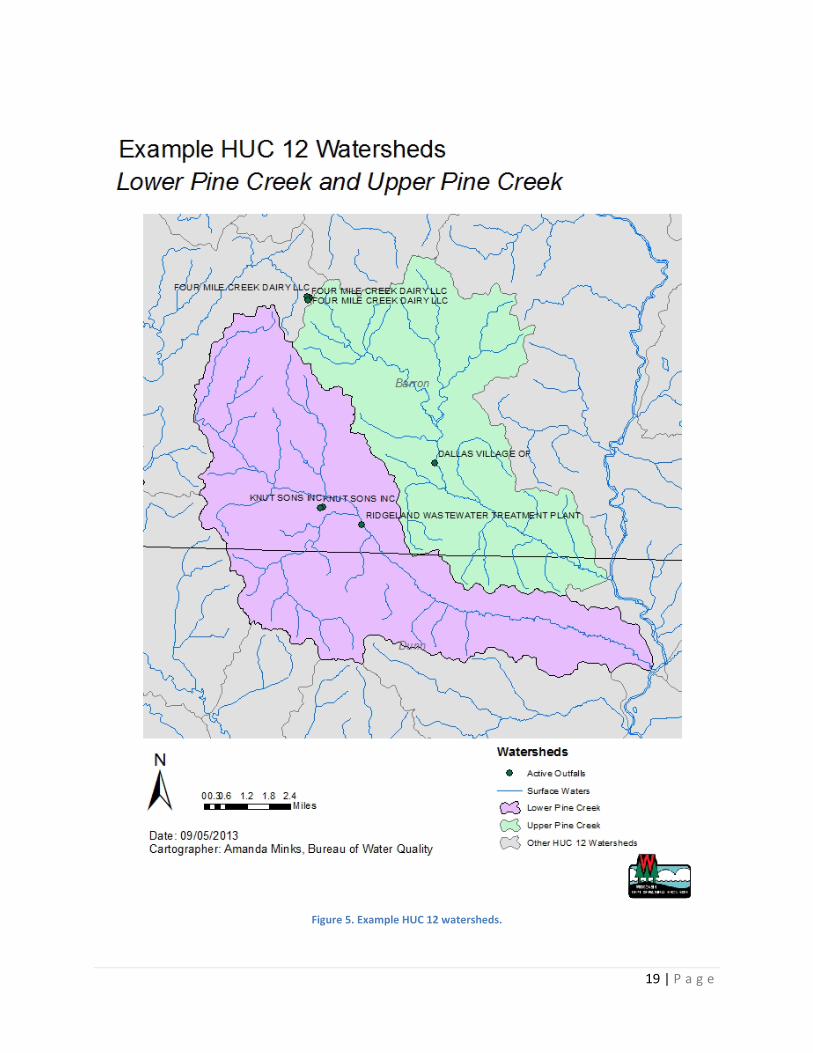
1. Calculate pollutant offset needed The goal of this step is to calculate the pollutant offset required. To make this calculation you need to know your watershed boundary and your applicable WQBEL. Identifying Your Watershed Typically, water quality trading should occur between credit users and generators in the same 12‐digit Hydrologic Unit Code watershed (HUC 12). Also, credit generators should be upstream of the credit user, if possible. If you are unsure which HUC 12 your discharge is located in, see Appendix D on page 67 for detailed instructions on how to identify your HUC 12 watershed. Figure 5 illustrates the geographic extent of example HUC 12 watersheds in Wisconsin.
Step 1 Calculate pollutant offset needed
Step 2 Identify a credit broker/exchange, if applicable
Step 3 Identify potential credit generators
Step 4 Assess availability of credit
19 | P a g e
Figure 5. Example HUC 12 watersheds.

20 | P a g e
WDNR may approve trades to alternative adjacent HUC 12s or within larger HUCs (such as a HUC 10) on a case‐by‐case basis. Scenarios where alternative trading areas may be approved include point sources discharging to effluent dominated stream segments or waters with an EPA approved TMDL. Also, discharges to waterbodies classified as limited aquatic life or wetlands in chs. NR 104 and NR 103, Wis. Adm. Code, may be able to extend their trading area downstream if the pollutant in question does not have applicable water quality criteria for these waterbody types. This can sometimes significantly expand the available trading area. To request an alternative watershed for trading, contact your local WDNR wastewater engineer, specialist, or trading coordinator (see Section 7, p. 54 for contact information). Multiple Trades in the Same HUC 12 There can be multiple point sources pursuing trading for the same pollutant in the same HUC 12 watershed. Although this is permissible, it may not be advantageous as the increased demand for credits may increase their cost. One option to avoid this competition is to pursue alternative compliance options such as adaptive management. Again, adaptive management is only a phosphorus compliance option. Adaptive management allows point sources to pool their financial and other resources to work together towards phosphorus compliance in the most cost‐effective manner possible. For more information about adaptive management visit: http://dnr.wi.gov/topic/surfacewater/adaptivemanagement.html.
If multiple point sources continue to pursue trading in the same HUC 12, for the same pollutant, careful coordination and tracking is necessary to avoid “double counting”. Trading does not allow multiple point sources to take credit for the same pollutant reduction. However, there are some circumstances where credits can be divided between point sources so that “double counting” does not occur (Table 3).
Table 3. Ways to divide credits generated between point sources.
Circumstance Example The credit generator produces more credit than one credit user needs and splits these credits between multiple credit users.
A point source generator produces 100 lbs/day of phosphorus credit. The point source sells 60 lbs/day to credit user A, and 40 lbs/day to credit user B.
The management practice used to generate credits controls multiple pollutants.
A buffer strip is used to capture excess phosphorus and sediment runoff. Credit user A takes credit for the phosphorus reductions generated by the buffer strip, and credit user B takes credit for the sediment reductions.
Flexibility in TMDL Watersheds A “TMDL reach” is a waterbody segment used to calculate pollutant allocations for point and nonpoint sources in a TMDL. Typically, TMDL reaches are either impaired themselves or located upstream of an impaired water. Because of how TMDL reaches are delineated TMDL reaches may overlap with HUC 12 watershed boundaries allowing TMDL reaches to be used in lieu of or in addition to the HUC 12 boundary. When trading to meet allocations from a TMDL the trade locations must be hydraulically connected and located upstream of the impaired segment.
To search for approved TMDLs in Wisconsin visit http://dnr.wi.gov/topic/tmdls/tmdlreports.html.

21 | P a g e
Determine your applicable WPDES permit limit(s) To evaluate whether trading is a viable option for your facility, you need to know the applicable limits for the pollutant(s) of concern. WDNR will calculate and provide pollutant limits to permittees during the permit reissuance process. Typically, these limits are sent to permittees with the cover letter that accompanies the application for permit reissuance approximately nine to twelve months prior to the expiration of the WPDES permit. If your facility’s WQBELs are not already included in your WPDES discharge permit, or are not yet available, you may wish to calculate draft limits for planning purposes. Guidance is available to help you calculate draft limits: • See Section 2.01 of the Phosphorus Implementation Guidance document to calculate phosphorus
limits at http://dnr.wi.gov/topic/surfacewater/phosphorus.html. • See Chapter 3 of the Thermal Implementation Guidance document to calculate temperature limits
at http://dnr.wi.gov/topic/surfacewater/thermal.html.
Note: Trading cannot be used to meet technology-based effluent limits.
Quantify the offset needed To calculate the amount of offset needed to comply with your WQBEL, use the most restrictive limit for the given pollutant in the following equation:
Needed Credits = (Current Discharge ‐ Permit Effluent Limit) x Trade Ratio x 365 days/yr
Where: Permit Effluent Limit = Most restrictive WQBEL for the pollutant; Current Discharge = Long‐term average discharge rate of the pollutant; Trade Ratio = Use a ratio of 2:1 for an initial estimate. A more precise trade ratio will be calculated in Step 5 (p. 34).
Example:
Point Source A is a municipal wastewater treatment facility (WWTF) with an effluent discharge that averages 1.3 million gallons per day (MGD) and 0.5 mg/L total phosphorus. The facility’s average annual design flow equals 1.9 MGD. The facility discharges to a waterbody with an in‐stream total phosphorus concentration of 0.12 mg/L, which exceeds the water quality criterion for total phosphorus of 0.10 mg/L. Therefore, total phosphorus WQBELs equal to 0.1 mg/L and 1.58 lbs/day as six‐month averages (0.1 mg/L x 1.9 MGD x 8.34) and 0.3 mg/L as a monthly average (0.1 mg/L x 3) are applicable to the facility’s discharge. Since the six‐month average limit of 0.1 mg/L is the most restrictive limit, needed total phosphorus credits equal:
(0.5 mg/L – 0.1 mg/L) x 1.3 MGD x 8.34 x 2 x 365 days/yr = 3,166 lbs/yr
Where: 0.5 mg/L = Point Source A’s current average discharge of total phosphorus;
0.1 mg/L = Total phosphorus WQBEL expressed as a six‐month average concentration;
1.3 MGD = Point Source A’s current average discharge flow rate;
8.34 = A factor for converting effluent concentration and flow rate to a daily mass (lbs/day); and

22 | P a g e
In this step you will: •Determine the need for a credit broker or exchange •Identify potential partners •Create Memorandum of Understanding (MOU) between partners, if desirable
2 = A default trade ratio for an initial estimate.
Point Source A currently requires 3,166 pounds per year of total phosphorus credits. Note that the effluent flow rate used in the above calculation represents current average flow and not design flow. Therefore, as influent flows to the facility increase during the facility’s design life, additional phosphorus credits will be required. Also, note that needed phosphorus credits could be calculated using total phosphorus WQBELs of 1.58 lbs/day as a six‐month average and 0.3 mg/L as a monthly average (2,804 lbs/yr and 1,583 lbs/yr of needed credits, respectively). However, doing so would result in underestimating needed phosphorus credits.
2. Identify credit broker or exchange, if applicable The goal of this step is to determine if a credit broker or exchange will be used to establish the trade and identify this partner, if desired. Although there are several types of market structures4 that can be used for trading, credit brokers or exchanges are the most commonly used nationwide, and will be the focus of this section of the guidance. As previously mentioned, credit brokers and credit exchanges do not need to be used, but they can improve the administrative feasibility of trading.
A credit broker is a third party that brings potential trading partners together. A broker performs the research necessary to match credit users and credit generators based on location, pollutant type, amount, and timing. Although brokers may assist in trading negotiations, they do not sign or regulate trade agreements. Brokers do not assume any liability for individual trades. A credit exchange, on the other hand, is a third party that collects pollutant reduction credits from credit generators to sell to credit users. A credit exchange is typically responsible for developing and monitoring trade agreements over time. A credit exchange may assume some amount of liability for individual trade agreements.
When to consider a broker/exchange:
In some watersheds, credit generators are easily identifiable and willing participants in trading. Additionally, some point sources already have working relationships with potential credit generators, making trading even more likely to succeed. In these cases, working through a credit broker or exchange is probably unnecessary. It will be economically preferable in these scenarios to work directly with credit generators to avoid administrative costs associated with a broker or exchange.
Credit brokers or exchanges may be useful to facilitate trades between point and nonpoint sources, find potential credit generators, or bridge communication between credit user and generator when working 4 EPA (2005). An Examination of Key Elements and Conditions for Establishing a Water Quality Trading Bank. Office of Policy, Economics, and Innovation and Office of Water. http://www.eli.org/pdf/wqtforum/SiemAhlLand05.pdf.

23 | P a g e
relationships are not well‐established. Although some point sources, like cheese manufacturers, have strong connections with farmers, the majority of point sources in Wisconsin do not have a working relationship with these and other nonpoint sources. Studies have shown that working with a broker or exchange that understands the concerns and challenges facing these entities can improve the probability that trading will be successful5. Trust between an agricultural credit generator and a credit bank/exchange can greatly reduce perceptions of uncertainty and fear of regulation, and can increase the sense of equity for agricultural producers. If a credit broker or exchange can bring these qualities to trading, the probability of working with agricultural nonpoint sources may be greater than if a point source tried to work with a farmer directly.
Finding a credit broker/exchange:
Credit brokers or exchanges currently are not well established in the state of Wisconsin; however, there are several potential entities that can serve as a credit broker or exchange. If a credit exchange is used, a formal trade agreement between the exchange and the credit user is required to successfully implement this type of market structure (see Section 6 on page 51). If a credit broker is used, the credit user and broker may wish to enter into a Memorandum of Understanding (MOU), but an actual trade agreement between these entities is not required (see Section 6 on page 51). MOUs are recommended agreements between credit users and their broker to specify deliverables, milestones, and necessary compensation. These contractual agreements can help protect both the point source and the facilitator throughout the trading process. MOUs do not have to be submitted to WDNR, nor are they required. If an applicant submits a MOU to WDNR staff it will be for informational purposes only. WDNR will not validate or comment on these documents, but may consider them when evaluating the adequacy of completed trading strategies.
Counties: The county Land Conservation Department (LCD) may be one partner that can effectively bridge communication between point and nonpoint sources, identify potential credit generators in the watershed, and oversee trading. County LCDs have expertise in agricultural performance standards compliance and cost‐share agreements, among other things. County LCDs also have ties to effectively reach out to, and work with, farmers and municipalities in their area. There is some precedence in Wisconsin for county LCDs serving as credit brokers. Barron County LCD, for example, has been serving as a credit broker for the Village of Cumberland since the late 1990’s. Partnerships with county LCDs can be mutually beneficial given the overlap in goals and experience. However, county staff are not required to assist with trading activities. Point sources and county LCDs should determine their appropriate level of involvement and necessary compensation for these projects. To find county staff in your area visit http://datcp.wi.gov/Environment/Land_and_Water_Conservation/Land_and_Water_Conservation_Directory/index.aspx.
5 Example: Granovetter, Mark (Nov., 1985). Economic Action and Social Structure: The Problem of Embeddedness. Amer. Jrnl. Of Sociology 91(3). 481‐510.

24 | P a g e
In this step you will: • Identify sources of pollution in your watershed • Determine current land uses and typical agricultural practices in the watershed, if necessary
Consultants: Some environmental consultants may be interested and willing to serve as credit brokers or exchanges. You may wish to seek out consultants that have experience working in your watershed, knowledge of nonpoint source runoff, and/or familiarity with outreach and education to help improve the feasibility of implementing a successful trade. Consultants and other third parties facilitating trades do not need direct ties to farmers in your watershed, but should be perceived as unbiased and trustworthy, so that farmers and other nonpoint sources are willing to partner with them. Trusted social relationships will likely create a more efficient market place for trading, and may even reduce transaction costs for trading. Other: Other partnerships may also be beneficial to provide technical expertise, assist with project outreach and education, provide alternative funding sources, or seek out trading credits. When determining the potential for other partners it is important to identify regional groups already active in land use/water quality issues. For example, local agricultural groups and/or environmental groups can help identify credit generators or install best management practices (BMPs). Non‐governmental organizations or other partners may also be willing to serve directly as a credit broker or exchange.
Statewide organizations or agencies may be willing to assist in trading projects such as Wisconsin Rural Watershed Association, Clean Wisconsin, Sand County Foundation, Department of Agriculture, Trade, and Consumer Protection (DATCP), and UW Extension. Again, seeking partners with watershed experience or working relationships with nonpoint sources in your area can greatly improve the chances for success.
3. Identify potential credit generators This step allows you to identify potential credit generators by describing the sources of pollution in your watershed. Any land use feature in your watershed that contributes the pollutant of concern may be a potential trading opportunity. This can include point sources, nonpoint sources, and natural features. Point Sources Tools are available to help you identify the WPDES permitted discharges in your watershed. These discharges can include municipal and industrial discharges as well as permitted Municipal Separate Storm Sewer Systems (MS4s). The Surface Water Data Viewer (SWDV) is one tool that is recommended for use. The SWDV is a data delivery system that provides interactive webmapping tools for a wide variety of datasets such as mapping the surface water discharges in Wisconsin. The SWDV is available at http://dnr.wi.gov/topic/surfacewater/swdv/. See Appendix D (p. 67) for an overview on using the SWDV.

25 | P a g e
Once the point sources in your watershed have been identified, you should determine their pollutant loading for the pollutant of concern. This may require direct contact with point source representatives in your area. These data may also be available through other resources, particularly if your pollutant of concern is phosphorus or TSS. WDNR has developed a GIS‐based model called “Pollutant load Ratio EStimation Tool” (PRESTO), which identifies the point and nonpoint source loadings of phosphorus in watersheds throughout Wisconsin. For details about point source phosphorus loadings and the PRESTO model, visit http://dnr.wi.gov/topic/surfacewater/presto.html. Watersheds with an EPA approved TMDL will also have point and nonpoint source loads specified by reach in the TMDL development document. To review Wisconsin’s TMDL watersheds, visit http://dnr.wi.gov/topic/tmdls/. WDNR also maintains data submitted by point sources on their discharge monitoring reports (DMRs). External parties can access these data upon request. Contact your local wastewater engineer or specialist, or trading coordinator for questions about PRESTO or point source pollution loads. Table 4 is provided as an example to help you organize point source data for decision‐making purposes. A map may also be useful for organizational and administrative purposes. Table 4. Blank example of ways to help organize point source data in your watershed for decision-making purposes.
Permit Number
Point Source Name
Pollutant Load
(lbs/day)
Pollutant Concentration
(mg/L)
Location Other key
characteristics Comments Latitude Longitude Nonpoint Sources Nonpoint sources of pollution can come from non‐permitted urban stormwater, agricultural runoff, and natural land use features. Urban land uses that may produce stormwater runoff may include urban open spaces, low density residential areas, high density residential areas, and commercial and industrial areas. Agricultural land use features that should be identified include cropland, pastures/hay land, and animal feedlots. Natural land use features can include forests, prairie, wetlands, conservation land, and open water areas. Although natural land use features are less likely to contribute significant pollution loads, there may be opportunities such as wetland restoration projects that can improve or expand the functionality of these and other natural features.
26 | P a g e
Trades can occur with any nonpoint source as long as quantifiable pollutant reductions are made and the practices conform to established trading protocols. Section 6 (p. 46) describes the tools that are available to quantify reductions from management measures. Trading strategies involving nonpoint source credit generators will likely target nonpoint projects that are already identified in the watershed, or nonpoint projects that will maximize the cost‐effectiveness of the trade. County LCDs, or other entities, may already know of potential projects in your watershed. If unknown, a watershed inventory can be used to discover potential trading opportunities. These data can then be used to determine which nonpoint trades will be most cost‐effective (see Section 5, p. 33). A watershed inventory is designed to describe the current land use and land management practices in the watershed in order to discover potential opportunities for improvements that can be utilized in a trading strategy. To complete an effective watershed inventory, collaboration with local governments, county LCD staff, and local WDNR nonpoint source (NPS) coordinators will likely be necessary. You may also need to make direct observations in the watershed. Gather and organize data The first step in conducting a watershed inventory is to gather existing data. Many sources of information are available to help complete a watershed inventory such as:
• Data from local governmental units, watershed groups, associations, current or past projects or studies within the watershed or nearby soil surveys
• Topographic maps and aerial photos of the watershed • Any reports, studies, monitoring data, or plans developed in the watershed by others • County road maps and plat books, if available
It is strongly advised that you work with your local county LCD and WDNR nonpoint source (NPS) coordinator to determine what information is needed for your project, and what sources of information are already available within your watershed. A summary of the types of information you will likely need throughout the trading project is summarized in Table 5. Sources of information that may be available to you are summarized in Table 6. Once information is gathered, determine how to organize these data. ArcGIS and Excel© or Access© tables are the most common tools used for data storage and organization.
Why do a watershed inventory? • Helps identify activities in the watershed
which may be negatively affecting water quality
• Organizes information that can be used at public meetings, to educate others about your project
• Provides a detailed record of current conditions and characteristics of your unique watershed, serving as a benchmark against which to measure future changes.

27 | P a g e
Table 5. Types of information needed.
Phys
ical
Fe
atur
es o
f the
La
nd
Land
Use
Stre
ams,
Lake
s, W
etla
nds
Resi
dent
ial a
nd
Urba
n
Agri
cultu
re
Fore
sts
Topographic Map x x x x Soil Survey x x Aerial Photos x x x x x National Wetlands Inventory
x
Current Land Use x x x x Zoning Maps x Floodplain Maps x
Table 6. Government agency information available.
Title of Publication or Government
Agency Information
Available How to Obtain/Contact Wisconsin DATCP
Land and water conservation directory Manure management advisory system and WI 590 Nutrient Management Planning
http://datcp.wi.gov/Environment/Land_and_Water_Conservation/Land_and_Water_Conservation_Directory/index.aspx http://www.manureadvisorysystem.wi.gov/
U.S. Department of Agriculture (USDA)
Web soil survey http://websoilsurvey.nrcs.usda.gov/app/HomePage.htm
WDNR GIS layers for land cover, grant opportunities, surface water monitoring locations, wetlands, etc.
http://dnr.wi.gov/topic/surfacewater/swdv/
UW Stevens Point/UW Extension
Data, mapping and survey resources
http://www.uwsp.edu/cnr‐ap/clue/Pages/publications‐resources/DataMappingGIS.aspx
Department of Soil Science UW-Madison
Wisconsin watershed project clearinghouse
http://nonpoint.cals.wisc.edu/?page_id=14
28 | P a g e
U.S. Geological Survey (USGS)
Wisconsin Water Quality Center housing monitoring information, numerous reports, and stream flow data Land cover data layers
http://wi.water.usgs.gov/ http://landcover.usgs.gov/
USDA Wisconsin agricultural statistics National Agricultural Statistics Service
http://www.nass.usda.gov/Statistics_by_State/Wisconsin/index.asp http://www.nass.usda.gov/
Natural Resource Conservation Service (NRCS)
Soil Survey Geographic (SSURGO) Database
http://soils.usda.gov/survey/geography/ssurgo/
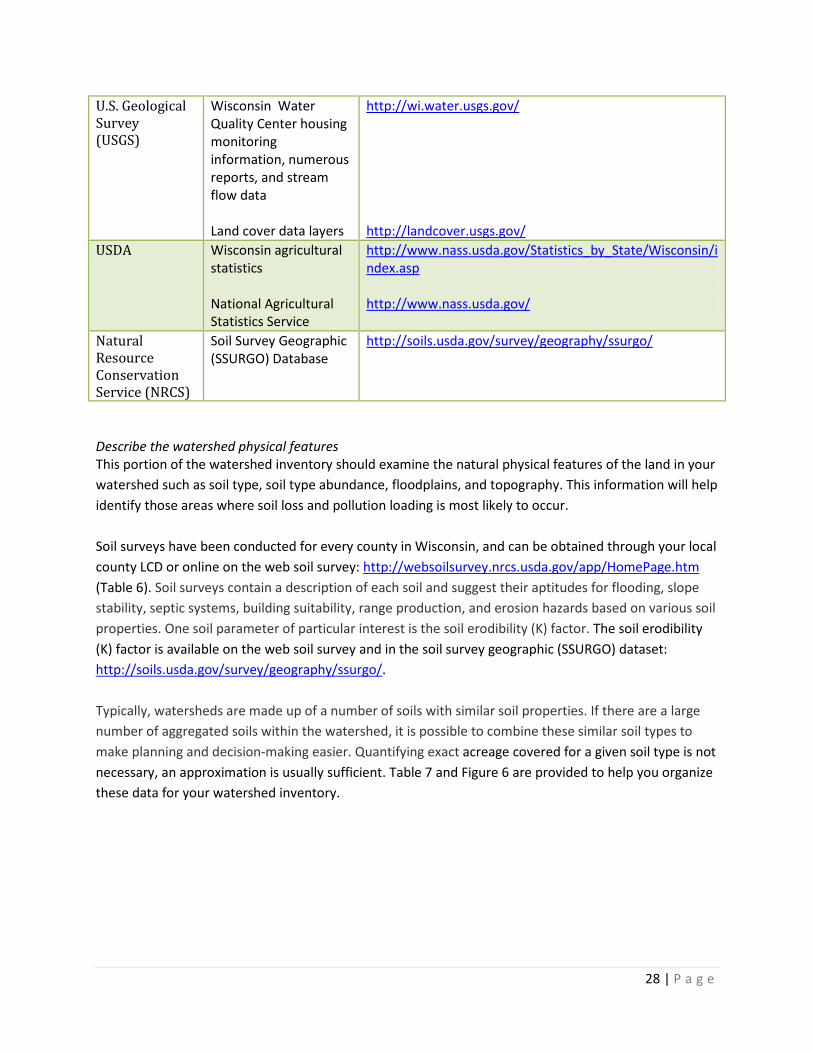
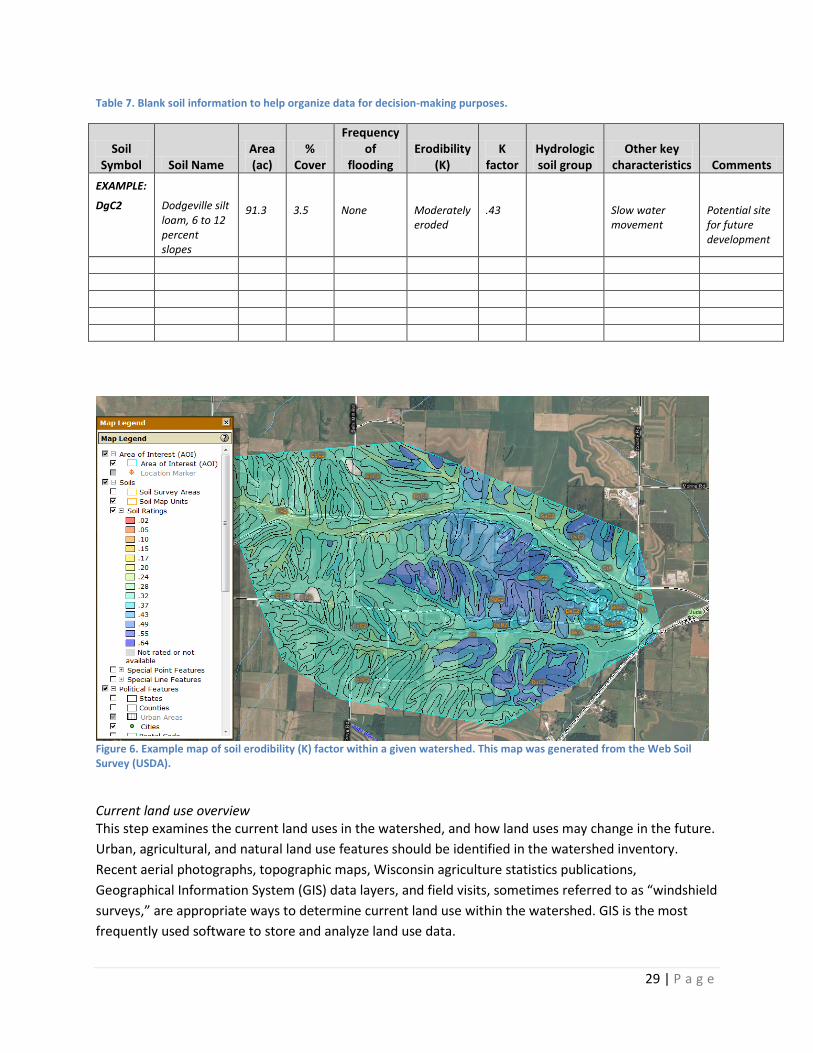
Describe the watershed physical features This portion of the watershed inventory should examine the natural physical features of the land in your watershed such as soil type, soil type abundance, floodplains, and topography. This information will help identify those areas where soil loss and pollution loading is most likely to occur. Soil surveys have been conducted for every county in Wisconsin, and can be obtained through your local county LCD or online on the web soil survey: http://websoilsurvey.nrcs.usda.gov/app/HomePage.htm (Table 6). Soil surveys contain a description of each soil and suggest their aptitudes for flooding, slope stability, septic systems, building suitability, range production, and erosion hazards based on various soil properties. One soil parameter of particular interest is the soil erodibility (K) factor. The soil erodibility (K) factor is available on the web soil survey and in the soil survey geographic (SSURGO) dataset: http://soils.usda.gov/survey/geography/ssurgo/. Typically, watersheds are made up of a number of soils with similar soil properties. If there are a large number of aggregated soils within the watershed, it is possible to combine these similar soil types to make planning and decision‐making easier. Quantifying exact acreage covered for a given soil type is not necessary, an approximation is usually sufficient. Table 7 and Figure 6 are provided to help you organize these data for your watershed inventory.
29 | P a g e
Table 7. Blank soil information to help organize data for decision-making purposes.
Soil Symbol Soil Name
Area (ac)
% Cover
Frequency of
flooding Erodibility
(K) K
factor Hydrologic soil group
Other key characteristics Comments
EXAMPLE:
DgC2
Dodgeville silt loam, 6 to 12 percent slopes
91.3
3.5
None
Moderately eroded
.43
Slow water movement
Potential site for future development
Figure 6. Example map of soil erodibility (K) factor within a given watershed. This map was generated from the Web Soil Survey (USDA).
Current land use overview This step examines the current land uses in the watershed, and how land uses may change in the future. Urban, agricultural, and natural land use features should be identified in the watershed inventory. Recent aerial photographs, topographic maps, Wisconsin agriculture statistics publications, Geographical Information System (GIS) data layers, and field visits, sometimes referred to as “windshield surveys,” are appropriate ways to determine current land use within the watershed. GIS is the most frequently used software to store and analyze land use data.
30 | P a g e
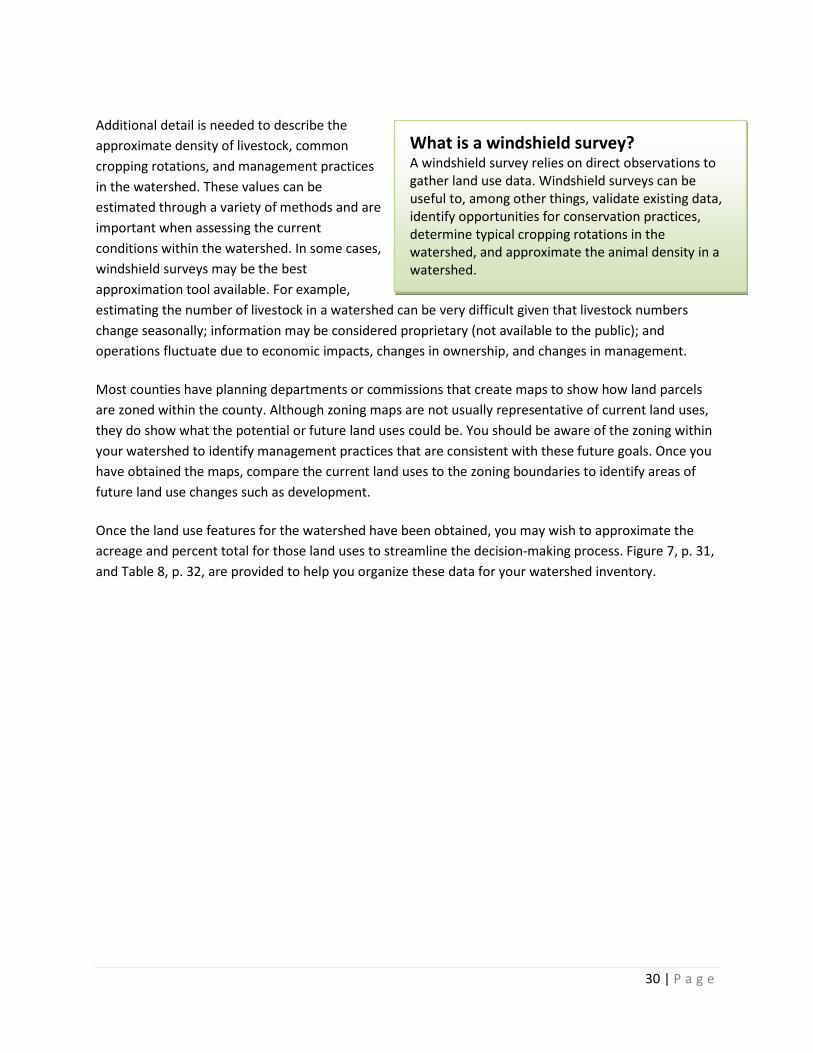
Additional detail is needed to describe the approximate density of livestock, common cropping rotations, and management practices in the watershed. These values can be estimated through a variety of methods and are important when assessing the current conditions within the watershed. In some cases, windshield surveys may be the best approximation tool available. For example, estimating the number of livestock in a watershed can be very difficult given that livestock numbers change seasonally; information may be considered proprietary (not available to the public); and operations fluctuate due to economic impacts, changes in ownership, and changes in management. Most counties have planning departments or commissions that create maps to show how land parcels are zoned within the county. Although zoning maps are not usually representative of current land uses, they do show what the potential or future land uses could be. You should be aware of the zoning within your watershed to identify management practices that are consistent with these future goals. Once you have obtained the maps, compare the current land uses to the zoning boundaries to identify areas of future land use changes such as development. Once the land use features for the watershed have been obtained, you may wish to approximate the acreage and percent total for those land uses to streamline the decision‐making process. Figure 7, p. 31, and Table 8, p. 32, are provided to help you organize these data for your watershed inventory.
What is a windshield survey? A windshield survey relies on direct observations to gather land use data. Windshield surveys can be useful to, among other things, validate existing data, identify opportunities for conservation practices, determine typical cropping rotations in the watershed, and approximate the animal density in a watershed.

31 | P a g e
Figure 7. Example land use map of the Yellow River Watershed.

32 | P a g e
Table 8. Blank land use overview table.
Current Land Use
Land Use Approximate Land Cover (ac)
Approximate Land Cover (%)
Typical Impervious Fraction/Runoff Coefficient6
Approximate Impervious Area in Watershed
Low density residential
0.3
Medium density residential
0.5
High density residential
0.7
Industrial and commercial areas
0.85
Urban open areas 0.2 Wetland 0.08 Forest 0.1 Grassland 0.1 Cropland 0.1 Animal feedlots 0.75 Pasture/hay 0.12 Description of Cropping Practices
Common Rotations Approximate Land Cover (ac) Approximate Land Cover (%) Tillage Practices No‐till (ac) Conservation tillage (30% or more) (ac) Conventional tillage (less than 30%) (ac) Unknown (ac) Livestock Density Approximate number of animals in watershed Beef Dairy Pork Poultry Other Comments:
6 Runoff coefficients are used in the rational equation, which is one of the simplest methods to determine peak discharge from drainage basin runoff. These values are provided as a general approximation for decision‐making purposes and should be modified as appropriate.

33 | P a g e
This step: • Ensures that sufficient credit is available for trading • Confirms that the distribution of credits is administratively feasible for trading
4. Assess Availability of Credit Once you have determined the amount of credits needed (step 1, p. 18), and the potential trading partners in your watershed (steps 2 and 3, pp. 22 and 24), consider the total pollutant load contributed within the watershed to determine if trading is feasible. If needed pollutant credits equal a significant proportion of the receiving water’s total pollutant load, trading will not be feasible. There simply may not be enough credits that can be generated. Additionally, if other point sources contribute a significant proportion of the receiving water’s total pollutant load, it may be difficult for you to find sufficient and affordable phosphorus credits. Competition for credits in point‐source dominated situations may make available credits very costly. Alternative compliance options such as adaptive management may help avoid this competition.
Typically, trading will be most feasible for point sources when located in watersheds dominated by nonpoint sources. Other characteristics that can make watersheds more apt for trading include:
• Watersheds where a small number of nonpoint sources contribute high loads to receiving waters,
• Watersheds where nonpoint sources have been, and may continue to be, effectively engaged to implement management measures,
• Watersheds where land use inventories have been conducted so that management measures can be strategically identified, and
• Watersheds where nonpoint source partners are within the same area as the point source in need of credits.
Establishing a Baseline To generate credits, the trading strategy must quantify the current pollution load to the receiving water and use management practices or other load reduction activities to reduce that load. The current pollution load to the receiving water is called the “baseline load”. For preliminary decision‐making purposes, a specific baseline may not be necessary; the overall factors discussed above may be sufficient to determine trading feasibility. Once specific management practices have been identified, a quantifiable baseline will be required. See Section 6, p. 46, for details.
What is the baseline load and why is it important? A trading “baseline” is a snapshot of the current land use conditions within the watershed. Establishing a baseline is necessary to quantify the current pollution loading to the receiving water from specific sources. These data can then be used to quantify the amount of credit that can be generated through various management practices to control these sources. For preliminary decision‐making purposes, a general baseline will be sufficient. A detailed baseline will be necessary once individual trades are established.
34 | P a g e
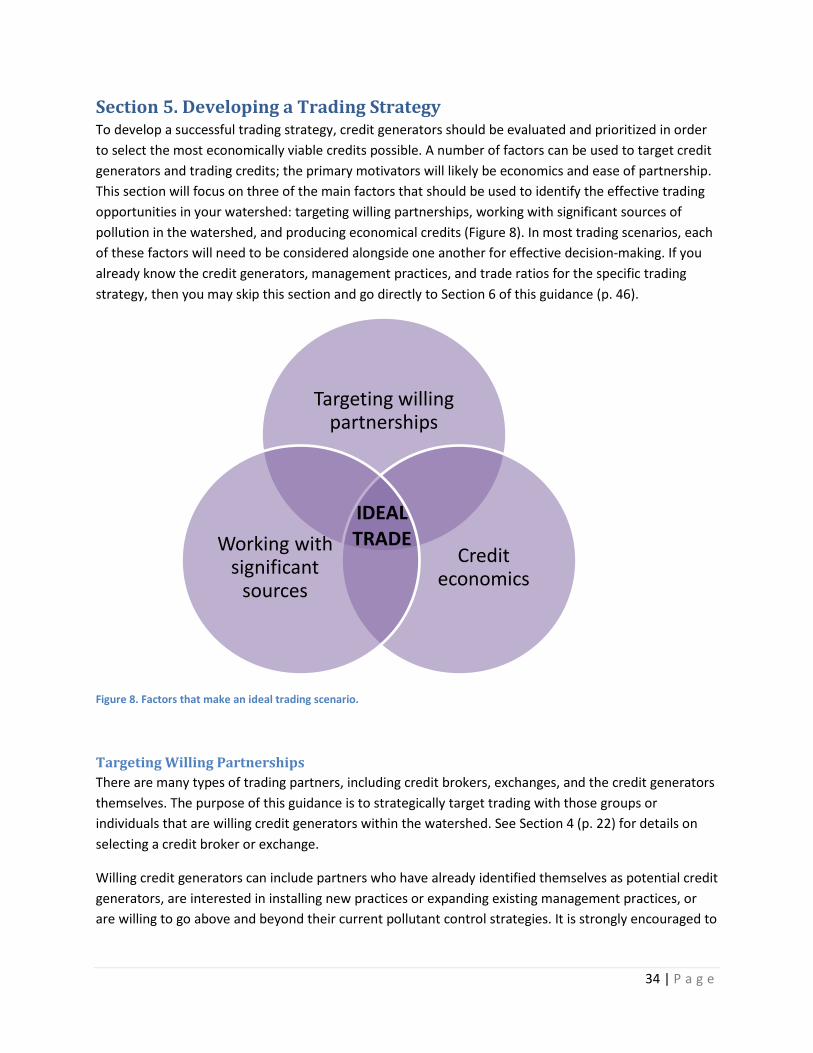
Section 5. Developing a Trading Strategy To develop a successful trading strategy, credit generators should be evaluated and prioritized in order to select the most economically viable credits possible. A number of factors can be used to target credit generators and trading credits; the primary motivators will likely be economics and ease of partnership. This section will focus on three of the main factors that should be used to identify the effective trading opportunities in your watershed: targeting willing partnerships, working with significant sources of pollution in the watershed, and producing economical credits (Figure 8). In most trading scenarios, each of these factors will need to be considered alongside one another for effective decision‐making. If you already know the credit generators, management practices, and trade ratios for the specific trading strategy, then you may skip this section and go directly to Section 6 of this guidance (p. 46).
Figure 8. Factors that make an ideal trading scenario.
Targeting Willing Partnerships There are many types of trading partners, including credit brokers, exchanges, and the credit generators themselves. The purpose of this guidance is to strategically target trading with those groups or individuals that are willing credit generators within the watershed. See Section 4 (p. 22) for details on selecting a credit broker or exchange.
Willing credit generators can include partners who have already identified themselves as potential credit generators, are interested in installing new practices or expanding existing management practices, or are willing to go above and beyond their current pollutant control strategies. It is strongly encouraged to
Targeting willing partnerships
Credit economics
Working with significant
sources
IDEAL TRADE

35 | P a g e
work with these willing partners to help improve the social acceptability of the trade and to mitigate administrative costs associated with finding potential trading partners in the watershed.
Point sources will likely be the most easily identifiable credit generators in the watershed. Point source credit generators may view trading as a way to offset some of their costs to upgrade their treatment technology and may, therefore, be more likely to seek out credit users. Additionally, trades between traditional point sources will be the most administratively straight forward, given that both credit user and credit generator will have a WPDES permit that will maintain the trade over time.
In some watersheds, urban stormwater or nonpoint source credit generators are also easily identifiable. County LCDs, local agricultural groups, regional planning commissions, or other entities may already know of potential credit generators in the watershed, or can easily develop this list. Although less likely, urban stormwater and nonpoint sources can also identify themselves as potential credit generators in the watershed. Working with willing urban stormwater or nonpoint source credit generators is one of the best ways to alleviate some of the complexities associated with these types of trades. If willing partners exists in a watershed, logistical concerns associated with finding partners and credits can be greatly reduced, which can have a direct impact on the economic and administrative viability of trading. Other administrative costs may still be required, however, for activities such as preliminary trade negotiations, developing trading agreements (see Section 6 p. 51 for details), and maintaining and verifying trading practices over time. Despite these costs, trades with nonpoint sources can still be far more economical than traditional wastewater treatment facility upgrades.
Local environmental groups may also know of water quality improvement projects such as wetland restoration and bank stabilization projects that can be implemented to generate credits. These groups may have third party funding sources that can help offset some of the trading costs associated with these projects or may have staff resources that can contribute to the project’s viability.
Working with Significant Sources of Pollution In some watersheds, you may be aware of a number of significant pollution‐generating sites in your watershed; while in other watersheds, you may need to actively seek out these locations. If you have a number of potential sites to choose from, it is recommended to work first with the most significant contributing sites in your watershed. The most significant contributors will likely be able to generate the most cost‐effective credits possible (see p. 41 for details on credit economics).
If significant pollution‐generating sites are unknown, data collected in Step 3 of Section 4 (p. 24) can be used for decision‐making purposes to help identify these locations. It is strongly recommended that sites be targeted based on their pollution load contribution, and/or the owner’s willingness to partner. Targeting significant sites, also called “critical source areas,” means that you will be able to capture more of the pollutant of concern with fewer trading partners. Working with these sources will help create a more efficient marketplace for trading, decrease administrative overhead, and may even reduce transaction costs. The critical source areas in your watershed may be point or nonpoint sources.

36 | P a g e
As mentioned, this portion of the guidance uses the information gathered in Step 3 of Section 4 (p. 24) to identify and target critical source areas in those watersheds where trading partners are unknown. If the trading strategy occurs within a TMDL watershed, some critical source areas will have already been identified in the TMDL report (http://dnr.wi.gov/topic/tmdls/). If you are in a point source dominated area, the information gathered in Step 3 of Section 4 (p. 24) will likely be sufficient to identify the critical source areas in your watershed.
Additional work may be required to identify critical source areas of nonpoint source pollution. The following guidance assumes that a phosphorus trading scenario in a nonpoint source dominated watershed. However, this approach is also valid for other pollutants like TSS. When identifying these contributors, it is strongly recommended to work with County LCDs, Natural Resources Conservation Service (NRCS), Wisconsin Department of Agriculture, Trade, and Consumer Protection (DATCP), WDNR NPS coordinators, and/or others familiar with the nonpoint source conditions within the watershed.
The approach outlined below can help identify critical areas for targeting, if unknown. This is not a “modeled” approach, as the data required to apply a detailed model at this scale is not always readily available. Instead, this approach identifies some publicly available data that can be used to help identify potential critical source areas without going through an extensive modeling effort. This process involves overlaying spatial GIS data layers, then using the windshield survey and/or local knowledge gathered in Step 3 of Section 4 (p. 18) as evidence of uncontrolled (i.e., no BMPs in place) critical source areas. This process of targeting critical areas relies on data that is readily available (e.g., slope, soil characteristics, etc.) and, if it is available, field‐scale management information (e.g., tillage practices, manure spreading, cropping practices, etc.).
Pollution movement from the agricultural landscape to receiving waters involves a combination of both source factors and transport factors7 (Table 9). Source factors represent the amount of phosphorus available on the land, while transport factors represent the mechanisms by which phosphorus is moved across the landscape and delivered to receiving waters. These factors, among others, are used to calculate the Wisconsin Phosphorus Index (P Index), an estimate of the average annual phosphorus delivered from a field to a nearby waterbody (http://wpindex.soils.wisc.edu/). Without going to the extent of actually calculating a P Index value, the following outlines the types of data that may be available to identify potential critical sources areas.
7 Sharpley, A.N., T.C. Daniel, and D.R. Edwards. 1993. Phosphorus movement in the landscape. J. Prod. Agric. 6:492‐500.
Use readily available data to identify potential critical source areas, and then use a windshield survey and/or local knowledge to gather evidence of uncontrolled critical source areas.

37 | P a g e
Table 9. Phosphorus source and transport factors.
Source Factors Transport Factors • Soil Test P • Application rate of P
fertilizer & manure • Application method of P
fertilizer & manure
• Erosion potential • Runoff • Connectivity to
receiving water
Source Factors
Phosphorus source factors include the amount of phosphorus present in the soil (soil test P), the application rate of phosphorus inputs (manure, fertilizer, etc.), as well as the application timing and method. Soil test P values can increase over time when the amount of manure or fertilizer applied is greater than the amount removed through crop harvesting. Fields with high soil test P values have the potential to be a large source of phosphorus in a watershed. The application method can determine the potential for an area to be a source of phosphorus. For example, manure or fertilizer that is injected into the soil has less chance of being moved off the field than manure or fertilizer that is surface applied. Along the same line, poor barnyard practices can also contribute phosphorus, including: inadequate manure storage, unprotected manure piles, cattle in streams, etc. Timing of manure application can also be a factor. Manure or fertilizer that is not quickly incorporated into the soil has greater potential for delivery to nearby receiving waters particularly if it has not been incorporated before fall or winter.
Transport Factors
Because a large portion of soil phosphorus is “bound” to soil particles, areas where the soil is easily detached or eroded are potential critical sources areas, if there is a high concentration of phosphorus in or on the soil. Data that can help identify areas prone to erosion include soil erosion factor or “K Factor” and slope. The K Factor indicates the susceptibility of a soil to sheet and rill erosion by water, and other factors being equal, higher values correspond to greater erosion potential. Steeper slopes correspond with faster runoff and, therefore, more force to move soil and soil‐bound phosphorus. As mentioned in Step 3 on page 24, both the K Factor and slope for a particular area can be determined using the USDA‐NRCS Web Soil Survey (http://websoilsurvey.nrcs.usda.gov). The Web Soil Survey allows a user to select a custom area of interest, then view available soil properties by map unit (soil type). Table 10 shows the path to find K Factor and slope on the web soil survey. Areas with higher K Factor and higher slope will likely have higher erosion rates. Some counties have maps of highly erodible lands. If this is available in the area of interest, it can be used as a substitute for the K Factor and slope analysis since highly erodible lands analyses include those factors. Additional information that can help determine the erosion potential of an area includes tillage frequency and type, and tolerable soil loss. Conservation tillage and no‐till practices can reduce erosion over traditional tillage practices. Additionally, tolerable soil loss, sometimes referred to as “T,” is the maximum annual amount of soil which can be removed before the long‐term natural soil productivity is adversely affected.
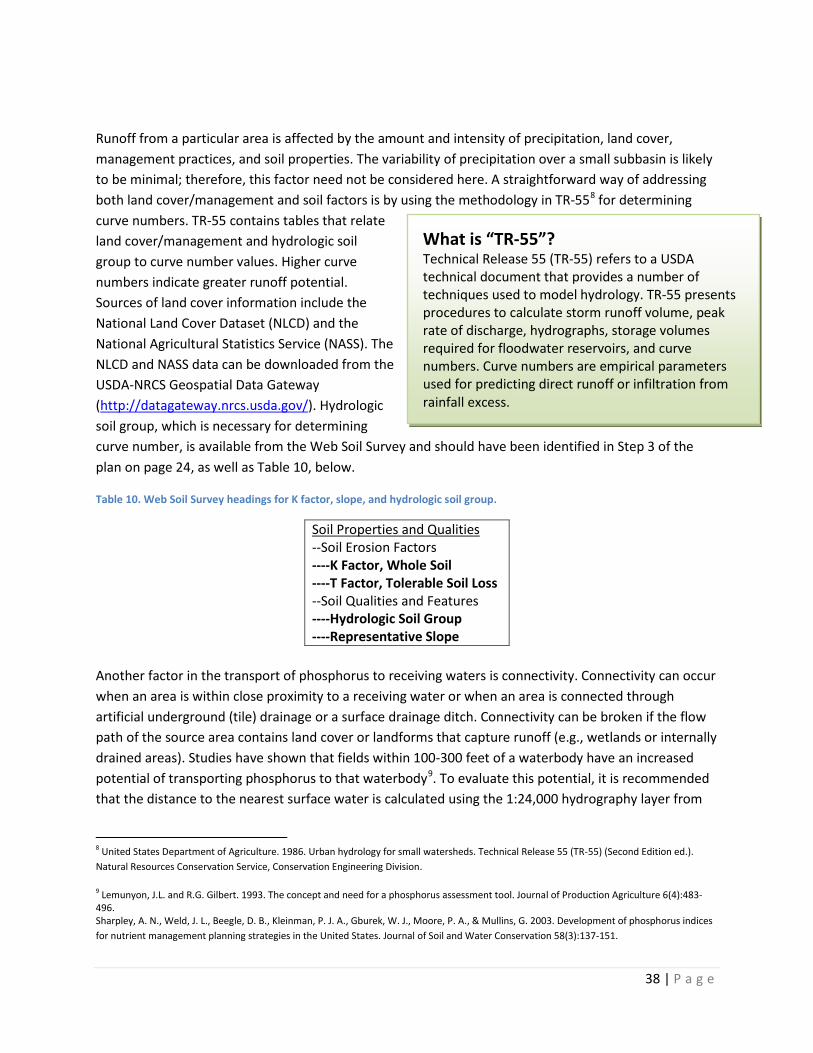
38 | P a g e
Runoff from a particular area is affected by the amount and intensity of precipitation, land cover, management practices, and soil properties. The variability of precipitation over a small subbasin is likely to be minimal; therefore, this factor need not be considered here. A straightforward way of addressing both land cover/management and soil factors is by using the methodology in TR‐558 for determining curve numbers. TR‐55 contains tables that relate land cover/management and hydrologic soil group to curve number values. Higher curve numbers indicate greater runoff potential. Sources of land cover information include the National Land Cover Dataset (NLCD) and the National Agricultural Statistics Service (NASS). The NLCD and NASS data can be downloaded from the USDA‐NRCS Geospatial Data Gateway (http://datagateway.nrcs.usda.gov/). Hydrologic soil group, which is necessary for determining curve number, is available from the Web Soil Survey and should have been identified in Step 3 of the plan on page 24, as well as Table 10, below.
Table 10. Web Soil Survey headings for K factor, slope, and hydrologic soil group.
Soil Properties and Qualities ‐‐Soil Erosion Factors ----K Factor, Whole Soil ----T Factor, Tolerable Soil Loss ‐‐Soil Qualities and Features ----Hydrologic Soil Group ----Representative Slope
Another factor in the transport of phosphorus to receiving waters is connectivity. Connectivity can occur when an area is within close proximity to a receiving water or when an area is connected through artificial underground (tile) drainage or a surface drainage ditch. Connectivity can be broken if the flow path of the source area contains land cover or landforms that capture runoff (e.g., wetlands or internally drained areas). Studies have shown that fields within 100‐300 feet of a waterbody have an increased potential of transporting phosphorus to that waterbody9. To evaluate this potential, it is recommended that the distance to the nearest surface water is calculated using the 1:24,000 hydrography layer from
8 United States Department of Agriculture. 1986. Urban hydrology for small watersheds. Technical Release 55 (TR‐55) (Second Edition ed.). Natural Resources Conservation Service, Conservation Engineering Division.
9 Lemunyon, J.L. and R.G. Gilbert. 1993. The concept and need for a phosphorus assessment tool. Journal of Production Agriculture 6(4):483‐496. Sharpley, A. N., Weld, J. L., Beegle, D. B., Kleinman, P. J. A., Gburek, W. J., Moore, P. A., & Mullins, G. 2003. Development of phosphorus indices for nutrient management planning strategies in the United States. Journal of Soil and Water Conservation 58(3):137‐151.
What is “TR-55”? Technical Release 55 (TR‐55) refers to a USDA technical document that provides a number of techniques used to model hydrology. TR‐55 presents procedures to calculate storm runoff volume, peak rate of discharge, hydrographs, storage volumes required for floodwater reservoirs, and curve numbers. Curve numbers are empirical parameters used for predicting direct runoff or infiltration from rainfall excess.

39 | P a g e
WDNR (http://dnr.wi.gov/maps/gis/datahydro.html). Drain tile can be an important transport pathway for soluble phosphorus as well; however, artificial drainage location information is not readily available. Local experts may know specific or general locations of artificial drainage.
Windshield Survey
As mentioned in Step 3 on page 24, performing a windshield survey (i.e., observing the watershed while driving along the road) can help to identify additional source and transport factors. Conducting a windshield survey in the spring offers the advantages of greater land visibility due to lack of vegetation and greater chance of observing runoff patterns. If observations of cropping practices are important, then a follow‐up survey during the growing season would be appropriate.
The following are some source and transport factors that may be identified during a windshield survey:
Factors related to source potential:
• Cattle access to streams • Poor barnyard manure handling • Inadequate manure storage • Unconfined manure piles • Poor runoff management practices
Factors related to transport potential:
• Tillage practices • Cropping practices (strip cropping, terraces, crop type, etc.) • Grazing practices • Stream channel erosion • Riparian buffers
Summary
Overlaying source and transport factors may identify potential critical source areas. Lack of local field‐scale data may inhibit the analysis of all the factors mentioned above; however, with available statewide data, local knowledge from county, WDNR, and other staff, and information gathered during a windshield survey, many of the critical source areas within a watershed can be identified (Figure 9). Table 11 is provided as an example worksheet to help organize critical source areas in your watershed for decision‐making purposes. A map of critical source areas may also be useful.

40 | P a g e
Figure 9. Example source and transport factors to identify critical source areas for phosphorus.
Table 11. Blank example worksheet to help organize critical sources areas and potential management measure for decision-making purposes.
Critical Source Area Control Objective(s) Management Practice(s) Area 1 Objective 1.
Objective 2. BMP 1 BMP 2 BMP 3 BMP 4
Area 2 Objective 3. Objective 4.
BMP 5 BMP 6 BMP 7 BMP 8
Area 3 Objective 5. Objective 6.
BMP 9 BMP 10 BMP 11 BMP 12
Area 4 Objective 7. Objective 8.
BMP 13 BMP 14 BMP 15 BMP 16
Area 5 Objective 9. Objective 10.
BMP 17 BMP 18 BMP 19 BMP 20

41 | P a g e
Credit Economics The costs of trading credits will be affected by the installation cost of the practice used to generate the credit, the cost to maintain the practice over time, and the applicable trade ratio (Figure 10).
Figure 10. Factors that affect the cost of trading credits.
Installation and Maintenance Costs
Installation and maintenance costs will vary by management measure or practice. Management measures or practices are those activities that will be used to generate credits in your watershed. There is a wide variety of practices that can be used to reduce pollution loads to surface waters. WDNR does not require specific practices be utilized in trading. However, any reduction that occurs must be quantifiable and will have to meet the trading requirements specified in Section 2, p. 10, such as credit threshold. See Section 6, p. 46, for details on quantifying management practices.
Communication between the credit brokers/exchanges, credit users, and credit generators is critical to ensure that practices identified in this step are reasonable, acceptable, and effective. Practices will vary depending on the source of pollution and the partner(s) you are collaborating with to control the source. For example, point source reductions can be used as credit generators so long as these reductions exceed the amount needed to comply with the credit generator’s applicable WQBEL or TBEL (Section 2, p. 12). Treatment technology optimization or facility upgrades may be needed to generate these credits.
There is an array of management measures that can control runoff from urban storm water and agricultural sources. Any management practice that produces quantifiable pollutant reductions can be considered in a trading strategy. Urban storm water practices are typically designed to control runoff from exposed and/or disturbed land area, including construction sites and industrial sites, and impervious areas like paved streets, parking lots, and building rooftops during rainfall and snow events. Agricultural practices, on the other hand, could focus on reducing erosion and runoff from cropland, or improving manure management. Cost share rates specified in ATCP 50 can be used as the basis for
Credit Cost
Installation Cost
Maintenance Cost Trade Ratio
Administrative Costs

42 | P a g e
Identify Necessary Management Practices
Design Practices According to Technical Standards
Implement or Install Management Practices
Maintain Management Practices
quantifying installation and maintenance costs for most agricultural management practices: http://docs.legis.wisconsin.gov/code/admin_code/atcp/50.pdf. Urban and agricultural practices that require construction, such as manure storage, have variable installation costs due to the price of materials at the time of construction. County LCDs will likely have cost estimates available for these construction‐based management measures.
Any trade with urban storm water or agricultural producers should ensure that management practices will be designed, implemented, and maintained according to applicable technical standards (Figure 11). WDNR provides technical standards for storm water management practices on its web site at: http://dnr.wi.gov/topic/stormwater/standards/index.html. Agricultural technical standards used in Wisconsin are maintained by the USDA‐NRCS in the Electronic Field Office Technical Guide (eFOTG) at: http://efotg.sc.egov.usda.gov/toc.aspx?CatID=16855; agricultural performance standards are found in ch. NR 151, Wis. Adm. Code, and ATCP 50 (available at http://dnr.wi.gov/topic/nonpoint/nr151Strategy.html and http://docs.legis.wisconsin.gov/code/admin_code/atcp/50.pdf, respectively).
Trade Ratio
The trade ratio adjusts the number of credits needed in order to: a) account for uncertainties or potential inaccuracies associated with the trade, and b) ensure that trade results in a greater pollutant reduction than would otherwise be achieved absent the trade. The trade ratio directly impacts the economic feasibility of trading—the higher the trade ratio, the more credits that will need to be purchased in the offset.
Figure 11. Process to successfully implement a management practice.
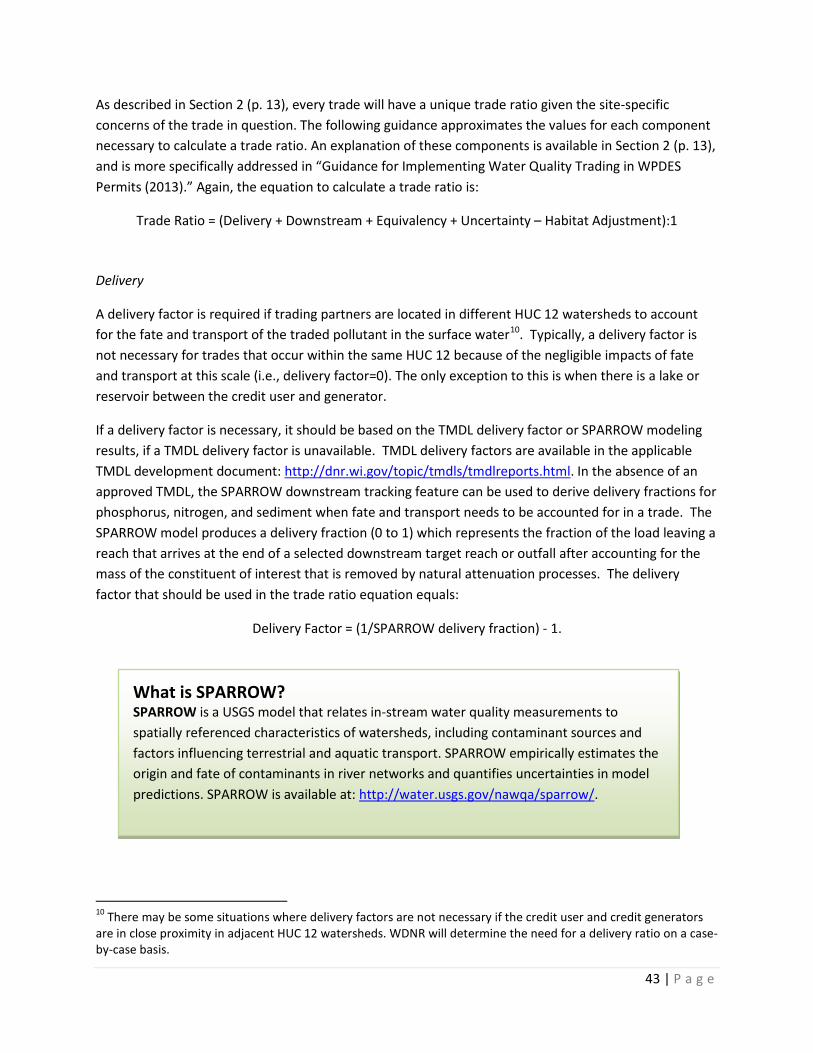
43 | P a g e
As described in Section 2 (p. 13), every trade will have a unique trade ratio given the site‐specific concerns of the trade in question. The following guidance approximates the values for each component necessary to calculate a trade ratio. An explanation of these components is available in Section 2 (p. 13), and is more specifically addressed in “Guidance for Implementing Water Quality Trading in WPDES Permits (2013).” Again, the equation to calculate a trade ratio is:
Trade Ratio = (Delivery + Downstream + Equivalency + Uncertainty – Habitat Adjustment):1
Delivery
A delivery factor is required if trading partners are located in different HUC 12 watersheds to account for the fate and transport of the traded pollutant in the surface water10. Typically, a delivery factor is not necessary for trades that occur within the same HUC 12 because of the negligible impacts of fate and transport at this scale (i.e., delivery factor=0). The only exception to this is when there is a lake or reservoir between the credit user and generator.
If a delivery factor is necessary, it should be based on the TMDL delivery factor or SPARROW modeling results, if a TMDL delivery factor is unavailable. TMDL delivery factors are available in the applicable TMDL development document: http://dnr.wi.gov/topic/tmdls/tmdlreports.html. In the absence of an approved TMDL, the SPARROW downstream tracking feature can be used to derive delivery fractions for phosphorus, nitrogen, and sediment when fate and transport needs to be accounted for in a trade. The SPARROW model produces a delivery fraction (0 to 1) which represents the fraction of the load leaving a reach that arrives at the end of a selected downstream target reach or outfall after accounting for the mass of the constituent of interest that is removed by natural attenuation processes. The delivery factor that should be used in the trade ratio equation equals:
Delivery Factor = (1/SPARROW delivery fraction) ‐ 1.
10 There may be some situations where delivery factors are not necessary if the credit user and credit generators are in close proximity in adjacent HUC 12 watersheds. WDNR will determine the need for a delivery ratio on a case‐by‐case basis.
What is SPARROW? SPARROW is a USGS model that relates in‐stream water quality measurements to spatially referenced characteristics of watersheds, including contaminant sources and factors influencing terrestrial and aquatic transport. SPARROW empirically estimates the origin and fate of contaminants in river networks and quantifies uncertainties in model predictions. SPARROW is available at: http://water.usgs.gov/nawqa/sparrow/.

44 | P a g e
Downstream
A downstream trading factor is necessary if the credit generator is downstream of the credit user. The downstream trading factor is a function of the difference between the average annual load discharged by the credit user to the overall load at the credit user's point of discharge, and ranges from 0.1‐0.8 (Table 12). For phosphorus and TSS this difference can be calculated using PRESTO: http://dnr.wi.gov/topic/surfacewater/presto.html.
Table 12. Downstream trading factor.
Percent Difference Between Credit User's Load and Total Load at the Point of the Credit User’s Discharge
Downstream Trading Factor
<25% 0.1 <50% 0.2 <75% 0.4 >75% 0.8
Equivalency
An equivalency factor is not needed for phosphorus or TSS trades. If a trade involves other pollutants of concern, contact your local trading coordinator or wastewater engineer or specialist (see Section 7, p. 54).
Uncertainty
The uncertainty factor accounts for uncertainties associated with nonpoint source trades that originate from climatic variability, potential inaccuracies in field testing or modeling of the amount of pollutant controlled by a management practice, and the reliability of the management practice to perform. The uncertainty factor is set equal to one for trades between traditional point sources. Visit http://dnr.wi.gov/topic/SurfaceWater/waterqualitytrading.html to look up the uncertainty factor for trades between other point sources and nonpoint sources. At the time this guidance was written, the current version of this table is also available in Appendix A (p. 56).
If an uncertainty factor is not available for a particular practice of interest, contact your local trading coordinator or wastewater engineer or specialist (see Section 7, p. 54).
Aquatic Habitat Adjustment
Aquatic habitat adjustments are only made for aquatic habitat restoration efforts that meet applicable WDNR and NRCS technical standards (Table 13). If you select one of these management measures, contact your local trading coordinator to quantify the applicable habitat adjustment factor for your project.

45 | P a g e
Table 13. Applicable NRCS technical standards Number Description 395 Stream Habitat and Improvement and Management 657 Wetland Restoration 658 Wetland Creation
Simplified Equation for Upstream Phosphorus or TSS Trades in the same HUC
Given the information above, the trade ratio equation can be simplified to the following for upstream phosphorus or TSS trades within the same HUC 12:
Trade Ratio = (Uncertainty – Habitat Adjustment):1
No trade can have a smaller trade ratio than 1.1:1 for point to point source trades, or 1.2:1 for point to nonpoint source trades. Once a trade ratio is calculated, it should be compared to these minimum trade ratios, and the larger of the two values should be used as the applicable trade ratio.
Example: A nonpoint source uses cover crops to generate phosphorus and TSS credits. The uncertainty factor for cover crops is 2 (Appendix A, p. 56). The credit generator is upstream of the credit user within the same HUC‐12. Therefore, the applicable trade ratio in this example is 2:1, meaning 2 pounds of phosphorus reduction is equivalent to 1 pound of phosphorus credit. Because this practice also captures TSS, a credit user can also take credit for TSS reductions using the same trade ratio.
Trade Ratio = (2 – 0):1 = 2:1
Administrative Costs
These are the costs associated with arranging trading agreements with credit generators and users as well as annual verification that the trading practices are still operational. Both the processes of arranging the agreements and verifying them can be simple (inexpensive) or complex (expensive). Credit users can contract for these services or do it themselves. For example, if verification of BMP operation is just an annual photograph, the credit user could collect it and submit it to WDNR. If verification is an annual review of a farm’s nutrient management activities, a contractor might be hired. Administrative costs can vary significantly and should be considered when determining credit costs.

46 | P a g e
Section 6. Implementing a Trading Strategy Once the credit generators, management practices, and trade ratios are established for the specific trading strategy, implementation can occur. Implementation requires you to develop and implement trade agreements, quantify credits generated, and maintain permit compliance throughout the permit term.
Quantifying Reductions Credit users must quantify reductions made by the credit generator to establish compliance with their WQBEL. The following information will be needed to make this calculation: current pollution load, pollution load post‐trading implementation, and credit threshold (p. 12). The method for quantifying the current pollution load and the credit threshold will depend on the credit generator type. Therefore, this section of the guidance is broken up by credit generator. As mentioned in Section 2 (p. 15) credits must be generated before the WQBEL takes effect in the WPDES permit. Credits will also need to be generated throughout the permit term to maintain compliance through a trading offset throughout the permit term.
Traditional Point Source Reductions
For a traditional point source to be a credit generator, the point source must accept a lower discharge limit than would otherwise be given to them in their WPDES permit. This revised limit will be set below the current effluent quality of the credit generator to ensure that net water quality improvements are made from the trade. The difference between the revised, more restrictive limit and the previously applicable limit (WQBEL or TBEL) is the amount of credit that is generated for trading (Figure 12).
Figure 12. Method for quantifying credits generated by a traditional point source discharge.
Effluent monitoring will be used to verify compliance with the trading WQBEL. The frequency and sampling protocols for effluent monitoring will be specified in the WPDES permits of the credit generator and credit user. Reporting requirements will also be specified in the WPDES permit. Questions on these permit requirements may be submitted to the local wastewater engineer or specialist, or trading coordinator (see Section 7, p. 54 for contact information).
Applicable WQBEL
Pre‐Trade
Applicable WQBEL
Post‐Trade
Amount of Credit
Generated

47 | P a g e
Nonpoint and Other Point Source Reductions
Figure 13. Method for quantifying credits generated by nonpoint or other point sources.
Figure 13 illustrates the process for quantifying credits being generated from agricultural and urban management practices. Modeling will likely be used to quantify the current pollution load as well as the reductions made from agricultural and urban management practices. The following models have been applied throughout Wisconsin to help estimate phosphorus and TSS reductions through improved landscape practices:
• Program for Predicting Polluting Particle Passage thru Pits, Puddles, & Ponds (P8) • SNAP‐Plus (Wisconsin Phosphorus Index) • Spreadsheet Tool for Estimating Pollutant Load (STEPL) • Soil and Water Assessment Tool (SWAT) • Source Loading and Management Model for Windows (WinSLAMM) • UW Barnyard Tool APLE
The type of management practice will dictate which model(s) is appropriate for use. Recommended models by management practice are listed in Appendix A (p. 56). While the models listed in this guidance have traditionally been used to simulate phosphorus and TSS reductions from the landscape with typical BMPs, permittees are not limited to those models cited. If permittees have questions about another model’s applicability, they can contact the WDNR water quality modeling group ([email protected]) for input. Step 1: Baseline Load As mentioned in Section 4, p. 33, the baseline load is the existing pollution load from a given source. The baseline load for most nonpoint sources, such as barnyard loads, runoff from cropland, and streambank erosion, can be quantified for a given calendar year from the models listed above. Because field‐based management practices rely on crop rotations, an averaging period will be necessary to quantify the baseline load from these areas. The baseline condition should be established from the previous full crop rotation and current soil nutrient levels from these areas. Nutrient management plans should contain
Step 1 Quantify the current pollution load (baseline load)
Step 2 Quantify the pollution load based on the management practices identified
Step 3 Subtract the predicted load (step 2) from the baseline load (step 1) to quantify credit being generated
Step 4 Compare the generated credit (step 3) to the credit threshold
48 | P a g e
these data, if available. If unavailable, landowner interviews and other reasonable data collection methods should be utilized to develop an appropriate baseline. A minimum of three years should be used to make this calculation. Steps 2 and 3: Predicted Load and Establishing Credit Once the baseline load is quantified, modeling can be used to predict the future pollution load once management practices are installed. The reductions made by these agricultural and urban management practices represent the credit that has been generated.
Note: In most cases previously installed BMPs cannot be counted towards “credit generating” activities because they would be counted in the baseline load (step 1), not the predicted load (step 2). Some exemptions apply; see Section 2, p. 15, for details.
Step 4: Long-term vs. Interim Credit
As mentioned in Section 2, p. 12, nonpoint sources can generate either interim or long‐term credit. Long‐term credit will be given for all reductions in non‐TMDL areas and for those that go above and beyond the load allocation in TMDL areas. Interim credit will be given for reductions made to comply with TMDL load allocations. Interim credit is available for up to five years.
Documentation There are several pieces of documentation necessary to develop and implement trading in a WPDES permit (Figure 14 and Table 14). This portion of the guidance briefly describes each of the documents. Contact your local trading coordinator with questions or comments (see Section 7, p. 54).
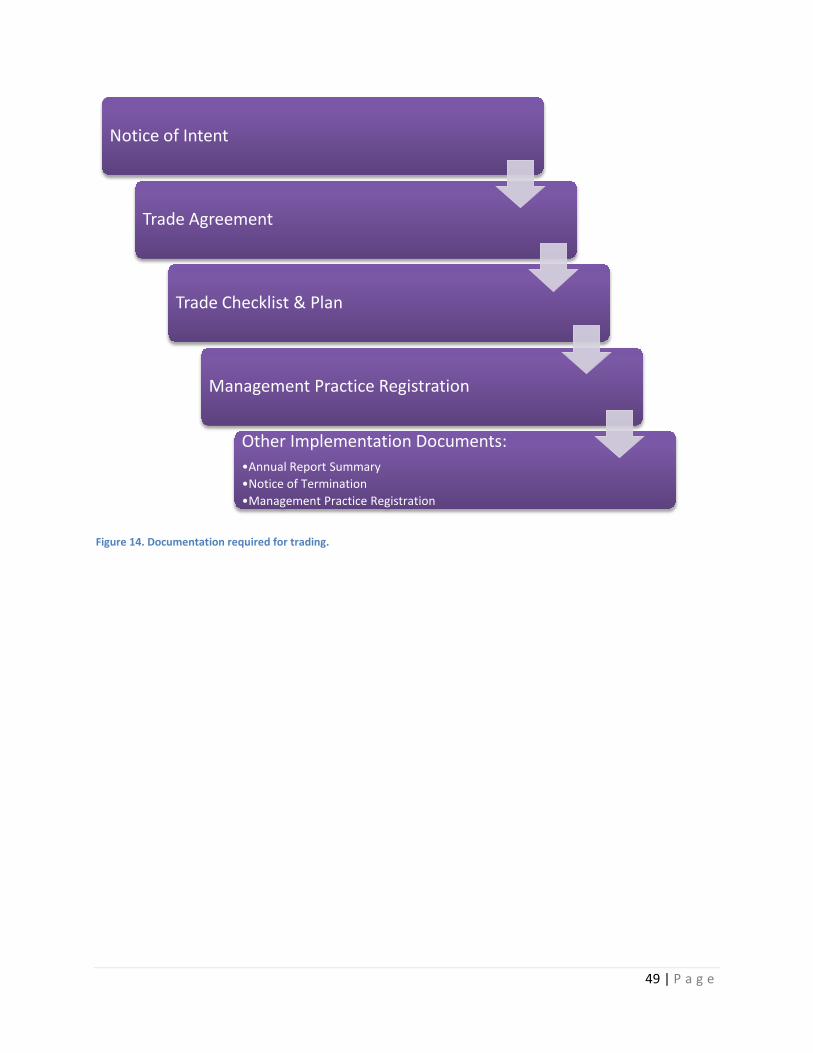
49 | P a g e
Figure 14. Documentation required for trading.
Notice of Intent
Trade Agreement
Trade Checklist & Plan
Management Practice Registration
Other Implementation Documents: •Annual Report Summary •Notice of Termination •Management Practice Registration

50 | P a g e
Table 14. Description of WQT documentation required by the permittee. For the most up-to-date version of these forms visit http://dnr.wi.gov/topic/SurfaceWater/WaterQualityTrading.html.
Trading Document Purpose Parties Involved Notice of Intent
• Credit user submits to WDNR for review and approval • Allows permittee to confirm trading eligibility prior to
plan development • Typically submitted no later than the preliminary facility
plan step of the compliance schedule for TP WQBELs or at least 12 months prior to permit expiration2
• Permittee/credit user • WDNR wastewater
engineer/local trading coordinator
Trade Agreement • Document required of permittee/credit user by s. 283.84, Wis. Stats. to formalize the trade
• Typically completed prior to submittal of the WQT plan or at least 9 months prior to permit expiration2
• Permittee/credit user • Credit generator • WDNR or local
governmental unit (if applicable)
WQT Checklist & Plan • Credit user submits to WDNR for review and approval • Documents will be public noticed with permit reissuance • Outlines the content of the WQT strategy • Typically submitted with the final facility plan step of the
compliance schedule or with the permit application for reissuance at least 6 months prior to permit reissuance2
• Permittee/credit user • WDNR basin
engineer/local trading coordinator
• Statewide trading coordinator, if necessary
Management Practice Registration1
• Submitted to WDNR to verify that the management practice has been properly installed in accordance with the WQT plan
• WDNR reviews and tracks registration using docket numbering system
• Information can be reviewed later for trade verification and auditing
• Permittee/credit user • WDNR wastewater
engineer/local trading coordinator
• Statewide trading coordinator, if necessary
Annual Report Summary1
• Submitted to WDNR to verify management practices identified in the WQT plan are maintained
• Informs WDNR of any changes made to the Trade Agreement or WQT plan
• WDNR reviews, tracks, and modifies permit as necessary
• Permittee/credit user • WDNR wastewater
engineer/local trading coordinator
• Statewide trading coordinator
Notice of Termination1
• Submitted to WDNR prior to practice termination or as soon as the permittee becomes aware of the failure of a practice
• Should be submitted no later than the annual report submittal date
• Permittee/credit user • WDNR wastewater
engineer/local trading coordinator
1‐Only required if the credit generator is a nonpoint source.
2‐ Assumes that the permit contains a compliance schedule that is consistent with the P implementation guidance and is longer than five years.
Notice of Intent As stated in Section 3 (p. 16), a “Notification that Water Quality Trading Will Be Used to Comply with WQBELs” form (also called “Notice of Intent”) should be submitted prior to developing the full trading plan. Such a submittal will serve as a conversation starter between permittee and WDNR staff and allow WDNR to confirm trading eligibility, to suggest possible sources of pollutant reduction credits, and to

51 | P a g e
provide preliminary feedback to help improve the final plan submittal. WDNR recommends that the credit user include the following information in the WQT Notice of Intent:
• An indication whether WQT will be used exclusively or in conjunction with other methods to comply with WQBELs for the traded pollutant;
• PRESTO results verifying nonpoint source loading to the receiving water when trading with nonpoint source credit generators is contemplated;
• A general identification of area(s) where pollutant load reductions may be implemented to generate credits;
• Likely management practice(s) to be used to generate credits; and • The identification of any broker(s), credit exchanges or other third parties likely to be involved in
establishing the trade.
The Notice of Intent form is available for download at http://dnr.wi.gov/topic/SurfaceWater/waterqualitytrading.html. The version of this form available at the time this guidance was written is also provided in Appendix B (p. 57).
Trade Agreement To successfully develop a trading plan, the applicant will need to create a trading strategy with accompanying trade agreements. Trade agreements are contractual agreements between the credit user and generator, or between the credit user and exchange, specifying the location of trading practices, practice description and duration, amount of credit being generated, and other pertinent details of the trade. These agreements are required pursuant to s. 283.84, Wis. Stats., which requires the permittee to reach a binding, written agreement with the credit generator, or with the credit exchange, if applicable. Individual s. 283.84 trade agreements DO NOT need to be directly submitted to WDNR unless WDNR is identified as a partner of the agreement. However, trade agreements may be submitted to WDNR in support of the trading plan. If trade agreements are not submitted directly to WDNR, a certification step is required to validate that trade agreements exist. Cost share agreements can be used as a starting point to develop trade agreements with nonpoint source credit generators. Most nonpoint sources have either direct or indirect experience with cost share agreements used by the County LCD and WDNR. An example cost share agreement is available at http://dnr.wi.gov/files/PDF/forms/3400/3400‐069.pdf. Additional examples are also provided in Appendix E and F (pp. 74 and 77).
Individual trade agreements submitted to WDNR do not need to include private information such as individual names of nonpoint source credit generators, contact information of nonpoint source credit generators, or financial reimbursement levels for the trade.

52 | P a g e
Trading Plan and Checklist The permittee must submit a trading plan to WDNR, and the requirements of the trade must be built into the WPDES permit, before trading can be used to demonstrate compliance with a WQBEL. WDNR encourages that the trading plan be submitted with the permit application to avoid permit modification. However, the ultimate due date for the plan and checklist will vary depending on the length of the compliance schedule (See Section 3, p. 16).
WDNR recommends that a water quality trading checklist be submitted with the trading plan. The purpose of the checklist is to summarize the content of the plan, and to ensure that the necessary components of the plan have been included. The trading checklist in Appendix C (p. 64) provides an outline of the information that should be included in the WQT plan. Visit http://dnr.wi.gov/topic/SurfaceWater/waterqualitytrading.html to download the current version of the checklist.
The information in the checklist and plan will serve as the basis for permitting decisions. In order to obtain approval from WDNR to use trading to comply with their WQBELs, the trading plan must contain sufficient detail to allow WDNR to conclude that the terms of the trade agreement(s) comply with the ground rules for trading and results in the generation of sufficient pollutant reduction credits to allow the credit user to comply with the WQBELs. As part of the plan, the permittee must include a binding, written agreement as required in s. NR 283.84 (1), Wis. Stats., or certify that such an agreement has been reached, as stated above.
Management Practice Registration The purpose of the management practice registration is to ratify to WDNR that a management practice identified in the plan has been properly installed and is effective. This information will be used to track implementation progress, verify compliance, and perform audits, as necessary. A trade registration should be submitted for every management practice that has been identified in the WQT plan. This documentation is only required for point to nonpoint source trades; point to point source trades will be demonstrated via effluent monitoring and will have documentation and effective date requirements specified in the WPDES permits.
If practices are effective prior to trading plan submittal, trade registrations can be submitted with the plan. Otherwise trade registrations should be submitted during the permit term, as practices become effective, or with the annual report. The trade registration is available for download at http://dnr.wi.gov/topic/SurfaceWater/waterqualitytrading.html. The version of this form available at the time this guidance was written is also provided in Appendix G (p. 82).
Annual Report Permittees will need to submit annual reports as part of their permit requirements. The purpose of the annual report is to inform WDNR of the status of management practices, provide WDNR with an update

53 | P a g e
of the trading project overall, and submit any needed changes to the plan to WDNR. Trade Registrations and Notices of Termination should be submitted to WDNR prior to or with the annual report submittal. The following should be included in the annual report:
• Verification that site inspections occurred • Brief summary of site inspection findings • Any applicable notices of termination or practice registration • Amount of credit used each month over the calendar year • Other requirements as stated in the WPDES permit
Notice of Termination If a trade agreement or the trading plan needs to be modified or terminated during the permit term, the permittee should submit a Notice of Termination to inform WDNR of the termination. This information will be used to determine if a permit modification is required due to the termination, the termination will result in non‐compliance, or other permit actions are required due to the termination.
The Notice of Termination form is available for download at: http://dnr.wi.gov/topic/SurfaceWater/waterqualitytrading.html. The version of this form available at the time this guidance was written is provided in Appendix H (p. 84). This document should be submitted to WDNR prior to practice termination, no later than the submittal date of the annual report.

54 | P a g e
Section 7. Contact Information As previously mentioned, this guidance document is one of several available to help explain Wisconsin’s trading program. Other available trading guidance documents include “A Water Quality Trading Framework for Wisconsin (2011)”, and “Guidance for Implementing Water Quality Trading in WPDES Permits (2013)”. These guidance documents are available at: http://dnr.wi.gov/topic/surfacewater/phosphorus.html.
WDNR is committed to making trading as flexible and accountable as possible. As you work towards developing and implementing a trading strategy, WDNR staff are available to answer questions and provide technical feedback. Trading questions can be directed to your local trading and adaptive management coordinator, or to your local basin engineer or specialist. WDNR is committed to working towards water quality improvements together.

55 | P a g e
Table 15. WDNR Water Quality Trading Contacts.
Location Contact Information WDNR Office Counties Served Statewide water quality trading coordinators
Kevin Kirsch [email protected] 608‐266‐7019 Mike Hammers [email protected] 608‐267‐7640
GEF 2 Statewide
Statewide adaptive management coordinator
Amanda Minks [email protected] 608‐264‐9223
GEF 2 Statewide
Northern District adaptive management/water quality trading coordinator
Lonn Franson [email protected] 715‐634‐9658
Hayward Service Center
Ashland, Barron, Bayfield, Burnett, Douglas, Forest, Florence, Iron, Langlade, Lincoln, Oneida, Polk, Price, Rusk, Sawyer, Taylor, Vilas, Washburn,
Southern District adaptive management/water quality trading coordinator
Amy Schmidt [email protected] 608‐275‐3258
Fitchburg Service Center
Columbia, Dane, Dodge, Grant, Green, Iowa, Jefferson, Lafayette, Richland, Rock, and Sauk
Southern District adaptive management/water quality trading coordinator
Sharon Gayan [email protected] 608‐263‐8707
Milwaukee Headquarters
Kenosha, Milwaukee, Ozaukee, Racine, Sheboygan, Walworth, Washington, and Waukesha
Eastern District adaptive management/water quality trading coordinator
Keith Marquardt [email protected] 920‐303‐5435
Oshkosh Service Center
Brown, Calumet, Door, Fond du Lac, Green Lake, Kewaunee, Manitowoc, Marinette, Marquette, Menominee, Oconto, Outagamie, Shawano, Waupaca, Waushara, and Winnebago
Western District adaptive management/water quality trading coordinator
Mike Vollrath [email protected] 608‐275‐3288 Pat Oldenburg [email protected] 715‐831‐3262
Eau Claire Service Center
Adams, Buffalo, Chippewa, Clark, Crawford, Dunn, Eau Claire, Jackson, Juneau, La Crosse, Marathon, Monroe, Pepin, Pierce, Portage, St. Croix, Trempealeau, Vernon, Wood,

56 | P a g e
Appendix A. Uncertainty Ratios The uncertainty factor accounts for the multiple types of uncertainty that normally occur in the generation of pollutant reduction credits, especially when credits are generated by a nonpoint source. Uncertainties originate from climatic variability, potential inaccuracies in field testing or modeling of the amount of pollutant controlled by a management practice, and the reliability of the management practice to perform. Below is a list of nonpoint source management practices that may be used to generate credits for trading. The list specifies an uncertainty factor for each practice. Generators of pollutant reduction credits are not restricted to the management practices covered by the following list, but if not present in the list a proposed management practice will likely require an evaluation by the WDNR before credits generated by the practice are approved for use by a second source to demonstrated compliance with permit limits.

57 | P a g e
Table 16. Management practices with preapproved credit generation and use information. Visit http://dnr.wi.gov/topic/SurfaceWater/waterqualitytrading.html for the current version of this Table.
Management Practice Uncertainty
Factor1
Applicable Technical Standard
Method for Calculating Pollutant Load
Reductions Notes
Agricultural Practices
Whole Field Management: Requires an approved nutrient management plan, filter strips/buffer strips, grassed waterways, conservation or no till, and cover crops. Additional practices as deemed by NRCS or County Conservationist may be required to protect against mobilization and delivery of pollutants.
1 NRCS 590, 393, 332, 412, 345 329, 340 and 330
SNAP‐Plus or equivalent model
results compared to baseline
Requires an approved NRCS 590 nutrient management plan (NMP) that meets both the soil test‐P and PI requirements.
Requires a draw down strategy for nutrient concentrations that are above University of Wisconsin‐Extension soil fertility recommendations.
No application of manure, biosolids, or industrial wastes on snow covered or frozen ground or on fields with high groundwater or tile drainage.
A crop or livestock producer engaged in a trade agreement must have all fields under an approved NMP, not just fields engaged in the trade.
Companion Crops (perennial vegetation)
1 NRCS 340 SNAP‐Plus or equivalent model
results compared to baseline
Model as perennial cover
Companion crops must be established to provide continuous protection to soil surface and placed in support of Nutrient Management and supporting practices outlined below.
Conservation Easement 1 NRCS 327 SNAP‐Plus or equivalent model
results compared to baseline
Land in perennial vegetation.

58 | P a g e
Management Practice Uncertainty
Factor1
Applicable Technical Standard
Method for Calculating Pollutant Load
Reductions Notes
Nutrient Management and supporting practices:
2 (3) NRCS 590
SNAP‐Plus or equivalent model
results compared to baseline
An approved NMP is required with any of the listed supporting practices. All supporting practices receive the same uncertainty factor as the NMP.
An uncertainty factor of 2, instead of (3), may be used when documentation can be provided through historic cropping records or soil testing that nutrient levels are stable or dropping, an indication of adherence to the NMP.
An uncertainty factor of (3) is required if fields are not brought into compliance with NR 151.02 and NR 151.04, Wis. Adm. Code.
No application of manure, biosolids or industrial wastes allowed on snow‐covered or frozen ground or on fields with high groundwater or tile drainage.
A crop or livestock producer engaged in a trade agreement must have all fields under an approved NMP, not just fields engaged in the trade.
Use of grassed waterways on fields in support of nutrient management and other supporting practices lowers the uncertainty factor to 1.5.
Tillage Options Mulch Till No Till
2 (3) 2 (3)
NRCS 345 NRCS 329
Riparian Filter Strip (edge of field) 2 (3) NRCS 393
Grassed Waterway See Notes NRCS 412
Cover Crop
Other practices simulated in SNAP‐Plus
2 (3)
2 (3)
NRCS 340
Production Area Practices Diversion Roof Runoff Structure Vegetated Treatment System Constructed Wetland
2 2 4 4
NRCS 362 NRCS 558 NRCS 635 NRCS 656
University of Wisconsin Barnyard Tool APLE or equivalent modeling
method
Sediment Control Basin 2 NRCS 350 RUSLE2 For agricultural runoff control.
Streambank Stabilization and Shoreline Protection
Without aquatic habitat restoration
3
NRCS 580 NRCS 382
Contact WDNR to discuss project and
develop a method to quantify impact of
stabilization. Appropriate methods
include NRCS regression calculation.
For livestock producers, streambank stabilization must be accompanied by riparian fencing or other controls to prevent destruction of streambanks.
With aquatic habitat restoration 2 NRCS 580 NRCS 395

59 | P a g e
Management Practice Uncertainty
Factor1
Applicable Technical Standard
Method for Calculating Pollutant Load
Reductions Notes
Dredging, Lake Treatment and Wetland Restoration
Lakes and Reservoirs
Dredging and removal of in‐situ sediment and nutrients or treatment (i.e., alum)
3
Load reductions calculated by
determining seasonal flux rate of pollutant
entering water column
Dredging must remove sediment to the original or native layer.
Seasonal flux rate should be calculated based on a calibrated model or monitoring data. Annual load reductions are generated based on the calculated seasonal flux rate.
Load reductions are generated on a prorated annual basis until the flux rate returns back to pre‐dredging flux rate conditions.
Dredging and removal of in‐situ sediment and nutrients or treatment accompanied by aquatic habitat restoration.
2 NRCS 395
Rivers or Streams
Dredging with stable stream banks, installation of appropriately wide buffer strips and supporting upland practices addressing pollutants of concern
1 NRCS 580
Dredging without stabilized stream banks or without supporting upland practices
3
Wetland Restoration 1 NRCS 657 NRCS 658
SNAP‐Plus or equivalent model
results compared to baseline
Load Reductions are generated for land placed out of production such as the conversion of agricultural land back to wetland. Credits may not generated by using wetlands to treat runoff.

60 | P a g e
Management Practice Uncertainty
Factor1
Applicable Technical Standard
Method for Calculating Pollutant Load
Reductions Notes
Urban Practices
Bioretention for Infiltration 2 DNR 1004 SLAMM, P8, or Recarga
Urban practices are not to be installed in wetlands, as they will be ineffective in hydric soils with a high water table.
Infiltration Basin 2 DNR 1003 SLAMM, P8, or Recarga
Infiltration Trench 2 DNR 1007 SLAMM, P8, or Recarga
Proprietary Storm Water Sedimentation Devices
2 DNR 1006 SLAMM
Vegetated Infiltration Swales 2 DNR 1005 SLAMM or P8
Wet Detention Pond 2 DNR 1001 SLAMM or P8 1 Uncertainty factors provided in this table are applicable to TP and TSS only. 2 When using SNAP‐Plus or an equivalent model to calculate load reductions, use the same soil type and field slope when calculating pollutant loads prior to and after installation of the
management practice.
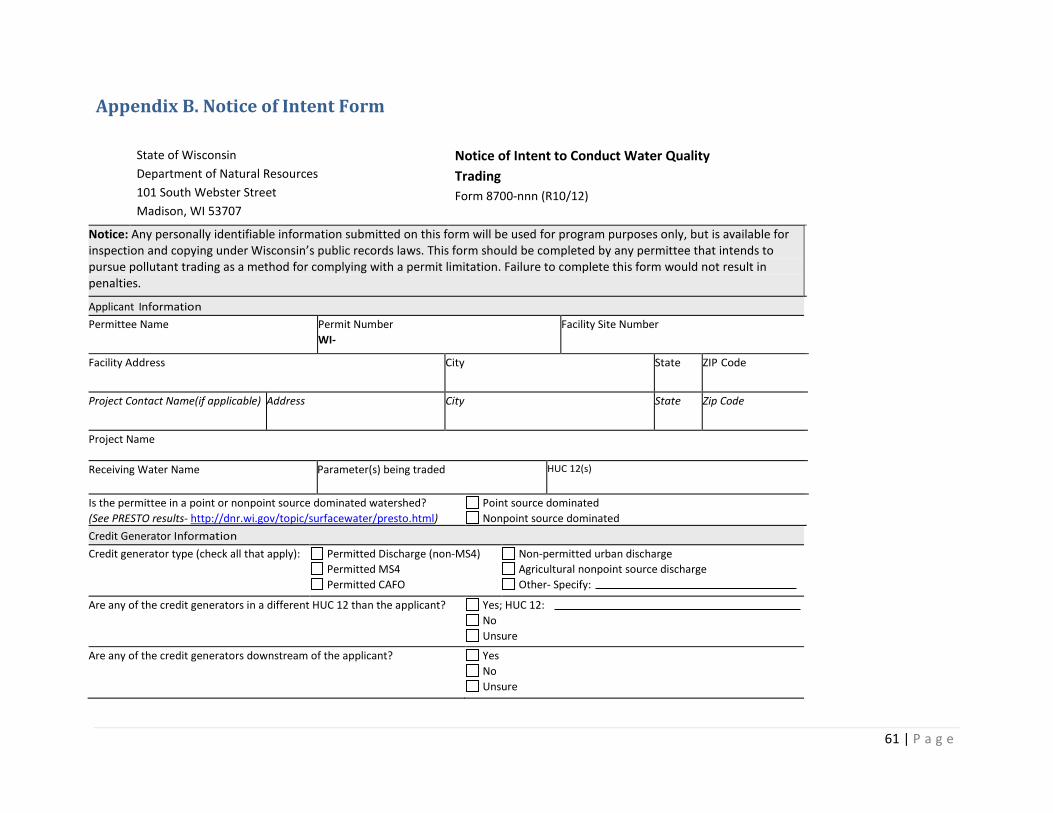
61 | P a g e
Appendix B. Notice of Intent Form
State of Wisconsin Department of Natural Resources 101 South Webster Street Madison, WI 53707
Notice of Intent to Conduct Water Quality Trading Form 8700‐nnn (R10/12)
Notice: Any personally identifiable information submitted on this form will be used for program purposes only, but is available for inspection and copying under Wisconsin’s public records laws. This form should be completed by any permittee that intends to pursue pollutant trading as a method for complying with a permit limitation. Failure to complete this form would not result in penalties.
Applicant Information Permittee Name Permit Number
WI- Facility Site Number
Facility Address City State ZIP Code
Project Contact Name(if applicable) Address City State Zip Code
Project Name
Receiving Water Name Parameter(s) being traded HUC 12(s)
Is the permittee in a point or nonpoint source dominated watershed? (See PRESTO results- http://dnr.wi.gov/topic/surfacewater/presto.html)
Point source dominated Nonpoint source dominated
Credit Generator Information Credit generator type (check all that apply):
Permitted Discharge (non‐MS4) Permitted MS4 Permitted CAFO
Non‐permitted urban discharge Agricultural nonpoint source discharge Other‐ Specify:
Are any of the credit generators in a different HUC 12 than the applicant? Yes; HUC 12: No Unsure
Are any of the credit generators downstream of the applicant? Yes No Unsure

62 | P a g e
Will a broker/exchange be used to facilitate trade? Yes; Name: No Unsure
Point to Point Trades (Traditional Municipal/Industrial Discharge, MS4, CAFO):
Discharge Type Permit Number Name Contact Address Is the PS currently in compliance with their permit requirements?
Traditional MS4 CAFO
Yes Unsure No
Traditional MS4 CAFO
Yes Unsure No
Traditional MS4 CAFO
Yes Unsure No
Traditional MS4 CAFO
Yes Unsure No
Traditional MS4 CAFO
Yes Unsure No
Point to Nonpoint Trades (Agricultural, Non-Permitted Urban, etc.):
Check all practices that will be used to generate credits:
Method for quantifying credits generated: Monitoring Modeling, Names: Other:
Projected date credits will be available:
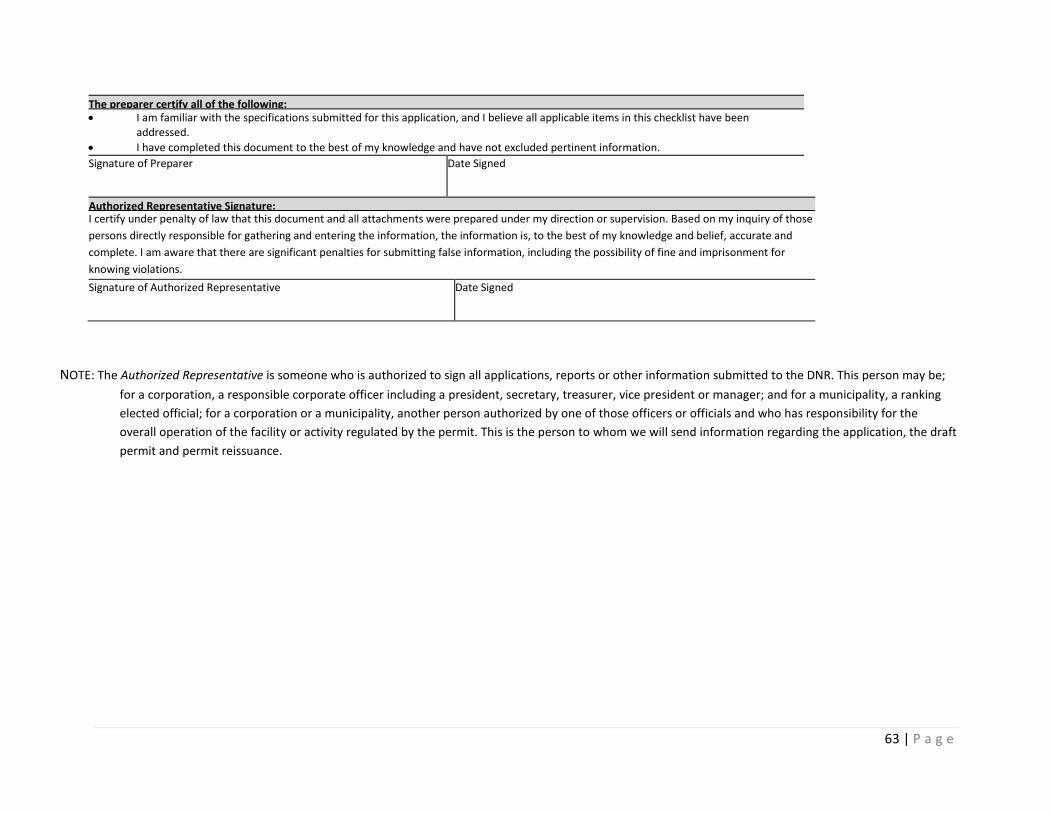
63 | P a g e
NOTE: The Authorized Representative is someone who is authorized to sign all applications, reports or other information submitted to the DNR. This person may be; for a corporation, a responsible corporate officer including a president, secretary, treasurer, vice president or manager; and for a municipality, a ranking elected official; for a corporation or a municipality, another person authorized by one of those officers or officials and who has responsibility for the overall operation of the facility or activity regulated by the permit. This is the person to whom we will send information regarding the application, the draft permit and permit reissuance.
The preparer certify all of the following: • I am familiar with the specifications submitted for this application, and I believe all applicable items in this checklist have been
addressed. • I have completed this document to the best of my knowledge and have not excluded pertinent information.
Signature of Preparer Date Signed
Authorized Representative Signature: I certify under penalty of law that this document and all attachments were prepared under my direction or supervision. Based on my inquiry of those persons directly responsible for gathering and entering the information, the information is, to the best of my knowledge and belief, accurate and complete. I am aware that there are significant penalties for submitting false information, including the possibility of fine and imprisonment for knowing violations.
Signature of Authorized Representative Date Signed
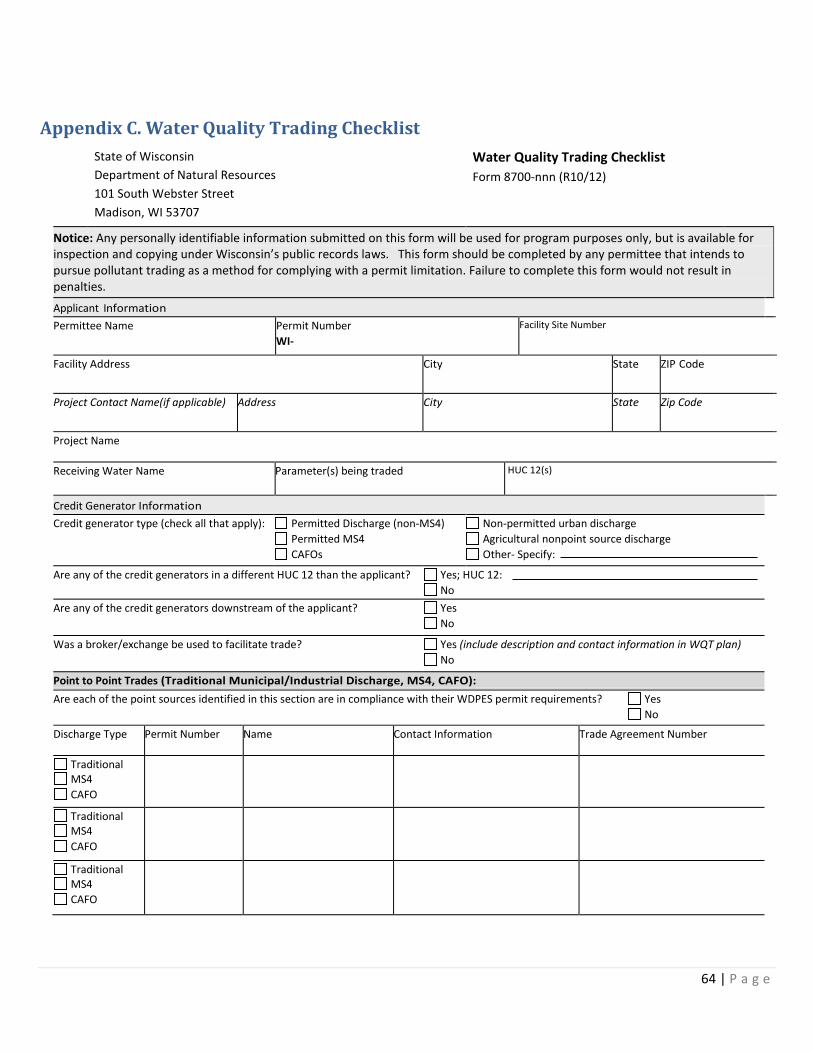
64 | P a g e
Appendix C. Water Quality Trading Checklist State of Wisconsin Department of Natural Resources 101 South Webster Street Madison, WI 53707
Water Quality Trading Checklist Form 8700‐nnn (R10/12)
Notice: Any personally identifiable information submitted on this form will be used for program purposes only, but is available for inspection and copying under Wisconsin’s public records laws. This form should be completed by any permittee that intends to pursue pollutant trading as a method for complying with a permit limitation. Failure to complete this form would not result in penalties. Applicant Information Permittee Name Permit Number
WI- Facility Site Number
Facility Address City State ZIP Code
Project Contact Name(if applicable) Address City State Zip Code
Project Name
Receiving Water Name Parameter(s) being traded HUC 12(s)
Credit Generator Information Credit generator type (check all that apply):
Permitted Discharge (non‐MS4) Permitted MS4 CAFOs
Non‐permitted urban discharge Agricultural nonpoint source discharge Other‐ Specify:
Are any of the credit generators in a different HUC 12 than the applicant? Yes; HUC 12: No
Are any of the credit generators downstream of the applicant? Yes No
Was a broker/exchange be used to facilitate trade? Yes (include description and contact information in WQT plan) No
Point to Point Trades (Traditional Municipal/Industrial Discharge, MS4, CAFO):
Are each of the point sources identified in this section are in compliance with their WDPES permit requirements? Yes No
Discharge Type Permit Number Name Contact Information Trade Agreement Number
Traditional MS4 CAFO
Traditional MS4 CAFO
Traditional MS4 CAFO

65 | P a g e
Traditional MS4 CAFO
Traditional MS4 CAFO
Does plan have a narrative that describes: Plan Section a. Summary of discharge and existing treatment including optimization
Yes No
b. Amount of credit being generated
Yes No c. Timeline for credits and agreements
Yes No
d. Method for quantifying credits Yes No e. Tracking and verification procedures Yes No f. Location of credit generator in proximity to receiving water and credit user Yes No
g. Other: Yes No Point to Nonpoint Trades (Non-permitted urban, agricultural, other): Type Practices Used to Generate Credits Method of Quantification Trade Agreement Number Have the practice(s)
been formally registered?
Urban NPS Agricultural NPS Other
Yes No Only in part
Urban NPS Agricultural NPS Other
Yes No Only in part
Urban NPS Agricultural NPS Other
Yes No Only in part
Urban NPS Agricultural NPS Other
Yes No Only in part
Urban NPS Agricultural NPS Other
Yes No Only in part
Urban NPS Agricultural NPS Other
Yes No Only in part
Urban NPS Agricultural NPS Other
Yes No Only in part
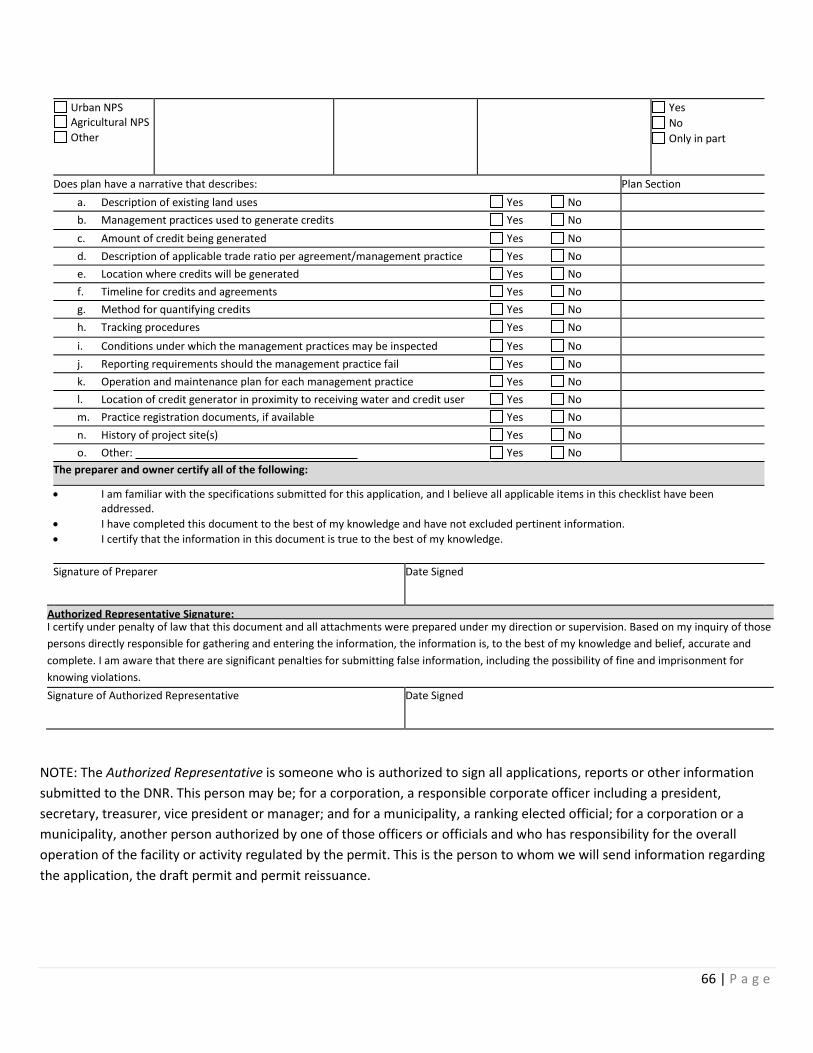
66 | P a g e
Urban NPS Agricultural NPS Other
Yes No Only in part
Does plan have a narrative that describes: Plan Section a. Description of existing land uses
Yes No
b. Management practices used to generate credits
Yes No c. Amount of credit being generated
Yes No
d. Description of applicable trade ratio per agreement/management practice Yes No e. Location where credits will be generated Yes No f. Timeline for credits and agreements
Yes No
g. Method for quantifying credits Yes No h. Tracking procedures Yes No i. Conditions under which the management practices may be inspected Yes No j. Reporting requirements should the management practice fail Yes No k. Operation and maintenance plan for each management practice Yes No l. Location of credit generator in proximity to receiving water and credit user Yes No m. Practice registration documents, if available Yes No n. History of project site(s) Yes No o. Other: Yes No
The preparer and owner certify all of the following:
• I am familiar with the specifications submitted for this application, and I believe all applicable items in this checklist have been addressed.
• I have completed this document to the best of my knowledge and have not excluded pertinent information. • I certify that the information in this document is true to the best of my knowledge. Signature of Preparer Date Signed
Authorized Representative Signature: I certify under penalty of law that this document and all attachments were prepared under my direction or supervision. Based on my inquiry of those persons directly responsible for gathering and entering the information, the information is, to the best of my knowledge and belief, accurate and complete. I am aware that there are significant penalties for submitting false information, including the possibility of fine and imprisonment for knowing violations.
Signature of Authorized Representative Date Signed
NOTE: The Authorized Representative is someone who is authorized to sign all applications, reports or other information submitted to the DNR. This person may be; for a corporation, a responsible corporate officer including a president, secretary, treasurer, vice president or manager; and for a municipality, a ranking elected official; for a corporation or a municipality, another person authorized by one of those officers or officials and who has responsibility for the overall operation of the facility or activity regulated by the permit. This is the person to whom we will send information regarding the application, the draft permit and permit reissuance.

67 | P a g e
Appendix D: Eight Easy Steps to Finding Your 12‐digit Hydrologic Unit Code (HUC) Water quality trading should be fully contained within the 12‐digit Hydrologic Unit Code (HUC) where the discharger is located whenever possible. Permittees should work with their local WDNR wastewater engineer, specialist, or trading coordinator, if an adjacent HUC 12 or larger scale HUC is desired. The Surface Water Data Viewer is an effective tool to identify your HUC 12, and can provide you with other data such as surface water outfall locations in your watershed. This Appendix briefly orients you to this tool by identifying an example HUC 12 watershed in Wisconsin (the Spring Creek watershed).
Step 1: To locate your HUC 12 click on the link below, which will take you to WDNR’s Surface Water Data Viewer Home Page: http://dnr.wi.gov/topic/surfacewater/swdv/.
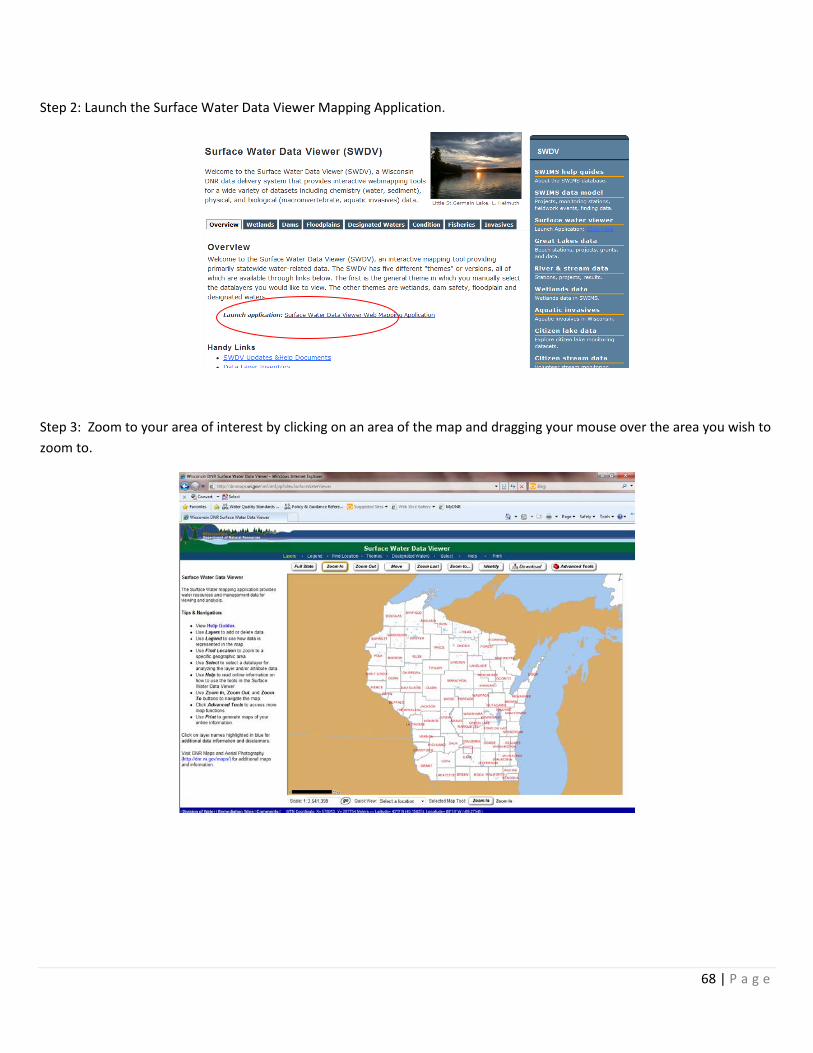
68 | P a g e
Step 2: Launch the Surface Water Data Viewer Mapping Application.
Step 3: Zoom to your area of interest by clicking on an area of the map and dragging your mouse over the area you wish to zoom to.
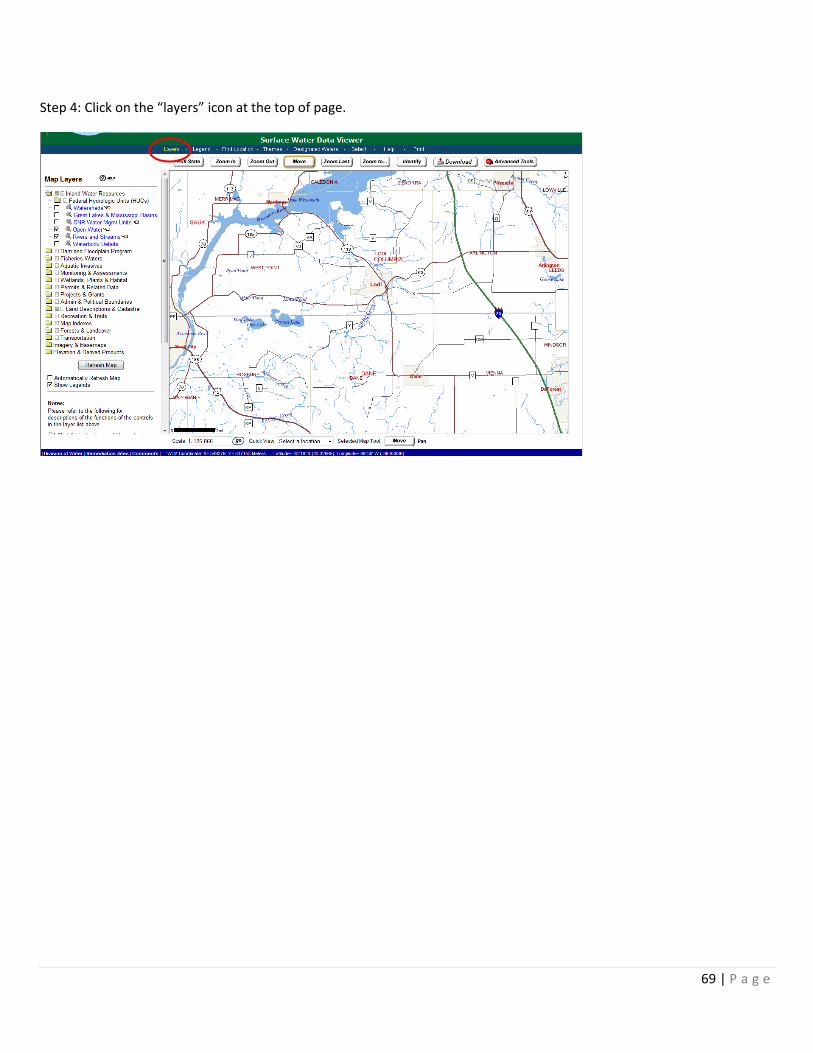
69 | P a g e
Step 4: Click on the “layers” icon at the top of page.

70 | P a g e
Step 5: Click on the “Federal Hydrologic Units (HUCs)” folder and select the “12‐digit HUCs” layer. Note: you may also be interested in the “Surface Water Outfalls” layer in the “Permits and Relate Data” Folder. This layer shows you all of the point source discharges in your HUC 12 watershed.
Step 6: Activate the 12‐digit HUCs layer by clicking on the mouse icon next to the layer name. This will make the layer turn blue.

71 | P a g e
Step 7: Highlight the HUC 12 you are interested in by clicking anywhere within the HUC 12 of interest, and select “new” in the left hand panel.
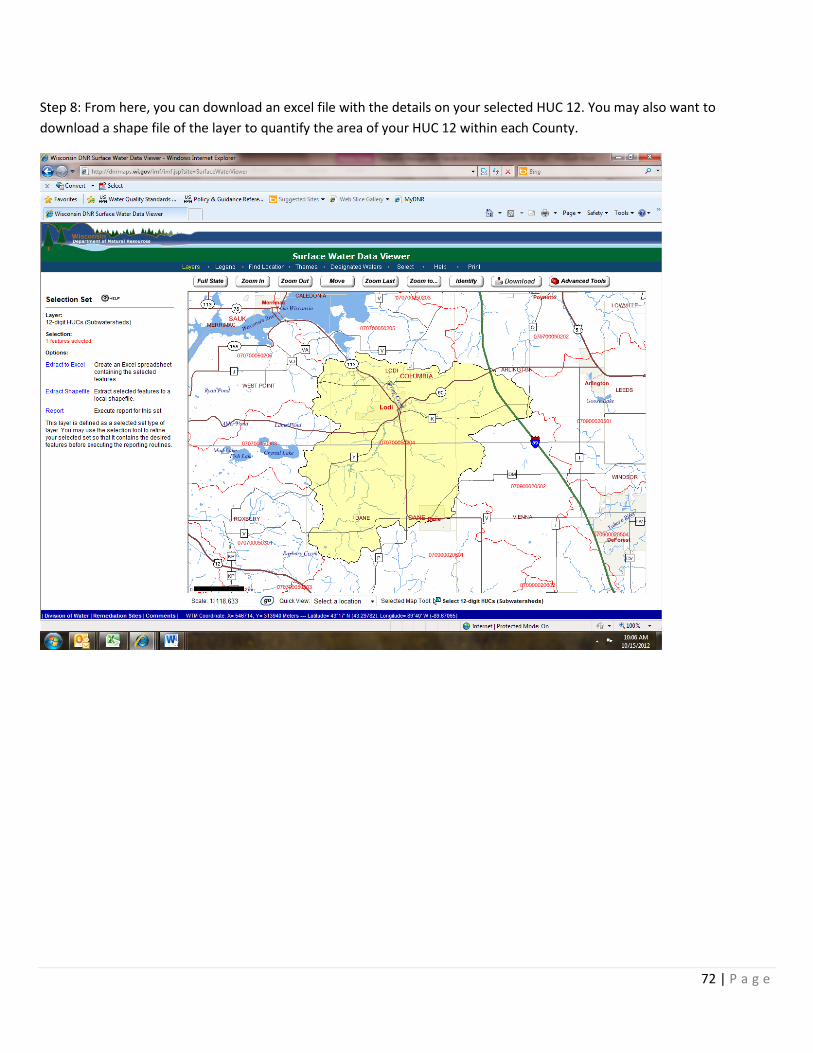
72 | P a g e
Step 8: From here, you can download an excel file with the details on your selected HUC 12. You may also want to download a shape file of the layer to quantify the area of your HUC 12 within each County.
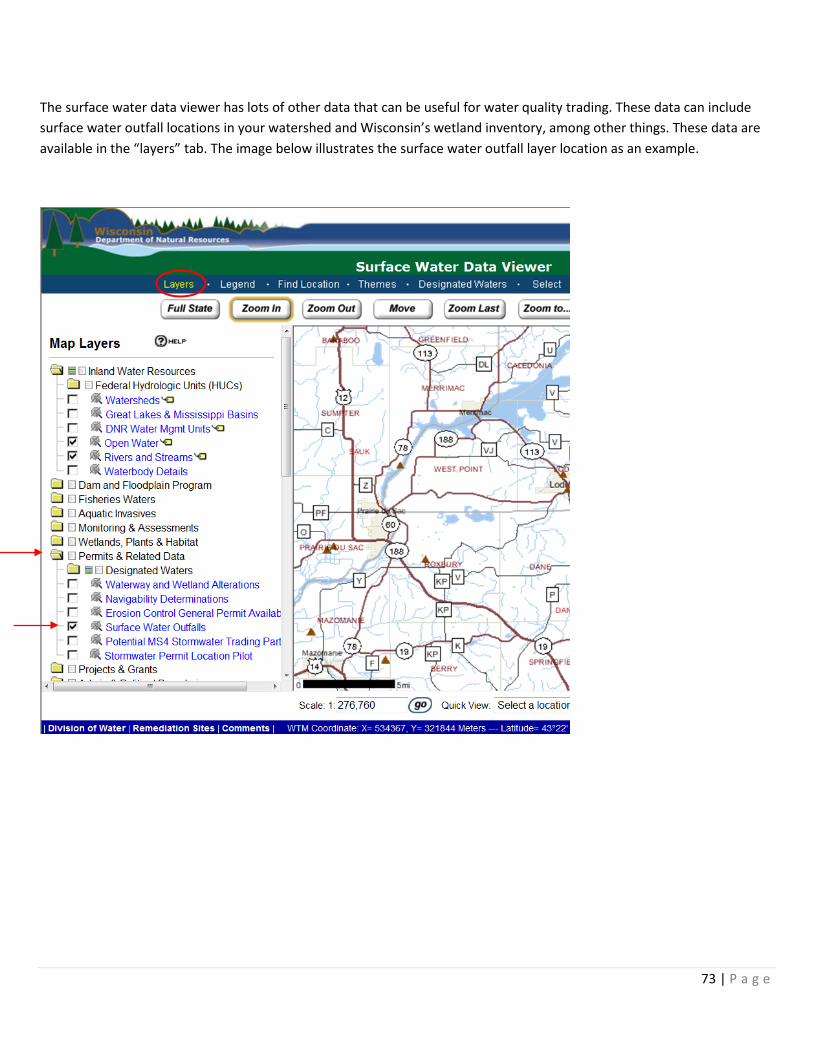
73 | P a g e
The surface water data viewer has lots of other data that can be useful for water quality trading. These data can include surface water outfall locations in your watershed and Wisconsin’s wetland inventory, among other things. These data are available in the “layers” tab. The image below illustrates the surface water outfall layer location as an example.
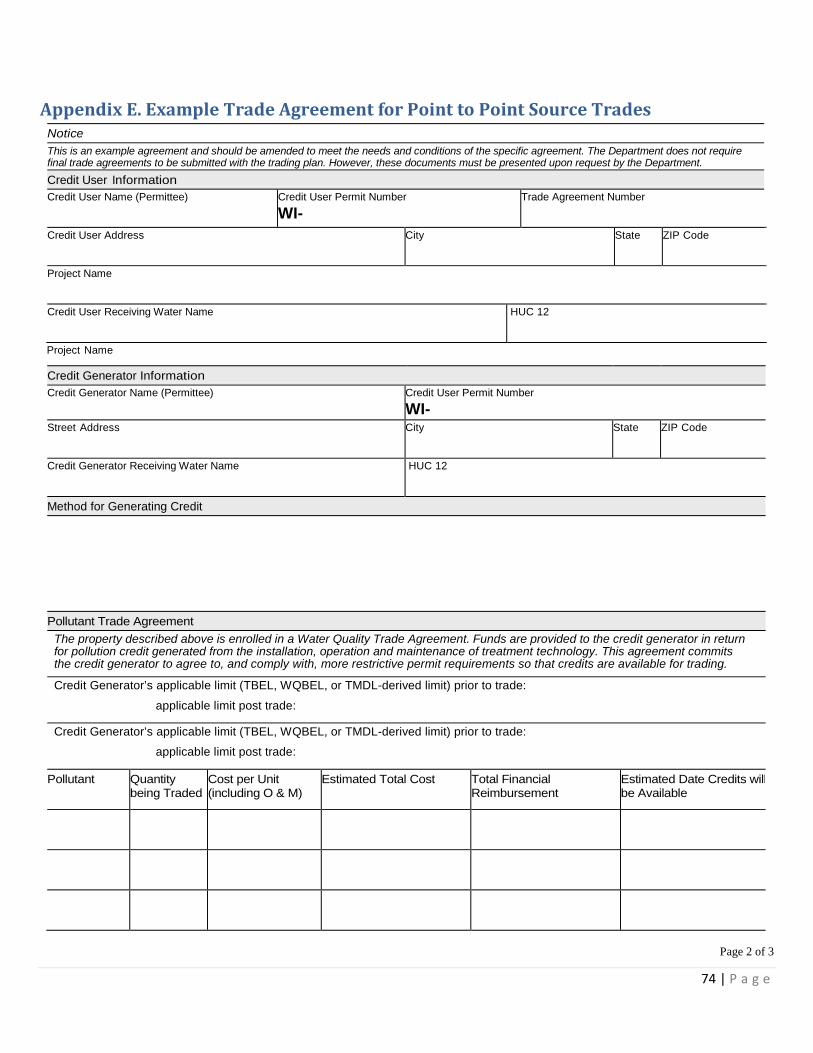
74 | P a g e
Appendix E. Example Trade Agreement for Point to Point Source Trades Notice This is an example agreement and should be amended to meet the needs and conditions of the specific agreement. The Department does not require final trade agreements to be submitted with the trading plan. However, these documents must be presented upon request by the Department. Credit User Information Credit User Name (Permittee) Credit User Permit Number
WI- Trade Agreement Number
Credit User Address City State ZIP Code
Project Name
Credit User Receiving Water Name HUC 12
Project Name
Credit Generator Information Credit Generator Name (Permittee) Credit User Permit Number
WI- Street Address City State ZIP Code
Credit Generator Receiving Water Name HUC 12
Method for Generating Credit
Pollutant Trade Agreement The property described above is enrolled in a Water Quality Trade Agreement. Funds are provided to the credit generator in return for pollution credit generated from the installation, operation and maintenance of treatment technology. This agreement commits the credit generator to agree to, and comply with, more restrictive permit requirements so that credits are available for trading.
Credit Generator’s applicable limit (TBEL, WQBEL, or TMDL-derived limit) prior to trade:
applicable limit post trade:
Credit Generator’s applicable limit (TBEL, WQBEL, or TMDL-derived limit) prior to trade:
applicable limit post trade:
Pollutant Quantity being Traded
Cost per Unit (including O & M)
Estimated Total Cost Total Financial Reimbursement
Estimated Date Credits will be Available
Page 2 of 3
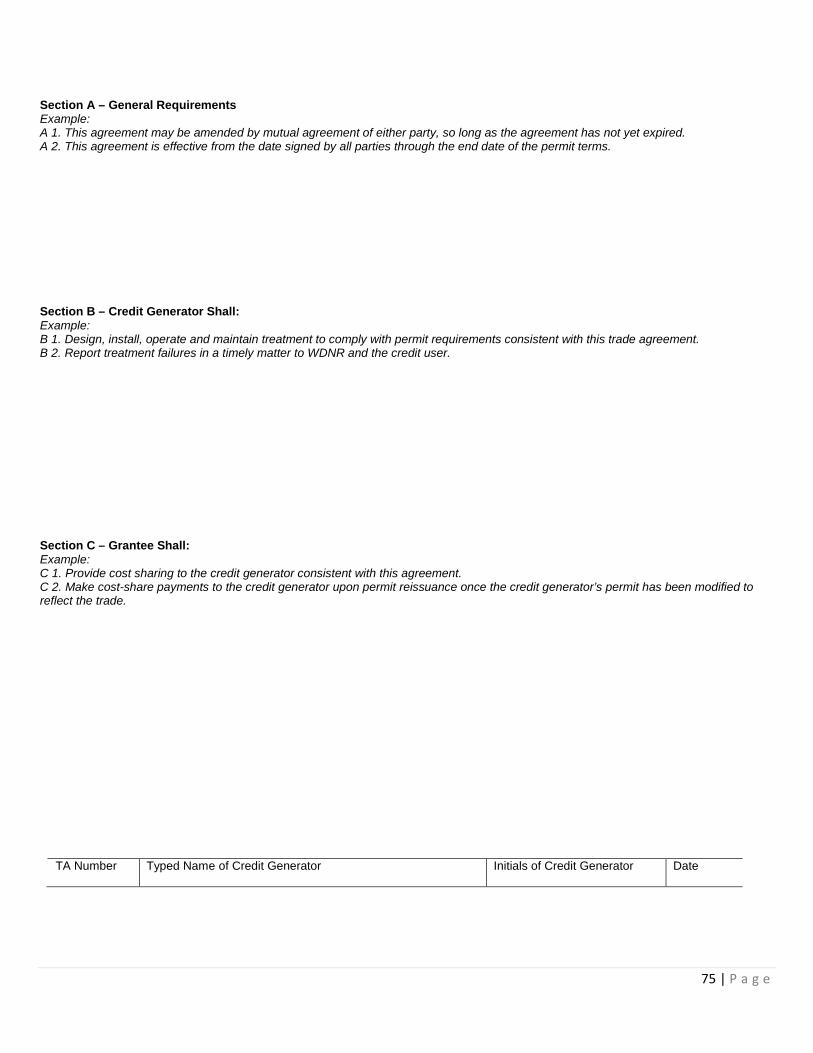
75 | P a g e
Section A – General Requirements Example: A 1. This agreement may be amended by mutual agreement of either party, so long as the agreement has not yet expired. A 2. This agreement is effective from the date signed by all parties through the end date of the permit terms. Section B – Credit Generator Shall: Example: B 1. Design, install, operate and maintain treatment to comply with permit requirements consistent with this trade agreement. B 2. Report treatment failures in a timely matter to WDNR and the credit user. Section C – Grantee Shall: Example: C 1. Provide cost sharing to the credit generator consistent with this agreement. C 2. Make cost-share payments to the credit generator upon permit reissuance once the credit generator’s permit has been modified to reflect the trade.
TA Number Typed Name of Credit Generator Initials of Credit Generator Date
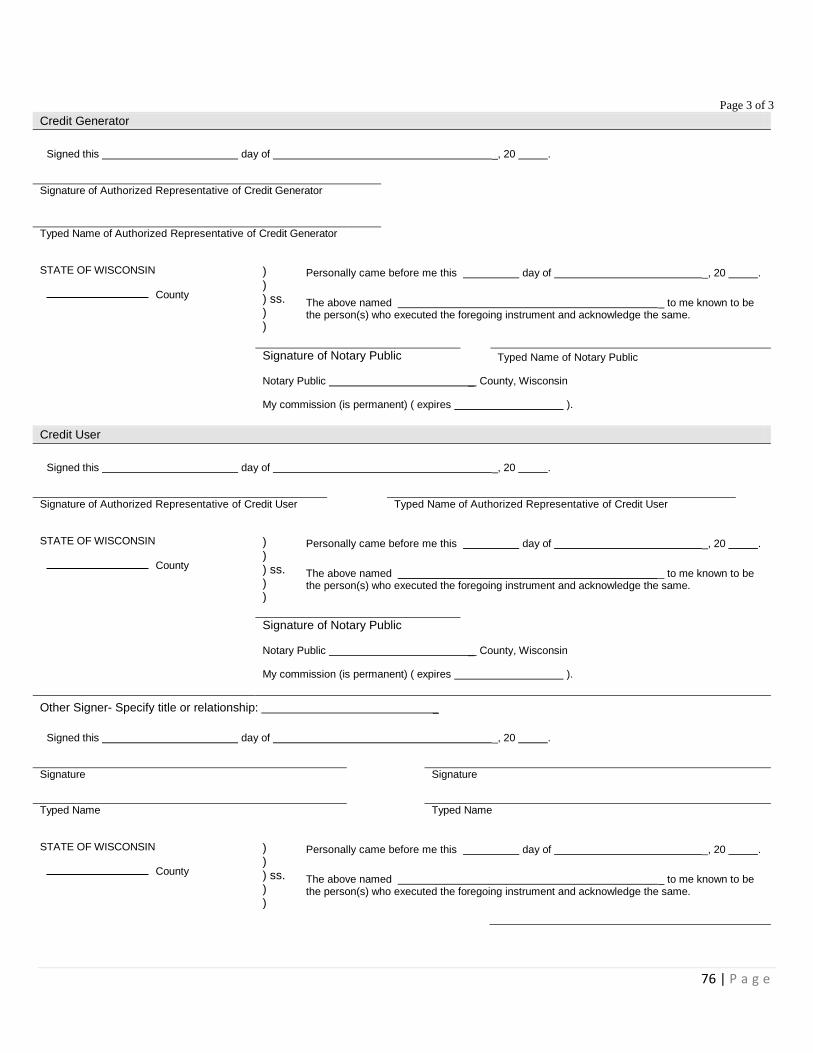
76 | P a g e
Page 3 of 3 Credit Generator
Signed this day of _, 20 .
Signature of Authorized Representative of Credit Generator
Typed Name of Authorized Representative of Credit Generator
STATE OF WISCONSIN County
) ) ) ss. ) )
Personally came before me this day of _, 20 . The above named _ to me known to be the person(s) who executed the foregoing instrument and acknowledge the same.
Signature of Notary Public Typed Name of Notary Public
Notary Public _ County, Wisconsin
My commission (is permanent) ( expires ).
Credit User Signed this day of _, 20 .
Signature of Authorized Representative of Credit User Typed Name of Authorized Representative of Credit User STATE OF WISCONSIN County
) ) ) ss. ) )
Personally came before me this day of _, 20 . The above named _ to me known to be the person(s) who executed the foregoing instrument and acknowledge the same.
Signature of Notary Public
Notary Public _ County, Wisconsin
My commission (is permanent) ( expires ).
Other Signer- Specify title or relationship: _ Signed this day of _, 20 .
Signature
Signature
Typed Name
Typed Name
STATE OF WISCONSIN County
) ) ) ss. ) )
Personally came before me this day of _, 20 . The above named _ to me known to be the person(s) who executed the foregoing instrument and acknowledge the same.
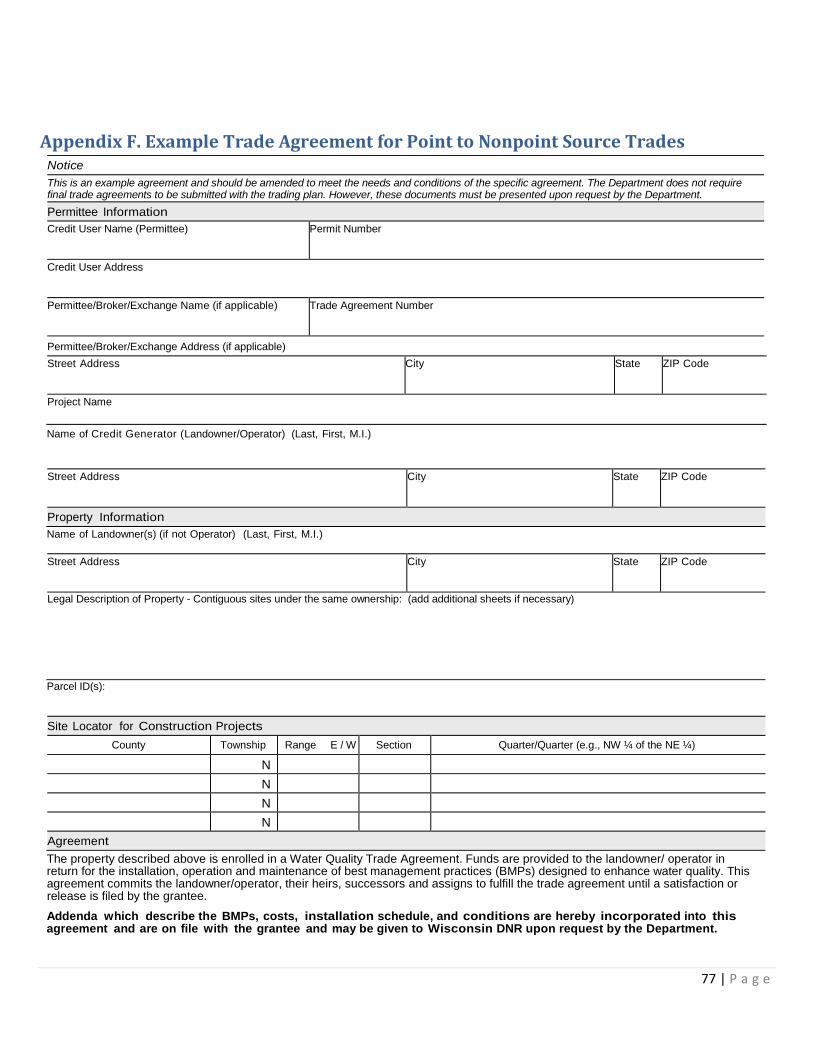
77 | P a g e
Appendix F. Example Trade Agreement for Point to Nonpoint Source Trades Notice This is an example agreement and should be amended to meet the needs and conditions of the specific agreement. The Department does not require final trade agreements to be submitted with the trading plan. However, these documents must be presented upon request by the Department. Permittee Information Credit User Name (Permittee) Permit Number
Credit User Address
Permittee/Broker/Exchange Name (if applicable) Trade Agreement Number
Permittee/Broker/Exchange Address (if applicable) Street Address City State ZIP Code
Project Name
Name of Credit Generator (Landowner/Operator) (Last, First, M.I.)
Street Address City State ZIP Code
Property Information Name of Landowner(s) (if not Operator) (Last, First, M.I.)
Street Address City State ZIP Code
Legal Description of Property - Contiguous sites under the same ownership: (add additional sheets if necessary)
Parcel ID(s):
Site Locator for Construction Projects County Township Range E / W Section Quarter/Quarter (e.g., NW ¼ of the NE ¼)
N N N N Agreement The property described above is enrolled in a Water Quality Trade Agreement. Funds are provided to the landowner/ operator in return for the installation, operation and maintenance of best management practices (BMPs) designed to enhance water quality. This agreement commits the landowner/operator, their heirs, successors and assigns to fulfill the trade agreement until a satisfaction or release is filed by the grantee.
Addenda which describe the BMPs, costs, installation schedule, and conditions are hereby incorporated into this agreement and are on file with the grantee and may be given to Wisconsin DNR upon request by the Department.

78 | P a g e
Landowner/Operator Signed this day of _, 20 .
Signature of Landowner/Operator
Signature of Landowner/Operator
Typed Name of Landowner/Operator
Typed Name of Landowner/Operator
STATE OF WISCONSIN County
) ) ) ss. ) )
Personally came before me this day of _, 20 . The above named _ to me known to be the person(s) who executed the foregoing instrument and acknowledge the same.
Signature of Notary Public Typed Name of Notary Public
Notary Public _ County, Wisconsin
My commission (is permanent) ( expires ). Landowners (if not operator)
If the landowner section is not completed, check (X) one or both of the following that apply Landowner is also operator Trade agreement contains only high residue management, nutrient management, pesticide management, cropland protection cover (green manure) Signed this day of _, 20 .
Signature of Landowner (if not operator)
Signature of Landowner (if not operator)
Typed Name of Landowner (if not operator)
Typed Name of Landowner (if not operator)
STATE OF WISCONSIN County
) ) ) ss. ) )
Personally came before me this day of _, 20 . The above named _ to me known to be the person(s) who executed the foregoing instrument and acknowledge the same.
Signature of Notary Public Typed Name of Notary Public
Notary Public _ County, Wisconsin
My commission (is permanent) ( expires ). Credit user/broker/exchange
Signed this day of _, 20 .
Signature of credit user/broker/exchange Typed Name of credit user/broker/exchange
STATE OF WISCONSIN County
) ) ) ss. ) )
Personally came before me this day of _, 20 . The above named _ to me known to be the person(s) who executed the foregoing instrument and acknowledge the same.
Signature of Notary Public Notary Public _ County, Wisconsin
My commission (is permanent) ( expires ).
79 | P a g e
Other Signer- Specify title or relationship: _
Signed this day of _, 20 .
Signature
Signature
Typed Name
Typed Name
STATE OF WISCONSIN County
) ) ) ss. ) )
Personally came before me this day of _, 20 . The above named _ to me known to be the person(s) who executed the foregoing instrument and acknowledge the same.
Signature of Notary Public Typed Name of Notary Public
Notary Public _ County, Wisconsin
My commission (is permanent) ( expires ). Other Signer- Specify title or relationship: _
Signed this day of _, 20 .
Signature
Signature
Typed Name
Typed Name
STATE OF WISCONSIN County
) ) ) ss. ) )
Personally came before me this day of _, 20 . The above named _ to me known to be the person(s) who executed the foregoing instrument and acknowledge the same.
Signature of Notary Public Typed Name of Notary Public
Notary Public _ County, Wisconsin
My commission (is permanent) ( expires ). Check this box if this page is purposely left blank.
80 | P a g e
Section A – General Requirements Example: A 1. This agreement may be amended by mutual agreement of either party, so long as the agreement has not yet expired. A 2. If a significant archeological or historical site is found, construction is to cease immediately and the BMP will be relocated, redesigned, or deleted to prevent damage to the archeological or historical site. The BMP may be deleted only if approved in writing by the Department of Natural Resources. Section B – Landowner/Operator Shall: Example: B 1. Design, install, operate and maintain BMPs listed in Addendum 2 of this agreement. B 2. Allow access to the installed BMP by the grantee, or an authorized representative of the grantee for site inspection of the BMP for installation, operation and maintenance. Section C – Grantee Shall: Example: C 1. Provide cost sharing to the landowner/operator consistent with Addendum 2. C 2. Make cost-share payments to the landowner/operator after payment is requested and evidence of contractor payment by the landowner/operator has been received, and the grantee verifies proper BMP installation.
TA Number Typed Name of Landowner/Operator Initials of Landowner/Operator Date
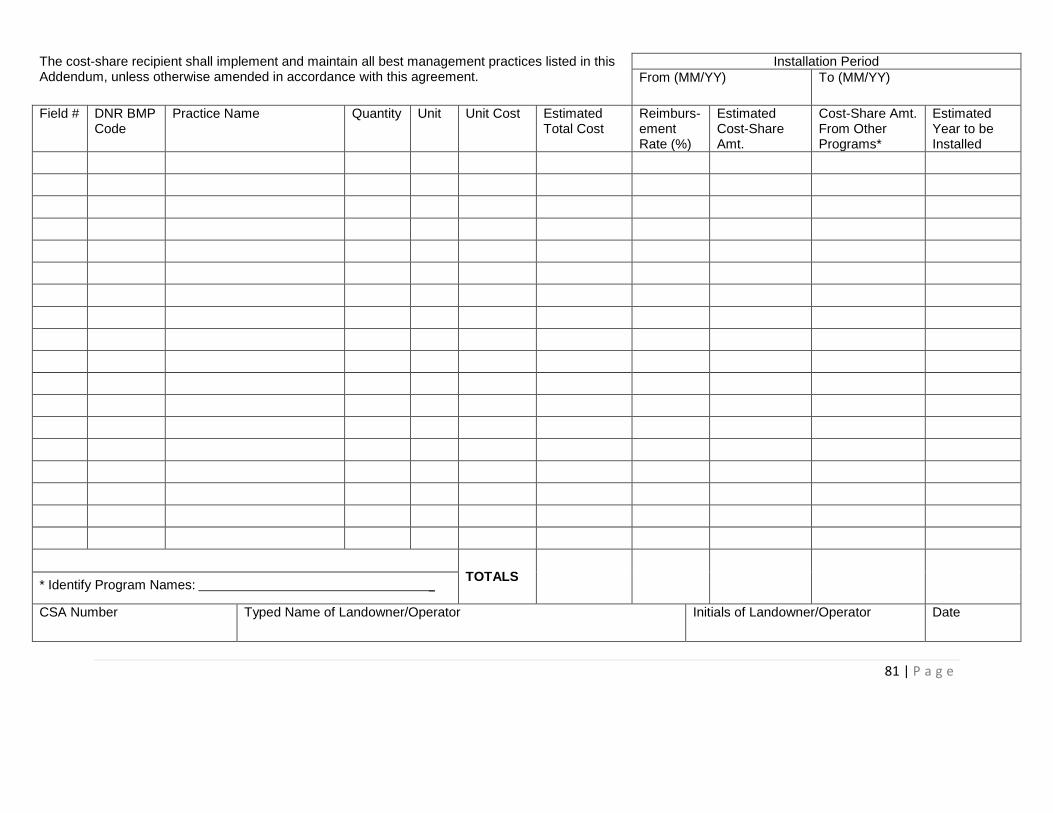
81 | P a g e
The cost-share recipient shall implement and maintain all best management practices listed in this Addendum, unless otherwise amended in accordance with this agreement.
Installation Period From (MM/YY)
To (MM/YY)
Field # DNR BMP Code
Practice Name Quantity Unit Unit Cost Estimated Total Cost
Reimburs-ement Rate (%)
Estimated Cost-Share Amt.
Cost-Share Amt. From Other Programs*
Estimated Year to be Installed
TOTALS
* Identify Program Names: _
CSA Number
Typed Name of Landowner/Operator Initials of Landowner/Operator Date
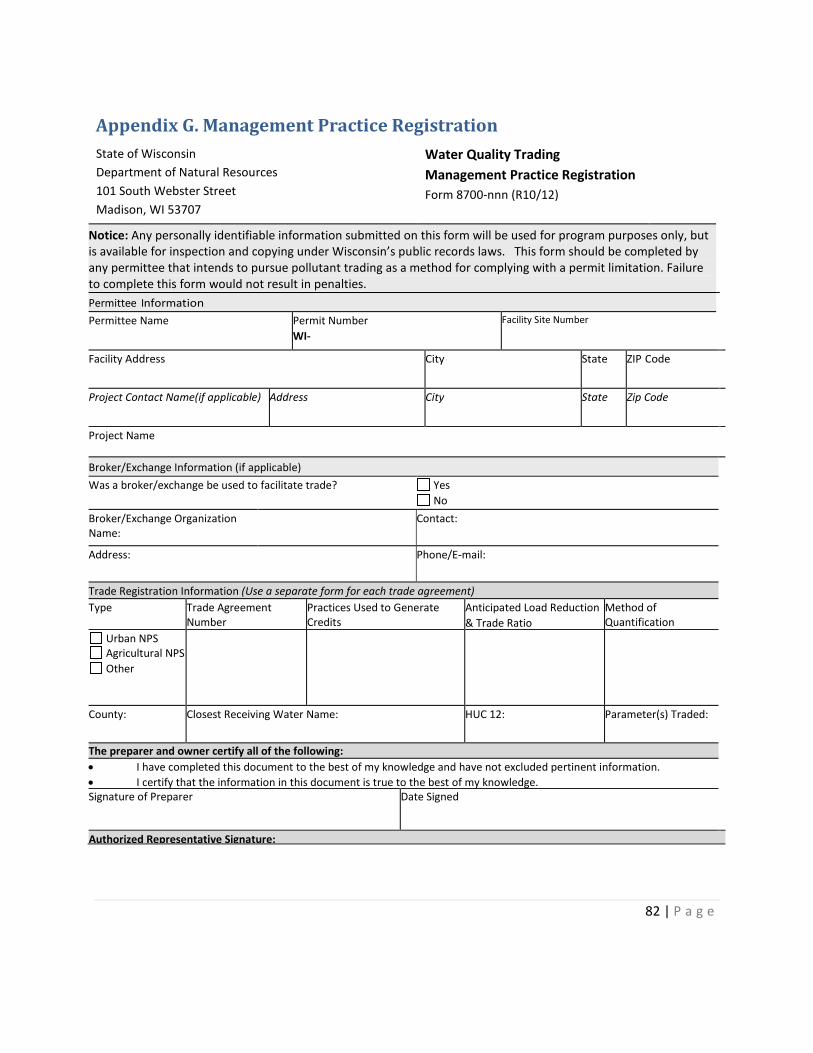
82 | P a g e
Appendix G. Management Practice Registration State of Wisconsin Department of Natural Resources 101 South Webster Street Madison, WI 53707
Water Quality Trading Management Practice Registration Form 8700‐nnn (R10/12)
Notice: Any personally identifiable information submitted on this form will be used for program purposes only, but is available for inspection and copying under Wisconsin’s public records laws. This form should be completed by any permittee that intends to pursue pollutant trading as a method for complying with a permit limitation. Failure to complete this form would not result in penalties.
Permittee Information Permittee Name Permit Number
WI- Facility Site Number
Facility Address City State ZIP Code
Project Contact Name(if applicable) Address City State Zip Code
Project Name
Broker/Exchange Information (if applicable) Was a broker/exchange be used to facilitate trade? Yes
No Broker/Exchange Organization Name:
Contact:
Address: Phone/E‐mail:
Trade Registration Information (Use a separate form for each trade agreement) Type Trade Agreement
Number Practices Used to Generate Credits
Anticipated Load Reduction & Trade Ratio
Method of Quantification
Urban NPS Agricultural NPS Other
County: Closest Receiving Water Name: HUC 12: Parameter(s) Traded:
The preparer and owner certify all of the following:
• I have completed this document to the best of my knowledge and have not excluded pertinent information. • I certify that the information in this document is true to the best of my knowledge. Signature of Preparer Date Signed
Authorized Representative Signature:
83 | P a g e
I certify under penalty of law that this document and all attachments were prepared under my direction or supervision. Based on my inquiry of those persons directly responsible for gathering and entering the information, the information is, to the best of my knowledge and belief, accurate and complete. I am aware that there are significant penalties for submitting false information, including the possibility of fine and imprisonment for knowing violations.
Signature of Authorized Representative Date Signed
For Department Use Only
Date Received: Trade Docket Number:
Entered in Tracking System Yes Date Entered:
Name of Department Reviewer:
NOTE: The Authorized Representative is someone who is authorized to sign all applications, reports or other information submitted to the DNR. This person may be; for a corporation, a responsible corporate officer including a president, secretary, treasurer, vice president or manager; and for a municipality, a ranking elected official; for a corporation or a municipality, another person authorized by one of those officers or officials and who has responsibility for the overall operation of the facility or activity regulated by the permit. This is the person to whom we will send information regarding the application, the draft permit and permit reissuance.
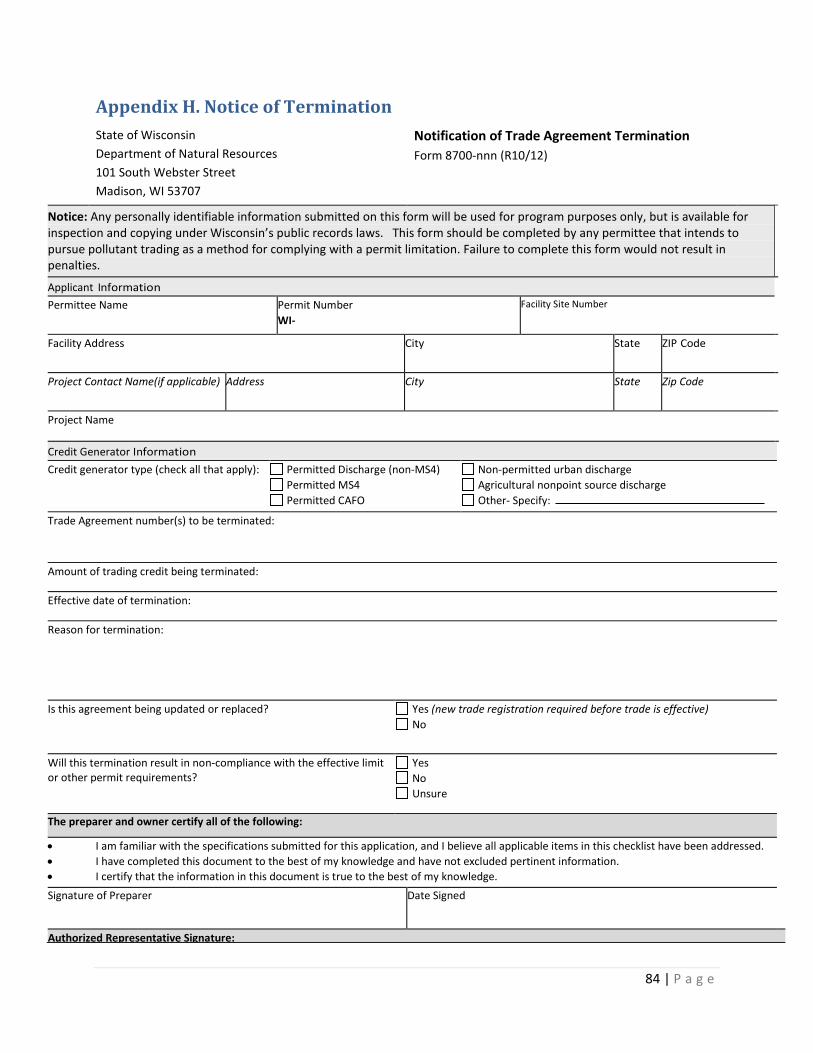
84 | P a g e
Appendix H. Notice of Termination State of Wisconsin Department of Natural Resources 101 South Webster Street Madison, WI 53707
Notification of Trade Agreement Termination Form 8700‐nnn (R10/12)
Notice: Any personally identifiable information submitted on this form will be used for program purposes only, but is available for inspection and copying under Wisconsin’s public records laws. This form should be completed by any permittee that intends to pursue pollutant trading as a method for complying with a permit limitation. Failure to complete this form would not result in penalties.
Applicant Information Permittee Name Permit Number
WI- Facility Site Number
Facility Address City State ZIP Code
Project Contact Name(if applicable) Address City State Zip Code
Project Name
Credit Generator Information Credit generator type (check all that apply):
Permitted Discharge (non‐MS4) Permitted MS4 Permitted CAFO
Non‐permitted urban discharge Agricultural nonpoint source discharge Other‐ Specify:
Trade Agreement number(s) to be terminated:
Amount of trading credit being terminated:
Effective date of termination:
Reason for termination:
Is this agreement being updated or replaced? Yes (new trade registration required before trade is effective) No
Will this termination result in non‐compliance with the effective limit or other permit requirements?
Yes No Unsure
The preparer and owner certify all of the following:
• I am familiar with the specifications submitted for this application, and I believe all applicable items in this checklist have been addressed. • I have completed this document to the best of my knowledge and have not excluded pertinent information. • I certify that the information in this document is true to the best of my knowledge.
Signature of Preparer Date Signed
Authorized Representative Signature:
85 | P a g e
I certify under penalty of law that this document and all attachments were prepared under my direction or supervision. Based on my inquiry of those persons directly responsible for gathering and entering the information, the information is, to the best of my knowledge and belief, accurate and complete. I am aware that there are significant penalties for submitting false information, including the possibility of fine and imprisonment for knowing violations.
Signature of Authorized Representative Date Signed
NOTE: The Authorized Representative is someone who is authorized to sign all applications, reports or other information submitted to the DNR. This person may be; for a corporation, a responsible corporate officer including a president, secretary, treasurer, vice president or manager; and for a municipality, a ranking elected official; for a corporation or a municipality, another person authorized by one of those officers or officials and who has responsibility for the overall operation of the facility or activity regulated by the permit. This is the person to whom we will send information regarding the application, the draft permit and permit reissuance.