Embed Size (px)
Citation preview

Technical Report GL-94-28C : August 1994US Army Corps AD-A285 552of EngineersWaterways ExperimentStation
A Waterborne Seismic Reflection Surveyof Three Tributaries in Boston Harbor,Massachusetts
by Keith J. Sjostrom, Rodney L. Leist
k94-32072
Approved For Public Release; Distribution Is Unlimited ',
Prepared for U.S. Army Engineer Division, New England

Si i I I I I I I I I I 7I I Ili iiI,
The contents of this report are not to be used for advertising,publication, or promotional purposes. Citation of trade namesdoes not constitute an official endorsement or approval of the useof such commercial products.
l ij FDM4 ON ROCYQCZED PAM

DVISCLAI /!_NOTICE"
THIS DOCUMENT IS BEST
QUALITY AVAILABLE. THE COPY
FURNISHED TO DTIC CONTAINED
A SIGNIFICANT NUMBER OF
COLOR PAGES WHICH DO NOT
REPRODUCE LE.IBLY ON BLACK
AND WITE MICROFICHE.

1~
Technical Report GL-94-28August 1994
A Waterborne Seismic Reflection Surveyof Three Tributaries in Boston Harbor,Massachusettsby Keith J. Sjostrom, Rodney L. Leist
U.S. Army Corps of EngineersWaterways Experiment Station3909 Halls Ferry RoadVicksburg, MS 39180-6199
Final Report
Approved for public release; distribution is unlimited
Prepared for U.S. Army Engineer Division, New EnglandWaltham, MA 02254

US Army Corpsof Engineers
Waterways Experiment SNto auolglnPblalnDt
Sjostom, KitheJ
IncludesPWY biblogrphi refernces1.~~~~~~~~~~~~AL Marin seiets-Msacue0A-so Hro ego.2
Seis ehia eot(..Am nierWaterways Experiment SainCboignPbiainDt
Stwation) m sesi reletonsrvyoftre riuare8i oso
T22 3 p o.G:II. ; 28 c.-(ahia eot L9-8

iT ,. II 0
jflbtil. 3 -, fl -,
By
Ct Availability andfRContents JA -and/6r
Preface .. .. ... ... . ..... .... ... ... .. ... ... . ... . .. v
Conversion Factors, Non-SI to SI Units of Measurement ........... vi
1 -Introduction .................................... 1
Background ..................................... 1Purpose and Scope ................................ 1Overview of Site Geology ............................ 2
2-Technical Approach ............................... 3
Seismic Reflection Principles .......................... 3Seismic Reflection Survey Approach ..................... 4Side Scan Sonar Operation ........................... 5Geophysical Survey ................................ 6
M ystic River .................................. 6Inner confluence area ............................. 6Chelsea River ................................. 7Reserved channel ............................... 7Survey methodology ............................. 8
3-Subbottom Sediment Sampling ......................... 94-Data Calibration and Ground Truth Correlation .............. 11
Bottom Sediment (Surface) Calibration .................... 12Subbottom Sediment Calibration ........................ 12Check Calibrations ................................ 13
5-Data Analysis and Results ............................ 14
Data Analysis ................................... 14Limitations and boundary conditions ................... 14Correlation of density estimates to soil classification ......... 15Data presentation ............................... 16
Results of Seismic Reflection Survey ..................... 16M ystic River .................................. !. 6Inner confluence area ............................. 17Chelsea River ................................. 19Reserved channel ............................... 20
Results of the Side Scan Sonar Survey .................... 22M ystic River .................................. 23
iii
• . . .. . .. - . . .. ..... ..

Inner confluence area ................................ 23Chelsea River ...................................... 24Reserved channel ................................... 25
Volumetric Estimates ................................... 26Loosely compacted sediment (muck) ...................... 27Stiff, cohesive clay/sandy material ....................... 27Rock. gravel, and till material .......................... 27Total volume of dredged material ........................ 28
6- Project Summary ..................................... 29
References ............................................ 31
Figures 1-79
Tables 1-3
Plates 1-10'Appendix A: Mystic River Positioning Information ............... Al
Appendix B: Inner Confluence Area Positioning Information ......... BI
Appendix C: Chelsea River Positioning Information ............... Cl
Appendix D: Reserved Channel Positioning Information ............ Dl
SPlRes 1-10 ge iocated in the pock•t of tde bdck cover.
iv

Preface
A waterborne seismic reflection investigation was conducted in three tribu-taries of Boston Harbor, Massachusetts, by personnel of the GeotechnicalLaboratory (GL), U.S. Army Engineer Waterways Experiment Station (WES),during the period 10-14 November 1992. The investigation was performedunder sponsorship of the U.S. Army Engineer Division, New England(CENED). The CENED Project Engineer was Mr. Bob Meader.
The overall test program was conducted under the general supervision ofDrs. William F. Marcuson 1Il, Diiector, GL, and Arley G. Franklin, Chief,Earthquake Engineering and Geosciences Division (EEGD). Mr. Keith J.Sjostrom was the Principal Investigator. This report was prepared byMessrs. Sjostrom and Rodney L. Leist under the supervision of Mr. Joseph R.Curro, Jr., Chief, Engineering Geophysics Branch, GL. Instrumentationsupport was provided by Mr. Tom S. Harmon, Jr., EEGD, GL. Data analy-sis assistance during this study was provided by Mr. Jeff S. Zawila, EEGD,GL, and by Mr. Richard G. McGee and Ms. Janie M. Vaughn, HydraulicStructures Division, Hydraulics Laboratory, WES. Data collection and analy-sis assistance were also provided by Mr. Dave Caulfield of Caulfield Engi-neering. Computer graphics suppoit was provided by Mr. Gary Henningtonof Information Management Systems, Inc.
Acknowledgement is made to the personnel of the Engineering DesignSection and Surveys Section, CENED, for their assistance during this study.The crew of the survey vessel 'Salem' is especially appreciated for its supportin performing the field surveys. Subbottom sediment sampling and analysiswas performed by the Materials Laboratory, CENED.
At the time of publication of this report, Director of WES wasDr. Robert W. Whalin. Commander was COL Bruce K. Howard, EN.
Mt contu of this report are not so be used for advertising, publication,or puonodlc pupme. OM•as•o of tuds names does not conniuuc anojqlal atdonromn or approvW of the use of such commercial products.
V
-v ~ -

Conversion Factors, Non-SI toSI Units of Measurement
Non-SI units of measurement used in this report can be converted to SI(metric) units as follows:
Multiply By To Obtain
cubic yards 0.7645549 cubic motors
feet 0.3048 motors
vi

1 Introduction
Background
At the request of the U.S. Army Engineer Division, New England(CENED), the U.S. Army Engineer Waterways Experiment Station (WES)conducted a waterborne seismic reflection and side scan sonar survey of threetributaries to Boston Harbor, Massachusetts (see Figure 1). These geophysicalstudies were performed in the Mystic and Chelsea Rivers, Reserved Chann'el,and the Inner Confluence Area. The results of this study will be used in thedevelopment of plans and specifications for the proposed channel deepeningand maintenance dredging of the project areas. These test results provide adescription of the bottom and subbottom materials to be dredged in terms ofdensity and soil classification which will assist in planning and monitoring theproposed channel deepening program.
Purpose and Scope
The objective of the seismic reflection study is to quantify, as a function ofdepth, the bottom and subbottom sediments in terms of density and soil typeto elevation -42 ft Mean Low Water (MLW) in Mystic River, Inner Conflu-ence Area, and Reserved Channel and to a minimum depth of -40 ft MLW inthe Chlsea River. The results will supplement previously obtained soil bor-ings by providing continuous profile line coverage of the entire length of eachproject area. This information will facilitate positioning of any additional soilborings that may be required, particularly in areas of suspected rock outcrop-pings. Specifically, the results from the procsed seismic data will provide:(1) material density and soil classification information of sediments, (2) betterdescriptions of changes in actual subbottom conditions, (3) delineation of thegeologic interface of the glacial till and/or rock, and (4) volumetric estimateson the quantities of material to be removed through dredging. Two highresolution subbottom profiling systems and a specially designed data acquisi-tion and analysis software package were used to meet the primary objectivesof the investigation. A dual frequency side scan sonar system was used toprovide increased bottom coverage and detect any possible dredging or navi-gation hazards.
Chapter 1 Intr xuction

Overview of Site Geology
Preliminary geolrogic information provided by CENED prior to the geo-physical survey indicated possible areas of rock outcrops in Mystic River, theInner Confleueno Area, and Reserved Channel. The bedrock has an irregulartopography wat is highly influenced by the preferential weathering and erosionof the rock material. Overlying the bedrock is a layer of glacial till comprisedprimarily of densely compacted sands, gravel, cobbles, and boulders. At afew locations in the project area, bottom samples have indicated glacial tillpresent on the bottom surface. These interpreted areas will be noted later inthe report. The next layer, a gray silty clay, typically called the Boston BlueClay, ranges in thickness from zero to over 60 ft. The texture ranges frommoist and very soft to stiff with water content values typically between 35 and45 percent (Bowen et al. 1992). Throughout each rroject area and as noted incore samples taken in Boston Harbor, a thin veneer of saturated, black,organic sandy silty clay covers the channel bottom and ranges in thicknessfrom a few inches to 5 ft. Water content values for this material typicallyrange from 90 to 110 percent (Bowen et al. 1992).
2 Chapter 1 Introduction

2 Technical Approach
Seismic Reflection Principles
Acoustic subbottom reflection data are produced when a source of acousticenergy is deployed just below the water surface. When acoustic energy isgenerated trom the deployed source and arrives at a boundary between twolayers of differing material properties, part of the energy will be reflectedback towards the surface and part transmitted downward. Portions of thetransmitted energy will undergo absorption or attenuation in the material whilethe remainder propagates through to the next stratigraphic boundary. Ratiosbetween transmitted and reflected energy, called reflection coefficients, aredependent on the density and velocity of the materials thrnugh which theenergy is propagating. The acoustic reflection coefficient kR) is defined as:
where ER is the reflected energy and E, the total energy incident to the strati-graphic boundary.
The reflection coefficient may also be expressed in terms of impedanceusing the following equation.
R - (Z, - Z.)(Z, Z.,
where the acoustic impedance of a sediment (Z,) is defined as the product ofthe material density (p,) and transmission velocity (C,) and represents theinfluence of the material's characteristics on rtZ•cted and transmitted waveenergy. Specifically
2ý = p.. C,., = water impedanceZ, = p, C, = sediment impedance
and
Chapter 2 Technical Approach
S . . .. . • , - m m an I-i-..--l-i- I i I

1.0 gicm3C,,= 1.5 x I0 cm/sec
Substituting, the impedance of the subbottom sediments may be determinedfrom measured ratios of the transmitted and reflected wave energy using thefollowing relationship.
F (xZ, - Z,)(z1Z,,)
The relationship between acoustic impedance and specific soil propertieshas been empirically based on an extensive data base of world averages ofimpedance versus sediment characteristics (Hamilton 1970, 1972; Hamiltonand Bachman 1982). These relationships, however, are based primarily onsurficial marine sediments. In order to extend the depth of investigation intomulti-iayer subbottom environments, Caulfield and Yim (1983) devised ageoacoustic model correlating Hamilton's work. The model is used to correctfor absorption and transmission losses in the subbottom sediments as a func-tion of frequency such that the reflection coefficients and impedance valuesmay be calculated as if they were surficial sediments. The concept isextended to each subsequent layer until the signal-to-noise ratio is at a levelwhere information cannot be extracted with accuracy. The model is thencombined with classical multi-layer reflection analysis algorithms to yieldacoustic impedance values equivalent to surficial sediments for subbottomlayers. The calculated values are compared to the database developed byHamilton to categorically classify each detected sediment regime.
Seismic Reflection Survey Approach
The energy sources used to acquire the acoustic subbottom reflectionrecords are a 3.5 kiloHertz (kHz) high resolution 'pinger' system and anintegrated, high definition, low frequency bubble pulse system. In general,higher operating frequencies permit greater resolution of the marine sedimentsbut shallower depths of energy penetration depending on the characteristics ofthe subbottom material. The sources of acoustic energy are deployed justbelow the water surface and generate acoustic waves that propagate downwardthrough the water column and sediments. As the transmitted energy propa-gates through sediment of varying densities and acoustic velocities, energy isreflected at geologic boundaries where there is a distinct contrast in the acous-tic impedance between the layers. Reflected signals are detected, amplified,filtered, and recorded with a shallow seismic, digital data acquisition system.Acoustic data are acquired in near real-time to permit continual data qualitycontrol. Signals from both the bubble pulse and 'pinger' systems are alsoprinted in the traditional 'shades-of-gray' analog format.
SChapter 2 Tech¢ical Approach
I.

Because of the nonuniqueness of seismic reflection signatures, severalcombinations of geologic conditions could conceivably yield similar signalcharacteristics and computed impedance values. But in specific geologicregions such as Boston Harbor, differing sediment units have a characteristicrange of impedance values. Therefore, using calibration procedures incorpo-rating local core data, the reflection data are corrected for transmission andabsorption losses and processed to yield acoustic impedance values at reflec-tion horizons. Estimates of material density are derived from the computedimpedance through geoacoustic modeling procedures developed by Caulfield(1983) and Hamilton (1980). The computed density results are correlatedwith ground truth information for verification. This specific technique is alsodescribed by McGee and Ballard (1992) and Ballard, McGee, and Whalin(1992). Through additional processing, the results are adjusted to the MeanLow Water (MLW) datum by removing tidal fluctuations and correlated withsurvey vessel positioning data.
The virtually continuous linear data coverage of the subbottom material arepresented in amplitude cross-sections which illustrate the different reflectionhorizons in the subbottom. Incorporating the corrected depths, positioninginformation, and the computed sediment densities or material types, two-dimensional (2-D) profiles of the sediment distribution versus location areproduced to assist the project engineer in assessing the subbottom character-istics throughout the project area. These plots also assist in placement ofadditional sample locations to directly investigate the sediment characteristicsat the site.
Side Scan Sonar Operation
Side scan sonar is an acoustic imaging device used to provide wide-area,large-scale images of the bottom of a body of water. The system consists ofan onboard recording system and control modules, an underwater sensor(typically referred to as a towfish), and a tow cable linking the two units.During survey operations, the side scan recorder continually charges capaci-tors in the towfish at set quantities determined as a function of the imagingrange. The range may be adjusted between 25 and 600 meters. At discretetime intervals, the recorder transmits this stored power to the transducers inthe towfish which in turn emit an acoustic pulse having a frequency of either100 or 500 kHz. The acoustic signals propagate through the water over theset imaging range and reflect off differing interfaces along the bottom surface.The returning signals are received at the transducers, amplified using a timevaried gain function, and recorded. The recorder performs further filtering,amplification, and digitizing functions before calculating the proper position ofthe signals on the final record. The recorder prints out and stores the resul-tant signature one scan at a time. The records produced provide a continuousimage of the bottom surface along the survey line and, as a function of signalamplitude, denote bottom features and variations in site characteristics. Fur-ther information concerning the side scan sonar theory of operation may befound in the text 'Sound Underwater Images' (Fish and Carr 1990).
Chapter 2 Technical Approach

The printed amplitude signatures received from various bottom features canbe qualitatively interpreted for the feature geometry, identification, and possi-ble composition. The reflectivity potential of an underwater surface is afunction of the side scan sonar's beam angle of incidence as it encounters thattarget. When the acoustic pulse is normal to a surface, more energy returnsto the towflsh than when a beam strikes at a differing angle. This angle ofincidence along with the surface roughness are the primary reasons for darkand light areas on the sonar record. The various intensities of these shadesassist in better record interpretation. Sandy or gravelly material typicallyproduces a darker gray pattern on the side scan record whereby lighter shadesmay be indicative of more silty or clayey material. However, the beam angle,towfish path, survey vessel speed, signal gain, and other physical parametersmay all affect the appearance and resolution of the side scan sonar record.
Geophysical Survey
A map showing the location of the geophysical survey lines along theMystic River, Inner Confluence Area, Chelsea River, and Reserved Channelare presented in Figures 2 through 8, respectively. A total of 59 seismicreflection/side scan sonar surveys were performed in Boston Harbor. In termsof survey lines per project area, a total of 9, 16, 15, and 19 survey lines wereconducted in Mystic River, the Inner Confluence Area, Chelsea River, andReserved Channel, respectively. The survey layout of each area is describedbelow.
Mystic River
Although improvement dredging is likely in select portions of MysticRiver, the entire length of the project area between the Mystic River (robin)Bridge and Alford Street (Malden) Bridge was surveyed. Each of the seismicreflection surveys are conducted parallel with the channel centerline anddenoted using the labels MPOI through MP09 as illustrated in Figure 2. Twoprofile lines, MPOI and MP02, are approximately 6,000 ft in length and sur-veys MP03, MP04, and MP07 through MP09 are approximately 4,500 ft inlength. The survey lines are spaced 200 ft apart with the exception of theoutermost surveys which had line spacings of 150 ft. Additionally, in an areawhere a rock outcrop is expected off the Exxon Pier, two additional profilelines, MPO5 and MP06 of length of 2,500 ft, were conducted. The side scansonar system was used along each survey line.
Inner confluence area
Maintenance dredging will likely be performed in the existing channel andalong the northeast corner of the Inner Confluence Area. The Inner Conflu-ence Area is located at the junction of the Mystic and Chelsea Rivers and themain ship channel. Because of suspected rock outcrops, eight profile lines
Chapter 2 Technioul Approach

were performed parallel with the centerline extending from the Inner Conflu-ence Area into the Chelsea River (see Figure 3). The seismic reflection sur-veys are denoted using the labels IP06 through IP13. Five of the surveys areapproximately 2,200 ft in length with the remaining three 1,500 ft in length.Each survey line was spaced 100 ft apart. Survey lines IPO through IP05,each 2,000 ft in length and spaced 150 ft apart, were performed parallel withthe centerline of the Mystic River approach (see Figure 4). Three additionalsurvey lines, each approximately 1,500 ft in length, were performed along thenorthern and eastern edges of the Inner Confluence Area (Figure 4). The sidescan sonar system was used along each survey line.
Chelsea River
Chelsea River is a narrow body of water extending northeastward from theInner Confluence Area. Because of the narrowness of the channel betweenthe McArdle and Chelsea Street Bridges, geophysical surveying was per-formed only along the edges of the existing channel. A total of four surveylines denoted as CP14N, CPl4S, CP15N, and CP15S were conducted in thisreach (see Figure 5). In the upstream reaches of Chelsea River, a total ofthirteen profiles lines were surveyed (Figures 5 and 6). The survey lines arelabelled CPOI through CPI3. Directly upstream of the Chelsea Street Bridge,five profile lines, CP09 through CP13 were surveyed and spaced a distance of150 ft apart. With the exception of survey CP13, each line is approximately3,000 ft in length and positioned parallel with the southeastern channel out-line. In the farthest upstream reach of Chelsea River, four survey lines(CP01, CP02, CP07, and CP08) each approximately 2,500 ft in length, wereperformed parallel to the Gulf Oil Dock (Figure 6). These lines were spaced200 ft apart. Four additional surveys (CP03 through CP06) were performedin the adjacent turning basin with each line ranging in length from 1,000 to1,500 ft in length and spaced 200 ft apart. The last profile, survey CP06, issituated in front of the Global-Gibbs and Northeast Oil docks. The side scansonar system was used along each survey line.
Reserved channel
Improvement dredging is likely within the existing channel as well as twoadditional areas near the mouth of the tributary. Although current proposedplans call for maintenance dredging in the channel for a distance of only4,000 ft, geophysical survey lines extended along the entire 4,500 ft length ofReserved Channel. Two lines each were positioned 100 and 250 ft either sideof the centerline (see Figure 7). Due to positioning limitations, these fourlines were divided into two parts each for a total of eight survey lines. Thesesurveys are denoted RP15 through RP22. Four additional survey lines (RPIO,RP1I, RPI2, and RPI4) with spacing of 150 ft and length 1,600 ft were per-formed at the channel mouth parallel to the channel centerline beginning400 ft to the north (Figure 7). Finally, seven profile lines parallel to thecenterline of the 35 ft main ship channel were surveyed starting 200 ft down-stream of Buoy #10 and extending 3,000 ft upchannel (see Figure 8). The
j . chapter 2 Tuechaoal Approah 7

spacing between these profiles is 150 ft. The survey lines are denoted asRPOI through RP09 with RP03 and RP06 not shown because of positioningproblems during data acquisition. The side scan sonar system was used alongeach survey line.
Survey methodology
For the seismic reflection portion of the survey, the high-resolution'pinger' system was mounted on the hull of the survey vessel and used as theprimary investigative tool. The 'pinger' provides good resolution of themulti-layer geology in each project area to the required depth of investigation."The source/receiver separation was 20 ft and each set of transducers weresituated approximately three feet below the water surface. The 'pinger' wasoperated at a tuned frequency of 3.5 Khz and a total trace length of 700 sam-ples were selected during data collection. A digital acquisition sampling rateof 52 microseconds (ms) was used for seismic data collection whereby provid-ing subsurface exploration to depths of approximately 90 ft below the watersurface. The high definition bubble pulse system was towed behind the sur-vey vessel during the investigation. The acoustic source was located 15 ftbehind the vessel on the starboard side whereas the hydrophone array(receiver) was positioned approximately 40 ft behind the vessel on the portside. The bubble pulse was operated at a central frequency of 0.8 Khz. Thedigital acquisition sampling rate was 96 ms with a total trace length of700 samples. The maximum depth of exploration using these parameters wasapproximately 150 ft.
The side scan sonar source/receiver was deployed off the front of thesurvey vessel and positioned at depths ranging from 5 to 10 ft below the watersurface depending on the depth of water in the project area to be investigated.The unit was operated at a frequency of 100 kHz and an image range settingof 100 or 150 m depending on the width of the project area and degree ofbottom resolution required. The high frequency acoustic signals were digitallyrecorded on magnetic tape and printed for near real-time visual display.
Navigational and positioning support was provided by CENED personnel.Positioning information for each survey line, collected using a Falcon IVMini-Ranger system, was recorded during seismic data acquisition and corre-lated to the geophysical records with respect to time. The side scan sonardata are correlated to positioning fix points noted during the survey. CENEDalso provided precision bathymetric data referenced to Mean Low Water.Bottom depths for the subbottom profiles are adjusted to the CENED depthmeasurements since the data provides nearly a 10:1 improvement in resolutionover any of the subbottom equipment.
S8 Chapter 2 Technical Approach
(.
L- * ........ . . • • • m m n mmmmum m i

3 Subbottom SedimentSampling
During earlier phases of proposed maintenance dredging work, CENEDhas conducted exploratory boring programs in each of the project areas. Anadditional six cores were collected following the geophysical survey to moreaccurately calibrate the geoacoustic model and develop the necessary acousticparameters to derive estimates of bottom and subbottom material density. TheWES core locations in Mystic River and Chelsea River, illustrated in Fig-ures 2 and 6, respectively, were positioned in areas of the project havingdiffering seismic signatures as indicated on the seismic reflection field records.The WES cores are denoted as 'BOR#' where '#' indicates the core number.It should be noted that because of ship traffic, cores were unable to beobtained in the Inner Confluence Area or Reserved Channel.
Shallow penetration coring was performed by the CENED Materials Labo-ratory using a free-fall gravity corer. Sediment sample analysis was alsoperformed by CENED and a short summary of the results are shown inTable 1. Laboratory analysis is designed to determine the parameters thatmost directly affect the propagation of an acoustic wave in submarine environ-ments; i.e., density, porosity, mean grain size, and soil gradation. Sedimentpenetration was limited because of hard or cohesive materials encountered ateach location. The length of the core samples (see Table 1) ranged from 1.6to 2.0 ft. The results for cores BORI through BOR6 indicate that the materialfound at the bottom surface consisted of dark grey silt or clay with an oily ororganic odor. At the bottom depth ranges, the material consisted primarily oflight grey clay. Exceptions were noted at core BORI in Chelsea River wherethe material was mostly medium grey sand and at core BOR5 in Mystic Riverwhere the deeper sediment consisted mainly of gravel.
Fifteen cores completed during June 1993 and analyzed by CENED werealso used during this investigation. The cores were positioned according topreliminary results derived from the seismic reflection investigation. Thesecores are denoted by the label 'FD-93-#' where '#' represents the alphabeticdesignation of each drill hole. The core locations with respect to the geo-physical survey lines are shown in Figures 2 through 8. The holes werecompleted to an elevation range of -45 to -54 ft MLW with the lengths rang-ing between 6 and 17 ft. The average length is approximately 14 ft. Labora-tory analysis information provided to WES for cores FD-93-A through
Chipter 3 Subbontom Sediment SamplingI,
AL|~

FD-93-N and FD-93-D2 were limited to representative soil classification at2.0 ft intervals and Standard Penetration Test blow count values. Full docu-mentation of both the WES and CENED cores is available from CENED.
10 Chaptef 3 Subbottom Sediment Sampling

i i I i i a I I-.- -- -- -
4 Data Calibration and GroundTruth Correlation
Using calibration procedures for data with high signal to noise ratios,seismic reflection data can be processed to provide estimates of the densityand soil type of bottom and subbottom sediments. Calibrations are performedby correlating acoustic impedance values calculated from the seismic reflectiondata at a sample location with the measured information (density, mean grainsize, etc.) at that location. Experience to date has shown that calibrationsmade at a few locations within a geologic region provides the necessary shal-low seismic parameters to accurately calibrate and describe the entire region(McGee 1991). Calibration of the acoustic reflection data for Boston Harborare briefly described in this chapter.
Calibration locations may be thought of as acoustic cores taken at variouslocations within the project area. The calibration plots shown in Figures 9through 44 illustrate the acoustically derived impedance and density valuesversus depth at a core location in which directly measured density valuesexist. At those location where no core information exists, the acoustic ampli-tude record illustrates representative seismic signatures of the bottom andsubbottom geology or depicts changes in the bottom and subbottom geologicconditions. Using the calibration parameters for the project area, the acousti-cally derived impedance and density values are computed and displayed toassist in the geologic interpretation of the site.
Referring to Figure 9, a portion of the seismic reflection record taken atWES core location BOR2 is presented in the leftmost block entitled 'AcousticReflection Record'. The darker colors represent higher amplitude signalsreflected and recorded from the varying geologic interfaces. The bottomsurface is detected at an elevation -40 ft MLW and a second distinct interface,where a change in impedance exists, is measured at elevation -48 ft MLW.The depth to the top of the detected interface increases sharply at the left halfof the record. Using surface and subbottom sediment calibration parameters,impedance values are computed for that portion of the seismic record anddisplayed in the block labelled 'Acoustic Impedance Record'. The impedancevalues are color-coded such that the darker colors are related to higher imped-ance values. Using the impedance versus sediment database developed byHamilton (1970, 1972), the higher impedance values are related to morecompetent sediments having higher density values such as a sand or stiff clay.
Chapter 4 Data Caibratlon and Ground Truth Correlation 11
L _

In the block entitled 'Density', the solid line depicts the acoustically deriveddensity values versus depth as related to the impedance versuw density data-base. The black dots represent measured density values at specific depths forthe core indicated in the title block. Visual sediment classification from thedriller's log is outlined in the block titled 'Lithology'.
Bottom Sediment (Surface) Calibration
The first calibration procedure performed with the reflection data deter-mines the total energy incident at the bottom surface. This process involvesdetermining the most representative reflection coefficiept for the first reflector(bottom surface) and the associated acoustic bottom loss for the given sedi-ment. The surface calibration begins by determining the total energyproduced by the acoustic energy source from the direct wave and the trans-mission losses associated with underwater acoustic wave propagation. Theseparameters are evaluated using the sonar equation. For an in depth discussionof the sonar equation, refer to Urick (1983). The computed source energyand transmission losses are in turn used to calculate the surface reflectioncoefficients. The reflection coefficients and bottom loss are then correlatedwith the measured sediment properties (density, mean grain size, water con-tent, etc.) to calibrate the bottom surface materials.
Surface calibrations were conducted at WES core BOR2 in Chelsea Riverand cores BOR3, BOR4, BOR5, and BOR6 in Mystic River. Sediment analy-sis of each core is presented in Table 1. Surface sediment density values (ing/cm') of 1.58, 1.84, 1.74, 1.38, and 1.82 were measured using cores BOR2,BOR3, BOR4, BOR5, and BOR6, respectively. The acoustically derived den-sity estimates, computed using the determined calibration parameters versusthe meas'tred characteristics of each core, are illustrated in Figures 9 through13, respectively. Good correlation exists, with the possible exception of coreBOR6, between the acoustically derived and measured density values for eachof the shallow cores.
Subbottom Sediment Calibration
The second part of the calibration process adjusts the impedance functionfor effects of acoustic absorption in unique soil types as the acoustic wave ispropagated down and reflected back through the subbottom sediments. Esti-mates of acoustic absorption, or the attenuation coefficient, are computed fromreflection data only in areas where a multi-layered lithology exists. It shouldbe noted that when only a surface reflection exists, the surface calibration isall that is necessary. The attenuation coefficients are initially correlated toempirical geoacoustic relationships developed to describe the characteristics ofbottom and subbottom sediments (Hamilton 1980; Caulfield 1983). The den-sity results are also compared to measured core information and any
12 Chapter 4 Date Calibration and Ground Truth Correlation

adjustments necessary are made in the acoustic analysis parameters in order toobtain the best correlation.
None of the WES cores extended deep enough into the subsurface to pro-vide the distinct changes in lithology, such as the interface between the near-surface silty material and stiff clay, necessary to accurately calibrate theimpedance function. Therefore, the subbottom calibration was accomplishedat the following CENED core locations: (1) cores FD-93-K, FD-93-L, andFD-93-M in Mystic River, (2) cores FD-93-G and FD-93-H in the InnerConfluence Area, (3) core FD-93-N in Chelsea River, and (4) cores FD-93-C,FD-93-D2, and FD-93-E in Reserved Channel. WES core BOR5 is locatednear core FD-93-K in Mystic River. Figures 12 and 14 through 21 presentthe acoustically derived density estimates, using the developed calibrationparameters, versus the laboratory determined sediment characteristics for theabove CENED cores. Sediment analysis, using the Unified ClassificationSystem for soils, at each of the core locations are presented alongside thecomputed density values. It should be noted that none of the CENED coresprovided to WES had any measured density values. Each density versusdepth prediction illustrates increasing densities near the compacted clay orrock and gravel interfaces as one might expect.
Check Calibrations
To verify the assumption of regional calibrations, numerous check siteswere evaluated in Boston Harbor. Acoustically derived estimates were com-pared with the remaining CENED cores and computed for select locationswithin each project area having multiple subbottom interfaces or characteristicseismic signatures using the final acoustic parameters established from thesurface and subbottom calibrations. Check calibrations and/or verificationlocations, in addition to those thusfar presented in Figures 9 through 21, areillustrated in Figures 22 through 44 for locations in Mystic River, Inner Con-fluence Area, Chelsea River, and Reserved Channel. The title block of eachfigure points out the location of the check point. Where measured sedimentdensity values or soil classification are available, the acoustically derivedestimates demonstrate good correlation. Typically, the calculated densitiesdeviate about the measured values by approximately + 0.2 g/cm3 or10 percent.
Chapter 4 Doaw Cdibration and Ground Truth Correlation 13
L .

5 Data Analysis and Results
Data Analysis
Continuous subbottom profiles of the acoustic reflection amplitudesobtained using the high resolution 'pinger' system for surveys performed inthe Mystic River, Inner Confluence Area, Chelsea River, and Reserved Chan-nel were delivered to the CENED Project Engineer in October 1993. Therecords are annotated with WES survey line and file number designations andCENED and WES core locations. Positioning and bottom depth informationfor each survey line and file number are presented in Appendices A, B, C,and D for the Mystic River, Inner Confluence Area, Chelsea River, andReserved Channel, respectively. Correlating the information interpreted fromthe seismic amplitude records with existing core information, a generaldescription of the subbottom sediments and material density distributions areprovided for each area of the survey.
Umitations and boundary conditions
The seismic signatures reflected from various geologic interfaces arerecorded and displayed to create seismic amplitude records. The seismicamplitude intensity, with the more competent reflectors correlating with thestrongest signals, give indications of the depths to stratigraphic interfaces inthe subsurface. However, it should be noted that interfaces between materialswith similar densities and acoustic velocities, such as rock versus compactedsands, may not be detected because the difference between acoustic impedancevalues are not large enough. Two points must also be made concerning thecapabilities of the geophysical instruments. First, the high-resolution 'pinger"system used sometimes has difficulty detecting surface sediments withdensities less than 1.1 g/cm3. Material below this density value is typicallytermed 'fluff` material. A 200 kllz fathometer commonly used in hydro-graphic surveying would be more readily able to detect this material butwould provide little to no subbottom information. The 'bubble pulse' systemhas a much longer pulse length than the 'pinger' and, therefore, is also unableto readily detect fluff material; unless the thickness of the fluff zone is over8 ft. Secondly, the resolution of geologic layers provided by the 'pinger'system is only on the order of two or three feet depending on the pulse length
14 Chptwr 5 Date Anulyis wnd Remvdt,
I II

and sampling rate used during data acquisition. Sediment layer resolutionobtained using the 'bubble pulse' is on the order of 7 to 8 ft.
Before discussing the density results from the four project areas of theBoston Harbor investigation, a few comments are needed regarding interpre-tation of acoustically derived estimates. These topics are addressed asfollows.
Accuracy. The sediment predictions are an indirect determination basedupon wave propagation principles and acoustic impedance versus density andsoil type relationships and should not be considered an absolute measurementof density. Ground truth verification of the density estimates were limited tothe upper two feet of sediment because of the shallow drop cores obtainedfollowing the survey. Directly measured density information were unavailablefrom the deeper CENED cores. However, computed density estimates shouldsafely fall within 15 percent of insitu density values using the seismic analysisparameters. The variance in density values is primarily attributed to the shal-lowness of the directly measured density values and the lack of any deeperdensity information. At greater depths in the subbottom, the impedance func-don and absorption model used to estimate impedance and density predictionsshould compute values somewhat lower than insitu.
Impedance function. The impedance function used for this technique isbased on empirical data collected from primarily deeper offshore environmentsin naturally occurring marine sediments (Caulfield 1983). Therefore, thisalgorithm may produce anomalous density values and estimates in the dynamicnear-shore, harbor, and riverine environments. Compacted, cohesive clayeysediments or highly active organics could compute as something they are not;hence, one of the primary reasons for the regional calibration approach.
Correlation between acoustic profiles and core logs. The acousticallyderived sediment profiles are cross-referenced to the core locations in eachproject area. Many of these cores are not located precisely on a survey line.Therefore, surface conditions may vary somewhat due to maintenance dredg-ing, construction activities, or isolated surface anomalies which may produceapparent discrepancies between the reflection data and cores.
Correlation of density estimates to soil classification
The bottom and subbottom sediment analysis within the project areaemphasizes density distribution with respect to lateral extent and depth. Sedi-ment density ranges used for data presentation and discussion were providedby CENED personnel to more practically delineate the sediment distributionand better assess the difficulty of removing this material through dredgingoperations. The computed density values are related to a basic soil descrip-tion, based on the database for natural, undisturbed marine sediments, asshown in Table 2. These relationships are valid for the sampled locations inthe study area except for areas where anomalous sediment conditions are detected.
15Chbts B D5to Anays nd Romits
V... . .

Data presentation
In general, the density ranges established delineate the predominantly clay,silt, and sand regions within the area surveyed. The distributions of computedsediment densities within each project area are presented in Plates I through10 as 2-D profiles illustrating the primary subbottom interfaces and differingzones of sediment material along each survey line. The profiles are cross-sections of the project area along the survey lines and illustrate the depth to aparticular interface (in feet MLW) and representative sediment density. Thelocation of CENED and WES cores are also identified. The labelled blackdots at the top of each profile denote the survey track line and direction.Each dot represents the beginning of every third seismic data file recorded inorder to give an indication of the data coverage along each survey line andassist in correlating the raw data and interpreted results. The associated labelrepresents the data file number. Appendices A through D note the locationand bottom elevation in feet MLW for the appropriate data file number alongeach survey line in Mystic River, Inner Confluence Area, Chelsea River, andReserved Channel, respectively. Each plate also illustrates a detailed site mapof the area noting the direction and physical location of the survey lines. Thesurvey line label arrow represents the direction with which each survey wasperformed. The large arrow labelled 'Cross-section Viewpoint' indicates theorientation of the survey line cross-sections on each diagram.
Results of the Seismic Reflection Survey
Mystic River
The Mystic River project area is located between the Mystic River (Tobin)Bridge and Alford Street (Malden) Bridge (see Figure 2). Nine seismic reflec-tion surveys, lines MPOI through MP09, were performed in the channel andthe 2-D cross-sections illustrating the interpreted sediment regimes and densitydistributions are shown in Plates I and 2. The interpretations for surveysMP02 through MP06 are presented on Plate 1 and surveys MPO1 and MP07through MP09 are shown on Plate 2. CENED and WES core locations andmeasured density information where available are also displayed. Sedimentproperties and the seismic data acquisition parameters allowed high qualitydata to be recorded for interpretation and density determination purposes to anelevation range of -50 to -75 ft MLW.
The near-surface sediments are primarily comprised of materials ranging indensity from 1.4 to 1.7 g/cm'; indicative of silty clay to sandy silts. Nearsurface information from WES cores collected along survey lines MPOI andMP02 correlate well with these results (see Figures 10 through 13). In thewestern part of Mystic River and along the project perimeter, higher densitymaterial is detected at the bottom surface and is found to have computeddensities greater than 2.2 g/cm'. This sediment type is indicative of com-pacted sands, stiff clays, or hardpan material which is supported by
16 Chapter 5 Data Analysis and Results
-- -. p m,,m m m m m m mnnm mn u l nnmn nnm M •nmn miII

interpretation of the seismic records. This material is not rock or gravel. Aportion of the seismic amplitude record along survey line MP05, files 000through 030, is presented in Figure 45 and illustrates the transition zone from
the mucn higher density material at the lefthand side of the figure to the lessdense sediments at the right. Limited acoustic penetration in areas of thisdense bottom material prevented subbottom analysis at deeper depths. Itshould also. noted that during subbottom sampling following the seismicsurvey, the upper sediment layer had a strong 'oily' odor indicative of thepresence of a petroleum based residue on the bottom. It is technologicallyunclear at this time on what the effects of petroleum or other chemical resi-dues have on the bottom and subbottom sediment characteristics or on thereflection coefficients determined at the bottom surface. This 'oily' smellingbottom sediment was also sampled in the upper turning basin of ChelseaRiver.
In areas of deeper acoustic penetration, material densities ranged from1.6 to 2.2 g/cm3 and, relating available core information, these sediments areindicative of stiff, cohesive clay, namely the Boston Blue Clay, till material,or rock and gravel. In areas located near CENED cores, the density results incomparison with the physical subbottom samples correlate well. Representa-tive seismic signatures in areas of deeper penetration are presented in Fig-ures 45 through 47. In Figure 46, layering in the subbottom is particularlydistinct; especially within the clay material. The deepest interface, detected inthe lower right-hand corner of the figure, is that of a rock and gravel zone.Along survey lir1, MPO8 (Figure 47), near-surface anomalous zones havinghigh sediment density values and reflectian coefficients limit acoustic penetra-tion into the subbottom but deeper clay layers are still visible along the seis-mic line.
Analysis of the seismic data collected in Mystic River indicate two areas ofrock, gravel, or till outcrops on the channel bottom. These interpreted areasare located on the site map in Figure 48. The first outcrop area is locatednear the Exxon Dock. Seismic amplitude data collected along surveyline MP02, files 050 through 080, are presented in Figure 49 and best charac-terize this outcrop. Depth to rock in this zone ranges from 2 to 5 ft. Thiswas verified by WES Core BOR5, taken during the field survey, in whichapproximately two feet of clay with sand were collected over rock and gravel.The second area is located near the Mystic River Bridge and extends from theMystic River into the Inner Confluence Area. Seismic data collected alongsurvey line MPOI, files 050 through 080, are presented in Figure 50 andillustrate the detected interface of the rock, gravel, or till material. The aver-age depth to rock is approximately three feet. Limited acoustic penetration inthe western portion of Mystic River may mask any additional outcrop ar,.as.
Inner confluence area
The Inner Confluence Area is located at the entrance of both the Mysticand Chelsea River channels (see Figures 3 and 4). Sixteen seismic reflectionsurveys, lines IPO through 1P16, were performed in the project area and the
Chaptw S Dta Andyhia mn ResuIts 17

2-D profiles illustrating the different geologic interfaces and density distribu-tions are shown in Plates 3 and 4. The results from seismic surveys IP0]through [P05 and 1P14 through IP16 are displayed on Plate 3 whereas surveysEP06 through TP13 are presented on Plate 4. CENED core locations are alsodisplayed. High quality seismic data was recorded for interpretation to anelevation range of -50 to -75 ft MLW.
The acoustically derived results indicate that the upper layer of material,having thicknesses between 1 and 5 ft, ranges in density from 1.4 to1.8 g/cm3. Material classification determined from the computed densities isclayey silt to silty sand which is consistent with drill hole information.Higher computed sediment densities at the bottom surface are located sporadi-cally throughout the area and along the project area perimeter; particularlyalongside of the primary approaches to Mystic or Chelsea River. One suchpocket of more dense sediment is detected along survey line IP07 as shown atleft hand side of Figure 51. The material is interpreted as being primarilysand.
Underlying the near-surface material, the sediments transition into a stiff,cohesive clay, likely the Boston Blue Clay, or rock, gravel, and till zoneshaving acoustically computed density ranges of 1.6 to 2.3 g/cm'. Sedimentinformation received from the CENED drill holes indicated predominantlylean clay with sand overlying a layer of rock fragments, gravel, cobbles, ortill. Referring to Figures 51 through 54 which illustrate seismic data collectedalong survey lines IP07, IP02, IP03, and IP06, respectively, numerous layersand interfaces are detected in the subbottom. The bottom-most interface isthat of the rock and gravel or till layer. The remaining interfaces are withinthe Boston Blue Clay. The thickness of the clay material is highly variable.
Using seismic data collected in the Inner Confluence Area, two rock,gravel, or till outcrop areas near the channel bottom were detected. Theseareas are located on the site map in Figure 55. The first area is an extensionof the outcrop detected in the Mystic River near the Mystic River Bridge.Data collected in this area are representative of this rock and gravel outcropand correlates well with the Mystic River survey data. The depth to rock isapproximately three feet. The second, much larger area is located in thecentral portion of the confluence area. Seismic data presented in Figures 52,53, and 54 illustrates the rock and gravel interface as it approaches the chan-nel bottom in this area as detected along survey lines IP02, IP03, and IP06,respectively. The depths to rock and gravel are more variable in this zoneand range from 3 to 7 ft. The portion of the seismic record for survey IP03(Figure 53) illustrates particularly well the undulating surface of the inter-preted rock and gravel interface at depth. The acoustically determined densi-ties for this material range from 1.9 to 2.3 g/cm3.
Prior to the seismic reflection study, CENED personnel indicated that therewas a near-surface rock or gravel zone along the eastern edge of the conflu-ence area; an area proposed to be widened. Because of shallow water, limitedseismic surveying was performed. One survey, line IPIS, was conducted inthis area along the eastern boundary of the current channel. The seismic data,
18 chapter 5 Data Analysis and Results
L.

see Figure 56, was inconclusive on whether or not an outcrop exists in thisarea. CENED core information near this line indicated sand with some gravelwhich correlates well with the acoustic results for survey IPi5. However,further subbottom information should be obtained via drilling or some othertechnique to investigate the possibility of a rock outcrop in this region.
Chelsea River
The Chelsea River project area extends towards the north and east of theInner Confluence Area as shown in Figures 5 and 6. Fifteen seismic reflec-tion surveys, lines CPO1 through CP15, were conducted along the length ofthe area and the acoustically derived results are presented in 2-D profileswhich illustrate the interpreted sediment interfaces and density distributions.The results from seismic surveys CPO1 through CPO8 are displayed onPlate 5, survey lines CP09 through CP13 on Plate 6, and surveys CP14 andCPI5 on Plate 7. The existing CENED and WES core locations and appro-priate density information where available are also displayed. Sediment prop-erties and the data acquisition parameters allowed high quality seismic data tobe recorded for interpretation and density determination purposes to an eleva-tion range of -50 to -75 ft MLW.
Two surveys, lines CPI4 and CP15, were conducted between the McArdleand Chelsea Street Bridges. Results from the seismic data analysis of thesesurvey lines, see Plate 7, indicate that the density of the near-surface materialis within the range of 1.8 to 2.2 g/cm3. No drill hole information is availablein this area to determine the soil classification. A typical example of theseismic signatures recorded in this area are presented in Figure 57. Therecord was collected along survey CP15N just upstream of the McArdleBridge. Because of the competent nature of the surface reflector, limitedacoustic penetration was obtained and, therefore, prevented detailed acousticanalysis below depths of -50 ft MLW. No distinct geologic interfaces at depthwere detected along this length. Also shown in Figure 57 are two smalltrenches which may indicate the location of pipelines or utilities traversing thechannel area. Unfortunately, positioning problems during the survey preventaccurate location of the features. The depth to the possible utilities could notbe determined because of the small target size.
Upstream of the Chelsea Street Bridge, the near-surface sediments havehighly variable density values ranging from 1.5 to 2.3 g/cmn. The less densematerial are indicative of loosely compacted sandy, silty clay or clays withhigher water content. The soil classification and acoustically derived densityvalues compare well with the driller's logs and measured densities for WEScores BORI and BOR2 and CENED core FD-93-N (see Figures 9, 18, and30). In many areas of Chelsea River, surface materials having densitiesgreater than 2.0 g/cm3 limit acoustic penetration into the subbottom and there-fore possibly mask the detection of any subbottom interfaces. These areas arelikely comprised of sandy material but petoleum residue detected in coresBORI and BOR2 may also affect the bottom sediment characterisics as well aslimiting acoustic penetration. In areas having lower density surface material,
19Chps Data Anlysisd aind Results

deeper acoustic penetration was obtained thereby allowing detection of deepersubbottom interfaces. Portions of seismic amplitude records recorded alongsurvey lines CP07 and CP09 are presented in Figures 58 and 59, respectively.Along survey CP07 (see Figure 58), a window of less dense material is inter-preted amongst a competent bottom surface to allow detection of a few sub-bottom interfaces. These few interfaces occur within the stiff, cohesive claymaterial which has computed densities ranging from 1.8 to 2.1 g/cm3. Thedeepest interface may indicate a rock, gravel, or till layer approaching thechannel bottom. The rock/gravel interface, however, is greater than 10 ftbelow the bottom. Referring to Figure 59, intermittent zones of competentmaterial partially mask the deeper subbottom interfaces within the claymaterial. The computed densities of the deeper sediments range from 1.9 to2.1 g/cm3 along this profile (see also Plate 6).
Analysis of the seismic data collected in the Chelsea River indicate twosmall areas of either a rock, gravel, or till outcrop near the channel bottom.The first area is located in the upper reach of the Chelsea River near theGlobal-Gibbs and Northeast Oil petroleum transfer facility. Data from surveyline CP03, presented in Figure 60, illustrates the interpreted outcrop interface.CENED core FD-93-N was drilled at this location following the geophysicalsurvey. The second zone is detected along the southern edge of the shipchannel at the Chelsea Street Bridge (see Plate 6). The depth to the rock orgravel interface is approximately 3 to 5 ft below the channel bottom. Both ofthese rock or gravel outcrop areas are located just outside of the current dred-ging scope. It should also be noted that in large areas of Chelsea River,limited acoustic penetration was obtained and, therefore, other outcrop areasmay exist along the river but were unable to be detected with this technique.
Reserved channel
The seismic reflection investigation in and around Reserved Channel wasdivided into two areas as shown in Figures 7 and 8. A total of nine surveys,RPOI through RP09, were performed northeast of the entrance to ReservedChannel with each survey line parallel to the centerline of the 35 ft Main ShipChannel. The 2-D profiles illustrating the sediment density distributions andgeologic interfaces for these surveys are presented in Plate 8. Survey linesRP03 and RP09 are not used in the subbottom interpretation. Thirteen seis-mic survey lines were conducted within Reserved Channel and just north ofthe channel mouth (see Figure 7). Acoustically derived results are presentedin 2-D cross-sections which illustrate sediment density distributions andgeologic interfaces along these survey lines. The results for surveys RPIOthrough RPlg, excluding survey RPI3, are displayed on Plate 9 and for sur-veys RP19 through RP22 on Plate 10. Recent CENED core locations are alsodisplayed. High quality seismic data was recorded for interpretation purposesto an elevation range of -45 to -75 ft MLW.
Outside of reserved channel. In the area surveyed northeast of theentrance to Reserved Channel, in the 35 ft Main Ship Channel, the near-surface sediments varied in density with computed values ranging from 1.4 to
20 Chapter 5 Data Analysis and Results
1L i -... __"•:2

2.2 glc/ 3 . The lower density material, less than 1.8 g/cm3, are indicative ofloosely compacted sands, silts, and/or clays as identified from three CENED
cores retrieved in this area. Deeper sediments are comprised almost exclu-
sively of gray clay, according to the core logs, with traces of silt material.Computed densities for this material range primarily from 1.5 to 1.7 g/cm'.
Numerous interfaces are also found within the clay material as shown in Fig-
ures 61 through 63. The deepest interfaces detected in Figures 62 and 63 are
due to an interpreted rock or gravel layer which will be discussed later. It isnoted that deeper acoustic penetration was obtained primarily in areas where
the bottom surface sediments have lower density values.
Locations where higher computed density values are determined along thebottom surface may be correlated to materials such as sands on the channelbottom. It is unknown whether or not chemical residues are present on thebottom surface. These more dense sediments limit the acoustic penetration ofthe signal and partially or fully mask any of the subbottom reflectors. Anexample of this effect is shown along the leftmost and rightmost sides ofFigure 61 where seismic data was collected along survey line RP07. Thebottom material along survey lines RP08 and RP06, conducted outside of the35 ft Main Ship Channel, consists primarily of sandy sediments with com-puted densities typically greater than 2.0 g/cm3 .
In areas of deeper acoustic penetration, the rock, gravel, and/or till inter-face is detected. One possible outcrop area is identified along the centerlineof the Main Ship Channel, see Figure 64, and is likely within 5 ft of the cur-rent channel bottom. A portion of the seismic amplitude record illustratingthis feature is presented in Figure 62 with the interpreted rock and graveloutcrop and interface shown on the left side of the record. This data wascollected along survey line RP07. CENED core FD-93-D is located in thisvicinity but did not encounter the seismic feature (see Figures 40 and 62).Other rock, gravel, or till pinnacles or ridges are also detected using thistechnique but are located more than 10 ft below the channel bottom. Fig-ure 63 illustrates the seismic signature of one such pinnacle detected alongsurvey line RP05.
Within reserved channel. The near-surface sediments nearest the mouthof the channel and within the current channel limits are primarily comprisedof materials ranging in density from 1.4 to 1.7 g/cm3, indicative of silty clayto sandy silts. Acoustically derived bottom sediment densities greater than1.8 g/cm` are computed along the remaining length of the channel. Thissediment type may be indicative of compacted sands, stiff clays, or hardpanmaterial. It is unkown whether of not chemical residues are present on thebottom surface. Interpretation of the seismic records, however, concludes thatthis material is not rock or gravel. A portion of the seismic amplitude recordalong survey line RP1S, files 010 through 030, is presented in Figure 65 andillustrates the transition zone from the lower density surface material on theleft to the much higher density bottom sediments on the right. Limited acous-tic penetration in areas of this dense bottom material prevented subbottomanalysis at deeper depths and masked any geologic interfaces. Intermittentwindows through the more dense material, however, permit investigation
21Chalp sr Data Analysis and Results

deeper into the subbottom. An example of one such area is shown inFigure 66 along survey line RP20.
In areas of deeper acoustic penetration, the subbottom material densitiestypically range between 1.6 and 2.0 g/cm3. These sediments are typicallystiff, cohesive clay, indicative of the Boston Blue Clay, possible till material,or rock and gravel. Representative seismic signatures in an area of deeperacoustic penetration is presented in the left half of Figure 65. The layering inthe subbottom is particularly distinct; especially within the clay material. Thedeepest interface detected may be a possible rock and gravel zone.
North of Reserved Channel, five seismic surveys were performed in anarea proposed to be deepened (see Figure 7). The acoustically derived densityvalues for the near-surface sediments ranged from 1.4 to 1.8 g/cm3 in areasnearest the main ship channel to greater than 1.8 g/cm3 near the existing dockfacilities. The less dense material, according to CENED core information,consists primarily of unconsolidated clayey and silty sand whereas the moredense material is mostly sand mixed with some gravel. The more dense mate-rial limits acoustic penetration into the subbottom and thereby masking anygeologic interfaces. An example of this effect is evident in a portion of theseismic record along survey RPI2 (see Figure 67). In areas of deeper acous-tic penetration, the subbottom material has a density range of 1.6 to1.9 g/cm3. Referring to CENED core information, this material correlates tostiff, gray clay with trace silt.
Analysis of the seismic data collected within Reserved Channel indicate arock, gravel, or till outcrop in the area north of the channel mouth proposedto be deepened. The outline of this area is located on the site map shown inFigure 68. Seismic amplitude data collected along survey line RP15, files 010through 033, are presented in Figure 69 and best characterize this layer.Because of limited acoustic penetration due to the competent near-surfacematerial, the rock/gravel interface is poorly defined in most of the area andcannot be resolved along some survey lines. In the few areas in which theinterface can be mapped, the depth to rock ranges from 10 to 15 ft below thebottom surface. This range correlates well with CENED core informationtaken in this particular area. Limited acoustic penetration in the westernextent of Reserved Channel may also mask any additional outcrop areas.Therefore, it should be noted that other rock areas may exist in the channelbut were not able to be detected with this technique.
Results of the Side Scan Sonar Survey
The side scan sonar was used in conjunction with the seismic equipment toprovide an image of the channel bottom in each of the four project areas.Side scan sonar information was collected along each survey line. The unitwas operated at a frequency of 100 kHz with a range setting of either 100 or150 meters. Each record was analyzed and interpreted to investigate thefollowing: general channel bottom features, gross soil classification, utility
22 Chapter 5 Data Analysis and Remith
f.I

i- - - -•..-.- . o
crossings, obstructions to navigation, possible dredging hazards, and otheranomalous features. As directed by CENED, special attention is given toareas along wharfs and bulkheads in each area. It should be remembered thatthe side scan provides minimal, if any, subbottom information.
Mystic River
The side scan sonar investigation in Mystic River was directed along theseismic reflection survey lines shown in Figure 70. Interpreted side scansonar anomalies are also presented in Figure 70. In the western part of thearea from the Boston Edison wharf to Distrigas, the bottom signatures producea relatively smooth texture indicative of silt or clay bottom material. An areaof scattered debris is detected along the north bank near coordinate position717855, 505900. This location, see Figure 70, is adjacent to a scrap metalyard and dock and the signatures received are likely reflected off pieces ofmetal that have fallen into the water. A portion of the side scan record takenin this area is presented in Figure 71. Numerous drag marks are also detectedalong the channel bottom.
In the central and eawtern portions of Mystic River, recorded side scan datacreate an image of the bottom surface that is much more irregular in texture.The rougher texture is likely indicative of coarser sediment on the channelbottom. This texture may be due to more frequent ship traffic in these loca-tions which prevent settling of fines on the bottom. The rock, gravel, or tilloutcrops off the Exxon Dock and near the Mystic River Bridge are unable tobe detected or resolved on the records. Shallow rows and troughs are alsopresent along this section of the channel bottom. A small circular anomaly isdetected near coordinate 720720, 505270 (see Figure 70).
There are no utility or pipeline crossings apparent on the side scan recordscollected in Mystic River. There are also no bottom obstructions detected thatmay cause a hazard to navigation. The only detected dredging hazards arelikely the scrap metal debris discussed earlier and located in western MysticRiver. The sonar images recorded may indicate a small boat on the bottomsurface near coordinate 721095, 505405 (see Figure 70) and approximately25 m offshore. This location, however, is outside the current dredging scope.Analysis of the sonar records near the wharfs and bulkheads along the Mass-port Terminal on the south shore of Mystic River indicate a change of slopealong the base of the bulkhead which likely indicates a buildup of sedimentmaterial.
Inner confluence area
The side scan sonar investigation was conducted simultaneously with theseismic reflection study and follows the surveys lines presented in Figure 72.Interpreted side scan sonar anomalies are also noted on this figure. Theimage of the channel bottom appears relatively free of finer sediments asdenoted by the rough and irregular texture. The lack of fines are likely due to
Chepw S Dao Amyul and eault 23
S 1.. . ... . . . .. . .. . . -..... .. . ... . .. ..

frequent ship traffic which prevent the settling of silty or clayey material inthe central portion of the project area and along the primary approaches toMystic and Chelsea River. The bottom of the ship channel contains scatteredobjects, likely rocks, of all shapes and sizes. Most of the anomalies are rela-tively flat on the bottom surface although several cast a distinct acousticshadow indicating some relief above the bottom (see Figure 73). These feat-ures may be due to the rock, gravel, or till outcrop near the channel bottom atthis location. The channel bottom texture becomes smoother around theperimeter of the project area which may indicate a higher percentage of claysand silts on the bottom surface.
No utility crossings or apparent obstructions to navigation are apparent onthe side scan records. A circular shaped anomaly is detected along surveyline IP16. Analysis of the side scan information near existing docks andbulkheads reveal few anomalous conditions. Some debris is detected approxi-mately 25 m off the end of a dock near the start of survey line IP07 (seeFigure 72).
Chelsea River
The side scan sonar investigation in Chelsea River was performed concur-rently with the seismic reflection study along the survey lines shown in Fig-ure 74. Anomalous areas detected with this technique are also shown in thefigure. Between the McArdle and Chelsea Street Bridges, the texture of thechannel bottom is primarily rough and irregular with intermittent regionshaving smoother texture. The irregular texture is indicative of sand or gravelon the bottom surface. Some the features have various degrees of relief whichmay indicate rocks, cobbles, or other objects on the bottom. The areas ofsmoother texture likely consist of finer sediments which have settled on thebottom surface.
No utility crossings or pipelines are readily apparent on the side scanrecords; even in the area of McArdle Bridge where two trenches were notedduring the seismic reflection survey. An extensive area of debris was detectedalong the channel bottom just downstream of the Chelsea Street Bridge (seeFigure 74). The objects are of varying sizes and lengths which protrudeslightly up off the bottom surface. A portion of the side scan sonar recordpresented in Figure 75, taken along survey line CPI4N, illustrates these bot-tom features. A rectangular shaped object' was detected approximately 12 msouth of survey line CPI4S near coordinate 728140, 504830. An additionalthree rectangular objects, thought to be submerged vehicles, are located offthe end of a pier located near the beginning of survey line CPI4S (see Fig-ure 76). The majority of the bulkheads, wharves, and docking facilities havefew if any anomalous conditions associated with them. However, accordingto the side scan records, the bulkheads situated along the northern bank justdownstream of the Chelsea Street Bridge have failed and soil, rocks, and otherdebris have fallen into the channel area (see the side scan record inFigure 75). This may pose a possible hazard to navigation along this part ofthe channel.
24 Chapter 5 Date Anlysis and Remit.

Upstream of the Chelsea Street Bridge, the channel bottom has a muchsmoother texture indicating that larger quantities of fine sediment are presenton the bottom surface. Coarser sediments are detected intermittently along thechannel perimeter. A large area having irregular texture is noted along thesouthern boundary of the upper turning basin in the vicinity of a possible rockand gravel outcrop area (see Figure 74). Interpretation of the sonar signaturesindicate coarse material and possibly rock fragments on the channel bottomand side slope. A few of the objects have some relief above the bottom sur-face. Drag lines are also detected along the channel bottom.
No utility crossings, pipelines, or navigation hazards are detected in theupper reaches of Chelsea River. Located just upstream of the Chelsea StreetBridge (see Figure 74), an anomalous area indicative of a debris pile wasdetected on the channel bottom. A rectangular bottom anomaly is locatedalong survey line CP02 near coordinate 730500, 507835. Acoustic anomaliesare also detected in the vicinity of the Global-Gibbs and Northeast Oil petro-leum transfer facilities. Few anomalous conditions were detected along any ofthe other bulkheads or docking facilities in this area.
Reserved channel
The side scan sonar survey was performed simultaneously with the seismicreflection investigation in Reserved Channel and the area directly opposite thechannel entrance. Seven surveys were performed in the area opposite of theentrance to Reserved Channel and conducted parallel to the centerline of the35 ft Main Ship Channel. A total of 12 surveys were performed withinReserved Channel and in the area north of the channel entrance. The surveylines and interpreted anomalies are shown in Figure 77.
In the area across the main ship channel from the Reserved Channelentrance, the texture of the bottom surface image becomes more irregular nearthe southeastern end of the survey area. This signature may indicate a higherproportion of coarser sediments and/or rocks on the bottom surface. Some ofthe detected objects have some relief above the bottom surface. The bottommaterial in the northwest section of the area is interpreted as having moreclay or silt material at the surface. Near the beginning of survey line RP05, alarge anomalous area indicative of a debris pile is detected and interpreted aslikely being comprised of rocks, gravel, or other coarse material. A portionof the side scan sonar record illustrating this feature is shown in Figure 78.At the location of a suspected rock or gravel outcrop, as detected with seismicreflection data (see Figure 64), the sonar images show few anomalous signa-tures that may indicate the presence of rock, gravel, or cobbles on the channelbottom.
No definite hazards to vessel navigation were determined from the resultsof the survey performed in this area. Bottom images did detect numeroussignatures intermreted as lobster traps or other man-made debris. Two long,linear anomaliws were detected in the southeastern part of the area surveyed
5
chq~ts soDat Aniul aid Remi25V.
tL .. ....... ... .. .... . .... ...... . ..

(see Figure 77) and are illustrated in Figure 78. These distinct linear featuresmay be trenches for utility crossings or drag marks on the channel bottom.
Within the current boundaries of Reserved Channel, the bottom image hasa smooth to moderately irregular texture indicative of predominantly finersediments with traces of coarse material, probably sand, on the bottom sur-face. This correlates well with the results from the seismic reflection survey.Two separate piles of sediment material are detected in the berthing area atand beyond the western end of the Castle Island (Massport) Terminal bulk-head. These features are illustrated in the side scan record shown in Fig-ure 79. The mounds do not have much relief and do not pose a hazard toship traffic. A few drag marks and trenches are detected along the channelbottom but it cannot be determined if these features represent utility crossings.Numerous sonar signatures interpreted as lobster traps are noted along thelength of the channel with the heaviest concentration nearest the main shipchannel. The bulkheads on either side of the channel appear -. ucturallysound from information displayed on the side scan records but small inter-mittent anomalies appear along their edges. These anomalous images maylikely be man-made debris that has fallen in the water.
North of the entrance to Reserved Channel, the texture of the bottomimage is more irregular than that detected within the channel which likelyindicates coarser material present on the channel bottom. These results corre-late well with the interpretation from the seismic reflection survey in this area.Numerous scattered targets are detected which appear to be man-made debris,buoy anchors, or lobster traps. Some of these targets may also representrocks or cobbles. No utility crossings were detected in this area.
Volumetric Estimates
One of the objectives of the seismic reflection investigation is to not onlycharacterize the subbottom sediments but also quantify the sediment types.Seismic signatures reflected from various geologic interfaces are recorded anddisplayed to create seismic amplitude cross-sections. The seismic amplitudeintensity, with the more competent reflectors correlating with the strongestsignals, give indications of the depths to differing stratigraphic interfaces inthe subsurface. Using the three material categories of interest: (1) rock,gravel, and till, (2) stiff, cohesive clay and sandy material, and (3) looselycompacted sediments (muck), thicknesses were determined from the amplitudecross-sections. Investigation of the seismic data have indicated that the dens-ity and acoustic impedance contrasts between the sandy material and stiff,cohesive clay, namely the Boston Blue Clay, are small and distinguishingbetween the two geologic units is difficult. Therefore, estimates reflect thecombined volume of sandy material and clay to be removed through dredging.The survey results for each of the bottom and subbottom material categoriesare discussed below.
26 Chapter 5 Data Analysis and Results
I.

-. -=- - -. -- - .---" -
Loosely compacted sediment (muck)
During analysis of the seismic data collected in the four project areas,thicknesses of loosely compacted sediments were measured along each profileline and correlated to the surface areas of the proposed dredging efforts. Thevolume estimates for this material classification in each area of investigationare shown in column 1 of Table 3. The best volume estimate of the looselycompacted sediment (muck) for the dredging effort in Boston Harbor is578,700 yd3.
Stiff, cohesive cdaylsandy material
The thicknesses of this interpreted material above set dredging limits aremeasured along each profile line and correlated to the surface areas withineach project area. The generalized category of stiff, cohesive clay/sandymaterial encompasses the Boston Blue Clay, areas of hardpan clay, sands, andcompacted or bonded sandy silt material. The volume estimates for this mate-rial classification for each area of investigation are shown in column 2 ofTable 3. The best volume estimate for the dredging effort in Boston Harboris 1,297,500 yd3 with nearly 41 percent of the quantity retrieved from MysticRiver. Separate estimates for the sandy sediments and clay material wereunable to be made because of the sediments similar density and acousticimpedance values.
Rock, gravel, and till material
Volume estimates of the rock, gravel, and till material were made throughanalysis of the seismic data collected in the four project areas. Areas ot possi-ble rock outcrops were determined from the seismic amplitude cross-sectionsand outlined in a letter report provided to Mr. Yuri Yatsevitch, CENED-ED-GG, on 2 February 1993. The estimated thicknesses of rock and gravelmaterial were measured along each seismic profile line and correlated to thesurface areas of the interpreted outcrop areas within the proposed dredgingeffort. The volume estimates for this material classification for each area ofinvestigation are shown in column 3 of Table 3. The best volume estimate ofrock and gravel material for the dredging effort in Boston Harbor is79,600 yd3. It should be noted that possible rock outcrops were detected inthe Chelsea River but are located outside of the current dredging scope. InReserved Channel, the competent near-surface sandy material limited acousticpenetration of the seismic signal into the subbottom and thereby lessened theidentification and detection of rock or gravel interfaces in and around thechannel mouth. Further analysis of these areas using CENED drill hole infor-mation assisted WES investigators in determining volumetric estimates of thismaterial.
The proposed dredging effort also includes widening of the Inner Conflu-ence Area along the eastern side. Limited seismic surveying was performedin this area because of shallow water depths. Using the seismic data obtained
Chepw 6 Do* Anis end m .Reaft 27

and information provided by CENED, the sediment material is comprised ofmuck, sandy silt, clay, and possible rock outcrops. A gross estimate of sedi-ment volume to be removed through dredging is approximately 229,400 yd'.
Total vooum of dredged materoal
'Me volumes of rock and sediment material to be removed from eachproject area during the proposed harbor deepening is outlined in column 4 ofTable 3. The total volume of rock and sediment material to be removed fromBoston Harbor through dredging is estimated at approximately 1,955,800 yd'.Adding the material volume estimate from the proposed widening of the InnerConfluence Area, the total volume is approximately 2,185,200 yd3.
28 Chaop S Dam Anwva ad R*emu
I,
d :-i

6 Project Summary
A high-resolution, seismic reflection survey was performed in three tribu-taries of Boston Harbor, MA to quantify the densities and soil types of thenear-surface and subbottom marine sediments. The project areas investigatedinclude the Mystic River, Inner Confluence Area, Chelsea River, andReserved Channel. Analysis of the seismic data yielded computed sedimentdensities which may vary by ±0.20 g/cm3 from insitu values.
Near-surface material densities are highly variable across the entire projectscope with values ranging from 1.4 to 2.2 g/cm3. Surface material havingcomputed densities between 1.4 and 1.8 g/cm3 are indicative of sedimentsranging from silty clays to silty sands. The higher density sediments arelikely rock, gravel, or till material, sandy material, stiff, cohesive clays typi-cally called the Boston Blue Clay, or hardpan material. Areas of higher den-sity sediments could readily be detected on the seismic records because oflimited penetration of the acoustic signal in these areas. Density and soilclassification of the bottom sediments, as determined from the seismic data,correlated well with existing CENED and WES drill hole information.
Below the depths set by the proposed dredging work, the subbottom mate-rial becomes primarily a stiff, lean clay or rock, gravel, and till. These mate-rials are detected in many of the deeper core logs. This material hasacoustically derived densities ranging from 1.6 to 2.2 g/cm 3.
The results of the seismic reflection survey did detect and delineate threeregions of rock, gravel, or till outcrops near the channel bottom in the MysticRiver and Inner Confluence Area. The undulating interface generally formspinnacles or ridges and at the areas noted, approaches to within 3 to 5 ft ofthe channel bottom. The estimated volume of this competent material to beremoved through dredging is approximately 46,100 yd 3. Two outcrop areaswere also detected along the Chelsea River; one near the Chelsea StreetBridge and another southwest of the Global-Gibbs and Northeast Oil petro-leum transfer docks. These outcrop areas are, however, outside the currentdredging scope. One rock or gravel outcrop was detected across fromReserved Channel in the 35 ft Main Ship Channel. The depth to this zone isapproximately three feet. Three other rock or gravel pinnacles were alsoidentified but are located at least 10 ft below the channel bottom. North ofthe mouth to Reserved Channel, limited acoustic penetration prevented delin-eation of a suspected rock, gravel, or till outcrop area. Further analysis
I29L..qnw 6 P.oiw siw.ww9

during CENED drilling and probing efforts provided additional subbottominformation at this location. Seismic data collected in the Chelsea River,Reserved Channel, and western Mystic River had limited depth penetrationand, therefore, few geologic interfaces could be detected and interpreted.Therefore, it should be noted that other rock, gravel, or till outcrops mayexist in these areas but are not able to be detected with this technique.
After analysis of the seismic reflection data, the survey results were able todelineate the acoustic signatures of the differing sediment regimes outlinedwithin the report. Volume estimates of the loosely compacted bottom material(muck), stiff, cohesive clay/sandy material, and rock, gravel, and till arecomputed from the interpreted sediment thicknesses. The total volume of rockand sediment material to be removed from the three tributaries of BostonHarbor is estimated at approximately 1,955,800 yd-. Of this total, a quantityof 1,297,500 yd3 or 66 percent of this material is categorized as stiff, cohesiveclay and/or sandy material. An additional 229,400 yd' of material are esti-mated to be removed during the proposed channel widening along the easternside of the Inner Confluence Area. The volumetric results provided in thisreport are best estimates and should be used judiciously in the development ofany finalized dredging specifications.
The side scan sonar was operated concurrently during the seismic reflectionsurvey and provide an acoustic image of the channel bottom in each projectarea. The results provided qualitative assessments of the bottom sedimentcharacteristics and identified any anomalous conditions that may pose a hazardto navigation or the proposed dredging effort. One area of concern is locatedalong the northern retaining wall in Chelsea River just downstream of theChelsea Street Bridge. The wall has collapsed and sediment material or otheidebris have fallen into the channel. The presence of any utility or pipelinecrossings are noted in each area investigated.
Analysis of the seismic information provides a continuous description ofthe bottom and subbottom sediments in terms of density and material type.The sediment characteristics and profiles highlight changes in the actual sub-bottom conditions and delineates the extent and depth of various geologicfeatures. With additional information provided from a side scan sonar, anacoustic image of each channel bottom qualitatively characterized the bottomsediments and delineated any navigation or dredging hazards. This inform-ation will be especially helpful in coordinating and completing a sedimentcoring program or proposed maintenance or new work dredging.
30 Chapter 6 Project Sunuinery
L....

References
Ballard, R. F., McGee, R. G., and Whalin, R. F. (1992). "A high-resolutionsubbottom imaging system." Proceedings of the U.S./Japan Marine Facil-kies Panel of UJNR, 25 October-11 November 1992, Washington, DC.
Bowen, J. D., Hartman, G. L. and Meininger, C. A. (1992). "Third harboCrtunnel, Boston: Mechanical dredge - sediment resuspension analysis."Terra et Aqua 47(Jan) 28-35.
Caulfield, D. D. and Yim, Y. C. (1983). "Prediction of Shallow SubbottomSediment Acoustic Impedance while estimating absorption and otherlosses." J. Can. Soc. Explor. Geophys. 19(1) 44-50.
Fish, J. C. and Carr, H. A. (1990). Sound underwater images: A guide tothe generation and interpretation of side scan sonar data. I st ed., LowerCape Publishing, Orleans, MA.
Hamilton, E. L. (1970). "Sound velocity and related properties of marinesediments." J. Geophys. Res. 75(23) 4423-4446.
Hamilton, E. L. (1972). "Compressional-wave attenuation in marine sedi-ments." Geophysics 37 620-646.
Hamilton, E. L. (1980). "Geoacoustic modeling of the sea-floor."J. Acoust. Soc. Am. 68(5) 1313-1340.
Hamilton, E. L. and Bachman, R. T. (1982). "Sound velocity and relatedproperties of marine sediments." J. Acoust. Soc. Am. 72(6) 1891-1904.
McGee, R. G. (1991). "Subbottom hydro-acoustic survey of Gulfport ShipChannel, MS." U.S. Army Engineer Waterways Experiment Station,Vicksburg, MS. (Copies can be requested from U.S. Army EngineerWaterways Experiment Station, ATTN: CEWES-HS-H (McGee),3909 Halls Ferry Road, Vicksburg, MS).
McGee, R. G. and Ballard, R. F. (1992). "An acoustic impedance methodfor subbottom site characterization." Proceedings of Water Forum '92,Am. Soc. Civ. Eng., Baltimore, MD.
31
.----- i-i - - -- ... -

Urick, R. J. (1983). Principles of Underwater Sound. 3 rd ed., McGraw-Hill, New York.
32Reference.
LI'

3'-.EREVERETT
CHELSEA
cholof Chelsea St.
Brdg
- in ChnnllhnTna
EASTSOSTO
,.flRir d 4Wbr~re (pleasued
Myti n-re to 40'
Flesuved Channel to 40 SOUTH BOSTONChelsea River to 38'
I US Army Carps of Enginemers
ScleIFe New Englandl DMsioEn* 5C h~ 1 jBoston Harbor, Massachusetts
0; 2Oo 4Ooo Navigation Improvement ProjectI Shooti I 12
1 March 1992
Fonige1. Sute map lusirsting fte three tributaries (four projec areas) aurveyed In BstonHarbor, MA

00
CLC
0=
a ii 0
'pCN
L 777TZ72..~ --- __

C))43- 0
3 c U)
C 0D
IL __ ___u

U,c
0
C 0 z 2s
ZU) En0 c
4).> 0A 0 c
4m 0 - 0
MAIN SHIP C;HANNEL L
if))0 0 0o Al
LL CL(1 0

wS..)
zi
Z ILa0
0o
If)
c.'J
otIf))
U :10
I nnC
0LC),
4 I
_ _ _ -we 02

An - - -
goCLzj LL
coo
oG
0
0
o) 0
o CL
600A
LC).

5. z
92 0
IL &
aw
AAk
0 II
L)O
00
A22 L

400
0@0
CC
- 0
0~0
L K! ee IIrI0

0f 0 ) C n 0 f 0 In 0
-~9 c
* >0
W co
LII W
z0 . I !0~ ~ I..
00
J0
AA .A r-Yz
IX

ml a It 0
00 0
2.5
- 2U
1.0
c 0
co
POO LA ml=) A r01( L" L
>, CL
OJo
L. .~..~ _

LUI I I i I 1 1 I I I I I I
2.5
2.0
0 --o--
C 0
oEU1,
0
•o -r ,•c7- 1.0
0o i
'--•• ....
M L L ),a
C)a
00
M u)
S•I-- l . .I I I lJ l I l J I I TI l l lIl ,llllJ 1 I i I I , i I I I I I f a, '-•
(D I
U, 0 U, 0 U,
J--• I I I I I I I I I .-L moo
LZ .Al'

11 0 Lf 0 Vfl 0 V) 0 0 0 In 0-C al CO to l F, c w
>- o0 U' V) mG
0
-J i
00
n u
z- LIJ
0
-~ 0z n
u ')0QJW
0)0)
I.XI
000
0 >f A fM ~ 00 Lo Pm I I
__ _ __ _ __ _ _ __ _ _ __ _ _ __ _ _ __ _ _ __ _U
I.n
0 -. ~- - - ~ *

0 ~ 0 ~ 0 LO 0 &i U
t n ~C r ~w a
2.0_
00
m 00
to I L)0 C*0 O
UJ~cO
a))

0 kn 0 10 0 to 0 Ul 0l to 0
0 Q
0.
0 u
I
v)00
4) 0> Q
Ln 0
ClCu
uq 000)
(U a)z0 0 uoE
z LLI
z z f~ ku
8 (D0 a. 0a f 0 kn 0 U 0 U, 0
n In o to I, c Go a)____ ___ ___ ____ ___ ___ ____ ___ ___ ___LL

o U) o i) o U-) 0 Ito 0 in 0t 4. in In) co to f- P% co OD C)
II I I I f
000
_____25
2.0 0
0- Z U
1.- 1.5
cn 1.0cJ0
ILL
0")01
U CL
-o .0
0 c o En
Sf
L)O En) 0 t 0 I
-E IL.=.. .0.- . . .~

0 Inl 0 Ufl 0 It 0 .fl 0 41 0In I e) ID D 00 ao I
a1 5
01 0
DimmOWL)
IV U00___ __ C,
o o
LLL
< 0
I~< I I TCD0 In0Ll 0 0 0 4 n .
W n w CoU1CL

-0 l 0 fl 0 u.) CD .f 0 LO 0
I I
1 LLiJ Lj -L .1-I 1100
nL(A a 0
o2I _ _ _ - - -- - - - - -
c- '2 20
u) E0 C)-
C ----- 26I
oauuu 0 D
uwwuCL
CDC
0 00
~z m 0rUJ j=(11 ..
44 (Z A
Lo ~I'~0I 0 LI II I -- T 7 - rTV--r
-ID 0 ~ ~ l u 0 If 0 Inl 0
In to w w r, Il a a a
-~ K _ _

I- 0 0f 0 it) 0 in 0 1f) 0 ko a
ca In In I0 to()LUJ
.LL1I Al I ~ .L .~jI I It
20
z
0 00
c
m
L) A.
0 L
U-UOLU)
09
C) 0 -Q
01 rn 61V) I
Cn I Vr" -
Z Lfl
01 LO 00 W 0 g
w~flzr

0 LO f 0 u) 0 L) 0 o Ln 0
-u _j InI wI
0
C2
0
-C1 0
a)0
00
L)0 8
> 2) C0 q
00
CL ) Fl~ /I- ci
_ 0
z
Zk o In f In I

U) 0 ~ fl 0 fl 0 U 0 ) 0
w L, i~ -ý -- L L I I I I
LU1 0.. V) tt ~
00
o?- -~CI -i -
~t~2 0
II- t Em ýi E01.1 occ
Q) r1)N
IO A
C_ _ _ _ __ __ _ _ _ _ 4_ _ _ _ _U

T 0 V) 0 uf) 0 LO 0 u) 0 In
0 h
20
Lo
Li
L)A
QI)
CDCu..2
C4
44
10 In 0 o ILoN to rl r o G

0A aA C IA 0 I
02
0 E- 0
215
2 20
0
m c
7) 0)
0
Ii
C: aO)
0 ) I C w
C'n Z IXUg ,,*zx
I I I I I I I I I IIZI I I I I I I I IC%
Q IA C ,A C- IA C- IA C A4
LI In IO In I I
2n Ln (D M727U-

v -w in in w. to f, do c
00
2. J
20
0 E
C 10
o cc
*(LG) tn
>0 L-
(nUCL Ix(0 00 2
ID D
V)L wz c '
zf)z
8 v)
_ L0 U, 0 o, a U, 0 0 U 0w4 4 n W, Go IC rw
I I I I I I I

0~~ W) 5 ) 0 in 0
I IID O Sfi IV I I ION
2,
ME-
LA 0
0 j
02.
C1410
0)
z 1ý; 4' C
z 1
Zz
00
iC)~~TT CO CD N N ,4O
j a.0 L, 0 10 0 iC) 05___ ____ _(o__(____,___ ____ ___ _co _ _ U

I- 0 U') 0 .C) 0 fl 0 i 0 .*i 0v- ~ I n 1 10 lU t 10 ID 0'co a
0-30 UOlIODO]l SfILi IV aAOý ON
2.5
0
C0
. V 11U c "-
Ln 0)
CD .4.
C,4 U.) -it
~3 z
c I I I I I
0 EA~ II CL 0 In -nI I
in 0 w w 'r
c o 0

C) u ) 0 In . 0 In 0 n~ 0
i. I-L- I I I JI I I i I-1
UO!)D210 SIL4j IV G`0 ON
0_ _ _ _ _ _1
02
mcn u
01'0
00
C Z
0 c'J < 0
- a-L
m- I
__ _ _ _ _ _ _ __ __;_ _ _ __ _ _ _ _ _I

I~ I I I I
UIIO O sI I' @A : ON I I
20
o
00
<oL w
zX
2 0 J
4 I I I , I I
-f00L

CD - u7>l
z~
A- LZ
00OQ- --- rTT7rT- -- - -7-71T-~lTr7 -- l
ID Go
4fl ~ - 4- - _ ____ ____ ___ ____ ____ ___

- 0 (1 0 In 0 U CD 0 ) 40 )
L-JwJ"w.LLLL L iL-Li.±LL.L i-L-L-i t -L ~iL
U2,0
-24
m C)
LI
9 I..
u CL< .
o Lr IX IQ_ _ I I0_ _ _ __ _U

0 U) 0 Ln 0 LU) 0 dfl 0 Ln 0Ir U) d") to to co co W m
UiZ -I I I I I I L I I I I I I I I I I 1 1 1 1 1 1 1 1 1 1 1 1
0
0
-
- 2.0
- - -1 5
0
M
00OLiJ
0
0'I~. CU
Q) > C) Pon
(3(r) L-L 0
~j LJ j7
00
00
a. Wm 0 LI) 0 Lfl 0 un 0 LO 0
__t % _ _ __ _ __ _ _ Intoto________ o-

o Ifl ) 0 1) 0 Lr 0 Ln 0
L I I I I I I I I III I I I L I I I I 111 1 1 1 1 1 1 1 1 1 1 1
0 L ILLLLLLJLJLLILLILL4LILLL W Z)Z ON
2,
Fn ~ ~ ~ ~ SLU~ 'O 0
o~ U-
:D ~ 0
LLu
0 cc
90
>u 0 ( .i 0 f
W~ (10 U0 S0 1z U<I

0 kn) 0 fLr 0 Lfl 0 fLr 0 Ul 0
-L I I ( L I I I I i I I I I I III I I I I I I I I
0 U011O0]0 SILf IV 9JO3 ON
I E 2.0
1.0
0 ow
2 -
0
a) X
0) ;Q7½ , 1
f''U
z c.J
-' 0-0 , 0 U
0 Ink)Ln 0 L

in 0 f 0 to0 0 Inl
'2~~ 5
dm-
2.
0 r-1
Q)A 00 LO
iii 4 11In0
In 0 n. 0 In
0n In 0, r 0 0
..............................................................

0 to 0 10 0 ul 0 r) 0 U
I' In 10 0 I0 00
0~2
E "1 iJ03 1 SI4J ý 010) 3
ý7 E
0) -0 u
< W-IN '~ I~ ~j Acc
I~z < o J.3 W ) X 4' .. ,
00
0 U) 0T) 0 U ) 0 U
a. L U) Z 0 0) (D
f 00 00II

U')~ 0 fLn 0 nf 0 -If) 0- - Ui
I~iL L
_j LL _Y
0
Q)
Iv)Z) 0
-oc c
U L
w _
I7T ---- jT I I co
> LL .

In K) v 'I 0 U) 1 0 co~
LILLI- Lj L tJ iAI I II)Lj1 11 -
~ (3 0
z
(n-C
0
u cQj
>0
> CY -v)
~OwL
LU LU r
00
_j (L 0 fLO 0 f 0 tfl 0n o ~ 0- u) 0In If ) Ilo lo co 1

0 (IF 0 FLn 0 dI( 0 Inl 0 ti) 01
"A t ILiLL L-La... -1 1 L 1L LiAILiL "L L _L 'LiA
r00
25
0
0 Za
0 a-~
AZ,
Q) 0 ) (l Zn .0C
U) W u
- I I U_ _ _ _ _ _ _ ~ ~ ~ _ _ _ _ _ _ _ _ _ _ _ _ _ _ _ _
ID IL C

- I I t- I I- II JLI-L
20
00
Ia):
C1
) ,TC ,. - 1
00~~-r
0
L~~ __ __ __ _ __ __ _

- 0 Lr 0 U') 0 Inl 0 In fr ~ ) 0- Lo U) r N ao
o U014D-)O] SItlI pýi aJ(O3 ON
SE L ------_ _ - 2w E
0~
v) <
0u Q
In 0)jNI
00 00 4a
'I-nIý f
Q__ __ __ _ _ _ _ __ _ _ _ __ _ _ _ L
L~~~u -I . r. c--t.-

a9 LOI 0 Lo 0 III 0 10 0 If) 0
iiinIiiii itii iiii iiII IIII IIII IIII IIII I I I I I I I
0
0 0)
0 o ý
.2.
0u
U) z"oj
Cl 1.0
W <0)I~ ~fl
10
0))
LC)u
0)Q). >~ 90
9 z <~1 W, U ,0 LO z
LUi LU I . 0)z v)"
0 IAv )90 N N~C
IL

a~ n ci In 0i 0 In 0 T)
I L I I- L
uLJOIIO1-D SIL1 PV aJO:) ON
______2 C
L7
.so_ _ _ _ __ _ _ _ _ _ __ _ _ _ _ _ _ 10x
V)O C)
Ln 0 E0
-CLO0
_________________________ CKl -r L.. .;
Lo 0
0 ~ ' z
cz
_j. EL In oi u) ci n 0Cn I~~Ln r) lo~0 N

I 0 In 0 fl 0n an f) 0
C.-
I.40
L~C
zC
ý. -T--r I TU
.4 a)

0 .fl 0 0 LnL 0
0 U0¼0DDO I SI~ 4V 0aO3 ON
vLnzp
p uc
LL~
CC))
LZ
vi
I I7r7 I I I- -- r -

0 fL 0 ' to 0 i 0 i 0 IC 0U) in) (0 (D r, 00 Go 0)
0 010- S Iq IV giz O I
Li2.5
0.
Ow ~ cO1S~j~ J~OL) C
Z2.w
0 3
0 - 0ýV<
a CD
-C
V r- Ln AL)> to nz
S1 0WL
0 0)
- I I I I I II I I

~ LO
4i ....
- -- E
'1; U0U,9

-. .--. ..... .,...lin
SC14
4)
" N -. 7z" 0-
- U-
0)
- /
IQ
E111 111 111 r,1 1 1 11 1 I I r I I I I iI I I I I F
o U*) 0 LO 0 U) 0 U) 0 U-)E2to4- 4 U U-) to to 0- N-
(M IN

* U)
TxC
U) 0 n*O r
0)
U-

CL CL
ticEl! :0,= V,C.-C0u
0CLoCLC)0U-)
0C)C-)
C)C)
N9
0 Cin
-J110 C()
0
Ix
Co
.1 U)
OD 0 E
on0IL 0

*1~~~ --.---.-.... - -----. .
tI- 1*P~cm
(C2
40
Jk 0~ 0
aa)7 (
A-1 Lt4 '11 COIA
C 00
(IIL

CUL
E-* i. .
S. 1M!
V. .1EC
LO 0
(M V4 '1)U1jA

________ I ~-
Elf)k~i~. ci
T)r .,*7i 1z.
-I."
~;'~'E a)
o CoTp,)
0
A) l~ -j opA1
U.i

0
Xf W'- 06
P 0S0 .z
I9 E
Mll w'wL
-c-.

11 rW
Z ',
All t
t~~C'c
-ka
20
0~ -
CLo
**o to to
'(M 8y '3-'.)
-0j 1
0.

Ai Ui
'2 .
CU~ Z- ~ * ~
Y:.TD
(D* ID y**
*ooMJV '11 UOI AG
:iI LL

0 (
0 00inl -i 2
0) 0)L 0.
-D V) 0
2 L
C)Cu0
00
0 q00
MAIN SHPCANL -w
-0 CDI01 _ _ _) '

-, ?77.-- .
0 0 U' 0 (
II II"0
C,~ 0C l~ ~,* ~s o
(MUV '1) OIeA1

- 7..
p
0) -)
4-E I'-
I 0
I~y.'~L0

I7IL-- 0
Tr. 7- 0 7 r-r -
0o to___ 00.. n 0 LOto n to ~ . to ' to o.)
NM I 'fl1) U0(Aj
____ I
.. ... .............

1C1
j"j
L4 f1h
el 0
C
C LO 00o0 LO 0
I--

r0
CI
0 '01
QCD a.0 G
I U.

*I W-1
cc4-J
3o 4~ ,~! s, A
~) 0CC
.. .. 4. cc.
E0
(M V4 '11 U IA93cc

- -
, ,-.. ..~y~flIY>
- ''V,.. .JINV
- .>N
'F' f.Y
9 W.,. -
_____ ____ ____ ____ ____ *Y)
C, CqO~
,etc~tt
~\ *f ~ Q 4.
-Co
0 to. e'tj0 t 0 %
U) in (D t '.- 0 00 O
I f
(M-1 V '41) UO11A9I9IL

0 4 )~ ~ ->
a, - ~>aLt;
4-0 x 0
L4-
I 8
rq~Ir
0 n 0 n 0 In 0 In 0
(MI Vy '14) U01leAG13

z!
0a 0 I I A
AMA
L .n CO
~ . 2
0, 0
""o 0
a r_
. I
Z El- K
22
° Cu
o *0
0 0c O
ii.)
° g°•.n

(M1lIN '41) UOIIUA913
0C> 0 60 0 U) 0 LO C) U)
LOI In (D Io I
'N
2 j)
-E rL.. =LO
- .4zlL.~E
2~) ~j~0) I
Ap

0
4,A
5-j!-J
I t
(M Vy A '1)U 1' A 1,..f..- U.

- --- 4-
~~WIA
- A. c.
to 0o (
C .IUW$!fPT1'

a z
W~ CL
00
1
0M 0
C13
0, 00
0 0
o q Z1))
oCcf
2 -
____ ___ ___ ___ ___ ____ ___ ___ ___ ___ A2

"I"IW
C'
-~ 0
E L
o to 13') 0
CM~ '11 ;, jeA1

CLa,
C3 wC c<0
to
00LI)
-- 7 /-7 CN
000
0Lq0
u0 c0 00 (f) (DIx
02CIO I
vn0) 0LL0 o rDU. Ln L. Ie-
0
90a:0m O)w
OD
0. 13C -0 :04
12
2 CO)c
.2ex
CN WZz Ij . I r ! 9-
CE W* za w
0 maM
0 le w0
om

44
3 Z9
2 c
'44-
60.
.I434.. '*.-i*.LL

0
o T ~
LO 0 C
0 -J o
0m c
So a
->1 04 041- C. ._"
) CI
S~~MAIN SHIP CHANNEL -
-0 In0) >

C44
4.4
0
~~ ---------w

IU-~L _j~- --
Out) x
IW
0
00
.00
wolf32Uz-Ul
C'4L
In00c

444
0@
cm.
JJ C
If) -ýt.-

r4 FA
4"
* 4.4
4.w
r4
I';;WIN
.....-...

I~~~I - - -- .-
- I
lb ~
z LD
to
a c
401,
0

Ito
so4
wo I

-I-
0 IV
* i*r
'ill. * UN I

155a6
PS- o - 9
ir vI v. 6 -J v
ca al 0 2~
CI C4 Ni 44 44 C4 ( 4
II~0 Q S AS C
0OE
In - -0 _ _
o ri ci ~ 5

I
Table 2Density Range versus Basic Marine Sediment Description
Density Range toiam3 1 Sediment D. diption
1.0-1.4 Muds. Clay - Silty Clay
1.4 - 1.6 Clayey Silt - Sandy Silt
1.6- 1.8 Clayey, Silty Sands
1.8 - 2.2 Sands (Loose or Compacted), Moderate to Stiff Cloy, Glacial Till
> 2.2 Stiff Clay. Cemented Sand, Rock, Shells

Table 3Volumetric Estimates of Marine Sediment Above Dred ing Limits
Loosely Stiff. Cohesive Rock. Gravel.Compacted Clay/ Sandy and TINSediment Material Material Total
Prfoect Area lydeI) (ydl lyd3} lyd3 )
Mystic River 105.700 530,200 14,600 650,500
Inner Confluence 175,700 221,400 31,500 428,600
Area1
Chelsea River 185.400 234,800 0 420,200
Reserved 111,900 311,100 33,500 456,500
Channel
Total Iyd 3) 578,700 1,297,500 79.600 1,955,800
1 Volumetric estimates do not include the approximate 229,400 yd3
of sediment material
to be removed during the proposed channel widening along the eastern side of the Inner
Confluence Area

Appendix AMystic River PositioningInformation
SAppam cx A htic River Poesioning Information AlI,

MYSTIC RIVER, BOSTON HARBOR, MAWES Survey Line MPOl
Direction: N 82 WElevation
File Easting Northinit (ft. MLW)
050 722275 505021 -36.1053 722089 505090 -36.2060 721845 505135 -36.5063 721605 505151 -38.7070 721367 505184 -38.8073 721126 505210 -38.6080 720887 505255 -38.5090 720429 505322 -37.8093 720203 505354 -37.7100 719974 505389 -37.1103 719742 505415 -37.8110 719511 505454 -38.3113 719277 505486 -38.4120 719049 505511 -36.5123 718821 505558 -35.5130 718593 505586 -36.3133 718361 505618 -37.1140 718139 505661 -37.0143 717909 505688 -37.0150 717676 505720 -36.6153 717443 505732 -35.9160 717204 505775 -36.0163 716967 505835 -26.4170 716726 505870 -27.5173 716481 505894 -28.9
MYSTIC RIVER, BOSTON HARBOR, MAWES Survey Line MP02
Direction: S 82 E
ElevationFile # Easting Northing (ft, MLW)
000 716435 506068 -34.0003 716531 506102 -35.5010 716759 506076 -34.9013 716984 506027 -35.4020 717218 505988 -35.9023 717465 505957 -37.4030 717702 505926 -38.2033 717938 505884 -39.9040 718182 505848 -38.3043 718438 505824 -37.6
A2Appendix A Mystic River Positioning Inforrnmiton

MYSTIC RIVER, BOSTON HARBOR, MAWES Survey Line MP02 (cont.)
Direction: S 82 EElevation
File # E Northiniz (ft. MLW)
050 718674 505782 -36.4053 718900 505752 -38.4060 719148 505708 -37.1063 719409 505674 -37.5070 719646 505638 -38.9073 719881 505600 -38.0080 720108 505575 -37.7083 720328 505521 -37.3090 720561 505489 -37.3093 720798 505453 -37.8100 721045 505410 -34.9103 721286 505388 -36.8110 721521 505358 -37.2113 721766 505317 -37.5120 722000 505276 -37.2
MYSTIC RIVER, BOSTON HARBOR, MAWES Survey Line MP03
Direction: S 82 EElevation
File # Easting NorthinK (ft. MLW)
003 716335 506272 -35.5010 716530 506284 -35.4013 716737 506277 -35.8020 716936 506243 -35.5023 717152 506174 -35.0030 717361 506124 -38.5033 717599 506120 -39.1040 717790 506112 -39.4043 717985 506146 -39.3050 718174 506043 -37.4053 718371 505987 -37.1060 718607 505961 -38.9063 718784 505925 -37.4070 718986 505912 -37.0073 719180 505891 -38.3080 719381 505878 -37.0083 719576 505842 -38.3090 719771 505795 -39.5093 719953 505742 -39.3100 720123 505698 -36.1103 720301 505631 -37.7
Appendix A Mystic iver Positoning Informtion A3I.

MYSTIC RIVER, BOSTON HARBOR, MAWES Survey Line MP04
Direction: N 82 WElevation
File# Eastin2 Northinm (ft. MLW)
000 719964 505829 -38.4003 719775 505917 -43.9010 719571 505962 -42.7013 719351 506005 -40.7020 719149 506056 -41.1023 718933 506092 -38.0030 718715 506065 -36.0033 718508 506062 -36.2040 718302 506087 -37.0043 718095 506125 -37.5050 717893 506161 -37.9053 717697 506208 -38.7060 717530 506306 -41.7063 717317 506351 -38.8070 717109 506375 -34.4073 716937 506380 -35.9080 716751 506439 -36.5083 716547 506475 -35.2090 716359 506499 -35.6093 716359 506499 -35.6
MYSTIC RIVER, BOSTON HARBOR, MAWES Survey Line MP05
Direction: S 82 EElevation
File # Eastin Northing (ft, MLW)
000 717165 506166 -38.1003 717298 506114 -38.4010 717435 506061 -38.6013 717645 506047 -37.6020 717868 506010 -39.1023 718081 505974 -39.9030 718257 505927 -38.0033 718484 505912 -36.6040 718701 505873 -37.4043 718910 505844 -36.7050 719118 505813 -37.2053 719327 505782 -37.6060 719538 505754 -38.7063 719752 505722 -39.5
A4 Appendix A Mystic River Positioning Infomisiton

MYSTIC RIVER, BOSTON HARBOR, MAWES Survey Line MP06
Direction: N 82 WElevation
ile Easting Northing (ft. MLW)
000 720037 505494 -39.2003 720096 505446 -39.1010 719940 505526 -38.3013 719738 505533 -38.1020 719543 505555 -38.7023 719343 505571 -38.7030 719143 505614 -37.1033 718948 505637 -37.5040 718752 505663 -36.3043 718542 505700 -37.5050 718336 505730 -38.3053 718133 505761 -37.2060 717928 505800 -38.4063 717715 505856 -36.9
MYSTIC RIVER, BOSTON HARBOR, MAWES Survey Line MP07
Direction: N 82 WElevation
File * Eastinp Northing (ft, MLW)
000 722112 504859 -39.7003 721903 504915 -37.6010 721658 504937 -38.5013 721413 504963 -39.5020 721167 505006 -38.4023 720923 505042 -38.6030 720679 505081 -38.3033 720448 505104 -39.5040 720226 505141 -39.5043 720004 505183 -38.4050 719752 505211 -39.2053 719526 505240 -40.3060 719294 505283 -39.4063 71904 505323 -36.6070 718808 505357 -36.9073 718572 505378 -36.7080 718328 505426 -36.7083 718089 505468 -36.7090 717842 505506 -37.1093 717594 505527 -39.2
Appudix A Myst Rkwr Peddooft knfomffim A5

MYSTIC RIVER, BOSTON HARBOR, MAlWES Survey Line MPO8
Direction: S 82 EElevation
File # Easting Nothn (ft. MLW)
000 717658 505317 -36.5003 717871 505279 -35.7010 718087 505274 -36.5013 718315 505230 -36.3020 718540 505185 -35.4023 718767 505164 -34.7030 719001 505130 -37.1033 719224 505096 -36.1040 719452 505065 -38.1043 719677 505025 -37.6050 719906 504983 -36.8053 720132 504946 -41.4060 720320 504944 -39.0063 720527 504902 -39.2070 720751 504865 -39.3073 720988 504840 -40.3080 721209 504799 -40.9083 721430 504764 -35.0090 721652 504743 -37.7093 721875 504711 -25.0
MYSTIC RIVER, BOSTON HARBOR, MAWES Survey Line MP09
Direction: N 82 W
ElevationFile Eastina Ngrthing (ft. MLW)
000 720605 504869 -38.2003 720413 504877 -40.4010 720202 504855 -42.2013 720014 504838 -39.2020 719819 504859 -37.9023 719623 504883 -36.1030 719416 504914 -37.6033 719217 504936 -36.7040 719013 504959 -35.8043 718811 504986 -33.8050 718632 504991 -33.5053 718395 505040 -34.0060 718195 505083 -34.6063 717996 505110 -35.9070 717798 505137 -37.3073 717605 505163 -38.1
A6 Appendix A Mystic River Positioning Informmiton
1A i

Appendix BInner Confluence AreaPositioning Information
B1Appuldi 3 kw Confhoem Am Positinng Infomotion

INNER CONFLUENCE AREA, BOSTON HARBOR, MAWES Survey Line IPO1
Direction: S 35 EElevationFle*N ng (fft, bm
000 722453 504954 -36.0003 722592 504818 -38.4010 722756 504703 -37.4013 722887 504552 -37.2020 722963 504350 -38.2023 723025 504160 -37.1030 723063 503934 -37.6033 723114 503707 -35.0040 723178 503553 -35.7043 723178 503553 -35.7
INNER CONFLUENCE AREA, BOSTON HARBOR, MAWES Survey Line IP02
Direction: N 30 W
ElevationSEating Northing
000 723096 503471 -36.4003 723038 503428 -37.4010 722981 503643 -40.2013 722885 503884 -44.3020 722745 504090 -39.8023 722624 504330 -39.8030 722535 504578 -40.5033 722368 504772 -41.7040 722248 504994 -36.5043 722234 505008 -36.9
02APPedx 8 Iner Confl•ome Area Poefienng rmeweln
I I I I- III I I I I II I

INNER CONFLUENCE AREA, BOSTON HARBOR, MAWES Survey Line IP03
Direction: S 30 EElevation
File* Easting Northing (ft. MLW)
000 722191 504942 .- 39.2003 722172 504913 -40.2010 722225 504780 -41.0013 722345 504553 -39.7020 722467 504320 -38.8023 722604 504089 -39.8030 722764 503827 -43.4033 722892 503573 -43.8040 723003 503350 -38.9043 723003 503350 -38.9
INNER CONFLUENCE AREA, BOSTON HARBOR, MAWES Survey Line IP04
Direction: N 60 WElevation
File# Easting Northin• (ft. MLW)
000 722973 503053 -40.2003 722917 503031 -42.8010 722873 503242 -43.9013 722765 503456 -42.4020 722652 503676 -43.1023 722530 503904 -41.8030 722404 504134 -36.9033 722267 504348 -38.8040 722157 504567 -35.5043 722048 504734 -38.2
Appendix 8 kun Cwiuo c. Arm PoshlonkV Intomwton B3
-L- -- . .- '-~ .

INNER CONFLUENCE AREA, BOSTON HARBOR, HAWES Survey Line IP05
Direction: S 25 EElevation
SE Northing (ft. MLW)
000 722194 504405 -37.8003 722233 504318 -37.7010 722303 504099 -34.2013 722415 503845 -39.6020 722515 503599 -43.2023 722665 503387 -43.6030 722746 503176 -42.4033 722890 502961 -42.8
INNER CONFLUENCE AREA, BOSTON HARBOR, MAWES Survey Line IP06
Direction: N 60 EElevation
File# Eastina Northing (ft. MLW)
010 722477 504318 -40.7013 722616 504418 -39.9020 722788 504502 -38.3023 722954 504611 -37.2030 723127 504703 -41.5033 723298 504787 -40.1040 723461 504885 -40.0043 723648 504984 -40.0050 723816 505087 -41.3053 723990 505193 -40.6
S4 Appendix 8 Inner Confluence Area Positioning Information
I'

INNER CONFLUENCE AREA, BOSTON HARBOR, MAWES Survey Line IP07
Direction: S 60 WElevation
SEastin Northin(ft. MLW)
000 723839 505232 -35.5003 723782 505195 -34.8010 723635 505111 -36.9013 723434 504967 -37.8020 723254 504883 -35.5023 723039 504801 -40.5030 722842 504724 -37.4033 722664 504601 -39.0040 722518 504466 -40.2043 722455 504430 -39.6
INNER CONFLUENCE AREA, BOSTON HARBOR, KAWES Survey Line !P08
Direction: N 30 E
ElevationFile# Eastinz Northin• Ift. MLW)
000 722299 504412 -37.3003 722303 504431 -38.0010 722439 504524 -41.2013 722586 504624 -39.7020 722732 504721 -37.4023 722889 504799 -38.2030 723048 504876 -37.9033 723208 504950 -33.1040 723348 505032 -33.8043 723494 505105 -33.7050 723646 505194 -34.2053 723791 505262 -34.4
App.dxB InnrCoenflunoe Ar Poetioninginfomnnion B5

INNER CONFLUENCE AREA, BOSTON HARBOR, MAWES Survey Line IP09
Direction: S 60 WElevation
File* Eastina Northina (ft. MLW)
000 724024 505135 -35.6003 723963 505046 -34.5010 723787 504936 -36.5013 723586 504870 -37.8020 723423 504761 -37.5023 723232 504633 -40.3030 723011 504520 -39.8033 722794 504399 -38.6040 722596 504279 -40.4043 722429 504195 -38.3
INNER CONFLUENCE AREA, BOSTON HARBOR, MAWES Survey Line IP10
Direction: N 60 EElevation
File# Eastina Northing (ft, MLW)
000 722417 503966 -39.5003 722439 503969 -39.2010 722528 504086 -39.2013 722654 504217 -41.2020 722787 504281 -39.9023 722946 504380 -38.2030 723109 504484 -38.0033 723242 504541 -38.2040 723386 504607 -35.2043 723538 504679 -33.0050 723678 504776 -19.5053 723678 504776 -19.5
B6 Appendix B Inner Confluence Area Positioning Information

INNER CONFLUENCE AREA, BOSTON HARBOR, MAWES Survey Line IP1I
Di.rection: S 60 WElevation
File# Easting Northina (ft. MLW)
000 723642 504750 -28.7003 723616 504719 -32.0010 723509 504587 -32.3013 723329 504502 -36.3020 723141 504382 -38.4023 722960 504262 -38.0030 722777 504153 -39.9033 722584 504071 -39.3040 722402 503993 -37.2043 722402 503993 -37.2
INNER CONFLUENCE AREA, BOSTON HARBOR, MAWE. Survey Line IP12
Direction: N 60 EElevation
File# Easting Northinz (ft, MLW)
000 722330 503777 -39.9003 722400 503771 -41.5010 722501 503860 -43.7013 722603 503980 -38.1020 722752 504050 -39.5023 722916 504120 -37.9030 723066 504197 -37.6033 723197 504291 -37.1
INNER CONFLUENCE AREA, BOSTON HARBOR, MAWES Survey Line IP13
Direction: S 60 W
ElevationFile* Eastina Northing (ft. MLW)
000 723252 504206 -35.2003 723121 504104 -36.5010 722912 504045 -39.1013 722687 503949 -39.6020 722473 503837 -41.2023 722368 503749 -37.5
Appendix B Inner Confluence Ame Po~ioning Infomotion 67

INNER CONFLUENCE AREA, BOSTON HARBOR, MAWES Survey Line IP14
Direction: S 60 EElevation
File# Easting Northing (ft. MLW)
050 722493 505032 -36.2053 722687 504950 -36.8060 722909 504890 -38.0063 723092 504763 -41.3070 723267 504645 -39.8073 723382 504526 -35.7
INNER CONFLUENCE AREA, BOSTON HARBOR, MAWES Survey Line IPI5
Direction: N 25 EElevation
File* Easting Northing (ft, MLW)
000 723210 503812 -34.7003 723250 503891 -35.7010 723325 504104 -34.0013 723394 504264 -27.8020 723456 504431 -32.3023 723559 504590 -32.8
INNER CONFLUENCE AREA, BOSTON HARBOR, MAWES Survey Line IP16
Direction: S 10 WElevation
File# Eastinz Northing (ft, MLW)
050 723288 503583 -30.2053 723239 503348 -35.2060 723207 503095 -36.0063 723153 502856 -35.6070 723195 502600 -35.2073 723195 502600 -35.2
B8 Appendix B Inner Confluence Area Positioning Information
L .

Appendix CChelsea River PositioningInformation
Appendix C Chdale. River Poeitioling Information c

----. mn -•.- .- In-.-.-.
CHELSEA RIVER, BOSTON HARBOR, MAWES Survey Line CPO1
Direction: S 10 WElevation
File Eastin Northina (ft. MLW)
013 730614 509050 -39.3020 730533 508839 -39.6023 730465 508692 -37.6030 730414 508507 -38.7033 730408 508342 -38.1040 730412 508174 -38.0043 730389 507998 -38.6050 730358 507819 -38.6053 730354 507656 -38.5060 730353 507479 -39.5063 730333 507303 -36.5
CHELSEA RIVER, BOSTON HARBOR, MAWES Survey Line CP02
Direction: N 08 EElevation
File# Eastinz Northiny (ft. MLW)
000 730383 507439 -37.1003 730422 507537 -38.5010 730481 507756 -41.0013 730531 508020 -38.6020 730560 508272 -35.4023 730629 508524 -37.3030 730718 508764 -38.1033 730745 509015 -38.8040 730780 509223 -39.9043 730780 509223 -39.9
C2 Appendix C Chelsea River Positioning Information1 '

CHELSEA RIVER, BOSTON HARBOR, MAWES Survey Line CP03
Direction: S 05 WElevation
Fie Eatn Northinr (ft. MLW)
000 731155 509910 -37.9003 731031 509827 -38.0010 730890 509693 -37.0013 730874 509458 -38.9020 730879 509259 -40.2023 730869 509055 -39.3030 730858 508847 -38.5033 730858 508847 -38.5
CHELSEA RIVER, BOSTON HARBOR, MAWES Survey Line CP04
Direction: S 05 W
ElevationFilef Easting Northina (ft. MLW)
000 731118 509821 -38.1003 731085 509672 -37.7010 731089 509460 -38.8013 731077 509243 -37.7020 731062 509035 -38.7023 731044 508912 -36.1
CHELSEA RIVER, BOSTON HARBOR, MAWES Survey Line CP05
Direction: S 10 EElevation
File# Easting Northing (ft. MLW)
000 731202 509707 -37.3003 731259 509665 -39.0010 731305 509476 -39.6013 731290 509258 -37.8020 731278 509146 -38.9023 731278 509146 -38.9
.pwd C Cchdo" Mw Poidnglnfonrsto C3

CHELSEA RIVER, BOSTON HARBOR, MAWES Survey Line CP06
Direction: SouthElevationFile* Estin Northine (ft. MLW)
000 731387 509649 -19.5003 731461 509401 -32.7010 731490 509186 -39.9013 731383 508976 -39.1
CHELSEA RIVER, BOSTON HARBOR, MAWES Survey Line CP07
Direction: S 08 WElevation
File# Easting Northing (ft. MLW)
000 730962 509684 -37.0003 730888 509726 -36.2010 730721 509626 -36.4013 730703 509367 -40.5020 730676 509134 -38.8023 730658 508900 -39.2030 730641 508669 -38.8033 730597 508464 -35.3040 730564 508249 -38.2043 730556 508025 -38.7050 730541 507804 -38.2053 730518 507575 -37.7060 730499 507372 -36.6063 730499 507372 -36.6
CHELSEA RIVER, BOSTON HARBOR, MAWES Survey Line CP08
Direction: S 08 W
ElevationFile# E Northing (ft. MLw)
053 730424 509114 -34.7060 730331 508921 -19.1063 730287 508747 -1.5070 730320 508608 -5.2073 730334 508406 -32.3
C4 Appendix C Chelsea River Pouitionrng Informationf .•-
i • • -

CHELSEA RIVER, BOSTON HARBOR, MAWES Survey Line CP08 (cont.)
Direction: S 08 WElevation
Fie Esti Northina (ft. MLW)
080 730235 508134 -35.4083 730228 507909 -35.7090 730223 507685 -36.3093 730182 507458 -35.5100 730141 507219 -40.0103 730128 506985 -39.1
CHELSEA RIVER, BOSTON HARBOR, MAWES Survey Line CP09
Direction: S 33 WElevation
File# Easting Northing (ft. MLW)
000 730337 507339 -35.8003 730213 507161 -40.4010 730071 506985 -37.6013 729956 506782 -38.8020 729866 506580 -39.8023 729728 506399 -40.7030 729593 506212 -40.8033 729488 505999 -40.3040 729371 505802 -40.1043 729247 505606 -39.6
CHELSEA RIVER, BOSTON HARBOR, MAWES Survey Line CP10
Direction: S 31 WElevation
File# astng Northing (ft. MLW)
000 730357 507336 -35.6003 730433 507302 -37.3010 730346 507091 -38.6013 730190 506897 -37.6020 730080 506670 -38.9023 729946 506456 -35.7030 729803 506255 -35.5033 729689 506042 -37.2040 729565 505850 -39.5043 729436 505675 -37.1
Appe'ix C Chdimeivew Pewonb lnfonmfton C5

CHELSEA RIVER, BOSTON HARBOR, KAWES Survey Line CPll
Direction: S 33 WElevation
L Etinz Northinp. (ft. MLW)
000 730476 507389 -36.4003 730496 507164 -6.1010 730383 506921 -0.8013 730268 506730 -4.2020 730153 506541 -4.2023 730024 506357 -12.6030 729914 506167 -34.7033 729804 505979 -36.6040 729662 505802 -37.3043 729662 505802 -37.3
CHELSEA RIVER, BOSTON HARBOR, MAWES Survey Line CP12
Direction: S 35 WElevation
File* Eastine Northini (ft, MLW)
000 730184 507448 -38.8003 730242 507594 -39.3010 730179 507368 -40.1013 730077 507166 -37.9020 729930 506964 -33.9023 729783 506749 -31.6030 729641 506538 -31.1033 729447 506334 -42.1040 729322 506120 -40.4043 729222 505888 -39.0050 729130 505679 -39.2053 728973 505531 -35.7060 728798 505401 -36.4063 728627 505363 -37.2
C6 Appendix C Chelsea River Positioning InformaionIL. ...- _._ _

CHELSEA RIVER, BOSTON HARBOR, MAWES Survey Line CP13
Direction: S 30 WElevation
File. Eastina Northing (ft. MLW)
000 729327 506118 -40.4003 729215 506064 -41.6010 729088 505928 -42.2013 728987 505751 -29.3020 728925 505574 -30.3023 728764 505414 -36.6
CHELSEA RIVER, BOSTON HARBOR, MAWES Survey Line CP14N (North Toe of Channel)
Direction: Towards McArdle Bridge
ElevationFile* Eastin•i Northing (ft. MLW)
000 728643 505391 -36.7003 728643 505391 -36.7010 728461 505273 -36.1013 728326 505153 -33.5020 728176 505051 -33.7023 728041 504944 -34.0030 727888 504858 -30.3033 727730 504778 -34.7040 727565 504727 -32.7043 727395 504706 -33.8050 727226 504712 -35.9053 727077 504734 -33.1060 726910 504752 -37.6063 726782 504722 -30.8070 726699 504743 -29.8073 726613 504791 -27.6080 726529 504839 -25.4083 726554 504934 -20.0
€ € m C7App'd C ho w'dt nout

CHELSEA RIVERi, BOSTON HARBOR. MAWE'ES Survey Line CF14S (South Toe of Channel)
Direction: Towards McArdle BridgeElevation
Fie* Estinr Norhing (ft. LW)
100 728407 505294 -38.7103 728642 505316 -40.9110 728557 505132 -34.2113 728420 505052 -41.4120 728290 504956 -39.6123 728155 504849 -39.6130 728018 504737 -38.6133 727857 504623 -38.1140 727698 504593 -37.7143 727538 504586 -38.4150 727378 504553 -37.1153 727218 504547 -37.6160 727057 504570 -36.8163 726893 504608 -38.8170 726740 504605 -38.7173 726740 504605 -38.7
CHELSEA RIVER, BOSTON HARBOR, MAWES Survey Line CP15N (North Toe of Channel)
Direction: Towards McArdle BridgeElevation
File Easting Northing (ft, MLW)
Positioning Data Unavailable
CHELSEA RIVER, BOSTON HARBOR, MAWES Survey Line CP15S (South Toe of Channel)
Direction: Towards Chelsea Street BridgeElevation
Fie Easting Northint (ft, MLW)
Positioning Data Unavailable
CS Appendix C Chelbee RiW' Pfoetdng Infommien

Appendix DReserved ChannelPositioning Information
Appuix D Rse wWvs d C el klonin Infom ,n D1
_______________

RESERVED CHANNEL. BOSTON HARBOR, HAWES Survey Line RPOl
Direction: N 50 WElevation
File# Eastina Northing (ft. NIW)
003 732779 489325 -37.2010 732607 489470 -36.2013 732450 489612 -36.7020 732284 489751 -36.1023 732131 489880 -35.6030 732003 489991 -37.8033 731770 490214 -38.6040 731620 490323 -38.2043 731437 490487 -37.4050 731265 490637 -38.7053 731103 490780 -41.1060 730937 490920 -37.6063 730775 491078 -37.6070 730590 491237 -35.7073 730465 491325 -35.4080 730473 491323 -35.3083 730473 491323 -35.3
RESERVED CHANNEL, BOSTON HARBOR, MAWES Survey Line RP02
Direction: S 50 EElevation
File* Eastin% Northin2 (ft, MLW)
000 730555 491296 -34.5003 730562 491294 -34.4010 730675 491270 -35.7013 730899 491125 -38.4020 731098 490994 -40.3023 731271 490809 -39.3030 731465 490661 -36.6033 731678 490512 -37.1040 731790 490363 -38.2043 '31931 490182 -37.0
D2 Appendix D Reserved Channel Postioning Information
t

RESERVED CHANNEL, BOSTON HARBOR, MAWES Survey Line RP04
Direction: S 50 E
ElevationFile* Basting Northint f.pW
000 730164 491036 -41.7003 730303 490869 -42.1010 730488 490735 -42.4013 730672 490602 -41.9020 730830 490434 -41.5023 730995 490263 -42.1030 731184 490121 -43.1033 731359 489946 -43.9040 731525 489819 -43.9043 731703 489657 -44.0050 731882 489510 -44.4053 732058 489335 -44.2060 732253 489183 -44.6063 732451 489012 -44.6
RESERVED CHANNEL, BOSTON HARBOR, MAWES Survey Line RP05
Direction: N 50 WElevation
File# Eastjng Northiny (ft. MLW)
000 732778 488906 -42.3003 732710 488992 -41.3010 732548 489151 -38.8013 732379 489280 -40.8020 732228 489435 -39.4023 732049 489577 -41.5030 731887 489738 -39.7033 731711 489891 -40.7040 731525 490024 -40.3043 731346 490164 -39.7050 731169 490300 -38.9053 731006 490421 -38.4060 730840 490577 -38.3063 730674 490699 -38.4070 730512 490775 -37.0073 730364 490768 -37.5080 730215 490673 -35.8083 730215 490673 -35.8
App dMix 0 Rum d Cham, Paeo.fti•nin •Ifmm D3
- -.. ..-.......- - - -

RESERVED CHANNEL, BOSTON HARBOR, MAWES Survey Line RP06
Direction: S 50 E
ElevationFi.e.g.a Northig (ft. MLW)
000 730486 491346 -34.1003 730518 491420 -33.9010 730550 491492 -33.8013 730582 491566 -33.6020 730770 491479 -31.9023 730899 491326 -32.8030 731069 491207 -33.4033 731247 491031 -37.0040 731415 490907 -35.1043 731586 490743 -34.3050 731765 490596 -37.1053 731961 490445 -38.206a 732127 490284 -35.9063 732310 490145 -33.3070 732488 489992 -33.4073 732669 489815 -37.0080 732838 489679 -37.1083 732838 489679 -37.1
RESERVED CHANNEL, BOSTON HARBOR, MAWES Survey Line RP07
Direction: N 50 WElevation
File# Easting Northinm (ft. MLW)
000 732878 489138 -37.8003 732749 489137 -38.7010 732601 489276 -38.6013 732444 489428 -37.9020 732281 489566 -38.4023 732103 489707 -38.3030 731934 489849 -38.7033 731769 490011 -39.4040 731581 490147 -39.3043 731418 490299 -38.7050 731264 490453 -37.3053 731064 490595 -37.6060 730918 490745 -38.2063 730747 490891 -38.1070 730547 491066 -37.2073 730385 491207 -35.7
D4Appendix D Reserved Channel Poatmoning Informntion

RESERVED CHANNEL, BOSTON HARBOR, HAWES Survey Line RP08
Direction: S 50 EElevation
File Eastn Northiny (ft. MLW)
110 733070 489692 -23.0113 732932 489790 -35.9120 732783 489911 -34.7123 732653 490032 -34.3130 732495 490185 -34.0133 732333 490317 -34.2140 732156 490455 -33.2143 731997 490599 -18.9150 731837 490733 -14.8153 731683 490860 -29.0160 731520 491008 -29.5163 731342 491147 -34.6170 731185 491295 -32.6173 731011 491437 -30.9180 730869 491574 -28.9183 730772 491585 -29.0
RESERVED CHANNEL, BOSTON HARBOR, HAWES Survey Line RP1O
Direction: West
ElevationFile# Eastin. Northing (ft. MLW)
000 730781 490471 -42.1003 730539 490477 -42.4010 730297 490479 -42.2013 730048 490512 -41.1020 729815 490485 -39.9023 729572 490489 -36.1030 729342 490472 -34.4033 729189 490462 -33.7
AppeNdix0 ft Rs• CeweWl Polt ie fwemn D5
I. I

RESERVED CHANNEL, BOSTON HARBOR, MAWES Survey Line RP11
Direction: EastElevation
File* Easting Northing (ft. MLW)
000 729239 490374 -33.1003 729427 490337 -34.7010 729633 490404 -36.7013 729871 490411 -38.8020 730100 490388 -40.8023 730328 490387 -41.8030 730576 490410 -42.5033 730837 490402 -41.2040 731092 490388 -40.6043 731252 490398 -37.3
RESERVED CHANNEL, BOSTON HARBOR, MAWES Survey Line RP12
Direction: WestElevation
File# Easting Northina (ft, MLW)
000 731282 490276 -39.2003 731289 490245 -39.7010 731297 490213 -40.2013 731064 490231 -42.4020 730828 490212 -42.4023 730583 490220 -42.6030 730323 490218 -42.0033 730098 490202 -39.7040 729847 490183 -33.2043 729584 490187 -29.2050 729337 490183 -28.5053 729307 490202 -28.4
D6 Appndix D Reserved Channel Positioning Information
.................

RESERVED CHANNEL, BOSTON HARBOR, MAWES Survey Line RP14
Direction: WestElevation
Fileh Eastin Northin• (ft. MLW)
003 731136 490050 -43.3020 730919 490084 -41.7013 730680 490067 -42.9020 730450 490053 -40.8023 730230 490051 -36.3030 730009 490046 -33.5033 729785 490029 -31.2040 729558 490034 -29.1043 729387 490028 -28.1
RESERVED CHANNEL, BOSTON HARBOR, MAWES Survey Line RP15
Direction: EastElevation
File# Easting Northinz (ft, MLW)
000 729252 489886 -33.3003 729361 489891 -30.0010 729628 489880 -31.5013 729905 489910 -33.2020 730199 489893 -34.1023 730498 489908 -37.7030 730796 489913 -43.2033 731084 489930 -44.6
D7Appendix D Reamvd Chwmnn P..Itio.*ig Information
†-- - - - - --. - -- - - . -

RESERVED CHANNEL, BOSTON HARBOR, MAWES Survey Line RP16
Direction: WestElevation
File* t N Ift. MLW)
000 731117 489784 -45.2003 730768 489772 -43.1010 730540 489765 -41.6013 730318 489753 -39.5020 730106 489748 -41.0023 729885 489735 -40.1030 729666 489738 -36.0033 729447 489718 -36.9040 729229 489724 -37.6043 729229 489724 -37.6
RESERVED CHANNEL, BOSTON HARBOR, MAWES Survey Line RP17
Direction: WestElevation
File# Easting Northing (ft. MLW)
050 730888 489520 -43.5053 731019 489531 -44.0060 731147 489542 -44.5063 731154 489548 -44.1070 730908 489570 -39.6073 730661 489558 -38.5080 730421 489557 -37.8083 730179 489547 -37.2090 729924 489546 -38.0093 729685 489533 -37.5100 729422 489527 -37.7103 729174 489509 -38.2
DASAppendix D Reserved Channel PositoninglInformation

RESERVED CHANNEL, BOSTON HARBOR, MAWES Survey Line RP18
Direction: WestElevation
File# Eastlng Northinx (ft. MLW)
013 731243 489419 -42.0020 731011 489423 -39.2023 730781 489417 -37.6030 730520 489405 -36.7033 730323 489400 -36.0040 730082 489399 -39.1043 729852 489386 -39.1050 729615 489386 -38.4053 729375 489376 -39.9
RESERVED CHANNEL, BOSTON HARBOR, MAWES Survey Line RP19
Direction: West
ElevationFile# Eastink Northing (ft, MLW)
003 729459 489398 -39.3010 729260 489373 -40.4013 729066 489381 -41.0020 728857 489368 -39.5023 728639 489352 -41.9030 728433 489360 -43.7033 728232 489350 -44.2040 728023 489342 -42.4043 727812 489316 -42.2050 727616 489307 -42.4053 727420 489296 -44.6060 727191 489284 -36.5063 726987 489326 -31.9070 726783 489323 -33.5073 726569 489318 -33.0080 726350 489316 -33.9083 726130 489302 -33.6
AP.44mi D Ro owod Chennl P'o nken Intomamion D9
IL.e-.......

-- -
RESERVED CHANNEL, BOSTON HARBOR, MAWES Survey Line RP20
Direction: WestElevation
File* Ba ig Northinz (ft. MLW)
023 729247 489520 -40.8030 729036 489510 -42.3033 728824 489519 -38.8040 728614 489518 -38.9043 728406 489511 -39.9050 728185 489491 -38.8053 727961 489478 -36.7060 727750 489475 -36.4063 727541 489477 -38.3070 727331 489480 -36.0073 727110 489455 -33.0080 726883 489450 -32.9083 726666 489451 -33.4090 726438 489436 -34.0093 726207 489449 -34.5100 725980 489455 -34.5103 725980 489455 -34.5
RESERVED CHANNEL, BOSTON HARBOR, MAWES Survey Line RP21
Direction: WestElevation
File# Eastinn Northina (ft. MLW)
003 729183 489703 -36.8010 728978 489711 -36.2013 728761 489719 -36.2020 728566 489721 -37.3023 728332 489694 -34.8030 728117 489710 -35.2033 '27912 489721 -38.3040 727679 489633 -36.0043 727467 489639 -37.3050 727256 489646 -33.6
S053 727049 489638 -33.7060 726823 489636 -33.9063 726593 489627 -33.7070 726368 489611 -34.4073 726137 489630 -33.6
D10 Appendix D Reserved Channel Positioning Information
a1

RESERVED CHANNEL, BOSTON HARBOR, MAWES Survey Line RP22
Direction: WestElevation
* Easting Northint (ft. MLW)
000 729192 489831 -35.3003 729149 489850 -35.4010 728962 489866 -33.9013 728764 489844 -33.4020 728567 489857 -35.4023 728362 489863 -33.0030 728152 489863 -34.8033 727935 489802 -35.3040 727734 489756 -35.0043 727534 489743 -36.4050 727325 489744 -34.6053 727120 489748 -34.2060 726909 489751 -33.5063 726680 489741 -35.9070 726456 489728 -36.3073 726234 489808 -35.9080 726057 489777 -34.4083 726057 489777 -34.4
DD11

090 083 080 073 070 063 060 053 OO 043 040 0:33 030 023 020
-30
S-40
C -50 2o Date BDsemmt , Dtt B2',,,nt
-60 ........
-4 -........
I.-70
Mystic RiverWES Survey Line 4
a03 010 023 030 033 040 A3050)53 060 o63 070 073
0 00 03 06 06 *7 *7 8
-30___
~-40 00
-J /
-50 0. /a/ /B ..... /.. .+0 @ -50 F MLW z asmn
>t
60 -/or F,11-

F
CD
(330 02) 020 013 � o03 010 013 020 023 �3O o33 Q40 043 050 o53 o�000
0 0 * *
I
�-40 _________ -
- I -� � 2: _______
4- eeote-50
-- C*nt I a Doto B seMent I
GiL.A -60
D to Boser�ient-70 -- -,
I I_______________________ I ___________________
MyStic
WES Suwve
070 �73 080 083 090 o9� 100 i03* * 0 0 0 0
/.8.
�ee - /
// /. Dato
7 (£0
_ [-7�

3050 053 060 063 070 073 090 o83 090 093 loo 103 110 11 Lt 20 063 06)L)
L W W c c- 3 0
-40 -
LWt -50
Dota Dosement e-55 f t, MLW 0_____________ ____________ >
-60
-70
Mystic RiverS Survey Line 2
ED"
I-A BR

063 060 053 0Ot) 043 040) 03J 0'30 023 020 013 010 003 000
-30 -
A-40 1/7~' 1.--
4; / /s
-10
-70
% ~Mystic RiverWES Survey Line 6
MP04 60R3
7 MP06 FD-93--J--L

" !•,./"//1,---- - - -- 1--70
Mystic RiverW/ES Survey Line 3
00•003010 003 020 023 030 033 040 043 050 053 060 C
-30
-40 -. ..
DesiyRage(/co e / /
te+;-50 Dato Basemen-t /
0
> -60/
-70
Mystic RiverW/ES Survey Line 5
Density Ronge (g/cc) Notes
CM1.0 - 1.4 Rete.4 - ,.6 Using C
1.6 - 1'6 graveLEZ 1.6 - 1.8S1.8 - 2.2 The fu
> 2.2 nume1.8 - 2.4 A append
the su

• .. J _ _- -... S.- - _ --- •
MuP02Y3 MP05 "
MP03
3 o53 060 063
Mystic RverBoston, Mossachuset,
S.. ..----- - 13 , LEG EN Dl
19 NED Core Locaticns
E) WES Core Locaticns
/ Additional Anaoi.yi Location
Notes Horizontal Scole
I Relates to a distinct topographic feature on the seismic records. us.Using CENED Core Infornation, materal inclicative of rock,gravel. tilt, or other competent substrate.
The nu•bers 000, 003, 010, etc. represent seismic data record Vertical Exaggerationtnumbers. The positions of this data are presented in theoppendices of this report. The associated dots ilustratethe survey track of vessel.
_A

LO U. .)' B O R Imp -
Glu 1"0 QS3 BSR03s 0 (Xk
Cor Locti no
03 an ON~yi Loaton Ds anc (ft) t
0~ _____

MPO4 60R3MP04FD -93 -JMP06 FO-93-1
/1
• *• U. & Inner
ConfluenceArea
2000 2500
U.S.ARMY Corps Of EngineersWaQterways Experiment Station
Vicksburg, Mississippi
Dlesignedl by,
Drwn by,
IMS, Inc. Mystic RiverChocked by, Boston HQrkor, MA
Reviewed byy ScOW.e Shoot
1:600 Reference Rate I
Apro.ved Dye 7/15/93Draw "g Code'Sh .. of ._IQ_____________________

0i
173 170 163 160 153 150 143 140 133 130 123 120 113 110
-30
-40
-50
"Dato Basemeit P -50 Ft, ML
0 -60
________________Notes
Mystic Ri\WES Survey
093 090 083 080 073 070 063 060 053 050 04-
-30
-40 OF
+;
-10
Data Bus Imqnt
-60 r . .v . . .. , .
0Data Basement @ -e ft
-70
River P05/ ___jI

33 113 110 103 100 093 090 083 080 073 070 063 060 053 050
L. Data
IL L
_ _ _ Ri e
-e Line 1
040_ _____0003 03 2 20 03 00 0 0

073 070 063 060 053 050 043 040 033 030 023 020 013 010
-30
L43-
-40
-50
~ -50 Da~ta Basement Data Boserient
C-6
-0 /~-60
Mystic RiverWES Survey Line 9
EDISONPOLAIZE BOR4
--.. GGA FD-93-K
l ........ . .. .......I R

1-f
023 020 013 010 003 000
La See
ment s Notes
re9
BOR3i(
FD-93-JFD-93-1

Data Basement -5 ft 0
-70
MysticW/ES SurVE
000 003 , 013 020 023 030 033 340 043
-30
-40
-50 ... '...Data Basement I...s
-60 . .. .
Dc
-70
Mystic IWES S rve)
Density Range (p/cc) Notes
CM 1.0 - 1.4 u RetateiUsing C1.4 - 1.6 graveL,
1.6 - 1.81.8 - 2.2 The nui
S> 2.2 number1.8 - 2.4 a appendi
the su

,stic Riverý'urvey Line 7
,0 043 050 053 060 063 070 073 080 083 090 093
]• _ Mystic Riv
I- Boston, MassacA_ LEGEND
- NED Core Locatio:i
> ... -• •4) WES Core Location-
S...... Additipnal Analysis
~..........................S. . . . . . . . . . .
Doata Bsemet _ _
B(
tic River":rvey Line 8L J
,tes Horizontal ;ScaleRelates to a dlstinct topographic feature on the seismic records. 0 wUsing CENED Core Informatiom material Indicative of rock,grovet, tilt, or other competent substrate.
The numbers 000, 003, 010, etc. represent seismi'c data record Vertical Exaggeratione x 40numbers. The positions of this data are presented in theappendices of this report. The associated dots Illustrate
C the survey track of vessel.

080 li Iit3 13 t
MP0 a" 03O)I to S 3
Oij 03~a" eli on G
B0R5 MtC ~Mystic River FD-93-M 0
-Boston, Massachusetts
- EED0 500 1000 1500 2000 2500 009 NED .'ore Locations
LWES 'ore Locations 0 >ti ~Distance (ft) L
-9j Additional Analysis Locations C
Desip
-1zontal Scale
IaMPa ?It Draw
Exaggeroxtions x 40
Rvww

at 43 afta 01.3 010 a"~A
as MP07
0 Inner-*ý -- j -ConfluenceU C Area
U)0
U.S.ARMY Cor-ps [Of Engineer-sWaIter-ways Exper-iment Station
____________Vicksbour-g, MississippiDesignd by,
Drown bye
IMS, Inc. Mystic RiverChockd byeBoston H arboor, MA
Reviewed by# Scott$ Sheet
1:600 NumberC. Mate 2_____ _____ by eo 7./15/93
Draswing Code.
Shee- -t ...L. of~A

050 053 060 063 070 073
-30
-~-40
-j
Dat
Inner Conf luence Area.WVES Survey Line 14
00013 0200200 03000 033 040
-30
-40 9 ... .
-5..0.. .. .
Data Basement
L'- 6 0
-70

000003010 013 020 023 030 0 3 3 040
-30
-'-40
-50
S-60--------
-70
Inner Conf luence Area.
WES Survey Line 3
043 040 033 030 023 020 013 010 00300
-30
-40 0
4; -50- -
M 60 D
-70

000 003 010 0 0 30 070 063 060
-30 Tk-30
-4U -40
-o D cito serment _ 5 Eto Ba5 -505o.
>
___ __0_ 61 - 60
-70 -70
Inner Conftuence Area Inner ConFLLWES Survey Line 15 WES SurvE
_ -- FD-93-H
IPO14 FD 3-G•
River IP05\,
GomGVP - -" .,n"J . • "_ _ /, _ : .

I0
070 063 060 053 050
-30
j -40
-50o /Eata Basement+• I• -50 f't t4LW
6" -60
Inner Con.Ftuence AreaWES Survey Line 16
2:-
a to B Riverit
Ch Se
0" R_____er_

iiii~ -70 Data Basemient>- 170Inner Confluence Area
W/ES Survey Line 1
043 003040 033 030 023 020 013 010 '000
-30
-40
x
50ata
I•10- .4Uin E
o_ ; Base-a ment>
1.4 ,e--- 1. -ve.t
-60
-70 •
Inner Conftuence AreaWES Survey Line ,2
Densilty Range (g/cc1 Note_._s
7M 1.0 - 1.4S1.4 - 1.6 Using CEI"
S1.6 - 1.8 gravel. 1:
1 1.8 - 2.2The nubiSnumbers.
1.8 - 2.4 a oppendice
the survi

Inner Conftuence ArecQWES Survey Line 4
000003 010 013 020 023 030 033
• t .
-30
". Sh••C nnet-40 ..... .-..
A.W..
-5 . .. . .
>0 Data BQsement
-60
-70 Notes
Inner ConfLuence Area
WES Survey Line 5
Horizontal Scale
Relates to Q distinct topographic feQtureon the seismic records. so wo MUsing CENED Core Information, material indicative of rock,gravel, till, or other competent substrate.
The numabers 000, 003, 010, etc. represent selsnic data record Ver ticat Exaggeration, x 40iumbers. The positions of this data are presented In theappendices of this report. The associated dots Illustratethe survey track of vessel.

13 .- 93DO
/23 an IP16
• • ' •Inner 4
Distance (ft) E•. Additior.13
D----w n
SIMS, IPK,0 40 Inner
m vWmN by,
>I
7 prs~w4 byt
li-

FD-93-F
IP16
IP1 Cross -sectionSP02 ViewpointlP02 ( IP1S. 'P16)
IP04
flu Inner Confluence Areaas Boston, Massachusetts'GE LEGEND
Lc e0 NED Core Locations
An e Additional Analysis Locations
U.S.ARMY Corps IOF EngineersWaterways Experiment Station
Vicksburg, Mississippi
O.., toysInner C,_onfluenceIMS, Inc. Area.
C-n,-k " Boston Harbor, MASineid Somes Sievt
1:600 MPate 3_pp_8-4d Nor 7/15/93
b-v~ Codev I--Shet .3.. of .

000003 010 01J 020 023 030 033 040 043 050 053
-30 --
---.
ZaL• ~1.841S-40
"-50
Inner C nflBen emAent
SB a s e m e n e e n lS-60
-70
Inner" Conf luence Area
WES Survey Line 8
043040 033 030 023 020 013 010003000
-30
-40 L
-70 es / //• ,_ _
-50 Base
60
_ -70

043 040 033 030 023 020 013 010 003 000
-30 •
-,4
c 50 Da to a Dat aLSBasement -B~asement
Inner Confluence AreaWES Survey Line 9
00000210 013 020 023 030 033040 043 050
-30
-40SNotes,
-60 _
-70

010003010 013 020 023 O.JO 033
-30 !-- -
-40
-50
o_oo
-60
-70
Inner Confluence Area IrWES Survey Line 12
F'D-93-H I0!FD-93-G -
u~ 1P09
_ ) I1

023 0V0 013 010 003 000
0 0g
00
-30
-40-77
-50 4
d mn
-70
Inner Conftuence Area
WES Survey Line 13
- ChelseaRiver
*" P09p p

da n
-70
Inner Confluenc~e- AreaW/ES Survey Line 7
0/0 0 O'o o % Oo % 0o1 Oa Oo 0%50
-30
-40
-50
> Basement-6 0 .. . . " . . . . . .
-70
Inner Confluence AreQW/ES Survey Line 6
Density Range (o/cc) Notes
M1.0 - 1.4 Relotes t,1.4 - 1.6 Using CENE1.4 - 1.6 grovel, titL6•. - 1.8
( 1.8 - 2.2 The numbe9MR3 > 2.2 numlaers.
1.8 - 2.4 a omppendices
the survG
(uv

70~ I i ii
Inner Confluence AreaW/ES Survey Line 10
050 043 040033030 023 020 013 010003000
-30 7UU
-.J -40
-0
0
40~
J-60
-70
Inner Confluence AreaWES Survey Line 11
es Horizontat Scale
Retates to a distinct topographic feature on the seismic records. aM m"Using CENED Core Information nMaterial indicative of rock,groveL, titL, or other competent substrate.
The numbers 000, 003, 010, etc. represent seismic data record Vertical Exaggerations x 40numbers. The positions of this data are presented In theappendices of this report. The associated dots Illustratethe survey track of vesset.

IP069
J / FD-93-F
IP12 *%z
O • Inner Confluen
"r" 0
:I Boston, Massaz
z
zm LEGENI
0 500 1000 1500 • NED Core LocaIDistance (ft) Additional Analu
"Designed by'
;cQte'
Iml I~ #tDrown by'> 0IMS, In
,•tlon, x 40 Cimecked by,
Revgiwed by,
(5)lApproved bye

S IP1 1 l
IP 13
FD-93-F
Inner Confluence AreaBoston, Massachusetts
LEGEND
SNED Core Locations
* Additional Analysis Locations
U.SARMY Corps Of EngineersWcaerways Experiment Station
Vicksburg, Mississippi
elg e by@ •
&-ow brInner Conf uence
IMs, Inc. A "reaCwck• by$Boston Harbor, MA
R-evwwod by@ Scle ,Sheet
1:600 "'A" Plate 4Datel
Approved b 7/15/93Pha-ng Codeo-Sheet __._ of .1..

103 100 093 090 083 080 073 070063 060 U') 3
43 0 ..... ... .. ... .. . .
-500 4
c Data d1 sement0~ ~~ ~ -5 t ML .. . ........ .
-60
- 70 . .. . .. . .
Chelsea RiverWES Survey Line 8
063 060 053 050 043 040 033 030 023 020 013
_-40
S~Data R•asoment P• -51 ft MLWd
-60
-70_

000 003 010 013 020 023 030 033 040 043 050 053 060
-30 ......
--40 Z- "- - l4 ....
•-J •1•lZ3
05c Da to
9 Bosement I
S-60 •J
CheLsea RiverWES Survey Line 7
030 023 020 013 010 003 000
-30
^-40
-J
c ""..".. Duat4.?
-60•.. ..
S Data°,,0 Basement
~-70

SI
020 013 010 003"0 . 000
-30
,, -40
(-j
, -50
0~
LI 0
-70
CheLsea RiverWES Survey Line 5
LiJ

010 00T3013 000a
_z2
-- -5------
- /0
Chelsea RiverWES Survey Line 6
CP03 CP04
CCP06
cPoi Fuel Docks
CP08 1 0
Crss1cto

-L !-60--60 L_ -
Chelseo. RiverWES Survey Line 1
040 033 030 023 020 013 010 003 000
-30
-- 4-
v -50
oe to BaIsement @ -53 ft MLW
,• -60
-70
Chetsea. RiverWES Survey Line 2
Density Range (q/cc) Notes
2zz 1.0 - 1.4 0 Retates
= 1.4 - 1.6 Using Cl
E-2 1.6 - 1.8 gravek,
=J 1.8 - 2.2 The nur,S> 2.2 numbers
1.8 - 2.4 appendl(the sur
0

£ ~ Se0 Se
1 Data-7 3sement-70_
CheLsea. River
WES Survey Line 3 0 500 1001
Distc
023020 013 010 003 000
-30
b
-'-40
.J Sc
S-50 DatO..........s
>.... InnerS-60 Data Confluence
Baseme t Area
-70
Chelsea RiverWES Survey Line 4
Horizontal Scale
a 'lates to a distinct topographic feature on the seismic records.
C;in9 CENED Core Information, material indicative of rock,Or-avel, till, or other competent substrate,
()e numbers 000, 003, 010, etc. represent seismic data record Vertical Exaggeration, x 40
Ie•mbers. The positions of this data are presented in the)f)pendices of this report. The associated dots illustratetrie survey track of vessel.

1000 1500 2000 2500
Distance (ft)
LID
/~Salt DockOi
Amerado Hess
Designed by-
law PtDrawn by,
IMS, Inc.x 40 Checked by,
Reviewed by,
Approved by'

071 am Cross-section •2-Viewpoirnt
Gulf Oil BOR2
010
10.3
CP0
N
CHELSEA RIVER
"BOSTON, MASSACHUSSETS
LEGEND
SNED Core Locations
C\ WES Core Locations
0 Additional Analysis Locations
U.S.ARMY Corps Of EngineersWaterways Experiment Station
Vicksburg, MississippiDeswged by,
Drawn by,
IMS, Inc. Chetseco RiverCheckd bBoston Harbor, MAReviewed by. Scale, Sheet
1:600 MPate 5Date,Dotoe by, 7/15/93
Drawg Code. Ci) Sheet _.A_ of _A_

023 0?0 013 010 003 000
-30
-, -40 .. .. .- .. 2 -
4- /
""-50 -
d DataCi Basementw -60
-70Data
Ba ;men t
ChetseQ RiverWES Survey L;ne 13
053 050 043060 * 040 033 030 023 020 013 010
0033063 * 0 0 0
-30 -__
-40 7/
,. -50
-74.,.•
0 -6 .... ML
-70 _
Data Basemient

13
013 010* 003 000
//
74/

0
04,3 04U 03:3 030 023 020 013 010 003 000
-31)
-40
50c Data Baoement @ -50 £t MLW
-600
4'
-70 -- - - -_ __,o_ __ _ _
-7 .. ....
Chelseo RiverWES Survey Line 10
BOR 1
Gulf Oil

BOR 1 •Fuel Docks
FD-93-N
0•• BOR2
• f CP12
Gulf Oil CP09
SCp 10
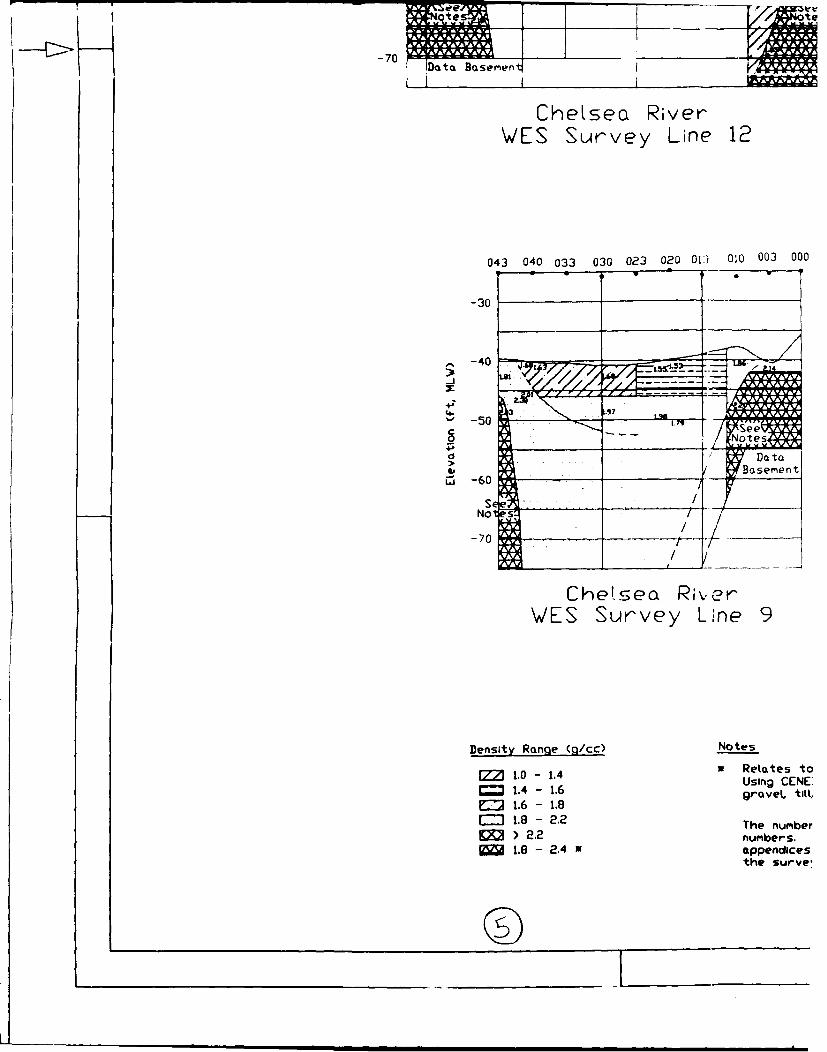
¶te 7/___ te
-70'Data Basementl
Chelsea RiverWES Survey Line 12
043 040 033 030 023 020 013 010 003 000
-30
_ -40
z7
C Seo :Not
>_ Do to
0�JoHasement,.• -60 "-
S•
-7o0t...
Chel.seo. RiverWES Survey Line 9
Density Range (q/cc) Notes
1771.0 - 1.4 0 Retates toUsing CENEI1.4 - 1.6 gravel, tilt,
F7 1.6 - 1.8r- 1.8 - 2.2 The numberK ) 2.2 numbers.
1.8 - 2.4 M appendicesthe surve,

otes
12 0 500 1000 1500 2000 25,
Distance (ft)
'u0 003 0
*.-• Salt Dock
COStol
Data InnerBasement Confluence I F•
Area -...
Amerado Hess
9
Otes Horizoitak Scake
Relates to a distinct topographic Feature in the seismic records. ,Using CENED Core Information, material indicative of rock, _!
gravel, tilt, or other competent substrate.
The numbers 000, 003, 010, etc. represent seismic data record Vertical Exaggerations x 4Cnumbers. The positions of this data are presented in theappendices of this report. The associated dots illustratethe survey track of vessel.
©A

I~ Cr
Gulf Oil //CF1500-
.. ~CP13 -
61 C.,.
¢ CH
National BOTN
Car Rental[
Sq~o.,00 NED Core
• , x4) WES Core
/I" •Additional
De sign ed by-
]0
IMS, Inc.4C0hocked by,
Reviewed by,
0 ApprWoved by'
& ?

SI I -//P12
ffOil •// CP09
CP1 1
//o
BOSTON, MASSACHUSSETS
LEGENDNED Core Locations
4D WES Core Locations
0 Additional Analysis Locations
UCS.ARMY Corps Of Engineers
Waterways Experiment StotionVicksburg, Mississippi
IMs, Inc, CheEseE RiverChc ked 8by- BostMn HUrbor, MA
D 1:600 LiPlnte 6
Dproee bye 7/15/93
Dr'a,,V Code," Moo -k- Ch -12-IIRv

083 080073070063060 053 050 043 040 033 OJO 02] Odri 013 ) 001
-20
" -30 . .. .... . ... ...
v .. .........4-
-40oj20
U 50Data Bosement P -50 f't MLW
-60 .. .
Chetsea RiverWES Survey Line 14N
103 110 113 120 123 130 133 140 143 150 153 160 163 173
-30
-40.- X__
x ... .. .. .+ ; . . . . .' . . . . .. • . . . . . . . .. " . . . . . . . . . . " . . . . . . . . .
" -50 - Data Basement g -50 ft ML W0
S-60
-70 _

Il) 01000
63173
1.

W13 I ?1 123 130 133 140 143 150 153 160 163 170 173 180 183
"L.U .......UHUy CroGSU
/ -
" -40 P 7 .. .. ac c 0~ c
b, d
-'0 Data Basement @ -50 ft MLW
ftot.. No gXU 0fVo tW go Mf.oemtiMastal to fwo kU" IVW. 0 ph to bottom
-60 _______Por f*t .w*I
CheLsea RiverWES Survey Line 15S
BORI
Gulf Oil

iK
BOR 1Fuel Docks
"K f Oil

-70
Chelsea RiverW/ES Survey Line 14S
110 103 100 013 090 083 080 073 070 063 060 053 050
-20
UtMIty c g UWUtty Croo.
-40
Do0D t Basemen @ -50 ft 4LW
Noto p Ift PC sonam or tj"Q&e W Mw too"t~avokol 40 for th• tibw., rpth to bol•tton
-60 Led • off of s910.4c Ocor&
Chelsea R;verWES Survey Line 15N
Density Range (1/cc) Notes
CM 1.0 - 1.4 a Retate
= 1.4 - 1.6 Using I
S1.6 - 1.8 gr~vek
1.8 - 2.2 The nt,_�> 2.2 number
1.8 - 2.4 * appencthe st

0 500 1000 1500 2000 25(
Distance (ft)
050
1P 1 5
CP15S No Position'
4,Salt Dock CaGto Availat
InnerConfluence
Area
Amerado Hess
--I CP1
Z tes Horizontat Scaled Relates to distinct topographic feoture on the seismic records. m
0 Using CENED Core Information, moteriol indicative of rock,grovel. till, or other competent substrote.
The numbers 000, 003, 010, etc. represent seismic dota record Verticol Exoggerotion. xo numbers, The positions of this doto ore presented in the
t oppendices of this report. The associoted dots illustratethe survey track of vessel.
©

Gulf oil
00 25000
O.Z 0CP14N
0 60
Positioning 0 Nita Available (Q
Notional
Car Rental
0 3o07003
CP14S to Ii 13
I Scalel00•
ION Is" ft Drown byt
IMSChocked t
erotaOn' x 40
Reviewed I
(j Approved
j

I CHELSEA RIVERBOSTON, MASSACHUSSETS
LEGEND
19 NED Core Locations
0) WES Core Locations
iti 0 Additional Analysis Locations
//
U.S.ARMY Corps Of' EngineersWaQter'ways Experiment Station
Des~wdby- MVicksburg, Mississippi
Drown~ by,
RCheVseR RiverChocked by, Boston HACHSor, MA
Reviewed by, SCOWe Sheet
1:600 RefeErece Plate 7
Approved byE t 7/15/93vG.Mn Code'
Sheot -2- of
I:otnHroM

183 I� I�'J 1/0 163 160 153 150 143 140 133 130 i� h?0 113 110
-rn e e -- ±A. * -A------ s- -
/ ___ ___
-20
/ ___ ____
3 /-J
eoi -� /// ____-� __
/ �.ZI 10'
0*:; -40d
GD __
LI // ____ /
*-50 Dotci B seMent � -50 ft MLW
-60
Reserved Cho.nnel\N/ES Survey Line 8
020 023 030 033 040 043 050 053 060063
-30 - ____________ _______
em-40 - _______
7
2: - _____ ____ ___
(I -_____ // __
'� -50 - _________ _____
C D�to BaseMent £ 50 Vt MLW / / / /9 ___________ _________
4' - _________ -
Doto.9 _____ ____
�-60 - /
__i-i __ / __

0730I'l (WO 061 W thA i3 04 1 040 0-33 030 oiO?O .0 1 Oilo 003 080
083
~t] -30
40 -40
50_ -50I11 / / -____ -Di ---- ta Basement
o1 1> Data Basem~ent / _____ Md
-60 --- - - o Lj -60B1
70 .......- 70
Rese::rvecl Choannet AreaxW/ES Survey Line 1
__063 070 073 080
2M
Data Posemeni

070 063 060 053 0( 4 4 3 3 2073 op 05 043 040 033 0 00080.
003300 000 003 010
__ _ _ ___30-- - - - ----- -30
N-40
-40 .4 ' - -_ - - -'.,--- -40__ __
-__ _ - --- -50-50 - ----f- - ------ - -
-60 ___Q / 60
-70 -__--__--7
Reserved Channe(W/ES Survey Line 5
RP04*)
BOSTON MARIN

000 003 010 013 0-)0 0123 0130 0313 041) 04 3 0'-U U OtI',O Of
-30 -
_-40
/1 /, ~'' -/- / -_ _ --- -
-70
GO7R0R ANNAN
FD-93-E
A.-

~-70_ F-
Reserved ChannelWES Survey Line 6
000 013 020 023 030 033003 O *O , 040 043 073 070 Ob3 060 053
-30 -30 _ ____1
% 40 -40/
: I______, I944;
-50 .-- 50 -
0c 0c
Data Bseent Data Basement
6-60 -60 -
-70 -70 -
Reserved Channel R(WES Survey Line 2 WE
Density Ronge (g/cc) Notes
1.0 - 1.4 9 Reiates= 1.4 - 1.6 Using CE
1.6 - 1.6 grQvet.1 .6 - 1.8S1.8 - 2.2 The mm*-l
S) 2.2 nuLlapers1.8 - 2.4 U appendac
the sur

BOSTON
,0 053 050 043 040 033 030 0,-- 020 013 010 003 000
L4---WHITES' / // / /BOSTON EDISON- - - ---- -- COMPAN'
/.
/0 .500 1000 "I500 200C
Reser'ved~ Channel. Distance (ft)EIS Survey Line 7
- -Hor-zont- Dcale
!elates to a distinct topographic feature on the seismic records. 1 - ii-
ising CENED Core Informution, materil| indicative oV rock,,ravel` till, or other competent sulbstrate.
;,e numibers 000. 003, 010, etc. represent seismic data record Vertical tExaggeration• x 40umbers. The positions of this data are presented in theappendilces of this report. The associated dots ILlustratehe survey track of vessel
© 0 00'5020

F D-
INDUS. PARK •q
S40o-F. APPROACH CHANNELTO {DRY.DOCK NO..3 o
•¾N'HT UL V -S• CASTLE ISLAND TERMINAL
SFD-93-8SFD-93-C
FD-93-A
CASlLE ISLAN
500 2000 2500 o, 9
(f t)
at Scale
gevatlona x 40 Choi
Rev
(1 Apo

0 ~FD-93-E ____
FD-9RPO2
R0O
RPO71
Reserved ChannelBoston, Massachusetts
LEGEND
SNED Core Locations
*Adedtional Analysis Locations
U.S.ARMY Cor'ps Of Engineer-sWaQterways Experiment Station
Dye Vicksburg, MississippiDwslgwd bye
Ir Draw"l bye
PY"IMS, Inc. Reserved~ CkrnneitClomckd byeBoston Harkoor, MA
byeRaovw~ed by$ Scatl.Soo
1-600 Plate 8by AMv"b, 7/15/93__
_____
IShoiwt -A- of -l-

0I
033030 (23 020 010 003 000 043 040 033 03
3 . .0 ..... .
• " -3 0 . .... .. ....... ... 30 . . . .... -4 . .. 4.0,- , _+4o
-J - - "1• ii•<7lD"L. -
/7/~ /Datai4 //-57 Basement -
a# Data Basemnnt R -57 Ft Me4Li 60 )U~0
Reserved~ Channe( Reser\WES Survey Line 10 WES Su
000003 010 O
010 013 020 023 030 033 040 04300003 • , _
-30 -30
40 -,-407)x ' .. .. ... ... ....t -- •/=
•" -50~ ~ . ......... /z /,//_z.Z,
:3 -3-50 I -500Data Basement @ -52 ft MLW 2pd
- 60 w 60
-70 -70

.L - 3 030 Od3 020 013 oO 003 103 too 093 090 083 080 0
li,0
4-
-_ Poc:kets of Sof
"~ Mit �r.teat De tect -t /
d Limvited AcouCt> PSnnetrtucn J
l 60,-,
-70
s :served Channel Reserved Ck,ey!S Survey Line 14 W/ES Survey 1
02001 013 020 023 030 033

C0U 073 070 063853050 053 050 043 04U 033 UJO (),)• iI.u (I
5 0.. . .-40
Dot BanelRsemvent -50 annel
IZI
-70
e ?y Line 1_7 W/ES Sur'vey Line 18
44/+.
dG
FD-3-
/ / / O _ _ _ _ _ _

040 033 030 0O23 OCT 01.3
I..
,rvecJ ChannelSurvey Line 18
R t GO0V ER NOR S I S LAN D
--D2 Fn-93--D2

Reserved Channet RiWES Survey Line 11 WE
05853 043 040 033 030 023 020 013 01003 040 033
.40---0
-- ---s -- -- --
.4 Nsri n __ ý _I - -4 - 4
-50_____--0c
50
o 0 Do,
Datoa Bosement B oBse
-6 0 ,. - 6 0
-70
Reserved Channet RiWES Survey Line 12 W/E
Density Range (g/cc) Jotes
1.0 - 1.4 1 Relate
71.4 - 1.6 Using1.4 - 1.6 grove
I2 1.6 - 1.81.8 - 2.2 The ni1.8 > 2.2 numbei1.8 - 2.4 * oppen,
the s

>r-eserved Channel• ES Survey Line 15
0ý33 030 023 020 013 010 003 000 BOSTON,
06D 073
0 0"3 ow 083 00
073 2 ON 083*4 0
1A100 063 090 013 0u0 073 070
083 060 073 070 063
-- 1 -- % BOSTON EDISON WHITE F
----- .. t COMPANY
,---;Data ------- --
:sement -----
0 500 1000 1500 2000
erReserved Channel Distance (ft)SvES Survey Line 16
Horlzonro.t Scale
D Cktes to a distinct topographic feature on the seisnic records. -o g CENED Core Informotion, materlal Indicative of rock
vet, till, or other competent substrate.
nunbers 000, 003, 010, etc. represent selimsc date record Vertical Exaggerationi x 40oers. The positions of this data are presented in the
ndices of this report. The associated dots ilustratesurvey track of vessel.
(0
-A

BOSTON MARINEINDUS. PhRK
SOTNAM AERP 15 am :o@w U0 010 003
08 0=0 013
010
5 1 0: ý00 C@0003 RP12
040 12 4 4
iam 00 0002
wo. WHT aUE CO. .,1o cW3- 4R 1
- iwýaa awan 50-4-P22
050~~~ASL CATLSILNDTNMIA
RP2 20009250
0>
U)
Designd by-
MON" Drawn by-
IMS, In(
1 x 40CheCkrd by.
Reviewed bys
(Z) Approved by'

D7 7 Fn--93--D2
RP10
Mellon RP12
L.X.- RP14 FD-93-D
Z" '04~ RP16
no ~ RP18
CASTL- ISLAND
Reserved ChannelBoston, Massachusetts
LEGEND
* NED Core Locations
0 Addtional Analysis Locations
U.S.ARMY Corps Of EngineersWaterways Experiment Station
Vicksburg, Mississippi
DesWgnd by* ~
Drawn by$
IMS, Inc. Reservecd C(hlnneLChack"ed by Boston Harbor, MA
Revewed bye sc(alO Sh;te
1:600 IAbe, Prate 9
Approveird bye Date' 7/15/93Drawing Code,
Set _3j_ o .of

(0J U u o".3 (1tu uOi 010 00J
080 0`3 0!0 Ofhi U603 0, t O .O 0 4A 034 1 000
- i s-... ...
-30- -
S-40 ........ . . . .. .... ...... .. ,• • ... ... 1•p .... IA
. ... .............. ..- I
70
Reserved Cha~nnelWES Sur'vey Line 22
03 03 00 03000300 033 030 023 020 013 010 00373 07006 00 05 05 04 00
-30
-40- 50 ........-. ..... ,. . .
c DM ee Datea~ni Bas_..emen.t..i.[.2.]
0 •' NotesZ
a'
S-60
0-7

()Oj010 OO3
000
S 010 003
lent

08,3 080 073 070 06:3 060 053 050 043 040 ou 03 0't 01-3 iou U
-30
-40
'-50
Data EB1seme t
60
-70
Reserved Channel
WdES Survey Line 19
ell *0 IezFD-93- E
BOSTON MARINE)UINDUS. PARK -FD-93--D2
I&ROAC.H CANEL I

G GOV E R NORS I S LAN D
-D-93-E
YFD-9.3-D2
-

-70
Reserved ChannetWES Survey Line 21
100 093 090 083 080 073 070 063 060 053 050 043 04
-30
L94
'LIM
• -40
-504J . .... . .
j-60 -
Data B ement
-70
Reserved ChannetWES Survey Line 20
Density Range (g/cc) Notes
177 1.0 - 1.4 * RelUS1,
1.4 - 1.6 Urs1.6 - 1.81.8 - 2.2 Th4> 2.2 Pup1.8 - 2.4 m QPI
"tho

nnelne 21
SO!
S073
,3 03C 050 043 040 033 030 0237307 06- 0I 00'
_____________________too O_________(WO W m 03 -W 013
0 6300 073 070 04
BOSTON EDISON W
-a COMPANY
_, __t 0 500 1000 1500 20
Distance (ft)
.nnetne 20
Notes Horizon
to G u Relates to a distinct topographic feature on the seismic records.ENED C Using CENED Core Informatin material indicative of rock,till, or gravel, till, or other competent substrate.
ibers ( The numbers 000, 003, 010, etc. represent seusr•ic data record Vertical Exai;. The numbers. The positions of this data are presented in theces of appendices of this report. The associated dots Illustratevey tr the survey track of vessel.
_ ©

BOSTON MARINEINDUS. PAR- FD-93-D2
043RP I' we 02 2 U 1 O 03 010 0$3 20 W 0430 0&
1,N,3 N30 01 02 03 w~
00 o 0 0 W3an3 0 10 No~- ma m4 m am~ 03 2
040 03 03 02 03 01 an w -w Of
RRP18C A S T LA STE I S L N DF D - 3 -
RP19 D-930
0>
C)-
ScateDesigned by,
Drawn by,
x40 ChMkedby
R~eviewd bye
(iii Approved by,

- FD-93-D2
ISLAND
Reserved ChannelBoston, Massachusetts
LEGEND
NED Core Locations
* Addtional Analysis Locations
QCkJ
U,S.ARMY Corps Of EngineersWVcterways Experiment Station
Vicksburg, MississippiDes"d by,
Drawn bye
IMS, Inc. Reserved ChannelCha.ckd by, Boston Harbor, MA
Reviewed by' Scat* sh&i
1:600 N"#*W" Plate 10
Approved bye Dat.• 7/15/93Dreveft Codw'
Sheet -iL of -It

REPORT DOCUMENTATION PAGE OW No 74081180". of ianurm..sin is sw.mm to "Terp I sw met usew~.~ddm Un .1 sisa Wti. WKWsldi.A k @ex" dUO 9W4*L
=%ws SIr~si 5a~ edf ~SIU. ofl "itW
I. AG11C USE ONLY (" 6&* 2.Its DAT 3. REPORT TPE AND DATES COVERE
&T AD RW I I August 1994 Final report S.________________
A Waterborne Seismic Reflection Survey of Three Tributaries MIPR 93-C-005in Bo"to Harbor, Massachusetts
6. AUTHNO(S)
Keith J. Siostrom, Rodney L. Leist
7. PERFORMING ORGANIZATION NAMES) ANM AOORESS(ES) L. PERORMING ORGARKLATION
U.S. Army Engineer Waterways Experiment Station REPORT NUMBER3909 Halls Ferry Road Technical ReportVicksburg, MS 39180-6199 GL-94-28
3. SPONSORING /MONITORING AGENCY NAME(S) AND ADDRESS(ES) 10. SPONSORING/ MONITORING
U.S. Army Engineer Division, New England AGENCY REPORT NUMBER
Waltham, MA 02254
11. SUPPLEMENTARY NOTES
Plates 1-10 are located in the pocket of the back cover. This report is available from the National TechnicalInformation Service, 5285 Port Royal Road, Springfield, VA 22161.
12&. DISTROUUTION/AvALAaRJTY STATEMENT 13b. DISTRIBUTION CODE
Approved for public release; distribution is unlimited.
IL. ABSTRACT (MeIXihWwn200woiWg
A waterborne seismic reflection and side scan sonar survey of three tributaries to Boston Harbor,Massachusetts, is reported. The geophysical studies were performed in the Mystic and Chelsea Rivers,Reserved Channel, and the Inner Confluence Area in order to characterize and quantify bottom and subbottomnsediments in support of proposed channel deepening. Two high resolution subbottom profiling systems withspecially designed data acquisition and analysis software packages were utilized to meet the primary projectobjectives. A dual frequency side scan sonar was used to provide increased bottom coverage and detect anypossible dredging hazards. The survey results provide estimates of the material density and volume ofmaterials to be removed through dredging. In addition, the information supplements previously obtained soilborings by providing continuous profile line coverage along each project area, particularly in areas ofsuspected rock outcroppings.
14. SSIUCT TER1MS 15. NUMBER OF PAGESBoston Hbarbr, MA seismic reflection23
GohsclmddsWaterbore 223PIC CD
OF 4MTAm ABSATSTRCT
NSN 754"40..S-5540 Standard form 296 (Rev. 2493)ftescnSd by AOM laW Z3915

.-- -.- -.-,- - -- --- - -- •-
I
Plates are included in a separate envelope.
Destroy this report when no longer needed. Do not return it to the originator.
9 -m mmmm Jf m n•• -