Embed Size (px)
Citation preview

A Wealth of Opportunities
In association with
� � � � � � � �
Private banking and wealth management in the UK: Economic impact, the view of the investors and latest trends
About the BBA
The BBA is the UK’s leading association for the banking sector representing the interests of more than 250 member organisations with a worldwide presence in 180 countries.
Our member banks make up the world’s largest international banking cluster, operating 150 million personal accounts for UK customers and contributing over £60 billion annually to UK economic growth.
We represent our members to policymakers, regulators, the media and all key stakeholders across the UK, Europe and beyond, working together to promote a legislative and regulatory system that helps customers, promotes growth and raises standards in the industry.
For more information on becoming a member and working with the BBA, visit: www.bba.org.uk/membership or contact: Richard Adler, Relationship Director, [email protected]
© BBA 2014
Published by BBA, Pinners Hall, 105–108 Old Broad Street, London EC2N 1EX
www.bba.org.uk
Printed by CDL Print Solutions: www.citydigital.net Designed by Soapbox: www.soapbox.co.uk
A Wealth of Opportunities – Private banking and wealth management in the UK: Economic impact, the view of the investors and latest trends October 2014

BB
AA
Wealth of O
pportunities
Contents
Foreword
Introduction
Executive summary
Chapter 1: Economic impact
Chapter 2: The view of the investors
Chapter 3: Latest trends
Appendix A
3
5
7
9
19
34
53

2B
BA
A
Wea
lth o
f Opp
ortu
nitie
s

3B
BA
A W
ealth of Opportunities
One of the hallmarks of private banking and wealth management is discretion. So perhaps one should not be entirely surprised that this sector has remained one of our economy’s hidden success stories.
This report aims to give this valuable part of our industry the recognition it has long deserved and emphasise why fostering its further growth is in the interests of us all.
The service and advice offered by private banks and wealth managers acts as a magnet to some of the world’s most dynamic and successful people. The opportunities created by having such clients here are felt throughout the country. These are often people who create jobs and bring investment into the UK.
The valuable work conducted by ComPeer and Oxford Economics, and supported by the Wealth Management Association, suggests that our country’s private banks and wealth managers now oversee £524 billion of assets and contribute £3.2 billion a year to GDP. Then there is the £1.2billion of tax receipts the sector generates for our nation’s public finances a year. The sector is also responsible for directly employing some 23,000 people and supporting the employment of another 42,000.
The title of our report also alludes to the opportunities of the future. This is a growing global market and the UK is well-placed to be even more successful at private banking and wealth management in the years to come. Our country’s advantages in this field are many and deep-rooted. High levels of expertise and experience, a robust and trusted legal system, our proximity to Europe and the United States and even
ForewordBy Anthony Browne

4B
BA
A
Wea
lth o
f Opp
ortu
nitie
s
the propensity of the English language are all persuasive reasons to believe that this part of our industry should continue to flourish.
And yet we cannot take that position for granted. It is vital that our country fosters the right environment for this sector to maintain its position. The UK faces challenges from other private banking centres – established and emerging – which are also trying to attract clients and their assets.
Moreover, private banks are not immune to the wider political and regulatory changes affecting financial services. The nature of their client base means that regulation often requires a greater level of interpretation and cost for firms seeking to comply. It can also mean that firms are unduly impeded from serving their clients’ needs, or disproportionately affected in comparison to others.
Whilst the BBA supports reform of financial services, greater care needs to be applied to ensure the sector is not unnecessarily undermined.
We hope this report sets out why it’s in all our interests to value and safeguard this important part of the UK’s financial services industry. This is an industry that offers both its clients and our country a wealth of opportunities.

5B
BA
A W
ealth of Opportunities
The BBA, ComPeer and Oxford Economics were tasked with sizing aspects of the UK private banking and wealth management sector (hereafter referred to as the ‘PBWM sector’) and its economic impact.
Within this report we will show the latest trends across UK private banks and wealth managers, outlining key business performance metrics, based on data from ComPeer’s annual UK Wealth Management survey. From these statistics, Oxford Economics have modelled a variety of economic impacts. We have also sought the view of the high net worth investor, as the key recipients of services from this sector. The answers from online interviews of over 250 individuals with more than £1 million of investable assets will be unveiled as part of this report.
When sizing the UK PBWM sector, we have focussed on three main firm types. The combination of these three firms from here on have been categorised as ‘wealth managers’:
i. Private banks – Firms who are licensed deposit takers. Our research includes 30 private banks with investment management divisions of substance operating in the UK. These include subsidiaries or branches of foreign banks together with the private banking divisions of major UK universal banks and smaller niche players.
ii. Private client investment managers – Our research includes 53 private client investment managers; we have also included multi-family offices
Introduction

6B
BA
A
Wea
lth o
f Opp
ortu
nitie
s
within this category. These firms are differentiated from the private banks in that they operate under client money rules rather than as licensed deposit takers. We do not include firms managing less than £50 million of assets nor hedge fund managers. Neither do we include firms providing advisory services to clients where the firm does not have permission to undertake discretionary services i.e. IFAs.
iii. Full service wealth managers – These firms focus on private client discretionary and advisory business, often supplemented by wider financial planning services. There are 36 firms included in our research in this category. These firms are differentiated by being members of the London Stock Exchange.
Although execution only stockbrokers also provide services to the affluent, mass affluent and high net worth sectors, for the purpose of this research data for these firms have been excluded.
7B
BA
A W
ealth of Opportunities
The UK PBWM sector has proven to be one of the most resilient industries within financial services, overcoming market difficulties in the aftermath of the financial crisis and adapting to regulatory changes, whilst delivering record business performance results year after year.
We are confident that the UK PBWM sector is well positioned to be the world’s leading PBWM centre and be an even greater contributor to the UK economy, but to do this it will need the support in terms of promoting the sector both at home and abroad.
We believe there should be greater recognition from policy makers and regulators as to exactly how important this industry is to the UK to ensure that its position is not eroded and the UK PBWM sector continues to thrive.
Economic impact of the sector
As at the end of 2013, UK private banks and wealth managers were responsible for managing and / or administering as much as £524 billion of assets in the UK on behalf of affluent, high net worth and ultra-high net worth investors from across the world.
The sector directly employs close to 23,000 individuals in the UK. After accounting for the indirect employment through suppliers
Executive summary
8B
BA
A
Wea
lth o
f Opp
ortu
nitie
s
and induced economic impacts, the sector supports over 65,000 jobs. These employees are spread across each of the regions in the UK, with the core focus being London where it supports close to 1% of all employment in the capital.
The firms and employees in the sector paid a combined £1.2 billion in taxes in 2013, an equivalent of £19 for each individual living in the UK.
In addition we have calculated that the sector itself made a £3.2 billion gross value added contribution to UK GDP in 2013. This is larger than the market research sector (£2.5 billion) and the sector for the manufacture of electronic components and boards (£1.4 billion). It is also only slightly smaller than the television programming and broadcasting sector. Including direct, indirect, and induced impacts, the sector supported an estimated £5.5 billion in gross value added for the UK economy.
Perceptions of the UK
The sector is also delivering in terms of attracting assets from overseas. Overseas investors have been a key source of asset inflows in recent years and our survey of high net worth investors indicates that there will be continued investment from overseas as a result of the sector’s quality. These investors also confirmed that they are more likely to conduct business in the UK as a result of their existing relationship with a UK PBWM firm.
Although it is very welcome to see London voted the most attractive place to provide wealth management services by both UK and non-UK passport holders, this hard won competitive edge over other centres should not be taken for granted.
The future for private banking and wealth management in the UK
As with any industry the UK PBWM Sector is not without its challenges. Our report suggests the formation of an advice gap, where
individuals in lower wealth bands either cannot access advisory services, as some firms no longer provide them below certain investment thresholds, or are unable to afford the luxury of financial advice as a result of increases in charges to cover items such as the additional costs of regulation.
Continued low interest rates may have a detrimental effect on the sector with many firms, particularly private banks, heavily reliant on net interest income. If this revenue stream diminishes then they may be forced to source the revenue elsewhere, most likely through further increases in fees. With the level of fees being the key factor (as chosen by the high net worth investors) when selecting a wealth manager, this can only have a negative effect in terms of business inflows.
Costs too may be under pressure in 2014 with a heightened regulatory burden from Europe, upward pressure on front office base salaries, due in part to EU changes and a continuing need to invest in technology.
9B
BA
A W
ealth of Opportunities
Key findings · Including direct, indirect, and induced economic impacts, the PBWM
sector supported 65,700 jobs in the UK in 2013. That is one in every 490 jobs in the UK, and roughly equal to employment in the entire economies of St. Albans or Ipswich.
· The PBWM sector supports employment in each of the UK’s 12 nations and regions. Total jobs supported via direct, indirect, and induced channels as a share of whole economy employment was highest in London (0.9% of employment), Scotland (0.2%), the North West (0.2%), and the South East (0.2%).
· Across the direct, indirect, and induced channels of economic impact, the sector supported £5.5 billion in gross value added (GVA) contributions to the UK economy in 2013. That is 0.4% of all GVA created in the UK that year.
· The PBWM sector, therefore, supported an amount of economic activity similar to the entire economy of Brighton and Hove.
· Firms and employees in the PBWM sector itself collected and paid an estimated £1.2 billion in taxes in 2013. That is £19 for every man, woman and child in the UK.
CHAPTER 1 Economic impact
10B
BA
A
Wea
lth o
f Opp
ortu
nitie
s
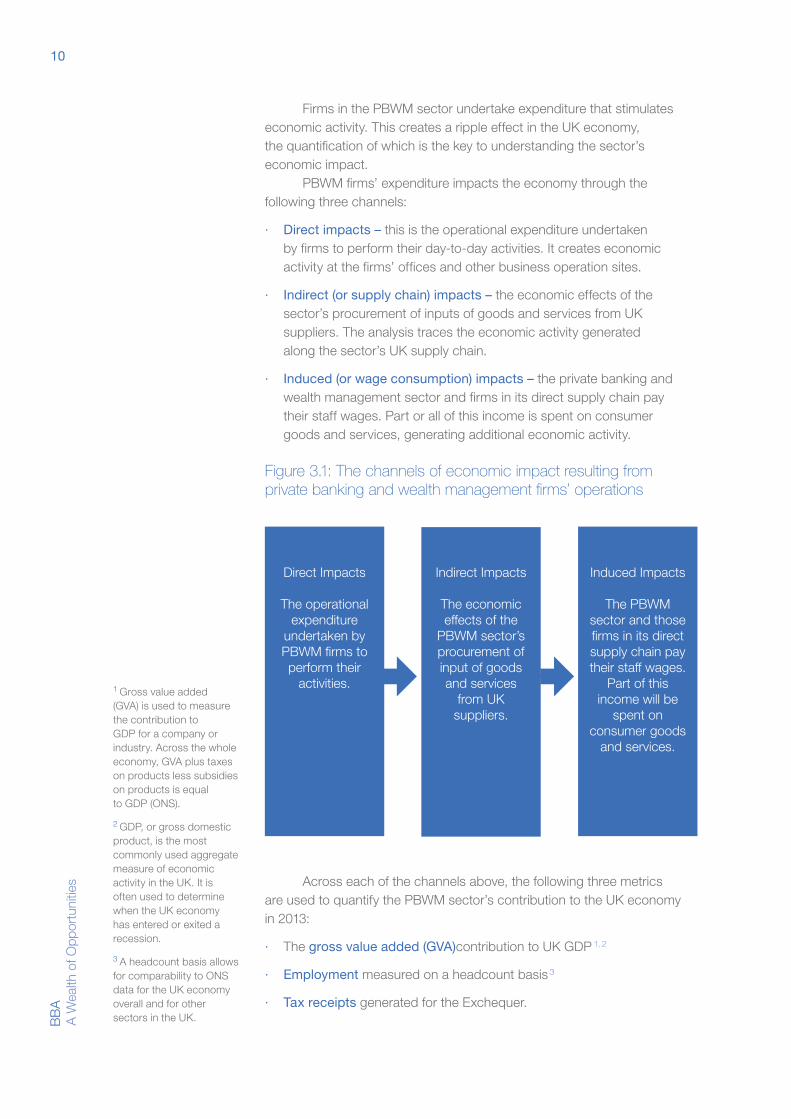
Firms in the PBWM sector undertake expenditure that stimulates economic activity. This creates a ripple effect in the UK economy, the quantification of which is the key to understanding the sector’s economic impact.
PBWM firms’ expenditure impacts the economy through the following three channels:
· Direct impacts – this is the operational expenditure undertaken by firms to perform their day-to-day activities. It creates economic activity at the firms’ offices and other business operation sites.
· Indirect (or supply chain) impacts – the economic effects of the sector’s procurement of inputs of goods and services from UK suppliers. The analysis traces the economic activity generated along the sector’s UK supply chain.
· Induced (or wage consumption) impacts – the private banking and wealth management sector and firms in its direct supply chain pay their staff wages. Part or all of this income is spent on consumer goods and services, generating additional economic activity.
Figure 3.1: The channels of economic impact resulting from private banking and wealth management firms’ operations
Direct Impacts
The operational expenditure
undertaken by PBWM firms to perform their
activities.
Indirect Impacts
The economic effects of the
PBWM sector’s procurement of input of goods and services
from UK suppliers.
Induced Impacts
The PBWM sector and those firms in its direct supply chain pay their staff wages.
Part of this income will be
spent on consumer goods
and services.
Figure 3.1: The channels of economic impact resulting from private banking and wealth management firms’ operations
Across each of the channels above, the following three metrics are used to quantify the PBWM sector’s contribution to the UK economy in 2013:
· The gross value added (GVA)contribution to UK GDP 1, 2
· Employment measured on a headcount basis 3
· Tax receipts generated for the Exchequer.
1 Gross value added (GVA) is used to measure the contribution to GDP for a company or industry. Across the whole economy, GVA plus taxes on products less subsidies on products is equal to GDP (ONS).
2 GDP, or gross domestic product, is the most commonly used aggregate measure of economic activity in the UK. It is often used to determine when the UK economy has entered or exited a recession.
3 A headcount basis allows for comparability to ONS data for the UK economy overall and for other sectors in the UK.
11B
BA
A W
ealth of Opportunities
The results are presented on a gross rather than net basis. A gross impact study does not take into account what the resources used up in the operation of the sector could alternatively be deployed to do, while a net study does. Therefore, a gross study ignores alternative uses, while a net study would attempt to estimate the impact created by the sector in excess of that if the resources were deployed in their second most effective use. The net approach is more complex and potentially more controversial, since the counterfactual (where the PBWM sector does not exist) is not observable. Undertaking this study on a gross basis follows the dominant approach in the literature.
3.1 Direct gross value added contribution to UK GDP
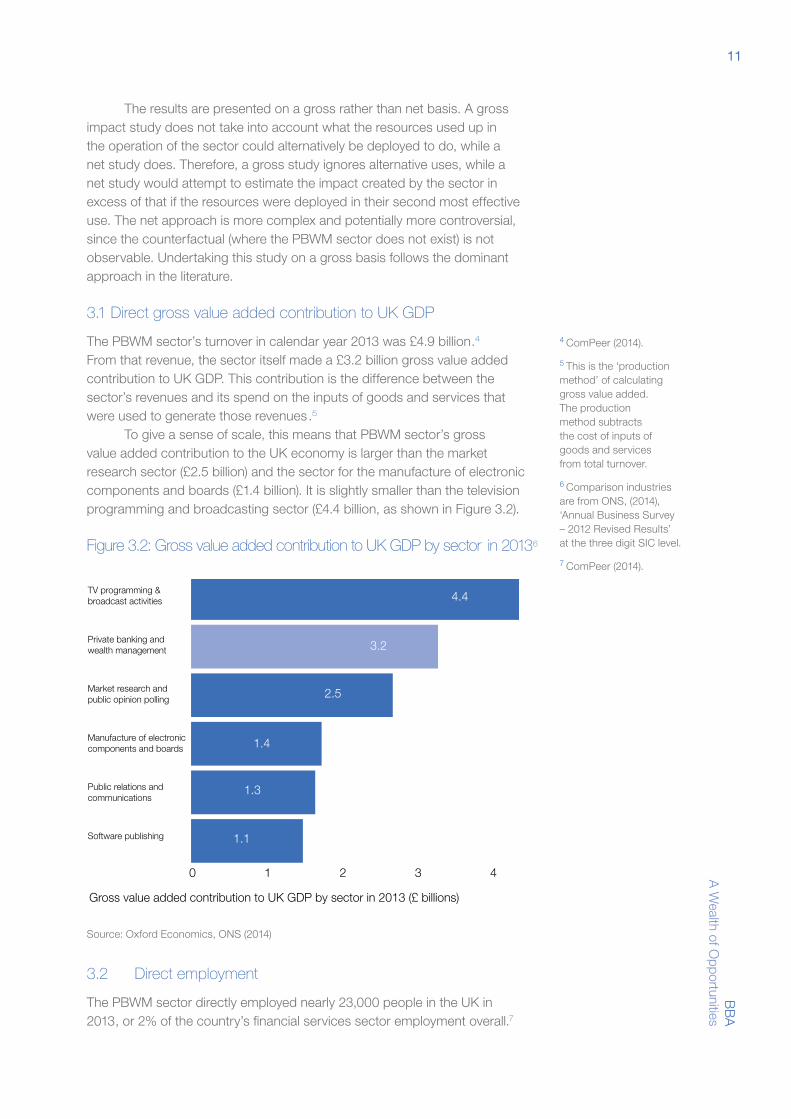
The PBWM sector’s turnover in calendar year 2013 was £4.9 billion.4 From that revenue, the sector itself made a £3.2 billion gross value added contribution to UK GDP. This contribution is the difference between the sector’s revenues and its spend on the inputs of goods and services that were used to generate those revenues.5
To give a sense of scale, this means that PBWM sector’s gross value added contribution to the UK economy is larger than the market research sector (£2.5 billion) and the sector for the manufacture of electronic components and boards (£1.4 billion). It is slightly smaller than the television programming and broadcasting sector (£4.4 billion, as shown in Figure 3.2).
Figure 3.2: Gross value added contribution to UK GDP by sector in 20136
TV programming & broadcast activities
Private banking and wealth management
Market research and public opinion polling
Manufacture of electronic components and boards
Public relations and communications
Software publishing
Figure 3.2: Gross value added contribution to UK GDP by sector 6 in 2013
43210
Gross value added contribution to UK GDP by sector in 2013 (£ billions)
Source: Oxford Economics, ONS (2014)
4.4
3.2
2.5
1.4
1.3
1.1
Source: Oxford Economics, ONS (2014)
Source: Oxford Economics, ONS (2014)
3.2 Direct employment
The PBWM sector directly employed nearly 23,000 people in the UK in 2013, or 2% of the country’s financial services sector employment overall.7
4 ComPeer (2014).
5 This is the ‘production method’ of calculating gross value added. The production method subtracts the cost of inputs of goods and services from total turnover.
6 Comparison industries are from ONS, (2014), ‘Annual Business Survey – 2012 Revised Results’ at the three digit SIC level.
7 ComPeer (2014).
12B
BA
A
Wea
lth o
f Opp
ortu
nitie
s
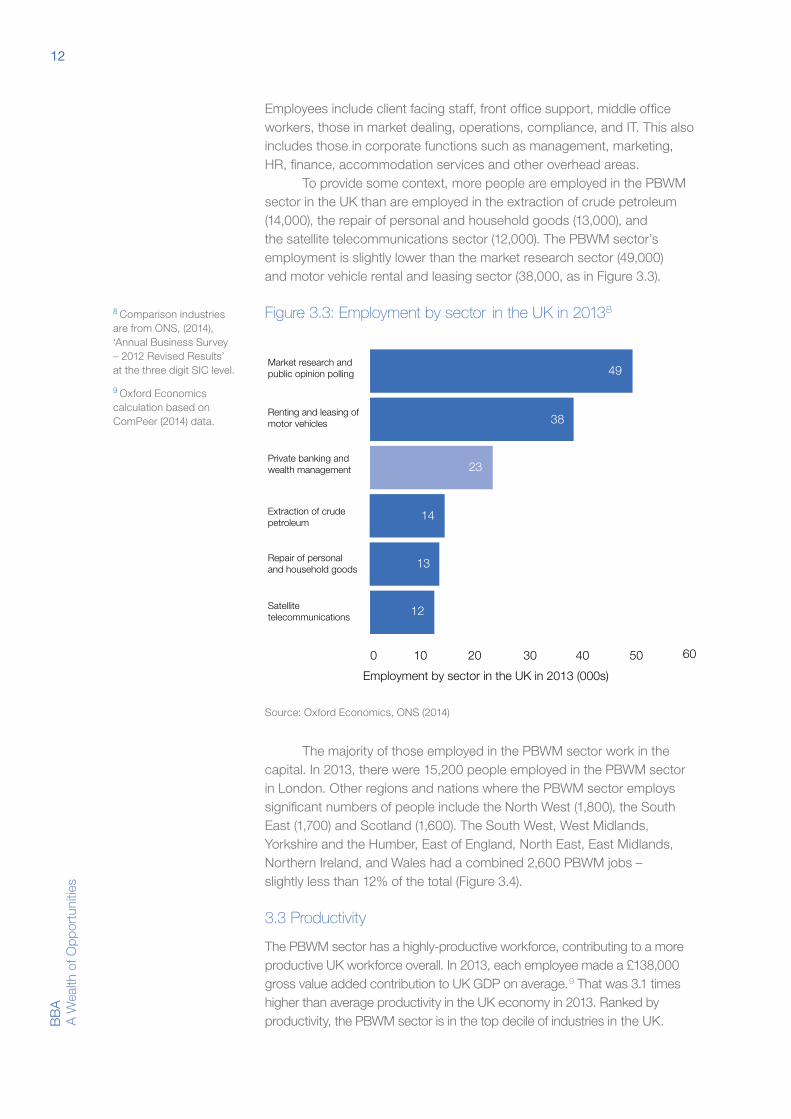
Employees include client facing staff, front office support, middle office workers, those in market dealing, operations, compliance, and IT. This also includes those in corporate functions such as management, marketing, HR, finance, accommodation services and other overhead areas.
To provide some context, more people are employed in the PBWM sector in the UK than are employed in the extraction of crude petroleum (14,000), the repair of personal and household goods (13,000), and the satellite telecommunications sector (12,000). The PBWM sector’s employment is slightly lower than the market research sector (49,000) and motor vehicle rental and leasing sector (38,000, as in Figure 3.3).
Figure 3.3: Employment by sector in the UK in 20138Source: Oxford Economics, ONS (2014)
Figure 3.3: Employment by sector8 in the UK in 2013 (000s)
Market research and public opinion polling
Employment by sector in the UK in 2013 (000s)
Renting and leasing of motor vehicles
Private banking and wealth management
Extraction of crude petroleum
Repair of personal and household goods
Satellite telecommunications
49
38
23
14
13
12
10 20 30 40 50 600
Source: Oxford Economics, ONS (2014)
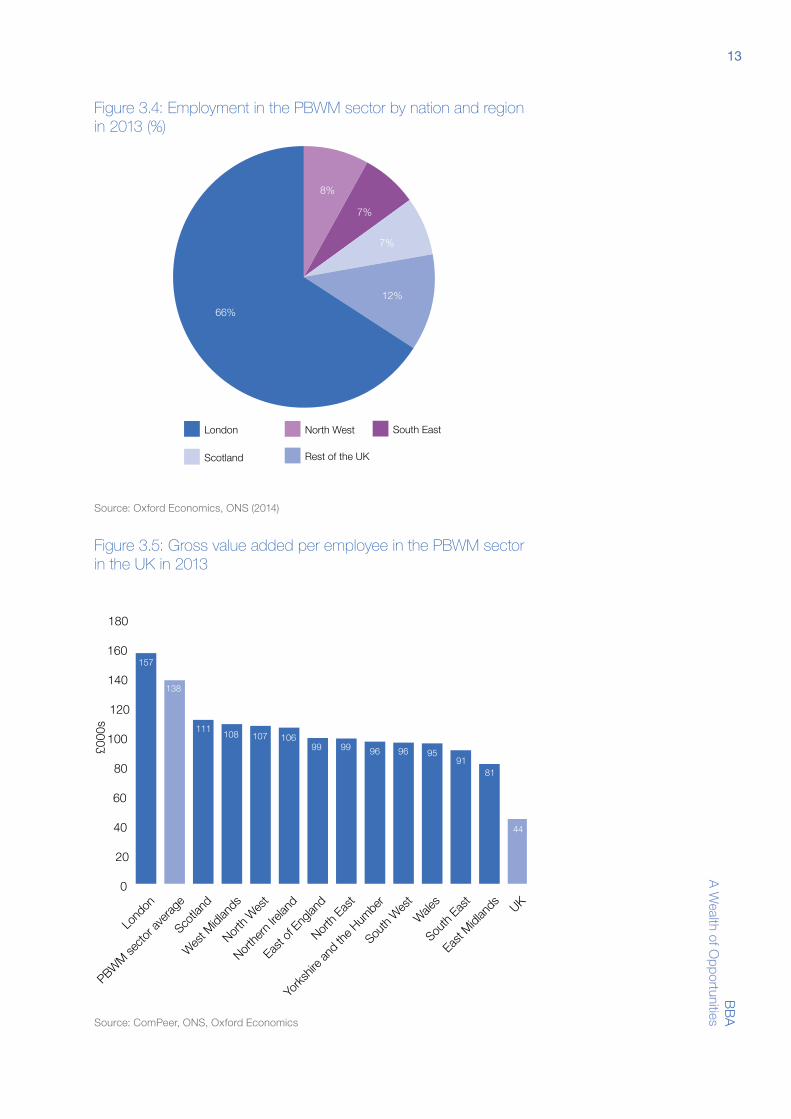
The majority of those employed in the PBWM sector work in the capital. In 2013, there were 15,200 people employed in the PBWM sector in London. Other regions and nations where the PBWM sector employs significant numbers of people include the North West (1,800), the South East (1,700) and Scotland (1,600). The South West, West Midlands, Yorkshire and the Humber, East of England, North East, East Midlands, Northern Ireland, and Wales had a combined 2,600 PBWM jobs – slightly less than 12% of the total (Figure 3.4).
3.3 Productivity
The PBWM sector has a highly-productive workforce, contributing to a more productive UK workforce overall. In 2013, each employee made a £138,000 gross value added contribution to UK GDP on average.9 That was 3.1 times higher than average productivity in the UK economy in 2013. Ranked by productivity, the PBWM sector is in the top decile of industries in the UK.
8 Comparison industries are from ONS, (2014), ‘Annual Business Survey – 2012 Revised Results’ at the three digit SIC level.
9 Oxford Economics calculation based on ComPeer (2014) data.
13B
BA
A W
ealth of Opportunities
Figure 3.4: Employment in the PBWM sector by nation and region in 2013 (%)
Figure 3.4: Employment in the PBWM sector by nation and region in 2013 (%)
London
Rest of the UKScotland
North West South East
12%
7%
7%
66%
8%
Source: ComPeer
Figure 3.5: Gross value added per employee in the PBWM sector in the UK in 2013
0
100
20
40
60
80
120
140
160
180
UK
East M
idlan
ds
South
East
Wale
s
Sou
th W
est
Yorks
hire a
nd th
e Hum
ber
North
East
East o
f Eng
land
Northe
rn Ire
land
North
Wes
t
Wes
t Midl
ands
Scotla
nd
PBWM se
ctor a
verag
e
Lond
on
£000
s
Figure 6.5: Gross value added per employee in the UK in 2013
157
138
111108 107 106
99 99 96 96 9591
81
44
Source: ComPeer, ONS, Oxford Economics
Source: Oxford Economics, ONS (2014)
Source: ComPeer, ONS, Oxford Economics
14B
BA
A
Wea
lth o
f Opp
ortu
nitie
s
Productivity in the PBWM sector varies by nation and region. In London, it is estimated to be nearly £157,000 per year. In Scotland and the West Midlands, PBWM sector productivity is £111,000 and £108,000 per year, respectively. In the South East and the East Midlands, it is £91,000 and £81,000, respectively (Figure 3.5).
3.4 Direct tax contribution to the Exchequer
The PBWM sector is an important contributor to tax revenues in the UK. Through a combination of corporate taxes, irrecoverable VAT, employers’ national insurance contributions (NICs), employee NICs, and income taxes, the PBWM sector collected and paid an estimated £1.2 billion to the Exchequer in 2013.10 That is 0.25% of total UK tax receipts in 2013.11
An estimated £683 million of this amount was due to employee income taxes and NICs. Employer NICs comprised £252 million, while corporation taxes made up £144 million, and irrecoverable VAT paid is estimated to have been £112 million.12
The PBWM sector collected and paid 38% of its direct GVA in tax in 2013.
3.5 Indirect impacts
In the course of its day-to-day operations, the PBWM sector purchases inputs of goods and services. In 2013, the sector’s procurement spend was £1.7 billion, of which an estimated £1.4 billion (or 81%) was spent with UK suppliers.13 This expenditure stimulates economic activity along the PBWM sector’s UK supply chain. The impact is estimated using Oxford Economics’ detailed Input-Output model of the UK economy.14
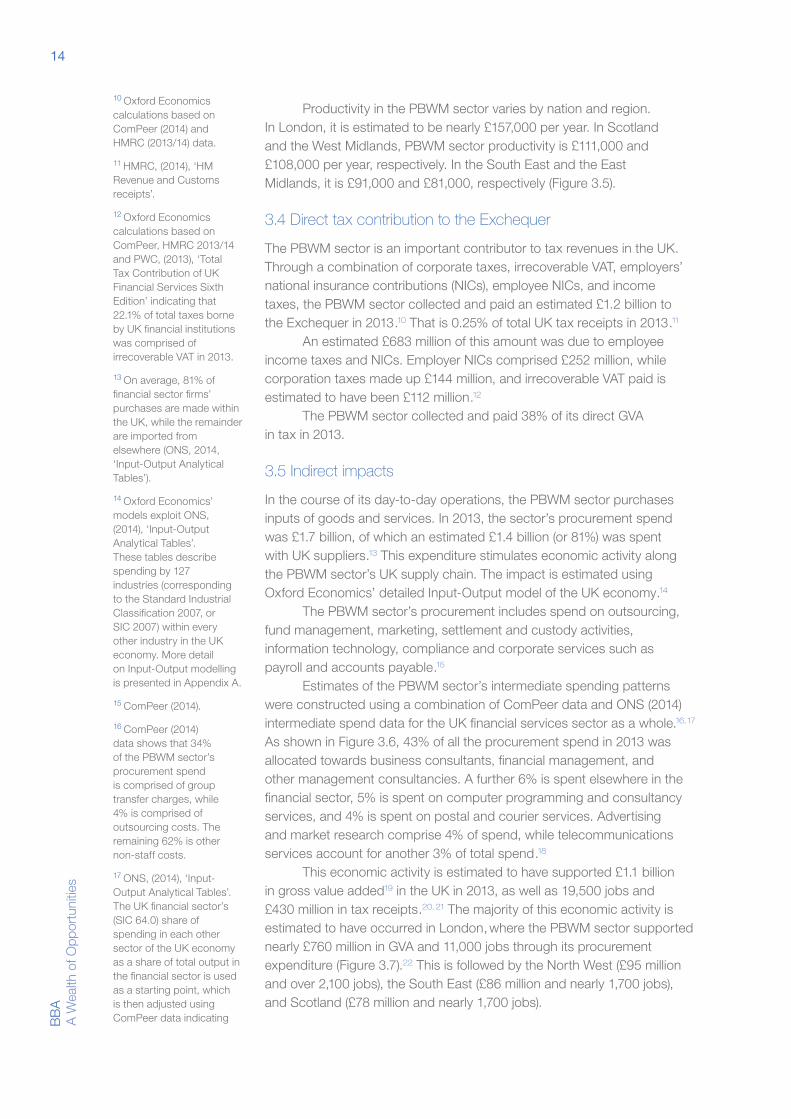
The PBWM sector’s procurement includes spend on outsourcing, fund management, marketing, settlement and custody activities, information technology, compliance and corporate services such as payroll and accounts payable.15
Estimates of the PBWM sector’s intermediate spending patterns were constructed using a combination of ComPeer data and ONS (2014) intermediate spend data for the UK financial services sector as a whole.16, 17 As shown in Figure 3.6, 43% of all the procurement spend in 2013 was allocated towards business consultants, financial management, and other management consultancies. A further 6% is spent elsewhere in the financial sector, 5% is spent on computer programming and consultancy services, and 4% is spent on postal and courier services. Advertising and market research comprise 4% of spend, while telecommunications services account for another 3% of total spend.18
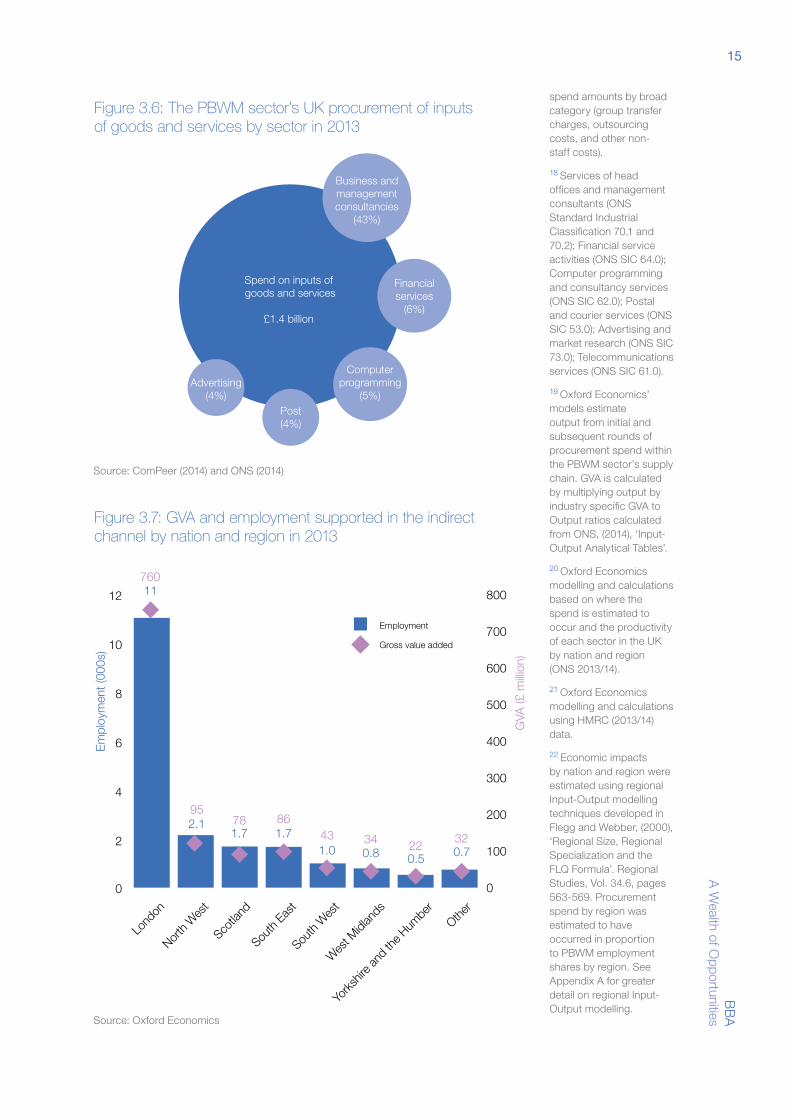
This economic activity is estimated to have supported £1.1 billion in gross value added19 in the UK in 2013, as well as 19,500 jobs and £430 million in tax receipts.20, 21 The majority of this economic activity is estimated to have occurred in London, where the PBWM sector supported nearly £760 million in GVA and 11,000 jobs through its procurement expenditure (Figure 3.7).22 This is followed by the North West (£95 million and over 2,100 jobs), the South East (£86 million and nearly 1,700 jobs), and Scotland (£78 million and nearly 1,700 jobs).
10 Oxford Economics calculations based on ComPeer (2014) and HMRC (2013/14) data.
11 HMRC, (2014), ‘HM Revenue and Customs receipts’.
12 Oxford Economics calculations based on ComPeer, HMRC 2013/14 and PWC, (2013), ‘Total Tax Contribution of UK Financial Services Sixth Edition’ indicating that 22.1% of total taxes borne by UK financial institutions was comprised of irrecoverable VAT in 2013.
13 On average, 81% of financial sector firms’ purchases are made within the UK, while the remainder are imported from elsewhere (ONS, 2014, ‘Input-Output Analytical Tables’).
14 Oxford Economics’ models exploit ONS, (2014), ‘Input-Output Analytical Tables’. These tables describe spending by 127 industries (corresponding to the Standard Industrial Classification 2007, or SIC 2007) within every other industry in the UK economy. More detail on Input-Output modelling is presented in Appendix A.
15 ComPeer (2014).
16 ComPeer (2014) data shows that 34% of the PBWM sector’s procurement spend is comprised of group transfer charges, while 4% is comprised of outsourcing costs. The remaining 62% is other non-staff costs.
17 ONS, (2014), ‘Input-Output Analytical Tables’. The UK financial sector’s (SIC 64.0) share of spending in each other sector of the UK economy as a share of total output in the financial sector is used as a starting point, which is then adjusted using ComPeer data indicating
15B
BA
A W
ealth of Opportunities
Figure 3.6: The PBWM sector’s UK procurement of inputs of goods and services by sector in 2013
Figure 3.6: The PBWM sector’s UK procurement of inputs of goods and services by sector in 2013
Spend on inputs of goods and services
£1.4 billion
Business and management consultancies
(43%)
Financial services
(6%)
Computer programming
(5%)Post (4%)
Advertising(4%)
Figure 3.7: GVA and employment supported in the indirect channel by nation and region in 2013
0
2
4
6
8
10
12
Other
Yorks
hire a
nd th
e Hum
ber
Wes
t Midl
ands
South
East
South
Wes
t
Scotla
nd
North
Wes
t
Lond
on
E
mpl
oym
ent (
000s
)
Figure 3.7: GVA and employment supported in the indirect channel by nation and region in 2013
11 760
95 78 86
43 34 22 32
2.1 1.7 1.7
1.0 0.8 0.5 0.7
Employment
Gross value added
Source: Oxford Economics
GVA
(£ m
illion
)
0
300
400
100
200
500
600
700
800
Source: Oxford Economics
Source: ComPeer (2014) and ONS (2014)
spend amounts by broad category (group transfer charges, outsourcing costs, and other non-staff costs).
18 Services of head offices and management consultants (ONS Standard Industrial Classification 70.1 and 70.2); Financial service activities (ONS SIC 64.0); Computer programming and consultancy services (ONS SIC 62.0); Postal and courier services (ONS SIC 53.0); Advertising and market research (ONS SIC 73.0); Telecommunications services (ONS SIC 61.0).
19 Oxford Economics’ models estimate output from initial and subsequent rounds of procurement spend within the PBWM sector’s supply chain. GVA is calculated by multiplying output by industry specific GVA to Output ratios calculated from ONS, (2014), ‘Input-Output Analytical Tables’.
20 Oxford Economics modelling and calculations based on where the spend is estimated to occur and the productivity of each sector in the UK by nation and region (ONS 2013/14).
21 Oxford Economics modelling and calculations using HMRC (2013/14) data.
22 Economic impacts by nation and region were estimated using regional Input-Output modelling techniques developed in Flegg and Webber, (2000), ‘Regional Size, Regional Specialization and the FLQ Formula’. Regional Studies, Vol. 34.6, pages 563-569. Procurement spend by region was estimated to have occurred in proportion to PBWM employment shares by region. See Appendix A for greater detail on regional Input-Output modelling.
16B
BA
A
Wea
lth o
f Opp
ortu
nitie
s
The East of England, the East Midlands, the North East, the South West, the West Midlands, Yorkshire and the Humber, Wales, and Northern Ireland supported a combined £130 million of GVA and 3,000 jobs.
3.6 Induced impacts
People employed by the PBWM sector and its direct supply chain spend a proportion of their incomes at local retailers and leisure outlets. This spend supports additional economic activity, called the “induced” impact (or wage-consumption impact) of the PBWM sector in these outlets and their UK supply chain. These impacts, as with the indirect impacts, are estimated using Oxford Economics’ detailed Input-Output modelling of the UK economy.
Based on in-house staff costs of £2 billion in 2013, it is estimated that employees in the PBWM sector itself had £980 million in disposable income.23 In addition, the PBWM sector’s supply chain expenditure supported around £700 million in wages.
The economic activity driven by employee spend is estimated to have supported a £1.2 billion gross value added contribution to the UK economy in 2013. It also supported 23,300 jobs and £600 million in tax receipts.
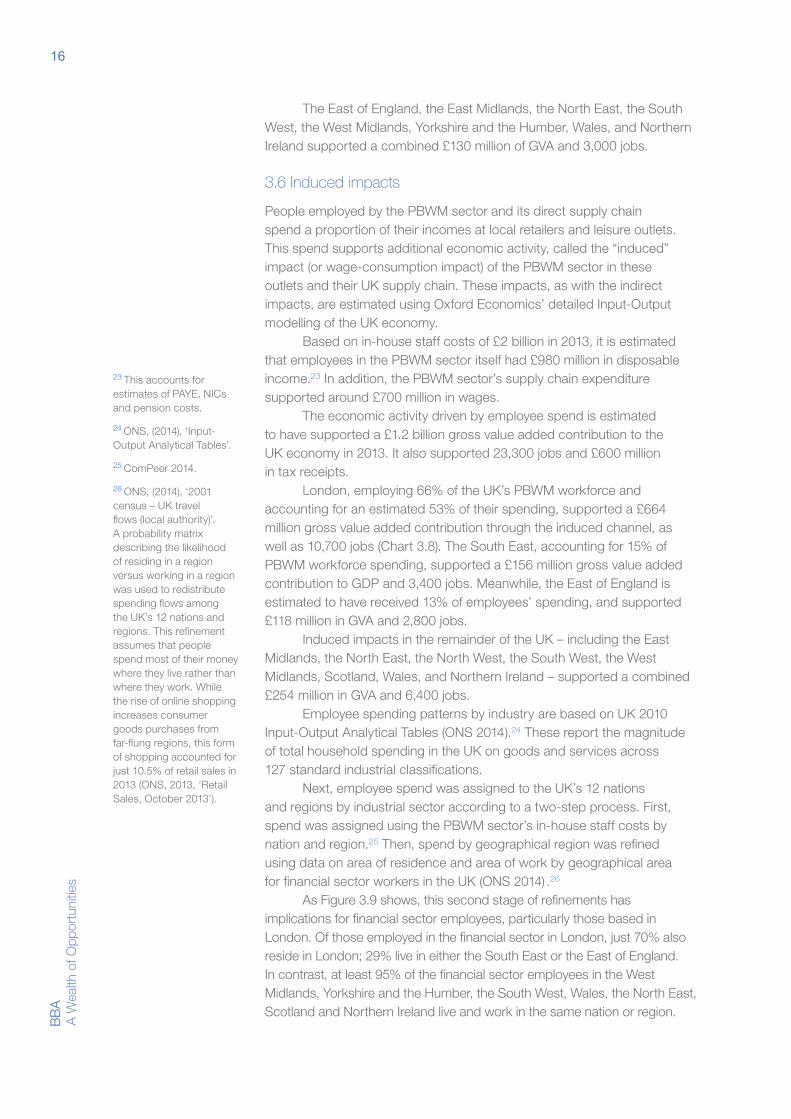
London, employing 66% of the UK’s PBWM workforce and accounting for an estimated 53% of their spending, supported a £664 million gross value added contribution through the induced channel, as well as 10,700 jobs (Chart 3.8). The South East, accounting for 15% of PBWM workforce spending, supported a £156 million gross value added contribution to GDP and 3,400 jobs. Meanwhile, the East of England is estimated to have received 13% of employees’ spending, and supported £118 million in GVA and 2,800 jobs.
Induced impacts in the remainder of the UK – including the East Midlands, the North East, the North West, the South West, the West Midlands, Scotland, Wales, and Northern Ireland – supported a combined £254 million in GVA and 6,400 jobs.
Employee spending patterns by industry are based on UK 2010 Input-Output Analytical Tables (ONS 2014).24 These report the magnitude of total household spending in the UK on goods and services across 127 standard industrial classifications.
Next, employee spend was assigned to the UK’s 12 nations and regions by industrial sector according to a two-step process. First, spend was assigned using the PBWM sector’s in-house staff costs by nation and region.25 Then, spend by geographical region was refined using data on area of residence and area of work by geographical area for financial sector workers in the UK (ONS 2014) .26
As Figure 3.9 shows, this second stage of refinements has implications for financial sector employees, particularly those based in London. Of those employed in the financial sector in London, just 70% also reside in London; 29% live in either the South East or the East of England. In contrast, at least 95% of the financial sector employees in the West Midlands, Yorkshire and the Humber, the South West, Wales, the North East, Scotland and Northern Ireland live and work in the same nation or region.
23 This accounts for estimates of PAYE, NICs and pension costs.
24 ONS, (2014), ‘Input-Output Analytical Tables’.
25 ComPeer 2014.
26 ONS, (2014), ‘2001 census – UK travel flows (local authority)’. A probability matrix describing the likelihood of residing in a region versus working in a region was used to redistribute spending flows among the UK’s 12 nations and regions. This refinement assumes that people spend most of their money where they live rather than where they work. While the rise of online shopping increases consumer goods purchases from far-flung regions, this form of shopping accounted for just 10.5% of retail sales in 2013 (ONS, 2013, ‘Retail Sales, October 2013’).
17B
BA
A W
ealth of Opportunities
Figure 3.8: GVA and employment supported in the induced channel by nation and region in 2013
0
2
4
6
8
10
12
0
200
100
300
400
500
600
700
Figure 3.8: GVA and employment supported in the induced channel by nation and region in 2013
10.7 664
156 118
81 71 37 29 37
3.4 2.8
2.0 1.7
0.9 0.8 1
Employment
Gross value added
Source: Oxford Economics
E
mpl
oym
ent (
000s
)
GVA
(£ m
illion
)Othe
r
Wes
t Midl
ands
South
Wes
t
North
Wes
t
Scotla
nd
East o
f Eng
land
South
East
Lond
on
Figure 3.9: UK financial sector employees who lived and worked in the same nation or region in 2001
Region Employees (%)
London 70
South East 91
East of England 92
North West 94
East Midlands 94
West Midlands 95
Yorkshire and the Humber 95
South West 95
Wales 97
North East 98
Scotland 99
Northern Ireland 100
Source: Oxford Economics
Source: ONS (2014)
18B
BA
A
Wea
lth o
f Opp
ortu
nitie
s
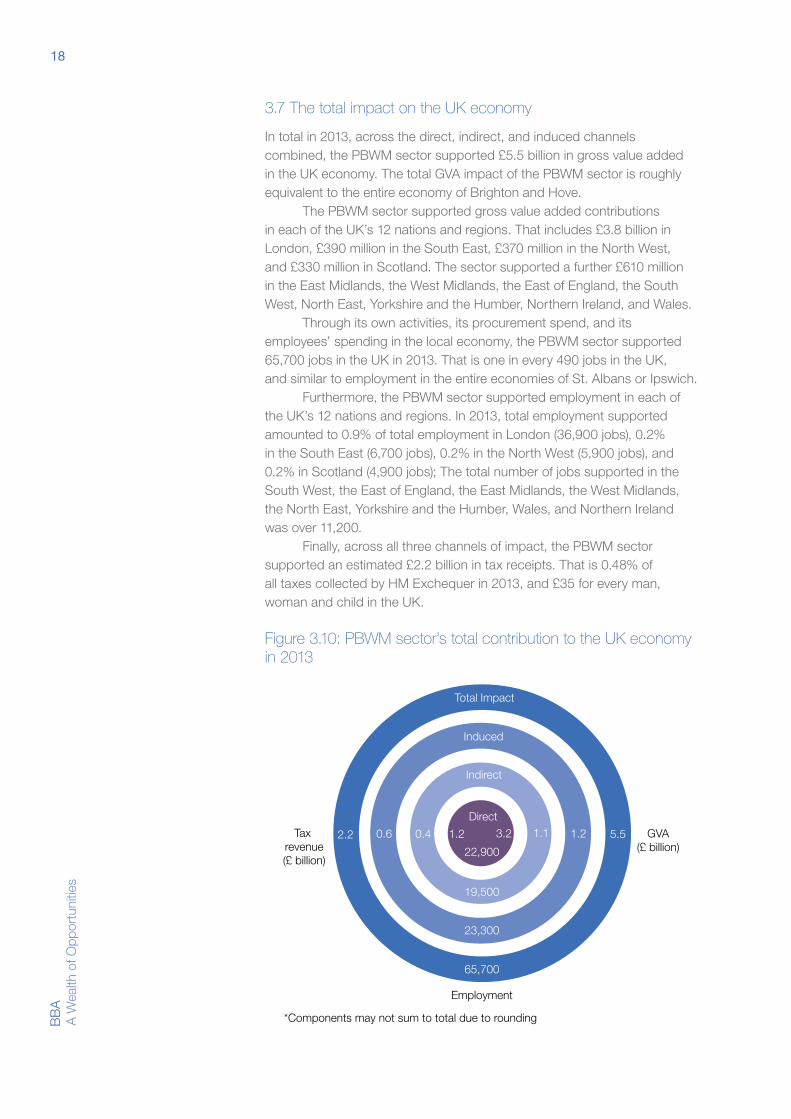
3.7 The total impact on the UK economy
In total in 2013, across the direct, indirect, and induced channels combined, the PBWM sector supported £5.5 billion in gross value added in the UK economy. The total GVA impact of the PBWM sector is roughly equivalent to the entire economy of Brighton and Hove.
The PBWM sector supported gross value added contributions in each of the UK’s 12 nations and regions. That includes £3.8 billion in London, £390 million in the South East, £370 million in the North West, and £330 million in Scotland. The sector supported a further £610 million in the East Midlands, the West Midlands, the East of England, the South West, North East, Yorkshire and the Humber, Northern Ireland, and Wales.
Through its own activities, its procurement spend, and its employees’ spending in the local economy, the PBWM sector supported 65,700 jobs in the UK in 2013. That is one in every 490 jobs in the UK, and similar to employment in the entire economies of St. Albans or Ipswich.
Furthermore, the PBWM sector supported employment in each of the UK’s 12 nations and regions. In 2013, total employment supported amounted to 0.9% of total employment in London (36,900 jobs), 0.2% in the South East (6,700 jobs), 0.2% in the North West (5,900 jobs), and 0.2% in Scotland (4,900 jobs); The total number of jobs supported in the South West, the East of England, the East Midlands, the West Midlands, the North East, Yorkshire and the Humber, Wales, and Northern Ireland was over 11,200.
Finally, across all three channels of impact, the PBWM sector supported an estimated £2.2 billion in tax receipts. That is 0.48% of all taxes collected by HM Exchequer in 2013, and £35 for every man, woman and child in the UK.
Figure 3.10: PBWM sector’s total contribution to the UK economy in 2013
Figure 3.10: PBWM sector’s total contribution to the UK economy in 2013
Total Impact
Direct
Indirect
Induced
23,300
19,500
65,700
Employment
0.6 0.42.2 1.11.2 3.2 1.2 5.5 GVA(£ billion)
Tax revenue(£ billion)
22,900
*Components may not sum to total due to rounding
19B
BA
A W
ealth of Opportunities
Key findings · Although private banks and wealth managers are seen by the majority
of their clients as capable and understanding of their needs, only slightly more than half of investors would describe their wealth management provider as client centric.
· Investors are placing the majority of their assets in the UK, with both UK and non-UK passport holders voting London as the most attractive banking centre for conducting their private banking / wealth management.
· Investors do not see a need for increased usage of social media. Although this form of communication is necessary in other industries, it is unlikely to be a game changer in wealth management in the near future.
· Improvements need to be made in terms of advice on pensions and tax and this is likely to be a cause of significant outflows if improvements are not made soon.
· A lack of transparency over products and pricing also remains a concern for a substantial percentage of investors.
· Philanthropy is used by a select group of long-standing investors but represents a very small proportion of their assets. It is, however an area where many expect growth in the future.
· A higher proportion of investors are currently making their own investment decisions via an execution only stockbroker.
CHAPTER 2 The view of the investors
20B
BA
A
Wea
lth o
f Opp
ortu
nitie
s
· Whilst the regulatory authorities should be commended for making customers feel more secure, our findings suggest that some regulation could benefit from more understanding of the investors perspective.
· Changes to tax laws and economic improvements are both viewed as positive moves for attracting further investment in the UK.
We have seen that the UK PBWM sector is an important contributor to the UK economy. Although the firms deserve credit for this, the sector depends entirely on the end investor. We therefore sought to obtain the views of these investors, specifically those with more than £1 million of investable assets.
Through a series of online interviews, 255 individuals gave their opinions on a range of topics including reasons for investing in the UK, philanthropy and regulation. Twenty-three of these investors were specifically targeted as non-UK passport holders, to understand if views from outside the UK differ and what attracts them to the UK wealth management sector.
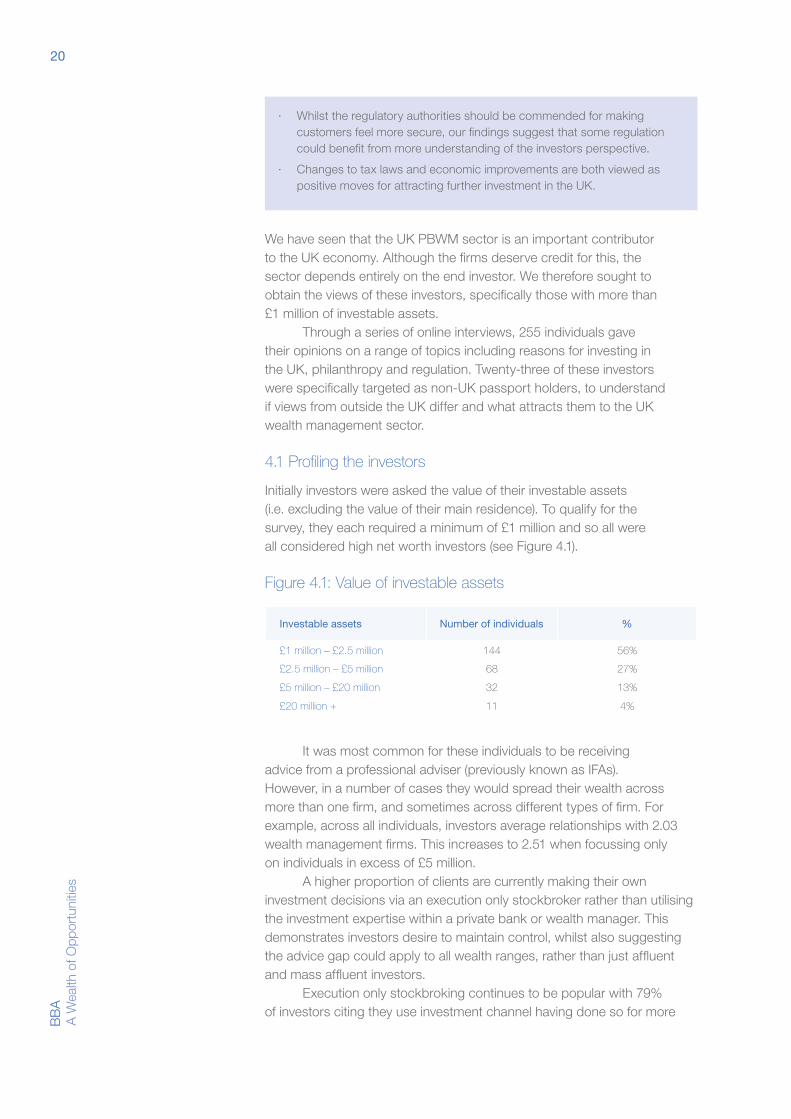
4.1 Profiling the investors
Initially investors were asked the value of their investable assets (i.e. excluding the value of their main residence). To qualify for the survey, they each required a minimum of £1 million and so all were all considered high net worth investors (see Figure 4.1).
Figure 4.1: Value of investable assets
Investable assets Number of individuals %
£1 million – £2.5 million 144 56%
£2.5 million – £5 million 68 27%
£5 million – £20 million 32 13%
£20 million + 11 4%
It was most common for these individuals to be receiving advice from a professional adviser (previously known as IFAs). However, in a number of cases they would spread their wealth across more than one firm, and sometimes across different types of firm. For example, across all individuals, investors average relationships with 2.03 wealth management firms. This increases to 2.51 when focussing only on individuals in excess of £5 million.
A higher proportion of clients are currently making their own investment decisions via an execution only stockbroker rather than utilising the investment expertise within a private bank or wealth manager. This demonstrates investors desire to maintain control, whilst also suggesting the advice gap could apply to all wealth ranges, rather than just affluent and mass affluent investors.
Execution only stockbroking continues to be popular with 79% of investors citing they use investment channel having done so for more
21B
BA
A W
ealth of Opportunities
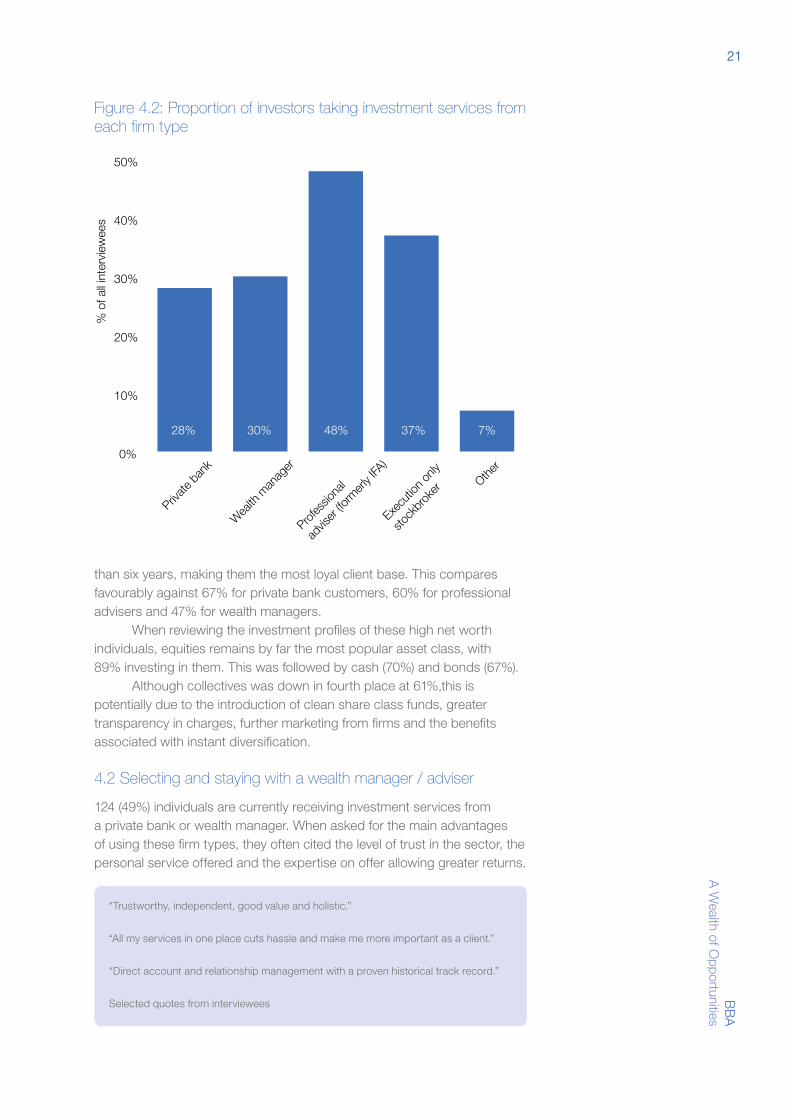
Figure 4.2: Proportion of investors taking investment services from each firm type
0%
10%
20%
30%
40%
50%
% o
f all
inte
rvie
wee
sFigure 4.2: Proportion of investors taking investment
services from each firm type
Wea
lth m
anag
er
Profes
siona
l
advis
er (fo
rmerl
y IFA
)
Execu
tion o
nly
stock
brok
erOthe
r
Private
ban
k
28% 30% 48% 37% 7%
than six years, making them the most loyal client base. This compares favourably against 67% for private bank customers, 60% for professional advisers and 47% for wealth managers.
When reviewing the investment profiles of these high net worth individuals, equities remains by far the most popular asset class, with 89% investing in them. This was followed by cash (70%) and bonds (67%).
Although collectives was down in fourth place at 61%,this is potentially due to the introduction of clean share class funds, greater transparency in charges, further marketing from firms and the benefits associated with instant diversification.
4.2 Selecting and staying with a wealth manager / adviser
124 (49%) individuals are currently receiving investment services from a private bank or wealth manager. When asked for the main advantages of using these firm types, they often cited the level of trust in the sector, the personal service offered and the expertise on offer allowing greater returns.
“Trustworthy, independent, good value and holistic.”
“All my services in one place cuts hassle and make me more important as a client.”
“Direct account and relationship management with a proven historical track record.” Selected quotes from interviewees
22B
BA
A
Wea
lth o
f Opp
ortu
nitie
s
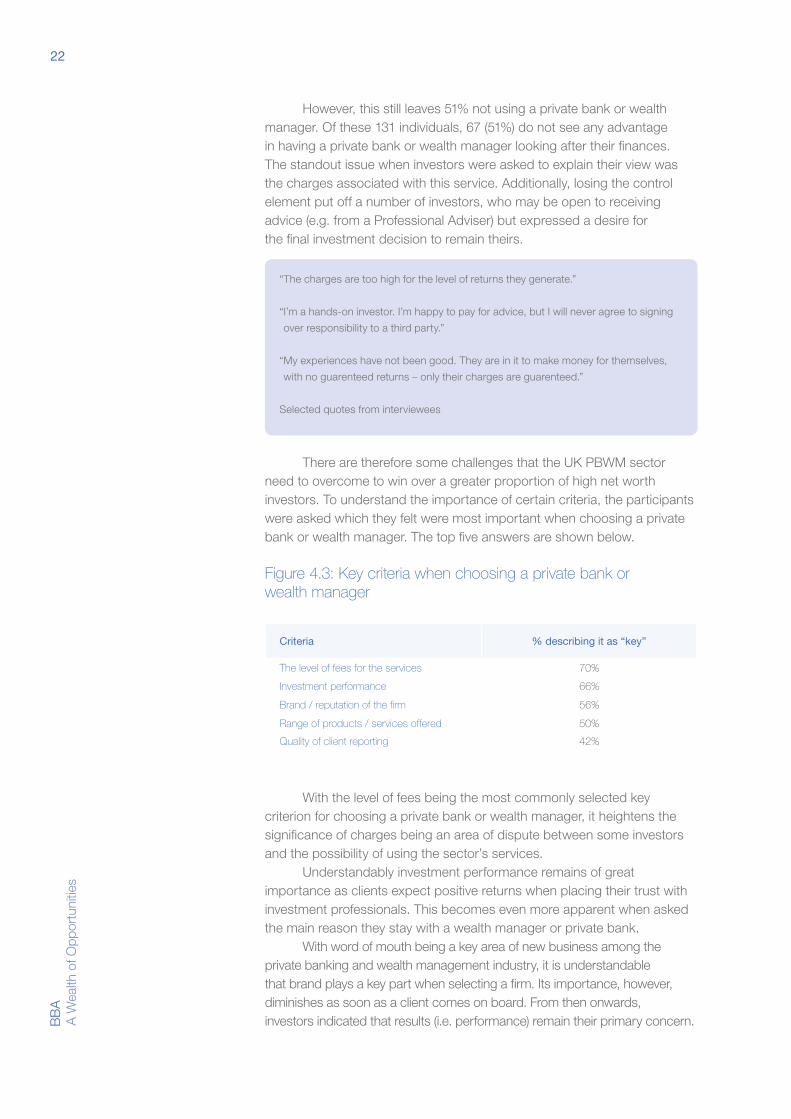
However, this still leaves 51% not using a private bank or wealth manager. Of these 131 individuals, 67 (51%) do not see any advantage in having a private bank or wealth manager looking after their finances. The standout issue when investors were asked to explain their view was the charges associated with this service. Additionally, losing the control element put off a number of investors, who may be open to receiving advice (e.g. from a Professional Adviser) but expressed a desire for the final investment decision to remain theirs.
“The charges are too high for the level of returns they generate.”
“ I’m a hands-on investor. I’m happy to pay for advice, but I will never agree to signing
over responsibility to a third party.”
“ My experiences have not been good. They are in it to make money for themselves,
with no guarenteed returns – only their charges are guarenteed.”
Selected quotes from interviewees
There are therefore some challenges that the UK PBWM sector need to overcome to win over a greater proportion of high net worth investors. To understand the importance of certain criteria, the participants were asked which they felt were most important when choosing a private bank or wealth manager. The top five answers are shown below.
Figure 4.3: Key criteria when choosing a private bank or wealth manager
Criteria % describing it as “key”
The level of fees for the services 70%
Investment performance 66%
Brand / reputation of the firm 56%
Range of products / services offered 50%
Quality of client reporting 42%
With the level of fees being the most commonly selected key criterion for choosing a private bank or wealth manager, it heightens the significance of charges being an area of dispute between some investors and the possibility of using the sector’s services.
Understandably investment performance remains of great importance as clients expect positive returns when placing their trust with investment professionals. This becomes even more apparent when asked the main reason they stay with a wealth manager or private bank.
With word of mouth being a key area of new business among the private banking and wealth management industry, it is understandable that brand plays a key part when selecting a firm. Its importance, however, diminishes as soon as a client comes on board. From then onwards, investors indicated that results (i.e. performance) remain their primary concern.

23B
BA
A W
ealth of Opportunities
Figure 4.4: Most important reason for staying with a private bank or wealth manager
Criteria % giving it as main reason
Investment performance 33%
Level and quality of communication 22%
The level of fees 17%
Brand of the wealth manager 9%
Breadth of service range 8%
Client loyalty was briefly mentioned before and results suggest the UK PBWM industry performs well in this respect. For example 60% of high net worth investors have not changed their private banks or wealth manager in the previous six years or indeed have never changed at all. Also only 11% suggested they are likely or very likely to change in the next twelve months (as opposed to 69% who said they are unlikely or very unlikely).
In some contrast to the results above were 54% of investors who stated they are now likely to invest without advice. However, it could be the case that these individuals will not transfer their entire portfolio to the execution only sector. Instead they could be keeping their existing relationship with a private bank or wealth manager and then opening a separate account with an execution only stockbroker to test their own investment skills.
4.3 Current service levels
We have seen that investors are likely to remain loyal to their private bank orwealth management firm provided service levels meet their requirements.
In terms of clarity and effectiveness of reporting, satisfaction levels of investors are high, with 87% stating they are satisfied with the current reporting they receive from their private bank or wealth management firm.
When asked which improvements could be made in this area, by far the most popular response was that no improvements are needed. For those that did suggest an improvement, more online access to reports was mentioned as well as increased simplification, provide additional graphing tools and allowing greater comparison of performance statistics.
Level and quality of communication was the second most important reason for staying with a private bank or wealth manager, with one to one review meetings the significant part of these communications.
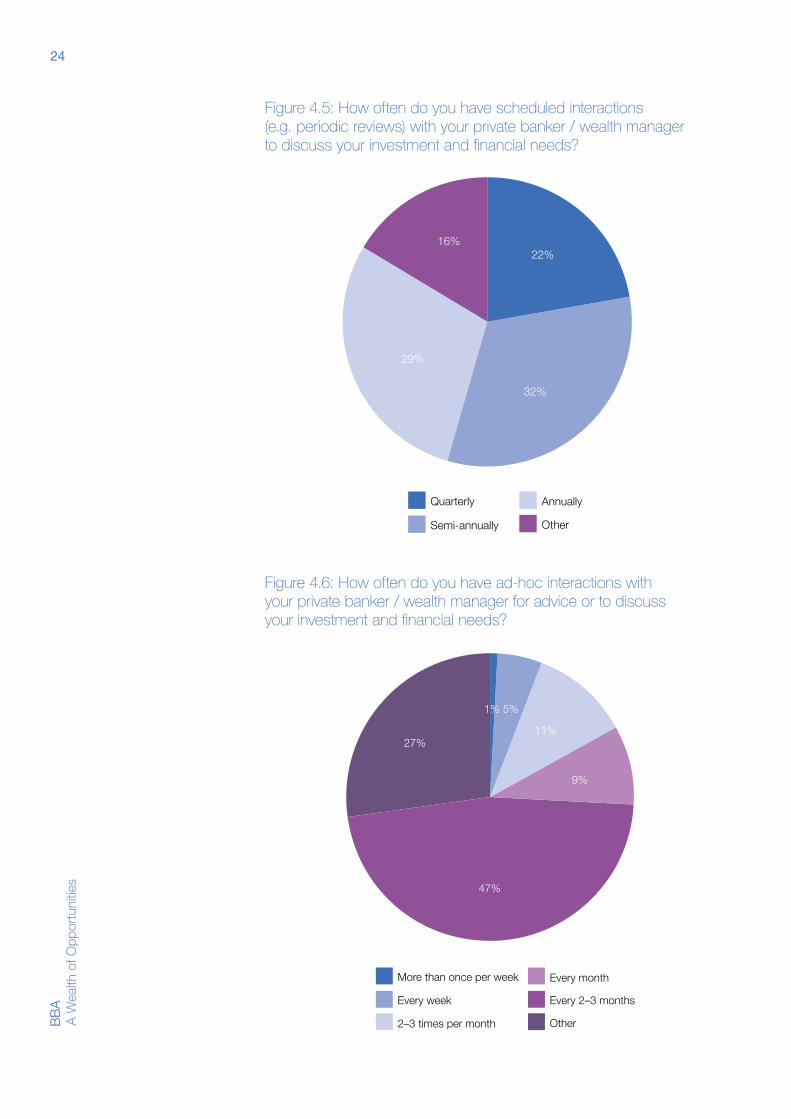
It is slightly more common for investors to meet their wealth manager twice a year in comparison to annually or quarterly. The 16% who suggested ‘other’ tended to be execution only investors and so did not require any meetings as they are not seeking advice.
Eighty-six per cent then suggested they do not want this to change, with only 11% wanting more frequent formal meetings – another positive satisfaction score for the industry.
Communication does not necessarily need to be just from periodic reviews. For example, some will offer regular contact on the phone with clients to provide brief updates.
24B
BA
A
Wea
lth o
f Opp
ortu
nitie
s
Figure 4.5: How often do you have scheduled interactions (e.g. periodic reviews) with your private banker / wealth manager to discuss your investment and financial needs?
Figure 4.5: How often do you have scheduled interac-tions (e.g. periodic reviews) with your private banker /
wealth manager to discuss your investment and
Quarterly
Semi-annually
Annually
Other
32%
22%16%
29%
Figure 4.6: How often do you have ad-hoc interactions with your private banker / wealth manager for advice or to discuss your investment and financial needs?
Figure 4.6: How often do you have ad-hoc interactions with your private banker / wealth manager for advice or
to discuss your investment and financial needs?
More than once per week
Every week
2–3 times per month
Every month
Every 2–3 months
Other
1% 5%
11%
9%
47%
27%

25B
BA
A W
ealth of Opportunities
The standout response was at least some form of contact every two to three months, with again the ‘Other’ selections predominantly being execution only investors not needing any form of contact. This too is meeting the needs of the investor with 89% wishing to remain at their current frequency.
Social media and mobile apps are hot topics in most industries and are areas that some have suggested wealth management needs to concentrate more on in upcoming years if they are to attract the “new breed of investor”.
Only 33% of investors commented that their wealth management firm or private bank offer the opportunity to interact via a mobile app, with even fewer (21%) having the option to interact via social media. However, there was a resounding (95%) answer of “no” when those who do not have access to either of these were asked if they would like to. It is therefore very clear that although this form of communication is necessary in other industries, it is unlikely to be a game changer in the near future.
When given a set of advantages and disadvantages for communicating in this manner and asked to rank their top three in terms of importance, there was a distinct focus on the disadvantages:
Figure 4.7: What do you see as the potential advantages /disadvantages of communicating via social media or mobile apps as opposed to more traditional channels? Rank 1, 2 or 3 in terms of importance (either positive or negative)
Individuals ranking it as 1
Individuals ranking it as 2
Individuals ranking it as 3
I don’t find social media or mobile apps allow me to communicate effectively with my private banker / wealth manager
66 57 48
Concerns over data security 56 50 55
Intrusive and distracting from my daily activities
53 55 41
Increased access to information regarding my investment
31 18 12
Greater flexibility of communication with my private banker / wealth manager
20 9 4
Doesn’t offer sufficient functionality to meet my investment needs
17 36 67
Increased control over my investment portfolio(s)
11 25 10
Provides a better level of service than traditional communication channels
1 5 18
26B
BA
A
Wea
lth o
f Opp
ortu
nitie
s
Investor’s major concerns are that it will not be effective, data security will be in jeopardy and it would become more of a distraction than a helpful tool.
These findings suggest that investors are generally meeting enough times with their investment service provider, they are satisfied with the reports they receive and want to stick with the traditional methods of communication, with little appetite for an increased social media presence.
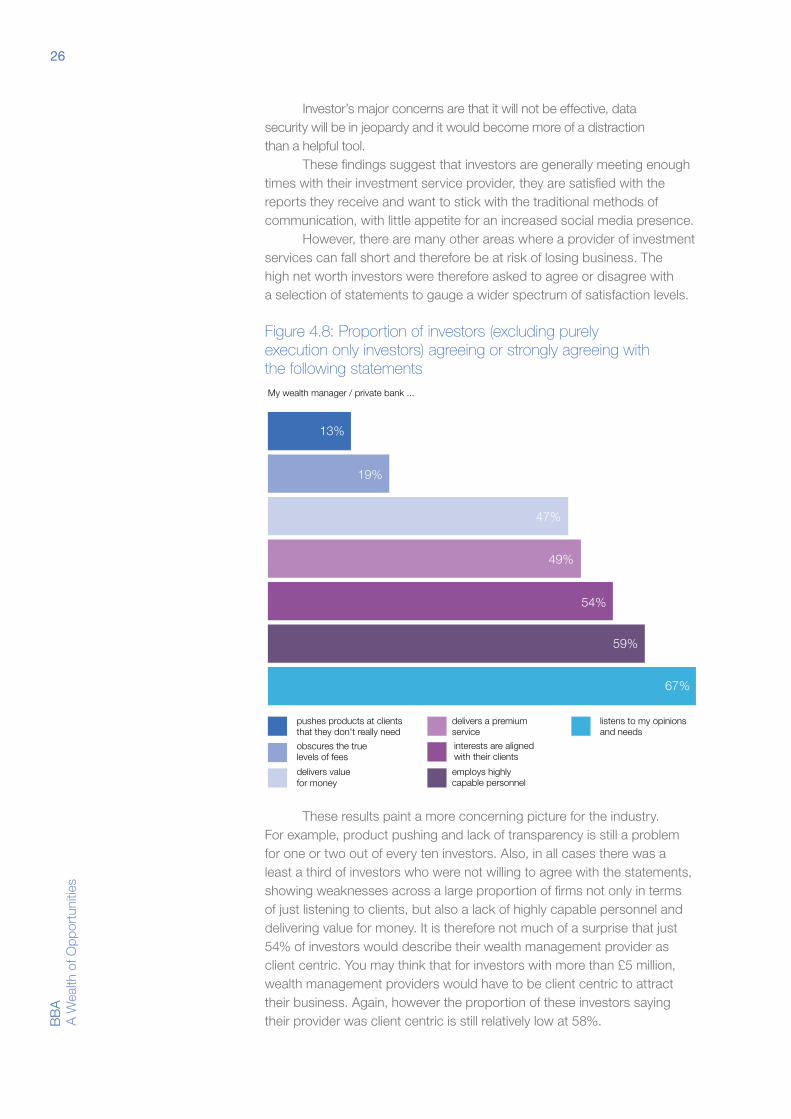
However, there are many other areas where a provider of investment services can fall short and therefore be at risk of losing business. The high net worth investors were therefore asked to agree or disagree with a selection of statements to gauge a wider spectrum of satisfaction levels.
Figure 4.8: Proportion of investors (excluding purely execution only investors) agreeing or strongly agreeing with the following statements
Figure 4.8: Proportion of investors (excluding purely Execution Only investors) agreeing or strongly agreeing
with the following statements
My wealth manager / private bank ...
listens to my opinions and needs
employs highly capable personnel
interests are aligned with their clients
pushes products at clients that they don't really need
delivers a premium service
delivers value for money
obscures the true levels of fees
13%
19%
47%
49%
54%
59%
67%
These results paint a more concerning picture for the industry. For example, product pushing and lack of transparency is still a problem for one or two out of every ten investors. Also, in all cases there was a least a third of investors who were not willing to agree with the statements, showing weaknesses across a large proportion of firms not only in terms of just listening to clients, but also a lack of highly capable personnel and delivering value for money. It is therefore not much of a surprise that just 54% of investors would describe their wealth management provider as client centric. You may think that for investors with more than £5 million, wealth management providers would have to be client centric to attract their business. Again, however the proportion of these investors saying their provider was client centric is still relatively low at 58%.
27B
BA
A W
ealth of Opportunities
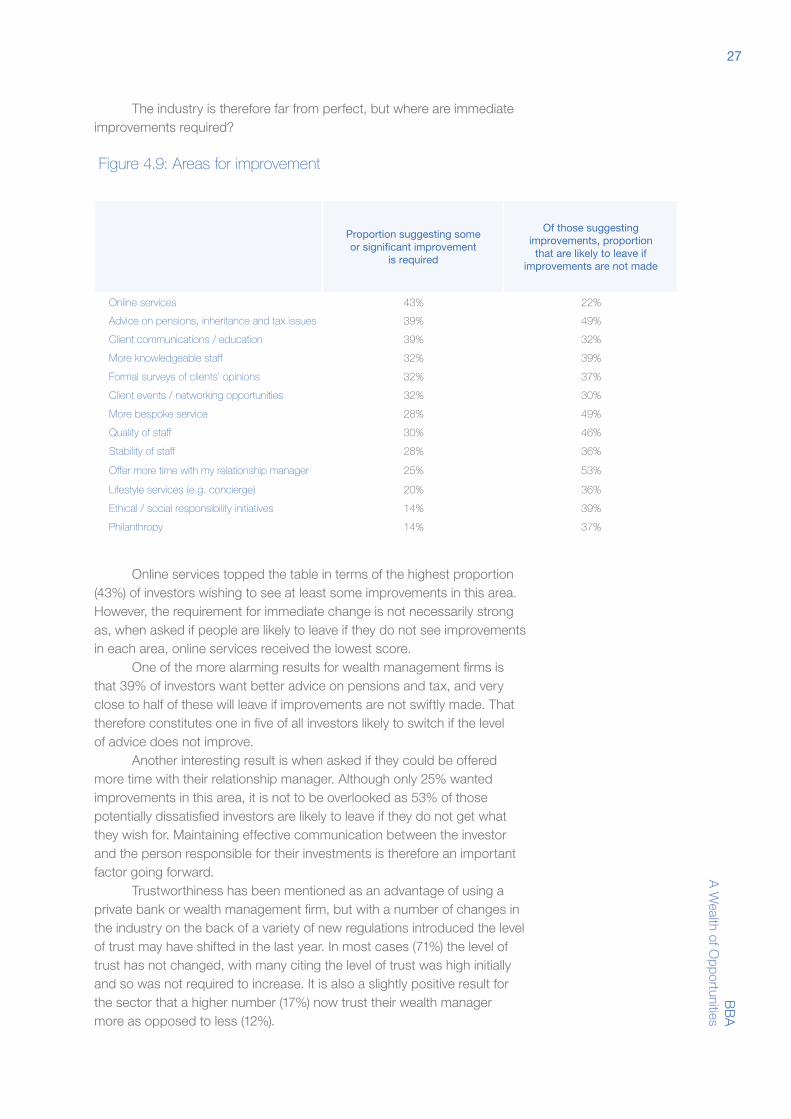
The industry is therefore far from perfect, but where are immediate improvements required?
Figure 4.9: Areas for improvement
Proportion suggesting some or significant improvement
is required
Of those suggesting improvements, proportion
that are likely to leave if improvements are not made
Online services 43% 22%
Advice on pensions, inheritance and tax issues 39% 49%
Client communications / education 39% 32%
More knowledgeable staff 32% 39%
Formal surveys of clients’ opinions 32% 37%
Client events / networking opportunities 32% 30%
More bespoke service 28% 49%
Quality of staff 30% 46%
Stability of staff 28% 36%
Offer more time with my relationship manager 25% 53%
Lifestyle services (e.g. concierge) 20% 36%
Ethical / social responsibility initiatives 14% 39%
Philanthropy 14% 37%
Online services topped the table in terms of the highest proportion (43%) of investors wishing to see at least some improvements in this area. However, the requirement for immediate change is not necessarily strong as, when asked if people are likely to leave if they do not see improvements in each area, online services received the lowest score.
One of the more alarming results for wealth management firms is that 39% of investors want better advice on pensions and tax, and very close to half of these will leave if improvements are not swiftly made. That therefore constitutes one in five of all investors likely to switch if the level of advice does not improve.
Another interesting result is when asked if they could be offered more time with their relationship manager. Although only 25% wanted improvements in this area, it is not to be overlooked as 53% of those potentially dissatisfied investors are likely to leave if they do not get what they wish for. Maintaining effective communication between the investor and the person responsible for their investments is therefore an important factor going forward.
Trustworthiness has been mentioned as an advantage of using a private bank or wealth management firm, but with a number of changes in the industry on the back of a variety of new regulations introduced the level of trust may have shifted in the last year. In most cases (71%) the level of trust has not changed, with many citing the level of trust was high initially and so was not required to increase. It is also a slightly positive result for the sector that a higher number (17%) now trust their wealth manager more as opposed to less (12%).
28B
BA
A
Wea
lth o
f Opp
ortu
nitie
s
4.4 Philanthropy
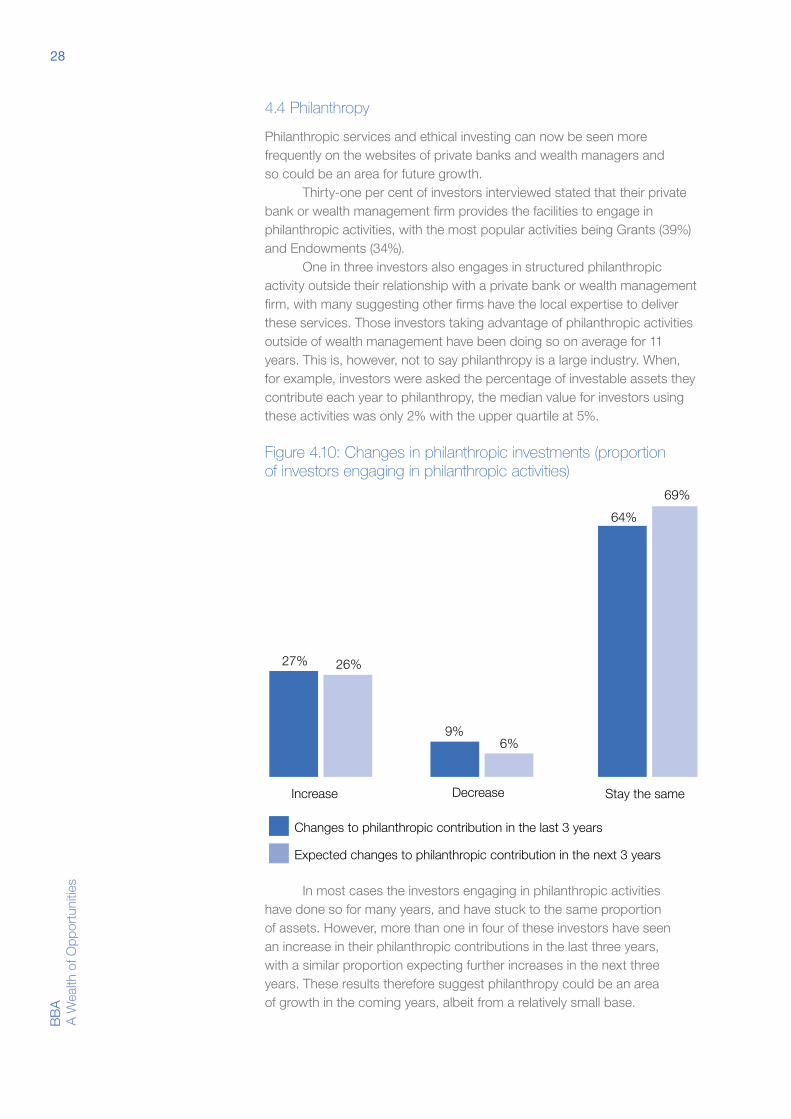
Philanthropic services and ethical investing can now be seen more frequently on the websites of private banks and wealth managers and so could be an area for future growth.
Thirty-one per cent of investors interviewed stated that their private bank or wealth management firm provides the facilities to engage in philanthropic activities, with the most popular activities being Grants (39%) and Endowments (34%).
One in three investors also engages in structured philanthropic activity outside their relationship with a private bank or wealth management firm, with many suggesting other firms have the local expertise to deliver these services. Those investors taking advantage of philanthropic activities outside of wealth management have been doing so on average for 11 years. This is, however, not to say philanthropy is a large industry. When, for example, investors were asked the percentage of investable assets they contribute each year to philanthropy, the median value for investors using these activities was only 2% with the upper quartile at 5%.
Figure 4.10: Changes in philanthropic investments (proportion of investors engaging in philanthropic activities)
Stay the sameDecreaseIncrease
Figure 4.10: Changes in philanthropic investments (proportion of investors engaging in philanthropic
Changes to philanthropic contribution in the last 3 years
Expected changes to philanthropic contribution in the next 3 years
27%
64%
69%
26%
9%6%
In most cases the investors engaging in philanthropic activities have done so for many years, and have stuck to the same proportion of assets. However, more than one in four of these investors have seen an increase in their philanthropic contributions in the last three years, with a similar proportion expecting further increases in the next three years. These results therefore suggest philanthropy could be an area of growth in the coming years, albeit from a relatively small base.
29B
BA
A W
ealth of Opportunities
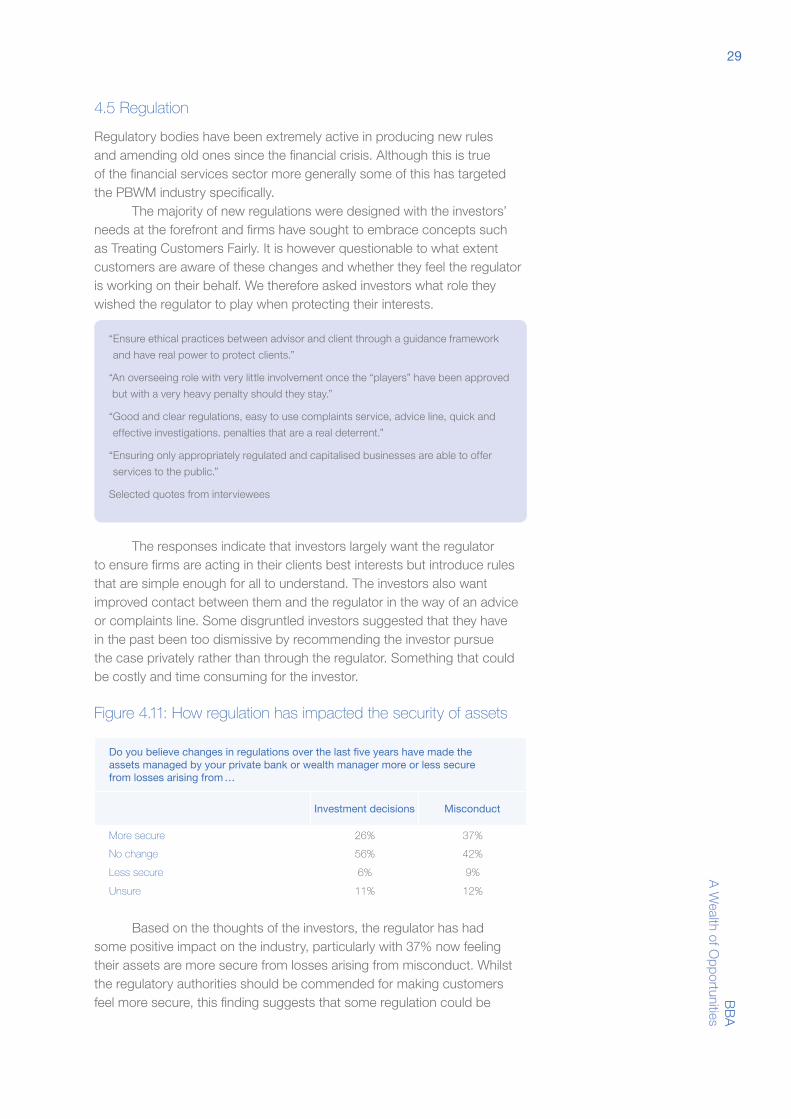
4.5 Regulation
Regulatory bodies have been extremely active in producing new rules and amending old ones since the financial crisis. Although this is true of the financial services sector more generally some of this has targeted the PBWM industry specifically.
The majority of new regulations were designed with the investors’ needs at the forefront and firms have sought to embrace concepts such as Treating Customers Fairly. It is however questionable to what extent customers are aware of these changes and whether they feel the regulator is working on their behalf. We therefore asked investors what role they wished the regulator to play when protecting their interests.
“ Ensure ethical practices between advisor and client through a guidance framework
and have real power to protect clients.”
“ An overseeing role with very little involvement once the “players” have been approved
but with a very heavy penalty should they stay.”
“ Good and clear regulations, easy to use complaints service, advice line, quick and
effective investigations. penalties that are a real deterrent.”
“ Ensuring only appropriately regulated and capitalised businesses are able to offer
services to the public.”
Selected quotes from interviewees
The responses indicate that investors largely want the regulator to ensure firms are acting in their clients best interests but introduce rules that are simple enough for all to understand. The investors also want improved contact between them and the regulator in the way of an advice or complaints line. Some disgruntled investors suggested that they have in the past been too dismissive by recommending the investor pursue the case privately rather than through the regulator. Something that could be costly and time consuming for the investor.
Figure 4.11: How regulation has impacted the security of assets
Do you believe changes in regulations over the last five years have made the assets managed by your private bank or wealth manager more or less secure from losses arising from …
Investment decisions Misconduct
More secure 26% 37%
No change 56% 42%
Less secure 6% 9%
Unsure 11% 12%
Based on the thoughts of the investors, the regulator has had some positive impact on the industry, particularly with 37% now feeling their assets are more secure from losses arising from misconduct. Whilst the regulatory authorities should be commended for making customers feel more secure, this finding suggests that some regulation could be
30B
BA
A
Wea
lth o
f Opp
ortu
nitie
s
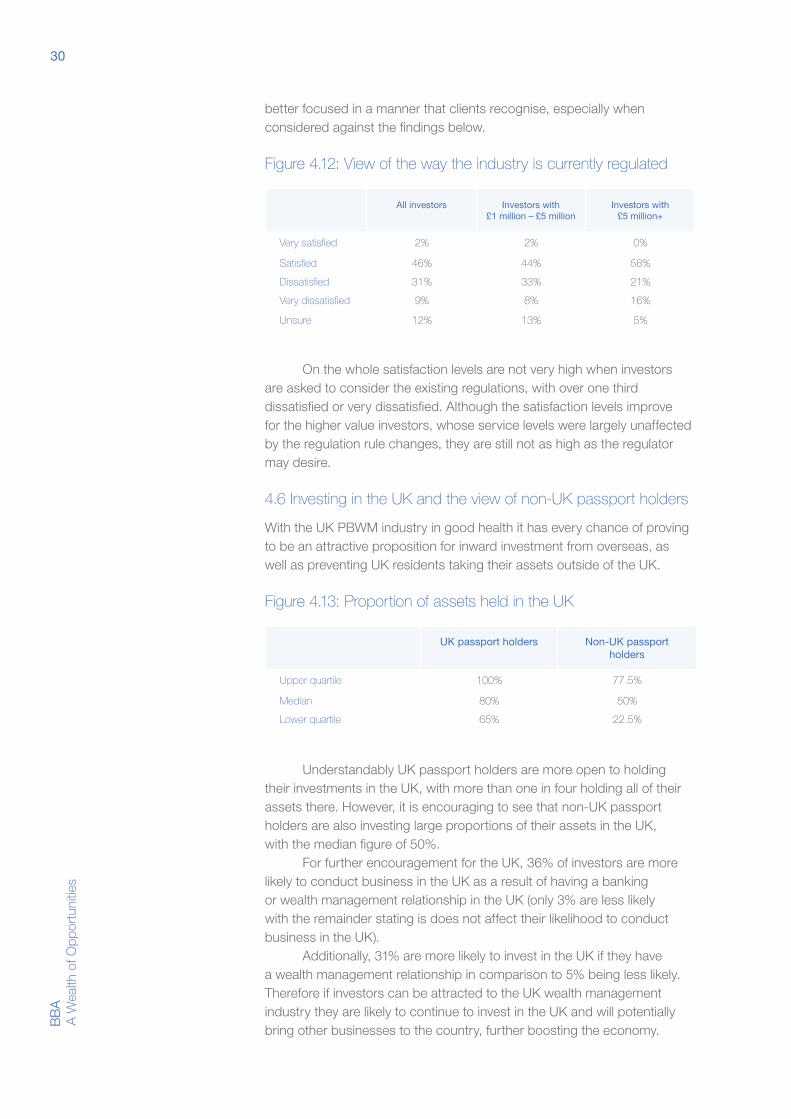
better focused in a manner that clients recognise, especially when considered against the findings below.
Figure 4.12: View of the way the industry is currently regulated
All investors Investors with £1 million – £5 million
Investors with £5 million+
Very satisfied 2% 2% 0%
Satisfied 46% 44% 58%
Dissatisfied 31% 33% 21%
Very dissatisfied 9% 8% 16%
Unsure 12% 13% 5%
On the whole satisfaction levels are not very high when investors are asked to consider the existing regulations, with over one third dissatisfied or very dissatisfied. Although the satisfaction levels improve for the higher value investors, whose service levels were largely unaffected by the regulation rule changes, they are still not as high as the regulator may desire.
4.6 Investing in the UK and the view of non-UK passport holders
With the UK PBWM industry in good health it has every chance of proving to be an attractive proposition for inward investment from overseas, as well as preventing UK residents taking their assets outside of the UK.
Figure 4.13: Proportion of assets held in the UK
UK passport holders Non-UK passport holders
Upper quartile 100% 77.5%
Median 80% 50%
Lower quartile 65% 22.5%
Understandably UK passport holders are more open to holding their investments in the UK, with more than one in four holding all of their assets there. However, it is encouraging to see that non-UK passport holders are also investing large proportions of their assets in the UK, with the median figure of 50%.
For further encouragement for the UK, 36% of investors are more likely to conduct business in the UK as a result of having a banking or wealth management relationship in the UK (only 3% are less likely with the remainder stating is does not affect their likelihood to conduct business in the UK).
Additionally, 31% are more likely to invest in the UK if they have a wealth management relationship in comparison to 5% being less likely. Therefore if investors can be attracted to the UK wealth management industry they are likely to continue to invest in the UK and will potentially bring other businesses to the country, further boosting the economy.

31B
BA
A W
ealth of Opportunities
Expectations are good with 88% of all investors likely to spend more or the same time in the UK over the next three years, and 87% suggesting they will invest more or the same as they currently do in the UK over the same period.
The key issues that would encourage investors to increase their UK assets include improvements in economic prospects and growth, a more favourable tax environment and strong investment returns among UK stocks.
However, with any investment hub it will have its drawbacks and most of the investors outlined political implications that they view as a risk and would have a negative effect on their UK investments.
“ In terms of investments – if economic conditions in the UK became very unfavourable
as compared to other locations. As to time spent in the UK, I have no intention to live
anywhere but the UK.”
“Reduced returns – increase in market uncertainty.”
“ I would not consider investing the majority of my wealth other than in the UK
through the ultimate investments will continue to be global depending on
investment judgement.”
Selected quotes from interviewees
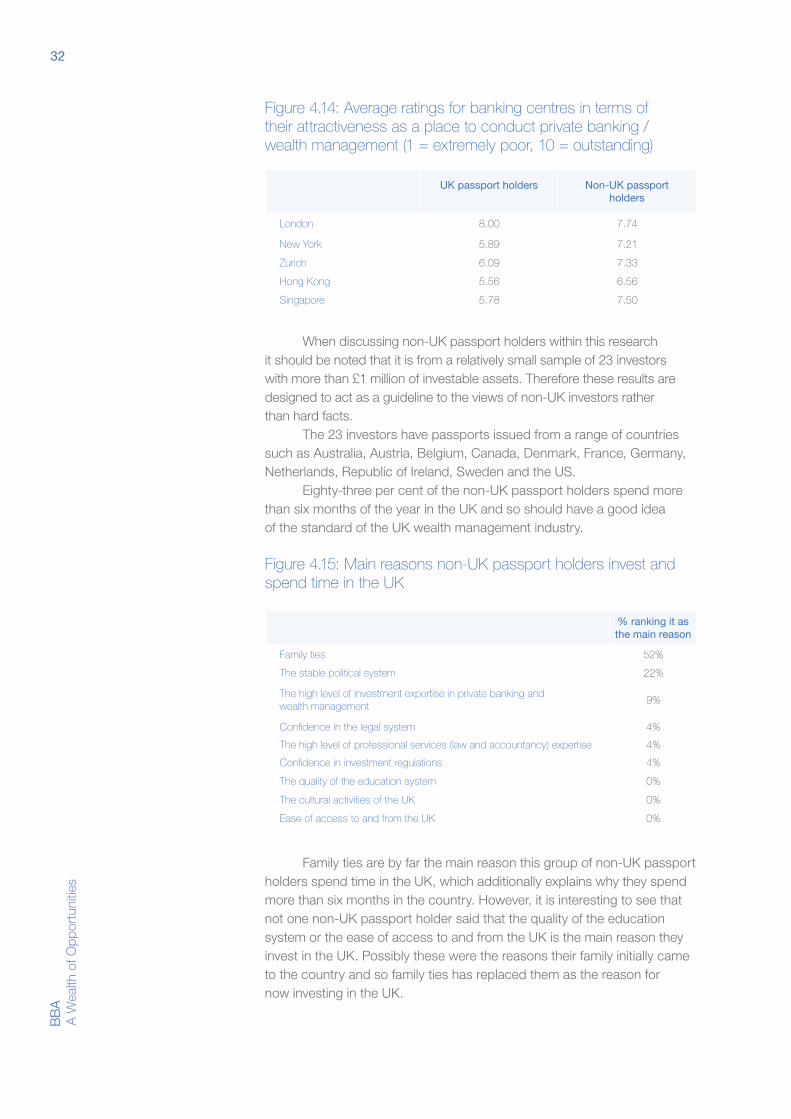
Comparing the UK to other large investment centres, the interviewees were asked to rate each of the centres in terms of the attractiveness as a place to conduct their private banking / wealth management.
The rating was on a scale of 1–10, where 1 is extremely poor and 10 is outstanding.
For UK passport holders London was by far the best rated banking centre for conducting wealth management, coming in with an average of 8, almost 2 higher than each of the other centres. This is, however, likely to include some bias given they are from the UK and also these investors may not be as familiar with other centres. However, even when reviewing the non-UK passport holders, London was still the top scorer albeit only marginally ahead of the others.
“ I split my time between France & UK so any tax law changes or implications in
either country.”
“ I could increase % of UK investment if that was an appropriate move for potential
investment growth.”
“ I like the country, the mentality and the work / life balance. It is a more dynamic
environment than most comparable countries.”
Selected quotes from interviewees
32B
BA
A
Wea
lth o
f Opp
ortu
nitie
s
Figure 4.14: Average ratings for banking centres in terms of their attractiveness as a place to conduct private banking / wealth management (1 = extremely poor, 10 = outstanding)
UK passport holders Non-UK passport holders
London 8.00 7.74
New York 5.89 7.21
Zurich 6.09 7.33
Hong Kong 5.56 6.56
Singapore 5.78 7.50
When discussing non-UK passport holders within this research it should be noted that it is from a relatively small sample of 23 investors with more than £1 million of investable assets. Therefore these results are designed to act as a guideline to the views of non-UK investors rather than hard facts.
The 23 investors have passports issued from a range of countries such as Australia, Austria, Belgium, Canada, Denmark, France, Germany, Netherlands, Republic of Ireland, Sweden and the US.
Eighty-three per cent of the non-UK passport holders spend more than six months of the year in the UK and so should have a good idea of the standard of the UK wealth management industry.
Figure 4.15: Main reasons non-UK passport holders invest and spend time in the UK
% ranking it as the main reason
Family ties 52%
The stable political system 22%
The high level of investment expertise in private banking and wealth management
9%
Confidence in the legal system 4%
The high level of professional services (law and accountancy) expertise 4%
Confidence in investment regulations 4%
The quality of the education system 0%
The cultural activities of the UK 0%
Ease of access to and from the UK 0%
Family ties are by far the main reason this group of non-UK passport holders spend time in the UK, which additionally explains why they spend more than six months in the country. However, it is interesting to see that not one non-UK passport holder said that the quality of the education system or the ease of access to and from the UK is the main reason they invest in the UK. Possibly these were the reasons their family initially came to the country and so family ties has replaced them as the reason for now investing in the UK.

33B
BA
A W
ealth of Opportunities
Five of the 23 investors agreed that the fact they have a banking or wealth management relationship in the UK makes them more likely to take up full time residency whereas the remainder all said it does not affect the likelihood.

34B
BA
A
Wea
lth o
f Opp
ortu
nitie
s
Key findings: · Investment assets increased for the fifth year running, reaching a
new high of £524.4 billion as at the end of 2013. This represented year on year growth of 11.4%.
· In comparison to 2012 the number of wealth management firms has declined from 126 to 119 by the end of 2013. Large, powerful firms are increasingly looking to merge in order to consolidate market share, and a number of new firms may currently be too small to meet the criteria for inclusion.
· The UK PBWM sector continues to function well in the key business performance metrics with a new annual record for revenues.
· Staff costs decreased for wealth managers in 2013 (down marginally, by 0.3%). Investment management costs not only continue to be the major staff cost component for wealth managers, but have also seen the second largest percentage increase in 2013.
· Absolute pre-tax profit across all wealth managers grew significantly in 2013 and hit a new record of £1.15 billion (2012: £0.95 billion).
CHAPTER 3 Latest trends

35B
BA
A W
ealth of Opportunities
Having heard the views of investors and seen the contribution the PBWM sector is making to the UK economy, it is interesting to consider the health of the sector and whether it can sustain these contributions going forward. Therefore in these final sections we outline the recent trends in the UK PBWM Industry, in particular reviewing the key business performance metrics. These trends have been formed based on data collected as part of ComPeer’s Annual Benchmarking Survey.
Criteria for inclusion All firms included in ComPeer’s Annual Benchmarking Survey, which have been aggregated for this industry report must follow these criteria:
· All data relates to private client business only (i.e. no institutional business).
· All surveyed participants must have at least £50 million under management or funds under administration at the end of the calendar year to be included.
· Only UK operations are included. If a firm has offshore operations (e.g. in the Isle of Man), the non-UK assets can be included if all revenues, staff and costs associated with their management are directed through the UK onshore division.
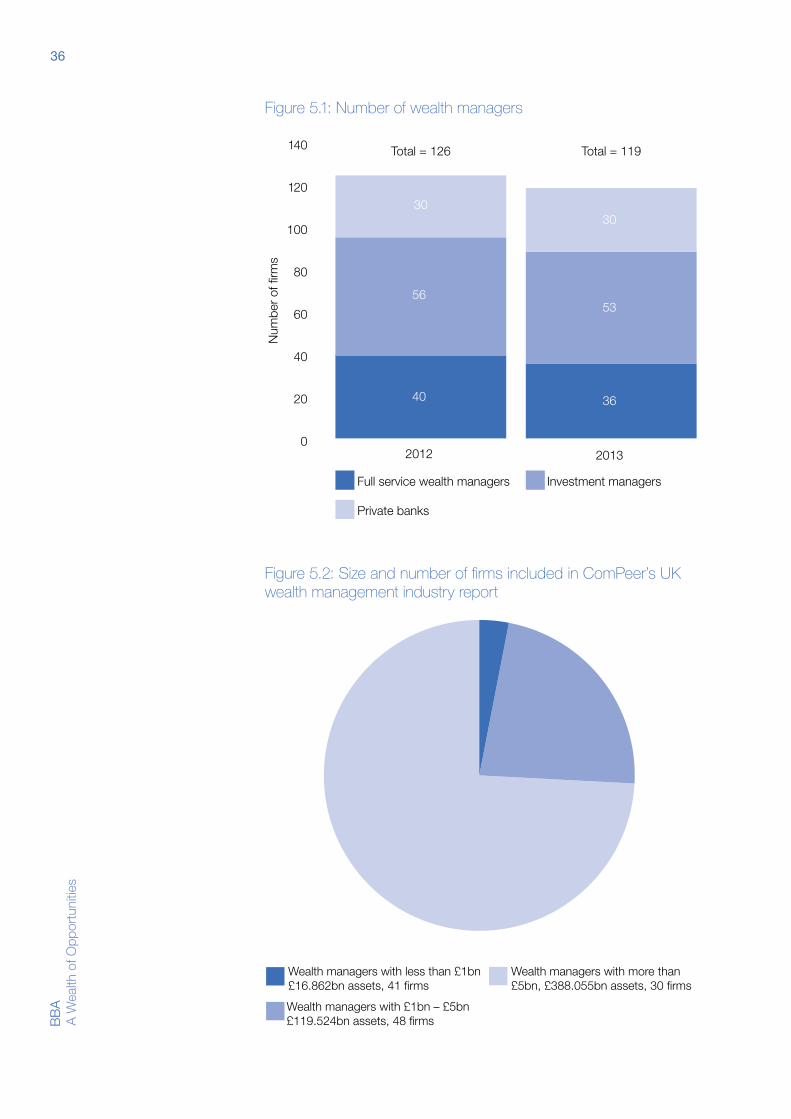
Number of firmsFigure 5.1 shows the number of firms that have been included in ComPeer’s two most recent annual benchmarking surveys.
In comparison to 2012 the number of wealth managers has declined from 126 to 119. Large, powerful firms are increasingly seeking to merge in order to consolidate market share.
Of those acquisitions in 2013, the blockbuster merger between Schroders and Cazenove created a firm with the combined strengths of two very different, but solidly performing firms. The Standard Life Wealth and Newton deal showed that it is not always the case of large firms taking over much smaller ones, but again indicated the larger firms’ appetite (even need) to grow through mergers.
It should however be acknowledged that a number of newer firms may currently be too small to meet the criteria for inclusion in this review.
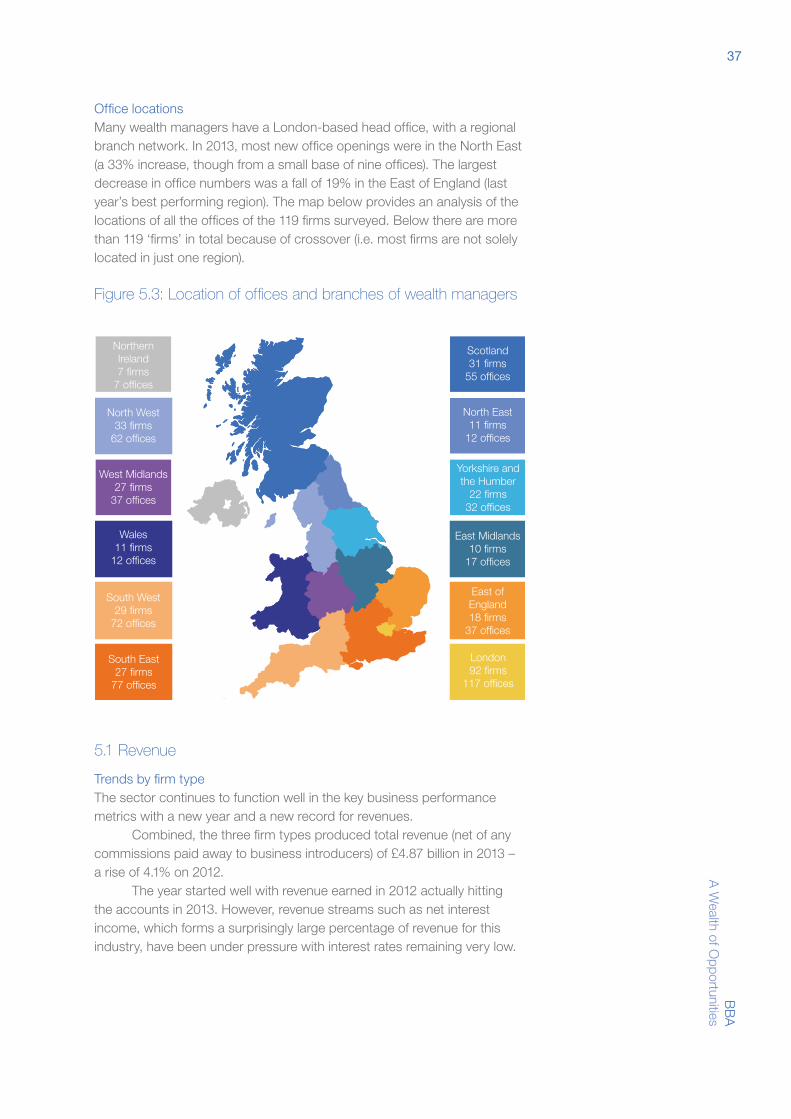
Spread in size of firmsThe 119 firms analysed in this report vary in size and service, ranging from full service wealth managers developing the original stockbroking model, to the major UK private banks and UK divisions of global private banks.
Figure 5.2 shows the spread in firms by value of investment assets, with full service wealth managers, investment managers and private banks all being classified as wealth managers. The proportions in the chart are based on the share of investment assets the firms in each category provide custody for or manage.
36B
BA
A
Wea
lth o
f Opp
ortu
nitie
s
Figure 5.1: Number of wealth managers
0
20
40
60
80
100
120
140
Full service wealth managers
Figure 5.1 Number of wealth managers
Investment managers
Private banks
40 36
56 53
30
Total = 126 Total = 119
30
2012 2013
Num
ber
of fi
rms
Figure 5.2: Size and number of firms included in ComPeer’s UK wealth management industry report
Figure 5.2 Size and number of firms included in ComPeer’s UK Wealth Management industry
report
Wealth managers with £1bn – £5bn£119.524bn assets, 48 firms
Wealth managers with less than £1bn £16.862bn assets, 41 firms
Wealth managers with more than £5bn, £388.055bn assets, 30 firms
37B
BA
A W
ealth of Opportunities
Office locationsMany wealth managers have a London-based head office, with a regional branch network. In 2013, most new office openings were in the North East (a 33% increase, though from a small base of nine offices). The largest decrease in office numbers was a fall of 19% in the East of England (last year’s best performing region). The map below provides an analysis of the locations of all the offices of the 119 firms surveyed. Below there are more than 119 ‘firms’ in total because of crossover (i.e. most firms are not solely located in just one region).
Figure 5.3: Location of offices and branches of wealth managers Figure 5.3: Location of offices and branches of Wealth Managers
North West33 firms
62 offices
West Midlands27 firms
37 offices
Wales11 firms
12 offices
South West29 firms
72 offices
South East27 firms
77 offices
Northern Ireland7 firms
7 offices
London92 firms
117 offices
East of England18 firms
37 offices
East Midlands10 firms
17 offices
Scotland31 firms
55 offices
North East11 firms
12 offices
Yorkshire and the Humber
22 firms32 offices
5.1 Revenue
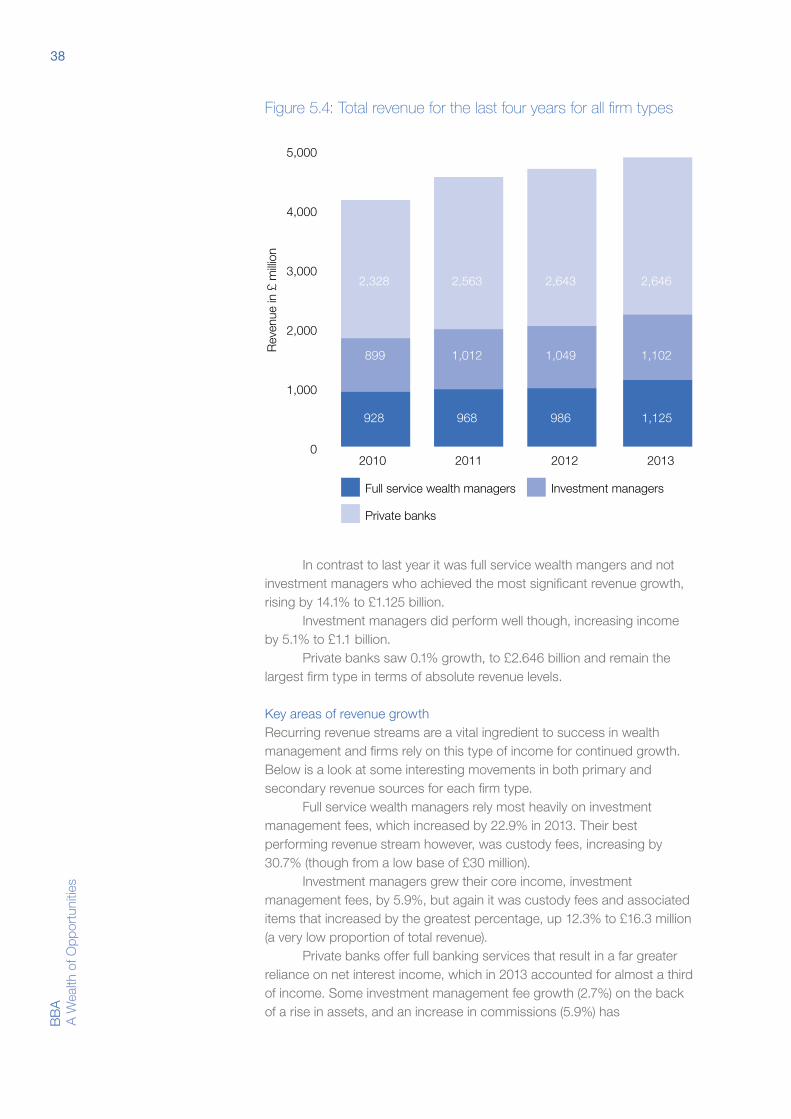
Trends by firm typeThe sector continues to function well in the key business performance metrics with a new year and a new record for revenues.
Combined, the three firm types produced total revenue (net of any commissions paid away to business introducers) of £4.87 billion in 2013 – a rise of 4.1% on 2012.
The year started well with revenue earned in 2012 actually hitting the accounts in 2013. However, revenue streams such as net interest income, which forms a surprisingly large percentage of revenue for this industry, have been under pressure with interest rates remaining very low.
38B
BA
A
Wea
lth o
f Opp
ortu
nitie
s
Figure 5.4: Total revenue for the last four years for all firm types
0
1,000
2,000
3,000
4,000
5,000
2013201220112010
Rev
enue
in £
milli
on
Figure 5.4: Investment assets by firm type
Full service wealth managers Investment managers
Private banks
928 968 986 1,125
899 1,012
2,563
1,049 1,102
2,643 2,6462,328
In contrast to last year it was full service wealth mangers and not investment managers who achieved the most significant revenue growth, rising by 14.1% to £1.125 billion.
Investment managers did perform well though, increasing income by 5.1% to £1.1 billion.
Private banks saw 0.1% growth, to £2.646 billion and remain the largest firm type in terms of absolute revenue levels.
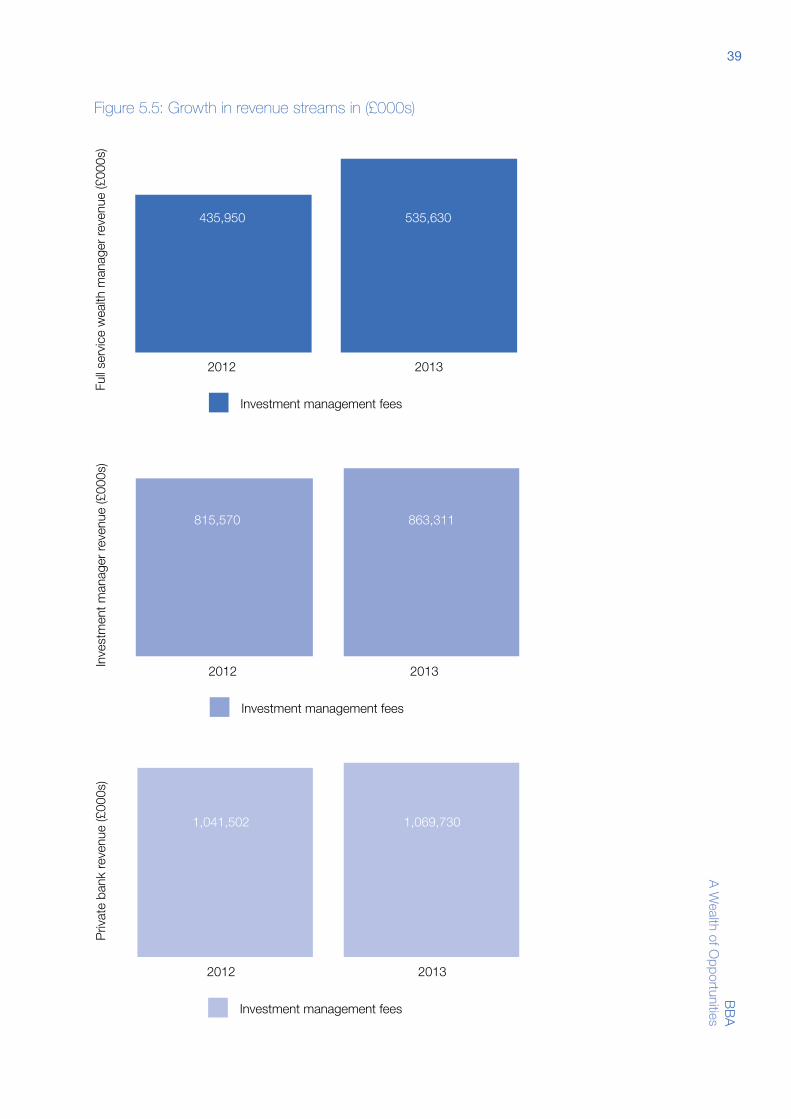
Key areas of revenue growthRecurring revenue streams are a vital ingredient to success in wealth management and firms rely on this type of income for continued growth. Below is a look at some interesting movements in both primary and secondary revenue sources for each firm type.
Full service wealth managers rely most heavily on investment management fees, which increased by 22.9% in 2013. Their best performing revenue stream however, was custody fees, increasing by 30.7% (though from a low base of £30 million).
Investment managers grew their core income, investment management fees, by 5.9%, but again it was custody fees and associated items that increased by the greatest percentage, up 12.3% to £16.3 million (a very low proportion of total revenue).
Private banks offer full banking services that result in a far greater reliance on net interest income, which in 2013 accounted for almost a third of income. Some investment management fee growth (2.7%) on the back of a rise in assets, and an increase in commissions (5.9%) has
39B
BA
A W
ealth of Opportunities
Figure 5.5: Growth in revenue streams in (£000s)
20132012
Full s
ervic
e w
ealth
man
ager
reve
nue
(£00
0s)
Investment management fees
535,630435,950
Figure 5.5:Growth in revenue streams in £k
0.00.20.40.60.81.0
20132012
Inve
stm
ent m
anag
er re
venu
e (£
000s
)
Investment management fees
863,311815,570
Figure 5.5:Growth in revenue streams in £k
20132012
Priv
ate
bank
reve
nue
(£00
0s)
Investment management fees
1,069,7301,041,502
Figure 5.5:Growth in revenue streams in £k
40B
BA
A
Wea
lth o
f Opp
ortu
nitie
s
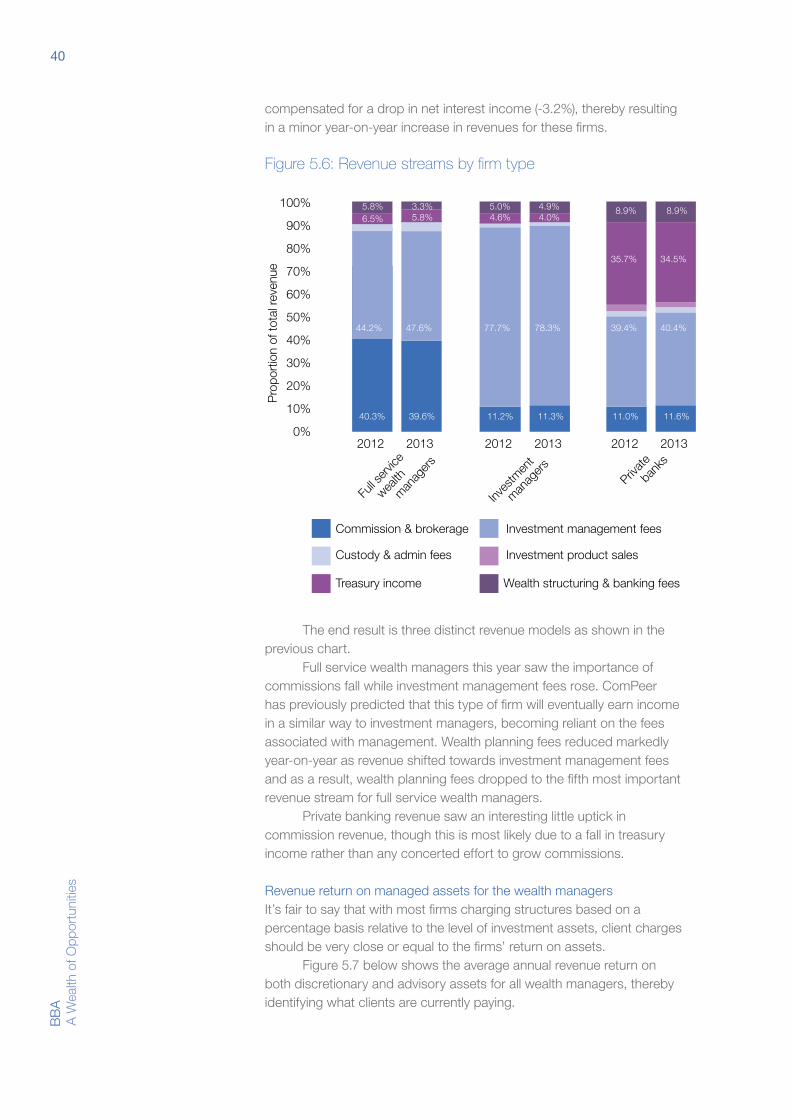
compensated for a drop in net interest income (-3.2%), thereby resulting in a minor year-on-year increase in revenues for these firms.
Figure 5.6: Revenue streams by firm type
0%
10%
20%
30%
40%
50%
60%
70%
80%
90%
100%
2012 2013 2012 2013 2012 2013
Pro
port
ion
of to
tal r
even
ue
Commission & brokerage
Figure 5.6: Revenue streams by firm type
Treasury income
Custody & admin fees
Full s
ervice
wealth
man
ager
s
Inves
tmen
t
manag
ersPriv
ate
bank
s
Investment management fees
Wealth structuring & banking fees
Investment product sales
40.3% 39.6%
47.6%44.2%
5.8%6.5%
3.3%5.8% 4.6% 4.0%
5.0% 4.9%
77.7% 78.3% 39.4% 40.4%
35.7% 34.5%
8.9% 8.9%
11.2% 11.3% 11.0% 11.6%
The end result is three distinct revenue models as shown in the previous chart.
Full service wealth managers this year saw the importance of commissions fall while investment management fees rose. ComPeer has previously predicted that this type of firm will eventually earn income in a similar way to investment managers, becoming reliant on the fees associated with management. Wealth planning fees reduced markedly year-on-year as revenue shifted towards investment management fees and as a result, wealth planning fees dropped to the fifth most important revenue stream for full service wealth managers.
Private banking revenue saw an interesting little uptick in commission revenue, though this is most likely due to a fall in treasury income rather than any concerted effort to grow commissions.
Revenue return on managed assets for the wealth managersIt’s fair to say that with most firms charging structures based on a percentage basis relative to the level of investment assets, client charges should be very close or equal to the firms’ return on assets.
Figure 5.7 below shows the average annual revenue return on both discretionary and advisory assets for all wealth managers, thereby identifying what clients are currently paying.
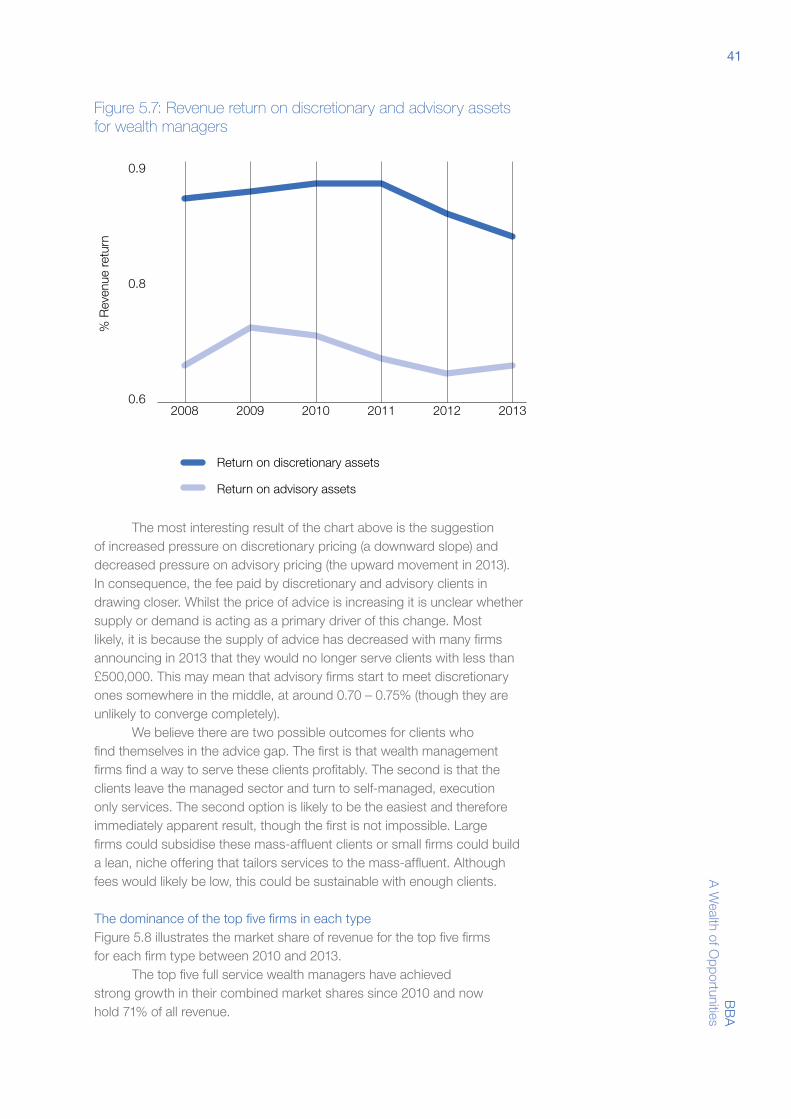
41B
BA
A W
ealth of Opportunities
Figure 5.7: Revenue return on discretionary and advisory assets for wealth managers
0.6
0.8
0.9
201320122011201020092008
% R
even
ue re
turn
Return on discretionary assets
Figure 5.7: Revenue return on discretionary and advisory assets for wealth managers
Return on advisory assets
The most interesting result of the chart above is the suggestion of increased pressure on discretionary pricing (a downward slope) and decreased pressure on advisory pricing (the upward movement in 2013). In consequence, the fee paid by discretionary and advisory clients in drawing closer. Whilst the price of advice is increasing it is unclear whether supply or demand is acting as a primary driver of this change. Most likely, it is because the supply of advice has decreased with many firms announcing in 2013 that they would no longer serve clients with less than £500,000. This may mean that advisory firms start to meet discretionary ones somewhere in the middle, at around 0.70 – 0.75% (though they are unlikely to converge completely).
We believe there are two possible outcomes for clients who find themselves in the advice gap. The first is that wealth management firms find a way to serve these clients profitably. The second is that the clients leave the managed sector and turn to self-managed, execution only services. The second option is likely to be the easiest and therefore immediately apparent result, though the first is not impossible. Large firms could subsidise these mass-affluent clients or small firms could build a lean, niche offering that tailors services to the mass-affluent. Although fees would likely be low, this could be sustainable with enough clients.
The dominance of the top five firms in each typeFigure 5.8 illustrates the market share of revenue for the top five firms for each firm type between 2010 and 2013.
The top five full service wealth managers have achieved strong growth in their combined market shares since 2010 and now hold 71% of all revenue.
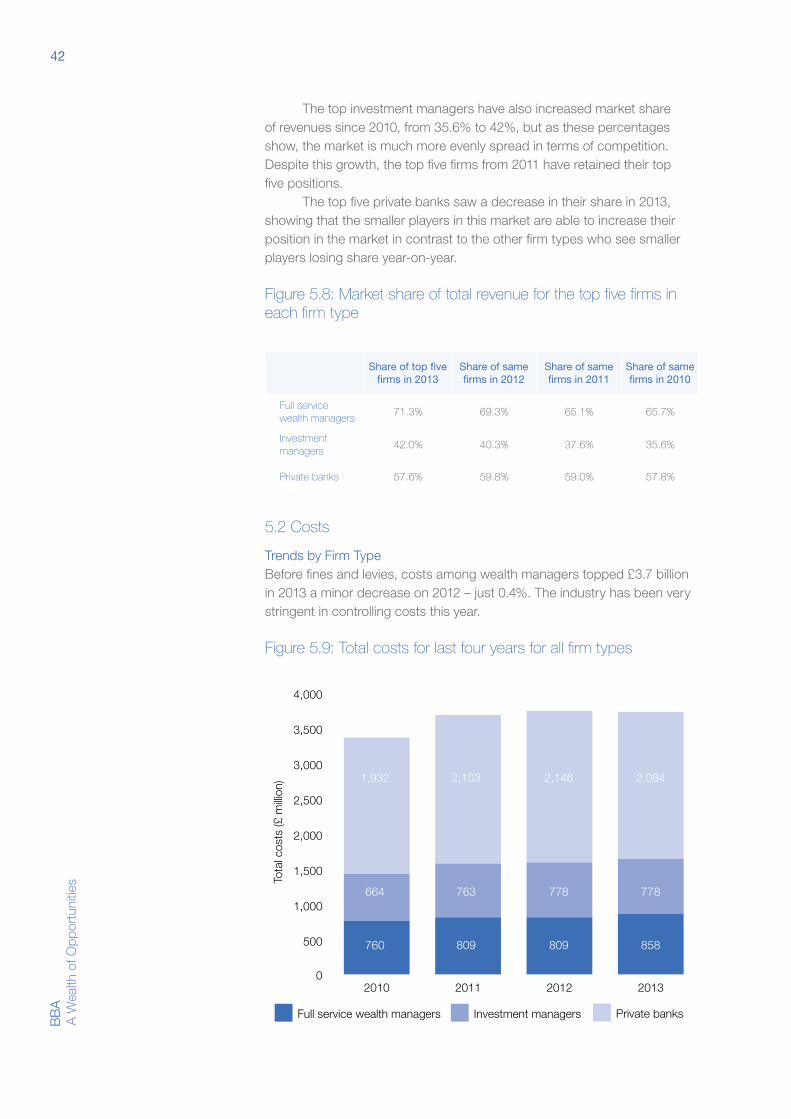
42B
BA
A
Wea
lth o
f Opp
ortu
nitie
s
The top investment managers have also increased market share of revenues since 2010, from 35.6% to 42%, but as these percentages show, the market is much more evenly spread in terms of competition. Despite this growth, the top five firms from 2011 have retained their top five positions.
The top five private banks saw a decrease in their share in 2013, showing that the smaller players in this market are able to increase their position in the market in contrast to the other firm types who see smaller players losing share year-on-year.
Figure 5.8: Market share of total revenue for the top five firms in each firm type
Share of top five firms in 2013
Share of same firms in 2012
Share of same firms in 2011
Share of same firms in 2010
Full service wealth managers
71.3% 69.3% 65.1% 65.7%
Investment managers
42.0% 40.3% 37.6% 35.6%
Private banks 57.6% 59.8% 59.0% 57.8%
5.2 Costs
Trends by Firm TypeBefore fines and levies, costs among wealth managers topped £3.7 billion in 2013 a minor decrease on 2012 – just 0.4%. The industry has been very stringent in controlling costs this year.
Figure 5.9: Total costs for last four years for all firm types
0
500
1,000
1,500
2,000
2,500
3,000
3,500
4,000
2013201220112010
Tota
l cos
ts (£
milli
on)
Figure 5.9 Total costs for last four years for all firm types
Investment managersFull service wealth managers Private banks
664 763 778 778
1,932 2,103 2,146 2,084
760 809 809 858
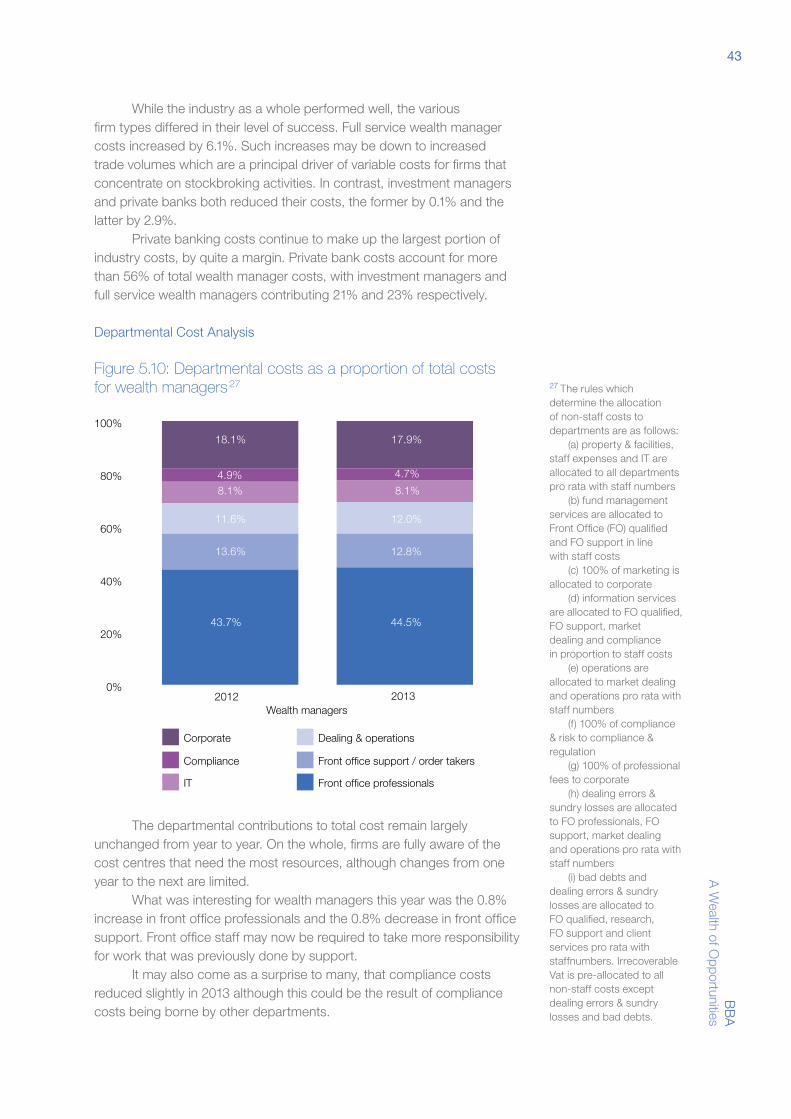
43B
BA
A W
ealth of Opportunities
While the industry as a whole performed well, the various firm types differed in their level of success. Full service wealth manager costs increased by 6.1%. Such increases may be down to increased trade volumes which are a principal driver of variable costs for firms that concentrate on stockbroking activities. In contrast, investment managers and private banks both reduced their costs, the former by 0.1% and the latter by 2.9%.
Private banking costs continue to make up the largest portion of industry costs, by quite a margin. Private bank costs account for more than 56% of total wealth manager costs, with investment managers and full service wealth managers contributing 21% and 23% respectively.
Departmental Cost Analysis
Figure 5.10: Departmental costs as a proportion of total costs for wealth managers27
0%
20%
40%
60%
80%
100%
20132012
Corporate
Figure 5.10: Departmental costs27 as a propor-tion of total costs for Wealth Managers
Compliance
IT
Dealing & operations
Front office support / order takers
Front office professionals
Wealth managers
12.8%
44.5%43.7%
13.6%
12.0%11.6%
8.1%8.1%
4.7%4.9%
17.9%18.1%
The departmental contributions to total cost remain largely unchanged from year to year. On the whole, firms are fully aware of the cost centres that need the most resources, although changes from one year to the next are limited.
What was interesting for wealth managers this year was the 0.8% increase in front office professionals and the 0.8% decrease in front office support. Front office staff may now be required to take more responsibility for work that was previously done by support.
It may also come as a surprise to many, that compliance costs reduced slightly in 2013 although this could be the result of compliance costs being borne by other departments.
27 The rules which determine the allocation of non-staff costs to departments are as follows: (a) property & facilities, staff expenses and IT are allocated to all departments pro rata with staff numbers (b) fund management services are allocated to Front Office (FO) qualified and FO support in line with staff costs (c) 100% of marketing is allocated to corporate (d) information services are allocated to FO qualified, FO support, market dealing and compliance in proportion to staff costs (e) operations are allocated to market dealing and operations pro rata with staff numbers (f) 100% of compliance & risk to compliance & regulation (g) 100% of professional fees to corporate (h) dealing errors & sundry losses are allocated to FO professionals, FO support, market dealing and operations pro rata with staff numbers (i) bad debts and dealing errors & sundry losses are allocated to FO qualified, research, FO support and client services pro rata with staffnumbers. Irrecoverable Vat is pre-allocated to all non-staff costs except dealing errors & sundry losses and bad debts.
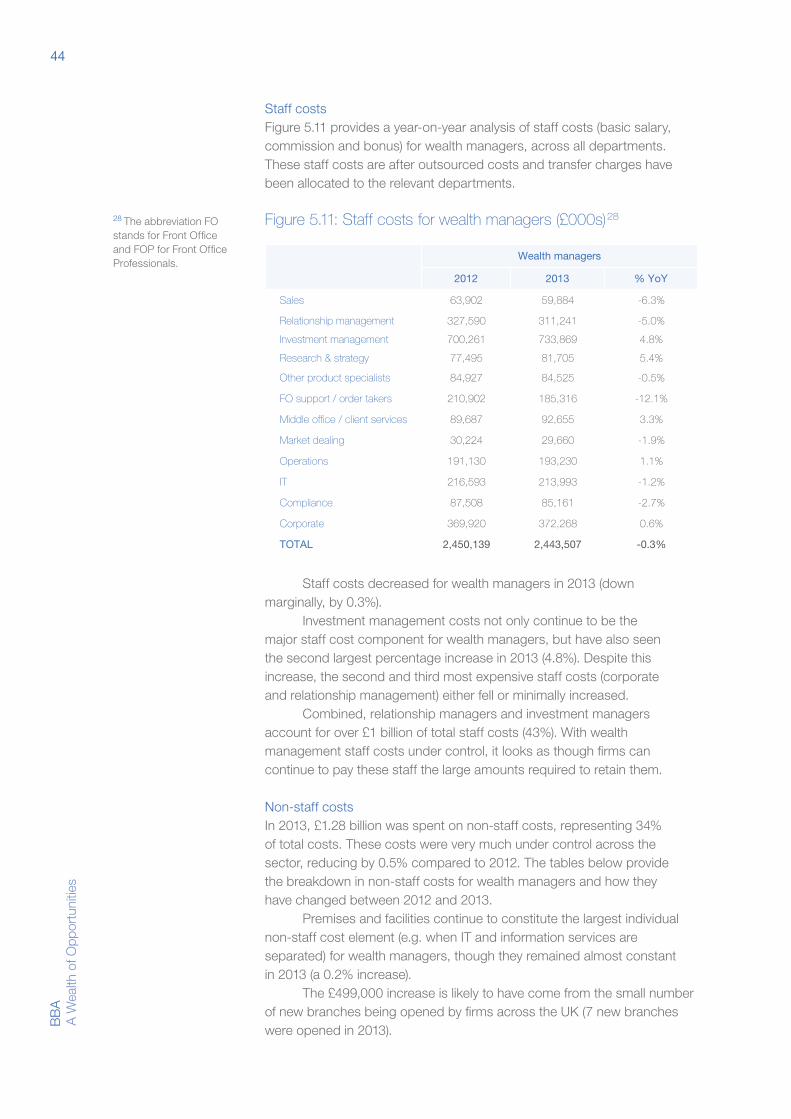
44B
BA
A
Wea
lth o
f Opp
ortu
nitie
s
Staff costs Figure 5.11 provides a year-on-year analysis of staff costs (basic salary, commission and bonus) for wealth managers, across all departments. These staff costs are after outsourced costs and transfer charges have been allocated to the relevant departments.
Figure 5.11: Staff costs for wealth managers (£000s)28
Wealth managers
2012 2013 % YoY
Sales 63,902 59,884 -6.3%
Relationship management 327,590 311,241 -5.0%
Investment management 700,261 733,869 4.8%
Research & strategy 77,495 81,705 5.4%
Other product specialists 84,927 84,525 -0.5%
FO support / order takers 210,902 185,316 -12.1%
Middle office / client services 89,687 92,655 3.3%
Market dealing 30,224 29,660 -1.9%
Operations 191,130 193,230 1.1%
IT 216,593 213,993 -1.2%
Compliance 87,508 85,161 -2.7%
Corporate 369,920 372,268 0.6%
TOTAL 2,450,139 2,443,507 -0.3%
Staff costs decreased for wealth managers in 2013 (down marginally, by 0.3%).
Investment management costs not only continue to be the major staff cost component for wealth managers, but have also seen the second largest percentage increase in 2013 (4.8%). Despite this increase, the second and third most expensive staff costs (corporate and relationship management) either fell or minimally increased.
Combined, relationship managers and investment managers account for over £1 billion of total staff costs (43%). With wealth management staff costs under control, it looks as though firms can continue to pay these staff the large amounts required to retain them.
Non-staff costsIn 2013, £1.28 billion was spent on non-staff costs, representing 34% of total costs. These costs were very much under control across the sector, reducing by 0.5% compared to 2012. The tables below provide the breakdown in non-staff costs for wealth managers and how they have changed between 2012 and 2013.
Premises and facilities continue to constitute the largest individual non-staff cost element (e.g. when IT and information services are separated) for wealth managers, though they remained almost constant in 2013 (a 0.2% increase).
The £499,000 increase is likely to have come from the small number of new branches being opened by firms across the UK (7 new branches were opened in 2013).
28 The abbreviation FO stands for Front Office and FOP for Front Office Professionals.
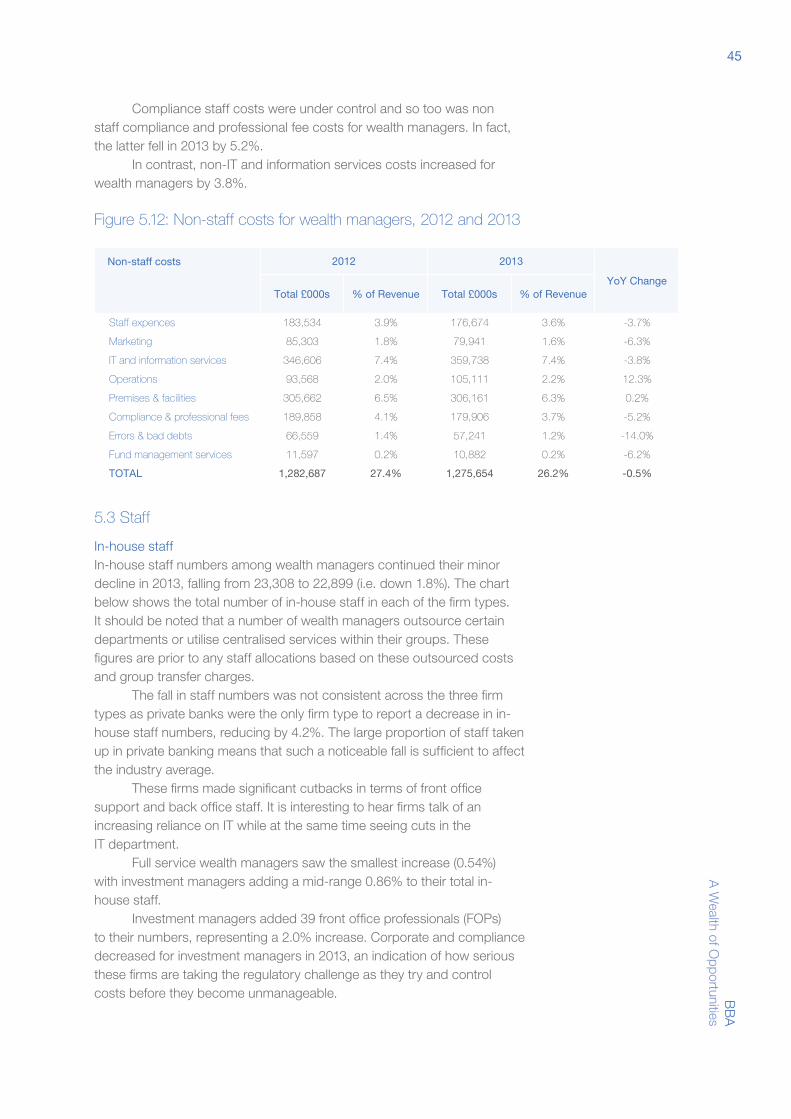
45B
BA
A W
ealth of Opportunities
Compliance staff costs were under control and so too was non staff compliance and professional fee costs for wealth managers. In fact, the latter fell in 2013 by 5.2%.
In contrast, non-IT and information services costs increased for wealth managers by 3.8%.
Figure 5.12: Non-staff costs for wealth managers, 2012 and 2013
5.3 Staff
In-house staffIn-house staff numbers among wealth managers continued their minor decline in 2013, falling from 23,308 to 22,899 (i.e. down 1.8%). The chart below shows the total number of in-house staff in each of the firm types. It should be noted that a number of wealth managers outsource certain departments or utilise centralised services within their groups. These figures are prior to any staff allocations based on these outsourced costs and group transfer charges.
The fall in staff numbers was not consistent across the three firm types as private banks were the only firm type to report a decrease in in-house staff numbers, reducing by 4.2%. The large proportion of staff taken up in private banking means that such a noticeable fall is sufficient to affect the industry average.
These firms made significant cutbacks in terms of front office support and back office staff. It is interesting to hear firms talk of an increasing reliance on IT while at the same time seeing cuts in the IT department.
Full service wealth managers saw the smallest increase (0.54%) with investment managers adding a mid-range 0.86% to their total in-house staff.
Investment managers added 39 front office professionals (FOPs) to their numbers, representing a 2.0% increase. Corporate and compliance decreased for investment managers in 2013, an indication of how serious these firms are taking the regulatory challenge as they try and control costs before they become unmanageable.
Non-staff costs 2012 2013
YoY ChangeTotal £000s % of Revenue Total £000s % of Revenue
Staff expences 183,534 3.9% 176,674 3.6% -3.7%
Marketing 85,303 1.8% 79,941 1.6% -6.3%
IT and information services 346,606 7.4% 359,738 7.4% -3.8%
Operations 93,568 2.0% 105,111 2.2% 12.3%
Premises & facilities 305,662 6.5% 306,161 6.3% 0.2%
Compliance & professional fees 189,858 4.1% 179,906 3.7% -5.2%
Errors & bad debts 66,559 1.4% 57,241 1.2% -14.0%
Fund management services 11,597 0.2% 10,882 0.2% -6.2%
TOTAL 1,282,687 27.4% 1,275,654 26.2% -0.5%
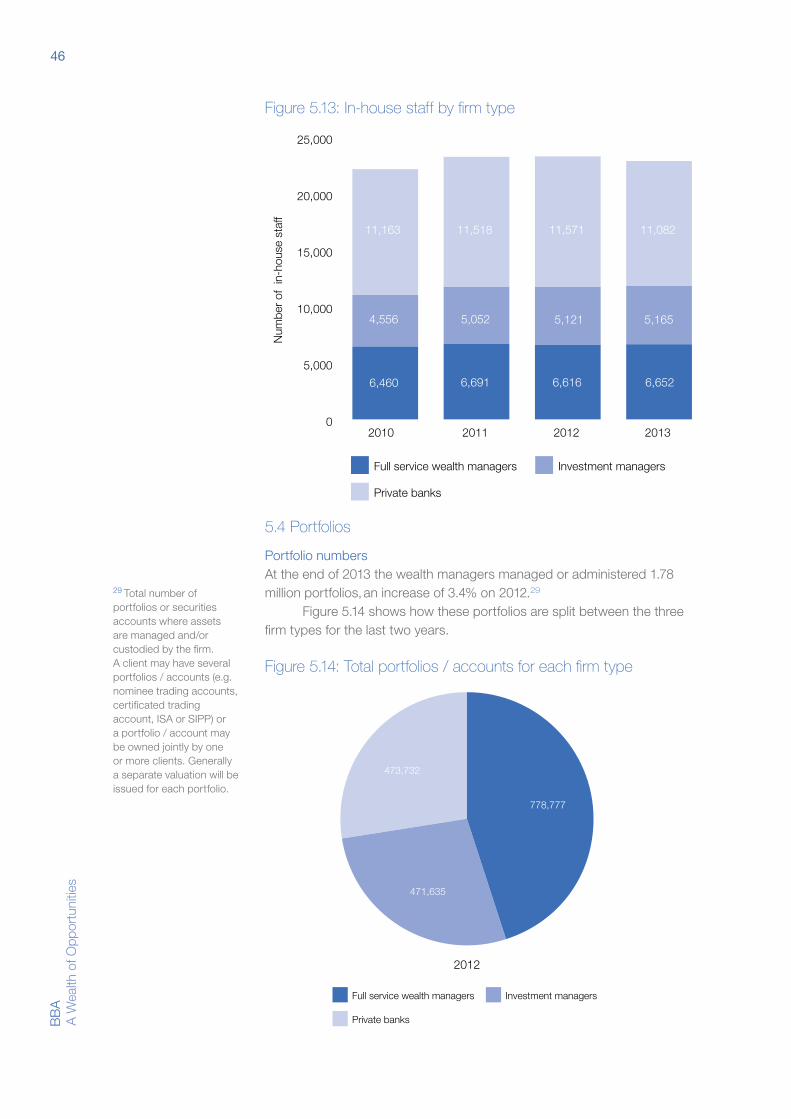
46B
BA
A
Wea
lth o
f Opp
ortu
nitie
s
Figure 5.13: In-house staff by firm type
0
5,000
10,000
15,000
20,000
25,000
2013201220112010
Num
ber
of i
n-ho
use
staf
f
Full service wealth managers
Figure 5.13: In-house staff by firm type
Investment managers
Private banks
6,6166,460
5,1214,556
11,571
6,691
5,052
6,652
5,165
11,08211,163 11,518
5.4 Portfolios
Portfolio numbersAt the end of 2013 the wealth managers managed or administered 1.78 million portfolios, an increase of 3.4% on 2012.29
Figure 5.14 shows how these portfolios are split between the three firm types for the last two years.
Figure 5.14: Total portfolios / accounts for each firm type
2012
Full service wealth managers
Figure 5.14:Total portfolios / accounts for each firm type
Investment managers
Private banks
778,777
473,732
471,635
29 Total number of portfolios or securities accounts where assets are managed and/or custodied by the firm. A client may have several portfolios / accounts (e.g. nominee trading accounts, certificated trading account, ISA or SIPP) or a portfolio / account may be owned jointly by one or more clients. Generally a separate valuation will be issued for each portfolio.
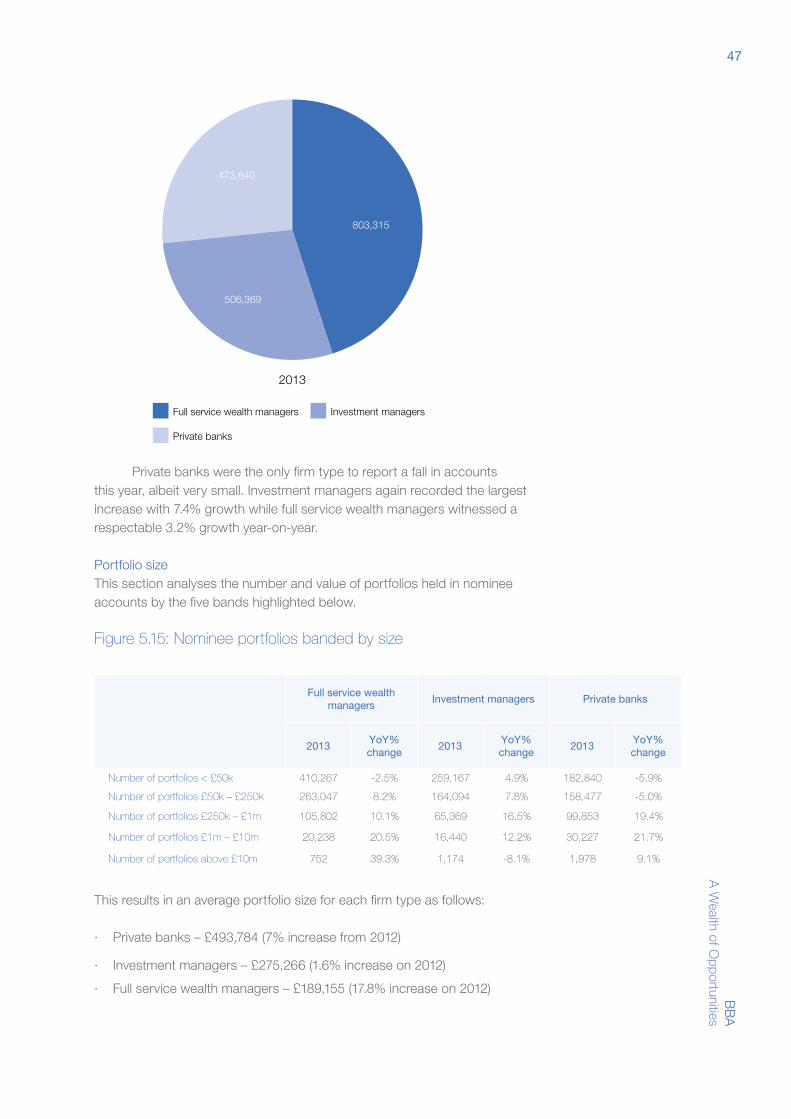
47B
BA
A W
ealth of Opportunities
Private banks were the only firm type to report a fall in accounts this year, albeit very small. Investment managers again recorded the largest increase with 7.4% growth while full service wealth managers witnessed a respectable 3.2% growth year-on-year.
Portfolio sizeThis section analyses the number and value of portfolios held in nominee accounts by the five bands highlighted below.
Figure 5.15: Nominee portfolios banded by size
Full service wealth managers
Investment managers Private banks
2013YoY%change
2013YoY%change
2013YoY%change
Number of portfolios < £50k 410,267 -2.5% 259,167 4.9% 182,840 -5.9%
Number of portfolios £50k – £250k 263,047 8.2% 164,094 7.8% 158,477 -5.0%
Number of portfolios £250k – £1m 105,802 10.1% 65,369 16.5% 99,853 19.4%
Number of portfolios £1m – £10m 20,238 20.5% 16,440 12.2% 30,227 21.7%
Number of portfolios above £10m 752 39.3% 1,174 -8.1% 1,978 9.1%
This results in an average portfolio size for each firm type as follows:
· Private banks – £493,784 (7% increase from 2012)
· Investment managers – £275,266 (1.6% increase on 2012)
· Full service wealth managers – £189,155 (17.8% increase on 2012)
2013
Figure 5.14:Total portfolios / accounts for each firm type
803,315
473,640
506,369
Full service wealth managers Investment managers
Private banks
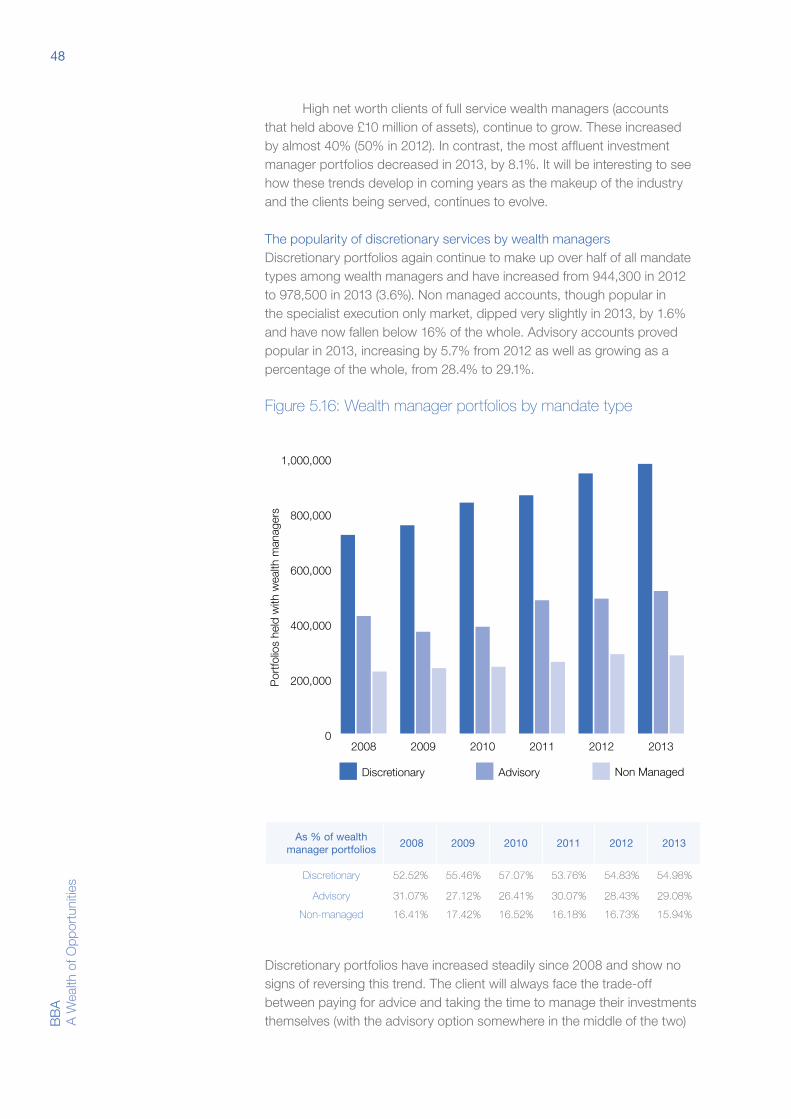
48B
BA
A
Wea
lth o
f Opp
ortu
nitie
s
High net worth clients of full service wealth managers (accounts that held above £10 million of assets), continue to grow. These increased by almost 40% (50% in 2012). In contrast, the most affluent investment manager portfolios decreased in 2013, by 8.1%. It will be interesting to see how these trends develop in coming years as the makeup of the industry and the clients being served, continues to evolve.
The popularity of discretionary services by wealth managersDiscretionary portfolios again continue to make up over half of all mandate types among wealth managers and have increased from 944,300 in 2012 to 978,500 in 2013 (3.6%). Non managed accounts, though popular in the specialist execution only market, dipped very slightly in 2013, by 1.6% and have now fallen below 16% of the whole. Advisory accounts proved popular in 2013, increasing by 5.7% from 2012 as well as growing as a percentage of the whole, from 28.4% to 29.1%.
Figure 5.16: Wealth manager portfolios by mandate type
0
200,000
400,000
600,000
800,000
1,000,000
201320122011201020092008
Por
tfolio
s he
ld w
ith w
ealth
man
ager
s
Discretionary
Figure 5.16: Wealth Manager Portfolios by mandate type
Advisory Non Managed
As % of wealth manager portfolios
2008 2009 2010 2011 2012 2013
Discretionary 52.52% 55.46% 57.07% 53.76% 54.83% 54.98%
Advisory 31.07% 27.12% 26.41% 30.07% 28.43% 29.08%
Non-managed 16.41% 17.42% 16.52% 16.18% 16.73% 15.94%
Discretionary portfolios have increased steadily since 2008 and show no signs of reversing this trend. The client will always face the trade-off between paying for advice and taking the time to manage their investments themselves (with the advisory option somewhere in the middle of the two)
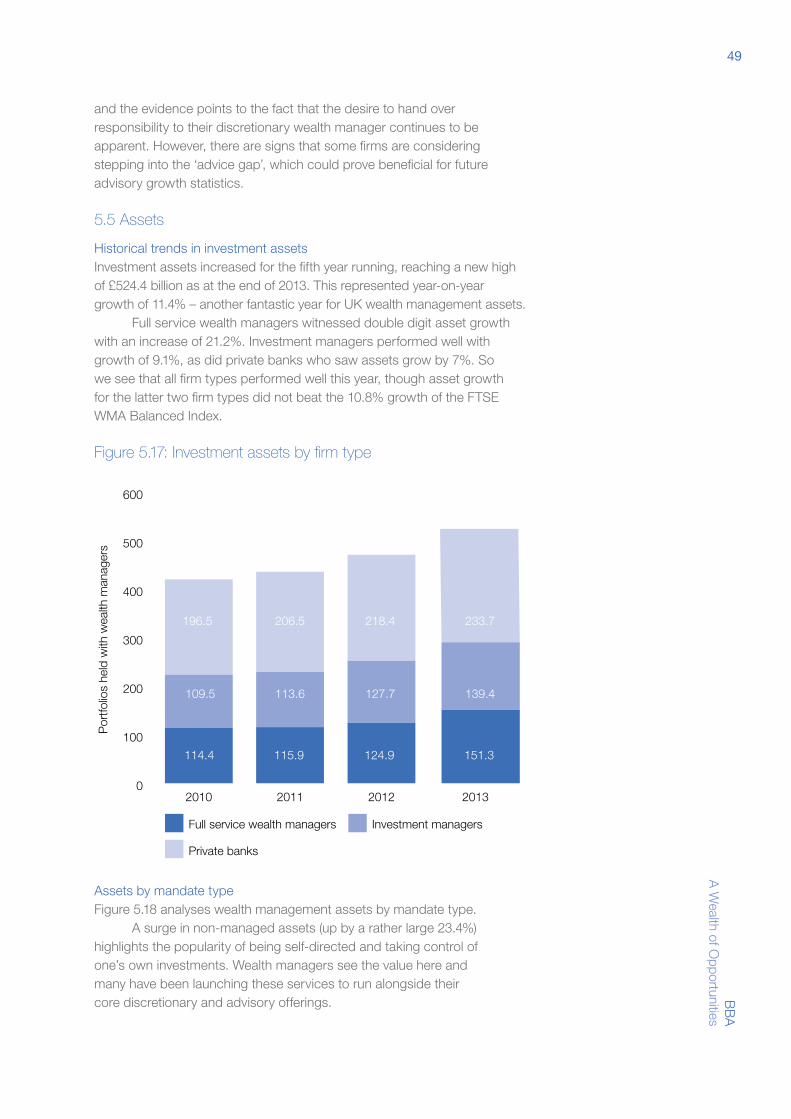
49B
BA
A W
ealth of Opportunities
and the evidence points to the fact that the desire to hand over responsibility to their discretionary wealth manager continues to be apparent. However, there are signs that some firms are considering stepping into the ‘advice gap’, which could prove beneficial for future advisory growth statistics.
5.5 Assets
Historical trends in investment assetsInvestment assets increased for the fifth year running, reaching a new high of £524.4 billion as at the end of 2013. This represented year-on-year growth of 11.4% – another fantastic year for UK wealth management assets.
Full service wealth managers witnessed double digit asset growth with an increase of 21.2%. Investment managers performed well with growth of 9.1%, as did private banks who saw assets grow by 7%. So we see that all firm types performed well this year, though asset growth for the latter two firm types did not beat the 10.8% growth of the FTSE WMA Balanced Index.
Figure 5.17: Investment assets by firm type
0
100
200
300
400
500
600
2013201220112010
Por
tfolio
s he
ld w
ith w
ealth
man
ager
s
Figure 5.17: Investment assets by firm type
Full service wealth managers Investment managers
Private banks
114.4 115.9 124.9 151.3
109.5 113.6
206.5
127.7 139.4
218.4 233.7196.5
Assets by mandate typeFigure 5.18 analyses wealth management assets by mandate type.
A surge in non-managed assets (up by a rather large 23.4%) highlights the popularity of being self-directed and taking control of one’s own investments. Wealth managers see the value here and many have been launching these services to run alongside their core discretionary and advisory offerings.
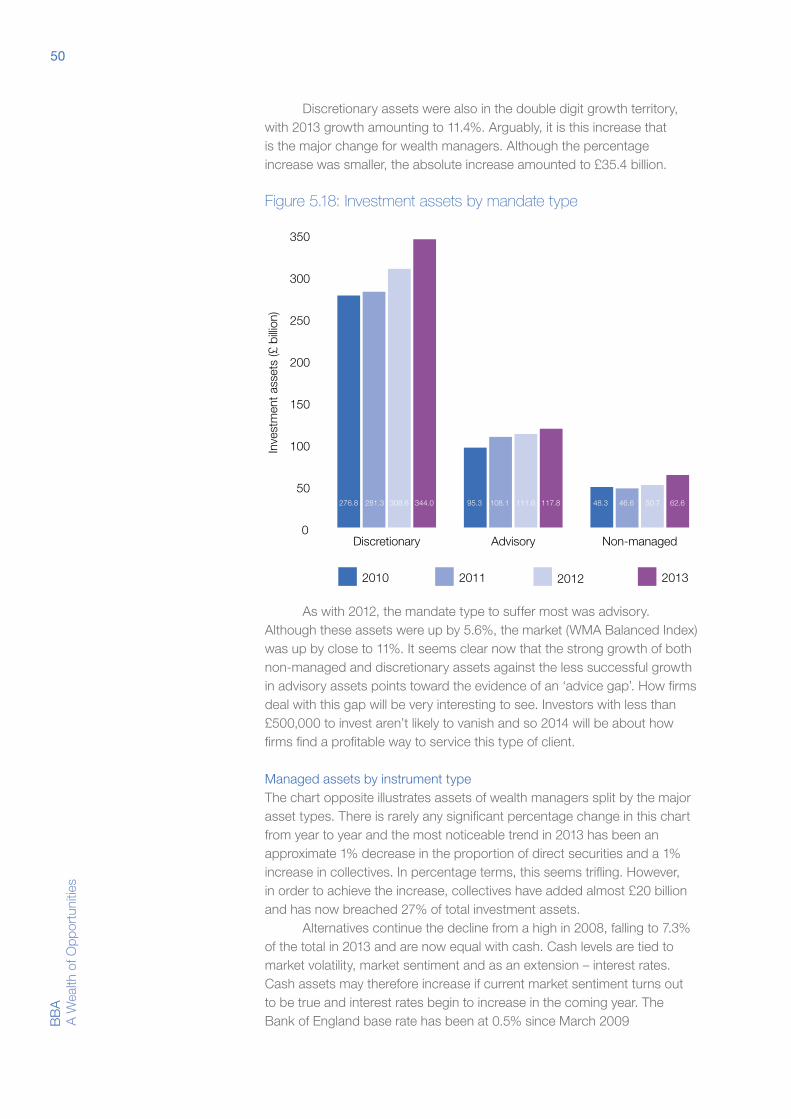
50B
BA
A
Wea
lth o
f Opp
ortu
nitie
s
Discretionary assets were also in the double digit growth territory, with 2013 growth amounting to 11.4%. Arguably, it is this increase that is the major change for wealth managers. Although the percentage increase was smaller, the absolute increase amounted to £35.4 billion.
Figure 5.18: Investment assets by mandate type
0
50
100
150
200
250
300
350
Non-managedAdvisoryDiscretionary
Inve
stm
ent a
sset
s (£
billi
on)
2010 2013
Figure 5.18: Investment assets by mandate type
2011 2012
276.8 281.3 308.6 344.0 95.3 108.1 111.6 117.8 48.3 46.6 50.7 62.6
As with 2012, the mandate type to suffer most was advisory. Although these assets were up by 5.6%, the market (WMA Balanced Index) was up by close to 11%. It seems clear now that the strong growth of both non-managed and discretionary assets against the less successful growth in advisory assets points toward the evidence of an ‘advice gap’. How firms deal with this gap will be very interesting to see. Investors with less than £500,000 to invest aren’t likely to vanish and so 2014 will be about how firms find a profitable way to service this type of client.
Managed assets by instrument typeThe chart opposite illustrates assets of wealth managers split by the major asset types. There is rarely any significant percentage change in this chart from year to year and the most noticeable trend in 2013 has been an approximate 1% decrease in the proportion of direct securities and a 1% increase in collectives. In percentage terms, this seems trifling. However, in order to achieve the increase, collectives have added almost £20 billion and has now breached 27% of total investment assets.
Alternatives continue the decline from a high in 2008, falling to 7.3% of the total in 2013 and are now equal with cash. Cash levels are tied to market volatility, market sentiment and as an extension – interest rates. Cash assets may therefore increase if current market sentiment turns out to be true and interest rates begin to increase in the coming year. The Bank of England base rate has been at 0.5% since March 2009
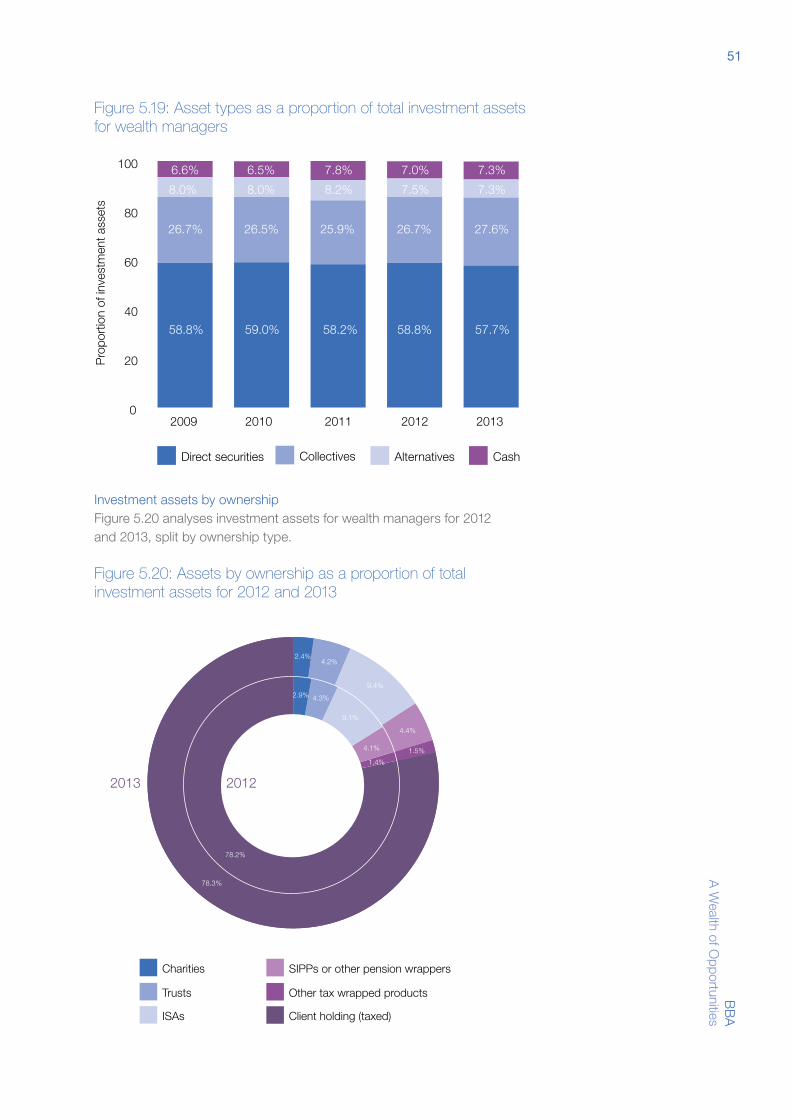
51B
BA
A W
ealth of Opportunities
Figure 5.19: Asset types as a proportion of total investment assets for wealth managers
Investment assets by ownershipFigure 5.20 analyses investment assets for wealth managers for 2012 and 2013, split by ownership type.
Figure 5.20: Assets by ownership as a proportion of total investment assets for 2012 and 2013
Charities
Figure 5.20: Asset types as a proportion of total investment assets for wealth managers
Trusts
ISAs
SIPPs or other pension wrappers
Other tax wrapped products
Client holding (taxed)
78.3%
78.2%
2.9%
2.4%4.2%
9.4%
4.3%
9.1%
4.1%
1.4%
1.5%
4.4%
20122013
0
20
40
60
80
100
20132012201120102009
Pro
port
ion
of in
vest
men
t ass
ets
Direct securities
Figure 5.19: Asset types as a proportion of total investment assets for wealth managers
Collectives Alternatives Cash
58.8%58.8% 58.2%
7.8%6.5%
25.9%
8.2% 7.5%
26.7%
7.3%
7.3%7.0%
59.0%
26.5%
57.7%
27.6%
6.6%
8.0%
26.7%
8.0%
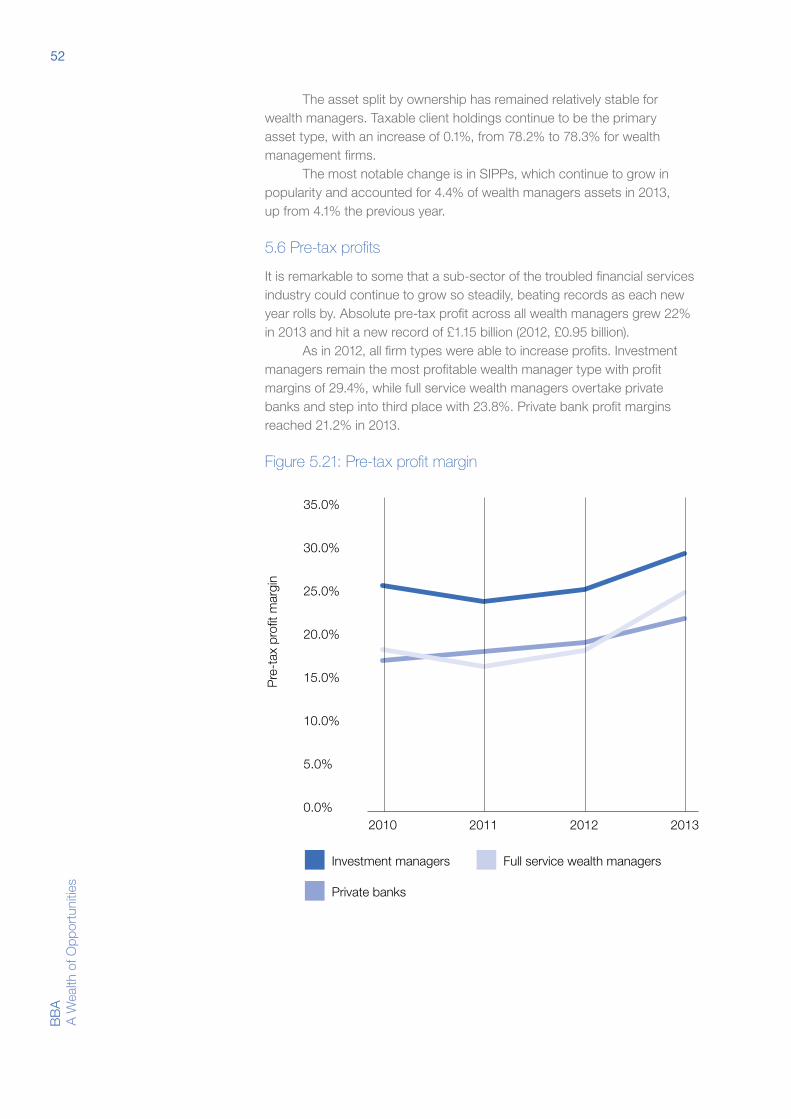
52B
BA
A
Wea
lth o
f Opp
ortu
nitie
s
The asset split by ownership has remained relatively stable for wealth managers. Taxable client holdings continue to be the primary asset type, with an increase of 0.1%, from 78.2% to 78.3% for wealth management firms.
The most notable change is in SIPPs, which continue to grow in popularity and accounted for 4.4% of wealth managers assets in 2013, up from 4.1% the previous year.
5.6 Pre-tax profits
It is remarkable to some that a sub-sector of the troubled financial services industry could continue to grow so steadily, beating records as each new year rolls by. Absolute pre-tax profit across all wealth managers grew 22% in 2013 and hit a new record of £1.15 billion (2012, £0.95 billion).
As in 2012, all firm types were able to increase profits. Investment managers remain the most profitable wealth manager type with profit margins of 29.4%, while full service wealth managers overtake private banks and step into third place with 23.8%. Private bank profit margins reached 21.2% in 2013.
Figure 5.21: Pre-tax profit margin
2013201220110.0%
5.0%
10.0%
15.0%
20.0%
25.0%
30.0%
35.0%
2010
Pre
-tax
pro
fit m
argi
n
Investment managers
Private banks
Full service wealth managers
Figure 5.21: Pre-tax profit margin
53B
BA
A W
ealth of Opportunities
Estimates of the indirect and induced impacts of the PBWM sector in this chapter rely on modelling using detailed UK 2010 Input-Output Analytical Tables.30 These tables, compiled by the ONS, record the flow of spending on intermediate goods and services throughout the UK economy for a single year.31
By quantifying the per unit internal needs and external production capabilities of industries in the UK economy via Leontief inverse matrices, and pairing that information with spend on inputs undertaken by PBWM firms and spend on goods and services by their employees, Oxford Economics’ models can estimate the total economic activity associated with the PBWM sector.
Geographical refinement of Input-output estimates based on Flegg and Webber methodologyIn addition to the UK economic impact modelling conducted for this chapter, regional economic impact modelling was carried out using techniques initially developed by Flegg and Webber.32 The techniques involve constructing regional input-output models by applying Location Quotients (LQs) and regional size adjustments to the standard UK Input-Output tables.
Appendix ABackground to modelling methods used in calculating the economic impact
30 ONS, (2014), ‘2010 Input-Output Analytical Tables’.
31 Spend is recorded from each of 127 standard industrial classifications (SIC 2007) to each of the other 127 SICs in the UK economy.
32 Flegg and Webber, (2000), ‘Regional Size, Regional Specialization and the FLQ Formula’. Regional Studies, Vol. 34.6, pages 563–569.

54B
BA
A
Wea
lth o
f Opp
ortu
nitie
s
These adjustments allow for better estimates of the location of gross value added supported in the indirect and induced channels. The result is that geographies with higher concentrations of industries receiving procurement or household expenditure have larger impacts.
In addition, by dividing gross value added by estimates of regional productivity (the gross value added per employee per year), estimates of total employment are made more accurate and the location of employment can be estimated.3333 Productivity estimates
for the UK overall are taken from ONS, (2014), Annual Business Survey; Productivity estimates by nation and region are estimated using ONS, (2014), ‘Business Register and Employment Survey’ and ONS, (2013), ‘Regional Gross Value Added (Income Approach), December 2013’.

www.bba.org.ukBBA
Pinners Hall 105–108 Old Broad Street
London, EC2N 1EXUnited Kingdom