Embed Size (px)
Citation preview

UNIVERSITY OF TARTU
Institute of Computer Science
Software Engineering Curriculum
Sabuhi Yusifov
A Web Application Supporting the Full Pipeline
of Business Process Deviance Analysis
Master’s Thesis (30 EAP)
Supervisor(s): Fabrizio Maria Maggi
Tartu 2021

2
A Web Application Supporting the Full Pipeline of
Business Process Deviance Analysis
Abstract:
In business process mining, the deviant cases refer to the unusual cases in the process
execution flow. Depending on their performance and outcomes, processes can deviate
in negative ways (for example a delivery process that takes too much time) or positive
ways (for example, a healthcare process in which a patient recovered very quickly).
Business process deviance mining is the task of exploring the reasons behind
exceptional cases in business process logs. In this thesis, we introduce a web
application built on top of existing work concerning the problem of explaining deviant
cases using sequential or declarative process patterns characterizing the cases, or a
combination of them. While the existing work provided most of the backend of the
application, we developed a web application on top of it to guide the process analyst in
the deviance mining task throughout the entire analysis pipeline from log splitting, to
case labeling, to the application of classifiers to extract deviance explanations in terms
of process patterns. The development and design of our application bases on a set of
requirements acquired from BPM experts. In this thesis, we will first present the
requirements, then we will walk through how each requirement is fulfilled by our
implementation by creating test cases for each specific requirement.
Keywords:
Deviance mining, User Interface, Business Process, Declare, Classification, Process
Analysis Tool
CERCS: P170: Computer science, numerical analysis, systems, control

3
Äriprotsesside Hälbekaeve Täielikku Töövoogu Toetav
Veebirakendus
Lühikokkuvõte:
Äriprotsesside kaeves nimetatakse hälbivateks juhtumiteks neid juhtumeid, mis
viitavad ebatavalistele protsessi täitmise töövoogudele. Sõltuvalt nende töövoogude
jõudlusest ja tulemustest võib hälbivad juhtumid liigitada negatiivseteks (näiteks liiga
kaua aega võttev kohaletoimetamise töövoog) ja positiivseteks (näiteks patsiendi ravi
töövoog, mille korral patsient terveneb väga kiiresti). Äriprotsesside hälbekaeve
eesmärk on uurida ebatavaliste töövoogude põhjuseid tuginedes äriprotsesside logide
andmetele. Käesolev lõputöö tutvustab veebi-põhist rakendust, mis on loodud
tuginedes juba olemasolevale tööle, mis omakorda keskendub hälbivate juhtumite
seletamisele kasutades järgnevuspõhiseid või deklaratiivseid protsessimustreid või
nende mustrite kombinatsioone protsessi juhtumite iseloomustamiseks. Kuigi juba
olemasolev töö pakus suurema osa vajalikust tagasüsteemi funktsionaalsusest, siis
käesoleva lõputöö raames on arendatud vastav veebi-põhine rakendus, mille eesmärk
on suunata protsessi analüütikut kogu hälbekaeve töövoo vältel, mis sisaldab muuhulas
logi alamosadeks jagamist, juhtumite sildistamist ja klassifikaatorite rakendamist
eesmärgiga eraldada hälvete selgitusi protsessimustrite kontekstis. Käesolevas lõputöös
tutvustatava rakenduse arendus ja disain tuginevad BPM ekspertidelt saadud nõuetele.
Käesolev lõputöö esitab kõigepealt kõik eelnevalt nimetatud nõuded ja seejärel käsitleb
iga nõude täitmist kasutades vastava nõude täitmise kontrollimiseks loodud
testjuhtumeid.
Võtmesõnad:
Halbekaevandus, Ariprotsessid, Kasutajaliides, Declare, Protsesside Analüüsimise
Tööriist, Liigitamine
CERCS: P170 - Arvutiteadus, arvanalüüs, süsteemid, juhti

4
Table of Contents
1. Introduction .......................................................................................................... 6
2. Related Work ....................................................................................................... 8
3. Background .......................................................................................................... 9
3.1 Business Process ............................................................................................ 9
3.2 Event Log ....................................................................................................... 9
3.3 Business Process Deviance Mining ............................................................. 10
3.4 Log Patterns ................................................................................................. 11
3.4.1 Sequential Features .............................................................................. 11
3.4.2 Data Features ....................................................................................... 11
3.4.3 Declare Features................................................................................... 12
3.4.4 Data-aware Declare constraints. .......................................................... 14
3.5 Classification................................................................................................ 15
3.5.1 K-fold cross-validation ........................................................................ 16
3.6 Background Work ........................................................................................ 17
3.6.1 Encodings ............................................................................................. 18
3.6.2 Results .................................................................................................. 19
4. Requirements...................................................................................................... 21
4.1 The Home Page ............................................................................................ 21
4.2 The Upload Page .......................................................................................... 21
4.3 The Splitting Page ........................................................................................ 21
4.4 The Labeling Page ....................................................................................... 22
4.5 The Validation Page ..................................................................................... 22
5. Additional Back-End Functionalities ............................................................... 24
5.1 Changes to The Existing Tool...................................................................... 25
5.2 Helper Tool .................................................................................................. 27
5.2.1 Split Log............................................................................................... 27
5.2.2 Labeling ............................................................................................... 29
6. Requirements Testing ........................................................................................ 31
6.1 Home Page ................................................................................................... 31
6.1.1 Home Page Test Cases ......................................................................... 32
6.2 Upload Page ................................................................................................. 33
6.2.1 Upload Page Test Cases ....................................................................... 33
6.3 Split Log File ............................................................................................... 35
6.3.1 Split Page Test Cases ........................................................................... 39
5
6.4 Labeling Page............................................................................................... 39
6.4.1 Labeling Page Test Cases .................................................................... 43
6.5 Validation Page ............................................................................................ 43
6.5.1 Validation using Basic feature sets. ..................................................... 44
6.5.2 Validation using Data feature sets. ...................................................... 45
6.5.3 Validation using Data-aware declare feature sets. ............................... 48
6.5.4 Classifier Selection .............................................................................. 48
6.5.5 Validation Page Test Cases .................................................................. 49
7. Feedback elements ............................................................................................. 53
8. Tool Implementation ......................................................................................... 55
8.1 Application Architecture .............................................................................. 55
8.1.1 API Architecture. ................................................................................. 55
8.1.2 Helper Tool Architecture ..................................................................... 56
8.1.3 Front-end Architecture ......................................................................... 56
8.2 Technologies ................................................................................................ 56
8.2.1 Back-end .............................................................................................. 56
8.2.2 Front-end .............................................................................................. 57
9. Conclusion .......................................................................................................... 58
10. References ........................................................................................................... 59
License ......................................................................................................................... 62

6
1. Introduction
Nowadays, more and more businesses use the power of data to improve and bring
clarity to every process execution of their businesses. Businesses log and store the data
of their process executions in so-called event logs [1]. Process mining is the family of
techniques used to extract knowledge from the event logs for further analysis and
adjustments to improve the efficiency of business operations.
One of the techniques used in process mining is called business process deviance
mining. Deviance mining deals with the subset of processes that deviate from their
normal executions. Deviation can be in the form of negative or positive. The goal of
applying deviance mining in businesses is to identify negative deviations and found
causes to minimize them as well as to boost the positive deviations [2].
The deviance mining starts with processing event logs that contain both deviant and
normal traces of executions. Then the next step is to discover the emerging patterns or
characterizations of deviant cases. Finally, by learning such patterns we can extract
features and train a classifier to identify the deviant cases for unseen traces.
Many techniques exist to explain deviances in event logs. One such technique is finding
sequential patterns from the sequence of events in traces. Later these patterns are used
as features to train a classifier. Moreover, other patterns are also used as features, for
example, declarative patterns or features using the data attributes inside traces.
Many studies focus on finding the best classifier for finding deviant cases using
different classification techniques with the same feature sets. In our project, we will
create a web application to allow the users to select different feature groups such as
Individual Activities, Sequential, Declare, Data, Data-aware Declare constraints as well
as a combination of those features and create the classifier using the back-end work
implemented in [3]. The application also allows the users to find the best classifier by
tuning parameters and displaying the accuracy metrics.
In chapter 2, we will discuss the previous research and similar applications. In chapter
3, we will give background information about the concepts used in this thesis. In
chapters 4, 5, 6, and 7 we start from requirements from BPM experts, and we explain

7
the design and development of the web application supporting the entire pipeline behind
the deviance mining analysis task. Chapter 8 discusses the various technologies used in
the development process of the application. Then we conclude the thesis with the
conclusion part in Chapter 9.

8
2. Related Work
Recently, the increasing number of studies on business process deviance mining
resulted in the application of various techniques to be developed to discriminate deviant
cases in business processes. An example of one of these techniques, in [6] authors used
sequential patterns in event logs recorded by an X-ray machine to identify system
failures. Similarly, in [20], the authors use frequent pattern mining techniques on
clinical data to find deviation in patient outcomes. Furthermore, authors in [2] evaluated
6 real-life datasets using sequential patterns, individual activities, and discriminative
patterns [21]. There are also other studies that use a combination of different patterns
to detect deviant cases in process logs. In [22], the authors draw attention to the issue
that most classifiers are biased because they are not taking into account that most of the
real logs are contain imbalanced data where deviant cases are far less than the non-
deviant cases. To solve this issue authors propose using multiple base models trained
using the different kinds of patterns and one final model where it leverages the
predictions made by the base models.
For our study, an application is presented to extract features from event logs using the
patterns mentioned above and training the classifiers for benchmarking purposes. The
Nirdizati1 [23] application is one example of this kind of work. Likewise, the user can
upload and evaluate logs by using a combination of different parameters. Although
there are similarities in terms of the process flow of the two applications, they serve
different purposes. Nirdizati application deals with predictive process monitoring
where the model is predicting the possible outcomes by using the collected data. On the
other hand, our application deals with deviance mining where we analyze the deviant
cases and finding out why the specific deviation occurs.
1 [http://research.nirdizati.org/]

9
3. Background
This chapter of the thesis gives background knowledge required to understand the
concepts discussed.
3.1 Business Process
A business process is a set of linked tasks that upon completion will result in achieving
a business goal. The process can consist of activities or events. It is possible to record
and track the steps performed by process executions to further analyze them. Processes
stored in log files called event logs.
3.2 Event Log
In an event log processes are described as a series of traces and traces are composed of
events. Both traces and events can have different attributes.
The standard storage format for event logs is XES (IEEE Standard for eXtensible Event
Stream) formatted files. XES is an XML-based schema used for storing business
process event logs [3].
The main data of the processes are stored in trace and event attributes. Attributes can
carry data in a variety of data types such as continuous (float), discrete (integer), literal
(string), date (timestamp), and logical (Boolean).
The most common attributes for events are the ones that represent their name and time
of execution namely - concept:name and time:timestamp. Figure 1, which represents a
hospital log shows both trace and event attributes. Apart from the name and execution
time of the event, there is a lifecycle:transition and org:group attributes which are also
common attributes for events. The value “complete” of the lifecycle attribute indicates
the status of completion of an event. Throughout the process execution, it shows the
lifecycle status of the process and can take values such as: “start”, “complete.” [5]. The
group attribute on the other hand represents which resource has executed the event. The
trace attribute Label can have values 1 or 0 that indicate whether the trace is deviant or
normal.

10
Figure 1. An example of a trace in an event log.
3.3 Business Process Deviance Mining
The process of extracting information from event logs is called business process
mining. Process mining includes different techniques to analyze business
processes. Deviance mining consists of analyzing business processes that deviate from
their normal execution. Deviations can be negative or positive. The deviation is positive

11
if the process results in a positive outcome by outperforming its expected performance.
On the contrary, negative deviation results in an unwanted outcome.
3.4 Log Patterns
In this chapter, we will discuss how to discover patterns from log files which will be
used to create features for explaining deviant processes.
3.4.1 Sequential Features
As we mentioned earlier, event logs consist of sequences of events inside traces. In
some cases, some sub-sequences can repeat themselves and create what is called a
sequential pattern. For instance, if a part of a process malfunction and the machine
retries the same events to get the correct response the iteration creates a loop over a
sub-sequence of events [6]. In this thesis, for sequential patterns, we focus on extracting
features from Tandem Repeats (TR), Tandem Repeats Alphabet (TRA), Maximal
Repeats (MR), and Maximal Repeats Alphabet (MRA) patterns [24].
Tandem Repeats capture sequences of events that are repeated consecutively. For
instance, given the trace T=abcabce, a TR is (abc) which is repeated twice. The same
logic applies to TRA as well, but the order does not matter. For example, consider the
trace T=abccba; (abc; cb; c) are TRA which all occur twice consecutively. MR are
maximal sequences of events in a trace that are repeated but not consecutively. For
example, for the trace T=aabcdbbcda MR are (a; b; bcd). All of them are repeated
twice. Likewise, MRA is also the same as MR, but the ordering of events does not
matter. For the trace T=aadcbbcd the MRA are (a; b; bcd). Also, all of them are
repeated twice. (bc) is not considered as MRA because it is not maximal and is a
subsequence of a longer repeat (bcd).
3.4.2 Data Features
Data features are features extracted from trace or event attributes. Picking features from
trace attributes is quite straightforward, the feature name is the attribute name itself and
the value is the same as the attribute’s value. For event attributes, because there can be
many attributes with the same name across different events, features are created by their
position in the trace or by aggregation of their values. By referring to Table 1 we can
see what these methods are and their implementation details.

12
Table 1. Methods for extracting Data features.
Method Description
Choose First The feature value is the first occurrence of the
attribute’s value in the trace.
Choose Last The feature value is the last occurrence of the
attribute’s value in the trace.
Count One feature is created from each attribute value. Each
feature has an integer value which holds the count of
how many times the value occurred in the trace.
Choose max. The feature is created by choosing the maximum value
of an attribute in the trace.
Choose min. The feature is created by choosing the minimum value
of an attribute in the trace.
Compute avg. The feature is created by computing the average value
of an attribute in the trace.
3.4.3 Declare Features
Declare is a constraint-based modeling system proposed in [7]. The main use case for
the declarative approach is to be more flexible than traditional approaches and support
loosely structured processes. A Declare model works with constraints which are the
representation of a set of rules to be followed in the process execution. Linear
Temporal Logic (LTL) for finite traces is the main specification language for
Declarative constraints. In addition to that, to understand constraints without prior
knowledge of LTL there are also graphical representations that make reading
constraints easy (like in Figure 2.).
The main advantage of Declare constraints is that it is quite straightforward to represent
and express logical relation between two activities [17]. To give an example of one
constraint let us consider a business process where the ordering of products must be
followed by a payment process. If we represent the ordering activity with “A” and the
13
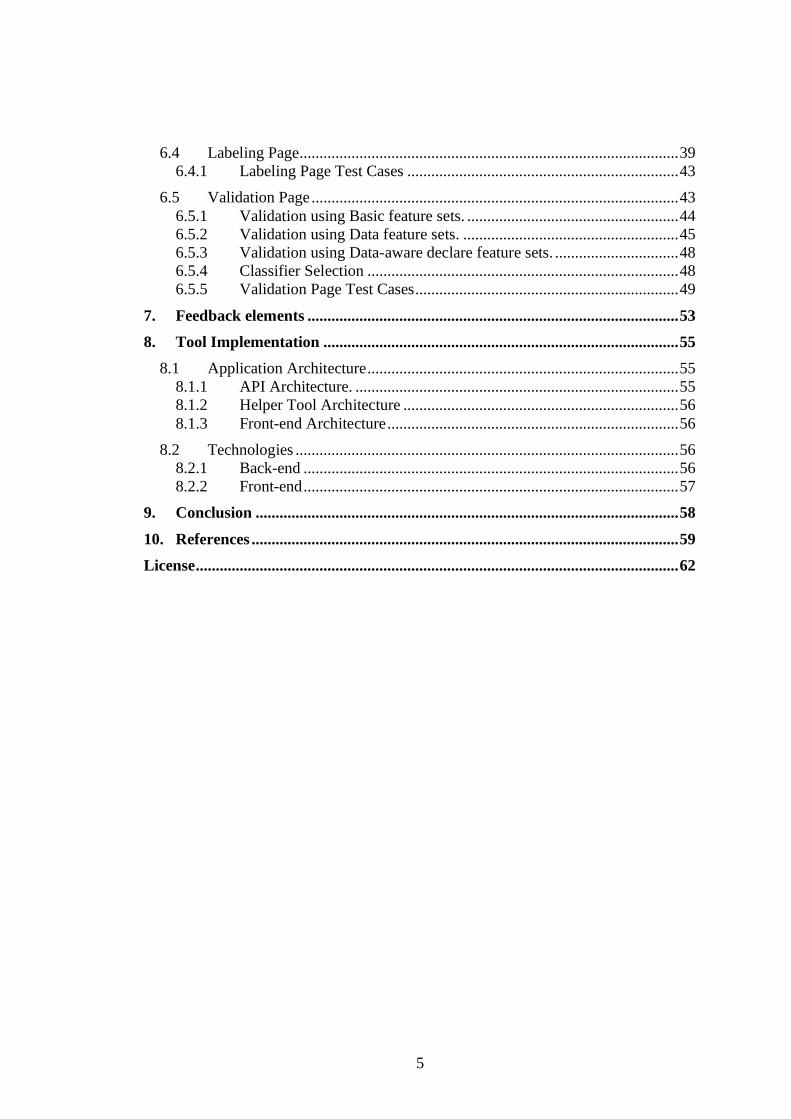
payment activity with “B” then the relationship between these two activities can be
defined as a response (A, B). If “A” occurs “B” must eventually follow. The graphical
representation of this constraint is shown in Figure 2 where the filled circle next to the
“A” indicates the first activity while the filled arrow next to the “B” shows the second
activity.
Figure 2.
There are many other types of constraints (a.k.a. templates) such as existence, init,
precedence, succession. Figure 3 below shows different templates with their LTL
semantics as well as their graphical representation.
Figure 3. The examples of declare constraint templates [8].

14
Suppose that we have a trace T = (A, C, D, B) and a constraint response (A, B). This
constraint is satisfied in the trace because event “A” is eventually followed by event
“B”. But in the trace T = (A, E, D) the same constraint is violated because there is no
event “B” that follows after the occurrence of “A”. There can also be a case where “A”
is not present in the trace, for instance, in the trace T = (B, C, D) the constraint
is vacuously (or trivially) satisfied [19]. An activation of a constraint in a trace is an
event whose occurrence imposes obligations on the occurrence of another event (the
target) in the same trace. For example, for the constraint response (A, B), “A” is the
activation because its occurrence imposes the occurrence of “B” the target afterward.
3.4.4 Data-aware Declare constraints.
There is also an extension of the declarative notation which is referred to as Data-
aware Declare. This extension adds an additional condition to the Declare constraints
[18]. For example, for the response (A, B, Cond.) constraint we read this notation as “if
the event “A” occurs and the given condition (Cond.) holds, then “B” must eventually
follow”. This condition gives us further flexibility when creating Declare constraints to
take data attributes into consideration as well. Table 2 examples for Data-aware Declare
constraints are shown.

15
Table 2. Data-aware Declare constraint examples [9].
3.5 Classification
There are many techniques used in deviance mining to evaluate the dataset. Within the
field of machine learning, there are 2 basic learning approaches: supervised and
unsupervised learning. The supervised learning algorithms learn on a pre-labeled
dataset. On the contrary, unsupervised learning models train on unlabeled datasets and
try to make sense of it by finding common patterns.
In this thesis, we use labeled datasets and supervised learning methods. Supervised
learning starts with a training algorithm usually on a large part of the dataset which is
called a training dataset. Then the algorithm is evaluated in the test phase with the rest
of the dataset which is called the test dataset. We use two different supervised learning

16
methods: Decision tree and Logistic regression. These techniques are used in datasets
that have binary labels. Therefore, they are used both as classification techniques.
Classification trees generate rules that can be easily converted to if-then-else statements
and at the end [10]. In Figure 4, we can see a simple classification tree that predicts a
person's gender based on his weight and height parameters. For instance, if the
condition height > 180cm holds then the classifier will predict the person as Male. Or
if the height < 180cm condition holds then it looks his weight value and if it is lower
than 80kg then the classifier predicts the person’s gender as Female.
Figure 4. An example of a classification tree
Similar to the Decision Tree classifier the Logistic regression classifier also works with
binary data where there are only two outcome classes. The technique uses an equation
(Sigmoid function) with weights and coefficient values of input data to predict the
output value. The function results in S shaped graph which is restricted between 0 and
1 values. So, the given any x value classifier tries to find the correct outcome class using
the logistic function [11].
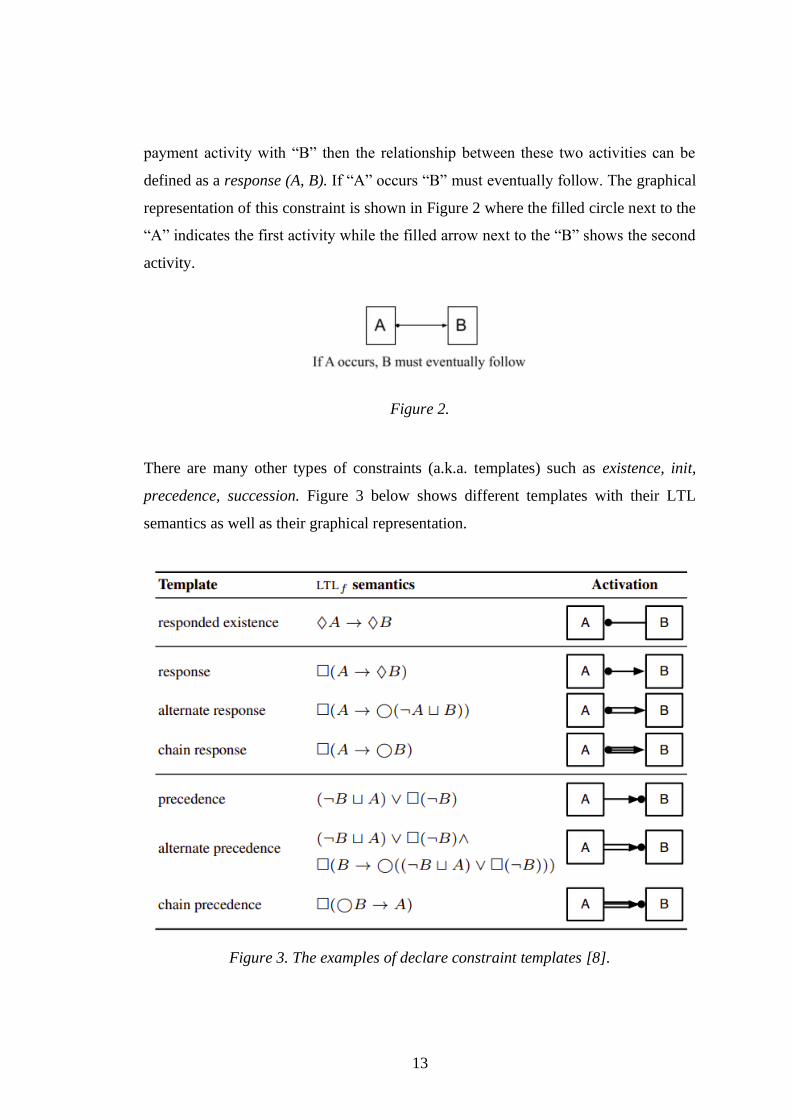
3.5.1 K-fold cross-validation
When training a classification model, it is common to encounter overfitting or selection
bias problems. There are many techniques to overcome this issue and the most effective
one is the cross-validation technique [12].
Using K-fold cross-validation helps to use each part of the dataset both as a training
and test set. Hence, the model’s prediction result is much more precise because it is
17
calibrated on every part of the dataset. For example, for 5-fold cross-validation, the
dataset is split into 5 folds and in each iteration, 4 folds are used for training and the
last one for testing.
Figure 5. [13]
3.6 Background Work
This thesis is based on the work done in [3]. This work benchmarks the deviance mining
results by using the aforementioned features in 3 synthetics and 7 real-life datasets.
There are different input points for every dataset where each input point has its
individual configuration parameters.
Three different feature groups were used for predictions. The first group includes
Individual activities (IA), Sequential features (TR, TRA, MR, MRA), Declare features,
and a combination of sequential and declarative features which are referred to as Hybrid
features. The second group includes Data features which are also used alongside
Sequential features. The last group uses Data-aware Declare Constraints (DWD) to
create features. Additionally, a combination of these features is also evaluated in the
last feature group. Table 3 shows the feature groups used in [3].
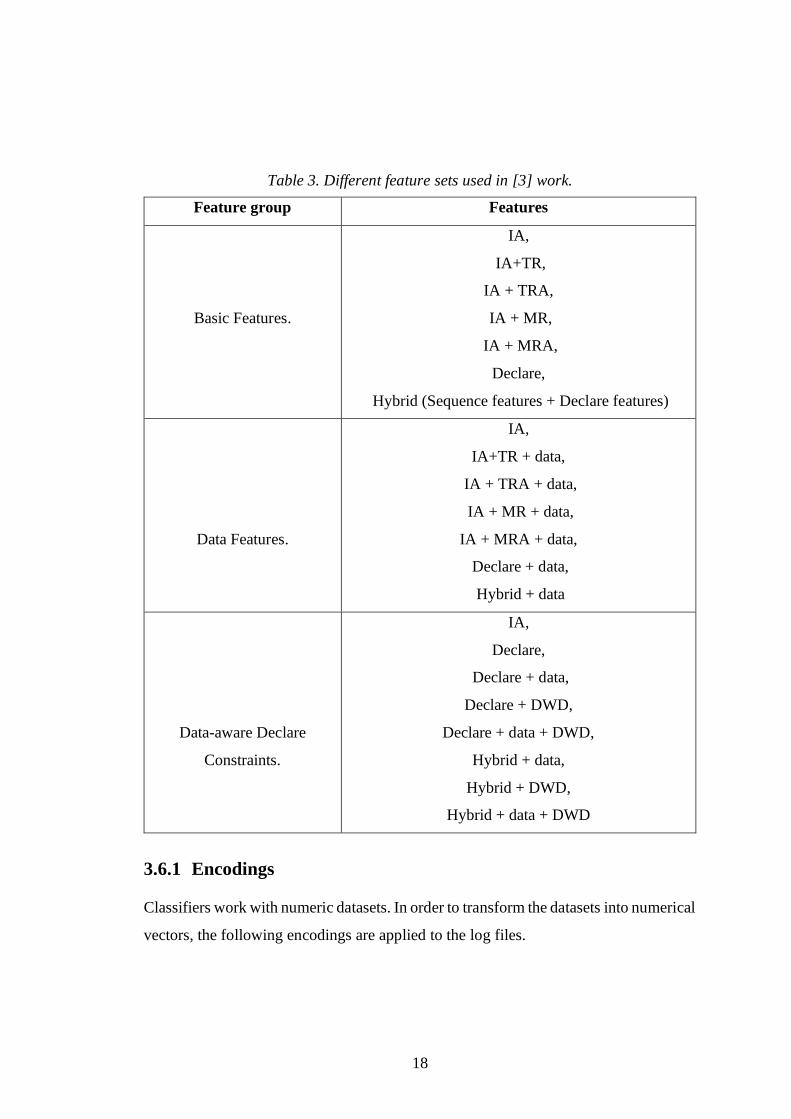
18
Table 3. Different feature sets used in [3] work.
Feature group Features
Basic Features.
IA,
IA+TR,
IA + TRA,
IA + MR,
IA + MRA,
Declare,
Hybrid (Sequence features + Declare features)
Data Features.
IA,
IA+TR + data,
IA + TRA + data,
IA + MR + data,
IA + MRA + data,
Declare + data,
Hybrid + data
Data-aware Declare
Constraints.
IA,
Declare,
Declare + data,
Declare + DWD,
Declare + data + DWD,
Hybrid + data,
Hybrid + DWD,
Hybrid + data + DWD
3.6.1 Encodings
Classifiers work with numeric datasets. In order to transform the datasets into numerical
vectors, the following encodings are applied to the log files.

19
Encoding for Sequential features. For encoding Sequential features, the number of
occurrences of the pattern in the trace has been used. For example, given a trace
T = ababc the tandem repeat in this set is TR = (ab) the number of occurrences of this
pattern is 2 therefore the feature value for this trace will be “2”. The same logic is also
applied to Individual Activities. For the above trace, IA has values a = 2, b = 2, and
c = 1. The features that are not present in the trace will be given the value “0”.
Encoding for Declare features. As we mentioned earlier Declare constraints can have
3 activation states: violated, vacuously satisfied, satisfied. The encoding for Declare
features is simple. If a constraint violation is detected, then the feature value will be “-
1” for the given trace, if the constraint is vacuously satisfied then the feature value will
be set to “0”. For satisfied constraints, the feature value will correspond to the number
“n” of activations in the trace.
Encoding for Hybrid features. For the hybrid encoding, both declarative and
sequential features will be selected, and the encodings mentioned above will apply to
the corresponding feature types.
3.6.2 Results
To benchmark the results using the different feature groups on each dataset, 5 metrics
were used: Accuracy, AUC, F1, Recall, and Precision. To calculate these metrics, we
need to understand what are True Positives, True Negatives, False Positives and
False Negatives refer to?
A true positive (TP) is a correctly predicted positive outcome. Likewise, true negative
(TN) is the one that the classifier predicted the negative outcome correctly. On the
contrary, false positive (FP) is an incorrectly predicted positive outcome and false
negative (FN) is an incorrectly predicted negative outcome [14].
• Accuracy. Accuracy is calculated by dividing the number of correct
classifications by the total number of classifications. For binary classification,
we divide the total of TP and TN by the total of all positives and negatives [14]:
𝐴𝑐𝑐𝑢𝑟𝑎𝑐𝑦 =𝑇𝑃 + 𝑇𝑁
𝑇𝑃 + 𝑇𝑁 + 𝐹𝑃 + 𝐹𝑁

20
• AUC. AUC stands for “Area Under the Curve” which measures the area
underneath the ROC (Receiver Operating Characteristic) curve [14].
• F1. The F1-measure is calculated using precision and recall. Precision is the
number of TP divided by all positives. 𝑝𝑟𝑒𝑐𝑖𝑠𝑖𝑜𝑛 =𝑇𝑃
𝑇𝑃 + 𝐹𝑃 [14].
The recall is the number of TP divided by all the TP and the False Negatives
(FN) 𝑟𝑒𝑐𝑎𝑙𝑙 =𝑇𝑃
𝑇𝑃 + 𝐹𝑁 . The equation for F1 is 𝐹1 =
𝑇𝑃
𝑇𝑃 + 1
2 (𝐹𝑃 + 𝐹𝑁)
which is the
harmonic mean of precision and recall [14].

21
4. Requirements
In this section of the study, we will evaluate the requirements set defined by BPM
experts to build our application. Firstly, we will explore requirements, and then in the
following chapters, we will design test cases and cover the implementation of the
requirements.
We separated the requirements and below we listed the requirements for each part of
the application.
4.1 The Home Page
Requirement 1. The application must have an “About” page that gives a brief
introduction about “what is the tool for?” and guidance on how to use the application.
Requirement 2. The application must have a “Navigation” menu where the users can
navigate through different pages.
4.2 The Upload Page
Requirement 3. The tool must allow the users to upload event logs for later evaluation.
If the operation is successful, then the success message must be shown otherwise error
message must be shown.
Requirement 4. For every uploaded log, the tool must calculate the number of traces
(or cases) and events in the log file and report it to the user in the form of a chart.
4.3 The Splitting Page
Requirement 5. The tool must allow the users to order the sequence of traces in the
log. The ordering options are sequential, random, temporal, and temporal strict.
Requirement 6. The tool must allow the users to split the uploaded log into training
and testing log files. The user should be able to set the ratio of training and testing log
sizes.
Requirement 7. The tool must allow the users to use k-fold cross-validation by
specifying the k value.

22
Requirement 8. There should be a separate downloading option for downloading
training and validation logs.
Requirement 9. A message must be shown to the user about whether the splitting
operation was successful or not.
4.4 The Labeling Page
Requirement 10. The tool must allow the users to label the selected log by applying
conditions on categorical, numerical, and date trace attributes.
Requirement 11. If the data type of trace attribute is number or date the user should
be able to add conditions such as if the attribute’s value is greater or smaller than the
user defined value then label the trace as deviant. If the selected trace attribute is
numerical then the users should also be able to compare the attribute’s value with the
custom threshold. The threshold can be the mean value of the all the attribute’s values
which must be shown to the user as well.
Requirement 12. The user must be able to download the labeled log.
Requirement 13. After the conditions are applied, an informative message must be
shown to the user which traces will be labeled as deviant. Upon completion of the
request, the success message must be displayed.
4.5 The Validation Page
Requirement 14. The application should allow the users to evaluate the log file with
selected feature sets, and with a classifier (with the sub-parameters for the specific
classifier).
Requirement 15. If the selected log file is unlabeled (has no “Label” tag in the traces)
the application should display an error message “Cannot evaluate the unlabeled log”. If
an error occurs during the evaluation process for unknown reasons the user must be
informed with an error message. If everything is correct, then the success message
“Evaluation successfully completed” should be displayed.

23
Requirement 16. Given a labeled dataset the application should produce the following
metrics for measuring classifier: accuracy, AUC (Area Under the Curve), f1 score,
precision, recall. These metrics must be shown for both training and validation datasets.
Furthermore, the parameters used while training the dataset such as coverage threshold,
classifier name, features used, the splitting method used (k-fold cross-validation or
holdout) must be specified in the results.
Requirement 17. The application should report to the users about the evaluated log
results in the form of a chart, diagram, or table. The results data must be stored in one
of the storage options (i.e., database, file system) and the user must be able to download
the results.
Requirement 18. If there are already results that exist for a given log file, they must be
shown to the user when the user selects the log, and the user must be able to download
the results.
Requirement 19. Because of the training, the classifier can take a few minutes the user
still should be able to navigate to other pages while the evaluation is in progress and
receive the message once the request is completed.

24
5. Additional Back-End Functionalities
This research is an extension of the work carried out in [3]. The main goal of this study
is to provide an interface that makes interaction with the tool in [3] more user-friendly.
Moreover, there are some features added to the existing project to guide the process
analyst in the deviance mining task throughout the entire deviance mining analysis
pipeline. The previous version of the tool has limitations to create custom
configurations for each dataset, for example, one needs to have a good understanding
of the Python programming language as well as prior knowledge about the codebase
and how it works.
Because the existing tool was working on a limited set of datasets and did not provide
pre-processing of event logs, a Helper tool was implemented with additional
functionalities. Its main goal is to provide functionalities that are required to accomplish
the entire evaluation process by using the user interface.
The features added to the Helper tool are:
• Splitting (sequential, random, temporal, temporal strict)
• Generating logs for k-fold cross-validation
• Labeling
• Fetching all unique trace attribute names
• Fetching trace attribute values
• Fetching all event attribute names with their corresponding values.
In general, four software tools are involved to serve the final goal.
The overall software architecture of how distinct parts interact with each other has been
described in Figure 6.

25
Figure 6. Application architecture
In this chapter of the study, we will break down each part of the application and explain
them separately.
Firstly, we will talk about changes to tthe ool in [3], secondly, we will continue with
what are the functionalities of the Helper tool and how it contributes to the overall
pipeline.
5.1 Changes to The Existing Tool
In this chapter, we are discussing the changes made to the existing tool that is necessary
to make it work with the front-end side of the application.
In [3], there was a separate entry point for running an evaluation on each dataset. For
instance, if the user wanted to evaluate a synthetically created dataset named
“synth_xray.xes” then there had to be an entry point customized for that.

26
The initial objective was to introduce changes to make this behavior more dynamic.
Therefore, now instead of creating several input points, there is a single input point
where we can set which event log we want to evaluate and with what parameters. In
order connect the tool with our user interface we created an application programming
interface (API).
Configuring the set of parameters is also a crucial part of the application as it defines
which feature sets and classifiers need to be used in the analysis. In addition to that,
there is a settings configuration file for the data features. We described in chapter 3.4.2
that data features can be extracted from trace or event attributes with various methods.
Furthermore, some trace attributes need to be ignored when using Data features.
Attributes like concept:name, which is the unique name of the trace, should be ignored
when the Data feature group is selected. In [3], the method to handle this issue was to
create a separate configuration file for each dataset. With the refactored tool this
settings file can be created using our user interface which we will demonstrate and
explain in chapter 6.
Another upgrade was to change the default behaviors of the existing tool. For example,
instead of using 5-fold cross-validation by default, now the users can set the k value
themselves. Besides, the users can also choose hold-out validation which is splitting the
file into just one training and one validation set.
Moreover, since existing work only supported the Decision Tree classifier, while we
have added an option to choose a Logistic Regression classifier as well.
As seen from the sequence diagram below in Figure 7, on the left frame, the previous
sequence of activities is described, on the right frame, the current state of the existing
tool is described.

27
Figure 7. Sequence diagrams of the previous and current state of an existing tool
Moreover, minor modifications have also been carried out in various parts of the
application to comply with the current state.
5.2 Helper Tool
5.2.1 Split Log
Splitting the log into training and test sets is a very essential part of the pre-evaluation
process. Since the order of the traces in an event log can play a key role when training
the algorithm, it is beneficial to have some options to change the order of traces before
splitting. Therefore, this tool offers four ordering methods of traces: Sequential,
Random, Temporal and Temporal Strict.
Table 4 below describes each ordering option.
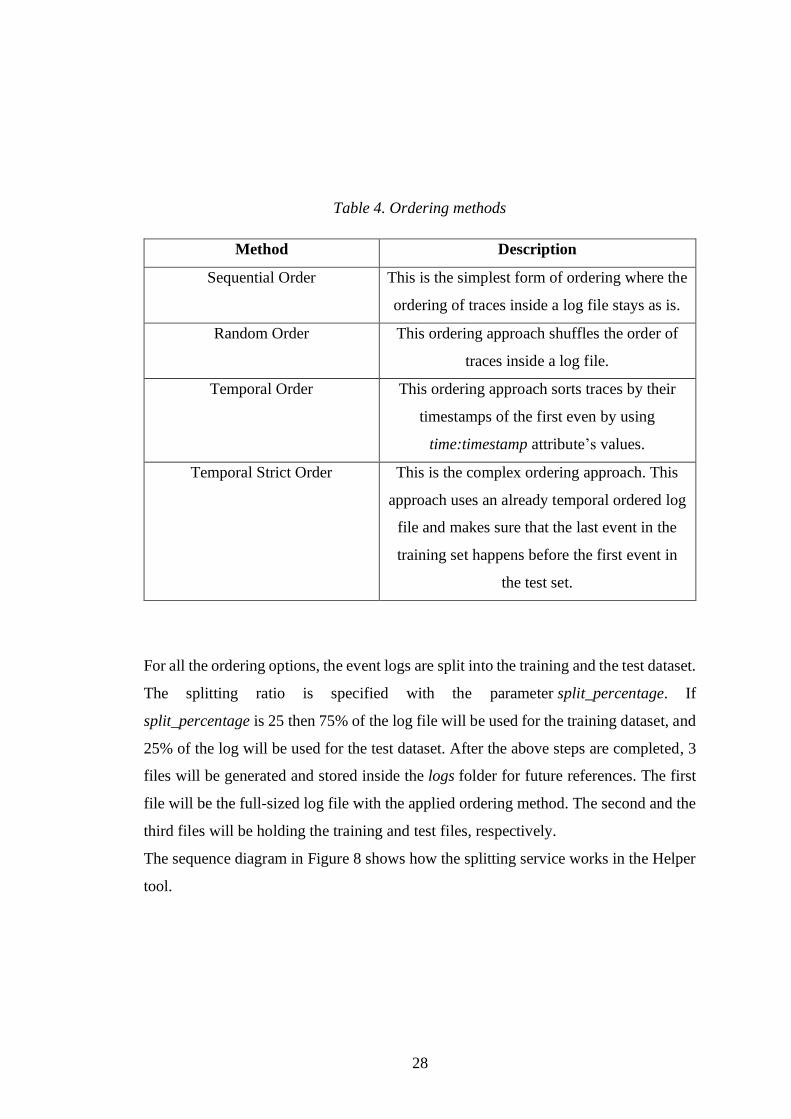
28
Table 4. Ordering methods
Method Description
Sequential Order This is the simplest form of ordering where the
ordering of traces inside a log file stays as is.
Random Order This ordering approach shuffles the order of
traces inside a log file.
Temporal Order This ordering approach sorts traces by their
timestamps of the first even by using
time:timestamp attribute’s values.
Temporal Strict Order This is the complex ordering approach. This
approach uses an already temporal ordered log
file and makes sure that the last event in the
training set happens before the first event in
the test set.
For all the ordering options, the event logs are split into the training and the test dataset.
The splitting ratio is specified with the parameter split_percentage. If
split_percentage is 25 then 75% of the log file will be used for the training dataset, and
25% of the log will be used for the test dataset. After the above steps are completed, 3
files will be generated and stored inside the logs folder for future references. The first
file will be the full-sized log file with the applied ordering method. The second and the
third files will be holding the training and test files, respectively.
The sequence diagram in Figure 8 shows how the splitting service works in the Helper
tool.

29
Figure 8. Sequence diagram for splitting service
Furthermore, the split service in the Helper tool also allows creating k-fold cross-
validation logs. Depending on the user’s choice of k, k logs will be created and split
into training and testing sets using the specified split percentage. k can take values
between 3 and 10. Although using cross-validation can increase the model’s accuracy
in general, as it trains the model on each dataset, it requires more computational
resources than using the holdout method.
5.2.2 Labeling
Sometimes logs are unlabeled, and they need to be labeled before the evaluation steps.
For our application, labeling can be done with conditions on values of trace attributes.
The tool provides labeling with conditions over numerical, categorical, and temporal
trace attributes.
• Labeling with numerical trace attributes. There are three conditions to label
the log with numerical attributes. The first is to label trace as deviant if the value

30
of the attribute equals the given value, the second if it is greater or equal than
the given value, and the third if it is less or equal than the given value.
• Labeling with categorical trace attributes. If the trace contains the selected
attribute's name and value, then it will be labeled as deviant.
• Labeling with temporal trace attributes. The way labeling with temporal
attributes is similar to numerical labeling. Where we label each trace based on
the given conditions.
We will discuss how to set attributes for labeling in chapter 6.4. During the labeling
process, the <string key="Label" value="1"/> tag will be added to the traces which
hold the specified criteria. The value “1” means the trace is deviant. The “0” value
indicates that the trace is not deviant, and it will be added for the rest of the traces.
After the labeling process is done, labeled logs will be saved to the logs folder for future
references. The process for labeling features has been expressed using a sequence
diagram in the following Figure 9.
Figure 9. Sequence diagram for labeling service.

31
6. Requirements Testing
The main goal of this study is to enable users to upload logs and benchmark them
showing the results in a user-friendly graphical user interface. Our user interface
consists of five pages: Home page, Upload page, Split page, Labeling page, and
Validation page.
In this section of the study, we will discuss and explain every page of our application.
According to the specifications in chapter 4 we will design test cases by applying the
principles discussed in [16] – creating a minimum amount of test cases to cover the
maximum number of requirements.
All the related code for the thesis can be found in
https://github.com/SabuhiYusif/Sabuhi-Thesis. The repository for the refactored
existing tool is stored in https://github.com/SabuhiYusif/devianceminingthesis. The
front-end part of the application is hosted in http://193.40.11.69 and the API is hosted
in http://193.40.11.233.
6.1 Home Page
The Home page represents a general view of the graphical interface, the steps for the
standard usage of the application, the navigation to different modules of the application,
and a brief introduction about each step. The purpose of this page is to guide the end-
user about how to interact with the application.
In addition to that, on the left part of the page, there is a Navigation panel that also
allows navigation to various parts of the application. This panel is common for all the
views and users can use it to easily jump between pages without having to navigate
back to the home page which in turn improves the user experience.
The first step for using the application starts with uploading files. This functionality has
been provided by the Upload page, then the second step is splitting files into training
and test files or using k-fold cross-validation in the Split page. Depending on the user’s
choice, a log file can also be labeled on the Labeling page. The final and the most
crucial step is validating the dataset which is called the Validation page. The
Validation page offers setting feature sets, classifiers, as well as parameters for training
the log file, also showing the results to the user.

32
6.1.1 Home Page Test Cases
In Table 5, we have designed the test case to cover the requirements mentioned in
chapter 4.
Table 5. Test case for Home page requirements.
Test
Case
Action Effect Requirements
Coverage
1 Open the application URL
in a web browser.
The guidance to the
application’s standard
procedure is shown in
Figure 10.
Req. 1.
Req. 2.
Figure 10. Home Page

33
6.2 Upload Page
The Upload page allows end-users to upload event log files to the application.
Currently, only XES formatted files can be uploaded to the application. Because most
of the business process event logs are already XES formatted files then this will cover
the majority of the event logs produced today.
The upload process starts with clicking the “Choose a file” button. Upon selecting a
file an API request is sent from the front-end to the back-end service. Then the uploaded
files will be stored under the logs folder of the application. Additionally, the back-end
service will also initiate a service to calculate the initial statistics of the file. This service
will calculate how many traces and events are present in the log file. Following the
completion of the requests, the uploaded file will appear in the Selection box (a
dropdown list in the UI which contains the names of the uploaded logs). The number
of traces and events will be represented in a bar chart. For instance, in Figure 11, we
can see that the uploaded log has 20 cases and 30 events. Furthermore, users can also
upload multiple files and they will be added to the selection list.
There is also a “Reset All” button next to the “Submit” button on the page. This button
serves to remove all the uploaded files from the logs folder.
Figure 11 and Figure 12 show the sequence diagram and the view of the Upload page
respectively.
6.2.1 Upload Page Test Cases
In Table 6 the test cases for covering Upload page requirements are described.
Table 6. Test case for Upload page requirements.
Test
Case
Action Effect Requirements
Coverage
1 Upload a log file using the
“Choose File” button.
The success message and the
number of traces and events the
event log have are shown
(Figure 12).
Req. 3.
Req. 4.

34
Figure 11. Sequence diagram for Uploading service.

35
Figure 12. Upload Page
6.3 Split Log File
The Splitting page allows users to split an uploaded event log into training and testing
logs. Moreover, it also offers a k-fold cross-validation option. The Splitting page can
be navigated through the Home page or the navigation bar.
To generate split logs, the users must select a log file from the dropdown list (by default
the application automatically selects the last chosen log). After selecting a file, the next

36
step is to choose an ordering option for the log - namely Sequential Order, Random
Order, Temporal Order, Temporal Strict Order. The ordering methods are explained in
chapter 5.2.1Split Log.
There is also a Slider component on the Splitting page which determines the ratio of
training and testing files. It is presented as a finite line with a filled circle attached to it.
The most common ratio rates are 80% for training and 20% for testing. Thus, the default
values in the Slider are set to these values. However, users can also easily change the
ratio rates for their case by moving the filled circle attached to the Slider to the right or
the left.
As we mentioned in chapter 5.2 Helper tool provides us the splitting functionality. In
order for splitting to happen, users must click the “Submit” button. Then the application
establishes a communication between the user interface and the Helper tool by
requesting the “/split” endpoint in our API service with the required parameters, which
in turn will run the splitter service.
After the splitting is completed a success message will be shown to the user and three
additional downloading options will also appear on the page. Clicking the first one will
download the full-sized log file with the selected ordering applied. The second one
downloads the created training log and the last one downloads the testing log. This
provides an option for users to download log files and use them in later evaluations.
The splitting process execution and Split page are illustrated in Figure 13 and Figure
14 respectively.

37
Figure 13. Sequence diagram for splitting endpoint
Figure 14. Split Page

38
To use k-fold cross-validation, we can check a checkbox so that an input field appears
where we can set the value for k. “5” is used as default if no value is specified
for k. Subsequently, if we click the “Submit” button, then 5 files will be generated for
further evaluation when we train the model. The indication of how many files have been
created will be added to the file name as a prefix. For instance, if the user chooses “5”
as k value then the file will be prefixed as “5k_[file_name]”. Figure 15 shows how the
user can set the k value on the Split page.
Figure 15. k value input field

39
6.3.1 Split Page Test Cases
In Table 7 the test cases for covering Split page requirements are described.
Table 7. Test case for Split page requirements.
Test
Case
Action Effect Requirements
Coverage
1 Choose a log file and select
one of the ordering methods.
Move the filled circle to the
right and stop it at 30% and
click the “Submit” button.
The success message and the
downloading options appear
on the screen
Figure 14).
Req. 5.
Req. 6.
Req. 9.
2 After the completion of the
splitting request, click the
downloading options.
The proper log files will be
downloaded depending on the
pressed download button.
Req. 8.
3 Choose a log file and then
check the “Use K-fold”
checkbox, write “5” to the
input box and click the
“Submit” button.
5 log files will be created
under the “logs” folder of the
server for future evaluation
(Figure 15).
Req. 7.
6.4 Labeling Page
The Labeling page provides options to label the uploaded log files. As we described in
chapter 5.2.2 the application provides labeling options using trace attributes on 3
different attribute data types: Numerical, String and Date. As for the Splitting page
users first must choose the log file to be labeled from the select list on the top of the
page.
Labeling using categorical trace attributes. To label the log file using categorical
attributes we choose the categorical option from the dropdown list. Upon selecting a

40
method, the application invokes the API endpoint “/attribute-names”, which retrieves
all the attribute names with their categorical values. If the set of fetched names is not
empty, then they will appear in the second selection box where users can choose an
attribute name. Choosing an attribute name also results in another API request which
retrieves all values of the attribute. Then clicking the “Submit” button will label traces
as deviant those are fulfilling the condition.
Labeling using numerical trace attributes. Differently from the categorical method,
selecting the numerical labeling method will only retrieve attributes with numerical
values. After selecting a value for the chosen attribute there will be three options for
defining the condition.
· Greater or equal than the specified value
· Less or equal than the specified value
· Equal to the specified value
By looking at the naming of the definitions, we can see that they refer to the options we
discussed in chapter 5.2.2.
Also, the user can set the custom value using the input text field then choose one of the
above conditions. In addition, the mean value of the attribute’s values will also be
available for the user to use in the custom field.
Labeling using temporal trace attributes. The steps for using a temporal method are
similar to the numerical method. Only the attributes with type date will be fetched and
conditions are the same as for the numerical method.
All labeling operations start from UI and invoke the proper services in the Helper Tool
using our API.
In Figure 16, the sequence diagrams demonstrate the whole labeling process execution
and, in Figure 17, a screenshot of the Labeling page is shown for labeling using
numerical trace attributes method.

41
Figure 16. Labeling process.

42
Figure 17. Labeling Page
43
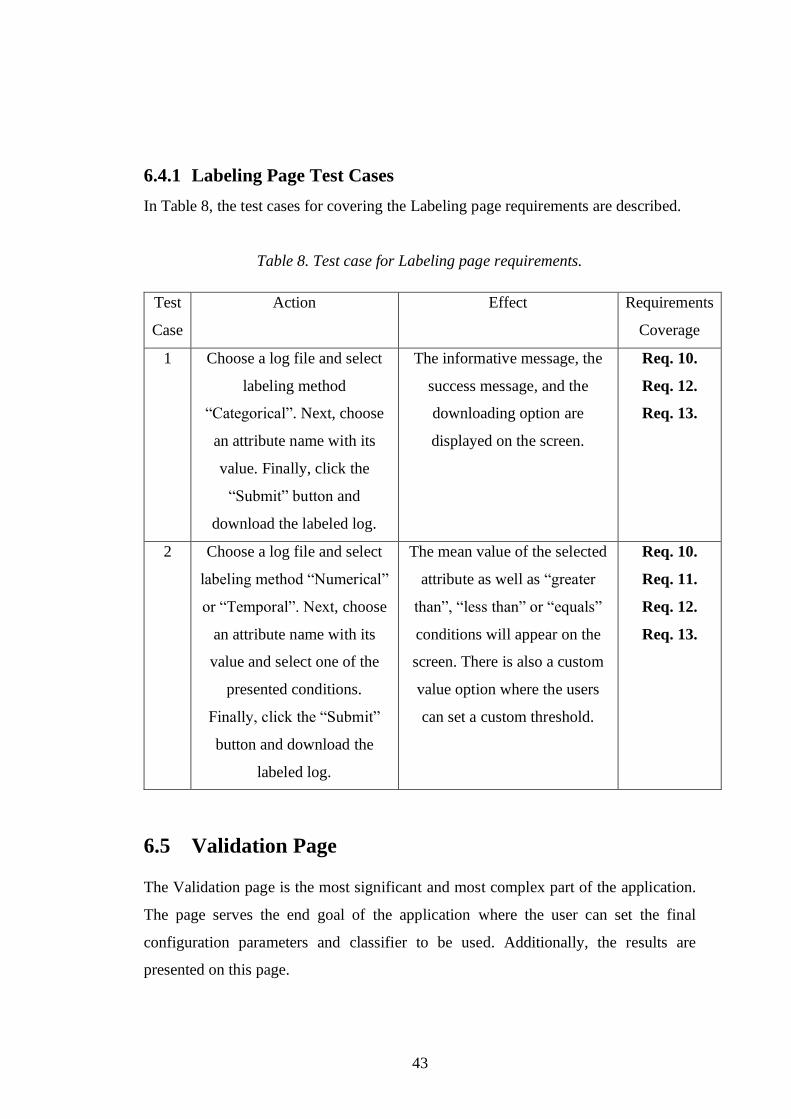
6.4.1 Labeling Page Test Cases
In Table 8, the test cases for covering the Labeling page requirements are described.
Table 8. Test case for Labeling page requirements.
Test
Case
Action Effect Requirements
Coverage
1 Choose a log file and select
labeling method
“Categorical”. Next, choose
an attribute name with its
value. Finally, click the
“Submit” button and
download the labeled log.
The informative message, the
success message, and the
downloading option are
displayed on the screen.
Req. 10.
Req. 12.
Req. 13.
2 Choose a log file and select
labeling method “Numerical”
or “Temporal”. Next, choose
an attribute name with its
value and select one of the
presented conditions.
Finally, click the “Submit”
button and download the
labeled log.
The mean value of the selected
attribute as well as “greater
than”, “less than” or “equals”
conditions will appear on the
screen. There is also a custom
value option where the users
can set a custom threshold.
Req. 10.
Req. 11.
Req. 12.
Req. 13.
6.5 Validation Page
The Validation page is the most significant and most complex part of the application.
The page serves the end goal of the application where the user can set the final
configuration parameters and classifier to be used. Additionally, the results are
presented on this page.

44
To understand how this page works we will talk about each part in separate subsections.
As we discussed in chapter 3.6, there are 3 feature groups to validate the dataset on.
When we open the page, we have 3 options to choose from: Basic feature group (with
Hybrid features), Data feature group (with Hybrid features), and Data-aware Declare
constraints (with Hybrid features).
6.5.1 Validation using Basic feature sets.
This is the first option and includes feature sets that belong to the basic feature group.
In detail, explanations are given in Table 3. When we choose this option on the left side
of the page, a list of feature names appears on the right side of the page with checkboxes
next to them. By checking these checkboxes, we are selecting which features we want
to use while training our model. After checking the features and making sure that the
correct file is chosen from the file selection box we can click the “Submit” button. This
will initiate an API request to the “/evaluate” endpoint. Henceforth, the API service will
invoke the application implemented in [3] and a progress bar will appear on the screen
to inform the user that the process is in progress. The results will be shown as bar charts
to the user. The Validation page with the “Basic Features” option selected is shown in
Figure 18.

45
Figure 18. Validation Page
6.5.2 Validation using Data feature sets.
This subpage is the most complex one. As we already mentioned in chapter 5.1, because
this feature set requires additional configurations to be applied before evaluation, we
need a settings configuration file to be created.
The settings file is a helper configuration file that the user can configure according to
the given options. The default layout for the settings file has been shown in Figure 19.
From the top of the file, we can see the “—TRACE IGNORED--” header. The values
below this field represent the attribute names that will be ignored while using Data

46
features methods. The default attribute names are the ones that should not contribute to
the evaluation process. For example, since the Label attribute defines if a trace is
deviant or not, this attribute should not be included in the features.
The most important part of the configuration file is the “--EVENT--” header where we
define, for each event attribute, the method we want to use when extracting Data
features from the event log. The schema for adding attribute names and the methods
follows [attribute_name] | [method] convention. For the rest of the attributes which are
not defined under the header “—EVENT--” the method under “—EVENT DEFAULT-
-” will be used for creating the features. For instance, if no extraction method is
specified for the event attribute “org:group” then the method defined under the event
default header will be used.
As we have already seen the methods are Count, Choose First, Choose Last, Choose
Max, Choose Min, and Choose Average. Choosing maximum, minimum, and average
values only belong to attributes with numeric (float or integer) data type. Choose First,
Choose Last and Count on the other hand can be used for all data types.
In addition to the methods mentioned above, we can also extract features using meta-
information. Those are not directly related to trace or event attributes rather they are
holding information such as time duration of traces or the number of events in a trace.
Currently, the tool provides feature extraction using trace length meta-information,
which we can see under the “—TRACE EXTRA--” header in the settings file.
Since most of the event logs have many common attribute names the settings file below
is the default file for each submitted event log. However, the validation page also allows
creating the custom configuration file for each selected event log. To do that first we
need to click the Data features option button on the Validation page, then our
application will immediately invoke an API request to fetch all the unique event
attributes of the selected file (which is provided by the Helper tool). Then, after the
request completion, a selection box is shown that contains a list of attribute names on
the screen. After selecting an attribute, another selection box will appear next to it where
the methods are shown. By selecting both attribute name and the method we can use
the “Add” button to add the selection to the table. We can also remove options using
the “Delete” action next to each row.

47
This table is shown in Figure 20 including the values under the “--EVENT--” header as
a table format.
Figure 19. Settings file with default configurations.
There is also an additional select box where the user can set the default extraction
method. This method will be written under the header “--EVENT DEFAULT--”.
After we populate the table and event default with the values we want, then we can
click the “Submit Settings” button. The settings file will be overwritten with our user-
defined settings. If the user wants to see the new settings file “Download Settings”
button will appear after the request is completed successfully.

48
Figure 20. Table view of selected attribute names and their feature extraction
methods
6.5.3 Validation using Data-aware declare feature sets.
For using Data-aware Declare constraints we must choose the third option on the
Validation page. If selected, we can also evaluate different hybrid options. For example,
Hybrid features with Data features and Data-aware Declare constraints.
6.5.4 Classifier Selection
The Validation page offers two models that can be set: Decision Tree and Logistic
Regression classifiers. Furthermore, it allows the user to set parameters for each model.
For instance, if the Decision Tree classifier is selected then the page also shows the
input parameters for defining the maximum depth of the tree and the minimum number
of samples required to split an internal node. We can see the view of this component in
Figure 21. Changing these parameters can produce different results, therefore the users
can also experiment with various values while benchmarking the feature sets.

49
Moreover, users can also set a value for the coverage threshold parameter as explained
in [15].
Figure 21. Classifier selection view
6.5.5 Validation Page Test Cases
The test cases for evaluating the Validation page are shown in Table 9 below. Besides,
there are references to the figures for each test case results.
Table 9. Test cases for Validation page requirements.
Test
Case
Action Effect Requirements
Coverage
1 Select unlabeled log file with Basic
Feature Set and Decision Tree
classifier with default parameters.
Additional Parameters: Coverage
threshold: 5.
Error message:
“Cannot evaluate
the unlabeled log”
(Figure 22).
Req. 14.
Req. 15.
2 Select invalid log file with Basic
Feature Set and Decision Tree
classifier with default parameters.
Additional Parameters: Coverage
threshold: 5.
Error message:
“Something went
wrong” (Figure
22).
Req. 14.
Req. 15.

50
3 Select a valid log file with a k-fold
cross validation split and choose Basic
Feature Set and Decision Tree
classifier with parameters max. depth:
15, min. samples: 10.
Additional Parameters: Coverage
threshold: 10.
Success message:
“Evaluation
successfully
completed”
Deviance Mining
Results:
Results reported
using bar/radar
charts.
“Download”
button for results.
Figure 23, Figure
24.
Req. 14.
Req. 15.
Req. 16.
Req. 17.
4 Select an already evaluated log file
with the holdout split method
with Data Feature Set and
Decision Tree classifier with default
parameters.
Additional Parameters: Default
values.
Deviance Mining
Results: Stored
results retrieved
from the file
system and
reported using
bar/radar charts.
“Download”
button for results.
Req. 14.
Req. 18.
5 Select a valid log file with holdout
split method and choose Data-aware
Declare constraints feature group with
classifier Logistic Regression with
parameters random state: 5.
Additional Parameters: Coverage
threshold: 8.
Global success
message:
“Evaluation
successfully
completed”.
Req. 14.
Req. 19.

51
Navigated to different pages while
evaluation is in progress.
6 Select an invalid log file with default
parameters.
Additional Parameters: Default
values.
Navigated to different pages while
evaluation is in progress.
Global error
message:
“Something went
wrong, evaluation
failed”.
Req. 19.
Figure 22

52
Figure 23
Figure 24

53
7. Feedback elements
In our user interface, we have diverse kinds of feedback messages. Because almost in
all parts of the application there is communication between the user interface and web
service (API) the user should be informed about the request completions. For that, we
are using success and error alerts to display the message without interrupting the
workflow.
For instance, on the Labeling page after we submit the request to the server, upon
successful completion the application displays an informative success message to the
user. In Figure 25, we can see the green success message and how it is displayed.
Figure 25. An example of shown success message.
On the other hand, if the request fails, then we display the error message in red color to
attract the user’s attention that something went wrong. In Figure 26, we are seeing the
example for the error message.
Figure 26. An example of shown error message.
Another useful message is informative messages which are displayed in blue color.
These messages usually give information about what will going to happen if the specific
action is executed. For instance, in Figure 27, we can see in the Labeling page, after the
conditions are selected, the message informing the user which traces will be labeled as
deviant if the user submits the request.
Figure 27. An example of shown informative message.

54
In addition to the aforementioned messages, there are also global feedback messages.
To give an example of global messages let us say the user executes a validation request
and this request might take 1 or even several minutes to accomplish. During this time,
the user can navigate between pages and the request still will be taken place in the
background.
In order to inform whether the request is finished or not, the user does not need to
navigate back to the Validation page because the message about the completed requests
will pop up on top of the screen of any other page. Figure 28 shows an example of a
global feedback message.
Figure 28. An example of a shown global message.

55
8. Tool Implementation
This section provides detailed information about the application architecture, the used
technologies, and the reasons why a specific technology stack was used.
8.1 Application Architecture
As we explored the overall architecture of the application in chapter 5. We can now
discuss the planning of the building process. Due to the previous work being done in
pure Python without any web frameworks such as Django or Flask, one of the main
challenges was to create a connection between the tool and the graphical interface. In
order to overcome this challenge, an application programming interface (API) was
created to provide communication between two applications. Since we have 2 back-end
modules for processing logs, creating an API cleared out the complexity of the need to
talk with 2 services directly from the front-end part of the application.
8.1.1 API Architecture.
The RESTful2 (Representational State Transfer) API design was used when creating
our API. In a REST service, data can be represented in different formats such as XML,
JSON, HTML. The JSON3 (JavaScript Object Notation) format is a subset of the
JavaScript language, thus, it is a common and simpler way of representing structured
data to the front-end side of the application. Therefore, JSON format was used for
sending and receiving the data between the front-end and the back-end services. Other
than connecting the user interface with back-end services, some tasks which do not
require data processing have been implemented by using the API service itself. For
instance, downloading and uploading log files as well as creating the configuration file
are implemented as part of the API.
2 A protocol used for creating interactive web services.
[https://en.wikipedia.org/wiki/Representational_state_transfer] 3 [https://www.json.org/json-en.html]

56
8.1.2 Helper Tool Architecture
There is no particular design used while creating the Helper Tool. The Helper Tool
composes of many modules which are independent of each other but uses common
utilities to achieve the result. This tool is an extension of the existing tool.
8.1.3 Front-end Architecture
The key functionality of front-end architecture is that it is the composition of
components. This means that the components and their sub-components are created for
each page, and they should work well together. The key advantage of using the
component-based design is that any part of the application can be changed without
modifying the other parts. For example, it should be possible to alter some parts of the
child component without altering the parent components.
The main components of our front-end are navigating, uploading, downloading log
files, splitting, labeling log files alongside training, and visual representation of the
results. Those components also have multiple child components which work together
in harmony to reach the final goal.
8.2 Technologies
In this section, we will explore the combination of technologies used to build and run
our application.
8.2.1 Back-end
For building the RESTful API the Spring Boot framework4 was used. Spring boot is an
open-source Java based framework that makes it easy to create and run Spring
applications with minimum effort. Although the main language for the Spring
framework is Java, there is also support for Kotlin5. This support was added in 2017
with Spring Framework 5.0 release. In our study, we use Kotlin. Kotlin is a statically
typed JVM (Java Virtual Machine) programming language that is compiled to Java
bytecode and fully interoperable with Java. The interoperability with Java gives access
to all existing libraries written in Java. The reasons for choosing Kotlin over Java are:
4 [https://spring.io/learn] 5 [https://kotlinlang.org/lp/server-side/]

57
support for not fully mainstream paradigm - functional programming concepts (lambda
expressions, inline functions), data classes which is concise by eliminating the
boilerplate line of codes, extension functions – adding extra functions to the classes
without having to inherit from them.
Because of the great amount of machine learning and data processing libraries, Python
was the main choice for developing the Helper tool. The tool was created using Python
3.8. With benefits like comprehensive documentation, compatibility with the latest
versions of Python, and open-source project – the PM4PY6 library was used for
processing the event logs. This library specialized in process mining purposes and
gained a lot of popularity in recent times.
8.2.2 Front-end
For implementing the front-end part of the application, the React JavaScript Library7
was used. It is the most popular library among developers for building modern web
applications. The Redux8 library was used for managing the state of the application.
This library serves to store, update the “global state” of the application which can be
used in various parts of the application. For styling, the UI Material-UI9 library was
used which is created based on Google’s Material Design10.
6 [https://pm4py.fit.fraunhofer.de/] 7 [https://reactjs.org/] 8 [https://redux.js.org/] 9 [https://material-ui.com/] 10 [https://material.io/design]

58
9. Conclusion
In this thesis we have developed a web application to support the full pipeline
underlying the analysis of deviant cases in a log file by applying different feature groups
namely: Sequential, Declare, Data, Data-aware declare constraints, and Hybrid. The
main aim of the application is to give the opportunity to the end-user to apply the set of
features with various parameter configurations and train a classification model. Then,
the tool presents metrics such as accuracy, AUC, f1 score, precision, and recall in a
form of graphical charts to compare the final results.
We have also presented a Helper tool that contributed to further improve the user
experience by providing additional features for the application back-end such as
uploading, splitting, and labeling under one web interface. We have also created an API
to serve as a communication channel between the user interface and the back-end
services.
As a next step to improve the implementation we currently have, we can merge raw
back-end Python scripts with the API using one of the Python web frameworks like
Django or Flask. To achieve this, the back-end services should be reimplemented into
web frameworks.
Moreover, currently, we are storing hyperparameters and the metrics generated after
the validation phase into the file system in JSON format. In the future, we can map
these into a relational database for simplifying the findings of correlations between
predictive model performance and selected combinations of the parameters.
Finally, to run the whole application, the developer must run both back-end and front-
end services separately. To make the developer experience more pleasant we can
introduce microservice architecture to our project. We can create submodules for each
part of the project and pack them into Docker11 containers for running the whole
application with one command.
11 [https://www.docker.com/]

59
10. References
1. Aalst, W. v. (2016). Process Mining Data Science in Action . Springer-Verlag
Berlin Heidelberg.
2. Nguyen H., D. M. (2014). Mining Business Process Deviance: A Quest for
Accuracy. In: Meersman R. et al. (eds) On the Move to Meaningful Internet
Systems: OTM 2014 Conferences. OTM 2014. Lecture Notes in Computer Science,
vol 8841. . Springer, Berlin, Heidelberg.
3. Puura, J. (2019). Advanced Methods in Business Process Deviance Mining. Masters
Thesis: University of Tartu.
4. Gunther, C. W., & Verbeek, H. M. W. (2014). XES - standard definition. (BPM
reports; Vol. 1409). BPMcenter. org.
5. Leemans S.J.J., Fahland D., van der Aalst W.M.P. (2016) Using Life Cycle
Information in Process Discovery. In: Reichert M., Reijers H. (eds) Business
Process Management Workshops. BPM 2016. Lecture Notes in Business
Information Processing, vol 256. Springer, Cham. https://doi.org/10.1007/978-
3-319-42887-1_17
6. Bose, R. P. J. C., & Aalst, van der, W. M. P. (2013). Discovering signature patterns
from event logs. In Proceedings of the 2013 IEEE Symposium on Computational
Intelligence and Data Mining (CIDM'13, Singapore, April 16-19, 2013) (pp. 111-
118). Institute of Electrical and Electronics
Engineers. https://doi.org/10.1109/CIDM.2013.6597225
7. Pesic, M. (2008). Constraint-based workflow management systems : shifting
control to users. Technische Universiteit
Eindhoven. https://doi.org/10.6100/IR638413
8. Giacomo, G.D., Dumas, M., Maggi, F., & Montali, M. (2015). Declarative Process
Modeling in BPMN. CAiSE.
9. Maggi F.M., Dumas M., García-Bañuelos L., Montali M. (2013) Discovering
Data-Aware Declarative Process Models from Event Logs. In: Daniel F., Wang
J., Weber B. (eds) Business Process Management. Lecture Notes in Computer

60
Science, vol 8094. Springer, Berlin, Heidelberg. https://doi.org/10.1007/978-3-
642-40176-3_8
10. Wikipedia [Online; accessed 8-May-2021], 2021 Decision Tree,
https://en.wikipedia.org/wiki/Decision_tree
11. Wikipedia [Online; accessed 8-May-2021], 2021 Logistic Regression,
https://en.wikipedia.org/wiki/Logistic_regression
12. Wikipedia [Online; accessed 8-May-2021], 2021 Cross-Validation (statistics)
https://en.wikipedia.org/wiki/Cross-validation_(statistics)
13. Datacamp [Online; accessed 8-May-2021], 2021 https://datacamp.com
14. Google developers [Online; accessed 8-May-2021], 2021 Classification Metrics
https://developers.google.com/machine-learning/crash-course/classification
15. Jarabek, J., Maggi, F., Milani, F.P., Teinemaa, I., Verenich, I., & Mateos, B. (2016).
Exploring business process Deviance with Declare.
16. G. Mogyorodi, "Requirements-based testing: an overview," Proceedings 39th
International Conference and Exhibition on Technology of Object-Oriented
Languages and Systems. TOOLS 39, 2001, pp. 286-295, doi:
10.1109/TOOLS.2001.941681.
17. M. Pesic, H. Schonenberg and W. M. P. van der Aalst, "DECLARE: Full Support
for Loosely-Structured Processes," 11th IEEE International Enterprise Distributed
Object Computing Conference (EDOC 2007), 2007, pp. 287-287, doi:
10.1109/EDOC.2007.14.
18. Montali, Marco & Chesani, Federico & Maggi, Fabrizio & Mello, Paola. (2013).
Towards Data-Aware Constraints in Declare. Proceedings of the ACM Symposium
on Applied Computing. 10.1145/2480362.2480624.
19. F. M. Maggi, A. J. Mooij and W. M. P. van der Aalst, "User-guided discovery of
declarative process models," 2011 IEEE Symposium on Computational Intelligence
and Data Mining (CIDM), 2011, pp. 192-199, doi: 10.1109/CIDM.2011.5949297.
20. Lakshmanan G.T., Rozsnyai S., Wang F. (2013) Investigating Clinical Care
Pathways Correlated with Outcomes. In: Daniel F., Wang J., Weber B. (eds)
Business Process Management. Lecture Notes in Computer Science, vol 8094.
Springer, Berlin, Heidelberg. https://doi.org/10.1007/978-3-642-40176-3_27

61
21. Sun, C., Du, J., Chen, N., Khoo, S.-C., Yang, Y.: Mining explicit rules for software
process evaluation. In: Proc. of ICSSP, pp. 118–125. ACM (2013).
22. Cuzzocrea A., Folino F., Guarascio M., Pontieri L. (2015) A Multi-view
Learning Approach to the Discovery of Deviant Process Instances. In: Debruyne
C. et al. (eds) On the Move to Meaningful Internet Systems: OTM 2015
Conferences. OTM 2015. Lecture Notes in Computer Science, vol 9415.
Springer, Cham. https://doi.org/10.1007/978-3-319-26148-5_9.
23. K. Jorbina,A. Rozumnyi,I. Verenich, C. Di Francescomarino, M. Dumas, "
Nirdizati: A web-based tool for predictive process monitoring," BPM Demo Track
and BPM Dissertation Award, 2017
24. Jagadeesh Chandra Bose R.P., van der Aalst W.M.P. (2009) Abstractions in
Process Mining: A Taxonomy of Patterns. In: Dayal U., Eder J., Koehler J.,
Reijers H.A. (eds) Business Process Management. BPM 2009. Lecture Notes in
Computer Science, vol 5701. Springer, Berlin, Heidelberg.
https://doi.org/10.1007/978-3-642-03848-8_12

62
License
Non-exclusive license to reproduce thesis and make thesis public
I, Sabuhi Yusifov
1. herewith grant the University of Tartu a free permit (non-exclusive license) to
reproduce, for the purpose of preservation, including for adding to the DSpace
digital archives until the expiry of the term of copyright,
A Web Application Supporting the Full Pipeline of Business Process
Deviance Analysis
supervised by Fabrizio Maria Maggi
2. I grant the University of Tartu a permit to make the work specified in p. 1
available to the public via the web environment of the University of Tartu,
including via the DSpace digital archives, under the Creative Commons license
CC BY NC ND 3.0, which allows, by giving appropriate credit to the author, to
reproduce, distribute the work and communicate it to the public, and prohibits
the creation of derivative works and any commercial use of the work until the
expiry of the term of copyright.
3. I am aware of the fact that the author retains the rights specified in p. 1 and 2.
4. I certify that granting the non-exclusive license does not infringe other persons’
intellectual property rights or rights arising from the personal data protection
legislation.
Sabuhi Yusifov
15/05/2021