Embed Size (px)
Citation preview

1
A Western-like fat diet is sufficient to induce a gradual enhancement in fat
mass over generations
Florence Massiera*, Pascal Barbry‡, Philippe Guesnet¶, Aurélie Joly**, Serge Luquet**,
Chimène Moreilhon-Brest‡,†, Tala Mohsen-Kanson*, Ez-Zoubir Amri*, and Gérard
Ailhaud*,1
*Université de Nice Sophia-Antipolis; CNRS, IBDC, UMR 6543, 06107 Nice, France;
‡Université de Nice Sophia-Antipolis; CNRS, IPMC, UMR6097, F-06560 Valbonne,
France; ¶INRA, Nu.Re.Li.Ce. UR909, 78352 Jouy en Josas cedex, France;
**Université Diderot-Paris 7, CNRS EAC 7059, Biologie Fonctionnelle et Adaptative
75205 Paris Cedex 13, France; †CHU de Nice, Laboratoire d'Oncohématologie,
Hôpital Pasteur, F06100 Nice, France.
1Corresponding author: G. Ailhaud, Université de Nice Sophia-Antipolis and CNRS,
UMR 6543; Faculté de Médecine; †8 Avenue de Valombrose, 06107 Nice Cedex 2,
France; Tel: +33 493 37 76 47; Fax: +33 493 37 70 58; [email protected]
Running title: Transgenerational obesity and high-fat diet
Abbreviations: ARA, arachidonic acid; DHA, docosahexaenoic acid; EPA,
eicosapentaenoic acid; HFD, high fat diet; LA, linoleic acid; LNA, α-linolenic acid;
PUFA, polyunsaturated fatty acid; WAT, white adipose tissue

2
Abstract
The prevalence of obesity has steadily increased over the last few decades. During
this time, populations of industrialized countries have been exposed to diets rich in fat
with a high content of linoleic acid and a low content of α-linolenic acid compared to
recommended intake. To assess the contribution of dietary fatty acids, male and
female mice fed a high-fat diet (35% energy as fat, linoleic acid/α-linolenic acid ratio
of 28) were mated randomly and maintained after breeding on the same diet for
successive generations. Offspring showed, over four generations, a gradual
enhancement in fat mass due to combined hyperplasia and hypertrophy with no
change in food intake. Transgenerational alterations in adipokine levels were
accompanied by hyperinsulinemia. Gene expression analyses of the stromal vascular
fraction of adipose tissue, over generations, revealed discrete and steady changes in
certain important players such as CSF3 and Nocturnin. Thus, under conditions of
genome stability and with no change in the regimen over four generations, we show
that a Western-like fat diet induces a gradual fat mass enhancement, in accordance
with the increasing prevalence of obesity observed in humans.
Supplementary key words: fat mass, ω6 linoleic acid, high-fat diet, generation

3
Introduction
The prevalence of overweight and obesity and the increase in the risk of developing
associated diseases have steadily increased across generations over the last
decades in infants and adults. In addition, these events now emerge earlier in life.
This epidemic is not attributable to genetic factors since it occurred relatively recently
and is observed in a wide range of human populations, which makes the emergence
of genetic variation quite unlikely. High-fat diets are considered to be obesogenic in
that they produce a consistent increase in fat mass, which is directly related to the fat
content of the diet and duration of feeding. However, the contribution of dietary fats
compared to an excess energy intake in increasing body weight remains
controversial, as no major change in the total amount of ingested fats has occurred in
the last two decades (1, 2).
In addition to caloric excess, a qualitative issue has emerged as a risk factor for
obesity in rodents and possibly in humans, i.e. the disequilibrium in polyunsaturated
fatty acid (PUFA) metabolism with a high ratio of linoleic acid (C18:2 ω6, LA) vs. α-
linolenic acid (C18:3 ω3, LNA)(3). Notably, in rodents, reducing this ratio from 59 to 2
under isolipidic, isoenergetic conditions (40% energy as fat) by inclusion of dietary
LNA counteracted the enhancing effects of LA on body weight and fat mass, which
then became similar to that observed with a chow diet (4). ω6 PUFAs were more
potent than ω3 PUFAs in promoting adipogenesis (5-7). When combined with a high
carbohydrate content, a linoleic acid-enriched diet was found to be pro-adipogenic in
vivo through cAMP-dependent signaling (8). LA acts through arachidonic acid (C20:4
ω6, ARA) and prostacyclin, since pups from mice invalidated for the prostacyclin
receptor (IP-R) and fed a LA-rich diet exhibit reduced body weight and fat mass
compared to wild-type mice fed the same diet (4). Overall, these results emphasize

4
the importance of adipose tissue development in rodents of a high fat diet combined
with a high LA/LNA ratio. Therefore, by analogy to humans in which consumers have
been permanently exposed -from in utero to old age- to dietary fats with a high
content of LA and a low content of LNA, and in which the prevalence of overweight
and obesity has increased within a few generations (9), we decided to set up a
nutritional model mimicking a human situation. For this purpose, male and female
mice were chronically exposed over four generations to a single Western-like fat diet,
i.e. 35% energy as fat with a LA/LNA ratio similar to that found in the most consumed
foods. The results show that this condition was sufficient to trigger gradual
transgenerational enhancement of the fat mass observed at early and adult age. In
addition to changes in insulin and adipokine circulating levels and to changes in
cellularity of adipose tissue, gene expression profiling over generations was used to
highlight the major molecular events favoring adipose tissue hyperplasia and
metabolic imprinting that lead to an obese phenotype. by on June 4, 2010 w
ww
.jlr.orgD
ownloaded from
http://www.jlr.org/cgi/content/full/jlr.M006866/DC1
Supplemental Material can be found at:

5
Materials and Methods
Transgenerational mice and diets. A colony of pure inbred C57BL6/J mice was
established based on the mating of 4 males and 4 females originating from the same
litter (Charles River, France) and which were fed a chow diet. At weaning, pups were
either maintained on a chow diet (STD mice) or fed a high-fat diet (ω6HFD) (HF
mice). Both diets contained 21.4% proteins, 3.9% fiber and 5.7% minerals and ash.
The fatty acid composition of ω6HFD (35% energy as fat) and chow diet is detailed in
Table S1 and shows that ω6HFD contained a 3.7-fold higher amount of LA (7.9 g/100
g vs. 2.2 g/100 g in the STD) but the same amount of LNA (0.24-0.26 g/100 g) than
the chow diet. As shown in Table 1, male and female mice were first fed ω6HFD from
weaning and later mated to generate HF0 mice whereas from HF0 to HF4 mice both
the male and female mice were fed ω6HFD; in this way HF0 to HF4 mice were
continuously exposed over generations to this isocaloric, isolipidic diet. The whole
population of male and female HF0 adults was mated randomly at 10 weeks old to
give the first generation termed HF1 (Table 1). Among several possibilities, pups
could have been derived from a low-body fat gainer male crossed with a low-body fat
gainer female, or from a high-body fat gainer male crossed with a high-body fat
gainer female. Many additional combinations were also possible. Random mating
was chosen on purpose in order to exclude any such selection process. After
lactation by HF0 dams, HF1 pups were fed after weaning on ω6HFD and mated
randomly as described above to generate HF2 mice. The same protocol was used to
establish generations HF3 and HF4. Reversion experiments were performed by
switching at weaning HF1, HF3 and HF4 pups to a chow diet; these mice were
respectively termed revHF1, revHF3 and revHF4 mice. Adult male and female
revHF4 mice then fed a chow diet were mated randomly to give birth to the 5th

6
generation of pups which were fed at weaning either the chow diet (termed std5
mice) or ω6HFD (termed hf5 mice) (Table 1). Mice were housed 5 per cage and the
body weight was measured weekly for each group of mice from birth to 22 weeks old.
All other measurements were performed with adult mice, i.e. from 8 to 22-weeks old.
At 8 weeks old, food intake was measured daily for one week. Plasma extraction and
adipose tissue dissection were performed as described previously (10). All
experimental animal protocols were performed in accordance with the
recommendations of the French and European Accreditation of Laboratory Animal
Care and were approved by the local experimentation committee.
Lipid analyses of plasma and adipose tissue. After a 12 h-fast, blood was collected
from 14 and 22- week old mice (n=4). Plasma and adipose tissue were analyzed for
the fatty acid content by direct transesterification as described (11).
Breast milk. Indirect measurement was performed by collecting the stomach content
of breast fed HF1 pups (n=4 for each group). Total lipids of the stomach content were
extracted in the presence of 0.02% butylhydroxytoluene before performing gas
chromatography (11).
Metabolic parameters. Blood was collected in 22-week old mice (n ≥ 4) by heart
puncture, after a 14-hour fast. Then plasma leptin, insulin, total adiponectin, IL-6,
TNF-α, resistin, PAI-1, and MCP-1 concentrations were assessed with a Lincoplex
assay (Millipore, St Quentin en Yvelines, France).
Morphometric analysis of isolated adipocytes. Epididymal fat pads from 10-week old
mice (n ≥ 3) were isolated and weighted before cell dissociation for 30 min with
collagenase type IV (Sigma Chem.). After filtration (250 µm), the infranatant was
removed by catheter aspiration. In each condition, three pictures of isolated

7
adipocytes per mouse were taken with a light microscope. Measurement of the cell
diameter and number was performed as described previously (10).
RNA extraction. Total RNA was extracted from SVF cells prepared from
periepididymal adipose tissues of 10-week old mice (n ≥ 3 per group) using TRI -
REAGENT (Euromedex, Souffelweyersheim, France) according to the
manufacturer’s instructions, and then used for cDNA microarray and quantitative
PCR.
cDNA microarray. Biological experiments used for expression profiling were
independently performed twice. Hybridization was dye-balanced, in order to reduce
the effects of using two distinct dyes, i.e. Cy3 and Cy5. The quality of total RNA was
controlled on an Agilent Bioanalyzer 2100 as previously described (12). Pangenomic
microarrays were printed using the mouse RNG/MRC oligonucleotide collection
(corresponding to 25,299 distinct probes) as previously described
(http://www.microarray.fr/). Experimental data and associated microarray designs
have been deposited in NBCI Gene. Expression Omnibus (GEO)
(http://www.ncbi.nlm.nih.gov/geo/) under series GSE16613 and GSE16636, and
under platform record GPL1456. All calculations were performed with the
Bioconductor packages (13) limma (14) and topGO (15). Differentially expressed
genes were selected using a Benjamini-Hochberg correction of the p-value for
multiple tests, based on a p-value of 0.05 or below. Additional parameters
corresponded to an average log2(Signal) above 6, a log2(Fold change) above 0.7
(absolute value) in one of the comparisons.
Quantitative PCR. Reverse transcriptase reactions and quantitative RT-PCR assays
were performed as described (16). The expression of selected genes was normalized
to that of 18S ribosomal RNAs and quantified using the comparative-ΔCt method.

8
Oligonucleotide sequences, designed using Primer Express software (PerkinElmer
Life Sciences, Courtaboeuf, France), are available upon request.
Statistical analysis. Data are presented as the mean ± SEM. Measurements were
compared via the two-tailed t-test or Kruskal & Wallis non-parametric rank-sum test.
Body weight curves were compared by ANOVA analysis for repeated measures
using XLstat software, followed by either Bonferroni (for pair wise comparison) or
Dunnet (for comparison to STD) post hoc analysis. Microarray experiments were
analyzed using the limma package from Bioconductor. The scripts used for the
analysis are available in the supplementary data.

9
Results
Body weight and fat mass across generations. As shown in Tables 1 and S1, 4 male
and 4 female C57BL/6J mice from the same litter were mated randomly and pups
were fed, after weaning, a LA-enriched diet termed a ω6 high-fat diet (ω6HFD), which
contained 35% energy as fat with a LA/LNA ratio ∼28 (Supplementary Information:
Materials and Methods). From weaning up to 8 weeks old, the body weight was not
affected by the diet. However, when all the adult male and female HF0 mice
maintained on ω6HFD were mated randomly and produced HF1 pups, the body
weight of the male mice at weaning became significantly higher (10.9 ± 0.2 vs. 9.6 ±
0.6g, p < 0.05; n ≥ 6 for each generation ) than that of HF0 mice; this weight
difference persisted at the adult age. Suckling HF1 pups from both sexes were fed
ω6HFD at weaning and then mated as above. The difference in body weight both at
weaning and at 8 weeks was further increased in HF2 male pups and adults
compared with HF1 mice though no significant weight difference persisted between
HF1 and HF2 mice at the adult age (Supplementary Figure S1-A).
Regarding fat mass, a large difference in the weight of the epididymal fat pad was
already observed across generations at 8 weeks for HF0 to HF2 mice (Figure 1A; n ≥
6 for each generation). This difference became more evident when comparing HF0
and HF2 mice at 14 (Figure 1B) and 22 weeks (Figure 1C), consistent with the
obvious difference in the morphological appearance of STD and HF4 mice at 22
weeks (Figure 1D). Most importantly, the number of pups per litter was not
statistically different: 5.5 ± 0.6, 5.6 ± 0.5, 5.0 ± 0.4, 4.5 ± 0.5, and 4.7 ± 0.4 for
STD/HF0, HF1, HF2, HF3 and HF4 mice, respectively, showing that ω6HFD had no
impact upon reproduction, thus excluding the possibility that the litter size could
explain an indirect effect of the diet across generations by increasing the energy

10
intake of suckling pups. When assessed at 8 weeks, no significant difference in the
caloric intake could be observed between STD, HF0, HF1, HF2 and HF4 mice (n ≥ 5;
Supplementary Table S2). Moreover, when HF4 pups were transferred at weaning to
a chow diet (Table 1), the food intake of revHF4 mice (n=3) remained similar to that
of HF4 and of previous generations. Thus, these results exclude the possibility that
changes in food and fat intake, across generations early and late in life, explain the
transgenerational increase in body weight and fat mass observed at the adult age,
suggesting that other mechanisms are implicated (vide infra). Interestingly, body
weight at birth appeared to decrease across generations but this trend was not
statistically significant (Supplementary Figure S1-B). The major effect of ω6HFD on
body weight of STD/HF0 versus HF3 mice took place between the 2nd and 3rd week,
suggesting a similar differential effect on fat mass, which was not accurately
measurable at this very early age (Supplementary Figure S1-C).
Lipid profile across generations. PUFA metabolism in the mothers’ milk lipids was
altered in response to the linoleic acid-enriched diet but then remained similar across
generations. The ω6HFD altered the PUFA composition of milk lipids of HF0 dams. It
strongly increased the content of LA and to a lesser extent that of ARA
(Supplementary Figure S2-A and B; n=4 for each group). In contrast, it decreased
significantly the content of long-chain polyunsaturated fatty acids (LC-PUFAs) of the
ω3 series, i.e. eicosapentaenoic acid (EPA) and docosahexaenoic acid (DHA), thus
increasing the ARA/DHA and ARA/DHA+EPA ratio from 1.3 to 2.2 and from 1.0 to
1.5, respectively (Supplementary Figure S2-A and C). As for mother’s milk, ω6HFD
induced an increase in the ω6 content (LA and ARA) and a decrease in that of LNA,
EPA and DHA in plasma and adipose tissue lipids at 14 weeks (Fig.2 and
Supplementary Table S3). All these observations are in agreement with human
11
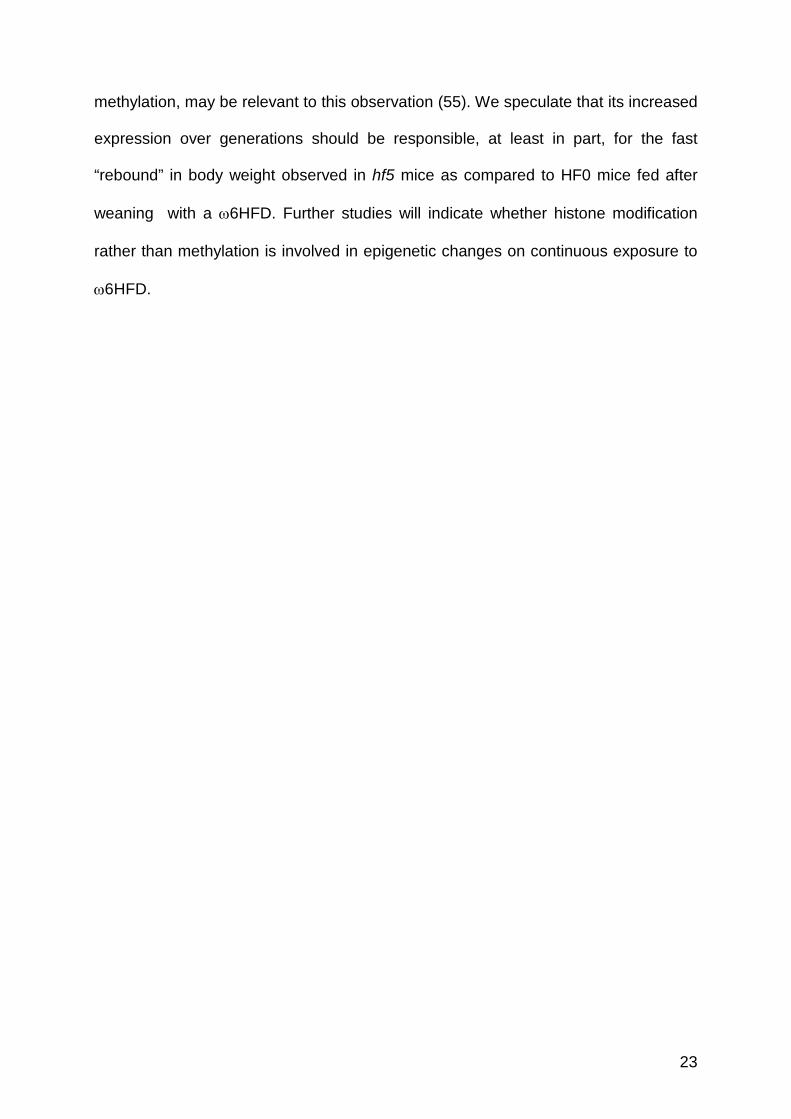
studies showing that an increase in LA intake led to stimulation of ARA and/or
inhibition of EPA and DHA synthesis (17). The PUFA profile was not different
between HF0 and HF4 mice (n=4), showing that no further changes occurred once
STD fed mice had been switched to ω6HFD (Fig.2). Taken together, these results
show that the PUFA profile was altered by the diet fat content and that a steady state
was then observed across generations. As expected, changes in the PUFA content
induced by the ω6HFD were reversed in a single generation of mice fed the chow
diet (rev-HF4; n=3). Palmitoleate (C16:1 ω7) has recently been reported to be an
insulin-sensitizing adipose tissue-derived hormone improving glucose metabolism
(18). Palmitoleate levels were indeed regulated in plasma and adipose tissue with a
2- to 3-fold reduction upon initial ω6HFD exposure, but no further change occurred
across generations (Supplementary Table S3). The decrease in the ω3 long chain-
PUFA (LC-PUFA) status in mice fed ω6HFD had no impact on the DHA
concentration in brain phospholipids (Supplementary Table S3). This excludes an
essential fatty acid deficiency arising across generations, which would have altered
various physiological functions and subsequently affected white adipose tissue
development.
The adipose phenotype can be partially reversed at later generations. To assess
whether further transgenerational effects of ω6HFD could be reversed, HF4 mice
were switched at weaning to the chow diet. In plasma, the percentage of ω6 PUFAs
of revHF4 mice was also similar at 14 weeks old to that of STD mice. The
ARA/EPA+DHA ratio increased more than 2-fold in HF4 mice and reversed
completely in revHF4 mice. A reversible pattern was also observed for the 6 and 3
PUFA composition of adipose tissue lipids (Fig.2 and Supplementary Table S3).
Under these conditions, the body weight of revHF4 mice returned five weeks later to

12
that of HF0 mice (Figure 3A, n ≥ 4). Importantly, a similar but incomplete reversal
was observed for the epididymal fat pad weight (Figure 3B; n ≥ 6). Therefore adult
male and female revHF4 mice were subsequently mated randomly to give birth to the
5th generation of pups (Table 1). When the litters were then fed at weaning either the
chow diet (std5 mice) or ω6HFD (hf5 mice; n = 5 for each group), not only were std5
mice heavier at weaning than STD mice, but a large difference in the rate of weight
gain could be observed in hf5 mice as compared to std5, as early as the first week
after weaning and was maintained afterwards (Figure 3C). It is striking that such a
difference was not observed for HF0 mice for which the body weight was similar to
that of STD mice from weaning until 8 weeks (Supplementary Figure S1-A). The
incomplete reversal of the adipose phenotype at later generations suggested that
some transgenerational memory had been acquired, allowing revHF4 mice to
respond more rapidly than STD mice to ω6HFD. This point was further examined at
the physiological and cellular levels.
Metabolic changes in plasma across generations. Compared to mice fed a chow diet,
those fed for 19 weeks after weaning with ω6HFD exhibited an increase in the
plasma level of most parameters traditionally associated with the metabolic syndrome
i.e. TNFα, resistin, insulin, leptin and MCP-1, in the 1st, 2nd and 3rd generation while
adiponectin and IL6 levels remained rather constant. Surprisingly, this inflammatory
signature was almost reversed at the 4th generation. TNFα, resistin, IL-6, MCP-1 and
leptin levels became dramatically reduced compared with those observed in HF3
mice and became similar to those of STD mice (Figure4; n ≥ 4). Fasting insulin levels
followed a pattern similar to that of cytokines but remained significantly higher than
those of HF0 mice. These observations indicate that, despite the fact that glycemia in

13
HF4 mice appeared normal at 22 weeks old (151 ± 30 for HF4 vs. 170 ± 30 mg/dl for
STD mice), continuous exposure to ω6HFD led to a sustained increase in plasma
insulin levels, which strongly suggests the emergence of insulin resistance of adult
animals at later generations.
Cellularity and cell sub-populations of adipose tissue across generations. Exposing
pups at weaning to ω6HFD led, within seven weeks, to changes in adipose tissue
cellularity (Figure 5; n ≥ 3). HF0 mice exhibited an increase in the percentage of very
small adipocytes (∼20 µm) and a slight increase in that of large adipocytes (40-70
µm). This suggests recruitment of adipocyte precursors from the stromal vascular
compartment (SVF) and a trend toward adipocyte hypertrophy. The percentage of
small adipocytes (20-30 µm) increased in HF1 mice, suggesting further recruitment of
adipocyte precursors. However, in HF3 mice, substantial change in cell hypertrophy
occurred with a shift to large sized adipocytes (50-70 µm) and the emergence of a
population of severely hypertrophied adipocytes (80-100 µm). Cell hypertrophy
became dramatic for HF4 mice in which two additional populations of large size
adipocytes, 50-70 and 70-130 µm, respectively, could be observed. A fairly large
proportion of small adipocytes (20-40 µm) remained detectable in HF4 compared to
HF0 mice, suggesting that adipocyte recruitment was still taking place at the fourth
generation.
When HF4 mice were switched at weaning to a chow diet, the pattern of adipocyte
size distribution of revHF4 mice was dramatically altered after 7 weeks as both
populations of large size adipocytes could no longer be observed.The values for
STD, HF0, HF4 and revHF4 mice were 35.4 +/- 15.4, 35.8 +/-17.9, 48.8 +/- 29.1 and
41 +/- 11.5 µm for the mean adipocyte size whereas the percentage of cells above 50

14
µm diameter was 12%, 20%, 40% and 22%, respectively, suggesting “remnant”
adipocyte hypertrophy.
In order to gain insight into recruitment of adipocyte precursor cells, we analyzed by
qRT-PCR the expression levels of preadipocyte markers. No significant enrichment
was found in the stromal vascular fraction of adipose tissue of HF0 to HF3 mice as
compared to STD mice with respect to Pref-1, PPARβ/δ, C/EBPβ, FAT/CD36 and
aP2/FABP4 (not shown). These results suggest that the hyperplastic growth of fat
tissue implicated progenitor cells were more immature than preadipocytes and able
to replenish the pool of preadipocytes. To characterize progenitor cell populations
that could ultimately contribute to the formation of new adipocytes, a comparative
FACS analysis of stromal vascular cells of epididymal fat tissue was carried out in
STD, HF0, HF1 and HF2 mice (n=8) at 4, 8 and 22 weeks old by using cell surface
specific markers of various cell lineages known to be present in this cell fraction. No
difference could be found in the proportion of Sca1+/CD34+ cells representative of
stem cells and immature progenitors, nor in that of CD45- and CD31- cells
representative of the hematopoietic and endothelial lineages, respectively (not
shown). Clearly, we cannot exclude changes in the proportion of the minor sub-
population of CD34+/Sca1+/CD24+ cells, which have been shown very recently to
behave in vivo as early adipocyte progenitors (19).
Gene expression analysis of stromal vascular cells. Expression profiles of the SVF of
adipose tissue were established for the different generations of mice fed ω6HFD (n ≥
3 per group). Two independent experiments were carried out, and the identified
probes were kept for subsequent analysis. To rule out possible contamination by
adjacent tissues, a preliminary experiment was performed to compare directly the
profile of SVF with those of testis and epidydimis. This led to the identification of a list

15
of 2366 distinct SVF-specific probes, which was subsequently used for further
analysis. We then selected from this list about 108 transcripts divided into 4 groups
(Supplementary Table S4), based on a linear model as proposed by Smyth in the
limma package from Bioconductor (20). Probes were selected based on average
log2(Signal) above 6, a log2(Fold change) above 0.7 (absolute value), and an
adjusted p-value below 0.05 for the following comparisons: HF3 versus HF0 and HF4
versus HF0. This initial analysis identified 46 transcripts (groups 1 and 2) that varied
after 3 or 4 generations fed with ω6HFD. Since we felt that such a criterion was too
restrictive and may not identify genes involved in the partial reversion of the
phenotype (Figs 3 and 5), we also selected additional transcripts for which the
expression differed due to the change in regimen from the chow diet to ω6HFD and
vice versa. The final list was established based on the following comparisons:
(HF0+HF1+HF3+HF4) vs. (STD+revHF1+revHF3+revHF4). Such transcripts were
expected to correspond more precisely to transcripts affected negatively or positively
by the change in regimen (groups 3 and 4).
The four lists of genes that varied along generations or after modification of the
regimen were then inspected using Ingenuity Pathways (http://www.ingenuity.com) to
reveal any significant enrichment of functional networks. These lists of genes were
then further analyzed directly in order to identify transcripts with known functions in
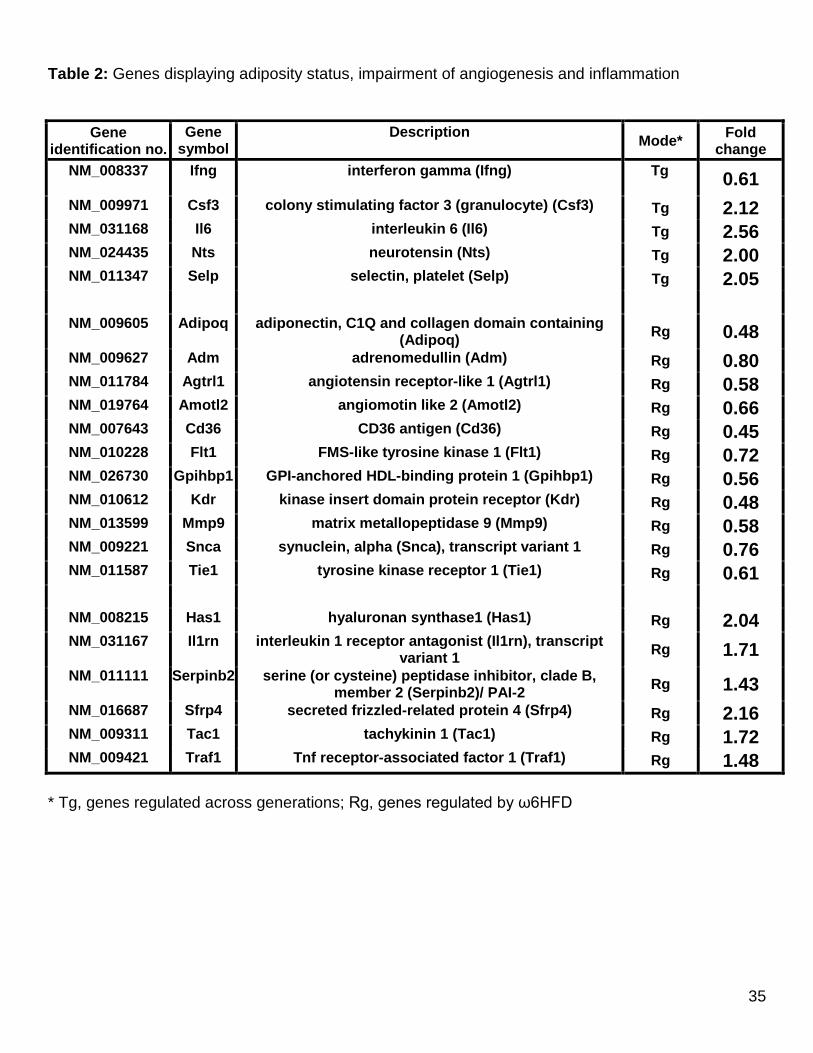
adipocyte biology as discussed below (Table 2). Genes showing a significant
difference but with no published evidence for involvement in adipose biology were
not pursued further at this stage.
Genes regulated across generations. As hyperplasia of adipose tissue took place
over generations, we anticipated a generation-dependent increase in the expression
of growth factors. Colony-stimulating factors (CSFs) are proteins necessary for

16
survival, proliferation and differentiation of hematopoietic progenitors, but the
specificity of these growth factors is rather promiscuous. For instance,
overexpression of CSF-1 (MCSF) in vivo led to a dramatic increase in adipose tissue
growth in rabbits through white adipose tissue (WAT) hyperplasia (21) whereas
invalidation of the CSF-2 (GM-CSF) gene reduces inflammation in adipose tissue of
C57 BL/6J mice in response to HFD (22). Of interest, our data show that expression
of CSF-3 (G-CSF) increased over generations in mice fed ω6HFD (validation by
qRT-PCR, Supplementary Figure S3). These results strongly suggest a role for CSF-
3 in stimulating growth of adipocyte progenitors and in enhancing macrophage
recruitment. Despite the fact that up-regulation of Nocturnin (Ccrn41) did not reach
statistical significance, the phenotype of ω6HFD-fed mice led us to assess its
expression by qRT-PCR. As shown in Supplementary Figure S3 this circadian
deadenylase, the deletion of which confers resistance to diet-induced obesity,
showed increased expression over generations, suggesting a pro-adipogenic role in
fat tissue formation by promoting nuclear transport of PPARγ (23) and personal
communication (CJ Rosen). A striking observation was sustained decreased
expression of interferon γ (Ifng) over generations, suggesting that ω6HFD altered
the number of interferon γ-producing T cells, which should in turn decrease the
expression of inflammatory genes (24). However, up-regulation of other genes
favoring recruitment of neutrophils and monocytes was noted. Expression of the P-
selectin (Selp) gene, reported to be up-regulated in HFD-induced obese mice,
increased with generations, suggesting local platelet activation and formation of
monocyte-platelet conjugates. These cell-cell interactions could then contribute to
local inflammatory processes (25). The tendency toward additional proinflammatory
pathways was also suggested by enhanced expression over generations of

17
neurotensin (Nts), which is known to participate in the activation of the NF-КB
signaling pathway. Although its expression is increased over generations, the
contribution of Interleukin 6 (Il-6) secreted from stromal vascular cells should be low
compared to that of adipocytes then recovered in blood (Figure 4), but its local
involvement in developing insulin resistance cannot be excluded.
Genes regulated by regimen Among the genes affected by the diet, genes encoding
the VEGF receptor-1 (Flt1) and angiopoetin-1 receptor (Tie1), the expression of
which is mainly present in the SVF of adipose tissue, were down-regulated. Both
receptors bind ligands that are known to promote angiogenesis during excessive
WAT development in different strains of mice fed a HFD (26, 27). The VEGF
receptor-2 (KDR) gene, encoding an early marker of endothelial cell differentiation,
was also decreased (28). Interestingly the APJ receptor (Agtrl1), which is part of the
apelin/APJ-R signaling system that plays a critical role in the development of a
functional network in WAT (29), is equally decreased in ω6HFD fed mice. Last but
not least, expression of adiponectin (Adipoq), which has been reported to promote
proliferation and function of endothelial cells (30), was also decreased. Unexpectedly,
the glycosylphosphatidylinositol-anchored high-density lipoprotein-binding
protein 1 (Gpihbp1), a gene highly expressed in WAT and involved in the lipolytic
processing of chylomicrons, appeared down-regulated by the regimen (31). In all
these cases, the variation was equivalent between HF0 and HF3 or HF4, indicating
that these modifications were caused by the regimen. Collectively, these data
strongly suggest that hypoxia should prevail under such conditions.
In accordance with these observations, which favor the possibility that decreased
gene expression on ω6HFD may impair angiogenesis, the genes encoding
angiomotin-like 2 (Amolt2), which is assumed to regulate, like angiomotin, the

18
migration of endothelial cells (32) and adrenomedullin (Adm), a potent vasodilator
and antioxidative peptide, were down-regulated (33). In addition to adrenomedullin,
down-regulation of the α-synuclein (Snca) and CD36 genes, which may prevent
excessive ROS production (34, 35), was observed. The modulation of extracellular
matrix components via the production of metalloproteinases is an important regulator
of fat tissue remodeling. The metalloproteinase 9 (Mmp-9) gene, known to be
expressed at higher levels in preadipocytes than in adipocytes, decreased over
generations in accordance with its down-regulation in nutritionally-induced obesity of
C57BL/6J mice (36).
As expected, chronic exposure to ω6HFD led to up-regulation of genes implicated in
the hyperplastic/hypertrophic development of adipose tissue. The glycosaminoglycan
hyaluronan is an essential component of the extracellular matrix that increases
adhesion and retention of monocytes in adipose tissue in diet-induced obese C57
BL/6J mice (37). Accordingly, the expression of hyaluronan synthase 1 (Has1),
known to be present in adipocytes and preadipocytes, increased with ω6HFD. Of
note, the increased expression of the precursor Tachykinin 1 (Tac1) suggests
enhanced production of substance P, which has been reported to promote
proliferation of preadipocytes (38). Regarding adipocyte hypertrophy, the
overexpression of PAI-2 (Serpinb2) over generations is consistent with the fact that
PAI-2-/- mice fed a HFD exhibit a lower adipocyte size and higher adipocyte number
than wild-type mice (39), and suggest that PAI-2 overexpression promotes excessive
WAT development. Reports have implicated Wnt signaling pathway components as
proteins that maintain the preadipocyte compartment and inhibit adipogenesis.
Interestingly, the gene expression of secreted frizzled-related protein 4 (sFRP4)
became elevated with ω6HFD (validation by qRT-PCR, Supplementary Figure S3).

19
As sFRP4 antagonizes the Wnt signaling pathway (40), this strongly suggests a
stimulating effect on WAT development. Adrenomedullin, the expression of which
decreased over generations (vide supra), has been proposed to be antiadipogenic
(41). If it were so in vivo, this will also favor adipogenesis. With respect to the
emergence of insulin resistance, up-regulation of Interleukin-1 receptor antagonist
(Il1rn) and TNFα receptor-associated factor 1 (Traf1) with a regimen appears to be
important since the respective blockade of Il-1 and TNFα signaling pathways
improved insulin sensitivity in diet-induced obesity (42, 43).
Discussion
We and others have pointed out the detrimental effects in humans caused by a
dramatic change in the fatty acid composition of dietary fats at a time when
quantitative changes in fat consumption were not observed. Notably, at a time where
overweight and obesity have steadily increased over generations in most
industrialized countries, consumption of LA and ARA has increased. In France an
increase of 250 and 230 %, respectively, occurred from 1960 to 2000 (9). During the
same period, consumption of LNA has decreased by 40%, resulting in a 4.2-fold
increase in the LA/LNA ratio. A similar increase in LA intake has been observed in
other countries of the Western world with a LA/LNA ratio ranging from 10 to 41 for
most foods consumed in the USA (44). Under isolipidic, isoenergetic conditions, an
LA-enriched diet was shown in elderly humans to increase body weight, and the rate
of LA accumulation in adipose tissue was associated positively with gain in body
weight and presumably in fat mass (45). In our experiments, LA represented 18%
and LNA 0.6% of the total energy intake, as compared to respectively 5-7% and 0.8-
1% recommended for humans by expert committees on nutrition. Unfortunately, a

20
significant higher LA intake and much lower LNA intake are frequently observed in
most industrialized countries (3, 9). Our results show that, in a situation of genome
stability which is reminiscent of the augmentation in the prevalence of obesity
observed world-wide, a gradual transgenerational increase in adiposity can occur in
mice fed a Western-like fat diet.
So far, studies have been mainly focused on the relationships between diet-induced
obesity in female rodents and the development of adult offspring adiposity and
associated diseases (46, 47). Herein we chose purposely ad libitum conditions to: i)
expose both male and female mice across several generations to a Western-like diet,
i.e. 35% energy as fat, whereas in most studies of diet-induced obesity in rodents
these figures ranged from 30% to 80% energy as fat and, ii) use at random breeding
of all pups from the same litter, thus excluding, in contrast to a recent report (48), any
selection of high- and low-body fat gainers, which would have put emphasis on
genetic issues and would have been less relevant to humans.
The results show clearly, under conditions minimizing an imbalance between fetal
and postnatal environment, a transgenerational increase in body weight and fat mass
that was already apparent in pups at weaning and was maintained in adulthood. With
respect to adipose tissue development, at any given generation, triggering events
associated with the diet can be postulated as it is known that in utero placenta
selectively extracts ARA and DHA from maternal blood. It is thus conceivable that the
ω6HFD will not increase LA levels in fetal blood but will rather increase ARA levels in
the maternal and subsequently in the fetal blood (49). After birth, according to our
data on the fatty acid composition of milk, adipose tissue and plasma lipids, we
assumed a similar contribution of LA in enhancing adipose tissue development owing

21
to the adipogenic role played by its metabolite ARA via prostacyclin at the time
where the content of the anti-adipogenic EPA and DHA decreased (4, 7).
Noteworthy, enhanced adiposity occurs over generations through hyperplasia and
hypertrophy despite no significant change in food intake in pups and adult mice.
Clearly, a progressive decrease in energy expenditure cannot be excluded though
the resistance of C57BL/6J mice to diet-induced thermogenesis has been reported
(8). Actually, we observed a trend -not statistically significant- toward higher
expression of UCP1 in brown adipose tissue, suggesting an increase in energy
expenditure over generations. It cannot be excluded that an increase of
subcutaneous adiposity contributes to decreased thermogenicity over generations as
heat loss is known to increase basal thermogenesis and resistance to diet-induced
obesity (50). Regarding the transgenerational hyperplasia of adipose tissue, it may
be due to the increased expression of CSF3 gene across generations that enhanced
the proliferation of adipose progenitors. In addition, we suggest that enhanced
Nocturnin expression across generations modulate hypertrophy and associated
metabolic events through subtle alterations in glucose homeostasis and lipid-
partitioning between various organs including adipose tissue as HF4 mice appear to
be a striking mirror image of Nocturnin-null mice fed a HFD. Indeed, compared to
wild-type mice, Nocturnin-null mice exhibited similar locomotor activity but an
abnormality in weight regulation despite equivalent caloric intake and less heat
production. Importantly, these K.O. mice also showed improved insulin sensitivity, i.e.
similar glucose and lower insulin levels (23).
We observed also impairment in the expression of genes promoting angiogenesis,
suggesting increased hypoxic and even highly hypoxic conditions in adipocytes
distant from the vasculature, which lead in turn to alterations in adipokine secretion
by on June 4, 2010 w
ww
.jlr.orgD
ownloaded from

22
(51) and insulin sensitivity (52). Surprisingly, after a rise in TNF-α, resistin, leptin and
MPC-1 in the first generation, normalization of circulating levels of adipokines
occurred in HF4 mice when compared to STD mice. Despite fat tissue expansion
across generations, leptin levels returned to normal. This suggests that hypothalamic
leptin sensitivity had somehow been redefined through transgenerational exposure to
ω6HFD. Moreover the decreased levels of inflammatory adipokines could also be
regarded as adaptive evolution of the autonomic nervous system output. The most
persistent dysregulation was that of insulin. In the absence of hyperglycemia, this
strongly suggests insulin-resistance, which is consistent with a progressive loss in
sympathetic inhibition of insulin release over generations. Thus it looks as if an
enhanced fat mass was an adaptive response to prevent aggravation of a metabolic
syndrome. Collectively, our data show that continuous exposure to a high-fat diet
combined with a high LA/LNA ratio from fetal to adult age over generations triggers a
discrete and steady increase in inflammatory stimuli that are accompanied by
enhancement of fat mass that was already observed a few weeks after birth. Most
interestingly, in humans, the recent Framingham heart study pointed out that non-
obese offspring with two obese parents had higher C-reactive protein levels
compared with offspring with one or no parent with obesity. Thus offspring with a high
risk of developing obesity are characterized at birth by a pro-inflammatory state (53).
Our results on the incomplete reversal of adipocyte hypertrophy suggest epigenetic
changes. To our knowledge there is no direct evidence that fatty acid nutrition affects
epigenetic gene regulation and that epigenetic mechanisms determining
overweight/obesity in an obesogenic environment have any relationship with those
observed in malnourished fetuses (54). Among candidate genes only sFRP4, a
member of the Wnt signaling pathway, known to exhibit epigenetic regulation through
23
methylation, may be relevant to this observation (55). We speculate that its increased
expression over generations should be responsible, at least in part, for the fast
“rebound” in body weight observed in hf5 mice as compared to HF0 mice fed after
weaning with a ω6HFD. Further studies will indicate whether histone modification
rather than methylation is involved in epigenetic changes on continuous exposure to
ω6HFD.

24
Acknowledgements
This work was supported by the Agence Nationale pour la Recherche (Contract
LIPADIP n° ANR-05-PNRA-007 to GA). FM was supported by a prize from the
“Institut Danone”. The authors wish to thank Drs. N. Combe and C. Vaysse
(Université de Bordeaux, ITERG, Département de Nutrition) for performing analysis
of the fatty acid composition of plasma and adipose tissue lipids. The authors wish to
thank Dr. C. Dani (IBDC, CNRS, UMR 6543) for his continuous support and helpful
discussion. The authors are grateful to the skilled assistance of Virginie Virolle for
performing initial microarray experiments. We are grateful for the skilled technical
assistance of Mansour Djedaini and the skilful secretarial assistance of Geneviève
Oillaux. We are grateful to the Nice-Sophia Antipolis Transcriptome Platform of the
Marseille-Nice Genopole where the microarray experiments were performed. We
thank Dr. Christiane Brahimi-Horn (http://cbrahimihorn.free.fr) for editorial correction
of the manuscript.
by on June 4, 2010 w
ww
.jlr.orgD
ownloaded from

25
References: 1. Troiano, R. P., R. R. Briefel, M. D. Carroll, and K. Bialostosky. 2000. Energy
and fat intakes of children and adolescents in the united states: data from the
national health and nutrition examination surveys. Am J Clin Nutr 72: 1343S-1353S.
2. Donahoo, W., H. R. Wyatt, J. Kriehn, J. Stuht, F. Dong, P. Hosokawa, G. K.
Grunwald, S. L. Johnson, J. C. Peters, and J. O. Hill. 2008. Dietary fat increases
energy intake across the range of typical consumption in the United States. Obesity
(Silver Spring) 16: 64-69.
3. Ailhaud, G., P. Guesnet, and S. C. Cunnane. 2008. An emerging risk factor for
obesity: does disequilibrium of polyunsaturated fatty acid metabolism contribute to
excessive adipose tissue development? Br J Nutr 100: 461-470.
4. Massiera, F., P. Saint-Marc, J. Seydoux, T. Murata, T. Kobayashi, S.
Narumiya, P. Guesnet, E. Z. Amri, R. Negrel, and G. Ailhaud. 2003. Arachidonic acid
and prostacyclin signaling promote adipose tissue development: a human health
concern? J Lipid Res 44: 271-279.
5. Gaillard, D., R. Negrel, M. Lagarde, and G. Ailhaud. 1989. Requirement and
role of arachidonic acid in the differentiation of pre-adipose cells. Biochem J 257:
389-397.
6. Vassaux, G., D. Gaillard, G. Ailhaud, and R. Negrel. 1992. Prostacyclin is a
specific effector of adipose cell differentiation. Its dual role as a cAMP- and Ca(2+)-
elevating agent. J Biol Chem 267: 11092-11097.
7. Kim, H. K., M. Della-Fera, J. Lin, and C. A. Baile. 2006. Docosahexaenoic acid
inhibits adipocyte differentiation and induces apoptosis in 3T3-L1 preadipocytes. J
Nutr 136: 2965-2969.
by on June 4, 2010 w
ww
.jlr.orgD
ownloaded from

26
8. Madsen, L., L. M. Pedersen, B. Liaset, T. Ma, R. K. Petersen, S. van den
Berg, J. Pan, K. Muller-Decker, E. D. Dulsner, R. Kleemann, T. Kooistra, S. O.
Doskeland, and K. Kristiansen. 2008. cAMP-dependent signaling regulates the
adipogenic effect of n-6 polyunsaturated fatty acids. J Biol Chem 283: 7196-7205.
9. Ailhaud, G., F. Massiera, P. Weill, P. Legrand, J. M. Alessandri, and P.
Guesnet. 2006. Temporal changes in dietary fats: role of n-6 polyunsaturated fatty
acids in excessive adipose tissue development and relationship to obesity. Prog Lipid
Res 45: 203-236.
10. Massiera, F., J. Seydoux, A. Geloen, A. Quignard-Boulange, S. Turban, P.
Saint-Marc, A. Fukamizu, R. Negrel, G. Ailhaud, and M. Teboul. 2001.
Angiotensinogen-deficient mice exhibit impairment of diet-induced weight gain with
alteration in adipose tissue development and increased locomotor activity.
Endocrinology 142: 5220-5225.
11. Lepage, G., and C. C. Roy. 1988. Specific methylation of plasma nonesterified
fatty acids in a one-step reaction. J Lipid Res 29: 227-235.
12. Moreilhon, C., D. Gras, C. Hologne, O. Bajolet, F. Cottrez, V. Magnone, M.
Merten, H. Groux, E. Puchelle, and P. Barbry. 2005. Live Staphylococcus aureus and
bacterial soluble factors induce different transcriptional responses in human airway
cells. Physiol Genomics 20: 244-255.
13. Gentleman, R. C., V. J. Carey, D. M. Bates, B. Bolstad, M. Dettling, S. Dudoit,
B. Ellis, L. Gautier, Y. Ge, J. Gentry, K. Hornik, T. Hothorn, W. Huber, S. Iacus, R.
Irizarry, F. Leisch, C. Li, M. Maechler, A. J. Rossini, G. Sawitzki, C. Smith, G. Smyth,
L. Tierney, J. Y. Yang, and J. Zhang. 2004. Bioconductor: open software
development for computational biology and bioinformatics. Genome Biol 5: R80.
by on June 4, 2010 w
ww
.jlr.orgD
ownloaded from

27
14. Wettenhall, J. M., and G. K. Smyth. 2004. limmaGUI: a graphical user
interface for linear modeling of microarray data. Bioinformatics 20: 3705-3706.
15. Alexa, A., J. Rahnenfuhrer, and T. Lengauer. 2006. Improved scoring of
functional groups from gene expression data by decorrelating GO graph structure.
Bioinformatics 22: 1600-1607.
16. Zaragosi, L. E., G. Ailhaud, and C. Dani. 2006. Autocrine fibroblast growth
factor 2 signaling is critical for self-renewal of human multipotent adipose-derived
stem cells. Stem Cells 24: 2412-2419.
17. Guesnet, P., P. Pugo-Gunsam, C. Maurage, M. Pinault, B. Giraudeau, J. M.
Alessandri, G. Durand, J. M. Antoine, and C. Couet. 1999. Blood lipid concentrations
of docosahexaenoic and arachidonic acids at birth determine their relative postnatal
changes in term infants fed breast milk or formula. Am J Clin Nutr 70: 292-298.
18. Cao, H., K. Gerhold, J. R. Mayers, M. M. Wiest, S. M. Watkins, and G. S.
Hotamisligil. 2008. Identification of a lipokine, a lipid hormone linking adipose tissue
to systemic metabolism. Cell 134: 933-944.
19. Rodeheffer, M. S., K. Birsoy, and J. M. Friedman. 2008. Identification of white
adipocyte progenitor cells in vivo. Cell 135: 240-249.
20. Smyth, G. K. 2004. Linear models and empirical bayes methods for assessing
differential expression in microarray experiments. Stat Appl Genet Mol Biol 3:
Article3.
21. Levine, J. A., M. D. Jensen, N. L. Eberhardt, and T. O'Brien. 1998. Adipocyte
macrophage colony-stimulating factor is a mediator of adipose tissue growth. J Clin
Invest 101: 1557-1564.
by on June 4, 2010 w
ww
.jlr.orgD
ownloaded from

28
22. Kim, D. H., D. Sandoval, J. A. Reed, E. K. Matter, E. G. Tolod, S. C. Woods,
and R. J. Seeley. 2008. The role of GM-CSF in adipose tissue inflammation. Am J
Physiol Endocrinol Metab 295: E1038-1046.
23. Green, C. B., N. Douris, S. Kojima, C. A. Strayer, J. Fogerty, D. Lourim, S. R.
Keller, and J. C. Besharse. 2007. Loss of Nocturnin, a circadian deadenylase,
confers resistance to hepatic steatosis and diet-induced obesity. Proc Natl Acad Sci
U S A 104: 9888-9893.
24. Rocha, V. Z., E. J. Folco, G. Sukhova, K. Shimizu, I. Gotsman, A. H. Vernon,
and P. Libby. 2008. Interferon-gamma, a Th1 cytokine, regulates fat inflammation: a
role for adaptive immunity in obesity. Circ Res 103: 467-476.
25. Nishimura, S., I. Manabe, M. Nagasaki, K. Seo, H. Yamashita, Y. Hosoya, M.
Ohsugi, K. Tobe, T. Kadowaki, R. Nagai, and S. Sugiura. 2008. In vivo imaging in
mice reveals local cell dynamics and inflammation in obese adipose tissue. J Clin
Invest 118: 710-721.
26. Dallabrida, S. M., D. Zurakowski, S. C. Shih, L. E. Smith, J. Folkman, K. S.
Moulton, and M. A. Rupnick. 2003. Adipose tissue growth and regression are
regulated by angiopoietin-1. Biochem Biophys Res Commun 311: 563-571.
27. Voros, G., E. Maquoi, D. Demeulemeester, N. Clerx, D. Collen, and H. R.
Lijnen. 2005. Modulation of angiogenesis during adipose tissue development in
murine models of obesity. Endocrinology 146: 4545-4554.
28. Madonna, R., and R. De Caterina. 2008. In vitro neovasculogenic potential of
resident adipose tissue precursors. Am J Physiol Cell Physiol 295: C1271-1280.
29. Kunduzova, O., N. Alet, N. Delesque-Touchard, L. Millet, I. Castan-Laurell, C.
Muller, C. Dray, P. Schaeffer, J. P. Herault, P. Savi, F. Bono, and P. Valet. 2008.
by on June 4, 2010 w
ww
.jlr.orgD
ownloaded from

29
Apelin/APJ signaling system: a potential link between adipose tissue and endothelial
angiogenic processes. Faseb J 22: 4146-4153.
30. Shibata, R., C. Skurk, N. Ouchi, G. Galasso, K. Kondo, T. Ohashi, M.
Shimano, S. Kihara, T. Murohara, and K. Walsh. 2008. Adiponectin promotes
endothelial progenitor cell number and function. FEBS Lett 582: 1607-1612.
31. Beigneux, A. P., B. S. Davies, P. Gin, M. M. Weinstein, E. Farber, X. Qiao, F.
Peale, S. Bunting, R. L. Walzem, J. S. Wong, W. S. Blaner, Z. M. Ding, K. Melford, N.
Wongsiriroj, X. Shu, F. de Sauvage, R. O. Ryan, L. G. Fong, A. Bensadoun, and S.
G. Young. 2007. Glycosylphosphatidylinositol-anchored high-density lipoprotein-
binding protein 1 plays a critical role in the lipolytic processing of chylomicrons. Cell
Metab 5: 279-291.
32. Aase, K., M. Ernkvist, L. Ebarasi, L. Jakobsson, A. Majumdar, C. Yi, O. Birot,
Y. Ming, A. Kvanta, D. Edholm, P. Aspenstrom, J. Kissil, L. Claesson-Welsh, A.
Shimono, and L. Holmgren. 2007. Angiomotin regulates endothelial cell migration
during embryonic angiogenesis. Genes Dev 21: 2055-2068.
33. Nambu, T., H. Arai, Y. Komatsu, A. Yasoda, K. Moriyama, N. Kanamoto, H.
Itoh, and K. Nakao. 2005. Expression of the adrenomedullin gene in adipose tissue.
Regul Pept 132: 17-22.
34. Klivenyi, P., D. Siwek, G. Gardian, L. Yang, A. Starkov, C. Cleren, R. J.
Ferrante, N. W. Kowall, A. Abeliovich, and M. F. Beal. 2006. Mice lacking alpha-
synuclein are resistant to mitochondrial toxins. Neurobiol Dis 21: 541-548.
35. Okamura, D. M., S. Pennathur, K. Pasichnyk, J. M. Lopez-Guisa, S. Collins,
M. Febbraio, J. Heinecke, and A. A. Eddy. 2009. CD36 regulates oxidative stress and
inflammation in hypercholesterolemic CKD. J Am Soc Nephrol 20: 495-505.
by on June 4, 2010 w
ww
.jlr.orgD
ownloaded from

30
36. Maquoi, E., C. Munaut, A. Colige, D. Collen, and H. R. Lijnen. 2002.
Modulation of adipose tissue expression of murine matrix metalloproteinases and
their tissue inhibitors with obesity. Diabetes 51: 1093-1101.
37. Han, C. Y., S. Subramanian, C. K. Chan, M. Omer, T. Chiba, T. N. Wight, and
A. Chait. 2007. Adipocyte-derived serum amyloid A3 and hyaluronan play a role in
monocyte recruitment and adhesion. Diabetes 56: 2260-2273.
38. Gross, K., I. Karagiannides, T. Thomou, H. W. Koon, C. Bowe, H. Kim, N.
Giorgadze, T. Tchkonia, T. Pirtskhalava, J. L. Kirkland, and C. Pothoulakis. 2009.
Substance P promotes expansion of human mesenteric preadipocytes through
proliferative and antiapoptotic pathways. Am J Physiol Gastrointest Liver Physiol 296:
G1012-1019.
39. Lijnen, H. R., L. Frederix, and I. Scroyen. 2007. Deficiency of plasminogen
activator inhibitor-2 impairs nutritionally induced murine adipose tissue development.
J Thromb Haemost 5: 2259-2265.
40. Christodoulides, C., C. Lagathu, J. K. Sethi, and A. Vidal-Puig. 2009.
Adipogenesis and WNT signalling. Trends Endocrinol Metab 20: 16-24.
41. Harmancey, R., J. M. Senard, P. Rouet, A. Pathak, and F. Smih. 2007.
Adrenomedullin inhibits adipogenesis under transcriptional control of insulin.
Diabetes 56: 553-563.
42. Somm, E., P. Cettour-Rose, C. Asensio, A. Charollais, M. Klein, C. Theander-
Carrillo, C. E. Juge-Aubry, J. M. Dayer, M. J. Nicklin, P. Meda, F. Rohner-
Jeanrenaud, and C. A. Meier. 2006. Interleukin-1 receptor antagonist is upregulated
during diet-induced obesity and regulates insulin sensitivity in rodents. Diabetologia
49: 387-393.
by on June 4, 2010 w
ww
.jlr.orgD
ownloaded from

31
43. Liang, H., B. Yin, H. Zhang, S. Zhang, Q. Zeng, J. Wang, X. Jiang, L. Yuan, C.
Y. Wang, and Z. Li. 2008. Blockade of tumor necrosis factor (TNF) receptor type 1-
mediated TNF-alpha signaling protected Wistar rats from diet-induced obesity and
insulin resistance. Endocrinology 149: 2943-2951.
44. Taber, L., C. H. Chiu, and J. Whelan. 1998. Assessment of the arachidonic
acid content in foods commonly consumed in the American diet. Lipids 33: 1151-
1157.
45. Dayton, S., S. Hashimoto, W. Dixon, and M. L. Pearce. 1966. Composition of
lipids in human serum and adipose tissue during prolonged feeding of a diet high in
unsaturated fat. J Lipid Res 7: 103-111.
46. Cottrell, E. C., and S. E. Ozanne. 2008. Early life programming of obesity and
metabolic disease. Physiol Behav 94: 17-28.
47. Samuelsson, A. M., P. A. Matthews, M. Argenton, M. R. Christie, J. M.
McConnell, E. H. Jansen, A. H. Piersma, S. E. Ozanne, D. F. Twinn, C. Remacle, A.
Rowlerson, L. Poston, and P. D. Taylor. 2008. Diet-induced obesity in female mice
leads to offspring hyperphagia, adiposity, hypertension, and insulin resistance: a
novel murine model of developmental programming. Hypertension 51: 383-392.
48. Koza, R. A., L. Nikonova, J. Hogan, J. S. Rim, T. Mendoza, C. Faulk, J. Skaf,
and L. P. Kozak. 2006. Changes in gene expression foreshadow diet-induced obesity
in genetically identical mice. PLoS Genet 2: e81.
49. Ghebremeskel, K., M. A. Crawford, C. Lowy, Y. Min, B. Thomas, I. Golfetto, D.
Bitsanis, and K. Costeloe. 2000. Arachidonic and docosahexaenoic acids are
strongly associated in maternal and neonatal blood. Eur J Clin Nutr 54: 50-56.
50. Sampath, H., M. T. Flowers, X. Liu, C. M. Paton, R. Sullivan, K. Chu, M. Zhao,
and J. M. Ntambi. 2009. Skin-specific deletion of stearoyl-CoA desaturase-1 alters
by on June 4, 2010 w
ww
.jlr.orgD
ownloaded from

32
skin lipid composition and protects mice from high fat diet-induced obesity. J Biol
Chem 284: 19961-19973.
51. Trayhurn, P., B. Wang, and I. S. Wood. 2008. Hypoxia in adipose tissue: a
basis for the dysregulation of tissue function in obesity? Br J Nutr 100: 227-235.
52. Regazzetti, C., P. Peraldi, T. Gremeaux, R. Najem-Lendom, I. Ben-Sahra, M.
Cormont, F. Bost, Y. Le Marchand-Brustel, J. F. Tanti, and S. Giorgetti-Peraldi. 2009.
Hypoxia decreases insulin signaling pathways in adipocytes. Diabetes 58: 95-103.
53. Lieb, W., M. J. Pencina, K. J. Lanier, G. H. Tofler, D. Levy, C. S. Fox, T. J.
Wang, R. B. D'Agostino, Sr., and R. S. Vasan. 2009. Association of parental obesity
with concentrations of select systemic biomarkers in nonobese offspring: the
Framingham Heart Study. Diabetes 58: 134-137.
54. Jimenez-Chillaron, J. C., E. Isganaitis, M. Charalambous, S. Gesta, T.
Pentinat-Pelegrin, R. R. Faucette, J. P. Otis, A. Chow, R. Diaz, A. Ferguson-Smith,
and M. E. Patti. 2009. Intergenerational transmission of glucose intolerance and
obesity by in utero undernutrition in mice. Diabetes 58: 460-468.
55. Dhir, M., E. A. Montgomery, S. C. Glockner, K. E. Schuebel, C. M. Hooker, J.
G. Herman, S. B. Baylin, S. L. Gearhart, and N. Ahuja. 2008. Epigenetic regulation of
WNT signaling pathway genes in inflammatory bowel disease (IBD) associated
neoplasia. J Gastrointest Surg 12: 1745-1753.
by on June 4, 2010 w
ww
.jlr.orgD
ownloaded from

33
Figure and Table legends
Figure 1: (A-C) Epididymal fat mass as a function of age. Data are means ± SEM. *,
p < 0.05 vs. STD; **, p < 0.01 vs. HF0; n>6 for each generation. (D) Morphology of
representative male STD after 4 generations and HF4 mice at 22 weeks old.
Figure 2: ARA and DHA content of plasma and adipose tissue lipids across
generations (see Table S3 for details). * significant difference vs STD at p < 0.05; ¤
no significant difference vs HF0.
Figure 3: Reversion of the adipose phenotype. Body (A) and fat pad weight (B) at 8
weeks old. Data are means ± SEM. *, p < 0.05 vs. STD; **, p < 0.01 vs. HF0.
Differential response of std5 and hf5 weaned pups in response to ω6HFD (C). For
each generation, n ≥ 4, (A), n ≥ 6 (B) and n=5 (C). Data are means ± SEM. * p < 0.05
for hf5 vs. std5/HF0
Figure 4: Changes in insulin and adipokine circulating levels across generations at
22 weeks. Values are means ± SEM. *, p < 0.05 vs. STD; **, p <0.01 vs. STD; ¤, p <
0.05 vs. HF0; ¤¤, p < 0.05 vs. HF1; ¤¤¤, p < 0.05 vs. HF3 (n ≥ 4).
Figure 5: Adipocyte size distribution across generations. The frequency of
distribution was analyzed using the adipocyte fraction of pooled fat pads from at least
3 mice at 10 weeks old as described in the Materials and Methods section.

34
Table 1: Experimental protocol to obtain generations of chow diet (STD) and ω6HFD fed mice
STD HF0 HF1 HF2 HF3 HF4 revHF1 revHF3 revHF4 hf5 std5
Number of generations on a ω6HFD 0 0 1 2 3 4 1 3 4 4 4
Diet of parents before and during breeding,
pregnancy and lactation Chow Chow HFD HFD HFD HFD HFD HFD HFD Chow Chow
Diet after weaning Chow HFD HFD HFD HFD HFD Chow Chow Chow HFD Chow
35
Table 2: Genes displaying adiposity status, impairment of angiogenesis and inflammation
Gene
identification no. Gene
symbol Description Mode* Fold
change NM_008337 Ifng interferon gamma (Ifng) Tg 0.61 NM_009971 Csf3 colony stimulating factor 3 (granulocyte) (Csf3) Tg 2.12 NM_031168 Il6 interleukin 6 (Il6) Tg 2.56 NM_024435 Nts neurotensin (Nts) Tg 2.00 NM_011347 Selp selectin, platelet (Selp) Tg 2.05
NM_009605 Adipoq adiponectin, C1Q and collagen domain containing
(Adipoq) Rg 0.48 NM_009627 Adm adrenomedullin (Adm) Rg 0.80 NM_011784 Agtrl1 angiotensin receptor-like 1 (Agtrl1) Rg 0.58 NM_019764 Amotl2 angiomotin like 2 (Amotl2) Rg 0.66 NM_007643 Cd36 CD36 antigen (Cd36) Rg 0.45 NM_010228 Flt1 FMS-like tyrosine kinase 1 (Flt1) Rg 0.72 NM_026730 Gpihbp1 GPI-anchored HDL-binding protein 1 (Gpihbp1) Rg 0.56 NM_010612 Kdr kinase insert domain protein receptor (Kdr) Rg 0.48 NM_013599 Mmp9 matrix metallopeptidase 9 (Mmp9) Rg 0.58 NM_009221 Snca synuclein, alpha (Snca), transcript variant 1 Rg 0.76 NM_011587 Tie1 tyrosine kinase receptor 1 (Tie1) Rg 0.61
NM_008215 Has1 hyaluronan synthase1 (Has1) Rg 2.04 NM_031167 Il1rn interleukin 1 receptor antagonist (Il1rn), transcript
variant 1 Rg 1.71 NM_011111 Serpinb2 serine (or cysteine) peptidase inhibitor, clade B,
member 2 (Serpinb2)/ PAI-2 Rg 1.43 NM_016687 Sfrp4 secreted frizzled-related protein 4 (Sfrp4) Rg 2.16 NM_009311 Tac1 tachykinin 1 (Tac1) Rg 1.72 NM_009421 Traf1 Tnf receptor-associated factor 1 (Traf1) Rg 1.48
* Tg, genes regulated across generations; Rg, genes regulated by ω6HFD

8w
eeks
BA
*
Figu
re 1
14 w
eeks
400
600
200
300
8 w
eeks
ht (mg)
ht (mg)
** **
* **
*
* **
200
400
100
200
d weigh
weigh
*
00
100
Fat pad
STD
HF0
HF1
HF2
Fat pad
STD
HF0
HF2
22 w
eeks
C
1200
D
F
STD
HF0
HF1
HF2
F
STD
HF0
HF2
g)
Cho
wH
F4* **
800
1200
eight (m
*40
0
pad we
0
Fat p
STD
HF2
HF0
by on June 4, 2010 w
ww
.jlr.orgD
ownloaded from

Figu
re 2
Plas
ma
Adi
pose
Tis
sue
*¤
141618
06
0.7
0.8
acids
*
**
81012
0.4
0.5
0.6
fatty a
*¤ *
*
468
0.2
0.3
f total f
**
*¤¤
**
**
02
0
0.1
% of
AR
AD
HA
AR
AD
HA
by on June 4, 2010 w
ww
.jlr.orgD
ownloaded from

Figu
re 3
AST
DH
F0H
F4re
vHF4
BC
2530A
HF0
revH
F4
400
500
B* **
* **2025
Std5
*H
f5 **
STD
HF0
*
C
2030
0
t (g)
ht (mg)
**
1520H
F0
ght (g)
1015
100
200
y weight
ad weig* **
1015
Body wei
510
80
100
STD
HF0
HF4
rev
Bod
3
Fat pa
53
45
6
B
Age
(wee
ks)
8ST
DH
F0H
F4re
vH
F43
34
56
Age
(wee
ks)
by on June 4, 2010 w
ww
.jlr.orgD
ownloaded from

Figu
re 4 50
0** ¤
metersandard)
400
500
STD
(n=7
)H
F0 (n
=5)
HF1
(n=4
)H
F3 (n
=8)
** ¤ *
** ¤**
ma parame of sta
300
HF4
(n=4
)
**
* ¤ ¤¤¤
*
al plasmrcentage
100
200
**
*¤
¤ ¤¤¤
¤¤¤
*
¤ ¤
Basa(per
0
100
Adi
tiTN
FR
iti
Ili
Lti
IL6
PAI1
MC
P1
¤¤¤
¤¤¤
Adi
pone
ctin
TNF
Res
istin
Insu
linLe
ptin
IL6
PAI-1
MC
P1

Figu
re 5
4045
STD
3035STDHF0HF1HF3
cy %
152025HF3HF4revHF4
equenc
51015
Fre
05
2040
5060
7080
9010
011
012
013
014
015
030
Cel
l dia
met
er (µ
m)
by on June 4, 2010 w
ww
.jlr.orgD
ownloaded from