Embed Size (px)
Citation preview

A wireless embedded passive sensor for monitoring the corrosion potential of reinforcing steel
This article has been downloaded from IOPscience. Please scroll down to see the full text article.
2013 Smart Mater. Struct. 22 075019
(http://iopscience.iop.org/0964-1726/22/7/075019)
Download details:
IP Address: 130.240.43.43
The article was downloaded on 10/09/2013 at 18:55
Please note that terms and conditions apply.
View the table of contents for this issue, or go to the journal homepage for more
Home Search Collections Journals About Contact us My IOPscience

IOP PUBLISHING SMART MATERIALS AND STRUCTURES
Smart Mater. Struct. 22 (2013) 075019 (10pp) doi:10.1088/0964-1726/22/7/075019
A wireless embedded passive sensor formonitoring the corrosion potential ofreinforcing steel
Sharmistha Bhadra, Douglas J Thomson and Greg E Bridges
Department of Electrical and Computer Engineering, University of Manitoba, Winnipeg,MB, R3T 5V6, Canada
E-mail: [email protected]
Received 13 September 2012, in final form 19 April 2013Published 7 June 2013Online at stacks.iop.org/SMS/22/075019
AbstractCorrosion of reinforcing steel, which results in premature deterioration of reinforced concretestructures, is a worldwide problem. Most corrosion sensing techniques require some type ofwired connection between the sensor and monitoring electronics. This causes significantproblems in their installation and long-term use. In this paper we describe a new type ofpassive embeddable wireless sensor that is based on an LC coil resonator where the resonantfrequency is changed by the corrosion potential of the reinforcing steel. The resonantfrequency can be monitored remotely by an interrogator coil inductively coupled to the sensorcoil. The sensor unit comprises an inductive coil connected in parallel with a voltagedependent capacitor (varactor) and a pair of corrosion electrodes consisting of a reinforcingsteel sensing electrode and a stainless steel reference electrode. Change of potential differencebetween the electrodes due to variation of the corrosion potential of the reinforcing steelchanges the capacitance of the varactor and shifts the resonant frequency of the sensor. Atime-domain gating method was used for the interrogation of the inductively coupledcorrosion sensor. Results of an accelerated corrosion test using the sensor indicate that thecorrosion potential can be monitored with a resolution of less than 10 mV. The sensor issimple in design and requires no power source, making it an inexpensive option for long-termremote monitoring of the corrosion state of reinforcing steel.
(Some figures may appear in colour only in the online journal)
1. Introduction
Reinforced concrete structures make up a large part of ourcivil infrastructure [1, 2]. The reinforcing steel in concretestructures is subject to corrosion, which is the predominantfactor for premature deterioration of structures worldwide [3].Corrosion of reinforcing steel reduces the service life ofthe infrastructure either through direct loss of the steel, orby concrete failure through pressure-induced cracking andspalling from corrosion-product generation [4–6]. Corrosionis very expensive to detect and repair [2]. The currentestimated cost of repairing reinforced concrete structuresis $200 m−2 of exposed surface. Indirect costs includingdelays, inconvenience and lost productivity can account
for over 10 times as much per year [7]. As a result,repair, maintenance, replacement cost of reinforced concreteconsumes a major part of the current spending on civilinfrastructure. Deterioration of concrete structures due tocorrosion is just not an economic issue, but can jeopardizehuman safety. Properly monitoring the corrosion performanceand taking suitable measures at the appropriate time canimprove safety and structural longevity [1, 3, 6–8].
Ingress of chloride (Cl−) ions into concrete is one ofthe major causes of corrosion initiation [1, 9]. When astructure is first built, bare reinforcing steel is exposed tooxygen and water, and a very thin (approximately 1 µm)dense layer of either metal oxide or hydroxide is formedon the surface [1]. Reinforcing steel bars are protected from
10964-1726/13/075019+10$33.00 c© 2013 IOP Publishing Ltd Printed in the UK & the USA

Smart Mater. Struct. 22 (2013) 075019 S Bhadra et al
corrosion by this thin passive layer. The highly alkalineenvironment of the surrounding concrete (pH value around12.6) helps to maintain the passive layer on the surface of thereinforcing steel [1, 9, 10]. However, Cl− ions from de-icingsalts used extensively to keep roads clear of snow and icein winters, exposure to a marine environment or admixturespresent at the time of concrete mixing permeate the concrete,reach the reinforcing steel depth and erode the passivelayer [1, 7]. After the passive layer is destroyed, corrosionpropagation starts. Both oxygen and water must be presentfor reinforcing steel to corrode [1]. Once corrosion begins, itis self-sustaining. Rust (corrosion product) formation at theouter surface of the reinforcing steel results in increase of thecross-section. Rust occupies two to six times the volume of theoriginal reinforcing steel and exerts stress within the concretewhich cannot be supported by the limited plastic deformationof the concrete [7, 11]. This stress generates cracks andspalls which subsequently lead to the degradation of thestructure by providing new means for water and Cl− ionsto reach the reinforcing steel [7, 11, 12]. As the reinforcingsteel is embedded in the concrete, the damage is severe bythe time the effects of corrosion are visible on the concretesurface. Therefore, monitoring techniques are needed for earlydetection of corrosion.
Most existing non destructive evaluation (NDE) sensingtechnologies used for monitoring corrosion require a wiredconnection to the outside world. The cost of wire installationand preparation of sites can easily equal the cost of thesensors and the interrogation equipment. Implementing manyof these methods is time-consuming as they require thestructure to be temporarily shut down, which creates indirectcost. Wires are also easily damaged during installationor while in service [13]. An attractive solution to thisproblem is embeddable wireless sensing. Several wirelessembeddable corrosion sensors are commercially available [7,14]. However, they require a battery or local power forelectronics on the sensor. This negates many of the advantagesof wireless sensors as the batteries require frequent rechargingor replacement. They are also expensive, making wide scaleinstallation a costly endeavor. Wireless passive sensors area promising alternative, where the sensor does not requirean internal power source. The lack of internal power sourceallows these sensors to be permanently embedded in theconcrete structures without recharging or replacing batteries.
Commercial RFID technology based wireless passivesensors have been reported in [15, 16]. The sensor in [15]provides 1 bit information indicating whether the corrosionpotential exceeds the threshold. The sensor in [16] employsa corrosion sensitive connection between the antenna andelectronics which severs in a corroded state. Researchershave identified a number of limitations associated with usingcommercial RFID technology for corrosion monitoring, themost important being restrictions on what data can be returnedto the reader and the reliability of the datastream [17]. CustomRFID circuitry eliminates these issues. Custom RFID circuitrybased sensors have been described in [17, 18]. The sensorin [17] detects corrosion the same way as [16]. The sensorin [18] employs an internal potentiostat to provide linear
polarization measurements. These RFID based sensors usecustom active electronics powered by inductive coupling tothe interrogator. A simpler, low cost alternative to customRFID circuitry are inductively coupled passive LC sensors.They are based on passive electronics requiring only a smallnumber of discrete components. One such sensor has beenused for corrosion sensing [5, 19]. These sensors have anexposed wire that eventually breaks as corrosion develops,changing an internal capacitance and shifting the resonantfrequency of the sensor. This fuse-type sensor provides 1 bitof information regarding the corrosion state.
The tendency of reinforcing steel to corrode in concreteis indicated by the potential it develops when in contact withthe concrete environment. This is called the corrosion poten-tial [3]. One of the NDE methods for corrosion monitoring,open circuit potential measurement, measures the corrosionpotential of reinforcing steel with respect to a referenceelectrode [3]. It is important to note that the corrosionpotential values can only provide information for corrosionprobability and are affected by a number of factors, whichinclude polarization by limited diffusion of oxygen, concreteporosity and the presence of a highly resistive layer [20].
In this paper, we present a wireless passive embeddablesensor that can detect the corrosion potential of reinforcingsteel with respect to a reference electrode and thus can beused for corrosion monitoring. The sensor, sensing electrodeand reference electrode, which is immune to corrosion, are allembedded in the concrete. The sensor is based on a passiveLC coil resonator whose resonant frequency changes with thecorrosion potential of reinforcing steel. An interrogator coil isinductively coupled to the sensor coil and tracks the change inthe sensor’s resonant frequency using a time-domain gatingmethod. The design of the sensor is simpler and moresuited for inexpensive mass production than custom circuitRFID based sensors. Another advantage of this sensor isthe ability to detect the corrosion initiation stage. Wirelesspassive corrosion sensors reported in [5, 15–17, 19] provideinformation when the corrosion exceeds a threshold level butare unable to detect the corrosion initiation stage.
2. Sensor operation
A block diagram of the coupled coil sensor–interrogator isshown in figure 1. In the remote sensor, an inductive coilis connected in parallel with a voltage dependent capacitor(varactor) and a pair of electrodes. The pair of electrodesconsists of a reinforcing steel sensing electrode and a stainlesssteel reference electrode. Here LS is the inductance of thesensor coil, C(Vcell) is the capacitance of the resonantsensing circuit and Vcell is the potential difference developedacross the electrodes when embedded in the concrete and isdependent on the surface condition of the sensing electrode.The capacitance, C(Vcell), changes in response to the lowfrequency change of Vcell. The sensor coil and capacitor forma resonant circuit with a resonant frequency, f0, approximatelygiven for high quality factor, Q, by
f0 =1
2π√
LSC(Vcell). (1)
2

Smart Mater. Struct. 22 (2013) 075019 S Bhadra et al
Figure 1. Block diagram of the wireless passive corrosion sensor.The electrode potential difference, Vcell, is detected by monitoringresonant frequency of the sensor.
An interrogator coil is inductively coupled to the sensorcoil and is used to track the resonant frequency of thesensor. In this manner, the measured resonant frequency isdirectly related to the voltage developed across the pair ofelectrodes.
An equivalent circuit diagram of the coupled coilcorrosion sensor is shown in figure 2. In the circuit, LS andRS are the series inductance and resistance of the sensorcoil, respectively, and L1 and R1 are the series inductanceand resistance of the interrogator coil, respectively. M is theinterrogator–sensor coil coupling factor. We have assumed theinter-winding capacitance of the interrogator and sensor coilsis small and the self-resonant frequency of the coils is muchlarger than f0. Cj is the small signal junction capacitance ofthe varactor in the sensing circuit. In the reverse bias state, Cjis approximated by Cj(VC) = C0(1 − VC/ϕ)
−γ , where C0 isthe junction capacitance at zero bias, ϕ is the junction builtin potential, γ is the doping dependent exponent, and VC isthe bias voltage applied across the varactor. Rcell is the cellresistance developed at the pair of corrosion electrodes whenembedded in the concrete. In the circuit, R3 and C2 act as alow pass filter so that the resonator is only sensitive to lowfrequency variations in the corrosion electrode potential and isnot loaded by Rcell. For a small interrogator source oscillationamplitude, small M, and Rcell � (R2 + R3),VC ∼= Vcell.Assuming losses are small and C1 � Cj(Vcell), the potentialof the reinforcing steel with respect to the reference electrodepotential, which is indicated by Vcell, can be monitoredby obtaining the resonant frequency of the sensor [21].An Important characteristic of this sensor design is thehigh DC input impedance, Z2 > 10 G�, which preventsgalvanic corrosion. Varactor based inductively coupledwireless passive sensors have been previously used for pHmeasurement [22, 23] and biopotentials transmission [24].
Figure 2. Equivalent circuit diagram of the wireless passivecorrosion sensor and coupled interrogator.
The proposed sensor uses sensing and reference electrodesthat are sensitive and alternatively immune to corrosion insideconcrete, respectively. A hermetic enclosure is used to protectthe sensor coil and sensing circuit from the corrosive concreteenvironment and to prevent water penetrating the circuit.
Change in the sensor’s resonant frequency is mostcommonly detected by measuring the induced change inthe impedance of the interrogator coil using an impedancemeasuring device. Referring to figure 2, near and at theresonant frequency the impedance, Zin, is given as
Zin(f ) = Z1 + ZT = R1 + j2π fL1 +(2π f )2M2
ZS, (2)
where ZS ∼= RS + j2π fLS + [j2π fCj + (R2 + R3)/(R2R3)]−1
is the sensor series impedance and f is the source frequency.The impedance, Zin, consists of two components; Z1 = R1 +
j2π fL1, due to the self impedance of the interrogator coil andZT = (2π f )2M2/ZS, due to the sensor coupling. To removethe self impedance of the interrogator coil a backgroundsubtraction, using the measured impedance of the interrogatorcoil when the sensor is absent, is implemented prior tomeasuring the sensor response [25]. As the interrogationdistance increases, the response from the sensor decreasesrapidly and the self impedance of the interrogator coil, Z1,which is sensitive to the surrounding environment (such asthe presence of rebar), dominates. Thus, the steady stateimpedance interrogation technique is strongly affected bythe response of the interrogator coil and typically requiresa small separation distance between the sensor coil and theinterrogator coil for accurate measurement.
Instead of determining the resonant frequency bymeasuring the steady state input impedance, Zin, a time-domain gating method was used for the interrogation ofthe weakly coupled corrosion sensor [26]. A block diagramof the time-domain gating system is shown in figure 3. Inthis method, the interrogator coil is periodically excited at aspecified frequency, f , and energy is coupled to the sensorcoil. After enough time has elapsed to allow the energy in thesensor to reach equilibrium, the source is turned off and theemitted response from the sensor is monitored by a lock-inamplifier. The received signal from the sensor, vr(t), is anexponentially decaying sinusoid that oscillates at the resonantfrequency, f0, of the sensor and a decay dependent on its
3

Smart Mater. Struct. 22 (2013) 075019 S Bhadra et al
Figure 3. Block diagram of time-domain gating interrogationsystem. In transmit mode energy is coupled to the sensor atfrequency f and in receive mode energy is coupled back to theinterrogator at sensor’s resonant frequency, f0.
quality factor. The amplitude of the received signal dependson the excitation frequency. The amplitude is largest whenthe excitation frequency matches the resonant frequency ofthe sensor. Thus, by sweeping the excitation frequency, f , andmonitoring the maximum amplitude of the received signal theresonant frequency of the sensor can be determined.
To determine the response signal, vr(t), we assume thatthe transmit mode duration is long enough so the sensorreaches equilibrium. The induced sensor current, I2, (seefigure 2) at a frequency, f , will then be
I2|f =−j2π fMI1
ZS=−j2π fM
ZS×
VG
Z0 + Zin. (3)
When the interrogator switches to the receive mode, thecurrent in the sensor coil oscillates at its resonant frequency,f0, and decays with a time constant τ = Q/π f0. ProvidedQ � 1 and f is near f0, we determine the initial inducedcurrent and voltage at the interrogator at the frequency,f0, using
I1|f0 =−j2π f0M|I2|f |
(Z0 + Z1)|f0, (4)
Vr|f0 = −Z0I1|f0 (5)
where the phase of the sensor current when switching tothe receive mode has been ignored. Using (3) and (4), theresulting received signal, vr(t), is approximately given by
vr(t) ∼= |A|e−t/τ cos(2π f0t + φ), (6)
A =(2π)2ff0M2Z0VG
(Z0 + Z1)|f0(ZS(Z0 + Z1)+ (2π)2f 2M). (7)
Equations (6) and (7) indicate that the received signal willbe maximized when f ∼ f0 and ZS|f0 is minimum. In orderto determine the resonant frequency, the source frequency,f , is swept near f0 using a signal generator (SRS DS345)and for each excitation frequency, f , the signal receivedfrom the sensor, vr(t) is sent to a RF lock-in amplifier
(SRS SR844) to detect the signal. The output of the lock-inamplifier, S, is monitored and a frequency response for S isobtained as the excitation frequency, f , sweeps. S is maximumwhen f ∼ f0. A more detailed description of time-domaingating electronics is provided in [26]. Three high isolationbi-directional absorptive SPDT switches (ZASW-2-50DR+)are used to switch between the transmit and receive mode.The maximum of the frequency response of S is determinedusing a quadratic fit. The advantage of this method is thatit eliminates the direct response of the interrogator coil andthe exciting signal. This results in a measurement dominatedby the response of the sensor, enabling detection of thesensor’s resonant frequency far more precisely at an extendedseparation distance [26].
From (7) it can be seen that for a fixed excitationfrequency the signal from the sensor under the small couplingcondition, ZS(Z0 + ZR) � f 2M, will be proportional toM2 (this is also the case using the steady state impedancemeasurement method, (2)). For two concentric coils (as shownin figure 1), the mutual coupling, M, can be expressed in termsof separation distance between the centers of two coils, d, theradius, r1, and number of turns, n1, of the interrogator coil, theradius, rs, and number of turns, ns, of the sensor coil as [27]
M = n1nSµ0√
r1rS
[(2k1− k1
)K(k1)−
2k1
E(k1)
],
K(k1) =
∫ π/2
0
dϕ√1− k2
1sin2ϕ
,
E(k1) =
∫ π/2
0
√1− k2
1sin2ϕ dϕ,
(8)
where k21 = (4r1rS)/(d2
+(r1+rS)2) and K(k1) and E(k1) are
the complete elliptic integrals.When the coils are separated by a large distance, r1, rs �
d (this was the case for the experiments described in thispaper), (8) can be expressed by
M =n1nSµ0πr2
1r2S
2d3 . (9)
From (9) it can be seen that M ∝ 1/d3. Thus thetransmit-receive signal for coupled coil system is proportionalto 1/d6 and is expected to decrease rapidly with increasingdistance.
Circuit simulation results of the time-domain gatingsystem for a model RLC sensor coil (R = 11.72 �,L =65.48 µH and C = 33.22 pF, yielding f0 = 3.4124 MHz)coupled to an interrogator coil (L1 = 2.35 µH,R1 =
334.13 m� and self-resonant frequency, fres = 28.32 MHz)for M = 0.17 is shown in figure 4. This model is verysimilar to the actual sensor–interrogator circuit used in ourexperiment. Figure 4(a) shows the voltage expected acrossthe interrogator coil for a source frequency f = 3.4127 MHzand subsequently the received decaying signal, vr(t), from thesensor at f0 = 3.4124 MHz. Figure 4(b) shows the simulatedvoltage across the sensor coil.
4

Smart Mater. Struct. 22 (2013) 075019 S Bhadra et al
Figure 4. Circuit simulation of a model interrogator–sensor system(f0 = 3.4124 MHz and Q = 120 for the sensor). The voltage across(a) the interrogator coil and (b) the sensor coil for the time-domaingating system in figure 3. Only the exponentially decaying signalportion, vr(t), will be provided to the lock-in amplifier.
3. Experiment and results
3.1. Prototype sensor and interrogator coil description
The prototype sensor is shown in figure 5. The sensor wasdesigned to have a resonant frequency, f0, near 3.4 MHzsince the time-domain interrogation system has a maximumfrequency limit of 5 MHz due to the limitations of circuitcomponents used for its construction. A sensor–interrogatorsystem capable of operating at a higher frequency ispossible. The prototype embeddable sensor was constructedby hermetically sealing the sensor coil and the sensing circuitin a high density polyethylene (dielectric constant 2.3) plasticcylinder. The sensor coil was 8.4 cm in diameter and madeof 19 turns of insulated wire of 0.55 mm diameter, producingLS = 68.53 µH and RS = 10.52 �. The sensing circuit wasfabricated on a 2.7 cm × 1 cm printed circuit board withsurface mount capacitors and resistors. The varactor (NXPBB202) in the sensing circuit had a junction capacitance that
Figure 5. Prototype embeddable wireless passive corrosion sensor.The coil and electronics are encased in a plastic cylinder.
varied in the range of 35.04 pF–22.95 pF for reverse biasvoltages between 0 V and 1 V, respectively. The sensor circuitwas connected to the electrodes which were external to theplastic cylinder. The reinforcing steel sensing electrode was20 cm long and 1.2 cm diameter. The stainless steel referenceelectrode was a 0.32 cm thick, 2.4 cm wide and 20 cmlong bar. As stainless steel has a higher reduction potentialthan reinforcing steel, the reinforcing steel and stainless steelelectrodes were connected to the positive and negative ends ofthe sensing circuit, respectively, so that the voltage developedacross the electrodes sets the varactor in a reverse bias state.Locations where the wires came out of the cylinder andconnected to the electrodes were sealed properly with epoxy.The ends of reinforcing steel bar were also sealed with epoxy.
The interrogator coil was 5.1 cm in diameter andconstructed of 5 turns of insulated copper wire of 1.2 mmdiameter, producing L1 = 2.35 µH,R1 = 334.13 m� and aself-resonant frequency, fres = 28.32 MHz. For the resultspresented here, the amplitude of the signal applied to theinterrogator coil was 200 mVpp. It took approximately 20 µsfor the energy in the corrosion sensor to reach equilibriumin the transmit mode and 6 µs for the receive signal todecay. The transmit-receive cycle was repeated every 40 µs.Fifteen transmit-receive cycles were used for each excitationfrequency. The excitation frequency was swept from 3 to4 MHz in increments of 5 kHz to collect the sensor’sfrequency response.
3.2. Calibration
Before connecting the electrodes to the sensing circuit,calibration of the sensor was performed by applying a DCvoltage directly to the sensing circuit in figure 5 usinga precision power supply (HP 6115A). A voltage wasnot directly applied to the electrodes to prevent galvaniccorrosion. The sensor coil was aligned concentrically withthe interrogator coil with a separation distance d = 12 cm.Figure 6 shows the measured resonant frequency, f0, of thesensor for different applied voltages, V . A linear fit given by
f0 = −0.000 76V (mV)+ 3.2249 (10)
5

Smart Mater. Struct. 22 (2013) 075019 S Bhadra et al
Figure 6. Resonant frequency versus voltage applied to the sensingcircuit.
over the 0 to −330 mV range indicates a slope of0.76 kHz mV−1 with a maximum deviation of less than3.3 kHz from linear fit (corresponding to a slope of1.32 mV kHz−1 and a deviation of less than 4.3 mV). Thedeviation from the linear fit results from the non-linear C–Vrelationship of the varactor. Note that the source impedancein this calibration was very small, whereas the reinforcingsteel/stainless steel electrode pair used in corrosion sensinghad a larger source impedance.
3.3. Preparation of mortar specimen with embedded sensor
The electrode pair along with the plastic cylinder wereembedded in a 17 cm × 15 cm × 18.5 cm mortarspecimen. A block diagram of the mortar specimen withthe embedded sensor is shown in figure 7. The top 5.5 cmof the electrodes were left protruding from the mortar sothat the potential difference could be measured directly.Mortar was used because its porous nature allows Cl− ionsand water to permeate the mortar quickly which acceleratesthe corrosion of the reinforcing steel [1, 23]. The mortarspecimen was made from Quikrete Mason Mix (type Smortar, no. 1136). The electrode pair and the sealed cylinderwere first placed in position in a plastic formwork. Afterthoroughly mixing 2.612 kg of mason mix with 602 gmof water according to the manufacturer instructions, themortar was placed in the formwork and appropriately tamped.The reinforcing steel/stainless steel pair was embeddedapproximately 14.5 cm. To guard against crevice corrosion,the reinforcing steel bar was painted with nitrile rubber at theboth ends and in the region where it protruded from the mortar.The spacing between the reinforcing steel bar and the stainlesssteel electrode was 1.2 cm. The distance from the center of thesensor coil to the mortar surface was 2 cm. After 10 days, themortar specimen block was taken out of the formwork and aircured for 14 days.
Figure 7. Block diagram of mortar specimen with embeddedsensor.
Figure 8. Experimental set up for accelerated corrosion test withthe embedded sensor. The mortar block was placed in a 6 cm depthsalt bath for 11 days.
3.4. Accelerated corrosion test
The experimental set up for the accelerated corrosion testwith the sensor embedded in the mortar specimen is shownin figure 8. As the corrosion process can take several yearsto occur naturally, accelerated corrosion tests are commonlyused to monitor the functionality and performance of differentcorrosion monitoring techniques and sensors in a reasonabletime. For accelerated corrosion tests, specimens are madeof porous concrete with a high air content or mortar. Thisallows easy diffusion of water, oxygen and chloride ions.Once the specimens are cured, they are submerged in a strongsalt solution to provide a source of chloride ions [1, 5, 28].Therefore oxygen, water, and chlorides are readily available atthe surface of the reinforcing steel and the corrosion potentialdrops much more rapidly as opposed to the gradual potentialchange during a natural corrosion process [28, 29].
The specimen was partially submerged in tap water for3 days and then in 5% NaCl solution for 11 days. The salt bath
6
Smart Mater. Struct. 22 (2013) 075019 S Bhadra et al
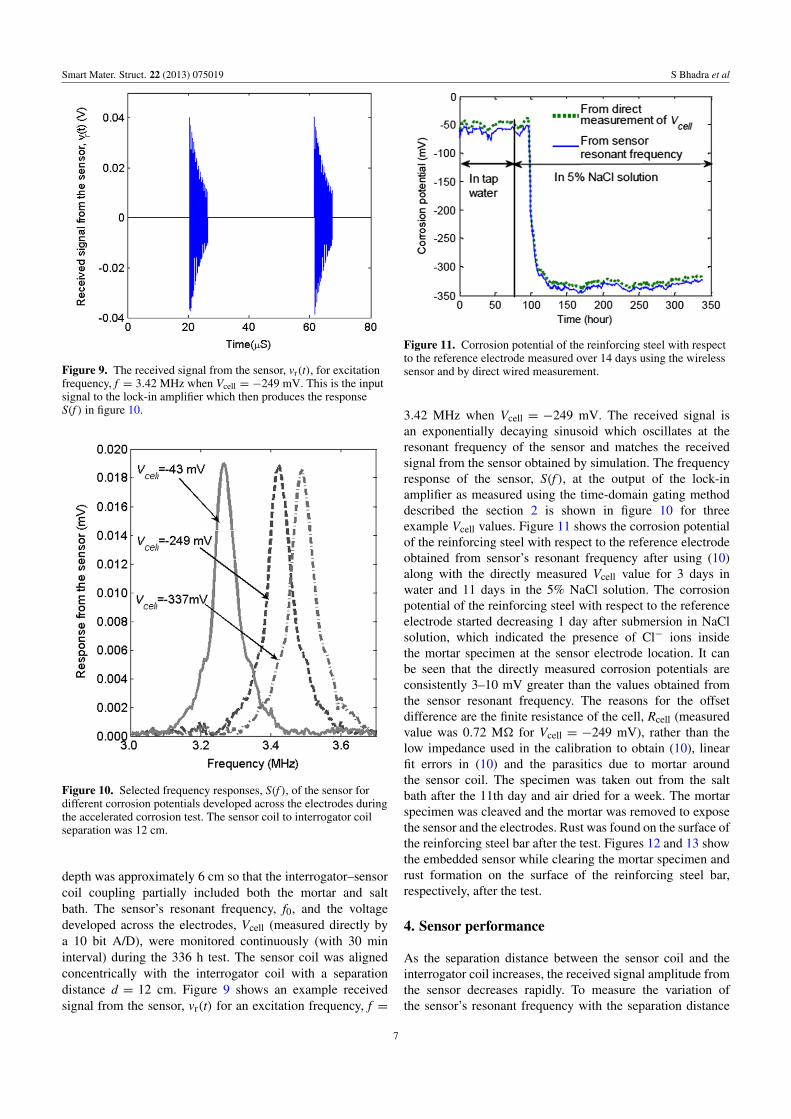
Figure 9. The received signal from the sensor, vr(t), for excitationfrequency, f = 3.42 MHz when Vcell = −249 mV. This is the inputsignal to the lock-in amplifier which then produces the responseS(f ) in figure 10.
Figure 10. Selected frequency responses, S(f ), of the sensor fordifferent corrosion potentials developed across the electrodes duringthe accelerated corrosion test. The sensor coil to interrogator coilseparation was 12 cm.
depth was approximately 6 cm so that the interrogator–sensorcoil coupling partially included both the mortar and saltbath. The sensor’s resonant frequency, f0, and the voltagedeveloped across the electrodes, Vcell (measured directly bya 10 bit A/D), were monitored continuously (with 30 mininterval) during the 336 h test. The sensor coil was alignedconcentrically with the interrogator coil with a separationdistance d = 12 cm. Figure 9 shows an example receivedsignal from the sensor, vr(t) for an excitation frequency, f =
Figure 11. Corrosion potential of the reinforcing steel with respectto the reference electrode measured over 14 days using the wirelesssensor and by direct wired measurement.
3.42 MHz when Vcell = −249 mV. The received signal isan exponentially decaying sinusoid which oscillates at theresonant frequency of the sensor and matches the receivedsignal from the sensor obtained by simulation. The frequencyresponse of the sensor, S(f ), at the output of the lock-inamplifier as measured using the time-domain gating methoddescribed the section 2 is shown in figure 10 for threeexample Vcell values. Figure 11 shows the corrosion potentialof the reinforcing steel with respect to the reference electrodeobtained from sensor’s resonant frequency after using (10)along with the directly measured Vcell value for 3 days inwater and 11 days in the 5% NaCl solution. The corrosionpotential of the reinforcing steel with respect to the referenceelectrode started decreasing 1 day after submersion in NaClsolution, which indicated the presence of Cl− ions insidethe mortar specimen at the sensor electrode location. It canbe seen that the directly measured corrosion potentials areconsistently 3–10 mV greater than the values obtained fromthe sensor resonant frequency. The reasons for the offsetdifference are the finite resistance of the cell, Rcell (measuredvalue was 0.72 M� for Vcell = −249 mV), rather than thelow impedance used in the calibration to obtain (10), linearfit errors in (10) and the parasitics due to mortar aroundthe sensor coil. The specimen was taken out from the saltbath after the 11th day and air dried for a week. The mortarspecimen was cleaved and the mortar was removed to exposethe sensor and the electrodes. Rust was found on the surface ofthe reinforcing steel bar after the test. Figures 12 and 13 showthe embedded sensor while clearing the mortar specimen andrust formation on the surface of the reinforcing steel bar,respectively, after the test.
4. Sensor performance
As the separation distance between the sensor coil and theinterrogator coil increases, the received signal amplitude fromthe sensor decreases rapidly. To measure the variation ofthe sensor’s resonant frequency with the separation distance
7

Smart Mater. Struct. 22 (2013) 075019 S Bhadra et al
Figure 12. Exposed embedded sensor after the corrosion test.
Figure 13. Rust formation on the surface of the reinforcing steelafter accelerated corrosion test.
an experiment was performed at the end of the acceleratedcorrosion test, when a fixed potential difference (measured bythe A/D), Vcell = −337 mV was observed. For all tests thesensor coil was aligned concentrically with the interrogatorcoil. The normalized received signal amplitude for a fixedexcitation frequency f = 3.4879 MHz is plotted in figure 14along with the normalized theoretical value (9), for differentdistances. It can be seen that the normalized received signalfollows the 1/d6 mutual coupling behavior predicted by (9).Figure 15 shows the variation of resonant frequency withdistance. A minimum separation distance of 8 cm betweenthe interrogator coil and the sensor coil was required so thatthe varactor in the sensor remained in a linear operatingrange. A separation of less than 18 cm was required tomaintain a measurement error less than 0.14% (correspondingto 6.3 mV). This separation distance is suited to that used instandard wired corrosion and chloride penetration testing [30].Corrosion sensors are typically embedded in stages abovethe reinforcing steel, which can be at depths of 4–10 cmbelow the concrete surface [31] (there may also be additionalcover materials). The separation distance can be improved byincreasing the power at the interrogator coil, or by increasingthe number of turns of the interrogator coil.
Figure 14. Received signal peak as a function ofsensor–interrogator separation (normalized to the signal peak at8 cm). Comparison with the 1/d6 theoretical value.
Figure 15. Variation of the resonant frequency as a function ofsensor–interrogator separation distance. The maximum deviationshown by the error bar corresponds to a 6.3 mV deviation incorrosion potential.
After the accelerated corrosion test the mortar specimenwas removed from the salt bath and dried for one week.The potential difference directly measured at the electrodes,Vcell, increased to −304.73 mV. For this dry condition thesensor’s resonant frequency was 3.4730 MHz. During thepreviously measured wet condition (figure 11) a cell potentialof Vcell = −304.60 mV resulted in a resonant frequency of3.4650 MHz. The dry-to-wet condition resonant frequencydifference (8 kHz) corresponds to a difference of 10.5 mV.This indicates that the sensor’s resonant frequency was onlyslightly affected by the moisture content inside the specimen.
8

Smart Mater. Struct. 22 (2013) 075019 S Bhadra et al
5. Sensor scaling
Inclusions introduced in concrete create stress locations andembedded sensors are a potential source of fractures [32].Although the proposed prototype sensor is comparable in sizeto commercially available embedded corrosion sensors [7,14], miniaturization is desirable to ensure the integrity of civilstructures. Reduction in sensor size can be achieved by usinga smaller sensor coil. For corrosion monitoring applications,even though the sensor coil would be small, the interrogatorcoil could remain large enabling the interrogator–sensordistance to remain in the order of 4–10 cm [31]. Under theseconditions (r1 � d � rs) we can approximate the mutualcoupling factor as (8)
M ∼=n1nSµ0πr2
1r2S
2(d2 + r2s )
3/2 . (11)
As the sensor signal is proportional to M2, we observefrom (11) and (7) that the received signal from thesensor is proportional to f 2
0 n2s r4
s . Decreasing the sensorcoil size would reduce the receive signal. This can becompensated for by increasing the number of coil turns,ns, and by operating at a higher resonant frequency, f0.However, attenuation in concrete medium, which increaseswith frequency, must be considered. Also, moisture contentinside concrete significantly increases radio wave attenuation.These effects are more prominent at higher frequency [33],and 13.56 MHz [17] and 868 MHz RFID [33] based sensorshave been shown suitable for embedding inside concrete.The size and number of turns of the sensor coil is limitedby its self-resonant frequency and thus, the operating rangefor inductively coupled resonant LC coil sensors decreasessignificantly with increase in operating frequency (decreasein size). A coupled resonant LC coil sensor (planar coil size2.7 cm × 2.7 cm × 0.15 cm) operating at 18 MHz has amaximum interrogation distance around 8.5 cm [34]. This issmaller than the maximum interrogation distance of the sensordescribed in this paper. Therefore, even though the sensor caneasily be modified to operate at higher frequency, receivedsignal strength and maximum interrogation distance shouldbe taken into consideration when scaling down the size of thesensor.
6. Conclusion
This paper demonstrated a wireless passive sensor that can beembedded in reinforced concrete structures and can remotelymonitor the corrosion potential of reinforcing steel withrespect to a reference electrode. The sensor was interrogatedusing a time-domain gating method. The sensor exhibited verylinear behavior over a 0 to −330 mV voltage range. Theaccelerated corrosion test indicated that corrosion potentialcould be monitored with a resolution less than 10 mV.This is adequate for corrosion potential monitoring [3, 35].Measurements could be performed for the sensor–interrogatordistances greater than 10 cm which is suitable for embeddedapplications in roadbeds or bridge decks. This simple sensor
is based on a LC coil resonator and passive electronics,making it mass producible, and inexpensive to manufactureand install. In practice, multiple sensors would be embeddedin a civil structure. One shortcoming of the proposed sensoris the ability to uniquely identify one sensor’s response fromits neighbor. This issue can be solved by designing sensors tohave different resonant frequencies [36].
Acknowledgments
This research was funded by the Natural Sciences andEngineering Research Council of Canada, grant no. NSERCRGPIN-42163 and ISIS Canada, grant no. MCEF ISIS F1.1.3.
References
[1] Ervin B L and Reis H 2008 Longitudinal guided waves formonitoring corrosion in reinforced mortar Meas. Sci.Technol. 19 055702
[2] Miller G, Gaydecki P, Quek S, Fernandes B and Zaid M 2005A combined Q and heterodyne sensor incorporatingreal-time DSP for reinforcement imaging, corrosiondetection and material characterisation Sensors Actuators A121 339–46
[3] Song H-W and Saraswathy V 2007 Corrosion monitoring ofreinforced concrete structures—a review Int. J.Electrochem. Sci. 2 1–28
[4] Gaydecki P, Silva I, Fernandes B T and Yu Z Z 2000 Aportable inductive scanning system for imagingsteel-reinforcing bars embedded within concrete SensorsActuators A 84 25–32
[5] Andringa M M, Neikirk D P, Dickerson N P and Wood S L2005 Unpowered wireless corrosion sensor for steelreinforced concrete Proc. IEEE Sensors Conf. (Irvine, CA)pp 155–8
[6] Pasupathy P P, Zhuzhou M, Neikirk D P and Wood S L 2008Unpowered resonant wireless sensor nets for structuralhealth monitoring Proc. IEEE Sensors Conf. (Lecce)pp 697–700
[7] Internet: http://www.vatechnologies.com/eciNeed.htm[8] Miller G, Gaydecki P, Quek S, Fernandes B T and
Zaid M A M 2003 Detection and imaging of surfacecorrosion on steel reinforcing bars using a phase-sensitiveinductive sensor intended for use with concrete NDT & EInt. 36 19–26
[9] Apostolopoulos C A and Papadakis V G 2008 Consequencesof steel corrosion on the ductility properties ofreinforcement bar Constr. Build. Mater. 22 2316–24
[10] Du R-G, Hu R-G, Huang R-S and Lin C-J 2006 In situmeasurement of Cl− concentrations and pH at thereinforcing steel/concrete interface by combination sensorsAnal. Chem. 78 3179–85
[11] Cabrera J G 1996 Deterioration of concrete due toreinforcement steel corrosion Cem. Concr. Compos.18 47–59
[12] Yeo T L, Cox M A C, Boswell L F, Sun T and Grattan K T V2006 Monitoring ingress of moisture in structural concreteusing a novel optical-based sensor approach J. Phys.: Conf.Ser. 45 186–92
[13] Han B G, Yu Y, Han B Z and Ou J P 2008 Development of awireless stress/strain measurement system integrated withpressure-sensitive nickel powder-filled cement-basedsensors Sensors Actuators A 147 536–43
[14] Internet: http://www.roctest.com/modules/AxialRealisation/img repository/files/documents/SensCore-161010.pdf
9

Smart Mater. Struct. 22 (2013) 075019 S Bhadra et al
[15] Water D G, Jayaweera P, Bahr A J, Huestis D L, Priyanhta N,Meline R, Reis R and Parks D 2003 Smart PebbleTM:wireless sensor for structural health monitoring of bridgedecks Proc. SPIE 5057 20–719
[16] Apblett A W and Materer N F 2010 Passive wireless corrosionsensor US Patent Specification 7675295 B2
[17] Materer N, Apblett A and Ley T 2011 Passive, wirelesscorrosion sensors for transportation infrastaructureOklahoma Transportation Center OTCREOS7.1-34-F
[18] Leon-Salas W, Kanneganti S and Halmen C 2011Development of a smart RFID-based corrosion sensor Proc.IEEE Sensors Conf. pp 534–7
[19] Yousef A A, Pasupathy P, Wood S L and Neikirk D P 2010Resonant sensors for detecting corrosion in concrete bridgesTransp. Res. Rec.: J. Transp. Res. Board 2201 19–26
[20] Browne R D, Geoghegan M P and Baker A F 1983 Corrosionmonitoring of steel in concrete Corrosion of Reinforcementin Concrete Construction ed A P Crane (London: EllisHorwood) pp 193–222
[21] Bhadra S, Bridges G E and Thomson D J 2010 Coupled coilsensor for detecting surface corrosion on steelreinforcement Proc. ANTEM-AMEREM Conf. (Ottawa,ON) pp 1–4
[22] Bhadra S, Bridges G E, Thomson D J and Freund M S 2010 Awireless passive pH sensor based on pH electrode potentialmeasurement Proc. IEEE Sensors Conf. (Big Island, HI)pp 927–30
[23] Horton J B E, Schweitzer S, DeRouin A J and Ong K G 2011A varactor-based inductively coupled wireless pH sensorIEEE Sensors J. 11 1061–6
[24] Towe B C 2010 Systems and methods for wirelesstransmission of biopotentials US Patent Specification20100198039 A1
[25] Ong J B, You Z, Mills-Beale J, Tan E L, Pereles B D andOng K G 2008 A wireless, passive embedded sensor forreal time monitoring of water content in civil engineeringmaterials IEEE Sensors J. 8 2053–8
[26] Bhadra S, Thompson E, Kordi B, Bridges G E andThomson D J 2010 Coupled resonant coil sensors withincreased interrogation distance Proc. 5th Int. Conf. onBridge Maintenance, Safety and Management(Philadelphia, PA) ed M Frangopol, R Sause andC S Kusko (Boca Raton. FL: CRC Press) p 82
[27] Tesche F M, Ianoz M V and Karlsson T 1997 EMC AnalysisMethods and Computational Models (New York: Wiley)
[28] Reis H, Ervin B L, Kuchma D A and Bernhard J T 2005Estimation of corrosion damage in steel reinforced mortarusing waveguides ASME J. Press. Vessel Technol.127 255–61
[29] Darwin D, Locke C E, Balma J and Kahrs J T 1999 Evaluationof stainless steel clad reinforcing bars structural engineeringand engineering materials SL Report pp 99–3 (Lawrence,KS: University of Kansas Center For Research, Inc.)
[30] Antoni A 2006 Development of non-destructive monitoringsystem for chloride penetration into reinforced concretestructures Civil Eng. Dimens. 8 99–105
[31] New York State Thruway Authority 2010 Thruway StructuresDesign Manual 4th edn (New York) TAP-422 (3/2010)
[32] Issa M A, Issa M A, Islam M S and Chudnovsky A 2000 Sizeeffects in concrete fracture: part 1, experimental setup andobservations Int. J. Fract. 102 1–24
[33] Daly D, Melia T and Baldwin G 2010 Concrete embeddedRFID for way point positiong Proc. Int. Conf. on IndoorPositioning and Indoor Navigation (Zurich, Switzerland)pp 1–10
[34] Bhadra S, Tan D S Y, Thomson D J, Freund M S andBridges G E 2013 A wireless passive sensor fortemperature compensated remote pH monitroing IEEESens. J. 13 2428–36
[35] ASTM C 876-91 2006 Standard test method for half-cellpotentials of uncoated reinforcing steel in concrete AnnualBook of ASTM Standards vol 03.02 pp 11–6
[36] Sridhar V and Takahata K 2009 A hydrogel-based passivewireless sensor using a flex-circuit inductive transducerSensors Actuators A 155 58–65
10