Embed Size (px)
Citation preview

A World Bank Group Flagship Report
Global Economic Prospects
JANUARY 2017
Weak Investment in Uncertain Times


A World Bank Group Flagship Report
Weak Investment in
Uncertain Times
JANUARY 2017

© 2017 International Bank for Reconstruction and Development / �e World Bank
1818 H Street NW, Washington, DC 20433
Telephone: 202-473-1000; Internet: www.worldbank.org
Some rights reserved
1 2 3 4 19 18 17 16
�is work is a product of the sta2 of �e World Bank with external contributions. �e 4ndings, interpretations, and conclusions expressed in this work do not necessarily re6ect the views of �e World Bank, its Board of Executive Directors, or the governments they represent. �e World Bank does not guarantee the accuracy of the data included in this work. �e boundaries, colors, denomi-nations, and other information shown on any map in this work do not imply any judgment on the part of �e World Bank concern-ing the legal status of any territory or the endorsement or acceptance of such boundaries.
Nothing herein shall constitute or be considered to be a limitation upon or waiver of the privileges and immunities of �e World Bank, all of which are speci4cally reserved.
Rights and Permissions
This work is available under the Creative Commons Attribution 3.0 IGO license (CC BY 3.0 IGO) http://creativecommons.org/licenses/by/3.0/igo. Under the Creative Commons Attribution license, you are free to copy, distribute, transmit, and adapt this work, including for commercial purposes, under the following conditions:
Attribution—Please cite the work as follows: World Bank Group. 2017. Global Economic Prospects, January 2017 Weak Investment in Uncertain Times. Washington, DC: World Bank. doi:10.1596/978-1-4648-1016-9. License: Creative Commons Attribution CC BY 3.0 IGO
Translations—If you create a translation of this work, please add the following disclaimer along with the attribution: This translation was not created by The World Bank and should not be considered an official World Bank translation. The World Bank shall not be liable for any content or error in this translation.
Adaptations—If you create an adaptation of this work, please add the following disclaimer along with the attribution: This is an adaptation of an original work by The World Bank. Views and opinions expressed in the adaptation are the sole responsibility of the author or authors of the adaptation and are not endorsed by The World Bank.
Third-party content—The World Bank does not necessarily own each component of the content contained within the work. The World Bank therefore does not warrant that the use of any third-party-owned individual component or part contained in the work will not infringe on the rights of those third parties. The risk of claims resulting from such infringement rests solely with you. If you wish to re-use a component of the work, it is your responsibility to determine whether permission is needed for that re-use and to obtain permission from the copyright owner. Examples of components can include, but are not limited to, tables, figures, or images.
All queries on rights and licenses should be addressed to World Bank Publications, The World Bank Group, 1818 H Street NW, Washington, DC 20433, USA; e-mail: [email protected].
Third-party content—The World Bank does not necessarily own each component of the content contained within the work. The World Bank therefore does not warrant that the use of any third-party-owned individual component or part contained in the work will not infringe on the rights of those third parties. The risk of claims resulting from such infringement rests solely with you. If you wish to re-use a component of the work, it is your responsibility to determine whether permission is needed for that re-use and to obtain permission from the copyright owner. Examples of components can include, but are not limited to, tables, figures, or images.
All queries on rights and licenses should be addressed to the Publishing and Knowledge Division, The World Bank, 1818 H Street NW, Washington, DC 20433, USA; fax: 202-522-2625; e-mail: [email protected].
ISBN (paper): 978-1-4648-1016-9 ISBN (electronic): 978-1-4648-1017-6 DOI: 10.1596/978-1-4648-1016-9 Cover design: Bill Pragluski (Critical Stages).
The cutoff date for the data used in this report was December 15, 2016.

iii
Summary of Contents
Chapter 1 Global Outlook: Subdued Growth, Shifting Policies, Heightened Uncertainty.......... 1
Special Focus The U.S. Economy and the World .......................................................................... 57
Chapter 2 Regional Outlooks .................................................................................................... 81
Weak Investment in Uncertain Times: Causes, Implications and Policy Responses .................................................................................................... 191
Chapter 3
Box 1.1 Low-income countries: Recent developments and outlook ........................... 19
Box 1.2 Regional perspectives: Recent developments and outlook ............................. 26
Box 2.1.1 Investment developments and outlook: East Asia and Pacific ..................... 93
Box 2.2.1 Recent investment slowdown: Europe and Central Asia ........................... 109
Box 2.3.1 Recent investment slowdown: Latin America and the Caribbean .............. 126
Box 2.4.1 Recent investment slowdown: Middle East and North Africa ................... 142
Box 2.5.1 Recent investment slowdown: South Asia ............................................... 159
Box 2.6.1 Recent investment slowdown: Sub-Saharan Africa .................................. 173
Box 3.1 Investment-less credit booms ...................................................................... 203
Box 3.2 Implications of rising uncertainty for investment in EMDEs ...................... 209
Box 3.3 Investment slowdown in China .................................................................. 214
Box 3.4 Interactions between public and private investment ................................... 221
Boxes


v
Table of Contents
Chapter 1
Global Outlook: Subdued Growth, Shifting Policies, Heightened Uncertainty .......... 1
Summary .................................................................................................................... 3
Major economies: Recent developments and outlook ................................................... 7
Global trends ............................................................................................................. 12
Emerging and developing economies: Recent developments and outlook ................... 16
Outlook ..................................................................................................................... 25
Risks to the outlook ................................................................................................... 28
Policy challenges ........................................................................................................ 37
References ................................................................................................................. 48
Box 1.1 Low-income countries: Recent developments and outlook ........................... 19
Box 1.2 Regional perspectives: Recent developments and outlook ............................. 26
Special Focus
The U.S. Economy and the World .......................................................................... 57
Introduction .............................................................................................................. 59
Linkages between the United States and the World .................................................... 60
Synchronization of U.S. and global cycles .................................................................. 63
Spillovers from the United States to the global economy ........................................... 65
Spillovers to the United States from the global economy ........................................... 68
Conclusion ................................................................................................................ 70
Annex SF.1 Cyclical spillovers .................................................................................... 73
Annex SF.2 Fiscal policy simulations ......................................................................... 74
References .................................................................................................................. 75
Chapter 2 Regional Outlooks .................................................................................................... 81
East Asia and Pacific ................................................................................................ 83
Recent developments .............................................................................................. 83
Outlook .................................................................................................................. 85
Risks ....................................................................................................................... 87
Policy challenges ..................................................................................................... 88
Box 2.1.1 Investment developments and outlook: East Asia and Pacific .................. 93

Europe and Central Asia ........................................................................................... 99
Recent developments .............................................................................................. 99
Outlook................................................................................................................ 101
Risks .................................................................................................................... 103
Policy challenges ................................................................................................... 104
Box 2.2.1 Recent investment slowdown: Europe and Central Asia ........................ 109
Latin America and the Caribbean ........................................................................... 115
Recent developments ............................................................................................ 115
Outlook................................................................................................................ 119
Risks ..................................................................................................................... 121
Policy challenges ................................................................................................... 121
Box 2.3.1 Recent investment slowdown: Latin America and the Caribbean .......... 126
Middle East and North Africa ................................................................................ 131
Recent developments ............................................................................................ 131
Outlook................................................................................................................ 135
Risks ..................................................................................................................... 136
Policy challenges ................................................................................................... 138
Box 2.4.1 Recent investment slowdown: Middle East and North Africa ............... 142
South Asia ............................................................................................................... 147
Recent developments ............................................................................................ 147
Outlook................................................................................................................ 151
Risks ..................................................................................................................... 153
Policy challenges ................................................................................................... 154
Box 2.5.1 Recent investment slowdown: South Asia ............................................ 159
Sub-Saharan Africa ................................................................................................. 165
Recent developments ............................................................................................ 165
Outlook................................................................................................................ 169
Risks ..................................................................................................................... 171
Policy challenges ................................................................................................... 172
Box 2.6.1 Recent investment slowdown: Sub-Saharan Africa ............................... 173
References................................................................................................................ 180
vi

Weak Investment in Uncertain Times: Causes, Implications and Policy Responses ..................................................................................................... 191
Introduction ............................................................................................................. 193
Main features of the investment slowdown .............................................................. 196
Macroeconomic backdrop ....................................................................................... 199
Factors associated with the investment slowdown ..................................................... 200
Implications of weak investment for global trade, long-term growth and catch-up ... 208
Policies to promote investment growth .................................................................... 213
Conclusions ............................................................................................................ 227
Annex 3.1 Determinants of investment: Empirical framework ................................. 228
Annex 3.2 Definitions and Methodology ................................................................. 233
References ................................................................................................................ 235
Box 3.1 Investment-less credit booms ....................................................................... 203
Box 3.2 Implications of rising uncertainty for investment in EMDEs ...................... 209
Box 3.3 Investment slowdown in China .................................................................. 214
Box 3.4 Interactions between public and private investment .................................... 221
Chapter 3
Figures
1.1 Summary - Global prospects ................................................................ 5
1.2 Summary - Global risks and policy challenges. .................................... 6
1.3 Advanced-economy growth and in6ation ........................................... 7
1.4 United States ....................................................................................... 8
1.5 Euro Area ............................................................................................ 9
1.6 Japan ................................................................................................. 10
1.7 China ................................................................................................ 11
1.8 Global trade ...................................................................................... 12
1.9 Global 4nancial conditions ............................................................... 14
1.10 Financial conditions in EMDEs ........................................................ 15
1.11 Commodity markets ......................................................................... 16
1.12 EMDE developments ........................................................................ 17
1.1.1 Growth and poverty indicators in low-income countries .................... 20
1.1.2 Macroeconomic and financial developments in low-income countries ........................................................................................... 22
Statistical Appendix ......................................................................................................................... ..245
vii

1.1.3 Vulnerabilities and policy uncertainty in low-income countries ........... 23
1.13 EMDE prospects ................................................................................. 25
1.2.1 Regional growth .................................................................................. 27
1.14 Risks to global growth ......................................................................... 29
1.15 Risks - Policy uncertainty and protectionism ...................................... 30
1.16 Risks - EMDE vulnerabilities ............................................................. 32
1.17 Risks - Volatility around U.S. tightening cycle .................................... 33
1.18 Risks - Low global interest rates and 4nancial instability ..................... 34
1.19 Risks - Weakening potential growth ................................................... 35
1.20 Upside risk - fiscal stimulus in major economies and growth spillovers ................................................................................. 37
1.21 Advanced-economy monetary policies ................................................. 38
1.22 Advanced-economy 4scal policies ........................................................ 39
1.23 Advanced-economy structural policies ................................................. 39
1.24 China 4nancial and structural policies ................................................ 40
1.25 EMDE monetary and 4nancial policies .............................................. 41
1.26 EMDE 4scal policies ........................................................................... 42
1.27 Services trade in EMDEs .................................................................... 43
1.28 Foreign direct investment in EMDEs .................................................. 44
1.29 Investment in human and physical capital ........................................... 45
1.30 Impact of growth and inequality on poverty reduction ....................... 46
SF.1 United States in the global economy .................................................. 59
SF.2 United States in global financial markets ............................................ 60
SF.3 Linkages between the United States and EMDE regions ..................... 61
SF.4 U.S. trade flows: Composition and partners ....................................... 62
SF.5 U.S. financial flows: Composition and partners .................................. 63
SF.6 The U.S. economy and commodity markets ...................................... 64
SF.7 Synchronization of business and financial cycles ................................. 65
SF.8 Spillovers from U.S. growth shocks ..................................................... 66
SF.9 Spillovers from U.S. interest rate shocks to EMDEs ........................... 67
SF.10 Spillovers from U.S. uncertainty shocks to EMDEs ........................... 68
SF.11 Importance of the global economy for the U.S. economy .................... 69
2.1.1 Growth ............................................................................................... 84
2.1.2 China: Activity, exchange rates, and external accounts......................... 85
viii

2.1.3 EAP region: Selected indicators ........................................................... 86
2.1.4 EAP region: Selected indicators (continued) ....................................... 87
2.1.5 Vulnerabilities ..................................................................................... 88
2.1.6 Risk of uncertainty in major advanced economies ............................... 89
2.1.7 Spillovers from the United States and the Euro Area ........................... 90
2.1.8 Policy challenges ................................................................................. 91
2.1.1.1 Investment growth .............................................................................. 94
2.1.1.2 Investment growth slowdown and investment needs ........................... 95
2.1.1.3 Infrastructure indicators ...................................................................... 96
2.1.1.4 Health and education ........................................................................ 97
2.2.1 Growth ............................................................................................. 100
2.2.2 Country developments ...................................................................... 101
2.2.3 Policy responses to lower oil prices and growth ................................. 102
2.2.4 Risks of heightened policy uncertainty in major advanced economies ........................................................................................ 103
2.2.5 Vulnerabilities ................................................................................... 104
2.2.6 Policy challenges ............................................................................... 105
2.2.1.1 Investment growth slowdown in Europe and Central Asia, 2010-15 ............................................................................................ 109
2.2.1.2 Investment decomposition, 2010-15 ................................................. 110
2.2.1.3 Investment gaps and projects ............................................................ 111
2.2.1.4 Infrastructure indicator ..................................................................... 112
2.2.1.5 Human development indicators ........................................................ 113
2.2.1.6 Institutional quality .......................................................................... 114
2.3.1 Growth ............................................................................................ 116
2.3.2 Financial sector ................................................................................. 117
2.3.3 Banking systems................................................................................ 118
2.3.4 Inflation and monetary policy ........................................................... 118
2.3.5 Fiscal policy ...................................................................................... 119
2.3.6 External sector .................................................................................. 120
2.3.7 Unemployment and earnings ............................................................ 120
2.3.8 Regional outlook .............................................................................. 121
2.3.9 Risks of uncertainty in major advanced economies ........................... 122
2.3.10 Spillovers from the United States and the Euro Area ........................ 123
ix

2.3.1.1 Investment growth slowdown .......................................................... 127
2.3.1.2 Correlates of investment growth slowdown ...................................... 128
2.3.1.3 Investment needs ............................................................................. 129
2.4.1 Growth ............................................................................................ 132
2.4.2 External and fiscal positions ............................................................. 133
2.4.3 Egypt: Balance of payment pressures ................................................ 133
2.4.4 Inflation ........................................................................................... 134
2.4.5 Financial conditions in GCC............................................................ 134
2.4.6 Growth outlook ............................................................................... 135
2.4.7 Fiscal adjustment .............................................................................. 136
2.4.8 Major risks to the outlook ................................................................ 136
2.4.9 Risks of uncertainty in major advanced economies ........................... 137
2.4.10 Spillovers from the United States and the Euro Area ....................... 138
2.4.11 Policy challenges ............................................................................... 139
2.4.1.1 Investment growth slowdown ........................................................... 143
2.4.1.2 Infrastructure, health, and education indicators ................................ 144
2.5.1 Economic activity in South Asia ....................................................... 148
2.5.2 Economic activity in India................................................................ 149
2.5.3 External sector developments ............................................................ 150
2.5.4 Exchange rate and inflation developments ........................................ 151
2.5.5 Fiscal developments .......................................................................... 151
2.5.6 Vulnerabilities .................................................................................. 153
2.5.7 Risks of uncertainty in major advanced economies ........................... 154
2.5.8 Spillovers from the United Sates and the Euro Area .......................... 155
2.5.9 Policy challenges ............................................................................... 156
2.5.1.1 Investment growth slowdown in South Asia ..................................... 160
2.5.1.2 Investment needs in South Asia ........................................................ 162
2.6.1 Growth ............................................................................................ 166
2.6.2 External developments ...................................................................... 167
2.6.3 Inflation and exchange rates ............................................................. 168
2.6.4 Fiscal developments .......................................................................... 169
2.6.5 Outlook for economic growth .......................................................... 170
2.6.6 Risks of uncertainty in major advanced economies ........................... 171
x

2.6.1.1 Investment growth slowdown .......................................................... 176
2.6.1.2 Investment needs ............................................................................. 178
3.1 Investment growth slowdown .......................................................... 194
3.2 Investment growth slowdown: Group-specific and regional dimensions ..................................................................................... 196
3.3 Investment growth after global downturns ...................................... 197
3.4 Economies with investment growing below its long-term average .... 197
3.5 Investment growth forecasts ............................................................ 198
3.6 Global financial conditions and activity .......................................... 198
3.7 Terms of trade and investment growth ............................................ 199
3.8 FDI flows and investment growth ................................................... 200
3.9 Political stability and investment growth ......................................... 201
3.10 Private debt and investment growth ................................................ 201
3.11 Correlates of investment growth ...................................................... 202
3.1.1 Investment growth during credit booms and deleveraging episodes .......................................................................................... 204
3.1.2 Coincidence between investment surges and credit booms .............. 205
3.1.3 Output growth during credit booms and deleveraging episodes ....... 206
3.12 Spillovers from the United States and the Euro Area ....................... 208
3.2.1 Evolution of uncertainty in EMDEs ............................................... 209
3.2.2 Financial market uncertainty and investment in EMDEs ................ 210
3.2.3 Policy uncertainty and investment in EMDEs .................................. 211
3.13 Slowdown in investment and global trade ....................................... 212
3.14 Labor productivity, TFP and investment ......................................... 213
3.3.1 Investment growth in China ........................................................... 216
3.3.2 Spillovers from China ..................................................................... 217
3.15 Public and private investment ......................................................... 219
3.16 Public investment and growth ......................................................... 220
3.17 Fiscal and monetary policy space ..................................................... 220
3.4.1 Public and private investment growth ............................................. 222
3.4.2 Comparison of public and private investment growth with long-term average ........................................................................... 223
3.18 Infrastructure, education, and health investment needs ................... 225
3.19 Investment and governance reform ................................................. 227
xi

1.1 Real GDP .............................................................................................. 4
1.1.1 Low income country forecasts ............................................................. 24
Annex 1 List of emerging market and developing economies ............................ 47
2.1.1 East Asia and Pacific forecast summary ................................................ 90
2.1.2 East Asia and Pacific country forecasts ................................................. 90
2.2.1 Europe and Central Asia forecast summary ........................................ 106
2.2.2 Europe and Central Asia country forecasts ......................................... 107
2.3.1 Latin America and the Caribbean forecast summary .......................... 124
2.3.2 Latin America and the Caribbean country forecasts ........................... 125
2.4.1 Middle East and North Africa forecast summary ............................... 140
2.4.2 Middle East and North Africa economy forecasts .............................. 141
2.5.1 South Asia forecast summary ............................................................. 157
2.5.2 South Asia country forecasts .............................................................. 158
2.6.1 Sub-Saharan Africa forecast summary ................................................ 173
2.6.2 Sub-Saharan Africa country forecasts ................................................. 174
Annex 3.1.1 Correlates of investment growth ........................................................ 231
Annex 3.1.2 Robustness: Bayesian Model Averaging ............................................. 231
Annex 3.2.1 Investment growth around governance reform spurts and setbacks .... 234
Tables
xii

Chapters 1 and 2 were led by Carlos Arteta. Chapter 1 (Global Outlook) was prepared by Carlos Arteta and Marc Stocker with contributions from Csilla Lakatos, Ekaterine Vashakmadze, and Dana Vorisek. Additional inputs were provided by John Ba2es, Sinem Kilic Celik, Jongrim Ha, Raju Huidrom, Gerard Kambou, Eung Ju Kim, Hideaki Matsuoka, and Modeste Some. Research assistance was provided by Xinghao Gong, Liwei Liu, Trang �i �uy Nguyen, and Peter Davis Williams.
�e Special Focus (�e U.S. Economy and the World) was prepared by M. Ayhan Kose, Csilla Lakatos, Franziska Ohnsorge, and Marc Stocker with contributions from Carlos Arteta, John Ba2es, Jongrim Ha, Raju Huidrom, Ergys Islamaj, Ezgi O. Ozturk, Hideaki Matsuoka, Naotaka Sugawara, and Temel Taskin. Research assistance was provided by Xinghao Gong, Trang Nguyen, and Peter Davis Williams.
Box 1.1 was prepared by Gerard Kambou and Boaz Nandwa. Box 1.2 was prepared by Derek Chen, Gerard Kambou, Boaz Nandwa, Yoki Okawa, Ekaterine Vashakmadze, and Dana Vorisek.
Chapter 2 (Regional Outlooks) was prepared by several authors. �e authors were Ekaterine Vashakmadze (East Asia and Paci4c), Yoki Okawa and Ekaterine Vashakmadze (Europe and Central Asia), Derek Chen and Dana Vorisek (Latin America and the Caribbean), Dana Vorisek (Middle East and North Africa), Boaz Nandwa (South Asia), and Gerard Kambou (Sub-Saharan Africa). Research assistance was provided by Xinghao Gong, Liwei Liu, Trang Nguyen, Shituo Sun, and Peter Davis Williams.
Chapter 3 (Weak Investment in Uncertain Times: Causes, Implications, and Policy Responses) was prepared by M. Ayhan Kose, Franziska Ohnsorge, Lei Sandy Ye, and Ergys Islamaj, with contributions from Jongrim Ha, Raju Huidrom, Csilla Lakatos, Hideaki Matsuoka, Yoki Okawa, Naotaka Sugawara, Congyan Tan, Ekaterine Vashakmadze and Shu Yu. Research assistance was provided by Mai Anh Bui, Collette Wheeler, Yiruo Li, Liwei Liu, and Cristhian Vera Avellan. Box 3.1 (Investment-less credit booms) was prepared by Shu Yu; Box 3.2 (Implications of Rising Uncertainty for Investment in EMDEs) was prepared by Jongrim Ha, Raju Huidrom, and Congyan Tan; Box 3.3 (Investment Slowdown in China) was prepared by Ekaterine Vashakmadze, Hideaki Matsuoka, and Trang Nguyen; Box 3.4 (Interactions between Public and Private Investment) was prepared by Yoki Okawa.
Modeling and data work were provided by Hideaki Matsuoka, assisted by Mai Anh Bui, Xinghao Gong, Cristhian Javier Vera Avellan, Jungjin Lee, Liwei Liu, Trang Nguyen, Shituo Sun, Collette Mari Wheeler, and Peter Davis Williams.
�e online publication was produced by a team including Graeme Littler, Praveen Penmetsa, Mikael Reventar, and Katherine Rollins, with technical support from Marjorie Patricia Bennington. Phillip Hay and Mark Felsenthal managed media relations and the dissemination. �e print publication was produced by Maria Hazel Macadangdang, Adriana Maximiliano, and Ianara Costa Pedrosa Mota Pinto.
Many reviewers o2ered extensive advice and com-ments. �ese included: Kishan Abeygunawardana,
Acknowledgments
)is World Bank Group Flagship Report is a product of the Prospects Group in the Development
Economics Vice Presidency. )e project was managed by M. Ayhan Kose and Franziska
Ohnsorge, under the general guidance of Paul Romer.
xiii

Magda Adriani, Abebe Adugna Dadi, Sara Alnashar, Paloma Anos Casero, Kiatipong Ariyapruchya, Konstantin Atanesyan, Sarah Nankya Babirye, Marina Bakanova, Luca Bandiera, Mary A. Barton-Dock, Davaadalai Batsuuri, Hans Anand Beck, Olivier Beguy, Robert Carl Michael Beyer, Guillermo Raul Beylis, Enrique Blanco Armas, Monika Blaszkiewicz-Schwartzman, Elena Bondarenko, Eduardo Borensztein, Andrew Burns, Maurizio Bussolo, César Calderón, Kevin Carey, Jasmin Chakeri, Shubham Chaudhuri, Jean-Pierre Chau2our, Laura Chioda, Ajai Chopra, Ibrahim Saeed Chowdhury, Karl Kendrick Tiu Chua, Kevin Chua, Punam Chuhan-Pole, Kevin Clinton, Maria Andreina Clower, Andrea Coppola, Tito Cordella, Gerardo M. Corrochano, Damir Cosic, Kevin �omas Garcia Cruz, Barbara Cunha, Stefano Curto, Somneuk Davading, Nancy Sabina Davies-Cole, Annette De Kleine Feige, Ruth Delgado Flynn, Agim Demukaj, Allen Dennis, Shantayanan Devarajan, Viet Tuan Dinh, Ndiami Diop, Calvin Zebaze Djiofack, Doerte Doemeland, Mariam Dolidze, Ralph Van Doorn, Jozef Draaisma, Bakyt Dubashov, Sebastian Eckardt, Kim Alan Edwards, Christian Eigen-Zucchi, Khalid El Massnaoui, Olga Emelyanova, Jorge Familiar Calderon, Marianne Fay, Maria Marta Ferreyra, Manuela V. Ferro, Erik Feyen, Norbert Matthias Fiess, Fitria Fitrani, Cornelius Fleischhacker, Samuel Freije-Rodriguez, Mismake D. Galatis, Laura So4a Olivera Garrido, Adnan Ashraf Ghumman, Frederico Gil Sander, Fernando Giuliano, Anastasia Golovach, Alvaro Gonzalez, Maria De los Angeles Cuqui Gonzalez Miranda, David Michael Gould, Poonam Gupta, Gohar Gyulumyan, Sabine Hader, Kiryl Haiduk, Lea Hakim, Keith Hansen, Birgit Hansl, Marek Hanusch, Wissam Harake, Caroline Heider, Jesko S. Hentschel, Marco Hernandez, Santiago Herrera, Sandra Hlivnjak, Bert Hofman, Sahar Hussain, Zahid Hussain, Stella Ilieva, Fernando Gabriel Im, Yoichiro Ishihara, Ivailo V. Izvorski, Evans Jadotte, Carlos Felipe Jaramillo, Mohammad Omar Joya, Kamer Karakurum-Ozdemir, Leszek Pawel Kasek, Vera Kehayova,
Tehmina Khan, Zarau Wendeline Kibwe, Mizuho Kida, Edith Kikoni, Markus Kitzmüller, David Knight, Friederike Norma Koehler, Naoko C. Kojo, Auguste Tano Kouame, Chandana Kularatne, Diana Mercedes Lachy Castillo, Jean-Pierre Lacombe, Jacqueline Larrabure Rivero, �omas Blatt Laursen, Eric Le Borgne, Daniel Lederman, Taehyun Lee, Joseph Louie C. Limkin, John Litwack, Sodeth Ly, Julio Ricardo Loayza, Julie Saty Lohi, Rohan Longmore, J. Humberto Lopez, David Cal MacWilliam, Sanja Madzarevic-Sujster, Sandeep Mahajan, William Maloney, Miguel Eduardo Sanchez Martin, Ashwaq Natiq Maseeh, Oliver Masetti, Gianluca Mele, Rhodora Mendoza Paynor, Dino Merotto, Elitza Alexandrova Mileva, Deepak K. Mishra, Saiyed Shabih Ali Mohib, Lars Moller, Lalita M. Moorty, Rafael Munoz Moreno, Lili Mottaghi, Nataliya Mylenko, Evgenij Najdov, Antonio Nucifora, Harun Onder, Felix Oppong, Carlos Rafael Orton Romero, Lucy Pan, Ugo Panizza, John Panzer, Catalin Pauna, Keomanivone Phimmahasay, Samuel Jaime Pienknagura, Miria A. Pigato, Rong Qian, Habib Nasser Rab, Martin Raiser, Martin Rama, Nadir Ramazanov, Julio Revilla, David Robinson, Alberto Rodriguez, David Rosenblatt, Michele Ruta, Pablo Saavedra, Yaye Seynabou Sakho, Apurva Sanghi, Ilyas Sarsenov, Cristina Savescu, Marc Tobias Schi2bauer, Philip Schuler, Claudia Paz Sepulveda, Lazar Sestovic, Sudhir Shetty, Altantsetseg Shiilegmaa, Joana C.G. Silva, Rosalie Singson Dinglasan, Gregory Smith, Karlis Smits, Nikola Spatafora, Abdoulaye Sy, Congyan Tan, Fulbert Tchana Tchana, Shakira Binti Teh Sharifuddin, Mark �omas, Hans Timmer, Augusto de la Torre, Eskender Trushin, Christoph �eodor Friedrich Ungerer, Ekaterina Ushakova, Robert Johann Utz, Julio Velasco, Mathew Verghis, Gallina Andronova Vincelette, Muhammad Waheed, Jan Walliser, Hernan Winkler, Kei-Mu Yi, Ayberk Yilmaz, Hoda Youssef, Albert Zeufack, Luan Zhao, May �et Zin, and Bakhrom Ziyaev. Regional Projections and write-ups were produced in coordination with country teams, country directors, and the oRces of the regional chief economists.
xiv

AE
ASEAN
bbl
BRICS
CAREC
CDS
CY
EAP
EBRD
ECA
ECB
EIB
EMBI
EMDE
EU
FDI
FOMC
FY
GCC
GDP
GEP
GST
IMF
LAC
LIC
MNA
MXEM
NPLs
OECD
OPEC
PMI
PPP
PVAR
RHS
SAR
SOE
SSA
Abbrevia�ons Advanced economies
Association of Southeast Asian Nations
barrel
Brazil, Russian Federation, India, China, and South Africa
Central Asia Regional Economic Cooperation
credit default swap
calendar year
East Asia and Pacific
European Bank for Reconstruction and Development
Europe and Central Asia
European Central Bank
European Investment Bank
Emerging Markets Bond Index
emerging markets and developing economies
European Union
foreign direct investment
Federal Reserve Open Market Committee
fiscal year
Gulf Cooperation Council
gross domestic product
Global Economic Prospects
goods and services tax
International Monetary Fund
Latin America and Caribbean
low-income country
Middle East and North Africa
MSCI Emerging Markets Index
nonperforming loans
Organisation for Economic Co-operation and Development
Organization of the Petroleum Exporting Countries
purchasing managers’ indexes
purchasing power parity
panel vector autoregression
right-hand side (in figures)
South Asia Region
state-owned enterprise
Sub-Saharan Africa
xv

STRI
TFP
VAR
WEO
WITS
WTI
WTO
services trade restrictiveness index
total factor productivity
vector autoregression
World Economic Outlook
World Integrated Trade Solution
West Texas Intermediate
World Trade Organization
xvi

Execu�ve Summary
Global Outlook: Subdued Growth, Shifting
Policies, Heightened Uncertainty. Stagnant
global trade, subdued investment, and heightened
policy uncertainty marked another diRcult year
for the world economy. Global growth in 2016 is
estimated at a post-crisis low of 2.3 percent and is
projected to rise to 2.7 percent in 2017. Growth
in emerging market and developing economies
(EMDEs) is expected to pick up in 2017,
re6ecting receding obstacles to activity in
commodity exporters and continued solid
domestic demand in commodity importers. Weak
investment and productivity growth are, however,
weighing on medium-term prospects across many
EMDEs. Downside risks to global growth include
increasing policy uncertainty in major advanced
economies and some EMDEs; 4nancial market
disruptions; and weakening potential growth.
However, 4scal stimulus and other growth-
enhancing policies in key major economies—in
particular, the United States—could lead to
stronger-than-expected activity and thus represent
a substantial upside risk to the outlook. In view of
limited room for macroeconomic policy to absorb
further adverse shocks, as well as subdued growth
prospects, structural reforms that boost potential
growth remain a priority. In EMDEs, investment
in human and physical capital would help narrow
unmet needs in skills and infrastructure and
support growth for the long term. Rebuilding
Stagnant global trade, subdued investment, and heightened policy uncertainty marked another difficult year for
the world economy. A moderate recovery is expected for 2017, with receding obstacles to activity in commodity
exporters and solid domestic demand in commodity importers. Weak investment is weighing on medium-term
prospects across many emerging markets and developing economies (EMDEs). Although fiscal stimulus in major
economies, if implemented, may boost global growth above expectations, risks to growth forecasts remain tilted
to the downside. Important downside risks stem from heightened policy uncertainty in major economies.
xvii
policy space, addressing vulnerabilities, and
enhancing international integration by promoting
trade and foreign direct investment would also
boost resilience and improve growth prospects.
Regional Perspectives. EMDE regions with
substantial numbers of commodity-importing
economies—East Asia and the Paci4c and South
Asia—are projected to experience solid growth. In
contrast, the outlook for EMDE regions with
large numbers of commodity exporters is mixed.
Growth in Latin America and the Caribbean and
in Europe and Central Asia is expected to
accelerate in 2017, mainly re6ecting a bottoming
out of activity in Brazil and Russia. Growth in the
Middle East and North Africa will pick up
modestly, as oil prices recover. While growth
should also rebound in Sub-Saharan Africa, the
improvement is notably weaker than previously
expected, as some commodity exporters struggle
to adjust to low commodity prices.
7ematic pieces: Role of the U.S. Economy in
the World; Weak Investment in EMDEs. �is
edition of Global Economic Prospects includes a
special focus on the role of the U.S. economy in
the world and a chapter on the causes,
consequences and policy implications of recent
investment weakness in EMDEs.
7e U.S. Economy and the World.
Developments in the U.S. economy, the world’s

largest, have e2ects far beyond its shores. A surge
in U.S. growth—whether due to expansionary
4scal policies or other reasons—could provide a
signi4cant boost to the global economy.
Tightening U.S. 4nancial conditions—whether
due to faster-than-expected normalization of U.S.
monetary policy or other reasons—could
reverberate across global 4nancial markets, with
adverse e2ects on some EMDEs that rely heavily
on external 4nancing. In addition, lingering
uncertainty about the course of U.S. economic
policy could have a signi4cantly negative e2ect on
global growth prospects. While the United States
plays a critical role in the world economy, activity
in the rest of the world is also important for the
United States. �e new U.S. administration’s
speci4c economic policies are still being shaped.
By assessing the U.S. economy’s role in the world,
the objective of this Special Focus is to inform the
analysis of potential global implications of such
policies.
Weak Investment in Uncertain Times: Causes,
Implications and Policy Responses. Investment
growth in EMDEs has slowed sharply since 2010.
�is deceleration has been most pronounced in
the largest emerging markets and commodity-
exporting EMDEs, but has now spread to the
xviii
majority of these economies: investment growth is
below its long-term average in the most EMDEs
over the past quarter century except during serious
global downturns. �ese economies account for
more than one-third of global GDP and about
three-quarters of the world’s population and the
world’s poor. While slowing investment growth is
partly a correction from high pre-crisis growth
rates in some EMDEs, it also re6ects a range of
obstacles holding back investment: terms-of-trade
shocks (for oil exporters), slowing foreign direct
investment in6ows (for commodity importers), as
well as private debt burdens and political risk (for
all EMDEs). Weak investment is a signi4cant
challenge for EMDEs in light of their sizable
investment needs to make room for expanding
economic activity, to accommodate rapid
urbanization, and to achieve sustainable
development goals. Sluggish investment also sets
back future growth prospects by slowing the
accumulation of capital and productivity growth.
Although policy priorities depend on country
circumstances, including the availability of policy
space and economic slack, policymakers should be
ready to employ the full range of cyclical and
structural policies to accelerate investment
growth.

CHAPTER 1
Subdued Growth, Shifting Policies, Heightened Uncertainty
GlobAl oUTlook


CHAPTER 1 GLOBAL ECONOMIC PROSPECTS | JANUARY 2017 3
Summary
Stalling global trade, weak investment, and heightened policy uncertainty have depressed world economic activity. Global growth is estimated to have fallen to 2.3 percent in 2016—the weakest performance since the global financial crisis and 0.1 percentage point below June 2016 Global Economic Prospects forecasts (Figure 1.1). Global growth is expected to rise to 2.7 percent in 2017, mainly reflecting a recovery in emerging market and developing economies (EMDEs).
Advanced economies continue to struggle with subdued growth and low inflation in a context of increased uncertainty about policy direction, tepid investment, and sluggish productivity growth. Activity decelerated in the United States and, to a lesser degree, in some other major economies. As a result, advanced-economy growth is now estimated to have slowed to 1.6 percent in 2016, a downward revision of 0.1 percentage point. Advanced-economy growth is expected to recover somewhat, to an average pace of 1.8 percent throughout the forecast period. In the United States, manufacturing activity is expected to
rebound, contributing to a modest pickup in growth from 1.6 percent in 2016 to an average of 2.2 percent in 2017-18. This forecast does not incorporate the effects of policy proposals by the new U.S. administration, as their scope and ultimate form are still uncertain. Fiscal stimulus, if implemented, could result in stronger growth outcomes than currently predicted. In the Euro Area and Japan, supportive monetary policies will help stimulate activity throughout the forecast period. Inflation is expected to rise gradually, but it will remain below central banks’ target in the Euro Area and Japan throughout the forecast horizon.
Anemic growth in advanced economies was accompanied by a further weakening of global trade in 2016. Mitigating these headwinds, commodity prices have stabilized and are projected to increase moderately during 2017-19, providing support for commodity-exporting EMDEs. The rise in U.S. yields since early November has led to a notable tightening of financing conditions for EMDEs, in some cases resulting in significant currency depreciation and portfolio outflows. Despite this tightening, financing conditions still remain generally benign, as major central banks maintain accommodative monetary policies.
EMDEs grew at an estimated 3.4 percent in 2016, broadly in line with previous expectations. Commodity exporters as a group continued to expand at markedly lower rates than commodity
Stagnant global trade, subdued investment, and heightened policy uncertainty marked another difficult year for the world economy. Global growth in 2016 is estimated at a post-crisis low of 2.3 percent and is projected to rise to 2.7 percent in 2017. Growth in emerging market and developing economies (EMDEs) is expected to pick up in 2017, reflecting receding obstacles to activity in commodity exporters and continued solid domestic demand in commodity importers. Weak investment and productivity growth are, however, weighing on medium-term prospects across many EMDEs. Downside risks to global growth include increasing policy uncertainty in major advanced economies and some EMDEs, financial market disruptions, and weakening potential growth. However, fiscal stimulus in key major economies—in particular, the United States—could lead to stronger-than-expected activity in the near term and thus represent a substantial upside risk to the outlook. In view of the limited room for macroeconomic policy to absorb further adverse shocks, as well as subdued growth prospects, structural reforms that boost potential growth remain a priority. In EMDEs, investment in human and physical capital would help narrow unmet needs in skills and infrastructure and support growth for the long term. Rebuilding policy space, addressing vulnerabilities, and enhancing international integration by promoting services trade and foreign direct investment would also boost resilience and improve growth prospects.
Note: This chapter was prepared by Carlos Arteta and Marc Stocker, with contributions from Csilla Lakatos, Ekaterine Vashakmadze, and Dana Vorisek. Additional inputs were provided by John Baffes, Sinem Kilic Celik, Jongrim Ha, Raju Huidrom, Gerard Kambou, Eung Ju Kim, Hideaki Matsuoka, and Modeste Some. Research assistance was provided by Xinghao Gong, Liwei Liu, Trang Thi Thuy Nguyen, and Peter Davis Williams.

CHAPTER 1 GLOBAL ECONOMIC PROSPECTS | JANUARY 2017 4
TABLE 1.1 Real GDP1
(percent change from previous year)
2014 2015 2016 2017 2018 2019 2015 2016 2017 2018
Estimates Projections
Percentage point differences from June 2016 projections
World 2.7 2.7 2.3 2.7 2.9 2.9 0.3 -0.1 -0.1 -0.1
Advanced economies 1.9 2.1 1.6 1.8 1.8 1.7 0.3 -0.1 -0.1 -0.1
United States 2.4 2.6 1.6 2.2* 2.1* 1.9* 0.2 -0.3 0.0* 0.0*
Euro Area 1.2 2.0 1.6 1.5 1.4 1.4 0.4 0.0 -0.1 -0.1
Japan 0.3 1.2 1.0 0.9 0.8 0.4 0.6 0.5 0.4 0.1
Emerging and developing economies
(EMDEs) 4.3 3.5 3.4 4.2 4.6 4.7 0.1 -0.1 -0.1 0.0
Commodity exporting EMDEs 2.1 0.4 0.3 2.3 3.0 3.1 0.2 -0.1 0.0 0.0
Other EMDEs 6.0 6.0 5.6 5.6 5.7 5.8 0.1 -0.2 -0.2 -0.1
Other EMDEs excluding China 4.5 5.0 4.3 4.6 5.0 5.1 0.3 -0.4 -0.3 -0.1
East Asia and Pacific 6.7 6.5 6.3 6.2 6.1 6.1 0.0 0.0 0.0 0.0
China 7.3 6.9 6.7 6.5 6.3 6.3 0.0 0.0 0.0 0.0
Indonesia 5.0 4.8 5.1 5.3 5.5 5.5 0.0 0.0 0.0 0.0
Thailand 0.8 2.8 3.1 3.2 3.3 3.4 0.0 0.6 0.5 0.3
Europe and Central Asia 2.3 0.5 1.2 2.4 2.8 2.9 0.6 0.0 -0.1 0.0
Russia 0.7 -3.7 -0.6 1.5 1.7 1.8 0.0 0.6 0.1 -0.1
Turkey 5.2 6.1 2.5 3.0 3.5 3.7 2.1 -1.0 -0.5 -0.1
Poland 3.3 3.9 2.5 3.1 3.3 3.4 0.3 -1.2 -0.4 -0.2
Latin America and the Caribbean 0.9 -0.6 -1.4 1.2 2.3 2.6 0.1 -0.1 0.0 0.2
Brazil 0.5 -3.8 -3.4 0.5 1.8 2.2 0.0 0.6 0.7 1.0
Mexico 2.3 2.6 2.0 1.8 2.5 2.8 0.1 -0.5 -1.0 -0.5
Argentina -2.6 2.5 -2.3 2.7 3.2 3.2 0.4 -1.8 -0.4 0.2
Middle East and North Africa 3.3 3.2 2.7 3.1 3.3 3.4 0.4 -0.1 0.0 -0.1
Saudi Arabia 3.6 3.5 1.0 1.6 2.5 2.6 0.1 -0.9 -0.4 0.2
Iran, Islamic Rep. 4.3 1.7 4.6 5.2 4.8 4.5 0.1 0.2 0.3 0.1
Egypt, Arab Rep.2 2.9 4.4 4.3 4.0 4.7 5.4 0.2 1.0 -0.2 0.1
South Asia 6.7 6.8 6.8 7.1 7.3 7.4 -0.2 -0.3 -0.1 0.0
India3 7.2 7.6 7.0 7.6 7.8 7.8 0.0 -0.6 -0.1 0.1
Pakistan2 4.0 4.0 4.7 5.2 5.5 5.8 0.0 0.5 0.7 0.7
Bangladesh2 6.1 6.6 7.1 6.8 6.5 6.7 0.5 0.6 0.5 -0.3
Sub-Saharan Africa 4.7 3.1 1.5 2.9 3.6 3.7 0.1 -1.0 -1.0 -0.7
South Africa 1.6 1.3 0.4 1.1 1.8 1.8 0.0 -0.2 0.0 -0.2
Nigeria 6.3 2.7 -1.7 1.0 2.5 2.5 0.0 -2.5 -2.5 -1.5
Angola 5.4 3.0 0.4 1.2 0.9 0.9 0.2 -0.5 -1.9 -2.5
Memorandum items:
Real GDP1
High-income countries 1.9 2.2 1.6 1.8 1.8 1.7 0.3 -0.1 -0.1 -0.1
Developing countries 4.4 3.6 3.5 4.4 4.8 4.9 0.1 -0.1 -0.1 0.0
Low-income countries 6.2 4.8 4.7 5.6 6.0 6.1 0.0 -0.6 -0.7 -0.6
BRICS 5.1 3.8 4.3 5.1 5.4 5.5 0.0 0.1 0.0 0.1
World (2010 PPP weights) 3.5 3.3 3.0 3.5 3.7 3.7 0.2 -0.1 -0.1 0.0
World trade volume4 3.7 2.8 2.5 3.6 4.0 3.9 0.0 -0.5 -0.3 -0.2
Commodity prices
Oil price5 -7.5 -47.3 -15.1 28.2 8.4 4.6 0.0 4.1 6.3 1.9
Non-energy commodity price index -4.6 -15.0 -2.6 1.4 2.2 2.1 0.0 2.5 -0.9 -0.1
Source: World Bank. Notes: PPP = purchasing power parity. World Bank forecasts are frequently updated based on new information. Consequently, projections presented here may differ from those contained in other Bank documents, even if basic assessments of countries’ prospects do not differ at any given moment in time. Country classifications and lists of Emerging Market and Developing Economies (EMDEs) are presented in Annex Table 1. BRICS include: Brazil, Russia, India, China, and South Africa. 1. Aggregate growth rates calculated using constant 2010 U.S. dollars GDP weights. 2. GDP growth values are on a fiscal year basis. Aggregates that include these countries are calculated using data compiled on a calendar year basis. Pakistan's growth rates are based on GDP at factor cost. The column labeled 2017 refers to FY2016/17. 3. The column labeled 2016 refers to FY2016/17. 4. World trade volume for goods and non-factor services. 5. Simple average of Dubai, Brent, and West Texas Intermediate. For additional information, please see www.worldbank.org/gep.
* The U.S. forecasts do not incorporate the effect of policy proposals by the new U.S. administration, as their overall scope and ultimate form are still uncertain. However, simulations indicate that the large reductions in corporate and personal income taxes suggested by the new administration could—if fully implemented and without consideration of any other policy changes—increase both U.S. GDP growth and global growth above baseline projections in 2017 and 2018. See the “Risks to the outlook” section of Chapter 1 for further details.

CHAPTER 1 GLOBAL ECONOMIC PROSPECTS | JANUARY 2017 5
FIGURE 1.1 Summary - Global prospects
Global growth in 2016 is estimated at a post-crisis low of 2.3 percent. A
moderate recovery is expected in 2017 amid heightened uncertainty.
Growth projections continued to be downgraded for both advanced
economies and emerging market and developing economies (EMDEs),
albeit less than in previous forecast rounds. Global goods trade was
stagnant for most of 2016, while commodity prices are projected to
experience a modest recovery over the forecast period. Among EMDEs,
growth in commodity importers is expected to remain solid, while growth in
commodity exporters is projected to pick up in 2017 from near stagnation
in 2016, helping EMDEs to make their strongest contribution to global
growth since 2013.
B. Contribution to global growth
revisions
E. Growth by country groups
D. Changes in commodity prices C. Global goods trade growth
Sources: CPB Netherlands Bureau for Economic Policy Analysis, World Bank. A.E.F. Shaded area indicates forecasts. Aggregate growth rates and contributions calculated using constant 2010 U.S. dollars GDP weights. B. Contribution to global growth revisions measured in constant 2010 U.S. dollars. Sum of contributions from individual country growth revisions can differ from global growth revisions reported in Table 1.1 due to decimal rounding. C. Global goods trade measured in volume terms. Data start in 1992. Last observation is September 2016. D. Commodity price changes based on actual annual average prices up to 2016 and forecasts for 2017 to 2019.
importers. Growth in commodity exporters for 2016 is estimated at 0.3 percent. Improved performance in some large EMDE exporters—including a more rapid bottoming out in the Russian Federation and an easing in the pace of contraction in Brazil—and an increase in commodity prices from their early-2016 lows offset additional weakness in other exporters, most notably in Sub-Saharan Africa. Meanwhile, commodity importers are estimated to have grown 5.6 percent, reflecting resilient domestic demand, low commodity prices, and generally accommodative macroeconomic policies.
EMDE growth is expected to accelerate to 4.2 percent in 2017 and to an average of 4.7 percent in 2018-19. EMDEs are forecast to contribute 1.6 percentage points to global growth in 2017, accounting for about 60 percent of global growth for the first time since 2013. With the anticipated increases in commodity prices, particularly for oil, the divergence in growth outlooks between commodity exporters and importers is set to narrow. The waning effect of currency depreciations in commodity exporters, and of past declines in energy prices for importers, should also narrow differences in inflation between the two groups. That said, the long-term EMDE outlook is clouded by a number of factors—most prominently, uncertainty about global trade prospects and advanced-economy policies, a weakening in potential output resulting from subdued investment, sluggish productivity growth, and demographic factors.
Within the broader group of EMDEs, growth in low-income countries (LICs) is estimated to have decelerated slightly to 4.7 percent in 2016. Some oil and metal exporters slowed sharply, as they continue to struggle to adjust to low commodity prices. In addition, a number of LICs faced domestic headwinds, including droughts, political tensions, and security challenges. However, many commodity-importing LICs continued to grow solidly. External and domestic conditions should improve gradually, with LICs growth rebounding to 5.6 percent in 2017 and reaching 6.1 percent by 2019.
There is substantial uncertainty around baseline projections (Figure 1.2). For example, while the
A. Global growth
F. Contribution to global growth
0
1
2
3
4
5
20
12
20
13
20
14
20
15
20
16
20
17
20
18
20
19
World Advanced economies EMDEsPercent
-0.12
-0.10
-0.08
-0.06
-0.04
-0.02
0.00
2016 2017 2018
Percentage points
-20
-15
-10
-5
0
5
10
15
20
20
06
20
08
20
10
20
12
20
14
20
16
1992-2008 averagePercent, year-on-year
-70
-50
-30
-10
10
30
50
Energy Metals Agriculture
2014-16
2017-19
Percent
0
2
4
6
8
10
2014
2015
2016
2017
2018
2019
2014
2015
2016
2017
2018
2019
2014
2015
2016
2017
2018
2019
EMDEcommodityimporters
EMDEcommodityexporters
EMDEs
1990-2008 average2003-2008 average
Percent
0.0
0.5
1.0
1.5
2.0
2.5
3.0
3.5
2014 2015 2016 2017 2018 2019
Advanced economies EMDEsPercentage points

CHAPTER 1 GLOBAL ECONOMIC PROSPECTS | JANUARY 2017 6
central forecast for global growth in 2017 is 2.7 percent, there is a 50-percent probability that actual growth will be between 2 percent to 3.2 percent. The materialization of downside risks could derail a fragile global economic recovery. The heightened level of policy uncertainty, especially regarding trade, has been exacerbated by recent political developments—most notably, electoral outcomes in the United States and the United Kingdom. This and other risks—particularly financial market disruptions amid tighter global financing conditions—may be amplified over the medium term by mounting protectionist tendencies, slower potential growth, and elevated vulnerabilities in some EMDEs. However, fiscal stimulus in key major economies could lead to stronger-than-expected activity in the near term and thus represent a substantial upside risk to the outlook—particularly, in the United States, where the new administration has signaled an intention to pursue expansionary fiscal policies, including tax cuts and the facilitation of infrastructure spending.
The sluggish economic outlook underscores the need to implement structural policies that support domestic demand and, especially, reinvigorate investment. In advanced economies, extremely low and negative real equilibrium interest rates constrain the effectiveness of monetary policy and may warrant more supportive fiscal policies. More generally, macroeconomic policies should remain accommodative until evidence of capacity constraints emerge and inflation is on a clear upward trend. In EMDEs, finding an appropriate balance between fiscal adjustment, measures to reduce vulnerabilities, and growth-oriented reforms aimed at raising human capital and physical infrastructure will be challenging for some countries. Policies that boost domestic sources of long-term growth—critically, long-term investment and productivity—are a priority. Investing in human and physical capital will help narrow unmet investment gaps in skills and infrastructure. These policies could be reinforced by efforts to further international integration, such as those that support growth in EMDE services trade, and that create an environment to maximize the benefits of foreign direct investment (FDI).
FIGURE 1.2 Summary - Global risks and policy
challenges
There is substantial uncertainty around global growth projections.
Downside risks to growth include rising policy uncertainty, particularly in
the United States and Europe; financial market disruptions; and growth
disappointments in major economies. In contrast, fiscal stimulus in major
economies—particularly, the United States—represent an important upside
risk. A secular decline in equilibrium interest rates constrains monetary
policy in major advanced economies. In EMDEs, large investment gaps
amid limited fiscal resources remain important challenges.
B. Global policy uncertainty A. Risks to global growth projections
Sources: Conference Board; Consensus Forecasts; Economic Policy Uncertainty; Iwata, Fueda-Samikawa, and Takahashi (2016); Holston, Laubach, and Williams (2016); United Nations Conference on Trade and Development, World Bank. A. The fan chart methodology is described in Ohnsorge, Stocker, and Some (2016). B. Global policy uncertainty as measured in Davis (2016). Based on the frequency of articles in domestic newspapers mentioning economic policy uncertainty. 6-month moving average. Last observation is November 2016. C. Productivity measured as real GDP (in constant USD) per hour worked. D. Five-year ahead Consensus Forecasts. Unweighted averages of 21 EMDEs. Latest available month in the year denoted. Last observation is October 2016. E. Real equilibrium rates for the U.S. and Euro Area estimated by Holston, Laubach, and Williams (2016) and by Iwata, Fueda-Samikawa, and Takahashi (2016) for Japan. The real equilibrium interest rate is the real policy rate that is consistent with full employment, stable prices, and growth at potential. Last observation is 2016Q2. F. “SDG” denotes Sustainable Development Goals. Investment refers to capital expenditure. Operating expenditure is not included. Investment gaps are based on upper bound estimates by UNCTAD (2014).
D. Five–year ahead investment growth
forecasts for EMDEs C. Labor productivity growth
F. SDG-related investment needs E. Real equilibrium interest rates
50
100
150
200
250
300
350
400
200
0
200
2
200
4
200
6
200
8
201
0
201
2
201
4
201
6
Index, Jan. 2000 = 100
0
1
2
3
2003-0
8
2010-1
5
2016
2003-0
8
2010-1
5
2016
2003-0
8
2010-1
5
2016
World Advancedeconomies
EMDEs
1990-2008 averagePercent
0
2
4
6
8
20
10
20
12
20
14
20
16
Percent
-2
-1
0
1
2
3
4
1995 2000 2005 2010 2015
United States Euro Area Japan
Percent
0.0
0.4
0.8
1.2
1.6
Pow
er
Tra
nsp
ort
Tele
com
s
Wa
ter
and
sanitation
Food s
ecurity
Clim
ate
cha
nge
Health
Education
Current investment Investment gap
Percent of global GDP
Fan chart
0
1
2
3
4
5
0
1
2
3
4
5
2015 2016 2017 2018
50 percent
80 percent
90 percent
Baseline
Percent

CHAPTER 1 GLOBAL ECONOMIC PROSPECTS | JANUARY 2017 7
Major economies: Recent
developments and outlook
Advanced economies continue to be afflicted by weak growth and low inflation, amid rising uncertainty about future policy direction. After slowing to 1.6 percent in 2016, growth is projected to recover somewhat in 2017-19, although the range of possible outcomes has significantly widened after the elections in the United States and the United Kingdom’s decision to leave the European Union. In China, projections are unchanged, despite resurfacing concerns about buoyant property markets, as growth slows gradually toward more sustainable levels, with a rebalancing from manufacturing to services.
Across major advanced economies, the deceleration in growth in 2016 to 1.6 percent reflected renewed policy uncertainties, weak external demand, and subdued productivity growth (Figure 1.3). Activity is expected to regain modest momentum in 2017-19, but uncertainty associated with policies of the new administration in the United States and with the United Kingdom’s decision to leave the European Union (Brexit) could significantly influence the growth trajectory of advanced economies. Growth projections for 2017 and 2018 have been revised down for the Euro Area and, especially, for the United Kingdom. For the United States, baseline forecasts for 2017 and 2018 are unchanged from June projections, in the absence of specific details about policy changes to be implemented by the new administration. Whereas constraints to monetary policy have intensified, fiscal policy is likely to play a greater role in the coming years. Weak productivity growth and rising demographic pressures, which weigh on labor supply and could contribute to a lower rate of return on capital, continue to constrain long-term prospects.
United States
Growth in the United States slowed markedly, from 2.6 percent in 2015 to an estimated 1.6 percent in 2016, 0.3 percentage point below previous projections. The U.S. economy was held back in 2016 by soft exports, a continued drawdown in inventories, and a deceleration in
private investment (Figure 1.4). In the run-up to the U.S. elections in November, activity had picked up again, and a further tightening of labor markets had led to slowly rising wage growth. This supported continued gains in real disposable income, which could help deliver a further reduction in poverty rates, following a drop in 2015 (Proctor, Semega, and Kollar 2016).
The outcome of the U.S. elections has made macroeconomic projections more uncertain. Proposals for corporate and personal income tax cuts; infrastructure spending; and shifts in trade, immigration, and regulation policies are likely to have sizable effects on the U.S. outlook—as well as spillovers on the rest of the world (Special Focus).
FIGURE 1.3 Advanced-economy growth and inflation
Subdued productivity growth and rising demographic pressures are
reflected in potential growth that remains well below long-term averages
across major advanced economies. Following weak growth in 2016, a
modest recovery is expected in 2017, but policy uncertainty has increased.
Inflation expectations have recovered appreciably in the United States,
reflecting prospects of significant policy changes, but remain low in the
Euro Area and Japan.
B. Potential output growth A. Labor productivity growth
D. Long-term inflation expectations C. GDP growth
Sources: Bank of Japan (2016), Conference Board, Congressional Budget Office (2016), European Commission (2016), World Bank. A. Annual growth in real GDP per hour worked, in 2015 U.S. dollars. B. Potential growth estimates from the U.S. Congressional Budget Office (2016) for the United States, Bank of Japan (2016) for Japan, and European Commission (2016) for the Euro Area. C. Shaded area indicates forecasts. D. Long-term inflation expectations are derived from 5-year 5-year forward swap rates. Last observation is December 19, 2016.
-1
0
1
2
3
200
3-0
8
201
0-1
5
20
16
200
3-0
8
201
0-1
5
20
16
200
3-0
8
201
0-1
5
20
16
United States Euro Area Japan
1990-2008 averagePercent
0
1
2
3
2003-0
8
2010-1
5
2016
2003-0
8
2010-1
5
2016
2003-0
8
2010-1
5
2016
United States Euro Area Japan
1992-2008 averagePercent
0
1
2
3
201
42
01
52
01
62
01
72
01
82
01
9
201
42
01
52
01
62
01
72
01
82
01
9
201
42
01
52
01
62
01
72
01
82
01
9
United States Euro Area Japan
1990-2008 average
2003-2008 averagePercent
-1
0
1
2
3
4
20
10
20
11
20
12
20
13
20
14
20
15
20
16
United States Euro Area Japan
Percent

CHAPTER 1 GLOBAL ECONOMIC PROSPECTS | JANUARY 2017 8
FIGURE 1.4 United States
Growth slowed in 2016, held back by weak exports and investment.
However, the U.S. labor market remained resilient and wage growth
accelerated. Policy uncertainty has increased substantially following the
elections; if it persists, it could have potential knock-on effects on
investment. Baseline forecasts do not incorporate the effects of policy
proposals by the new administration, as their scope is still uncertain.
Productivity has been stagnant in recent years, constraining potential
output growth. Despite generally subdued activity, unemployment and
inflation continued to move closer to policy objectives, signaling further
policy normalization.
B. Wage growth A. Contributions to GDP growth
D. Impact of a 10-percent rise in
economic policy uncertainty on
U.S. GDP
C. Economic policy uncertainty
Sources: Federal Reserve Bank of Atlanta, Federal Reserve Board, Haver Analytics, U.S. Bureau of Economic Analysis (BEA), U.S. Bureau of Labor Statistics (BLS), World Bank. B. The Employment Cost Index measures the change in the cost of labor, including wages, benefits, and other forms of compensation, free from the influence of employment shifts among occupations and industries. Median wage growth is based on survey data that track the same individuals twelve months apart. It incorporates changes in industry and job title, as these are two important ways for employees to increase their compensation. Last observations are 2016Q3 for the Employment Cost Index, and November 2016 for median wage growth. C. Policy uncertainty as measured in Baker, Bloom, and Davis (2015). Based on the frequency of articles in domestic newspapers mentioning economic policy uncertainty. 7-day moving average shown. Last observation is December 18, 2016. D. The model includes, in this order, the U.S. Economic Policy Uncertainty (EPU) index, U.S. stock price index (S&P 500), U.S. 10-year bond yields, U.S. real GDP and investment growth. Dotted lines denote 16-84 percent confidence bands. E. Average growth of output per hour worked in the non-farm business sector. Last observation is 2016Q3. F. Long-run unemployment is the median long-term projection of the unemployment rate by Federal Open Market Committee members in December 2016. The Fed’s inflation target is 2 percent. The latest observations are November 2016 for unemployment and October 2016 for PCE inflation.
F. Distance to long-run unemployment
and inflation target E. Labor productivity growth
However, their overall scope has not yet been clearly defined; hence, they are not included in baseline projections. While confidence continued to improve in the immediate aftermath of the election, an increase in policy uncertainty, if persistent, could have a dampening effect on investment. Against this backdrop, growth is expected to regain some momentum, reaching 2.2 percent in 2017 and 2.1 percent in 2018. These projections are unchanged from previous forecasts.
As remaining labor market slack is absorbed and policy interest rates approach neutral levels, growth is projected to slow slightly to 1.9 percent in 2019, close to its estimated potential rate. Downward revisions to potential output growth have coincided with further evidence of stagnant productivity (Congressional Budget Office 2016; Federal Open Market Committee 2016). This reflects in part labor force shifts toward lower-productivity service activities, as well as a declining productivity trend within both the manufacturing and services sectors (Vollrath 2016). The most productive firms are growing less rapidly than in the past, while the firm entry rate has declined, and flows in and out of jobs have slowed in the post-crisis period (Decker et al. 2016; Molloy et al. 2016). These factors, combined with slowing gains in educational attainment, might have contributed to a slower pace of productivity growth in recent years (Fernald 2016).
Despite relatively subdued underlying growth, the economy has continued to move closer to the Federal Reserve’s full employment and inflation objectives. The unemployment rate remained slightly below 5 percent in most of the second half of 2016. While labor force participation could recover from current low levels as discouraged workers return to the labor market, demographic pressures make a return of the participation rate to pre-crisis levels unlikely (Aaronson et al. 2014). Following a policy interest rate hike in December 2016, a further normalization of monetary policy is expected throughout the forecast period, as long-term inflation expectations have recovered and growth is predicted to remain above potential. However, the federal funds rate is expected to stabilize over the long run at a lower level than in previous cycles, reflecting further evidence of a
-1
0
1
2
3
4
2014 2015 2016 2017 2018 2019
Exports InvestmentConsumption ImportsGDP growth
Percentage points
0.0
1.0
2.0
3.0
4.0
5.0
2002 2004 2006 2008 2010 2012 2014 2016
Median wage growth
Employment cost index
Percent
-0.6
-0.4
-0.2
0.0
0.2
1 2 3 4 5 6 7 8
quarter
Percentage points
-1.0
-0.5
0.0
0.5
1 2 3 4 5 6 7 8
Quarter
Percentage points
0
1
2
3
4
19
90
19
92
19
94
19
96
19
98
20
00
20
02
20
04
20
06
20
08
20
10
20
12
20
14
20
16
1990-2016 average
Percent, year-on-year, 5-year moving average
-1.6
-1.2
-0.8
-0.4
0.0
0.4
Unemployment Headline inflation
Current
December '15
Percentage points
0
50
100
150
200
250
300
350
400
2010 2011 2012 2013 2014 2015 2016
Index, 100 = average of 2001-present

CHAPTER 1 GLOBAL ECONOMIC PROSPECTS | JANUARY 2017 9
Euro Area
Euro Area growth slowed from 2 percent in 2015 to 1.6 percent in 2016, as both domestic demand and exports lost momentum. Confidence in the Euro Area has been resilient following the United Kingdom’s vote to exit the European Union (EU) in June 2016 (Figure 1.5). The U.S. election results could also heighten policy uncertainty in Europe. A rebound in oil prices, from their trough in early 2016, implies diminished support to real income and private consumption growth relative
FIGURE 1.5 Euro Area
Despite the Brexit vote in June 2016, confidence in the Euro Area has
continued to improve. However, investment rates are low, particularly in
countries that were most affected by the Euro Area debt crisis. Borrowing
costs have eased considerably since the introduction of a negative interest
rate policy in June 2014, but concerns about banking sector profitability
intensified in 2016. Despite further monetary policy accommodation,
headline inflation remains close to zero, and long-term inflation
expectations are still below the European Central Bank’s policy target.
B. Investment rate in selected
countries A. Change in economic sentiment
since Brexit vote
D. Actual inflation and long-term
inflation expectations C. Change in interest rates since the
introduction of negative interest rate
policies in June 2014
Sources: European Central Bank, European Commission, Eurostat. A. European Commission economic sentiment is an average of business climate and consumer confidence indexes. Change from May 2016. Last observation is November 2016. B. Weighted average of investment rates across sub-groups of Euro Area countries. Last observation is 2016Q3. C. Euribor is the Euro interbank offered rate. Loan and mortgage rates are for newly originated lending. The ECB deposit rate is the rate offered to banks on their excess reserves held on deposit at the ECB. The ECB repo rate is the marginal refinancing operations rate that the ECB sets on its repurchase operations in the open market. Percentage point change since May 2014. Last observation is November 2016. D. Long-term inflation expectations are derived from 5-year 5-year forward swap rates. Last observation is November 2016.
persistently low real equilibrium interest rate (Holston, Laubach, and Williams 2016).
The fiscal policy stance is assumed to be broadly neutral to growth in 2017. However, the new administration has signaled intentions to pursue more expansionary fiscal policies, including tax cuts and measures to upgrade infrastructure, which could lead to stronger growth in the short term. In general, a fiscal stimulus of 1 percent of GDP could be expected to raise U.S. GDP by between 0.7 and 1.5 percent after 2 years, depending on the amount of remaining economic slack and the reaction of monetary policy authorities (Laforte and Roberts 2014; Brayton, Laubach, and Reifschneider 2014; Whalen and Reichling 2015).
In terms of the proposals suggested by the new U.S. administration, simulations indicate that the planned reduction in corporate and personal income taxes could—if fully implemented and without consideration for other policy changes—increase U.S. GDP growth projections to 2.2-2.5 percent in 2017 and 2.5-2.9 percent in 2018. Estimates vary depending on the timing of the tax cuts, the reaction of monetary policy authorities, and how businesses and households adjust their expectations to policy changes. Given limited details to date about the overall scope of all fiscal measures that the new administration plans to implement, including plans to stimulate infrastructure investment and cuts in other federal government outlays, it is difficult to rigorously examine their net effect on the outlook for the U.S. economy.1
Changes in business regulations could also support private-sector activity, while a relaxation of environmental standards could have important sectoral implications. If implemented, plans to retreat from trade agreements or to raise tariffs and trade barriers could lead to retaliatory action and have negative effects on the outlook for the U.S. economy. The renegotiation of NAFTA could have particularly significant effects on regional trade and industrial prospects (Noland et al. 2016).
1The “Risks to the outlook” section of this chapter presents further discussion.
1.4
1.5
1.6
1.7
1.8
1.9
2.0
U.K. Euro Area
Change in sentiment index
15
20
25
20
00
20
02
20
04
20
06
20
08
20
10
20
12
20
14
20
16
Greece, Ireland, Italy, Portugal, SpainRest of Euro Area
Percent of GDP
-1.2-1
-0.8-0.6-0.4-0.2
0
Co
rpo
rate
loan
s
Mo
rtga
ge
loan
s
Euri
bo
r
EC
B d
ep
osit
EC
B r
epo
Percent
-1
0
1
2
3
4
20
00
20
02
20
04
20
06
20
08
20
10
20
12
20
14
20
16
Inflation expectationsHeadline inflationECB target
Percent, year-on-year

CHAPTER 1 GLOBAL ECONOMIC PROSPECTS | JANUARY 2017 10
to the 2014-15 period. Investment rates are particularly low in the Euro Area periphery, with increased policy uncertainty likely weighing further on capital spending in 2017. Labor market and credit conditions continued to improve in 2016. Employment recouped its pre-crisis levels, and the unemployment rate ebbed further, albeit from elevated levels and with wide cross-country variations.
Negative policy interest rates, combined with large-scale asset purchase programs by the European Central Bank, led to a noticeable easing of borrowing costs and generally had a positive effect on lending flows (Arteta et al. 2016;
Rostagno et al. 2016). However, renewed concerns about banking sector profitability and elevated non-performing loans in some countries (e.g., Italy) could continue to constrain Euro Area credit and contribute to market volatility. Despite ongoing monetary policy easing, headline and core inflation remain significantly below target. The longer this undershooting continues, the greater the risk of inflation expectations becoming de-anchored from policy objectives (Łyziak and Paloviita 2016). Fiscal policy was slightly expansionary in 2016 partly as a result of refugee-related outlays, but is expected to be broadly neutral to growth in 2017. Fiscal sustainability concerns remain in a number of countries, although debt services costs declined in most Euro Area countries, thanks to the exceptionally low interest rates across the maturity spectrum.
Uncertainty about the Brexit process is expected to weigh on growth in 2017-18 in the United Kingdom and, to a lesser extent, in the Euro Area. Growth in the Euro Area in 2017 is projected to slow marginally to 1.5 percent, as the unwinding of the income boost associated with lower oil prices, increased policy uncertainties, and lingering banking sector concerns offset the benefit of more favorable financial conditions. Growth is expected to remain broadly stable in 2018 and 2019, at 1.4 percent, leading to a very gradual narrowing of the output gap.
Japan
Following the release of new and revised national accounts data, growth in Japan is now estimated at 1 percent for 2016. Investment and exports were generally weak, while private consumption showed some signs of improvement after two years of contraction. Labor shortages underlay a modest increase in wage growth; however, the gains were dampened by low inflation expectations and a rising share of part-time employment (Figure 1.6). In September 2016, the Bank of Japan changed its policy focus from a quantitative target for government bond purchases to a more flexible approach aimed at stabilizing long-term interest rates around zero. The decision could help alleviate constraints associated with the increased scarcity of bonds eligible for purchase by the
FIGURE 1.6 Japan
Wage growth continued to be dampened by a rising share of part-time
workers. With the Bank of Japan already holding around 40 percent of
government debt, the central bank decided to shift its policy focus towards
a stabilization of long-term interest rates around zero. The appreciation of
the yen during most of 2016 put downward pressure on profit margins for
exporters. To support growth, the government announced a series of fiscal
stimulus measures, including new public spending amounting to 1.2
percent of GDP.
B. Bank of Japan holdings of
government debt A. Full-time and part-time employment
D. Discretionary fiscal measures C. Exchange rate and export prices
Sources: Bank of Japan; Haver Analytics; Ministry of Finance; Ministry of Health, Labor and Welfare. A. 12-month moving average. Last observation is October 2016. B. Data include bonds for fiscal investment and loan program as well as central government securities. Last observation is 2016Q3. C. An increase in the nominal effective exchange rate denotes an appreciation. Last observation is November 2016. D. Budgeted additional discretionary expenditure from the central government.
0
10
20
30
40
50
60
70
20
00
20
02
20
04
20
06
20
08
20
10
20
12
20
14
20
16
Percent of central government securities
Percent of GDP
Percent
70
80
90
100
110
120
130
2010 2012 2014 2016
Export price (in yen)Export price (in contract currency)Nominal effective exchange rate
Index, 100 in 2010
0
1
2
3
4
Aug
-08
Oct-
08
Dec-0
8
Apr-
09
Dec-0
9
Sep
-10
Oct-
10
Oct-
11
Nov-1
2
Ja
n-1
3
Dec-1
3
Dec-1
4
Nov-1
5
Aug
-16
Percent of GDP
90
100
110
120
130
20
10
20
11
20
12
20
13
20
14
20
15
20
16
Full-time Part-time
Index, Jan. 2010=100

CHAPTER 1 GLOBAL ECONOMIC PROSPECTS | JANUARY 2017 11
central bank, and at the same time mitigate adverse effects of negative long-term yields on financial institutions (Arslanalp and Botman 2015; Iwata et al. 2016). Despite the policy shift, the yen appreciated in the earlier part of 2016. Since Japanese exports are often denominated in destination currencies, this dampened profits and investment in 2016. However, the yen depreciated rapidly towards the end of the year, paring most of its earlier gains.
To support growth, the government announced a series of measures. These included postponement of a planned consumption tax hike (from April 2017 to October 2019) and a fiscal stimulus package, with new public spending amounting to 1.2 percent of GDP. This new spending is expected to add around 0.3 percentage point to growth in 2017.
Overall, growth projections for 2017 and 2018 have been revised up—to 0.9 percent and 0.8 percent, respectively—but remain constrained by the low growth potential implied by a shrinking and aging labor force and heightened policy uncertainty in major trading partners. This, in turn, contributes to diminished expectations, which negatively affect investment spending as well as fiscal and monetary policy effectiveness. Growth is projected to slow to 0.4 percent in 2019, mainly resulting from the planned consumption tax hike.
China
Growth in China is estimated to have slightly decelerated to 6.7 percent in 2016. As part of ongoing economic rebalancing, growth has been concentrated primarily in services, while industrial production has stabilized at moderate levels (Figure 1.7; Zhang 2016). The internal rebalancing is also evident on the demand side: consumption growth has been strong, while investment growth has continued to moderate from the post-crisis peak (Lardy and Huang 2016). The decline in investment growth was concentrated in the private sector; investment by the non-private sector accelerated in 2016. Fiscal and credit-based stimulus measures supported growth in 2016, focusing on
infrastructure investment and on efforts to stimulate household credit.
Credit growth, which has been moderating since late 2015, stabilized during 2016 but remained well above the pace of nominal GDP growth. On the back of a continued real estate boom, loans to households accounted for an increasing share of credit extension in 2016. Reflecting household lending activity, household debt to GDP has surpassed 40 percent of GDP, up almost 10 percentage points over the past three years (BIS 2016). While credit growth to the industrial sector has moderated, the stock of credit to the non-financial corporate sector continued to rise, reaching 170 percent of GDP in 2016.
Partly as a result of real estate lending, housing prices reached new heights, especially in major
FIGURE 1.7 China
Growth in China slowed slightly in 2016 and continues to rebalance from
industry to services. Investment growth has continued to decelerate
from post-crisis peaks, with its drivers shifting to policy-induced
infrastructure investment. Credit growth moderated but still surpasses
nominal GDP growth.
B. Contribution to fixed-asset
investment growth A. GDP growth
D. Contribution to GDP growth C. Contribution to loan growth
Sources: China National Bureau of Statistics, Haver Analytics, World Bank. A. Last observation is 2016 Q3. B. State-owned and holding refers to either state-owned enterprises or enterprises whose shares are owned by both public and private sectors. 2016YTD refers to data up to November 2016. C. Non-financial enterprises include both public and private enterprises. 2016 is the average of January to November 2016. D. Shaded area indicates forecasts.
0
5
10
15
20
25
30
35
200
5
200
6
200
7
200
8
200
9
201
0
201
1
201
2
201
3
201
4
201
5
201
6Y
TD
State-owned and holding Private
Percentage points
0
2
4
6
8
10
12
14
16
2013 2014 2015 2016
Overseas loans
Non-financial enterprises
Households
Percentage points
-2
0
2
4
6
8
10
12
20
11
20
12
20
13
20
14
20
15
20
16
20
17
20
18
20
19
Net exportsGross capital formationConsumption expenditureAverage GDP growth 1990-2015
Percentage points
0
2
4
6
8
10
12
14
16
201
0
201
1
201
2
201
3
201
4
201
5
201
6Q
3
Industry Services GDP
Percent, year-on-year

CHAPTER 1 GLOBAL ECONOMIC PROSPECTS | JANUARY 2017 12
cities (Chen, Wang, and Liuc 2015). In 2016, prices rose more than 30 percent in Shanghai, Shenzhen, and Xiamen, although they showed signs of stabilization in recent months, reflecting tighter property regulations. Producer price deflation came to halt as input prices stabilized, but CPI inflation remained below the central bank’s 3-percent target throughout 2016.
Despite some easing, capital outflows from Chi- na remained sizable and continued to put downward pressure on the currency. During 2016, the renminbi depreciated around 7 percent against the U.S. dollar and around 5 percent in nomi- nal trade-weighted terms. These movements
notwithstanding, the renminbi remains markedly above its 2005 level in trade-weighted terms and broadly in line with fundamentals. The renminbi was added to the basket of currencies that make up the International Monetary Fund’s Special Drawing Right in October 2016.
Growth is projected to moderate to 6.5 percent in 2017 and to 6.3 percent in 2018-19, reflecting soft external demand, heightened uncertainty about global trade prospects, and, critically, slower private investment. Macroeconomic policies are expected to continue supporting activity to help smooth the adjustment of output in overcapacity sectors (World Bank 2016a). Rebalancing from industry to services, and from investment to consumption, is expected to moderate. Progress in reducing financial excesses will likely be modest, barring deep structural reforms with respect to state-owned enterprises (SOEs) and corporate restructuring (IMF 2016a).
Global trends
Global trade growth slowed further in 2016 to its weakest pace since the global financial crisis. Soft imports from major economies continued to depress trade flows, compounded by structural factors and increased protectionism. Financial market conditions for EMDEs, which were generally benign for most of 2016, tightened significantly following the U.S. elections. Commodity prices stabilized in the course of 2016, and are expected to gradually recover. Heightened policy uncertainty in the United States and Europe is likely to weigh on global trade and capital flows.
Global trade
Global trade growth in 2016 recorded its weakest performance since the global financial crisis. Stagnant goods trade for most of 2016 (Figure 1.8) was exacerbated by a cyclical drawdown in inventories across advanced economies and contracting imports in China and in major commodity exporters. The sharp drop in oil prices from mid-2014 to early 2016 could have contributed to the weakness in global trade over that period, as income losses were highly concentrated among a few countries, while gains
FIGURE 1.8 Global trade
Global goods trade volumes stagnated in the first half of 2016, reflecting
softening demand from advanced economies and still-contracting imports
from major commodity exporters. Weak investment growth has also
contributed to subdued capital goods trade. The slowdown in global value
chain integration seems to have intensified in recent years, contributing to
a lower income elasticity of trade. A gradual recovery in global trade is still
expected in 2017 and 2018, but at a weaker pace compared to its long-
term performance partly due to a less favorable policy environment.
B. Global capital goods trade and
investment
A. Global goods trade growth
D. Import volume growth C. Global value chain growth
Sources: CPB Netherlands Bureau for Economic Policy Analysis, Haugh et al. (2016), World Bank, World Trade Organization. A. Average of global merchandise imports and exports. Last observation is September 2016. B. Capital goods trade and gross fixed capital formation expressed in current U.S. dollars. Trend line shows the pre-crisis (2003-08) trend of the average of capital goods trade. C. Global value chain growth indicator as computed by Haugh et al. (2016) is a partial measure of participation in global value chains based on import values of intermediate goods, divided by the value of final domestic demand. The indicator is cyclically adjusted. D. Shaded area indicates forecasts. Goods and services import growth consistent with national accounts data. Aggregate growth rates calculated using constant 2010 U.S. dollars GDP weights.
50
100
150
200
250
300
350
200
0
200
1
200
2
200
3
200
4
200
5
200
6
200
7
200
8
200
9
201
0
201
1
201
2
201
3
201
4
201
5
Capital goods trade
Gross fixed capital formation
Pre-crisis trend
Index, 2000=100
-1
0
1
2
3
4
5
6
19
91-2
00
0
20
01-2
00
5
20
06-2
01
0
20
11-2
01
5
Percent
-6
-4
-2
0
2
4
6
8
20
14
20
15
20
16
20
17
20
18
20
14
20
15
20
16
20
17
20
18
20
14
20
15
20
16
20
17
20
18
20
14
20
15
20
16
20
17
20
18
World Advancedeconomies
EMDECommodityexporters
EMDECommodityimporters
1990-2008 averagePercent
-20
-10
0
10
20
30
2010 2012 2014 2016
Volume Value
Percent Dotted line: 1992-2008 average

CHAPTER 1 GLOBAL ECONOMIC PROSPECTS | JANUARY 2017 13
were diffused among many—import demand is generally more sensitive to large changes in income than to smaller changes (World Bank 2015a). The observed slowdown in global investment in 2015-16 played an important role as well, as capital goods account for about one third of world goods trade.
Structural forces at work include a slower pace of trade liberalization and of global value chain integration (Constantinescu, Mattoo, and Ruta 2016a). In an environment of weak global trade, stagnant real income gains in major advanced economies, and marked currency movements between major reserve currencies, protectionism has been slowly rising. For example, in 2016, G20 countries have taken more trade-restrictive measures than trade-facilitating ones (Evenett and Fritz 2016). Although subsidies and trade safeguard measures are still by far the most common forms of trade distortion, there has been a shift toward more opaque measures, such as localization requirements, export incentives, and other trade finance measures. The appetite for further trade liberalization has waned, particularly among major advanced economies, which in turn appears to have contributed to the global trade slowdown more than the rise in tempo- rary trade barriers (Constantinescu, Mattoo, and Ruta 2015).
The maturation of global value chains also contributed to a lower income elasticity of trade (the additional trade generated by an increase in global GDP). This trend, which had been observed prior to the global financial crisis, has intensified in recent years (OECD 2016a; Crozet, Emlinger, and Jean 2015; Haugh et al. 2016). Among major advanced economies, the slowdown in global value chain participation is particularly visible in the United States and Japan. Among EMDEs, China’s move toward more mature domestic intermediate production has also contributed in lowering its trade elasticity (Kee and Tang 2015). However, most EMDEs still have a large untapped potential to move up the value chain, by shifting to more complex and higher domestic value-added products (Taglioni and Winkler 2016; Ferrantino and Taglioni 2014).
Services trade continued to show greater resilience than goods trade because of its nature. Services cannot be stored, often represent a fixed cost in production processes, and are less sensitive to changes in credit and trade finance conditions (Borchert and Mattoo 2010; Ariu 2016).
A gradual recovery in global trade is still expected in 2017 and 2018, supported by a projected rebound in import demand from large EMDEs. However, the pace of the recovery is slower than previously expected because of downward revi-sions to growth prospects in major advanced econ-omies, persistent weakness in global investment, and slower or stalled trade liberalization amid un-certainty about trade policy in the United States and Europe.
Financial markets
While capital inflows to EMDEs generally recov-ered in 2016, a rapid increase in U.S. bond yields and an appreciation of the U.S. dollar following the U.S. elections led to a sudden tightening of financing conditions for EMDEs toward the end of 2016. In some cases, this tightening lead to sig-nificant currency depreciations, portfolio outflows, and slowing debt issuance.
The sudden rise in U.S. yields reflected an uptick in long-term inflation expectations and prospects of a faster normalization of U.S. monetary policy, which contributed to a recovery in term premiums from previous record-low levels (Figure 1.9). U.S. long-term yields increased to the highest levels since September 2014, although they remained below post-Taper Tantrum peaks in 2013-14. In contrast, expectations of continued monetary policy accommodation by the European Central Bank and the Bank of Japan put downward pressure on global bond yields and term premiums for most of 2016 (Hordahl, Sobrun, and Tuner 2016). By the end of 2016, bond yields up to a five-year maturity were still negative in economies accounting for nearly 20 percent of global GDP.
Prior to November 2016, record-low advanced-economy interest rates contributed to a resump-tion of capital flows to emerging markets, reinforced by a stabilization in commodity prices.

CHAPTER 1 GLOBAL ECONOMIC PROSPECTS | JANUARY 2017 14
This led to renewed appetite for emerging market assets and to a drop in sovereign credit spreads, benefiting in particular large commodity exporters (Figure 1.10). EMDE spreads have tightened since November 2016, but remained notably below levels prevailing at the start of the year. Demand for higher-yielding debt securities during 2016 has led many EMDEs, particularly oil exporters facing declining fiscal revenues and rising deficits, to issue foreign-currency debt. During the first three quarters of the year, strong issuance activity in Latin America and the Caribbean, Europe and Central Asia, and the Middle East and North Africa offset reductions in Sub-Saharan Africa, where access and cost of primary bond issuances remained severely constrained. Sovereign bond issuance by EMDEs has slowed appreciably since the U.S. elections, while corporate bond issuance generally remained weak throughout 2016.
FDI flows to EMDEs remained subdued throughout 2016, albeit with significant differences across commodity importers and exporters. Among commodity exporters, persistently low commodity prices have reduced the attractiveness of investment in mining and
exploration and have reduced the profits and reinvested earnings that supported past inflows. FDI growth is now well below long-term averages in both commodity-importing and commodity-exporting regions. Subdued FDI flows to commodity exporters add to external financing needs at a time when fiscal and current account positions are already under pressure. FDI flows to large commodity importers were generally resilient in 2016. In sum, capital flows to EMDEs recovered some ground during the first three quarters of 2016, following the post-crisis lows reached at the end of 2015, but stayed subdued by historical standards and showed renewed signs of weakness toward the end of the year.
EMDEs could continue to face challenging financial market conditions amid rising global bond yields, a strong U.S. dollar, and heightened policy uncertainty. However, capital inflows are still projected to recover modestly in 2017, assuming improved growth prospects among commodity exporters, rising commodity prices, and a gradual normalization of U.S. policy in-terest rates.
The benefit for FDI from continued liberalization measures in some large EMDEs, as well as an expected pick-up in mergers and acquisitions, may be partly offset by heightened policy uncertainty in the United States and Europe as investors brace themselves for downside risks. Portfolio and short-term debt flows could be supported by a stabilization in credit ratings for EMDEs, assuming low (albeit gradually increasing) global interest rates and a continued recovery in commodity prices. In contrast, cross-border syndicated bank lending to EMDEs is likely to remain feeble, reflecting tighter lending standards driven by de-risking, regulatory changes, and weak bank profitability. Unconventional monetary policies designed to support domestic lending in some advanced economies might also have had unintentionally negative effects on cross-border bank flows (Forbes, Reinhardt, and Wieladek 2016). Despite a projected recovery, capital inflows as a percent of EMDE GDP should remain significantly below averages over the 2000-08 and 2010-14 periods.
FIGURE 1.9 Global financial conditions
U.S. long-term yields increased markedly towards the end of 2016,
reflecting prospects of further monetary policy normalization and a rebound
in term premiums. However, U.S. and global bond yields remain low by
historical standards. Amid expectations of continued monetary policy
accommodation in the Euro Area and Japan, bond yields up to 5-year
maturity remain negative in countries that account for nearly 20 percent of
global GDP.
B. Share of world GDP with negative
interest rates
A. U.S. term premium and policy rate
expectations
Sources: Bloomberg, Federal Reserve Bank of New York, World Bank. A. Shows the decomposition of 10-year U.S. Treasury bond yields into policy rate expectations and a term premium based on a five factor no arbitrage yield curve model. See Adrian, Crump, and Moench (2016) for more detail. Last observation is December 19, 2016. B. Share of world real GDP (in 2010 US$) accounted for by economies with negative policy rates and 5-year government bond yields. Monthly averages. Last observation is December 19, 2016.
0
10
20
30
Jan-14 Jan-15 Jan-16 Latest
Policy rate 5-year bond yield
Percent of world GDP
-1
0
1
2
3
4
5
6
20
00
20
02
20
04
20
06
20
08
20
10
20
12
20
14
20
16
10-year average policy rate expectations10-year term premium
Percent

CHAPTER 1 GLOBAL ECONOMIC PROSPECTS | JANUARY 2017 15
Commodities
Crude oil prices have recovered from a low of $30 per barrel (bbl) at the start of 2016, but are still half of their pre-2015 levels (Figure 1.11). The oil market continues to rebalance, as consumption rises while non-OPEC supply declines—notably in the United States, where oil output is down 12 percent from its peak in early 2015. However, global oil inventories remain high, particularly in the United States. After averaging $43/bbl in 2016—an annual decline of 15 percent relative to 2015, despite the gradual increase throughout the year—oil prices are expected to average $55/bbl in 2017, up 28 percent from 2016 levels.
Following two years of unrestrained output to gain market share, OPEC decided at its November meeting to limit production to 32.5 million barrels per day (mb/d) in the first half of 2017—down 1.2 mb/d from October 2016 production levels—with the possibility of an extension of this limit for the remainder of the year. This decision represented the first agreed production cut by OPEC since 2008. In a subsequent meeting in early December, eleven non-OPEC countries pledged to cut nearly 0.6 mb/d, with Russia expected to account for about half of the reduction. If implemented in full, these agreements could help bring crude oil inventories back to historical balance during the first half of 2017. If the cuts are sustained into the second half of 2017, stock draws could lead to tighter market conditions. Nevertheless, formal commodity agreements in the past had limited ability to influence market conditions over extended periods of time (Baffes et al. 2015; World Bank 2016b). The possibility of partial compliance and the possibility of higher production from Libya and Nigeria could result in a more gradual drawdown of oil inventories throughout 2017.
OPEC’s ability to guide global oil prices higher will likely be challenged by the presence of unconventional oil producers, notably U.S. shale oil, which can respond rapidly to changing market conditions (Special Focus). Rising prices have already led to a rebound in shale drilling, and U.S. production is expected to bottom in 2017. Moreover, average costs have fallen markedly in
recent years because of efficiency gains and managerial improvements, leading to expectations of a sizable increase in U.S. shale activity once oil prices reach $60/bbl.
As the stock overhang is expected to gradually unwind, oil prices are projected to increase from $43/bbl in 2016 to $55/bbl in 2017. This represents an uptick from June projections, when oil prices for 2016 and 2017 were forecast to reach $41/bbl and $50/bbl, respectively. The outcome of the U.S. election might also lead to some policy-induced changes in energy market fundamentals, but such changes are likely to be
FIGURE 1.10 Financial conditions in EMDEs
A sudden rise in U.S. bond yields since early November led to a renewed
tightening of external financing conditions for EMDEs and, in some cases,
significant currency depreciations and portfolio outflows. Prior to the end-
year sell-off, the demand for EMDE assets was sustained for most of 2016,
and sovereign bond spreads remained below levels prevailing at the start
of the year. International bond issuance increased significantly in Latin
America and the Caribbean and in the Middle East and North Africa. While
capital flows to EMDEs recovered some ground during 2016, they
remained subdued by historical standards.
B. Emerging market bond spreads A. Emerging market currency and
equity indexes
D. Total capital inflows to EMDEs C. EMDE bond issuance
Sources: Bloomberg, Dealogic, J.P. Morgan, MSCI, World Bank. A. Currencies refers to the J.P. Morgan Emerging Markets Currency Index. Equities are the MSCI Emerging Markets Index. Commodities are the Standard and Poor’s GSCI Commodities Index. Last observation is December 19, 2016. B. For each country, the EMBI bond spread is calculated as the average spread of the country’s sovereign debt over their equivalent maturity U.S. Treasury bond. Median across each country groups. Last observation is December 15, 2016. C. EAP is East Asia and the Pacific, ECA is Eastern Europe and Central Asia, LAC is Latin America and the Caribbean, MNA is the Middle East and North Africa, SAR is South Asia, and SSA is Sub-Saharan Africa. Includes sovereign and corporate international bond issuance. D. Total capital inflows consistent with BPM6 balance of payments data. Last observation 2016Q2.
200
300
400
500
600
700
Jan
-14
Jul-
14
Jan
-15
Jul-
15
Jan
-16
Jul-
16
Commodity importers
Non-oil commodity exporters
Oil exporters
Basis points
0
20
40
60
80
100
120
LAC EAP MNA ECA SAR SSA
July-November
January-June
US$, billions
20162015
-2
0
2
4
6
8
10
2010 2012 2014 2016
ChinaCommodity importers ex. ChinaCommodity exportersTotal2000-2016 average
Percent of GDP
40
50
60
70
80
90
100
110
Jan
-14
Jul-
14
Jan
-15
Jul-
15
Jan
-16
Jul-
16
Commodity pricesCurrenciesEquities
Index, Jan. 1, 2014 = 100

CHAPTER 1 GLOBAL ECONOMIC PROSPECTS | JANUARY 2017 16
limited. Less strict environmental regulation in the United States could potentially contribute to lower oil prices, while geopolitical uncertainty could make oil prices more volatile. Further disruptions among politically-stressed producers (Iraq, Libya, Nigeria, and República Bolivariana de Venezuela, with the latter holding the world’s largest reserves) could exert additional upward pressures.
Metals prices have risen from lows in early 2016 on strong demand, partly from China’s stimulus to the property and construction sectors. Supply reductions for a few commodities—including zinc and nickel—have also been a factor. Average annual metals prices dropped in 2016, but are expected to rise marginally in 2017 as markets slowly tighten. Metals price risks depend critically on demand from China, given that the country
accounts for more than half of global metals consumption. Supply risks entail further outages in Asia, and China’s attempt to reduce excess capacity in steel, aluminum, and coal. The direction of U.S. policies after the elections might also induce some volatility in metal prices. Greater emphasis on infrastructure could lead to higher metal consumption in the United States, putting some upward pressure on prices; however, more protectionist trade policies might negatively affect metals demand, particularly from China.
Agricultural prices are projected to remain broadly stable in 2016 and 2017. Supplies for most commodities are adequate. Fears of supply disruptions in the Southern Hemisphere earlier in the year due to La Niña have diminished.2 Stocks for the three key grains (maize, wheat, and rice) are at multi-year highs. Global crop conditions have improved for most grains and oilseeds. Since agricultural production is energy-intensive, lower energy costs continued to have a dampening effect on prices in 2016. In addition, low oil prices reduce the incentive to divert land use away from food to biofuels. Indeed, global biofuel production grew at an annual rate of just 1 percent in the past 2 years, versus 17 percent during the preceding decade (World Bank 2016c). However, the expected recovery in energy prices in 2017 could halt these downward pressures.
Emerging and developing
economies: Recent
developments and outlook
EMDEs grew by an estimated 3.4 percent in 2016, slightly below June projections. Among commodity exporters, output expanded an estimated 0.3 percent, as some improvement in Brazil and Russia and a modest increase in commodity prices was offset by further weakness in other exporters. In commodity importers, growth in 2016 is estimated at 5.6 percent, reflecting resilient domestic demand and generally accommodative macroeconomic policies.
2La Niña is characterized by unusually cold ocean temperatures in the Equatorial Pacific, compared to El Niño, which is characterized by unusually warm ocean temperatures in the same region. La Niña often follows El Niño.
FIGURE 1.11 Commodity markets
Commodity prices stabilized over the course of 2016, and are expected to
gradually recover in 2017-19. The U.S. oil rig count has shown signs of
bottoming out, following a rebound in oil prices. Agricultural prices are
projected to remain broadly stable, with global stocks of the three key
grains at multi-year highs.
B. Changes in commodity prices A. Commodity prices
D. Stock-to-use ratios C. U.S. oil rig count and oil price
Sources: Baker Hughes, Bloomberg, U.S. Department of Agriculture, World Bank. A. Latest observation is November 2016. B. Commodity prices represent actual data up to 2016 and forecasts from 2017 to 2019. C. Last observation is December 16, 2016. D. Stock-to-use ratios denote the ratio of ending stocks to domestic consumption and represent a measure of how well supplied the market is. The last observation (2016-17 crop year) reflects the December 2016 U.S. Department of Agriculture update.
-70
-50
-30
-10
10
30
50
Energy Metals Agriculture
2014-16
2017-19
Percent
0
300
600
900
1,200
1,500
1,800
25
50
75
100
125
150
20
07
20
08
20
09
20
10
20
11
20
12
20
13
20
14
20
15
20
16
Oil price, WTI (LHS)US oil rig count (RHS)
Rig countUS$/bbl
0.1
0.2
0.3
0.4
Maize Wheat Rice
Range 2013-16 2016Ratio
40
60
80
100
120
140
160
180
2008 2010 2012 2014 2016
Energy Agriculture MetalsIndex, nominal term, 2010=100

CHAPTER 1 GLOBAL ECONOMIC PROSPECTS | JANUARY 2017 17
EMDE growth is projected to pick up to 4.2 percent in 2017 and to an average of 4.7 percent in 2018-19, mainly on a recovery in commodity exporters supported by a gradual increase in commodity prices. However, a number of factors—including advanced-economy policy uncertainty and slowing productivity growth—are expected to weigh on the medium- and long-term EMDE outlook.
Recent developments
Growth in EMDEs reached an estimated 3.4 percent in 2016, slightly below June forecasts and the subdued pace in 2015, and well below the long-term average of 4.4 percent. Weak global trade was offset by some pickup in domestic demand and, for most of 2016, by generally benign financing conditions—although the latter experienced a substantial tightening toward the end of the year, reflecting an appreciation of the U.S. dollar and a rise in global bond yields. The marked divergence between commodity exporters and importers continued, although with notable variations within each group (Figure 1.12). Reflecting these divergences, growth in commodity importers in 2016 accounted for almost the totality of EMDE growth.
Commodity-exporting EMDEs
Low commodity prices and weak global trade continue to create challenging conditions for commodity-exporting EMDEs (Reinhart, Rogoff, and Trebesh 2016). This group grew by an estimated 0.3 percent in 2016, markedly below the long-term average of 2.8 percent. Relative to June projections, growth in these economies has been slightly downgraded, as improvements in some of the largest exporters—most notably Russia and Brazil—and a modest increase in commodity prices were offset by further weakness in other exporters.
Growth in commodity-exporting EMDEs in 2016 was supported by some stabilization in domestic demand, following a contraction in 2015. Private consumption continued to contract in Brazil and Russia, but at a slowing pace as confidence improved. Investment also contracted again in 2016, especially in Brazil, Colombia, and Russia. More generally, subdued investment across
commodity exporters reflected policy tightening, weakness in extractive sectors, soft growth prospects, political and policy uncertainty, and continued adjustment to the earlier terms-of-trade shock (Chapter 3). In contrast, investment growth picked up in several exporters in East Asia and
FIGURE 1.12 EMDE developments
Commodity exporters grew much more slowly than commodity importers in
2016, with the latter accounting for most of the estimated aggregate EMDE
growth rate of 3.4 percent. In commodity importers, growth continued to be
supported by solid domestic demand. Although investment growth is
stronger in commodity importers than in exporters, it is below long-term
averages in more than half of all countries within both sub-groups.
B. Contribution to EMDE growth A. GDP growth
D. Growth in EMDE commodity
exporters (excluding BRICS) C. Contribution to GDP growth
Sources: Haver Analytics, International Monetary Fund, World Bank. A. Weighted averages of GDP growth. Last observation is 2016Q3. B. Commodity importers exclude China and India. Commodity exporters exclude Russia and Brazil. D. Growth is simple average of each country groups excluding BRICS. Gray bars denote inter-quartile ranges. E. Weighted averages. Includes 28 EMDEs with available quarterly data. Long-term averages start in 1991 for EMDEs and are based on annual data. Last observation is 2016Q2. F. Long-term averages are country-specific for 1990-2008.
F. Share of EMDEs with investment
growth below its long-term average E. EMDE investment growth
-2
0
2
4
6
8
10
12
2003-08 2010-14 2015 2016
IndiaRussiaCommodity exportersCommodity importersChinaBrazilAverage 1990-2008 growth
Percentage points
-6
-2
2
6
10
2011
2012
2013
2014
2015
2016
2011
2012
2013
2014
2015
2016
2011
2012
2013
2014
2015
2016
Commodityexporters
Commodityimporters (ex.
China)
EMDE
Exports Investment
Consumption Imports
Percent
0
2
4
6
2015
2016
2015
2016
2015
2016
2015
2016
EMDEcommodityexporters
EMDEenergy
exporters
EMDE metalexporters
EMDEagricultureexporters
Percent
0
5
10
15
20
10
20
11
20
12
20
13
20
14
20
15
20
16
EMDEs1990-2008 average2003-08 average
Percent, year-on-year
0
20
40
60
80
1002
01
0
201
1
201
2
201
3
201
4
201
5
Commodity exporters
Commodity importers
Share = 50
Percent of countries
-2
0
2
4
6
8
10
201
1
201
2
201
3
201
4
201
5
201
6
Commodity exportersCommodity importersCommodity importers ex. China
Percent, year-on-year

CHAPTER 1 GLOBAL ECONOMIC PROSPECTS | JANUARY 2017 18
Pacific, Eastern Europe and Central Asia, and Latin America and the Caribbean.
Variations in growth among commodity exporters in 2016 reflected the pace of policy adjustment to low commodity prices and country-specific domestic challenges (Gervais, Schembri, and Suchanek 2016). In general, because of the sharper and more recent decline in their terms of trade, growth in energy exporters (Angola, Azerbaijan, Kazakhstan, Nigeria) fell well behind that in metal and agriculture exporters (Ethiopia, Kenya, Peru, Tanzania, Uganda).
Although Brazil and Russia, which together account for about two-fifths of commodity-exporting EMDE output, suffered a second consecutive year of recession in 2016, they have been showing signs of improvement. In Russia, the stabilization in oil prices and the authorities’ policy response—exchange rate adjustment, banking sector capital and liquidity injections—improved the short-term outlook, helped restore confidence, and stabilized the financial system (IMF 2016b; World Bank 2016d). In Brazil, a rebound in confidence following moves to alleviate political uncertainty, combined with improved terms of trade, helped to slow the pace of output contraction (IMF 2016c).
In general, growth was resilient in more diversified commodity exporters, which avoided severe growth slowdowns in 2016 (Chile, Colombia, Costa Rica, Indonesia, Kenya, the Kyrgyz Republic, Malaysia, Myanmar, Peru, Tajikistan, Tanzania, Uganda, Uzbekistan). In many of these countries, various favorable domestic and external factors helped absorb shocks and support their current recovery (Gervais et al. 2016). These include flexible exchange rates, moderate inflation, policy buffers, access to concessional sources of financing, robust foreign direct investment, and stronger growth in their main trading partners. In some cases, greater fiscal space (Chile, Peru) provided more room for stimulus in response to slowing growth (IMF 2016d). In several countries, previous policy tightening helped improve confidence and policy credibility (Indonesia, Malaysia). These factors, combined with relatively benign external financing conditions for most of 2016, helped ease pressures on exchange rates and
asset prices and allowed some central banks (Armenia, Indonesia, Malaysia, the Kyrgyz Republic) to move to a policy easing cycle.
In contrast, growth decelerated sharply in 2016 in a number of exporters in Sub-Saharan Africa (Angola, Chad, the Democratic Republic of Congo, Nigeria, Mozambique, South Africa, Zimbabwe), Latin America and the Caribbean (Argentina, Ecuador), Middle East and North Africa (Bahrain, Saudi Arabia), Europe and Central Asia (Azerbaijan, Kazakhstan), and East Asia and Pacific (Mongolia, Papua New Guinea). Incomplete policy adjustment to the global commodity price shock in some countries was compounded by country-specific domestic challenges, including droughts and security issues (Nigeria, South Africa).
Balance of payment pressures, currency weakness, and high inflation prompted these countries to embark on or continue policy tightening in the second half of 2016 despite soft economic activity (Azerbaijan, Angola, Nigeria, Mozambique, Mongolia—IMF 2016e; IMF 2016f). After heavy reserve losses, several large oil exporters with tightly managed exchange rates (Azerbaijan, Angola, Kazakhstan, Nigeria) allowed their exchange rates to weaken in 2015-16 (Horton et al. 2016; Lariau et al. 2016). Fiscal retrenchment supported external adjustment in the less diversified oil exporters, including the Gulf Cooperation Council (Alan et al. 2012; Behar and Fouejieu 2016). Growth in these countries is now held back by contractions in non-oil activity, which had previously been supported by public investment (Azerbaijan, Saudi Arabia—IMF 2015a). As a result, labor market and job prospects have deteriorated in a range of commodity exporters.
Commodity-importing EMDEs
In commodity-importing EMDEs, growth is estimated at 5.6 percent in 2016—a slight downgrade from June projections and below its long-term average of 6.1 percent. Growth in commodity-importing EMDEs excluding China—a group that accounts for about one third of EMDE output—is estimated to have decelerated to a still-solid 4.3 percent in 2016,

CHAPTER 1 GLOBAL ECONOMIC PROSPECTS | JANUARY 2017 19
BOX 1.1 Low-income countries: Recent developments and outlook
Growth in low-income countries (LICs) remained subdued in 2016, slowing marginally to an estimated rate of 4.7 percent.
Low commodity prices, adverse weather conditions, and political and security difficulties were significant factors holding
back output in various countries. Growth slowed among commodity exporters, while remaining unchanged from 2015 for
commodity importers. Despite some modest improvement in 2016, commodity prices are expected to remain low, and fiscal
adjustment needs remain large in commodity-exporting LICs, putting an additional damper on their growth. Overall
growth in LICs is expected to recover moderately, to 5.6 percent in 2017 and 6.0 percent a year in 2018-19, as commodity
exporters continue to adjust. Risks to the outlook remain tilted to the downside. The main external risk is that the modest
expected increase in commodity prices might not materialize, while the main domestic risks lie in worsening drought
conditions and deterioration in political and security situations. Maintaining macroeconomic stability and boosting per
capita growth remain key policy challenges.
Subdued growth. GDP growth in LICs in 2016 is estimated to have edged down to 4.7 percent (Figure 1.1.1). Low commodity prices, adverse weather conditions, and political and security challenges were factors that continued to take a toll in various countries. Severe weather conditions caused a sharp fall in agricultural production in some countries (Ethiopia, Haiti, Malawi, Mozambique, Rwanda, Uganda), destroyed infrastructure in some cases (Haiti), and contributed to food insecurity (Ethiopia, Malawi). The security situation deteriorated notably in Afghanistan and South Sudan.
The slowdown was concentrated in the commodity exporters. GDP contracted in oil exporters (Chad, South Sudan). In Chad, depletion of oil fields exacerbated the negative effects of low oil prices on output, while Boko Haram militant attacks hampered economic activity more broadly. In South Sudan, conflict severely disrupted oil production. Metals exporters struggled, with growth slowing markedly in the Democratic Republic of Congo and Mozambique (Table 1.1.1), as socio-political uncertainties compounded the adverse effects of low metals prices. In Mozambique, the discovery of hitherto undisclosed information on external debt guarantees of the government led to a significant deterioration in investor sentiment. By contrast, growth rebounded in the Ebola-affected countries—Guinea, Liberia, and Sierra Leone—although the recovery was constrained by continued weakness in the price of iron ore, their main export. Per capita GDP growth was barely positive in metals exporting-countries in 2016.
Growth in LIC commodity importers held steady in 2016. These agricultural-based and non-intensive resource economies account for more than two-thirds of LIC output. Among the large economies (Ethiopia, Rwanda, Senegal), growth remained at or above 6 percent, supported by infrastructure investment. Growth was above 5 percent in several other countries, helped by stronger donor aid (Burkina Faso), a gradually improving security situation (Mali), and increased public investment (Togo). However, in a number of fragile countries, growth was feeble (Afghanistan, the Comoros, Malawi), slowed markedly (Nepal), or negative (Burundi). In Afghanistan, droughts and heightened insecurity held back activity. Delays in post-earthquake reconstruction and disruptions in cross-border trade with India adversely affected growth in Nepal. In Haiti, political paralysis and limited access to concessional financing, compounded by heavy flooding and destruction from hurricane Matthew, weighed heavily on growth. Per capita output growth was negative among fragile LICs in 2016.
Easing inflationary pressures. Average inflation in LICs in 2016 was unchanged from 2015, with a slight decline in inflation in commodity importers offsetting an increase in commodity exporters (Figure 1.1.2). Moderate currency movements and increased agricultural production helped stabilize prices in some cases. Inflation rose in the metals exporters as a result of currency depreciations and rising food prices due to drought. Some central banks tightened policy to relieve currency and inflationary pressures. Meanwhile, inflation among oil exporters remained low, reflecting weak domestic demand.
Deteriorating fiscal positions. Overall fiscal balances deteriorated in LICs in 2016. Fiscal deficits widened markedly, relative to GDP, in commodity importers
Note: This box was prepared by Gerard Kambou and Boaz Nandwa. Research assistance was provided by Xinghao Gong.

CHAPTER 1 GLOBAL ECONOMIC PROSPECTS | JANUARY 2017 20
BOX 1.1 Low-income countries: Recent developments and outlook (continued)
FIGURE 1.1.1 Growth and poverty indicators in low-income countries
GDP growth in low-income countries (LICs) slowed to an estimated 4.7 percent in 2016, from 4.8 percent in 2015. GDP
growth was negative in oil exporters, and per capita GDP growth was also negative in the fragile countries, reflecting low
commodity prices, adverse weather conditions, and elevated domestic political uncertainties. LICs’ GDP growth is expected
to recover moderately to 5.6 percent in 2017, and 6.0 percent annually in 2018-19, as commodity prices stabilize, but to
remain lower than the average in 2010-14. LICs need to strengthen growth to improve their human development indicators.
Sources: International Monetary Fund, World Bank. A. Commodity-exporting LICs include oil and metal exporters, namely, Chad, Guinea, Mozambique, Niger, and Congo, Dem. Rep. Commodity-importing LICs include 22 low-income countries for which data are available. Commodity-importing countries comprise agricultural-based and non-resource intensive economies. Shaded gray areas denote forecast period. C.D. Fragility is measured by the Country Policy and Institutional Assessment (CPIA) ratings published annually by the World Bank. Fragile countries had average CPIA scores of 3.2 or less in the years 2013-15. They include: Afghanistan, Burundi, Chad, the Comoros, Congo, Dem. Rep., The Gambia, Guinea, Guinea-Bissau, Haiti, Liberia, Madagascar, Malawi, Sierra Leone, South Sudan, and Zimbabwe. E. Blue bars denote range of unweighted regional averages across EMDE regions. Health expenditure per capita in purchasing power parity terms, unweighted averages of 199 EMDEs, 34 AEs, and 29 LIC economies. Access to improved sanitation facilities (in percent of population), unweighted averages for 150 EMDEs, 33 AEs, and 29 LIC economies. Access to improved water sources (in percent of population), unweighted averages for 148 EMDEs, 34 AEs, and 29 LIC economies. Latest available data is 2011-15. F. Blue bars denote range of unweighted regional averages across EMDE regions. Government expenditure per primary student (in percent of per capita income), unweighted averages of 87 EMDEs, 32 AEs, and 26 LIC economies. Pupil-teacher ratio in primary education (headcount basis), unweighted averages for 165 EMDEs, 31 AEs, and 21 LIC economies. Latest available data is 2011-15.
B. Per capita GDP growth in LICs A. GDP growth in LICs
D. Per capita GDP Growth in fragile LICs
C. GDP growth in fragile LICs
F. Selected education indicators in LICs E. Selected health care indicators in LICs
-4
-2
0
2
4
6
8
20
15
20
16e
201
7f
201
8f
20
15
20
16e
201
7f
201
8f
20
15
20
16e
201
7f
201
8f
20
15
20
16e
201
7f
201
8f
LICs Oil-exportingLICs
Metal-exporting LICs
Commodity-importing LICs
2010-2014 averagePercent
-8
-4
0
4
8
20
15
201
6e
20
17
f
20
18
f
20
15
201
6e
20
17
f
20
18
f
20
15
201
6e
20
17
f
20
18
f
20
15
201
6e
20
17
f
20
18
f
LICs Oil-exportingLICs
Metal-exporting LICs
Commodity-importing LICs
2010-2014 averagePercent
-2
0
2
4
6
8
20
15
20
16e
201
7f
201
8f
20
15
20
16e
201
7f
201
8f
20
15
20
16e
201
7f
201
8f
20
15
20
16e
201
7f
201
8f
Fragile Oil-exportingfragile
Metal-exporting
fragile
Commodity-importing
fragile
2010-2014 averagePercent
-8
-4
0
4
8
20
15
20
16e
201
7f
201
8f
20
15
20
16e
201
7f
201
8f
20
15
20
16e
201
7f
201
8f
20
15
20
16e
201
7f
201
8f
Fragile Oil-exportingfragile
Metal-exporting
fragile
Commodity-importing
fragile
2010-2014 averagePercent
0
20
40
60
80
100
120
0
1,000
2,000
3,000
4,000
5,000
Healthexpenditure
(LHS)
Improvedsanitation
(RHS)
Improvedwater
source(RHS)
Per capita
Range AE
EMDE LIC
Percent of population
0
10
20
30
40
50
Governmentexpenditure
Pupil-teacher ratio
Percent of per capita income, ratio
Range AE
EMDEs LIC
and commodity exporters (Figure 1.1.2). Fiscal deficits in metals exporters narrowed slightly, after these countries took measures to control expenditures and boost non-resource revenues. By contrast, fiscal deficits widened in the oil exporters as public spending rose, even as oil revenues remained depressed. In commodity importers, developments were mixed, although their average fiscal deficit widened. In some countries, deficits declined (Benin, Haiti), or remained low (Afghanistan, Nepal) helped by slower growth of public spending; in others, they remained high (Togo) or widened
(Ethiopia, Uganda) as robust growth encouraged higher expenditures.
Government debt continued to rise in most LICs, particularly in commodity exporters. The increase was especially steep in Mozambique, where gross government debt jumped to over 110 percent of GDP after new information exposed government guarantees on the debt of state-owned enterprises. Among commodity importers, government debt rose markedly in Ethiopia, due to the financing of an ambitious

CHAPTER 1 GLOBAL ECONOMIC PROSPECTS | JANUARY 2017 21
infrastructure program. They also widened in some fragile countries (Burundi, The Gambia), reflecting increased recourse to central bank advances and the issuance of treasury bills to finance persistently high fiscal deficits.
Narrowing current account deficits, declining capital inflows. External current account deficits narrowed but remained large among LICs in 2016 (Figure 1.1.2). The narrowing mainly reflected a reduction of imports by metals exporters; in contrast, deficits of oil exporters widened. Among commodity importers, current account deficits narrowed only slightly, as strong demand for capital goods imports largely offset gains from low oil prices. At the same time, capital inflows fell among LICs. Foreign direct investment (FDI) inflows continued to decline, especially among commodity-exporting LICs in Sub-Saharan Africa. In Mozambique, for example, inward FDI fell by 17 percent in 2016. Among commodity importers, inward FDI rose in Ethiopia, as investors responded to opportunities in construction, light manufacturing, and renewable energy. In contrast to the previous two years, no LIC tapped the international bond market in 2016, reflecting weak investor demand. Heightened political uncertainty reduced private and official bilateral inflows in several LICs.
Reserve drawdowns and currency depreciations. Large, albeit reduced, current account deficits, together with lower capital inflows, put pressure on exchange rates and international reserves in 2016. LIC currencies generally depreciated against the U.S. dollar, though by less than in 2015, except among the commodity exporters (Figure 1.1.2). The Democratic Republic of Congo franc and the Mozambican metical fell markedly against the U.S. dollar. The currencies of commodity-importing LICs (Rwanda, Uganda) depreciated by less, as low oil prices benefitted current account balances. In some fragile LICs (Burundi, Haiti), substantial depreciations reflected political uncertainty and low donor flows. Currency pressures were met in part with reserve drawdowns, especially among commodity exporters and some fragile countries. International reserves, in months of imports of goods and services, declined by over 30 percent in Burundi, the Comoros, and Mozambique.
Moderate growth outlook. The outlook is for a moderate recovery in growth across LICs, as they continue to adjust to low commodity prices. The
BOX 1.1 Low-income countries: Recent developments and outlook (continued)
external environment confronting LICs is expected to improve gradually, with commodity prices increasing modestly but stabilizing at low levels. GDP in LICs is forecast to expand by 5.6 percent in 2017 and to an average of 6.0 percent in 2018-19. Growth will be weaker in oil exporters than in metals exporters, and quite resilient in commodity importers.
• Growth among oil exporters is forecast to rebound moderately. GDP in Chad is expected to contract at a reduced pace in 2017 and expand in 2018, as oil prices continue to stabilize, the security situation improves, and new oil fields come on-stream.
• The outlook for metals exporters is relatively more favorable. In Mozambique, recent progress in developing the nascent energy sector will help boost investment in gas production. Post-Ebola recovery is expected to continue in Guinea, Liberia, and Sierra Leone, with improving commodity prices helping to boost investment and exports.
• Growth in most commodity importers is expected to remain strong, supported by large public investment and low oil prices. However, fragile countries will see a less vigorous recovery over the forecast horizon (Afghanistan, Burundi, the Comoros, Haiti), as political uncertainty and security challenges continue to hinder private investment.
Risks tilted to the downside. External and domestic risks to the growth projection vary across countries but are generally tilted to the downside.
• External risks. Rebalancing in China could lead to weaker-than-expected recoveries in growth in commodity-exporting LICs, through lower commodity prices and reduced FDI. Weaker-than- expected growth in advanced economies would have similar effects on commodity exports and remittances (Figure 1.1.3).
• Domestic risks. Activity could be adversely affected by persistent drought (Afghanistan, Ethiopia, Malawi, Zimbabwe), rising geopolitical tensions (Afghanistan), heightened political uncertainty (Ethiopia, Haiti, the Democratic Republic of Congo, Zimbabwe), and worsening security (Afghanistan, Mali) (Figure 1.1.3).

CHAPTER 1 GLOBAL ECONOMIC PROSPECTS | JANUARY 2017 22
Dual policy challenge. Low commodity prices have resulted in a slowdown in GDP growth in commodity-exporting LICs, threatening their recent progress in reducing poverty. Per capita output growth has also continued to lag notably among fragile countries. Commodity-importing LICs, benefitting from low raw materials prices, have experienced more solid growth, but they also suffer from some notable macroeconomic imbalances. Thus, LICs in general face the challenge of boosting per capita output growth, while ensuring macroeconomic stability.
• Growth challenges. About two-thirds of the poor in Sub-Saharan Africa’s LICs live in rural households,
for which agriculture is the dominant source of income and food security (World Bank 2016e). Increasing the growth of agricultural output and productivity is therefore central to boosting incomes in these countries. This requires significant public investment in rural public goods to strengthen markets and promote the adoption of new technologies. LIC governments will need international support to finance these types of investments. Multilateral development banks can play an important role by expanding access to concessional financial flows. Fragile countries need to achieve a degree of political stability in order to begin to generate steady growth.
BOX 1.1 Low-income countries: Recent developments and outlook (continued)
01234567
Congo, D
em
.R
ep.
Madagascar
Mali
Buru
ndi
Haiti
Com
oro
s
2015 Latest
Months of imports
-25
-20
-15
-10
-5
0
Commodity-exporting
LICs
Commodity-importing
LICs
LICs Fragilecountries
Dec-15Latest
Percent, year-on-year
-40
-30
-20
-10
0
Commodity-exporting
LICs
Commodity-importing
LICs
LICs Fragilecountries
20152016e
Percent of GDP
FIGURE 1.1.2 Macroeconomic and financial developments in low-income countries
In 2016, inflation slowed in commodity importers but rose sharply in commodity exporters, particularly in metal exporters,
driven by currency depreciations and rising food prices caused by drought. Fiscal deficits widened, with deficits rising more
sharply in commodity importers. As a result, public debt continued to grow. External current account deficits fell across LICs
as a whole in 2016 but remained high. Commodity exporters—in particular, metals exporters—account for most of the
improvement. Current account deficits fell only slightly in commodity importers. LIC currencies continued to depreciate
against the U.S. dollar in 2016, but by less than in 2015. Depreciations accelerated significantly, however, among the
commodity exporters, reflecting pressure from falling export receipts. Market pressures on exchange rates were partly
absorbed by reserve drawdowns, especially in commodity exporters and some fragile LICs.
Sources: International Monetary Fund, World Bank. A. The last observation is October, 2016. E. The last observation is November 2016. F. The last observation is October, 2016.
B. Fiscal balance A. Inflation
D. Current account balance
C. Public debt
F. Reserves in selected LICs E. Exchange rate depreciation
0
2
4
6
8
Commodity-exporting
LICs
Commodity-importing
LICs
LICs Fragilecountries
Dec-15 Latest 2010-14 averagePercent, year-on-year
-5
-4
-3
-2
-1
0
Commodity-exporting LICs
Commodity-importing LICs
LICs
2015 2016ePercent of GDP
0
10
20
30
40
50
60
70
Commodity-exporting LICs
Commodity-importing LICs
LICs
2010-14 2015 2016ePercent of GDP

CHAPTER 1 GLOBAL ECONOMIC PROSPECTS | JANUARY 2017 23
• Common to all LICs is the need for governments to put in place a positive business environment. While progress has been made across LICs to improve the quality of regulation, more needs to be done. Policy uncertainty should be reduced. Power and trade logistics infrastructure needs to be upgraded (World Bank 2013). Reforms in education and job training would strengthen the skills base. A strong business environment will also help promote economic diversification, which would reduce dependence on raw material exports and help sustain long-term growth.
• FDI can help the development of manufacturing and agro-businesses by introducing capital and skills that can be integrated into global value chains (GVC). Cambodia, which graduated from LIC status in 2016, effectively leveraged its comparative advantage in garments production to deepen integration into GVCs. This helped diversify its exports and boost output (IMF 2015b).
• Macroeconomic stability: With commodity prices remaining low and capital flows declining, adjustments are needed across LICs to contain fiscal deficits. These includes stronger efforts to improve
BOX 1.1 Low-income countries: Recent developments and outlook (continued)
tax collection, which is held back by limited data on potential taxpayers, limitations of tracking tools, gaps in capabilities and resources, and complex tax procedures. Appropriate measures to improve tax collection will vary across countries, depending on their tax systems. For most LICs, standardizing and simplifying internal processes, closing major tax loopholes, and improving collection procedures would help boost revenues (McKinsey Global Institute 2016).
• Fiscal adjustment also calls for more efficient government and the reduction of unproductive expenditures. This implies rationalizing current expenditures and increasing the efficiency of public investment through improved financial management (Dabla-Norris et al. 2012). Within a credible medium-term fiscal plan, it is vital to maintain, or increase, public investment in education and health to build human capital, and in strategic infrastructure to remove transportation bottlenecks and systemic power shortages. Concessional financing can help create space to fund these investments and catalyze additional private sector financing.
FIGURE 1.1.3 Vulnerabilities and policy uncertainty in low-income countries
LICs have become increasingly integrated into global trade flows. While trade has supported growth in these economies, it
has also exposed them to external shocks. While remittances from advanced economies have been stable in recent years,
those from other countries, including the Gulf Cooperation Council (GCC) economies, have declined. Several fragile LICs
have regressed on the policy perception index in recent years because of policy uncertainty.
Sources: Fraser Institute Annual Survey of Mining Companies (2015), International Monetary Fund, Organisation for Economic Cooperation and Development, World Bank. B. GCC is the Gulf Cooperation Council. GCC countries are: Bahrain, Kuwait, Oman, Qatar, Saudi Arabia, and the United Arab Emirates. C. Policy Perception Index, previously known as the Policy Potential Index, is a composite index, ranging from 1 (worst) to 100 (best), that measures the effects of government policies. Its calculation includes uncertainty concerning the administration, interpretation, and enforcement of existing regulations, environmental regulations, regulatory duplication and inconsistencies, taxation, disputed land claims and protected areas, infrastructure, socioeconomic agreements, political stability, labor issues, geological database, and security (Fraser Institute 2016).
B. Remittances A. Exports C. Policy perception index
0
20
40
60
80
UnitedStates
China EuroArea
LICs Others World
2000-08 2011-15Percent of GDP
0
2
4
6
8
10
12
2010 2015
Others GCC LIC Advanced economiesPercent of GDP
0
20
40
60
80
100
Bu
rkin
a F
aso
Ma
li
Mad
ag
asc
ar
Co
ng
o, D
em
. R
ep
.
Gu
ine
a
Nig
er
Zim
ba
bw
e
SS
A L
ICs
Policy Perception Index (100=best)
2011/20122015

CHAPTER 1 GLOBAL ECONOMIC PROSPECTS | JANUARY 2017 24
Source: World Bank. World Bank forecasts are frequently updated based on new information and changing (global) circumstances. Consequently, projections presented here may differ from those contained in other Bank documents, even if basic assessments of countries’ prospects do not significantly differ at any given moment in time. a. Central African Rep., Democratic People's Republic of Korea, and Somalia are not forecast due to data limitations. b. GDP at market prices and expenditure components are measured in constant 2010 U.S. dollars. c. GDP growth based on fiscal year data.
TABLE 1.1.1 Low-income country forecastsa
(Real GDP growth at market prices in percent, unless indicated otherwise)
2014 2015 2016 2017 2018 2019 2015 2016 2017 2018
Estimates Projections
Percentage point differences from
June 2016 projections
Low Income Country, GDPb 6.2 4.8 4.7 5.6 6.0 6.1 0.0 -0.6 -0.7 -0.6
Afghanistan 1.3 0.8 1.2 1.8 3.0 3.6 -0.7 -0.7 -1.1 -0.6
Benin 6.5 5.0 4.6 5.2 5.3 5.3 -0.2 -0.9 -0.6 -0.8
Burkina Faso 4.0 4.0 5.2 5.5 6.0 6.0 0.0 0.0 0.0 0.0
Burundi 4.7 -3.9 -0.5 2.5 3.5 3.5 -1.4 -3.5 -1.0 -0.5
Chad 6.9 1.8 -3.5 -0.3 4.7 6.3 0.0 -3.1 -1.9 -0.5
Comoros 2.1 1.0 2.0 2.5 3.0 3.0 -1.3 -0.4 -0.5 -0.1
Congo, Dem. Rep. 9.5 6.9 2.7 4.7 5.0 5.0 -0.8 -3.6 -3.0 -3.5
Ethiopiac 10.3 9.6 8.4 8.9 8.6 8.6 0.0 1.3 -0.5 0.0
Gambia, The 0.9 4.7 0.5 0.8 2.6 2.6 7.2 4.5 -3.7 -2.9
Guinea 1.1 0.1 5.2 4.6 4.6 4.6 0.0 1.2 -0.4 -1.4
Guinea-Bissau 2.5 4.9 4.9 5.1 5.1 5.1 -0.2 -0.8 -0.9 -0.9 Haitic 2.8 1.2 1.2 -0.6 1.5 2.0 0.0 0.3 -2.5 -0.7 Liberia 0.7 0.0 2.5 5.8 5.3 5.3 -0.3 -1.3 0.5 -0.3
Madagascar 3.3 3.1 4.1 4.5 4.8 4.8 0.1 0.4 0.8 1.1
Malawi 5.7 2.8 2.5 4.2 4.5 4.5 0.0 -0.5 0.1 -0.9
Mali 7.0 6.0 5.6 5.1 5.0 5.0 0.5 0.3 0.0 0.0
Mozambique 7.4 6.6 3.6 5.2 6.9 6.9 0.3 -2.2 -2.5 -1.4
Nepalc 6.0 2.7 0.6 5.0 4.8 4.8 0.0 0.0 0.3 0.4
Niger 6.9 3.5 5.0 5.3 6.0 6.0 -0.7 -0.4 -1.0 -1.0
Rwanda 7.0 6.9 6.0 6.0 7.0 7.0 -0.2 -0.8 -1.2 -0.1
Senegal 4.3 6.5 6.6 6.8 7.0 7.0 0.0 0.0 0.0 0.0
Sierra Leone 4.6 -21.1 3.9 6.9 5.9 5.9 0.4 -2.6 1.6 0.5
Tanzania 7.0 7.0 6.9 7.1 7.1 7.1 0.0 -0.3 0.0 0.0
Togo 5.9 5.5 5.4 5.0 5.5 5.5 0.0 -0.2 0.0 0.0
Ugandac 4.8 5.0 4.6 5.6 6.0 6.0 0.0 -0.4 -0.3 -0.8
Zimbabwe 3.8 1.1 0.4 3.8 3.4 3.4 0.0 -1.0 -1.8 -0.1
BOX 1.1 Low-income countries: Recent developments and outlook (continued)
above its long-term average of 4 percent. This slowdown partly reflects a downgrade to India’s fast pace of expansion.
Commodity importers continued to benefit from past terms-of-trade improvements and generally sound macroeconomic policies. Low inflation and low energy costs enabled many commodity importers to ease or to maintain accommodative macroeconomic policies (Croatia, Thailand, Tunisia, the Philippines). In some countries, growth has benefitted from idiosyncratic factors, such as improved confidence (Thailand), the
accelerated implementation of public investment projects (the Philippines), and large cross-border infrastructure investments (Bangladesh, Pakistan).
Domestic demand in commodity importers has remained robust, supported by low commodity prices and accommodative monetary and fiscal policy. Private consumption was strong in many commodity importers, especially in Eastern Europe and South Asia. Investment growth has recovered in a number of countries, particularly in Eastern Europe (Croatia, Romania, Serbia), East Asia and Pacific (Cambodia, the Philippines), and

CHAPTER 1 GLOBAL ECONOMIC PROSPECTS | JANUARY 2017 25
South Asia (Pakistan). However, investment growth remains below its long-term average in more than half of all commodity-importing countries. More generally, slower growth in some commodity importers is explained by idiosyncratic factors, such as policy uncertainty, spillovers from large trading partners (Belarus, Mexico), and legacies from natural disasters (Fiji, Haiti, Nepal). In India, the immediate withdrawal of a large volume of currency in circulation and subsequent replacement with new notes announced by the government in November contributed to slowing growth in 2016.3
Weaker demand growth from major markets depressed export growth in many commodity importers. Exceptions were Germany’s trading partners, which benefited from that country’s solid performance (Hungary, the former Yugoslav Republic of Macedonia, Poland, Romania); Asian economies with improving competitiveness (Cambodia, India); and economies with robust services exports (Croatia, India, Lebanon, the Philippines, Sri Lanka, Thailand).
Low-income countries
Within the broader group of EMDEs, growth in low-income countries (LICs) is estimated at 4.7 percent in 2016 (Box 1.1).4 Activity contracted in oil exporters (Chad, South Sudan), and decelerat-ed in a number of metal exporters (the Democrat-ic Republic of Congo, Mozambique, Zimbabwe) as they continued to struggle to adjust to low com-modity prices. The post-Ebola recovery in Guinea, Liberia, and Sierra Leone was held back by the de-cline in the price of iron ore, their main export. Compounding the effect of depressed commodity prices, a number of LICs were subject to negative domestic shocks. El Niño-related drought affected agricultural production in Chad, Ethiopia, Malawi, Mozambique, Rwanda, and Uganda. The release of previously undisclosed information on external debt guarantees of the government in Mozambique weakened investor sentiment, result-
ing in a sharp reduction in FDI flows. Elsewhere, political tensions (Burundi, The Gambia, the Democratic Republic of Congo, Haiti, Nepal), and security challenges (Afghanistan, Chad, Niger) continued to cause strains on economic activity. However, growth in many commodity importers (Ethiopia, Rwanda, Senegal, Tanzania) remained solid in 2016, supported by strong infra-structure investment.
Outlook
Growth in EMDEs is projected to pick up to 4.2 percent in 2017 and about 4.7 percent on average in 2018-19 (Figure 1.13). This acceleration mainly reflects a recovery in commodity-exporting
FIGURE 1.13 EMDE prospects
EMDE growth is projected to recover to 4.2 percent in 2017 and about 4.7
percent in 2018-19. This reflects a recovery in commodity exporters
towards their long-term average growth. Growth in commodity importers is
projected to remain at around 5.7 percent on average, slightly below its
long-term average rate. A number of mostly structural factors are expected
to weigh on the medium- and long-term EMDE growth outlook, as reflected
in deteriorating potential growth estimates and downward revisions to long-
term investment prospects.
B. GDP growth A. GDP growth
D. Five-year ahead investment growth
forecasts C. EMDE actual and potential growth
Sources: Consensus Economics, Didier et al. (2015), World Bank. A. B. Shaded area indicates forecasts. C. Unweighted average of major EMDEs. Potential growth defined as in Didier et al. (2015). D. Each column shows five-year ahead Consensus Forecasts as of the latest available month in the year denoted. Unweighted averages of 21 EMDEs. Last observation is October 2016.
0
2
4
6
8
10
2014
2015
2016
2017
2018
2019
2014
2015
2016
2017
2018
2019
2014
2015
2016
2017
2018
2019
EMDE com. exp.ex. BRICS
EMDE com. imp.ex. BRICS
BRICS
1990-2008 average
2003-2008 average
Percent
0
1
2
3
4
5
6
7
8
20
00
20
01
20
02
20
03
20
04
20
05
20
06
20
07
20
08
20
09
20
10
20
11
20
12
20
13
20
14
20
15
20
16
PercentActual growthPotential growth
0
2
4
6
8
20
10
20
12
20
14
20
16
Percent
0
2
4
6
8
10
2014
2015
2016
2017
2018
2019
2014
2015
2016
2017
2018
2019
2014
2015
2016
2017
2018
2019
EMDEs EMDE commodityimporters
EMDEcommodityexporters
1990-2008 average
2003-2008 averagePercent
3Chapter 2 discusses the short-term impact of this action on India’s growth.
4For the current fiscal year, the World Bank Group defines low-income economies as those with an annual GNI per capita, calculated using the World Bank Atlas method, of $1,025 or less in 2015.

CHAPTER 1 GLOBAL ECONOMIC PROSPECTS | JANUARY 2017 26
BOX 1.2 Regional perspectives: Recent developments and outlook
EMDE regions with substantial numbers of commodity-importing economies—East Asia and the Pacific, and South Asia—are
projected to experience solid growth. In contrast, the outlook for EMDE regions with large numbers of commodity exporters is
mixed. Growth in Latin America and the Caribbean, and in Europe and Central Asia, is expected to accelerate in 2017, mainly
reflecting a bottoming out in activity in Brazil and Russia. Growth in the Middle East and North Africa will pick up modestly,
as oil prices recover. While growth should also rebound in Sub-Saharan Africa, the improvement is notably weaker than previous-
ly expected, as some commodity exporters struggle to adjust to low commodity prices.
East Asia and Pacific. Regional growth is estimated to have reached 6.3 percent in 2016, slightly below the 6.5 percent registered in 2015, and in line with June projections (Figure 1.2.1). Solid domestic demand, supported by generally benign financing conditions for most of the year, was accompanied by soft export growth. The growth contour continued to follow China’s gradually declining path. Excluding China, regional output is estimated to have expanded 4.8 percent in 2016, the same pace as in 2015. A pickup in growth in commodity importers in the region offset weaker growth in some commodity exporters, which continue to adjust to low prices. Regional growth is projected to moderate to 6.1 percent on average in 2017-19, in line with June forecasts. Further moderation in Chinese growth will be partly offset by acceleration in the rest of the region, reflecting recovery in commodity exporters and continued solid performance in commodity importers. Key risks to the region include financial market volatility related to heightened policy uncertainty and growth disappointments in major economies, as well as rising protectionist sentiments.
Europe and Central Asia. Regional GDP is estimated to have expanded at a 1.2 percent pace in 2016, reflecting an easing recession in Russia, stabilization of commodity prices, and reduced geopolitical tensions in Ukraine. The 2016 estimate is broadly in line with June projections, as an upward revision for Russia was offset by weakness in some other commodity exporters and Turkey. Growth in the western part of the region remained generally solid, reflecting robust consumption and net export growth. In contrast, growth slowed in the eastern part, excluding Russia, due to deceleration in energy-exporting countries. Looking ahead, regional growth is projected to pick up to 2.4 percent in 2017 and an average of 2.9 percent in 2018-19, as Russia bounces back and other commodity exporters and Turkey recover. The main downside risks to the outlook include renewed declines in commodity prices, disruptions in financial markets amid tightening financing conditions, a sharper-than-expected slowdown in Euro Area growth, and elevated political uncertainty.
Latin America and the Caribbean. Regional output is estimated to have contracted 1.4 percent in 2016—the second consecutive year of negative growth—against the backdrop of low commodity prices, macroeconomic imbalances, and other domestic challenges. In South America, GDP contracted 2.8 percent, with a further decline in Brazil and recession in Argentina. Aggregate output in Mexico and Central America expanded 2.3 percent, while that of Caribbean grew 3.2 percent. Relative to June projections, regional growth in 2016 was slightly downgraded, as an upward revision for Brazil, partly reflecting improved confidence in the new government, was offset by downward revisions to growth in several other commodity exporters and Mexico. Regional growth is projected to recover to 1.2 percent in 2017, and to further strengthen to an average of 2.4 percent in 2018-19, as domestic headwinds in Brazil and other economies abate and fiscal consolidation across the region is completed. The main downside risks to the outlook include rising policy uncertainty in advanced-economy trading partners, particularly the United States; a renewed slide in commodity prices; and more protracted contractions among the region’s largest economies.
Middle East and North Africa. After reaching 3.2 percent in 2015, growth in the region is estimated to have fallen to 2.7 percent in 2016, slightly below June projections, and reflecting downward revisions in oil exporters, particularly some Gulf Cooperation Council (GCC) countries, as weakness spread from the oil to the non-oil sector. Regional growth is projected to accelerate following the bottoming out of oil prices in 2016, reaching 3.1 percent in 2017 and 3.3 percent in 2018–19. For oil exporters, despite a continued robust expansion in the Islamic Republic of Iran, growth will be somewhat slower than June projections, due to fiscal consolidation plans in Saudi Arabia, and oil production capacity constraints in Iraq. For oil importers, rising growth mainly reflects an agricultural sector recovery in Morocco and improving activity in Egypt after severe foreign exchange shortages in fiscal year 2016. However, recovery in Egypt is highly dependent on the pace of fiscal consolidation and adjustment to the recent floating of the currency. The main downside risks to the regional outlook continue to be a weaker-than-
Note: This box was prepared by Derek Chen, Gerard Kambou, Boaz Nandwa, Yoki Okawa, Ekaterine Vashakmadze, and Dana Vorisek.

CHAPTER 1 GLOBAL ECONOMIC PROSPECTS | JANUARY 2017 27
expected rise in oil prices, as well as spillovers from the severe conflicts in several countries.
South Asia. Regional output is estimated to have expanded by 6.8 percent in 2016, a bit below June projections, buoyed by strength in domestic demand. Indian growth is estimated to have decelerated to a still robust 7 percent, with continued tailwinds from low oil prices and solid agricultural output partly offset by challenges associated with the withdrawal of a large volume of currency in circulation and subsequent replacement with new notes. Excluding India, regional growth reached 5.3 percent in 2016, with notable heterogeneity among countries. Looking forward, regional growth is projected to edge up to 7.1 percent in 2017 and pick up to an average of 7.4 percent in 2018-19, supported by ongoing dividends from policy reforms and solid domestic demand amid a favorable macroeconomic environment. Downside risks to the outlook include reform setbacks, worsened political tensions, a further unexpected tightening of financing conditions, a slowdown in remittances inflows, and bank asset quality problems.
Sub-Saharan Africa. Regional growth is estimated to have decelerated from 3.1 percent in 2015 to 1.5 percent in 2016, the lowest level in over two decades, and almost one percentage point below June projections. As a result, regional per capita GDP is estimated to have contracted 1.1 percent in 2016, following an expansion of 0.4 percent in 2015. Commodity exporters continued to struggle to adjust to low prices, which is threatening recent progress on poverty and social indicators. The deterioration in economic activity in commodity exporters in 2016—particularly in South Africa and in oil exporters, which together account for two-thirds of regional output—was only partially offset by solid growth in most commodity importers. While the forecast for regional growth has been downgraded, a rebound is still expected—to 2.9 percent in 2017, and to 3.7 percent in 2018-19—as commodity prices stabilize and the adjustment to earlier negative terms-of-trade shocks continues. Downside risks include a slower pace of adjustment to persistently low commodity prices, a further decline in these prices, and an additional tightening of global financial conditions.
BOX 1.2 Regional perspectives: Recent developments and outlook (continued)
FIGURE 1.2.1 Regional growth
EMDE regions with substantial numbers of commodity-
importing economies are projected to experience solid
growth, in line with previous forecasts. In contrast, the
outlook for EMDE regions with large numbers of
commodity exporters is mixed.
A. Regional growth (weighted average)
B. Regional growth (unweighted average)
Source: World Bank. A.B. Average for 1990-08 is constructed depending on data availability. For ECA, data for 1995-2008 are used to exclude the immediate aftermath of the Soviet Union collapse. A. Since the largest economies of each region account for almost 50 percent of regional GDP in some regions, the weighted average predominantly reflects the development in the largest economies in each region. B. Unweighted average regional growth to ensure broad reflection of regional trends across all countries in the region.
0
2
4
6
8
10
201
52
01
62
01
72
01
8
201
52
01
62
01
72
01
8
201
52
01
62
01
72
01
8
201
52
01
62
01
72
01
8
201
52
01
62
01
72
01
8
201
52
01
62
01
72
01
8East
Asia andPacific
Europeand
CentralAsia
LatinAmericaand the
Caribbean
MiddleEast and
NorthAfrica
South Asia Sub-Saharan
Africa
GEP June 2016 1990-08 average 2003-08 averagePercent
-2
0
2
4
6
8
10
201
52
01
62
01
72
01
8
201
52
01
62
01
72
01
8
201
52
01
62
01
72
01
8
201
52
01
62
01
72
01
8
201
52
01
62
01
72
01
8
201
52
01
62
01
72
01
8
EastAsia andPacific
Europe andCentral
Asia
LatinAmericaand the
Caribbean
MiddleEast and
NorthAfrica
South Asia Sub-Saharan
Africa
GEP June 2016 1990-08 average 2003-08 averagePercent

CHAPTER 1 GLOBAL ECONOMIC PROSPECTS | JANUARY 2017 28
More generally, a number of mostly structural factors are expected to weigh on the medium- and long-term EMDE growth outlook. External factors include structural weakness in advanced-economy growth, heightened uncertainty about the direction of policies in key advanced economies, subdued global trade, persistently low commodity prices, and rebalancing in China. Domestic factors include unfinished adjustments in some commodity exporters to low commodity prices and slowing productivity growth. In general, potential growth has slowed in EMDEs since the global financial crisis, reflecting worsening demographics, lack of productive investment, depressed productivity growth, and weak investment growth. The deterioration in potential growth has, in turn, contributed to weaker investment prospects over the medium term. Total factor productivity growth has decelerated in EMDEs, particularly in commodity exporters and in EMDEs with the slowest investment growth (Chapter 3).
Risks to the outlook
Uncertainty surrounding global growth projections has increased and risks continue to be tilted to the downside. This reflects the possibility of a prolonged period of heightened policy uncertainty following recent electoral outcomes in key major economies, mounting protectionist tendencies, and potential financial market disruptions associated with sharp changes in borrowing costs or exchange rate movements. Weakening potential growth could further erode EMDEs’ ability to absorb negative shocks. However, significant fiscal stimulus in major economies—in particular, the United States—could support a more rapid recovery in global activity in the near term than currently projected, and thus represents a substantial upside risk to the outlook.
Baseline forecasts envisage that global growth will pick up from 2.3 percent in 2016 to 2.7 percent in 2017, reaching 2.9 percent by the end of the forecast horizon. While these projections represent the latest of a series of downgrades over recent forecast exercises, revisions are less pronounced than in the past (Figure 1.14).
EMDEs, where growth is projected to increase to 2.3 percent in 2017 and to an average of 3.1 percent in 2018-19—slightly above its long-term average of 2.8 percent, but substantially lower than the average of 5.9 percent achieved during the commodity price boom years of 2003-2008. In commodity-exporting EMDEs, a faster-than-expected recovery in some large countries (Brazil, Russia) and the modest rise in commodity prices will be offset by negative domestic factors in a number of countries still struggling to adjust to low commodity prices (Angola, Nigeria).
Growth in commodity-importing EMDEs is projected to remain stable throughout the forecast horizon, at around 5.7 percent on average, and slightly below its long-term average rate. The gradual slowdown in China is projected to be offset by a moderate acceleration in the rest of the group, including a robust expansion in India. As a result, divergences between exporters and importers are expected to narrow.
The external environment confronting LICs is expected to improve only gradually, with commodity prices stabilizing, but staying low, and global growth picking up only moderately. This is expected to provide some support to growth in commodity-exporting LICs. The majority of commodity-importing LICs will continue to benefit from low oil prices. Against this backdrop, growth in LICs is forecast to rebound to 5.6 percent in 2017, a moderate recovery by recent standards, before picking up to 6.1 percent by 2019.
Considerable differences will persist across LICs. Growth among oil exporters will remain weak in 2017. Other commodity exporters will continue to struggle to adjust to low commodity prices, with activity expanding at a moderate pace, such as Mozambique, the Democratic Republic of Congo, and Zimbabwe. Security issues, and political uncertainties will hold back activity in Afghanistan, Burundi, The Gambia, and Mali. However, growth is expected to strengthen in Nepal as political tensions ease and reconstruction of infrastructure picks up. Large infrastructure investment and low oil prices are expected to continue to support robust growth in Ethiopia, Rwanda, Senegal, and Tanzania.

CHAPTER 1 GLOBAL ECONOMIC PROSPECTS | JANUARY 2017 29
There is, however, substantial uncertainty around these forecasts, which has been heightened by recent political developments—in particular, electoral outcomes in the United States and the United Kingdom. Uncertainty around global growth projections for 2017 has increased, and the balance of risks remains tilted to the downside, amid unclear prospects for policy direction in major economies. At present, the 90 percent confidence interval around global growth forecasts for 2017 lies between 1.1 percent and 4 percent. The 50 percent confidence interval ranges from 2 percent to 3.2 percent. While the probability that global growth could be more than 1 percentage point below baseline projections in 2017 is currently estimated at about 17 percent, the probability of global growth being 1 percentage point above the baseline projection is estimated at 9 percent.
The main downside risks to the global outlook include prolonged periods of heightened policy uncertainty in major advanced economies and some EMDEs, as well as financial market disruptions amid tighter global financing conditions and renewed U.S. dollar appreciation. A number of events could trigger the realization of these downside risks. These include electoral outcomes in some large economies that further contribute to policy uncertainty, as well as monetary policy actions by major central banks that result in sharp swings in EMDE borrowing costs. Political and policy uncertainty could increase in a climate of mounting protectionist tendencies, which could undermine the expected recovery in global trade and investment. Global financial market volatility could be particularly disruptive in EMDEs with limited policy space and elevated vulnerabilities. Slower potential growth could further erode the ability of EMDEs to absorb negative shocks, including those emanating from lower-than-expected growth in major economies. However, well-targeted fiscal loosening and other growth-enhancing policies in major economies—particularly in the United States—could lead to stronger growth and a more balanced policy mix than currently assumed and thus represent a substantial upside risk to the forecast.
FIGURE 1.14 Risks to global growth
Global growth projections continued to be downgraded, albeit less than in
previous forecast rounds. Forecast uncertainty and downside risks to
global growth have increased, reflecting in part heightened global policy
uncertainty. The probability that global growth could be more than 1
percentage point below baseline projections in 2017 is estimated to be 17
percent. In contrast, the probability of global growth being 1 percentage
point above the baseline projection is estimated at 9 percent.
B. EMDE growth forecasts over time A. Global growth forecasts over time
D. Skewness of global growth
forecasts C. Standard deviation of global
growth forecasts
Sources: Bloomberg, World Bank. A.B. The dates indicate the editions of Global Economic Prospects. C.D. Vertical lines denote the cut-off date of the June 2016 Global Economic Prospects (May 31, 2016). The time-varying standard deviation and skewness of global growth forecasts are computed as the weighted average of the standard deviation and skewness of the forecast distribution of three underlying risk factors (oil price futures, the S&P 500 equity price futures and term spread forecasts). Each of the three risk factor’s weight is estimated using the variance decomposition of global growth forecasts derived from the vector autoregression model described in Ohnsorge, Stocker, and Some (2016). The median standard deviation and skewness is computed over the period 2006-16. 3-month moving average. Last observation for market data is December 19, 2016. E. F. The fan chart and corresponding probabilities are constructed based on the recovered standard deviation and skewness, assuming a two-piece normal distribution.
F. Probability of 1 percentage-point
change in global growth forecasts E. Risks to global growth projections
2
3
4
5
20
13
20
14
20
15
20
16
20
17
20
18
June 2015
January 2016
June 2016
January 2017
Percent
0.95
1.00
1.05
1.10
1.15
1.20
20
12
20
13
20
14
20
15
20
16
12-month ahead Median
Percent
-0.6
-0.4
-0.2
0.0
20
12
20
13
20
14
20
15
20
16
12-month ahead Median
Percent
0
5
10
15
20
25
2017 2018
1 percentage point below baseline
1 percentage point above baseline
Percent
2
3
4
5
201
3
201
4
201
5
201
6
201
7
201
8
June 2015
January 2016
June 2016
January 2017
Percent
0
1
2
3
4
5
0
1
2
3
4
5
2015 2016 2017 2018
50 percent
80 percent
90 percent
Baseline
Percent
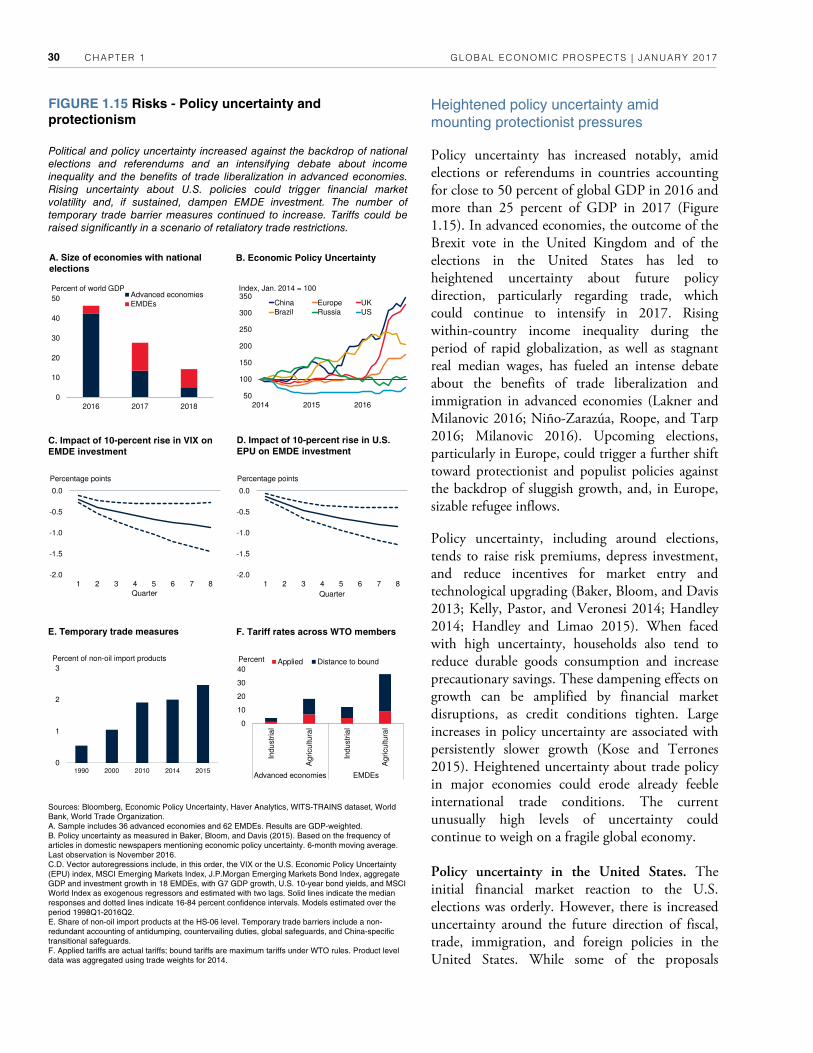
CHAPTER 1 GLOBAL ECONOMIC PROSPECTS | JANUARY 2017 30
Heightened policy uncertainty amid mounting protectionist pressures
Policy uncertainty has increased notably, amid elections or referendums in countries accounting for close to 50 percent of global GDP in 2016 and more than 25 percent of GDP in 2017 (Figure 1.15). In advanced economies, the outcome of the Brexit vote in the United Kingdom and of the elections in the United States has led to heightened uncertainty about future policy direction, particularly regarding trade, which could continue to intensify in 2017. Rising within-country income inequality during the period of rapid globalization, as well as stagnant real median wages, has fueled an intense debate about the benefits of trade liberalization and immigration in advanced economies (Lakner and Milanovic 2016; Niño-Zarazúa, Roope, and Tarp 2016; Milanovic 2016). Upcoming elections, particularly in Europe, could trigger a further shift toward protectionist and populist policies against the backdrop of sluggish growth, and, in Europe, sizable refugee inflows.
Policy uncertainty, including around elections, tends to raise risk premiums, depress investment, and reduce incentives for market entry and technological upgrading (Baker, Bloom, and Davis 2013; Kelly, Pastor, and Veronesi 2014; Handley 2014; Handley and Limao 2015). When faced with high uncertainty, households also tend to reduce durable goods consumption and increase precautionary savings. These dampening effects on growth can be amplified by financial market disruptions, as credit conditions tighten. Large increases in policy uncertainty are associated with persistently slower growth (Kose and Terrones 2015). Heightened uncertainty about trade policy in major economies could erode already feeble international trade conditions. The current unusually high levels of uncertainty could continue to weigh on a fragile global economy.
Policy uncertainty in the United States. The initial financial market reaction to the U.S. elections was orderly. However, there is increased uncertainty around the future direction of fiscal, trade, immigration, and foreign policies in the United States. While some of the proposals
FIGURE 1.15 Risks - Policy uncertainty and
protectionism
Political and policy uncertainty increased against the backdrop of national
elections and referendums and an intensifying debate about income
inequality and the benefits of trade liberalization in advanced economies.
Rising uncertainty about U.S. policies could trigger financial market
volatility and, if sustained, dampen EMDE investment. The number of
temporary trade barrier measures continued to increase. Tariffs could be
raised significantly in a scenario of retaliatory trade restrictions.
B. Economic Policy Uncertainty A. Size of economies with national
elections
D. Impact of 10-percent rise in U.S.
EPU on EMDE investment C. Impact of 10-percent rise in VIX on
EMDE investment
Sources: Bloomberg, Economic Policy Uncertainty, Haver Analytics, WITS-TRAINS dataset, World Bank, World Trade Organization. A. Sample includes 36 advanced economies and 62 EMDEs. Results are GDP-weighted. B. Policy uncertainty as measured in Baker, Bloom, and Davis (2015). Based on the frequency of articles in domestic newspapers mentioning economic policy uncertainty. 6-month moving average. Last observation is November 2016. C.D. Vector autoregressions include, in this order, the VIX or the U.S. Economic Policy Uncertainty (EPU) index, MSCI Emerging Markets Index, J.P.Morgan Emerging Markets Bond Index, aggregate GDP and investment growth in 18 EMDEs, with G7 GDP growth, U.S. 10-year bond yields, and MSCI World Index as exogenous regressors and estimated with two lags. Solid lines indicate the median responses and dotted lines indicate 16-84 percent confidence intervals. Models estimated over the period 1998Q1-2016Q2. E. Share of non-oil import products at the HS-06 level. Temporary trade barriers include a non-redundant accounting of antidumping, countervailing duties, global safeguards, and China-specific transitional safeguards. F. Applied tariffs are actual tariffs; bound tariffs are maximum tariffs under WTO rules. Product level data was aggregated using trade weights for 2014.
F. Tariff rates across WTO members E. Temporary trade measures
50
100
150
200
250
300
350
2014 2015 2016
China Europe UKBrazil Russia US
Index, Jan. 2014 = 100
0
1
2
3
1990 2000 2010 2014 2015
Percent of non-oil import products
0
10
20
30
40
Indu
str
ial
Ag
ricultura
l
Indu
str
ial
Ag
ricultura
l
Advanced economies EMDEs
Applied Distance to boundPercent
0
10
20
30
40
50
2016 2017 2018
Advanced economiesEMDEs
Percent of world GDP
-2.0
-1.5
-1.0
-0.5
0.0
1 2 3 4 5 6 7 8
Quarter
Percentage points
-2.0
-1.5
-1.0
-0.5
0.0
1 2 3 4 5 6 7 8
Quarter
Percentage points

CHAPTER 1 GLOBAL ECONOMIC PROSPECTS | JANUARY 2017 31
suggested by the new administration (e.g., fiscal stimulus and infrastructure spending) could have positive growth effects, others (e.g., tariff increases) could have a dampening impact. More generally, the United States plays a major role in the global economy (Special Focus); accordingly, a sustained increase in policy uncertainty in the United States could have negative repercussions for both the domestic and global economic outlooks. According to model estimates, a modest 1 standard-deviation shock to the U.S. index of economic policy uncertainty could reduce U.S. GDP and investment growth by 0.4 and 0.8 percentage points, respectively, within two years. Uncertainty in the United States could also weigh on investment in other countries, particularly EMDEs. A 10-percent increase in the implied volatility of the U.S. stock market (VIX) would reduce EMDE GDP growth by about 0.2 percentage point and EMDE investment growth by about 0.5 percentage point after one year.
Policy uncertainty in Europe. The Brexit vote had limited short-term cross-border financial market spillovers, partly reflecting the commitment for further policy accommodation by major central banks. However, it will take time to resolve the uncertainty surrounding the future relationship between the United Kingdom and the EU, given the protracted nature of the negotiations for international trade agreements, and the unusual complexity of the issues in this case. This, in itself, could set back longer-term growth prospects across the EU. The magnitude of adverse long-run effects will depend on the type of relationship that the United Kingdom will negotiate with the EU, as well as associated political and institutional risks.5 Policy uncertainty in Europe has considerable adverse implications for investment growth in EMDEs, particularly in the Eastern Europe and Central Asia (ECA) region, for which Europe is an important export market and source of finance. A 1 standard-deviation economic policy shock in Europe could reduce investment growth by 1.5
5Economic analysis conducted by a number of policy institutions prior to the referendum suggests a wide range of possible outcomes, with the long-run impact on the U.K. GDP level estimated to be between -1 and -8 percent, depending on market access to the rest of the EU under the new arrangements (HM Treasury 2016; OECD 2016b; IMF 2016g).
percentage points within a year in EMDEs in ECA that are close trading partners (Chapter 3).
Policy uncertainty in EMDEs. In some EMDEs, political and policy uncertainty reached new highs in 2016. According to model estimates, a 1 standard-deviation shock to an index of country-specific political risks reduces EMDE investment by about 2 percent below the baseline within a year (Chapter 3, Box 3.3). A confidence shock in major advanced economies, still the main trading partners for many EMDEs, could further dent EMDE investment growth.
Protectionism. Heightened policy uncertainty could coalesce around increased protectionism. New trade restrictions already reached a post-crisis high in 2016 (WTO 2016; Evenett and Fritz 2016). Trade defense measures (anti-dumping measures, countervailing duties, and safeguards) have been the most commonly used instruments in advanced economies, while EMDEs have used a broader set of restrictive measures, including import tariffs and export taxes. Even within the parameters of current international safeguards, WTO members could, legally, triple import tariffs, which would lead to a 10-percent drop in world trade from the baseline, and large welfare losses for the world economy (Bouet and Laborde 2008). These losses would disproportionately affect the poorest EMDEs, which rely on trade as a key engine for growth and development (Foletti et al. 2008; Evenett and Fritz 2015). The possible undoing of existing trade agreements amid increased protectionism would greatly exacerbate welfare losses in EMDEs. A scenario of retaliatory trade restrictions between the United States and China could also lead to substantially slower growth in the United States (Nolan et al. 2016).
Financial market risks
The prospects for increasing monetary policy divergence and heightened policy uncertainty in advanced economies, combined with deteriorated credit quality in EMDEs, raises risks of financial market disruptions. In the United States, policy rates are expected to increase further, and there is a risk that market expectations could adjust abruptly to signs of emerging inflation,
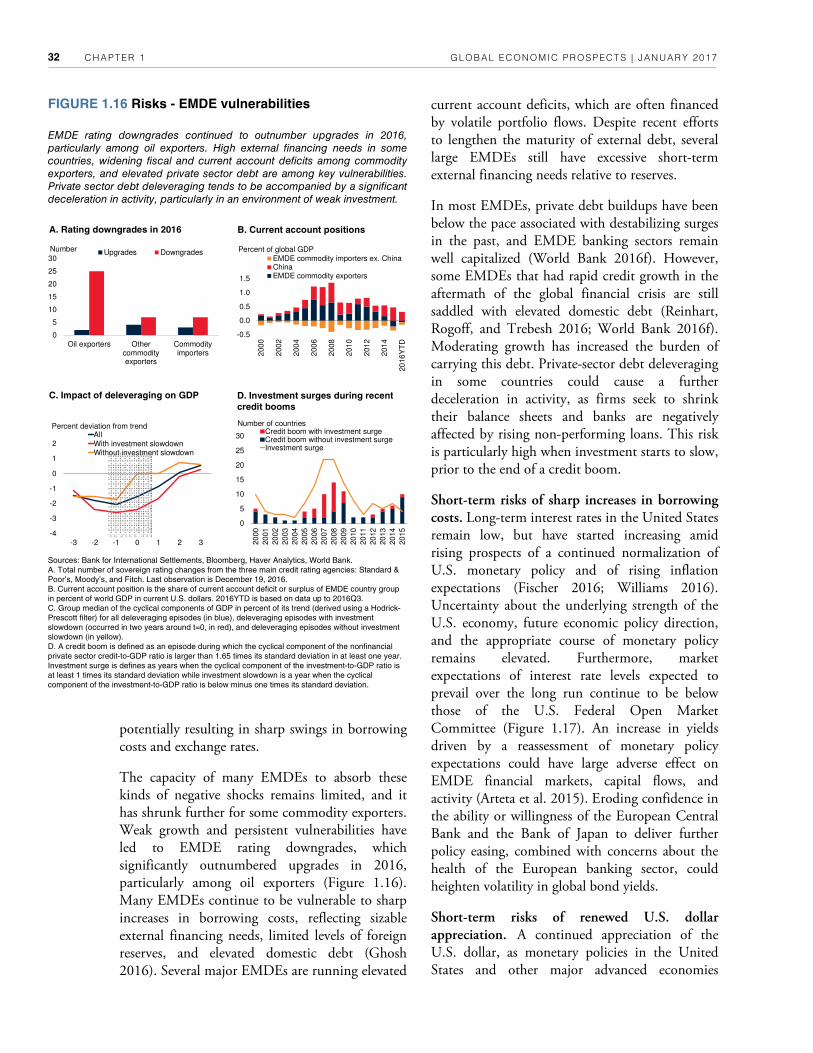
CHAPTER 1 GLOBAL ECONOMIC PROSPECTS | JANUARY 2017 32
current account deficits, which are often financed by volatile portfolio flows. Despite recent efforts to lengthen the maturity of external debt, several large EMDEs still have excessive short-term external financing needs relative to reserves.
In most EMDEs, private debt buildups have been below the pace associated with destabilizing surges in the past, and EMDE banking sectors remain well capitalized (World Bank 2016f). However, some EMDEs that had rapid credit growth in the aftermath of the global financial crisis are still saddled with elevated domestic debt (Reinhart, Rogoff, and Trebesh 2016; World Bank 2016f). Moderating growth has increased the burden of carrying this debt. Private-sector debt deleveraging in some countries could cause a further deceleration in activity, as firms seek to shrink their balance sheets and banks are negatively affected by rising non-performing loans. This risk is particularly high when investment starts to slow, prior to the end of a credit boom.
Short-term risks of sharp increases in borrowing costs. Long-term interest rates in the United States remain low, but have started increasing amid rising prospects of a continued normalization of U.S. monetary policy and of rising inflation expectations (Fischer 2016; Williams 2016). Uncertainty about the underlying strength of the U.S. economy, future economic policy direction, and the appropriate course of monetary policy remains elevated. Furthermore, market expectations of interest rate levels expected to prevail over the long run continue to be below those of the U.S. Federal Open Market Committee (Figure 1.17). An increase in yields driven by a reassessment of monetary policy expectations could have large adverse effect on EMDE financial markets, capital flows, and activity (Arteta et al. 2015). Eroding confidence in the ability or willingness of the European Central Bank and the Bank of Japan to deliver further policy easing, combined with concerns about the health of the European banking sector, could heighten volatility in global bond yields.
Short-term risks of renewed U.S. dollar appreciation. A continued appreciation of the U.S. dollar, as monetary policies in the United States and other major advanced economies
FIGURE 1.16 Risks - EMDE vulnerabilities
EMDE rating downgrades continued to outnumber upgrades in 2016,
particularly among oil exporters. High external financing needs in some
countries, widening fiscal and current account deficits among commodity
exporters, and elevated private sector debt are among key vulnerabilities.
Private sector debt deleveraging tends to be accompanied by a significant
deceleration in activity, particularly in an environment of weak investment.
B. Current account positions A. Rating downgrades in 2016
D. Investment surges during recent
credit booms
C. Impact of deleveraging on GDP
Sources: Bank for International Settlements, Bloomberg, Haver Analytics, World Bank. A. Total number of sovereign rating changes from the three main credit rating agencies: Standard & Poor’s, Moody’s, and Fitch. Last observation is December 19, 2016. B. Current account position is the share of current account deficit or surplus of EMDE country group in percent of world GDP in current U.S. dollars. 2016YTD is based on data up to 2016Q3. C. Group median of the cyclical components of GDP in percent of its trend (derived using a Hodrick-Prescott filter) for all deleveraging episodes (in blue), deleveraging episodes with investment slowdown (occurred in two years around t=0, in red), and deleveraging episodes without investment slowdown (in yellow). D. A credit boom is defined as an episode during which the cyclical component of the nonfinancial private sector credit-to-GDP ratio is larger than 1.65 times its standard deviation in at least one year. Investment surge is defines as years when the cyclical component of the investment-to-GDP ratio is at least 1 times its standard deviation while investment slowdown is a year when the cyclical component of the investment-to-GDP ratio is below minus one times its standard deviation.
potentially resulting in sharp swings in borrowing costs and exchange rates.
The capacity of many EMDEs to absorb these kinds of negative shocks remains limited, and it has shrunk further for some commodity exporters. Weak growth and persistent vulnerabilities have led to EMDE rating downgrades, which significantly outnumbered upgrades in 2016, particularly among oil exporters (Figure 1.16). Many EMDEs continue to be vulnerable to sharp increases in borrowing costs, reflecting sizable external financing needs, limited levels of foreign reserves, and elevated domestic debt (Ghosh 2016). Several major EMDEs are running elevated
-0.5
0.0
0.5
1.0
1.5
200
0
200
2
200
4
200
6
200
8
201
0
201
2
201
4
20
16
YT
D
EMDE commodity importers ex. ChinaChinaEMDE commodity exporters
Percent of global GDP
-4
-3
-2
-1
0
1
2
-3 -2 -1 0 1 2 3
Percent deviation from trendAllWith investment slowdownWithout investment slowdown
0
5
10
15
20
25
30
20
00
20
01
20
02
20
03
20
04
20
05
20
06
20
07
20
08
20
09
20
10
20
11
20
12
20
13
20
14
20
15
Credit boom with investment surgeCredit boom without investment surgeInvestment surge
Number of countries
0
5
10
15
20
25
30
Oil exporters Othercommodityexporters
Commodityimporters
Upgrades DowngradesNumber

CHAPTER 1 GLOBAL ECONOMIC PROSPECTS | JANUARY 2017 33
diverge or policy risks materialize, could raise debt servicing costs and credit risks for EMDEs (Hofmann, Shim, and Shin 2016). The U.S. dollar continues to play a unique role in the international transmission of monetary policy shocks, and its appreciation generally coincides with tighter global financial conditions and weak commodity prices (Special Focus; Bruno and Shin 2015). The share of both private and public debt denominated in foreign currency, and the number of countries with currency regimes tightly linked to the U.S. dollar, have declined. However, some countries with elevated short-term foreign-currency-denominated debt and weak or deteriorating current account positions, are vulnerable to rollover and interest rate risks, as well as to a drying up of foreign exchange liquidity (Chow et al. 2015).
Longer-term risks associated with persistently low interest rates. While a sudden increase in borrowing costs and risk aversion from current low levels are dominant risks in the short term, a more prolonged period of low interest rates could heighten financial stability risks over time. Adverse effects include the erosion of profitability of banks and other financial intermediaries, excessive risk-taking, and distorted asset valuations that increase the risk of booms and busts in asset prices. Negative policy rates in several advanced economies, if maintained for a significant period of time, could amplify these risks (Arteta et al. 2016; Claessens, Coleman, and Donnelly 2016; Borio, Gombacorta, and Hofman 2015).
Euro Area banks remain under significant pressure, partly reflecting concerns about future earnings and, for a number of vulnerable institutions, insufficient capital buffers (Figure 1.18). Further escalation of these pressures could have international spillovers, as Euro Area banks play a major role in the provision of syndicated bank loans to EMDEs, accounting for about 23 percent of their global bank inflows. Under persistently low- or negative-yielding bonds, pension funds and life insurance companies might also struggle to generate adequate returns to meet their long-term liabilities (Hannoun 2015; Geneva Association 2015; IMF 2015c). In an effort to compensate for negative or extremely low interest
rates, insurance companies and other institutional investors might increase their exposure to higher-yielding, lower quality debt. Greater risk-taking might eventually contribute to the formation of asset bubbles, which could be particularly damaging for the real economy if they take place in housing markets (Claessens, Kose, and Terrones 2012; Mian, Sufi, and Verner 2015).
Weakening potential growth
While partly reflecting cyclical factors, repeated growth disappointments in recent years in both advanced economies and EMDEs suggest that structural factors are at work. Falling potential output growth could reduce available fiscal space by reducing fiscal revenues and weakening cyclically-adjusted primary balances. By depressing real equilibrium interest rates, low potential growth also exacerbates problems associated with the lower bound of monetary policy interest rates. In both advanced economies and EMDEs,
FIGURE 1.17 Risks - Volatility around U.S. tightening
cycle
Despite a rebound in U.S. long-term yields amid prospects of continued
monetary policy normalization, a gap in policy rate expectations between
market participants and members of the U.S. Federal Open Market
Committee remain over the medium term. This raises the risk of financial
market volatility. An increase in U.S. long-term yields driven by a sudden
reassessment of monetary policy expectations could have sizable adverse
effects on EMDE equity markets.
A. U.S. policy interest rate
expectations
B. Impact of rising U.S. long-term
yields on EMDE equity prices
Sources: Bloomberg, Federal Reserve Board, World Bank. A. FOMC is the Federal Open Market Committee. Median is the median of forecasts submitted by FOMC participants. The range is the difference between maximum and minimum forecast values. The FOMC defines the long-run as the steady state level of the Federal Funds rate in the absence of further shocks to the economy. Long-run market expectations are derived from 10-year-ahead overnight swap rates. Last observation is December 19, 2016. B. Impulse responses after 12 months from a PVAR model including EMDE industrial production, long-term bond yields, stock prices, nominal effective exchange rates and bilateral exchange rates against the U.S. dollar, and inflation, with monetary and real shocks as exogenous regressors. Monetary shocks are defined as in Box 1 of Arteta et al. (2015). All data are monthly or monthly averages of daily data, for January 2013-September 2015 for 23 EMDEs. For comparability, the size of the U.S. real and monetary shocks is normalized such that each shock raises EMDE bond yields by 100 basis points on impact.
-4.0
-2.0
0.0
2.0
4.0
Monetary shock Real shock
Percent
0
1
2
3
4
5
Se
pt-
14
De
c-1
5
Se
pt-
16
De
c-1
6
Se
pt-
14
De
c-1
5
Se
pt-
16
De
c-1
6
End-2017 Long run
RangeFOMC medianMarket expectations
Percent

CHAPTER 1 GLOBAL ECONOMIC PROSPECTS | JANUARY 2017 34
potential growth estimates have been reduced considerably since the crisis (Didier et al. 2015). This has reflected persistently low productivity growth and, increasingly, weak investment growth.
• Slowing productivity growth. Productivity growth has slowed considerably since the global financial crisis, both in advanced economies and EMDEs (Figure 1.19). The rate of technological progress appears to have declined since the early 2000s. Diffusion across countries might have been hampered by slower trade liberalization and financial integration (Buera and Oberfield 2016). Rapid population aging may exert additional pressure on productivity growth. In particular, a rising proportion of older workers has been associated with lower average productivity, as well as slower innovation and technological diffusion (Aksoy et al. 2015; Feyrer 2008; World Bank 2015b).
• Weak investment growth. Investment growth in EMDEs slowed steadily from 10 percent in 2010 to 3.4 percent in 2015, below its long-term average of 5.1 percent (Chapter 3).
By slowing the rate of capital accumulation and technological progress embedded in investment, weak investment has set back potential output growth (OECD 2015). Should investment continue to grow at a sluggish pace and long-term prospects be further downgraded, the resulting slow-down in capital accumulation could reduce EMDE potential output growth substantially. The largest slowdowns would be felt in commodity-exporting EMDEs, where investment remains particularly weak.
By reducing policy space, weakening potential growth further diminishes the ability of EMDEs to absorb adverse shocks. One important type of shock relates to growth disappointments in major economies. In particular, weaker-than-expected growth in the United States, the Euro Area, or China could have severe consequences for the rest of the world, given that these economies are deeply integrated into regional and global supply chains and finance, rendering them an important source of spillovers to EMDEs (World Bank 2016a).
Upside risk: fiscal stimulus in major economies
While downside risks continue to dominate the outlook, significant fiscal easing in major economies could support a more rapid pace of growth in global activity and investment in the near term than currently expected, and thus represents a substantial upside risk to the global outlook.
United States
Proposals for sizable Pscal stimulus measures put forward by the new administration in the United States—which have not been factored into baseline projections in the absence of further details about their scope—could result in faster-than-anticipated U.S. growth in the near term. Qese measures include reductions of corporate and personal income tax rates, as well as plans to stimulate infrastructure investment. However, the positive growth impact of these actions could be offset by shifts in the pattern of federal government outlays that result in sizable net
FIGURE 1.18 Risks - Low global interest rates and
financial instability
In an environment of low global interest rates, concerns about bank
profitability intensified in 2016, particularly in the Euro Area. Increased
pressure on Euro Area banks could have international spillovers, as they
play a major role in the provision of syndicated bank loans to EMDEs,
especially in Eastern Europe and Central Asia, and in Latin America and
the Caribbean.
B. Share of cross-border lending flows
accounted by Euro Area banks A. Euro Area bank stocks and CDS
spreads
Sources: Bloomberg, European Central Bank, World Bank. A. Equities refers to the Euro Stoxx500 banking sector sub-index. Subordinated bond CDS spreads are from Bloomberg. Last observation is December 19, 2016. B. EAP is East Asia and the Pacific, ECA is Eastern Europe and Central Asia, LAC is Latin America and the Caribbean, MNA is the Middle East and North Africa, SAR is South Asia, and SSA is Sub-Saharan Africa. Bank claims are as of December 2015.
0
10
20
30
40
50
EAP ECA LAC MNA SAR SSA
Percent of EMDE total0
100
200
300
40060
80
100
120
140
160
Jan
-12
Jul-
12
Jan
-13
Jul-
13
Jan
-14
Jul-
14
Jan
-15
Jul-
15
Jan
-16
Jul-
16
Equities (LHS)
CDS spread (RHS)
Index, Jan 1, 2012 = 100 Basis points

CHAPTER 1 GLOBAL ECONOMIC PROSPECTS | JANUARY 2017 35
spending cuts, or by fiscal sustainability concerns. Changes in some other U.S. policies, such as changes in trade policy, could also offset the positive effects of fiscal stimulus, or might even set back growth.
Reduction in corporate and personal income taxes. The fiscal proposals put forward by the new U.S. administration include a cut in the statutory corporate income tax rate from 35 to 15 percent. Such a corporate income tax cut could—by itself and without considering other policies by the new administration—boost U.S. GDP growth by around 0.6 percentage point after four quarters following implementation, and by cumulatively 0.9 to 1.3 percentage points after eight quarters, depending in particular on the reaction of monetary policy authorities.6
Another proposal suggested by the new administration is to cut personal income taxes, especially for the highest-income earners; reduce the number of individual income tax brackets; and change the structure of tax deductions. If fully implemented, these measures could reduce the average tax rate on personal income by about 2.5 percentage points, and by over 7 percentage points for top income earners (Nunns et al. 2016). Such a cut could—again, by itself—increase U.S. GDP growth by around 0.3 percentage point after four quarters following implementation and by cumulatively 0.4 to 0.6 percentage point after eight quarters, again depending in particular on the reaction of monetary policy authorities.7
Taken together, these corporate and personal income tax reforms could—without consideration of additional policy changes by the new administration—raise U.S. GDP growth forecasts to 2.2-2.5 percent in 2017 and 2.5-2.9 percent in 2018.8 These estimates depend on the timing of the tax cuts, the reaction of monetary policy authorities, the amount of slack remaining in the U.S. economy, and how businesses and households adjust their expectations to these policy changes. In particular, the upper bound of these ranges assumes that both corporate and personal income tax cuts are fully implemented in
6These results are based on simulations using the Federal Reserve Board’s model for the U.S. economy (FRB/US). Simulations assume full implementation of both corporate and personal income tax cuts at once (i.e. no phasing in). The lower estimate of the growth impact after eight quarters assumes that monetary policy adjusts following a traditional Taylor Rule. The upper estimate assumes no monetary policy reaction. The net loss of corporate tax revenues, caused by a 15 percentage-point reduction in the effective marginal tax rate implied by a 20 percentage-point statutory corporate income tax cut (Nunns et al. 2016), could amount to 1.2 percent of GDP in the first year. Implicitly, the fiscal multiplier—the additional output generated for each additional dollar of tax losses—would be 0.4 in the first year, which is within the range of available estimates (Chahrour, Schmitt-Grohé, and Uribe 2012). 7Results are also based on simulations using the FRB/US model. The net loss of personal income tax revenues caused by a 2.5 percentage point reduction in the average effective marginal tax rate is estimated to be around 1.0 percent of GDP in the first year, with a corresponding fiscal multiplier of 0.3. This is at the lower end of the
range of estimated fiscal multipliers generally associated with personal income tax cuts (0.3-1.5), but within the range of estimated fiscal multipliers associated with personal income tax cuts targeted to higher-income households (0.1-0.6; Whalen and Reichling 2015). 8Tax cuts can support stronger near-term growth by boosting households’ real disposable income and companies’ after-tax earnings and profit margins. According to FRB/US model simulations, the largest short-term growth effect would be associated with corporate income tax cuts, with investment being boosted by a rise in corporate profits and a reduction in the cost of capital. The effect on consumption would more limited, as household savings are projected to increase following the personal income tax cut. In the case where monetary policy is allowed to react to a more rapid closing of the output gap, interest rates are estimated to increase by an additional 60 basis points after four quarters, and by up to 100 basis points after eight quarters. The dollar would also appreciate, while inflation would remain broadly unchanged. The revenue loss for the government would increase the budget deficit by around 2.4 percent of GDP after eight quarters.
FIGURE 1.19 Risks - Weakening potential growth
Falling productivity growth has narrowed policy options by reducing fiscal
space and depressing real equilibrium interest rates. Rapid population
aging may exert additional pressure on productivity growth in coming
years.
B. Median productivity growth and
old worker ratios in G20 economies A. Labor productivity growth
Sources: Conference Board, Eurostat, Organisation for Economic Co-operation and Development, World Bank. A. Labor productivity growth is the annual percent change in the ratio of real GDP to total hours worked. Labor productivity data for 2016 are estimates. B. Median of total factor productivity growth and old (55-64) worker ratio out of total employment in G20 countries, excluding China and India. Total factor productivity growth is cyclically adjusted by Hodrick–Prescott filter.
0
1
2
3
2003-0
8
2010-1
5
2016
2003-0
8
2010-1
5
2016
2003-0
8
2010-1
5
2016
World Advancedeconomies
EMDEs
1990-2008 averagePercent
6
8
10
12
14
16
-1.0
-0.5
0.0
0.5
1.0
19
95
19
97
19
99
20
01
20
03
20
05
20
07
20
09
20
11
20
13
20
15
Total factor productivity growth (LHS)
Old worker ratio (RHS)
Percent Ratio

CHAPTER 1 GLOBAL ECONOMIC PROSPECTS | JANUARY 2017 36
the second quarter of 2017, and monetary policy does not react to the change in fiscal policy. In a more realistic scenario where monetary policy authorities adjust their policy stance, the growth impact is somewhat reduced, particularly in 2018. The lower bound of the range assumes both delayed implementation of the tax cuts to the first quarter of 2018 and a tightening of monetary policy in reaction to changes in fiscal policy. In addition, these estimates do not specifically take into account fiscal sustainability considerations.
Increase in infrastructure investment. The new U.S. administration has signaled a number of measures to stimulate infrastructure investment, but specifics remain to be formulated for both the overall size and the choice of measures (and, hence, their impact on activity). There have been suggestions of increasing both public investment in transportation and infrastructure and of boosting private investment through tax credits. Empirical studies suggest that increases in government infrastructure investment tend to have large immediate effects on activity, with fiscal multipliers often estimated to be markedly above 1 (Auerbach and Gorodnichenko 2013; Bivens 2014; Whalen and Reichling 2015). Empirical evidence regarding the effect of tax credit and policy-driven support to private investment in infrastructure in the United States is limited. Studies of comparable initiatives in Europe point to positive but limited net effects (Claeys and Leandro 2016). Until additional details are unveiled, it is difficult to quantify the potential impact of these measures on the outlook.
Changes in federal spending. The new U.S. administration has suggested sizable cuts in non-defense spending, likely accompanied by increases in defense spending. While specific proposals have not yet been made, it is possible that, on net, overall federal spending will be substantially reduced. Accordingly, the impact of corporate and personal income tax cuts and infrastructure spending on aggregate demand could be offset in the short term if overall federal spending is also cut. This offsetting effect would depend on the size of the net reduction in government outlays and on the estimated fiscal multiplier of various spending categories (Whalen and Reichling 2015).
Euro Area
While fiscal policy in the Euro Area is currently expected to be broadly neutral to growth in 2017, the European Commission has recommended a more expansionary stance, as it would lead to a more rapid closing of the output gap and restore space for monetary policy action (European Commission 2016). A fiscal expansion of up to 0.5 percent of GDP for the Euro Area as a whole could help reduce the wedge between projected inflation and the ECB’s 2 percent inflation target in 2017, without creating undue overheating in some member states or concerns about fiscal sustainability. Fiscal multipliers could be particularly elevated in the current environment of low interest rates and persistent economic slack (In't Veld 2016; Blanchard, Erceg, and Lindé 2015). The optimal distribution of fiscal stimulus measures across Euro Area countries would need to take into consideration available fiscal space and cyclical conditions.
Other major economies
If these fiscal stimulus measures in the United States and the Euro Area were to materialize, they would follow analogous growth-enhancing actions announced or already implemented by other major economies—particularly Japan and China. In mid-2016, Japan’s government announced a fiscal package aimed at supporting growth, including new public spending and income support measures. These measures are expected to add around 0.3 percentage point to growth in 2017, and account for the bulk of upside revisions to Japan’s growth forecast. In China, growth-enhancing fiscal policies throughout 2016—including infrastructure investment and a reduction of the tax burden on businesses—continued to support economic activity amid ample policy buffers. Chinese authorities recently indicated that, in 2017, they will step up fiscal measures aimed at supporting growth. Fiscal policy targets will be published in March 2017.
Spillovers to the rest of the world
Fiscal loosening in major economies could lead to faster-than-envisioned global growth in the near-

CHAPTER 1 GLOBAL ECONOMIC PROSPECTS | JANUARY 2017 37
term. Stronger U.S. growth would help global activity by raising U.S. demand for trading partners’ exports (Special Focus). Empirical estimates indicate that a 1 percentage-point shock to U.S. growth could boost growth after one year by 0.8 percentage point in other advanced economies, and by 0.6 percentage point in EMDEs (Figure 1.20).
In the illustrative scenario of reforms to U.S. corporate and personal income taxes discussed earlier, global growth (including the United States) could rise by up to 0.1 percentage point in 2017 if the tax cuts are fully implemented in the second quarter of the year. In addition, global growth could rise by at least 0.3 percentage point in 2018, depending on the timing of the tax cuts and the reaction of U.S. monetary policy authorities. While some of the proposed U.S. corporate tax reforms could potentially affect corresponding fiscal revenues in other countries where U.S. corporations operate, the net global impact of stronger activity and investment in the United States is likely to be positive (Clausing, Kleinbard, and Matheson 2016; Nicar 2015).
Beyond changes in corporate and personal income taxes, some other U.S. policy changes should also have beneficial cross-border effects. While the import content of U.S. infrastructure is relatively limited, additional infrastructure spending in the United States should have positive domestic supply-side effects and lead to beneficial spillover effects for the rest of the world. However, as discussed earlier, these positive spillovers could be offset by changes in others U.S. policies—most notably, trade policies, particularly in the hypothetical scenario that the United States imposes tariff increases, and such increases trigger retaliatory action by other countries.
An easing of the fiscal stance in the Euro Area could further reinforce the positive impact on global growth. Econometric analysis suggests that a 1 percentage-point increase in Euro Area growth could boost global growth by 0.9 percentage point after one year, with particularly sizable benefits for regional trading partners. In general, simultaneous loosening of fiscal policy across the United States, the Euro Area, and other major economies could
help prevent excessive real effective exchange rate adjustments and lead to additional positive effects for global growth (Frankel 2016; Auerbach and Gorodnichenko 2016).
Policy challenges
Challenges in major economies
Among advanced economies, unconventional monetary policies have become a common feature of central banks’ toolkits in the post-crisis period. These policies, while still needed in a number of countries to support growth and bring inflation back in line with policy objectives, are facing increasing constraints. As real equilibrium interest rates are expected to remain low, the materialization of downside risks to growth might necessitate more supportive fiscal policies. A shift towards more expansionary fiscal policies is underway in Japan and may materialize in the United States. Although macroeconomic policies should remain accommodative until clear evidence of capacity constraints emerge, they need to be combined with prompt implementation of structural reforms to boost productivity and long-term growth. In China, the main policy challenge is to increase the role of markets and facilitate resource reallocation to high-productivity sectors, while reining in credit growth.
FIGURE 1.20 Upside risk - fiscal stimulus in major
economies and growth spillovers
Significant fiscal easing in major advanced economies, particularly in the
United States, could support a more rapid recovery in global growth than
currently assumed.
B. Impact of 1 percentage-point
increase in Euro Area growth
A. Impact of 1 percentage-point
increase in U.S. growth
Source: World Bank. A. Cumulative impulse response to a 1-percentage-point increase in GDP growth in the United States. Based on a Bayesian vector autoregression of global GDP growth (excluding the United States, other advanced economies or EMDEs), U.S. GDP growth, U.S. 10-year government bond yields plus J.P.Morgan’s EMBI spreads and GDP growth in other advanced economies or EMDEs. B. Cumulative impulse response to a 1-percentage-point increase in GDP growth in the Euro Area. Based on the same methodology described in A., replacing U.S. by Euro Area GDP growth.
-0.5
0.0
0.5
1.0
1.5
2.0
2.5
On impact 1 Year 2 Year
Percentage point
Other advanced economies
EMDEs
Rest of the world
-0.5
0.0
0.5
1.0
1.5
2.0
2.5
On impact 1 Year 2 Year
Percentage point
Other advanced economies
EMDEs
Rest of the world

CHAPTER 1 GLOBAL ECONOMIC PROSPECTS | JANUARY 2017 38
flexibly in order to stabilize long-term interest rates at zero. Central banks in the Euro Area and Japan are expected to maintain exceptional levels of policy accommodation until wage growth is on a clear upward trend, and inflation expectations are firmly anchored around policy objectives.
While needed to support activity and inflation in the short term, persistently low or negative interest rates could entail growing challenges for financial stability (Arteta et al. 2016; Hannoun 2015, Shin 2016). Risks of asset price bubbles reinforce the need for timely and effective macro-prudential policies. The implementation of borrower-based measures, such as loan-to-value and debt-to-income ratio caps, can help mitigate credit cycles (Cerutti, Claessens, and Laeven 2016). The business models of financial institutions in advanced economies will need to continue to adapt; further consolidation and cost-cutting measures may be required to maintain profitability in an era of low interest rates.
Fiscal policy in advanced economies
Low interest rates imply growing monetary and financial policy challenges, but they have also contributed to a reassessment of the role of fiscal policy. In particular, countercyclical fiscal measures could more vigorously complement monetary policy in stabilizing growth and inflation in this context (Christiano, Eichenbaum, and Rebelo 2011). Fiscal multipliers could be notably larger when interest rates are expected to stay low, and when many borrowers face tight credit constraints (Woodford 2011; Carlstrom, Fuerst, and Paustian 2013; Ferraresi, Roventini, and Fagiolo 2015).
However, the effectiveness of fiscal stabilization would depend to some extent on how expectations about long-run taxes and spending are affected, even when interest rates are stuck at the lower bound (Denes, Eggertsson, and Gilbukh 2013). Thus, fiscal stimulus measures would best be combined with growth-friendly tax policies and a credible commitment to debt sustainability over the medium run. For countries in need of fiscal stimulus, but lacking the necessary space, a reallocation of expenditures toward public investment and tax reforms would need to
Monetary and financial policies in advanced economies
Faced with a secular decline in real equilibrium interest rates and with policy rates at or near their lower bound, most major central banks are expected to maintain low, and in some cases negative, nominal policy interest rates over the projection horizon. In the United States, where inflation is approaching the 2 percent target and the unemployment rate is below 5 percent, policy rates will increase, but are expected to settle at a lower level than in previous cycles (Figure 1.21). A very gradual tightening of U.S. monetary policy would eventually stimulate investment and labor participation, and might therefore help reverse some of the post-crisis deterioration in U.S. potential growth (Yellen 2016).
In the Euro Area, negative policy interest rates and extensive unconventional measures implemented by the European Central Bank have helped support activity, but have so far failed to lift long-term inflation expectations, which remain below target and have shown increasing sensitivity to transitory price shocks. In Japan, the Bank of Japan tested new ground in September 2016 by calibrating its asset purchase programs more
FIGURE 1.21 Advanced-economy monetary policies
U.S. monetary policy normalization is expected to continue, but policy rates
will likely increase at a gradual pace. The European Central Bank and the
Bank of Japan are expected to maintain policy rates in negative territory
until at least 2020. Despite some recovery during the second half of 2016,
long-term inflation expectations remain low and showed increasing
sensitivity to transitory price shocks in the post-crisis period.
B. Inflation expectations in the Euro
Area A. Policy rates and market
expectations
Sources: Bloomberg; Haver Analytics; Holston, Laubach, and Williams (2016); World Bank. A. Market expectations are derived from overnight indexed swap rates. Historical policy rates are for the effective fed funds (United States), EONIA (Euro Area), and overnight call rate (Japan). Shaded area indicates forecast. Last observation is December 19, 2016. B. Inflation expectations are implied by zero-coupon Euro-denominated inflation swap rates. Pre-crisis includes 2005-2007. Post-crisis includes 2010-November 2016.
R² = 0.44
R² = 0.84
0
1
2
3
-1 0 1 2 3
Pre-crisis
Post-crisis
Percent, 10-year expectations
Percent, 2-year expectations
0
1
-1
0
1
2
3
4
5
6
7
2000 2004 2008 2012 2016 2020
United StatesEuro AreaJapan
Percent

CHAPTER 1 GLOBAL ECONOMIC PROSPECTS | JANUARY 2017 39
be prioritized. Stronger and more predictable counter-cyclical fiscal policies would support faster recoveries and reduce deflation risk in future downturns, without jeopardizing debt sustainability (Elmendorf 2016; Buti and Gaspar 2015).
Despite higher debt-to-GDP ratios in the post-crisis period (Figure 1.22), ultra-low borrowing costs have led to a reduction in interest payments across most advanced economies. This, combined with infrastructure deficiencies in many economies, has reinforced the case for boosting public investment. Enhancing the efficiency of public administration and regulation could increase the thresholds above which public debt becomes detrimental to growth (Masuch, Moshammer, and Pierluigi 2016b).
In the United States, as discussed earlier, the new administration’s campaign pledge to significantly reduce corporate and personal income taxes and stimulate infrastructure investment would result in a more expansionary fiscal stance, if implemented. In 2016, Japan announced the implementation of a series of fiscal stimulus measures aimed at supporting growth. In the Euro Area, a more supportive fiscal stance to support economic activity has been formally recommended to members states, but has not yet been implemented (European Commission 2016). Discussions on the need for a more robust system of coordination of fiscal policy have also made some progress, although a more centralized fiscal capacity remains a distant prospect (IMF 2016h).
Structural policies in advanced economies
Structural reforms in advanced economies could further spur confidence in medium-term growth prospects, reverse the weakening of productivity growth, and meet growing demographic challenges. Moreover, a renewed commitment to trade liberalization in advanced economies would support trade prospects, as these economies still account for over 60 percent of global trade. Although existing regional trade agreements have a wide coverage, the numbers of new signed agreements dropped in 2015 to its lowest level since 1999 (Figure 1.23). To reduce protectionist pressures, it is important that the benefits of trade
FIGURE 1.23 Advanced-economy structural policies
Although existing regional trade agreements have a wide coverage, the
number of new signed agreements dropped in 2015 to its lowest level
since 1999. Market entry of new companies has declined in the post-crisis
period, contributing to slower productivity growth.
B. Firm entry rate A. Advanced-economy trade deals
signed
Sources: Eurostat; Japanese Ministry of Health, Labor, and Welfare; Organisation for Economic Cooperation and Development; World Bank. A. Data are by years of entry into the trade agreement. Red line indicates average over the period. B. Firm entry is calculated by taking the number of newly formed firms and dividing by the total number of existing firms. Pre-crisis refers to the average of: 2004-2007 for the United States, Japan, and Spain, 2005-2007 for Italy and Germany, 2006-2007 for the United Kingdom, and 2007 for France.
liberalization be shared more broadly. In particular, national policies should be reinforced to lower adjustments costs for those people most exposed to risks. This includes greater efforts to support skills development and re-training, to modernize social protection systems, and to support labor mobility.
Policies that deliver more immediate support to both private and public investment should be prioritized, including improvements in physical
0
2
4
6
8
10
12
14
16
U.K
.
U.S
.
Fra
nce
Spa
in
Ge
rma
ny
Italy
Ja
pan
Pre-crisis2010-2014 average
Percent
0
2
4
6
8
10
12
199
1
199
3
199
5
199
7
199
9
200
1
200
3
200
5
200
7
200
9
201
1
201
3
201
5
Number of trade agreements
FIGURE 1.22 Advanced-economy fiscal policies
Despite significantly higher public debt-to-GDP ratios in the post-crisis
period, low borrowing costs have reduced debt service burdens across
most advanced economies.
B. Interest payments on public debt A. Public debt
Sources: European Central Bank, Japan Cabinet Office, Organisation for Economic Cooperation and Development, World Bank. A. Latest is 2016Q3 for U.S. and Japan, and 2016Q2 for Euro Area. B. Latest is 2016Q3 for U.S., 2016Q2 for Euro Area, and 2016Q1 for Japan.
0.0
0.5
1.0
1.5
2.0
2.5
3.0
Euro Area United States Japan
2007Q4 LatestPercent of GDP
0
50
100
150
200
250
Euro Area United States Japan
2007Q4 Latest
Percent of GDP
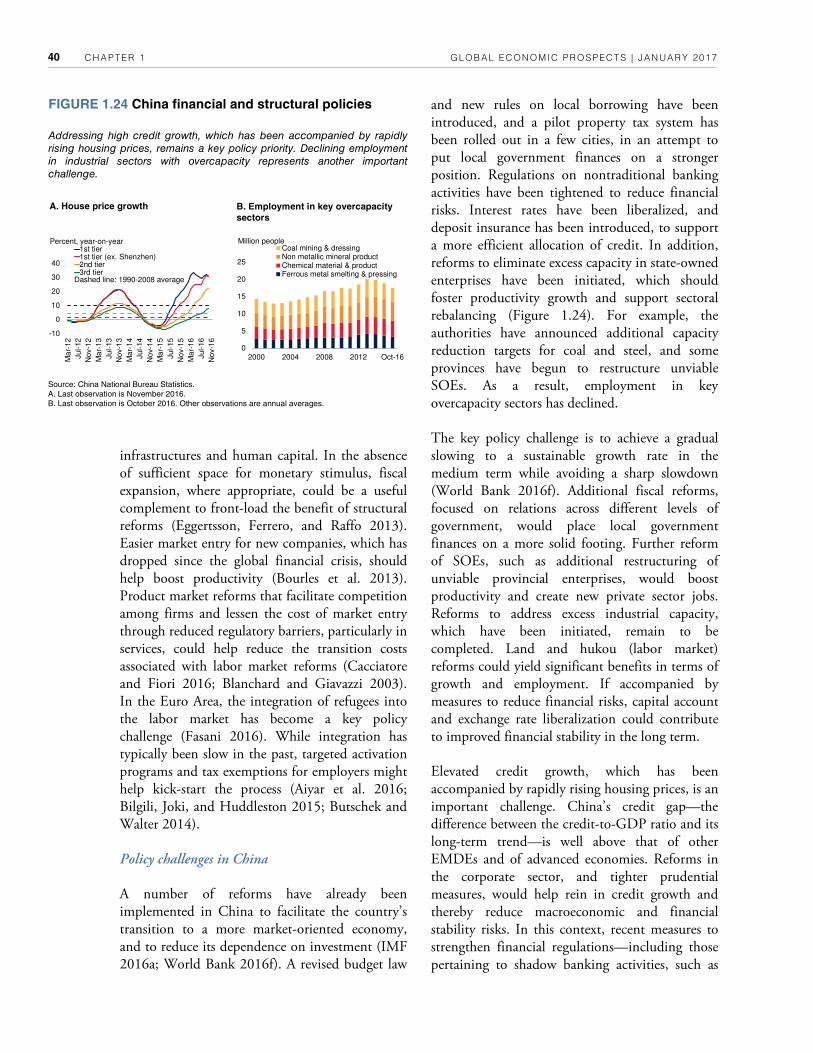
CHAPTER 1 GLOBAL ECONOMIC PROSPECTS | JANUARY 2017 40
infrastructures and human capital. In the absence of sufficient space for monetary stimulus, fiscal expansion, where appropriate, could be a useful complement to front-load the benefit of structural reforms (Eggertsson, Ferrero, and Raffo 2013). Easier market entry for new companies, which has dropped since the global financial crisis, should help boost productivity (Bourles et al. 2013). Product market reforms that facilitate competition among firms and lessen the cost of market entry through reduced regulatory barriers, particularly in services, could help reduce the transition costs associated with labor market reforms (Cacciatore and Fiori 2016; Blanchard and Giavazzi 2003). In the Euro Area, the integration of refugees into the labor market has become a key policy challenge (Fasani 2016). While integration has typically been slow in the past, targeted activation programs and tax exemptions for employers might help kick-start the process (Aiyar et al. 2016; Bilgili, Joki, and Huddleston 2015; Butschek and Walter 2014).
Policy challenges in China
A number of reforms have already been implemented in China to facilitate the country’s transition to a more market-oriented economy, and to reduce its dependence on investment (IMF 2016a; World Bank 2016f). A revised budget law
and new rules on local borrowing have been introduced, and a pilot property tax system has been rolled out in a few cities, in an attempt to put local government finances on a stronger position. Regulations on nontraditional banking activities have been tightened to reduce financial risks. Interest rates have been liberalized, and deposit insurance has been introduced, to support a more efficient allocation of credit. In addition, reforms to eliminate excess capacity in state-owned enterprises have been initiated, which should foster productivity growth and support sectoral rebalancing (Figure 1.24). For example, the authorities have announced additional capacity reduction targets for coal and steel, and some provinces have begun to restructure unviable SOEs. As a result, employment in key overcapacity sectors has declined.
The key policy challenge is to achieve a gradual slowing to a sustainable growth rate in the medium term while avoiding a sharp slowdown (World Bank 2016f). Additional fiscal reforms, focused on relations across different levels of government, would place local government finances on a more solid footing. Further reform of SOEs, such as additional restructuring of unviable provincial enterprises, would boost productivity and create new private sector jobs. Reforms to address excess industrial capacity, which have been initiated, remain to be completed. Land and hukou (labor market) reforms could yield significant benefits in terms of growth and employment. If accompanied by measures to reduce financial risks, capital account and exchange rate liberalization could contribute to improved financial stability in the long term.
Elevated credit growth, which has been accompanied by rapidly rising housing prices, is an important challenge. China’s credit gap—the difference between the credit-to-GDP ratio and its long-term trend—is well above that of other EMDEs and of advanced economies. Reforms in the corporate sector, and tighter prudential measures, would help rein in credit growth and thereby reduce macroeconomic and financial stability risks. In this context, recent measures to strengthen financial regulations—including those pertaining to shadow banking activities, such as
FIGURE 1.24 China financial and structural policies
Addressing high credit growth, which has been accompanied by rapidly
rising housing prices, remains a key policy priority. Declining employment
in industrial sectors with overcapacity represents another important
challenge.
B. Employment in key overcapacity
sectors
A. House price growth
Source: China National Bureau Statistics. A. Last observation is November 2016. B. Last observation is October 2016. Other observations are annual averages.
0
5
10
15
20
25
2000 2004 2008 2012 Oct-16
Coal mining & dressingNon metallic mineral productChemical material & productFerrous metal smelting & pressing
Million people
-10
0
10
20
30
40
Ma
r-1
2
Jul-
12
No
v-1
2
Ma
r-1
3
Jul-
13
No
v-1
3
Ma
r-1
4
Jul-
14
No
v-1
4
Ma
r-1
5
Jul-
15
No
v-1
5
Ma
r-1
6
Jul-
16
No
v-1
6
1st tier1st tier (ex. Shenzhen)2nd tier3rd tier
Percent, year-on-year
Dashed line: 1990-2008 average

CHAPTER 1 GLOBAL ECONOMIC PROSPECTS | JANUARY 2017 41
wealth management products and peer-to-peer lending—could be expanded. Strengthening the responsibility and capacity of local governments to manage debt, including contingent liabilities from off-budget activities, could help limit financial risks.
Challenges in emerging and developing economies
In the short term, macroeconomic policy challenges vary across EMDEs. While many commodity exporters face continued pressure to tighten monetary and fiscal policy, commodity importers need to maximize the benefits of past terms-of-trade gains. Over the medium term, both groups need to reduce vulnerabilities and rebuild policy space to cope with future shocks, including those that could emanate from policy changes in advanced economies. The need for domestic sources of growth in EMDEs increases the urgency of structural reforms, particularly those that boost investment in human and physical capital. Finding an appropriate balance between fiscal adjustment needs and these long-term investments will be challenging for some countries, suggesting a need to mobilize multilateral resources. Enhancing international integration by promoting services trade and foreign direct investment could also help support productivity and investment.
Monetary and financial policies
The decline in commodity prices in recent years has resulted in diverging inflation trends among EMDEs (Figure 1.25). Whereas inflation has generally moderated in commodity importers, it has picked up in commodity exporters—particularly in those with floating exchange rate regimes that experienced significant currency depreciation. As a result, monetary policy has been tightened across commodity exporters.
Since the start of 2016, this divergence has narrowed, reflecting the waning effects of earlier depreciation on inflation. However, inflation in commodity exporters is still generally above targets, limiting the ability of monetary authorities to provide accommodation. In some commodity exporters (Angola, Azerbaijan, Mongolia, Nigeria, Mozambique), the monetary policy stance still
remains notably contractionary. Inflation in commodity importers generally remains below target, indicating that there is scope for some central banks to loosen monetary policy (Hungary, Poland). This means that the paths of policy interest rates in importers and exporters will continue to diverge in the near term. However, the projected modest rebound in commodity prices in the next few years is likely to push up inflation in commodity importers and eventually limit the scope for additional accommodation.
FIGURE 1.25 EMDE monetary and financial policies
Divergence in inflation trends between commodity exporters and importers
continued in 2016. Inflation remains markedly high in commodity exporters
with floating exchange rates, and it is still above target levels in commodity
exporters more broadly, supporting a continued divergence in the path of
policy interest rates between exporters and importers. However, the
waning effect of currency depreciations in commodity exporters and of
past declines in energy prices for importers should narrow these
divergences in 2017. The U.S. dollar remains a dominant currency for
capital flows to EMDEs, which increases the likelihood that sharp U.S.
dollar appreciation could cause EMDE financial distress.
B. Gap between inflation and target A. Inflation trends
D. EMDE bond and bank loan inflows,
by currency C. Policy interest rates
Sources: Bank for International Settlements, Bloomberg, Central Bank News, Haver Analytics, World Bank. A. Floating ER stands for floating exchange rate. Fixed ER stands for fixed exchange rate. Figure includes 42 commodity-exporting and 33 commodity-importing countries and shows median consumer inflation in each of the respective groups. Last observation is November 2016. B. Figure includes 24 commodity-exporting and 17 commodity-importing countries with a stated inflation target and for which current inflation data is available. C. Figure includes 33 commodity-exporting and 20 commodity-importing countries and shows unweighted averages of policy rates in each group. Last observation is November 2016. D. Currency composition of EMDE bond issuance and cross-border bank lending. Data is for June 2016.
-10
-5
0
5
10
15
20
25
Apr-16 Jul-16 Nov-16 Apr-16 Jul-16 Nov-16
Commodity exporters Commodity importers
Range Median MeanPercentage points
3
4
5
6
7
8
9
20
12
20
13
20
14
20
15
20
16
Commodity exportersCommodity importers
Percent
0
20
40
60
80
100
Bank lending Bond issuance
US$ Euro Yen OtherPercent
0
2
4
6
8
10
20
12
20
13
20
14
20
15
20
16
Commodity exporters, floating ERCommodity exporters, fixed ERCommodity importers
Percent, year-on-year

CHAPTER 1 GLOBAL ECONOMIC PROSPECTS | JANUARY 2017 42
The implementation of negative interest rate policies by a number of major central banks has helped contain the overall level of global interest rates (Arteta et al. 2016). Easy financial conditions supported a resumption of capital flows to EMDEs for most of 2016 and may have contributed to diversification of the currency composition of capital inflows. However, sudden changes in market sentiment, or advanced-economy policy changes, could make capital inflows more volatile, while ongoing inflows could, over time, generate vulnerabilities (Arslan
and Taskin 2014; Lane and McQuade 2014). In addition, a more pronounced divergence in monetary policies between the U.S. Federal Reserve and other major central banks would contribute to further dollar appreciation and hence heavier debt servicing costs and credit risks for some EMDEs.
The weak macroeconomic environment in a number of EMDEs may erode bank asset quality and lead to an increase in non-performing loans. This suggests the need for macro-prudential tools to assess and bolster the resilience of the financial system, including more frequent or more stringent stress testing of bank and corporate balance sheets and regulation to facilitate restructuring of non-performing corporate loans. A general strengthening of the institutional environment—including the speedy resolution of bankruptcies and troubled assets, as well as the timely restructuring of financial institutions—could improve growth prospects while reducing vulnerabilities.
Fiscal policy
In general, fiscal space in EMDEs remains limited. With fiscal deficits in commodity exporters having bottomed out in 2016, the most acute nega- tive impacts of the extended period of low commodity prices on the government finances of these countries may have now passed (Figure 1.26). However, as deficits remain high, espe-cially in oil-exporting countries, fiscal policy adjustment to low prices will need to continue through the medium term in order to restore fiscal sustainability. Spending and revenue plans will need to be formulated strategically to stabilize debt ratios.
For commodity importers, the anticipated rise in commodity prices, particularly for oil, suggests that further improvement in fiscal space via the reduction of spending on energy subsidies or other social support measures may become more politically challenging. Among exporters, while the expected increase in commodity prices will relieve some of the pressure on fiscal positions, the uptick will not be rapid enough to offset the revenues lost during the price collapse over the past few years.
FIGURE 1.26 EMDE fiscal policies
Fiscal space remains limited among EMDEs. In commodity exporters,
fiscal balances and fiscal sustainability gaps deteriorated markedly
following the decline in commodity prices of the past three years, while
commodity importers were not able to improve their fiscal positions. A
projected rise in oil prices will relieve some of the fiscal pressures in
energy exporters, but the uptick will not be enough to allow governments
to revert to the pace of spending growth observed prior to the oil price
bust. Fiscal adjustment will need to continue through the medium term in
both groups of countries.
B. Fiscal sustainability gap A. Fiscal balance
D. Government debt C. Government spending growth
Sources: Haver Analytics, International Monetary Fund, World Bank. A.C.D. Gray area denotes forecast. A. Figure reflects unweighted average of 89 commodity-exporting and 62 commodity-importing EMDEs. B. Sustainability gap is measured as the difference between the primary balance and the debt-stabilizing primary balance, assuming historical average (1990–2016) interest rates and growth rates. The more negative the gap, the more unsustainable fiscal policy is assessed to be. Figure shows unweighted average of 41 commodity-exporting and 24 commodity-importing EMDEs. C. Figure reflects unweighted average of 84 commodity-exporting and 62 commodity-importing EMDEs. República Bolivariana de Venezuela and South Sudan are excluded due to outlying data during years shown. D. Figure reflects unweighted average gross government debt of 86 commodity-exporting and 61 commodity-importing EMDEs.
-5
-4
-3
-2
-1
0
2014 2015 2016
Commodity exporters
Commodity importers
Percent of GDP
0
3
6
9
12
2014 2015 2016 2017 2018
Commodity exportersCommodity importers
Percent
0
10
20
30
40
50
60
2014 2015 2016 2017 2018
Commodity exporters
Commodity importers
Percent of GDP
-8
-7
-6
-5
-4
-3
-2
-1
0
2014 2015 2016 2017 2018
Commodity exportersCommodity importers
Percent of GDP

CHAPTER 1 GLOBAL ECONOMIC PROSPECTS | JANUARY 2017 43
Continued weakness in global trade will also constrain improvements in fiscal positions, particularly for commodity exporters.
Low interest rates in advanced economies have helped contain borrowing costs, particularly for creditworthy borrowers. Broadly, though, EMDEs need to improve their fiscal profiles in order to reach a position where budgets are sustainable even as global financing conditions tighten. In the medium term, credible and well-designed fiscal targets, medium-term expenditure frameworks, broader tax bases, improved tax administration, and replenished stabilization funds can help restore fiscal space. In a number of large EMDEs, some of these aspects are included in ambitious reform programs now in progress (e.g., implementation of the Goods and Services Tax in India, the National Transformation Plan in Saudi Arabia) and will dominate the medium-term domestic fiscal policy agenda. Follow-through on the implementation of these programs is essential. More generally, policymakers need to consider the country-specific short-term and long-term ramifications of changes in tax structures and public spending composition for growth and investment.
Structural Policies
The limited room for macroeconomic policies to boost EMDE activity in the short term highlights the pressing need for structural policies that improve longer-term growth prospects. These policies have complementary domestic and international dimensions. On the one hand, during a time of stalling trade liberalization and a rising risk of protectionism, policies to promote further EMDE trade and financial integration are essential. Reforms to support the integration of EMDEs in global value chains, boost the growth of services trade, and maximize the benefits from FDI would be particularly helpful. Policy measures aimed to liberalize services trade and FDI are especially important for EMDEs where barriers remain significant. These reforms would need to be accompanied by measures to mitigate adverse distributional effects of trade openness, such as the loss of certain types of jobs or increased income inequality. On the other hand,
the protracted weakness and heightened policy uncertainty in advanced economies, and limited support from external demand, highlights the importance of EMDE policies that strengthen domestic demand and expand domestic sources of productivity and long-term output growth, such as investment in human and physical capital.
Services trade
Services account for about two-thirds of global economic output, and over 50 percent of output in most EMDE regions (Figure 1.27). The size of the services sector also exhibits a positive association with per-capita income levels. Services trade can be a stabilizing factor during an
FIGURE 1.27 Services trade in EMDEs
Services account for about two-thirds of global economic output and are
positively associated with per-capita income. EMDEs perform well in
services exports such as tourism and transportation but have significant
untapped potential in other sectors, such as financial and communication
services. Notable barriers to services trade remain.
B. Size of services sector and income
per capita
A. Services value added
D. Size of services sector and trade
restrictions
C. Composition of services exports
Sources: Borchert, Gootiiz, and Mattoo (2012); United Nations Conference on Trade and Development; World Bank. A. EAP is East Asia and the Pacific, ECA is Eastern Europe and Central Asia, LAC is Latin America and the Caribbean, MNA is the Middle East and North Africa, SAR is South Asia, and SSA is Sub-Saharan Africa. B. Horizontal axis denotes GDP per capita in purchasing power parity terms, in logarithm. D. The Services Trade Restrictiveness Index (STRI) is a measure of the restrictiveness of a country’s policy regime ranging from 0 (no restrictions) to 100 (completely closed). It covers 103 countries, five sectors (telecommunications, finance, transportation, retail, and professional services) and the key modes of service supply.
20
30
40
50
60
70
80
90
100
6 8 10 12GDP per capita, U.S. dollars
Advanced economies
EMDEs
Best fit line
Services, percent of GDP
0
10
20
30
Tra
nsp
ort
Tra
vel
Com
munic
ations
Con
str
uction
Insura
nce
Fin
an
cial
Info
rmation
Royaltie
s
Busin
ess
Pers
onal
Govern
ment
Advanced economies
EMDEs
Percent of total
0
10
20
30
40
50
60
70
80
90
40 50 60 70 80Services Trade Restrictiveness Index
Advanced economies
EMDEsBest fit line
Services, percent of GDP
0
10
20
30
40
50
60
70
80
Worl
d
LA
C
EA
P
EC
A
SA
R
SS
A
MN
A
1990 2014 50% linePercent of GDP

CHAPTER 1 GLOBAL ECONOMIC PROSPECTS | JANUARY 2017 44
obtaining business licenses and permits.9
Negotiations have resumed on provisions of the Trade in Services Agreement (WTO 2016a). Appropriate policies to improve the linkages of services trade with other domestic sectors, and to enhance the export capacity of EMDEs, could mobilize untapped sources of growth (Hoekman and Mattoo 2008; World Bank 2016i).
Foreign direct investment
Despite softness in 2015 and 2016, particularly in commodity exporters, and regional differences notwithstanding, aggregate FDI stocks in EMDEs have been growing at a faster annual average pace than those in advanced economies during the last decade (Figure 1.28). Foreign affiliates generated value-added of $7.9 trillion in 2015, or about 11 percent of world GDP, while employing about 79 million people (UNCTAD 2016). While FDI flows between advanced economies are still prevalent, EMDEs are becoming more attractive destinations for FDI for greenfield investment, but less so for mergers and acquisitions.
Under appropriate conditions, FDI boosts output growth in both home and host countries. FDI is a stable source of a financing that can bridge the gap between savings and investment of the host country (Kose et al. 2009). Multinational corporations (MNCs) are a prominent source of technology transfer and technical/management skills (Gorg and Greenway 2004). Employment effects on the host countries are generally beneficial, as MNCs create additional employment opportunities and, typically, pay higher wages than domestic companies (Javorcik 2015; Martins 2004; World Bank 1997). MNCs can encourage competition in the host country markets and thus boost innovation. In addition, MNCs can bring indirect benefits by encouraging domestic reforms.
In many EMDEs, barriers to FDI are still significant, and sometimes prohibitive—e.g., in real estate development, engineering services, and legal and accounting services. Because of the
economic crisis. For example, during the global financial crisis, exports of services were less synchronized across countries than exports of goods, suffered a smaller decline, and, after the crisis, recovered earlier than goods trade (Borcert and Mattoo 2010; Ariu 2016). EMDEs generally perform well in services exports such as tourism and transportation. However, they lag behind in other sectors, including finance, insurance, and communication services (World Bank 2016h).
Notable barriers to services trade remain. The most restrictive barriers involve limitations on the entry and establishment of foreign firms, local content requirements, restrictions on the movement of professionals, and discrimination in
9Barriers to services trade cover all four modes of supply of services across borders: cross-border trade (mode 1), consumption abroad (mode 2), foreign commercial presence (mode 3), and the presence of natural persons (professionals) abroad (mode 4).
FIGURE 1.28 Foreign direct investment in EMDEs
Despite softness in recent years, aggregate FDI stocks in EMDEs have
been growing at a faster pace than those in advanced economies during
the last decade. While FDI flows between advanced economies are still
prevalent, EMDEs are becoming more attractive destinations for FDI,
especially for greenfield investment. In many EMDEs, barriers to FDI are
still significant or completely prohibitive, highlighting the scope for further
liberalization.
B. Inward FDI stocks A. Inward FDI stocks
D. Barriers to FDI C. Composition of FDI
Sources: Organisation for Economic Cooperation and Development, United Nations Conference on Trade and Development, World Bank. C. Greenfield FDI relates to investment projects that entail the establishment of new entities and the setting up of offices, buildings, plants and factories from scratch abroad. Cross–border mergers and acquisitions entail the taking over or merging of capital, assets, and liabilities of existing enterprises. D. FDI restrictiveness covers four types of measures: (i) foreign equity restrictions, (ii) screening and prior approval requirements, (iii) rules for key personnel, and (iv) other restrictions on the operation of foreign enterprises. The highest score is 1 (fully restricted to foreign investment) and the lowest is 0 (there are no regulatory impediments to FDI). Lines refer to averages of country groups.
0
10
20
30
40
50
19
80
19
85
19
90
19
95
20
00
20
05
20
10
20
15
Advanced economiesEMDEs
Percent of GDP
0
200
400
600
800
1000
20
05
20
10
20
15
Greenfield FDI Mergers and acquisitions
20
05
20
10
20
15
EMDEsAdvanced economies
US$, billion
0
0.1
0.2
0.3
0.4
Phili
ppin
es
Chin
a
Myanm
ar
Saudi A
rabia
Indo
nesia
Jord
an
India
Ma
laysia
Tun
isia
Mexic
o
Advanced economies EMDEsIndex
0
1
2
3
4
5
6
7
8
9
0
5
10
15
20
19
80
19
85
19
90
19
95
20
00
20
05
20
10
20
15
Advanced economies (LHS)EMDEs (RHS)
US$, trillions US$, trillions
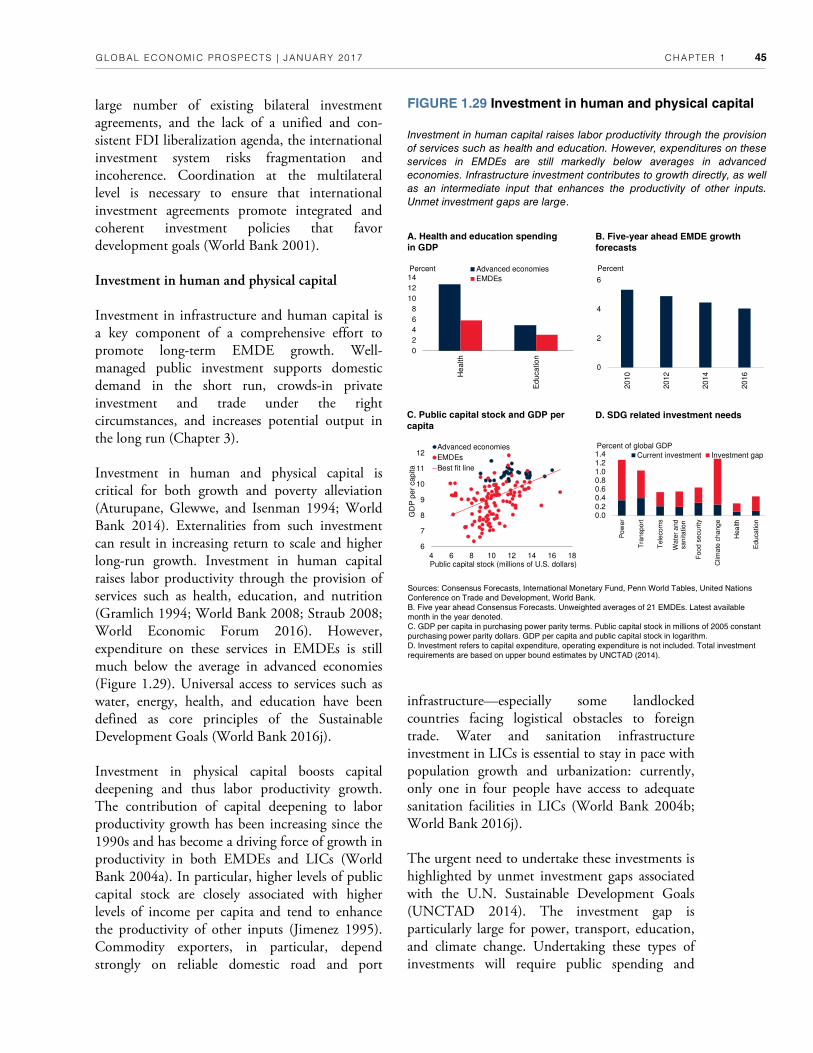
CHAPTER 1 GLOBAL ECONOMIC PROSPECTS | JANUARY 2017 45
large number of existing bilateral investment agreements, and the lack of a unified and con-sistent FDI liberalization agenda, the international investment system risks fragmentation and incoherence. Coordination at the multilateral level is necessary to ensure that international investment agreements promote integrated and coherent investment policies that favor development goals (World Bank 2001).
Investment in human and physical capital
Investment in infrastructure and human capital is a key component of a comprehensive effort to promote long-term EMDE growth. Well-managed public investment supports domestic demand in the short run, crowds-in private investment and trade under the right circumstances, and increases potential output in the long run (Chapter 3).
Investment in human and physical capital is critical for both growth and poverty alleviation (Aturupane, Glewwe, and Isenman 1994; World Bank 2014). Externalities from such investment can result in increasing return to scale and higher long-run growth. Investment in human capital raises labor productivity through the provision of services such as health, education, and nutrition (Gramlich 1994; World Bank 2008; Straub 2008; World Economic Forum 2016). However, expenditure on these services in EMDEs is still much below the average in advanced economies (Figure 1.29). Universal access to services such as water, energy, health, and education have been defined as core principles of the Sustainable Development Goals (World Bank 2016j).
Investment in physical capital boosts capital deepening and thus labor productivity growth. The contribution of capital deepening to labor productivity growth has been increasing since the 1990s and has become a driving force of growth in productivity in both EMDEs and LICs (World Bank 2004a). In particular, higher levels of public capital stock are closely associated with higher levels of income per capita and tend to enhance the productivity of other inputs (Jimenez 1995). Commodity exporters, in particular, depend strongly on reliable domestic road and port
infrastructure—especially some landlocked countries facing logistical obstacles to foreign trade. Water and sanitation infrastructure investment in LICs is essential to stay in pace with population growth and urbanization: currently, only one in four people have access to adequate sanitation facilities in LICs (World Bank 2004b; World Bank 2016j).
The urgent need to undertake these investments is highlighted by unmet investment gaps associated with the U.N. Sustainable Development Goals (UNCTAD 2014). The investment gap is particularly large for power, transport, education, and climate change. Undertaking these types of investments will require public spending and
FIGURE 1.29 Investment in human and physical capital
Investment in human capital raises labor productivity through the provision
of services such as health and education. However, expenditures on these
services in EMDEs are still markedly below averages in advanced
economies. Infrastructure investment contributes to growth directly, as well
as an intermediate input that enhances the productivity of other inputs.
Unmet investment gaps are large.
B. Five-year ahead EMDE growth
forecasts A. Health and education spending
in GDP
D. SDG related investment needs C. Public capital stock and GDP per
capita
Sources: Consensus Forecasts, International Monetary Fund, Penn World Tables, United Nations Conference on Trade and Development, World Bank. B. Five year ahead Consensus Forecasts. Unweighted averages of 21 EMDEs. Latest available month in the year denoted. C. GDP per capita in purchasing power parity terms. Public capital stock in millions of 2005 constant purchasing power parity dollars. GDP per capita and public capital stock in logarithm. D. Investment refers to capital expenditure, operating expenditure is not included. Total investment requirements are based on upper bound estimates by UNCTAD (2014).
0
2
4
6
20
10
20
12
20
14
20
16
Percent
Public capital stock (millions of U.S. dollars)
6
7
8
9
10
11
12
4 6 8 10 12 14 16 18
GD
P p
er
cap
ita
Advanced economies
EMDEs
Best fit line
0.00.20.40.60.81.01.21.4
Pow
er
Tra
nsport
Tele
com
s
Wate
r and
sanita
tion
Food
security
Clim
ate
change
Hea
lth
Educa
tion
Current investment Investment gap
Percent of global GDP
0
2
4
6
8
10
12
14
He
alth
Educa
tion
Advanced economies
EMDEs
Percent

CHAPTER 1 GLOBAL ECONOMIC PROSPECTS | JANUARY 2017 46
efforts geared towards improving existing delivery mechanisms (World Bank 2016h). However, many of the EMDEs facing pressing investment needs have very limited fiscal space. For these countries, finding an appropriate balance between fiscal adjustments needed in the short term and structural policies aimed at supporting unmet investment needs will be particularly challenging. This dilemma could be somewhat eased—to different extents across countries and regions—by the aforementioned fiscal reform efforts. In addition, the multilateral community, including international financial institutions, should make it a priority to coordinate and mobilize fiscal resources to enhance these countries’ ability to
meet their investment needs, particularly in a context of low global interest rates and modest average borrowing costs. The returns from well-designed programs, in the form of improved productivity and long-term prosperity, are likely to easily exceed the current low real costs of long-term borrowing.
Poverty and income inequality
Growth has been the main driver of poverty reduction over the last two decades—even more so than changes in income distribution (World Bank 2016k). Repeated growth disappointments, particularly among commodity-exporting countries, and slowing potential growth across EMDEs could set back progress toward poverty reduction goals (Lakner, Negre, and Prydz 2014). If income per capita would continue to grow at the weak pace observed in 2015, extreme poverty would remain significantly above the World Bank’s 3 percent target by 2030 (Figure 1.30). In contrast, a return to high pre-crisis (2003-08) growth rates in EMDEs could reduce extreme poverty to 3 percent by 2030, unless income inequality increases. In an intermediate scenario where growth stabilizes around its long-term average (1990-08), the poverty reduction goal would only be attainable if there is a sustained reduction in income inequality.
The eradication of extreme poverty will therefore require both robust growth and determined policy action. Such policy action includes domestic policies focusing on safety nets, human capital, and infrastructure development. Beyond country specificities, key policy areas include early childhood development, universal health care, universal access to good-quality education, conditional cash transfers, investments in rural roads and electrification, and taxation. If well-designed, these policies can have favorable effects on both inequality and poverty reduction, without major efficiency and equity trade-offs.
FIGURE 1.30 Impact of growth and inequality on poverty
reduction
With unchanged income distributions, a return to the high growth rates
EMDEs experienced in 2003-08 would reduce extreme poverty to the
World Bank’s 3 percent target by 2030. However, if growth continues at
the weak pace observed in 2015, or if income inequality increases,
extreme poverty would remain significantly above target. Reaching the 3
percent poverty goal by 2030 will require both sustained growth and
determined policy action to reduce income inequality.
B. Evolution of the share of global
poor under different inequality
scenarios
A. Share of global poor in 2030 under
different growth scenarios
Sources: Lakner, Negre, and Prydz (2014); World Bank. A. Global poor is defined as the population living under US$1.90/day. Simulations based on a sample of 113 EMDEs. “Poverty rate in 2030 (constant inequality)” corresponds to a scenario where income per capita growth of the bottom 40 percent and the mean population is the same in each country. “Poverty rate in 2030 (rising inequality)” corresponds to a scenario where income per capita growth of the bottom 40 percent is lower than that of the mean population income by 2 percentage points per year in each country. B. Assumes that income per capita growth over the period 2014-30 equals the long-term average (1990-2008) for each country. “Poverty rate (rising inequality)” corresponds to a scenario where income per capita growth of the bottom 40 percent is lower than that of the mean population income by 2 percentage points per year in each country. “Poverty rate (constant inequality)” corresponds to a scenario where income per capita growth of the bottom 40 percent and the mean population is the same in each country. “Poverty rate (falling inequality)” corresponds to a scenario where income per capita growth of the bottom 40 percent is higher than that of the mean population income by 2 percentage points per year in each country.
0
3
6
9
12
201
3
201
5
201
7
201
9
202
1
202
3
202
5
202
7
202
9
Poverty rate (rising inequality)
Poverty rate (constant inequality)
Poverty rate (falling inequality)
3 percent poverty goal
Percent
0
3
6
9
12
15
1990-2008growth
2003-08growth
2010-14growth
2015growth
Percent Poverty rate in 2030 (rising inequality)
Poverty rate in 2030 (constant inequality)
Poverty rate in 2013
3 percent poverty goal

CHAPTER 1 GLOBAL ECONOMIC PROSPECTS | JANUARY 2017 47
ANNEX TABLE 1 List of emerging market and developing economies1
Commodity Exporters2 Commodity Importers3
Albania* Malawi Afghanistan Pakistan
Algeria* Malaysia* Antigua and Barbuda Palau
Angola* Mali Bahamas, The Panama
Argentina Mauritania Bangladesh Philippines
Armenia Mongolia Barbados Poland
Azerbaijan* Morocco Belarus Romania
Bahrain* Mozambique Bhutan Samoa
Belize Myanmar* Bosnia and Herzegovina Serbia
Benin Namibia Bulgaria Seychelles
Bolivia* Nicaragua Cabo Verde Solomon Islands
Botswana Niger Cambodia St. Kitts and Nevis
Brazil Nigeria* China St. Lucia
Burkina Faso Oman* Comoros St. Vincent and the Grenadines
Burundi Papua New Guinea Croatia Swaziland
Cameroon* Paraguay Djibouti Thailand
Chad* Peru Dominica Tunisia
Chile Qatar* Dominican Republic Turkey
Colombia* Russia* Egypt, Arab Rep. Tuvalu
Congo, Dem. Rep. Rwanda El Salvador Vanuatu
Congo, Rep.* Saudi Arabia* Eritrea Vietnam
Costa Rica Senegal Fiji
Côte d'Ivoire Sierra Leone Georgia
Ecuador* South Africa Grenada
Equatorial Guinea* Sri Lanka Haiti
Ethiopia Sudan* Hungary
Gabon* Suriname India
Gambia, The Tajikistan Jamaica
Ghana* Tanzania Jordan
Guatemala Timor-Leste* Kiribati
Guinea Togo Kosovo
Guinea-Bissau Tonga Lebanon
Guyana Trinidad and Tobago* Lesotho
Honduras Turkmenistan* Liberia
Indonesia* Uganda Macedonia, FYR
Iran, Islamic Rep.* Ukraine Maldives
Iraq* United Arab Emirates* Marshall Islands
Kazakhstan* Uruguay Mauritius
Kenya Uzbekistan Mexico
Kuwait* Venezuela, RB* Micronesia, Fed. Sts.
Kyrgyz Republic West Bank and Gaza Moldova, Rep.
Lao, PDR Zambia Montenegro
Madagascar Zimbabwe Nepal
1 Emerging Market and Developing Economies (EMDEs) includes all those that are not classified as advanced economies. Advanced economies include Australia; Austria; Belgium; Canada; Cyprus; the Czech Republic; Denmark; Estonia; Finland; France; Germany; Greece; Hong Kong SAR, China; Iceland; Ireland; Israel; Italy; Japan; the Republic of Korea; Latvia; Lithuania; Luxembourg; Malta; Netherlands; New Zealand; Norway; Portugal; San Marino; Singapore; the Slovak Republic; Slovenia; Spain; Sweden; Switzerland; the United Kingdom; and the United States. 2 Energy exporters are denoted by an asterisk. An economy is defined as commodity exporter when, on average in 2012-14, either (i) total commodities exports accounted for 30 percent or more of total goods exports or (ii) exports of any single commodity accounted for 20 percent or more of total goods exports. Economies for which these thresholds were met as a result of re-exports were excluded. When data were not available, judgment was used. This taxonomy results in the classification of some well-diversified economies as importers, even if they are exporters of certain commodities (e.g., Mexico). 3 Commodity importers are all EMDE economies that are not classified as commodity exporters.

CHAPTER 1 GLOBAL ECONOMIC PROSPECTS | JANUARY 2017 48
References
Aaronson, S., T. Cajner, B. Fallick, F. Galbis-Reig, C. L. Smith, and W. Wascher. 2014. “Labor Force Participation: Recent Developments and Future Prospects.” Federal Reserve Bank of Cleveland Working Paper.
Aiyar, S., B. Barkbu, N. Batini, H. Berger, E. Detragiache, A. Dizioli, C. Ebeke, et al.. 2016. “Qe Refugee Surge in Europe: Economic Challenges.” StaU Discussion Notes 16/2, International Monetary Fund, Washington, DC.
Aksoy, Y., H. Basso, T. Grasl, and R. Smith. 2015. “Demographic Structure and Macroeconomic Trends.” Working Papers in Economics and Finance 1501, Birkbeck University of London.
Ariu, A. 2016. “Crisis-Proof Services: Why Trade in Services did not SuUer During the 2008–2009 Collapse.” Journal of International Economics 98: 138-149.
Arslan, Y., and T. Taskin. 2014. “International Evidence on the Interaction between Cross-Border Capital Flows and Domestic Credit Growth.” Working Paper 14/18, Central Bank of the Republic of Turkey, Ankara.
Arslanalp, S., and D. Botman. 2015. “Portfolio Rebalancing in Japan: Constraints and Implications for Quantitative Easing.” IMF Working Paper 15/186, International Monetary Fund, Washington, DC.
Arteta, C., M. A. Kose, F. Ohnsorge, and M. Stocker. 2015. “Qe Coming U.S. Interest Rate Tightening Cycle: Smooth Sailing or Stormy Waters?” Policy Research Note 15/02, World Bank, Washington, DC.
Arteta, C., M. A. Kose, M. Stocker, and T. Taskin. 2016. “Negative Interest Rate Policies: Sources and Implications.” Discussion Paper 11433, Centre for Economic Policy Research, London.
Aturupane, H., P. Glewwe, and P. Isenman. 1994. “Poverty, Human Development, and Growth: An Emerging Consensus?” American Economic Review 84 (2): 244-249.
Auerbach, A., and Y. Gorodnichenko. 2012. “Measuring the Output Responses to Fiscal Policy.” American Economic Journal: Economic Policy 4 (2): 1-27.
________. 2016. “EUects of Fiscal Shocks in a Globalized World.” IMF Economic Review 64 (1): 177-215.
________. 2013. “Fiscal Multipliers in Recession and Expansion.” In Fiscal Policy after the Financial Crisis Working Paper, edited by A. Alesina and F. Giavazzi. University of Chicago Press.
BaUes, J., M. A. Kose, F. Ohnsorge, and M. Stocker. 2015. “Qe Great Plunge in Oil Prices: Causes, Consequences, and Policy Response.” Policy Research Note 15/01, World Bank, Washington, DC.
Baker, S., N. Bloom, and S. Davis. 2013. “Measuring Economic Policy Uncertainty.” NBER Working Paper 21633, National Bureau of Economic Research, Cambridge, MA.
BIS (Bank for International Settlements). 2016. “Statistical Bulletin.” BIS Quarterly Review (September): 247–273.
Behar, A., and A. Fouejieu. 2016. “External Adjustment in Oil Exporters: Qe Role of Fiscal Policy and the Exchange Rate.” Working Paper 16/107, International Monetary Fund, Washington, DC.
Bilgili, Ö., A. Joki, and T. Huddleston. 2015. “Qe Dynamics between Integration Policies and Outcomes: A Synthesis of the Literature.” Unpublished paper, Migration Policy Group, Brussels.
Bivens, J. 2014. “Qe Short- and Long-Term Impact of Infrastructure Investments on Employment and Economic Activity in the U.S. Economy.” EPI BriePng Paper #374, Economic Policy Institute, Washington, DC.
Blanchard, O., and F. Giavazzi. 2003. “Macroeconomic EUects of Regulation and Deregulation in Goods and Labor Markets.” Quarterly Journal of Economics 118 (3): 879-907.

CHAPTER 1 GLOBAL ECONOMIC PROSPECTS | JANUARY 2017 49
Blanchard, O., C. J. Erceg, J. Lindé. 2015. “Jump Starting the Euro Area Recovery: Would a Rise in Core Fiscal Spending Help the Periphery?” Working Paper 21426, National Bureau of Economic Research, Cambridge, MA.
Borchert, I., and A. Mattoo. 2010. “Qe Crisis-Resilience of Services Trade.” De Service Industries Journal 30 (13): 2115-2136.
Borio, C., L. Gombacorta, and B. Hofmann. 2015. “Qe InZuence of Monetary Policy on Bank ProPtability.” Working Paper 514, Bank for International Settlements, Basel.
Bouet, A., and D. Laborde. 2010. “Assessing the Potential Cost of a Failed Doha Round.” World Trade Review 9 (02): 319-351.
Bourlès, R., G. Cette, J. Lopez, J. Mairesse, and G. Nicoletti. 2013. “Do Product Market Regulations in Upstream Sectors Curb Productivity Growth? Panel Data Evidence for OECD Countries.” De Review of Economics and Statistics 95 (5): 1750-1768.
Brayton, F., T. Laubach, and D. Reifschneider. 2014. “Qe FRB/U.S. Model: A Tool for Macroeconomic Policy Analysis.” FEDS Notes, Board of Governors of the Federal Reserve System, Washington, DC.
Bruno, V., and H. Shin. 2015. “Cross-Border Banking and Global Liquidity.” Review of Economic Studies 82 (2): 535-564.
Buera, J., and E. OberPeld. 2016. “Qe Global DiUusion of Ideas.” Working Paper 21844, National Bureau of Economic Research, Cambridge, MA.
Buti, M., and V. Gaspar. 2015. “Designing Fiscal Policy for Steady, Enduring Growth.” VoxEU, http://voxeu.org/article/Pscal-policy-enduring-growth.
Butschek, S., and T. Walter. 2014. “What Active Labour Market Programmes Work for Immigrants in Europe? A Meta-Analysis of the Evaluation Literature.” IZA Journal of Migration 3 (48).
Cacciatore, M., and G. Fiori. 2016. “Qe Macroeconomic EUects of Goods and Labor
Markets Deregulation.” Review of Economic Dynamics 20 (April): 1–24.
Carlstrom, C., T. Fuerst, and P. Matthias. 2013. “Policy Multipliers Under an Interest Rate Peg of Deterministic Versus Stochastic Duration.” Working Papers 475, Bank of England, London.
Cerutti, E., S. Claessens, and L. Laeven. Forthcoming 2016. “Qe Use and EUectiveness of Macroprudential Policies: New Evidence.” Journal of Financial Stability.
Chahrour, R., S. Schmitt-Grohé, and M. Uribe. 2012. “A Model-Based Evaluation of the Debate on the Size of the Tax Multiplier.” American Economic Journal: Economic Policy 4 (2): 28–45.
Chen, P., C. Wang, and Y. Liuc. 2015. “Real Estate Prices and Firm Borrowings: Micro Evidence from China.” China Economic Review 36 (December): 296–308.
Chow, J. T. S., F. Jaumotte, S. G. Park, and Y. S. Zhang. 2015. “Spillovers from Dollar Appreciation.” Policy Discussion Paper 15/2, International Monetary Fund, Washington, DC.
Christiano, L., M. Eichenbaum, and S. Rebelo. 2011. “When is the Government Spending Multiplier Large?” Journal of Political Economy 119 (1): 78–121.
Claessens, S., M. A. Kose, and M. E. Terrones. 2012. “How Do Business and Financial Cycles Interact?” Journal of International Economics 87 (1): 178-190.
Claessens, S., N. Coleman, and M. Donnelly. 2016. “Low-for-long Interest Rates and Net Interest Margins of Banks in Advanced Foreign Economies.” International Finance Discussion Papers Notes, Board of Governors of the Federal Reserve System, Washington, DC.
Claeys G., and A. Leandro. 2016. “Assessing the Juncker Plan after one year.” Bruegel.org, May 17. http://bruegel.org/2016/05/assessing-the-juncker-plan-after-one-year/.
CBO (Congressional Budget O\ce). 2016. An Update to the Budget and Economic Outlook: 2016

CHAPTER 1 GLOBAL ECONOMIC PROSPECTS | JANUARY 2017 50
to 2026. Washington, DC: Congressional Budget O\ce.
Clausing, K., E. Kleinbard, and T. Matheson. 2016. “U.S. Corporate Income Tax Reform and its Spillovers.” Working Paper 16/127, International Monetary Fund, Washington, DC.
Constantinescu, I. C., A. Mattoo, and M. Ruta. 2015. “Qe Global Trade Slowdown: Cyclical or Structural?” Policy Research Working Paper 7158. World Bank, Washington, DC.
________. 2016a. “Does the Global Trade Slowdown Matter?” Policy Research Working Paper 7673. World Bank, Washington, DC.
________. 2016b. “Global Trade Watch: Trade Developments in 2015.” World Bank, Washington, DC.
Crozet, M., C. Emlinger, and S. Jean. 2015. “On the Gravity of World Trade's Slowdown.” In De Global Trade Slowdown: A New Normal, edited by B. Hoekman, 179-196. London: Centre for Economic Policy Research.
Dabla-Norris, E., J. Brumby, A. Kyobe, and C. Papageorgiou. 2012. “Investing in Public Investment: An Index of Public Investment E\ciency.” Journal of Economic Growth 17: 235-266.
Davis, S. 2016. “An Index of Global Economic Policy Uncertainty.” NBER Working Paper No. 22740, National Bureau of Economic Research, Cambridge, MA.
De la Torre, A., D. Lederman, A. Ize, F. Bennett, and M. Sasson. 2016. De Big Switch in Latin America: Restoring Growth through Trade. LAC Semiannual Report, October 2016. Washington, DC: World Bank.
Decker, R., J. Haltiwanger, R. Jarmin, and J. Miranda. 2015. "Where Has All Qe Skewness Gone? Qe Decline in High-Growth (Young) Firms in the U.S." Working Paper 21776, National Bureau of Economic Research, Cambridge, MA.
Denes, M., G. Eggertsson, and S. Gilbukh. 2013. “DePcits, Public Debt Dynamics and Tax and
Spending Multipliers.” Economic Journal 123, F133–F163.
Didier, T., M. A. Kose, F. Ohnsorge, and L. S. Ye. 2015. “Slowdown in Emerging Markets: A Rough Patch or Hard Landing?” Policy Research Note 15/04, World Bank, Washington, DC.
Elmendorf, D. 2016. “Recommendations for Federal Fiscal Policy.” Speech at the Federal Reserve Bank of San Francisco, “Macroeconomics and Monetary Policy,” San Francisco, March 4.
Eggertsson, G., A. Ferrero, and A. RaUo. 2013. “Can Structural Reforms Help Europe?” International Finance Discussion Papers 1092, Board of Governors of the Federal Reserve System, Washington, DC.
European Commission. 2016. Communication from the Commission to the European Parliament, the Council, the European Economic and Social Committee and the Committee of the Regions: Towards a Positive Fiscal Stance for the Euro Area. Brussels, Belgium: European Commission.
Evenett, S. J., and J. Fritz. 2015. Drowing Sand in the Wheels: How Trade Distortions Slowed LDC Export-Led Growth. London: Centre for Economic Policy Research.
________. 2016. Global Trade Plateaus: De 19th Global Trade Alert Report. London: Centre for Economic Policy Research.
Fan, Y. Z. H. 2004. “Will FDI Cause Balance of Payments Crisis?” Economic Research Journal 11.
Fasani, F. 2016. “Refugees and Economic Migrants: Facts, Policies and Challenges.” VoxEU.org, October 31. http://voxeu.org/content/refugees-and-economic-migrants-facts-policies-and-challenges.
Federal Open Market Committee (FOMC). 2016. “Economic Projections of Federal Reserve Board Members and Federal Reserve Bank Presidents Under their Individual Assessments of Projected Appropriate Monetary Policy, September 2016.” Board of Governors of the Federal Reserve System, Washington, DC.

CHAPTER 1 GLOBAL ECONOMIC PROSPECTS | JANUARY 2017 51
Feyrer, J. 2008. “Aggregate Evidence on the Link Between Age Structure and Productivity.” Population and Development Review 34: 78-99.
Fernald, J. 2014. “Productivity and Potential Output Before, During, and After the Great Recession.” Work Paper 20248, National Bureau of Economic Research, Cambridge, MA.
________. 2016. “Reassessing Longer-run U.S. Growth: How Low?” Working Paper 2016/18, Federal Reserve Bank of San Francisco.
Ferrantino, M., and D. Taglioni. 2014. “Global Value Chains in the Current Trade Slowdown.” Economic Premise 137, World Bank, Washington, DC.
Ferraresi, T., A. Roventini, and G. Fagiolo. 2015. “Fiscal Policies and Credit Regimes: A TVAR Approach.” Journal of Applied Econometrics 30 (7): 1047–1072.
Fischer, S. 2016. “Why Are Interest Rates So Low? Causes and Implications.” Speech to the Economic Club of New York, New York City, October 17.
Foletti, L., M. Fugazza, A. Nicita, and M. Olarreaga. 2009. “Smoke in the Water: Qe Use of TariU Policy Flexibility in Crises.” Policy Research Working Paper 5050, World Bank, Washington, DC.
Forbes, K., D. Reinhardt, and T. Wieladek. 2016. “Qe Spillovers, Interactions, and (Un)Intended Consequences of Monetary and Regulatory Policies.” Working Paper 22307. National Bureau of Economic Research, Cambridge, MA.
Frankel, J. 2016. “International Coordination.” Working Paper 21878, National Bureau of Economic Research, Cambridge, MA.
Geneva Association. 2015. “Qe Impact of Low Interest Rates on the Insurance Sector and Its Economic Role.” Research Reports, Geneva Association, Zurich.
Gervais, O., L. Schembri, and L. Suchanek. 2016. “Current Account Dynamics, Real Exchange Rate Adjustment, and the Exchange Rate Regime in
Emerging-market Economies.” Journal of Development Economics 119: 86-99.
Ghosh, S. 2016. “Monitoring Macro-Financial Vulnerability: A Primer.” Discussion Paper 14, Macroeconomics and Fiscal Management Global Practice, World Bank, Washington, DC.
Görg, H., and D. Greenaway. 2004. “Much Ado about Nothing? Do Domestic Firms Really BenePt From Foreign Direct Investment?” De World Bank Research Observer 19 (2): 171-197.
Gramlich, E. M. 1994. “Infrastructure Investment: A Review Essay.” Journal of Economic Literature 32 (3): 1176-1196.
Handley, K. 2014. “Exporting Under Trade Policy Uncertainty: Qeory and Evidence.” Journal of International Economics 94 (1): 50-66.
Handley, K., and N. Limao. 2015. “Trade and Investment Under Policy Uncertainty: Qeory and Firm Evidence.” American Economic Journal: Economic Policy 7 (4): 189-222.
Hannoun, H. 2015. “Ultra-Low or Negative Interest Rates: What Qey Mean for Financial Stability and Growth.” Speech at the EuroP High-Level Seminar, “Fostering Growth in a Highly Indebted EU Environment,” Riga, April 22-24.
Haugh, D., A. Kopoin, E. Rusticelli, D. Turner, and R. Dutu. 2016. “Cardiac Arrest or Dizzy Spell: Why is World Trade So Weak and What Can Policy Do about It?” OECD Economic Policy Papers 18, OECD, Paris.
HM Treasury. 2016. HM Treasury Analysis: De Long-term Economic Impact of EU Membership and the Alternatives. London, UK: H.M. Treasury.
Hoekman, B., and A. Mattoo. 2008. “Services Trade and Growth.” Policy Research Working Paper 4461, World Bank, Washington, DC.
Hofmann, B., I. Shim, and H. S. Shin. 2016. “Sovereign Yields and the Risk-Taking Channel of Currency Appreciation.” Working Paper 538, Bank for International Settlements, Basel.
Holston, K., T. Laubach, and J. Williams. 2016. “Measuring the Natural Rate of Interest:

CHAPTER 1 GLOBAL ECONOMIC PROSPECTS | JANUARY 2017 52
International Trends and Determinants.” Working Paper 2016/11, Federal Reserve Bank of San Francisco, San Francisco.
Hordahl, P., J. Sobrun, and P. Turner. 2016. “Low Long-term Interest Rates as a Global Phenomenon.” Working Papers 574, Bank for International Settlements, Basel.
Horton, M. A., H. Samiei, N. P. Epstein, and K. Ross. 2016. “Exchange Rate Developments and Policies in the Caucasus and Central Asia.” Middle East and Central Asia Departmental Paper 16/2, International Monetary Fund, Washington, DC.
IMF (International Monetary Fund). 2015a. Fiscal Monitor: De Commodities Roller Coaster – A Fiscal Framework for Uncertain Times. Washington, DC: International Monetary Fund.
________. 2015b. “Cambodia: 2015 Article IV Consultation StaU Report.” International Monetary Fund, Washington, DC.
________. 2015c. Global Financial Stability Report: Vulnerabilities, Legacies, and Policy Challenges – Risks Rotating to Emerging Markets. Washington, DC: International Monetary Fund.
________. 2016a. “People’s Republic of China 2015 Article IV Consultation—StaU Report.” International Monetary Fund, Washington, DC.
________. 2016b. “Russian Federation 2016 Article IV Consultation—StaU Report.” International Monetary Fund, Washington, DC.
________. 2016c. “Brazil 2016 Article IV Consultation—StaU Report.” International Monetary Fund, Washington, DC.
________. 2016d. “Peru: Selected Issues.” Country Report 16/235, International Monetary Fund, Washington, DC.
________. 2016e. “Republic of Azerbaijan 2016 Article IV Consultation—StaU Report.” International Monetary Fund, Washington, DC.
________. 2016f. “Nigeria 2016 Article IV Consultation—StaU Report.” International Monetary Fund, Washington, DC.
________. 2016g. “United Kingdom: Selected Issues.” Country Report 16/169, International Monetary Fund, Washington, DC.
________. 2016h. “Euro Area 2016 Article IV Consultation—Selected Issues.” International Monetary Fund, Washington, DC.
In't Veld, J. 2016. “Public Investment Stimulus in Surplus Countries and their Euro Area Spillovers.” Economic Brief 016, European Commission, Brussels.
Ito, T., S. Koibuchi, K. Sato, and J. Shimizu. 2015. “How do Japanese Exporters Manage Qeir Exchange Rate Exposure?” VoxEU.org, June 29. http://voxeu.org/article/how-do-japanese-exporters-manage-their-exchange-rate-exposure.
Iwata, K., I. Fueda-Samikawa, and E. Takahashi. 2016. “Risks and Challenges for BOJ after breaking through ZLB-Accelerate move toward establishing a Cashless Society.” Japan Center for Economic Research, Tokyo.
Iwata, K., I. Samikawa, E. Takahashi, and T. Kimotsuki. 2016. “Risks from Extending the QQE policy-Bank of Japan’s JGB Purchases to reach Limits in June 2017.” Japan Center for Economic Research, Tokyo.
Javorcik, B. 2015. “Does FDI Bring Good Jobs to Host Countries?” De World Bank Research Observer 30 (1): 74-94.
Jimenez, E. 1995. “Human and Physical Infrastructure: Public Investment and Pricing Policies in Developing Countries.” In Handbook of Development Economics 3 (B), edited by J. Behrman, and T.N. Srinivasan, 2773-2843. Oxford, U.K.: Elsevier.
Kee, H., and H. Tang. 2015. “Domestic Value in Exports: Qeory and Firm Evidence from China.” Policy Research Working Paper 7491, World Bank, Washington, DC.
Kelly, B., L. Pastor, and P. Veronesi. 2014. “Qe Price of Political Uncertainty: Qeory and Evidence from the Option Market.” Working Paper 19812, National Bureau of Economic Research, Cambridge, MA.

CHAPTER 1 GLOBAL ECONOMIC PROSPECTS | JANUARY 2017 53
Kose, M. A., E. Prasad, K. RogoU, and S. Wei. 2009. “Financial Globalization: A Reappraisal.” IMF StaI Papers 56 (1): 8-62.
Kose, M. A., and M. Terrones. 2015. Collapse and Revival: Understanding Global Recessions and Recoveries. Washington, DC: International Monetary Fund.
Lakner, C., and B. Milanovic. 2016. “Global Income Distribution: From the Fall of the Berlin Wall to the Great Recession.” World Bank Economic Review 30 (2): 203-232.
Lakner, C., M. Negre, and E. Prydz. 2014. “Twinning the Goals: How Can Shared Prosperity Help to Reduce Global Poverty?” Policy Research Working Paper 7106, World Bank, Washington, DC.
Lane, P., and P. McQuade. 2014. “Domestic Credit Growth and International Capital Flows.” Scandinavian Journal of Economics 116 (1): 218–252.
Lardy, N. R., and Z. Huang. 2016. “China Private Investment Softens, But Not as Much as O\cial Data Suggest.” China Economic Watch, Peterson Institute for International Economics, Washington, DC.
Laforte, J.-P., and J. Roberts. 2014. “November 2014 Update of the FRB/U.S. Model.” FEDS Notes, Board of Governors of the Federal Reserve System, Washington, DC.
Lariau, A., M. El Said, and M. Takebe. 2016. “An Assessment of the Exchange Rate Pass-Qrough in Angola and Nigeria.” Working Paper 16/191, International Monetary Fund, Washington, DC.
Łyziak, T., and M. Paloviita. 2016. “Anchoring of InZation Expectations in the Euro Area: Recent Evidence Based on Survey Data.” Working Paper 1945, European Central Bank, Frankfurt.
Masuch, K., E. Moshammer, and B. Pierluigi. 2016. “Institutions and Growth in Europe.” Working Paper 1963, European Central Bank, Frankfurt.
McCauley, N., P. McGuire, and V. Sushko. 2015. “Global Dollar Credit: Links to U.S. Monetary
Policy and Leverage.” Working Papers 483, Bank for International Settlements, Basel, Switzerland.
McKinsey Global Institute. 2016. “Lions on the Move II: Realizing the Potential of Africa’s Economies.” McKinsey & Company.
Mian, A., A. SuP, and E. Verner. 2015. “Household Debt and Business Cycle Worldwide.” Working Paper 21581, National Bureau of Economic Research, Cambridge, MA.
Milanovic, B. 2016. Global Inequality: A New Approach for the Age of Globalization. Boston, MA: Harvard University Press.
Molloy, R., C. Smith, R. Trezzi, and A. Wozniak. 2016. “Understanding Declining Fluidity in the U.S. Labor Market.” Brookings Papers on Economic Activity, Brookings Institute, Washington, DC.
Nicar, S. B. 2015. “International Spillovers from U.S. Fiscal Policy Shocks.” Open Economies Review 26 (5): 1081-1097.
Niño-Zarazúa, M., L. Roope, and F. Tarp. 2016. “Global Inequality: Relatively Lower, Absolutely Higher.” Review of Income and Wealth (July).
Noland, M., G. Hufbauer, S. Robinson, and T. Moran. 2016. “Assessing Trade Agendas in the U.S. Presidential Campaign.” PIIE BriePng 16-6, Peterson Institute of International Economics, Washington, DC.
Nunns, J., L. Burman, B. Page, J. Rohaly, and J. Rose. 2016. “An Analysis of Donald Trump’s Revised Tax Plan.” Tax Policy Center, Washington, DC.
OECD (Organisation for Economic Cooperation and Development). 2015. “Lifting Investment for Higher Sustainable Growth.” In OECD Economic Outlook, 205-279. Paris: Organisation for Economic Cooperation and Development.
________. 2016a. “Cardiac Arrest or Dizzy Spell: Why is World Trade So Weak and What Can Policy Do about It?” OECD Economic Policy Papers 18, Paris, France.
________. 2016b. “Qe Economic Consequences of Brexit: A Taxing Decision.” Economic Policy

CHAPTER 1 GLOBAL ECONOMIC PROSPECTS | JANUARY 2017 54
Paper 16, Organisation for Economic Cooperation and Development, Paris, France.
Proctor, B., J. Semega, and M. Kollar. 2016. Income and Poverty in the United States: 2015. Current Population Reports. Washington, DC: U.S. Census Bureau.
Reinhart, C., and K. RogoU. 2009. Dis Time is DiIerent: Eight Centuries of Financial Folly. Princeton: Princeton University Press.
Reinhart, C., V. Reinhart, and C. Trebesch. 2016. "Global Cycles: Capital Flows, Commodities, and Sovereign Defaults, 1815-2015." American Economic Review 106 (5): 574-80.
Rostagno, M., U. Bindseil, A. Kamps, W. Lemke, T. Sugo, and T. Vlassopoulos. 2016. “Breaking through the Zero Line: Qe ECB’s Negative Interest Rate Policy.” Presentation at Brookings Institution seminar “Negative Interest Rates: Lessons Learned...So Far,” June 6, Washington, DC.
Sen, P. 1995. “Foreign Direct Investment: A Solution to BOP Problems?” Economic and Political Weekly 30 (30): 1921-927.
Shin, H. S. 2016. “Bank Capital and Monetary Policy Transmission.” Panel remarks at the ECB and Its Watchers XVII Conference, Center for Financial Studies, Frankfurt, April 7.
Straub, S. 2008. “Infrastructure and Growth in Developing Countries: Recent Advances and Research Challenges.” Policy Research Working Paper 4460, World Bank, Washington DC.
Taglioni, D., and D. Winkler. 2016. Making Global Value Chains Work for Development. Washington, DC: World Bank.
UNCTAD (United Nations Conference on Trade and Development). 2014. World Investment Report – Investing in the SGDs: An Action Plan. Geneva, Switzerland: UNCTAD.
________. 2016. World Investment Report – Investor Nationality: Policy Challenges. Geneva, Switzerland: UNCTAD.
Vollrath, D. 2016. “More on Decomposing U.S. Productivity Growth.” Growth Economics, May 11.
Whalen, C. and F. Reichling. 2015. “Qe Fiscal Multiplier and Economic Policy Analysis in the United States.” Working Paper Series 2015/02, Congressional Budget O\ce, Washington, DC.
Williams, J. 2016. “Monetary Policy in a Low R-star World.” FRBSF Economic Letter 2016/23, Federal Reserve Bank of San Francisco.
Woodford, M. 2011. “Simple Analytics of the Government Expenditure Multiplier." American Economic Journal: Macroeconomics 3 (1): 1-35.
World Bank. 1997. “Malaysia - Enterprise Training, Technology, and Productivity.” World Bank country study, Washington, DC.
________. 2001. Globalization, Growth, and Poverty: Building an Inclusive World Economy. Policy Research Report. Washington DC: World Bank; New York: Oxford University Press.
________. 2004a. Reforming Infrastructure: Privatization, Regulation and Competition. Policy Research Report. Washington DC: World Bank; New York: Oxford University Press.
________. 2004b. World Development Report: Making Services Work for Poor People. Washington DC: World Bank.
________. 2008. MENA Development Report: De Road not Travelled Education Reform in the Middle East and North Africa. Washington, DC: World Bank.
________. 2012. De World Bank Group’s Response to the Global Economic Crisis. Washington, DC: World Bank.
________. 2013. De Africa Competitiveness Report 2013. World Bank: Washington, DC.
________. 2014. Global Monitoring Report 2014/2015: Ending Poverty and Sharing Prosperity. Washington DC: World Bank.
________. 2015a. Global Economic Prospects: Having Fiscal Space and Using It. January 2015. Washington, DC: World Bank.

CHAPTER 1 GLOBAL ECONOMIC PROSPECTS | JANUARY 2017 55
________. 2015b. Global Monitoring Report 2015/2016: Development Goals in an Era of Demographic Change. Washington, DC: World Bank.
________. 2015c. “World Bank Group Engagement in Resource-Rich Developing Countries: Qe Cases of the Plurinational State of Bolivia, Kazakhstan, Mongolia, and Zambia. Clustered Country Program Evaluation Synthesis Report.” World Bank Group, Washington, DC.
________. 2016a. “Reducing Vulnerabilities.” East Asia PaciPc Economic Update, World Bank, Washington, DC.
________. 2016b. “Commodity Markets Outlook: OPEC in Historical Context.” October. World Bank, Washington, DC.
________. 2016c. “Commodity Markets Outlook: From Energy Prices to Food Prices: Moving in Tandem.” July. World Bank, Washington, DC.
________. 2016d. “Russia Economic Report No. 36: Qe Russian Economy Inches Forward: Will Qat Su\ce to Turn the Tide?” World Bank, Washington, DC.
________. 2016e. “Africa’s Pulse.” October 2016. World Bank, Washington, DC.
________. 2016f. Global Economic Prospects: Divergences and Risks. June 2016. Washington, DC: World Bank.
________. 2016g. Global Economic Prospects: Spillovers amid Weak Growth. January 2016. Washington, DC: World Bank.
________. 2016h. World Development Report: Digital Dividends. Washington DC: World Bank.
________. 2016i. EU Regular Economic Report 3: Growth, Jobs and Integration: Services to the Rescue. Washington, DC: World Bank.
________. 2016j. World Development Indicators: Featuring the Sustainable Development Goals. Washington, DC: World Bank.
________. 2016k. Poverty and Shared Prosperity 2016: Taking on Inequality. Washington, DC: World Bank.
World Economic Forum. 2016. “Qe Human Capital Report 2016.” Geneva, Switzerland.
WTO (World Trade Organization). 2016a. “Services Negotiations Gain Momentum as Members Show Renewed Interest.” WTO Press Release, July 4.
________. 2016b. “Report on G20 Trade Measures.” World Trade Organization, Geneva Switzerland.
Yellen, J. 2016. “Macroeconomic Research after the Crisis.” Speech at "Qe Elusive 'Great' Recovery: Causes and Implications for Future Business Cycle Dynamics" 60th Annual Economic Conference, sponsored by the Federal Reserve Bank of Boston.
Zhang, L. 2016. “Rebalancing in China—Progress and Prospects.” Working Paper 16/183, International Monetary Fund, Washington, DC.
Zidar, O. 2015. “Tax Cuts for Whom? Heterogeneous EUects of Income Tax Changes on Growth and Employment.” NBER Working Paper 21035, National Bureau of Economic Research, Cambridge, MA.


The U.S. Economy and the World
SPECIAL FOCUS


SPEC IAL FOCUS GLOBAL ECONOMIC PROSPECTS | JANUARY 2017 59
Introduction
Developments in the U.S. economy, because of its size and international linkages, are bound to have substantial implications for the global economy. �e United States is the world’s single largest economy (at market exchange rates), accounting for almost 22 percent of global output and over a third of stock market capitalization (Figures SF.1 and SF.2). It is prominent in virtually every global market, with about one-tenth of global trade (ows, one-)fth of global FDI stock, close to one-)fth of remittances, and one-)fth of global energy demand. Since the U.S. dollar is the most widely used currency in global trade and )nancial transactions, changes in U.S. monetary policy and investor sentiment play a major role in driving global )nancing conditions.
At the same time, the global economy is important for the United States. A,liates of U.S. multinationals operating abroad and a,liates of foreign companies located in the United States account for a sizable share of output, employment, cross-border trade and )nancial (ows. One-sixth of consumer goods purchases by U.S. consumers are for imported goods, with an even higher share in cars and consumer electronics.
�is Special Focus examines the role of the United States in the global economy and the two-way
The U.S. Economy and the World
Developments in the U.S. economy, the world’s largest, have e�ects far beyond its shores. A surge in U.S. growth—whether due to expansionary !scal policies or other reasons—could provide a signi!cant boost to the global economy. Tightening U.S. !nancial conditions—whether due to faster-than-expected normalization of U.S. monetary policy or other reasons—could reverberate across global !nancial markets, with adverse e�ects on some emerging market and developing economies (EMDEs) that rely heavily on external !nancing. In addition, lingering uncertainty about the course of U.S. economic policy could have a signi!cantly negative e�ect on global growth prospects. While the United States plays a critical role in the world economy, activity in the rest of the world is also important for the United States. ,e new U.S. administration’s speci!c economic policies are still being shaped. By assessing the U.S. economy’s role in the world, the objective of this Special Focus is to inform the analysis of potential global implications of such policies.
Note: This Special Focus was prepared by M. Ayhan Kose, Csilla Lakatos, Franziska Ohnsorge, and Marc Stocker, and with contributions from Carlos Arteta, John Baffes, Jongrim Ha, Raju Huidrom, Ergys Islamaj, Ezgi O. Ozturk, Hideaki Matsuoka, Naotaka Sugawara, and Temel Taskin. Xinghao Gong, Trang Nguyen, and Peter Williams provided research assistance.
FIGURE SF.1 United States in the global economy
The U.S. economy is the world’s largest, accounting for almost one quarter
of global GDP and one-tenth of global trade.
B. Size in global trade, 2010-15 A. Size of major economies, 2010-15
D. U.S. trade openness over time C. GDP and trade size over time
F. Exports to the United States,
2010-15 E. U.S. share of global imports,
2010-15
Sources: World Bank, International Monetary Fund, UN Population Statistics.
A.C. “PPP” stands for purchasing power parity exchange rates.
B.D. Trade is the sum of exports and imports of goods. E. Goods imports.
F. “EAP” stands for East Asia and Pacific; “ECA” stands for Europe and Central Asia; “LAC” stands
for Latin America and the Caribbean; “MNA” stands for Middle East and North Africa; “SAR” stands
for South Asia; and “SSA” stands for Sub-Saharan Africa.
0
10
20
30
40
50
GDP (marketexchange
rates)
GDP (PPP) Population
United States China Germany JapanPercent of total
0
20
40
60
19
80
s
201
0-1
5
19
80
s
201
0-1
5
19
80
s
201
0-1
5
GDP (marketexchange
rates)
GDP (PPP) Trade
United States China Germany Japan
Percent of total
0
10
20
30
40
Trade Exports Imports
United StatesChinaGermanyJapan
Percent of total
0
4
8
12
16
20
Agri
cultura
lpro
ducts
Foo
d
Fue
ls a
nd
min
ing
pro
du
cts
Iro
n a
nd
ste
el
Te
xtile
s
Chem
icals
Tra
nsp
ort
equ
ipm
en
t
Ele
ctr
on
ice
qu
ipm
en
t
Percent of world imports
0
1
2
3
4
5
6
7
EAP ECA LAC MNA SAR SSA
Percent of regional GDP
0
5
10
15
20
25
30
35
Exports Imports Trade
1980s 2010-15
Percent of GDPPercent of GDP

SPEC IAL FOCUS GLOBAL ECONOMIC PROSPECTS | JANUARY 2017 60
may be pursued by the new U.S. administration.1 �e incoming administration has signaled its intention to pursue more expansionary )scal policies, which could lead to stronger growth in the short-term. It has also promised a change in direction in trade policies. In designing these policies, the challenge will be to generate domestic bene)ts while containing potentially adverse feedbacks from their global repercussions. While detailed plans are still being worked out, an understanding of the role of the U.S. economy in the global economy can inform the analysis of potential global implications of likely policies. In light of the answers to the four questions above, some preliminary implications are sketched out in the concluding section of this Special Focus.
Linkages between the
United States and the World
With an estimated nominal GDP of more than $18 trillion in 2016, the United States is the world’s single largest economy and has the world’s third largest population. It accounts for more than 22 percent of global GDP (at 2015 market exchange rates), 11 percent of global trade, 12 percent of bank foreign claims, and 35 percent of global stock market capitalization (Figures SF.1 and SF.2).2 �e U.S. share of global output and trade has remained broadly stable since the 1980s, whereas the share of other major advanced economies has declined gradually. �e United States is the single largest international creditor and debtor: it holds the largest stock of foreign assets and liabilities and, by a wide margin, the largest net foreign asset position (updated and extended version of dataset constructed by Lane and Milesi-Ferretti 2007).
U.S. trade and )nancial integration with other advanced economies and EMDEs—especially in Latin America and the Caribbean (Figure SF.3)—
interactions between the U.S. economy and other economies by addressing the following questions:
• How important are linkages between the U.S. economy and the world?
• How synchronous are business cycles in the United States and other economies?
• How large are global spillovers from shocks originating in the United States?
• How important is the global economy for the United States?
Much attention has focused on the domestic and global implications of the economic policies that
FIGURE SF.2 United States in global financial markets
The United States is the single largest international creditor and debtor,
and U.S. financial markets are highly integrated with global markets. The
U.S. dollar is the most widely used currency in global trade and financial
transactions.
B. U.S. financial openness, 2010-14 A. Financial market size, 2010-15
D. Capital investment by the United
States, 2010-15
C. Share of U.S. dollar-denominated
transactions in financial markets, 2016
Sources: World Bank, Lane and Milesi-Ferretti (2007), Bank for International Settlements,
International Monetary Fund, World Federation of Exchange.
A. Foreign claims are consolidated foreign claims of BIS-reporting banks headquartered in respective
countries or locations (data unavailable for China). Assets and liabilities are international investment
positions. Average share for 2010-15, except for assets and liabilities (2010-14).
B. Total is the sum of assets and liabilities. Average shares in GDP over the periods of 1980-89 and
2010-14.
C. For currency, totals sum to 100 percent because each foreign exchange transaction involves two
different currencies. “Euro” includes all legacy currencies of the Euro as well as the European
Currency Unit. Data for the center and right bars are for June 2016.
D. Capital investment refers to stocks of foreign direct investment (FDI), portfolio investment, and
cross-border bank lending from the United States to EMDE regions. Country coverage varies by
capital investment component. As FDI data are not available for 2015, data up to 2014 are used for
FDI.
1Early assessments have emphasized the need for additional details and challenges for policy, see Blanchard (2016); Bown (2016); Constancio (2016); Chandy and Seidel (2016); Spence (2016). 2At purchasing power exchange rates, the United States is the world’s second largest economy with about 16 percent of global GDP in 2015. China is the world’s largest, accounting for 17 percent of global GDP.
0
10
20
30
40
50
60
Assets Liabilities Foreignclaims
Stock marketcapitalization
United States China Germany Japan
Percent of total
0
50
100
150
200
250
300
350
Assets Liabilities Total
1980s 2010-14
Percent of GDP
0
5
10
15
20
25
EAP ECA LAC MNA SAR SSA
Percent of regional GDP
0
20
40
60
80
100
Currency Bank lending Bond issuance
US$ Euro Yen OtherPercent

SPEC IAL FOCUS GLOBAL ECONOMIC PROSPECTS | JANUARY 2017 61
runs deep. Countries whose trade and )nancial ties are predominantly with the United States are directly exposed to U.S. developments. In addition, those that are in general highly open to global trade and )nance are indirectly exposed because of widespread spillovers from the United States.
Trade links. Trade accounted for 30 percent of U.S. GDP in 2015, considerably less than the average for other advanced economies (70 percent) but almost twice as much as in the 1980s (18 percent). �e United States is the world’s single largest importer and exporter of goods and services, and the largest exporter and importer of business services (Figure SF.4). It accounts for 14 percent of global goods imports and 9 percent of global services imports.
Manufactured goods account for more than three-quarters of U.S. goods imports, with oil imports making up most of the remainder despite a steady decline since 2000. �e most prominent imported manufacturing categories are motor vehicles, data processing machines, and drugs. More than two-thirds of U.S. manufacturing imports originate from China (24 percent of imports), the European Union (20 percent of imports), Mexico and Canada (combined 24 percent of imports).
�e United States is the single largest export destination for one-)fth of the world’s countries. It is the largest export market for more than half of the EMDEs in Latin America and the Caribbean, and South Asia, and the primary export market for several countries in other EMDE regions, especially in East Asia Paci)c. Mexico, Colombia, Ecuador and many smaller Central American EMDEs rely particularly heavily on exports to the United States.
�e growth of trade linkages between the United States and other countries has taken place in an era of trade liberalization. Since 1948, the General Agreement on Trade and TariKs (GATT) and, since 1995, the World Trade Organization (WTO) have provided a multilateral framework for this process. �e majority of U.S. trade is conducted under the Most Favored Nation (MFN) regime, with average tariKs at 3.5 percent
3For discussions of the implications of the NAFTA and CAFTA-DR, see De Hoyos and Iacovone (2013); Kose, Meredith and Towe (2005); Kose, Rebucci and Schipke (2005); Lederman, Maloney, and Serven (2004); and Romalis (2007).
B. Europe and Central Asia A. East Asia and Pacific
D. Middle East and North Africa C. Latin America and the Caribbean
F. Sub-Saharan Africa E. South Asia
Sources: World Integrated Trade Statistics, Bank for International Settlements, International Monetary
Fund, World Bank.
Notes: Averages for 2010-15, except for FDI (2010-14 average). In percent of total exports of each
EMDE region, total inward FDI stocks in each EMDE region, total portfolio liabilities (derived from
creditor data) in each EMDE region, total foreign claims of BIS-reporting banks on each EMDE
region, and total remittance flows to each region.
FIGURE SF.3 Linkages between the United States and
EMDE regions
The United States is a particularly large trading partner and source of
finance for Latin America and the Caribbean, and East Asia and the
Pacific. Portfolio and remittance inflows from the United States are
important for most EMDE regions.
(5.2 percent for agricultural products). In addition to multilateral agreements, the United States has negotiated 14 bilateral or regional trade agreements with 20 partner countries, which cover 32 percent of its imports of goods and services (Jackson 2016).3 �e largest of these agreements is
0
10
20
30
40
Export
s
Inw
ard
FD
I
Rem
itta
nce
sin
flow
s
Port
folio
liab
ilitie
s
Fore
ign c
laim
s
United States China Germany Japan
Percent of total
0
10
20
30
40
Export
s
Inw
ard
FD
I
Rem
itta
nce
sin
flow
s
Port
folio
liabili
ties
Fore
ign c
laim
s
United States China Germany JapanPercent of total
0
20
40
60
80
Export
s
Inw
ard
FD
I
Rem
itta
nce
sin
flow
s
Port
folio
liabili
ties
Fore
ign c
laim
s
United States China Germany JapanPercent of total
0
10
20
30
Export
s
Inw
ard
FD
I
Rem
itta
nce
sin
flow
s
Port
folio
liabili
ties
Fore
ign c
laim
s
United States China Germany JapanPercent of total
0
10
20
30
40
Export
s
Inw
ard
FD
I
Rem
itta
nce
sin
flow
s
Port
folio
liabili
ties
Fore
ign c
laim
s
United States China Germany Japan
Percent of total
0
10
20
30
40
50
Export
s
Inw
ard
FD
I
Rem
itta
nce
sin
flow
s
Port
folio
liabili
ties
Fore
ign c
laim
s
United States China Germany JapanPercent of total

SPEC IAL FOCUS GLOBAL ECONOMIC PROSPECTS | JANUARY 2017 62
the North American Free Trade Agreement (NAFTA), in force since 1994. �e United States also grants unilateral preferences to a number of EMDEs through it Generalized System of Preferences (GSP) and African Growth Opportunity Act (AGOA) which cover about 3.3 percent of U.S. imports (Frazer and Biesebroek 2008; Mattoo, Roy, and Subramaniam 2003; Cooper 2014).
Financial links. �e U.S. )nancial markets are highly integrated with global markets. Following a rapid expansion over three decades, by 2010-14, its international assets and liabilities were on average three times GDP, broadly in line with that of other advanced economies (Figure SF.2). �e United States remains the world’s largest source and recipient of foreign direct investment (FDI) (ows, accounting for about one-fourth of world FDI in(ows and out(ows in 2015. �e European Union (EU), Japan, Canada and Switzerland together hold about 90 percent of FDI assets in the United States, while the EU and Canada are the largest recipients of U.S. FDI. �e countries of the Latin America and Caribbean region are the most exposed to FDI in(ows originating in the United States, in particular, Brazil, Chile, and Mexico (Figure SF.5). Re(ecting the size and depth of its )nancial markets, the United States accounts for the largest share of portfolio assets in one-third of EMDEs.
�e U.S. dollar is the most widely used currency in international trade and )nancial markets and is the world’s preeminent reserve currency. Around 80 percent of EMDE bond issuance and more than 50 percent of cross-border bank (ows to EMDEs are denominated in U.S. dollars. Europe and Central Asia is the only EMDE region where the U.S. dollar is surpassed—by the euro—as the currency of denomination for cross-border bank (ows. Ecuador, El Salvador, and Panama use the U.S. dollar as their o,cial currency; more than 30 other EMDEs maintain exchange rate pegs against the U.S. dollar. A large share of o,cial foreign exchange reserves (63 percent) are dollar-denominated. �e U.S. dollar is widely used in international trade transactions for current account transactions, accounting for about one-third of invoicing for goods and services in Europe
FIGURE SF.4 U.S. trade flows: Composition and
partners
The U.S. is the single largest country destination of global exports of goods
and services. It is a key market for the LAC region as well as for some
EMDEs in East Asia. Electronic and transport equipment account for the
bulk of U.S. manufacturing imports and are mostly imported from other
NAFTA members, European Union countries, and China.
B. Composition of U.S. exports and
imports
A. U.S. share of global goods and
services trade
D. Exports destinations of EMDE
regions
C. Main sources of U.S. imports
F. Share of EMDEs for which United
States is a major export destination
E. Selected EMDEs: Exports to the
United States
Sources: World Trade Organization, World Integrated Trade Statistics, Bureau of Economic Analysis,
IMF, World Bank.
Note: Averages for 2010-15 unless otherwise specified.
A. U.S. imports of goods and services in percent of global goods and services imports.
B. U.S. imports of goods or services in percent of total U.S. imports of goods and services (purple
bars); U.S. imports in each sector in percent of total U.S. goods imports (other bars);. “Energy”
includes energy-related products, metals and minerals; “Electronics” stands for electronic products;
“Chemicals” stands for chemicals and related products; “Transport” stands for transportation
equipment; “Other” includes agricultural and forestry products, textiles, apparel, and footwear.
Averages for 2010-2014.
C. Sectoral exports from European Union, China, Japan, and other economies to the United States in
percent of total U.S. imports in each sector.
D. Exports to the United States, other advanced economies, and China in percent of total exports of
each EMDE region. “AE” stands for advanced economies.
E. Exports to the United States in percent of total exports or in percent of GDP of each EMDE
economy.
F. Share of EMDE economies in each region for which exports to the United States account for the
single largest share of total exports or for which exports to the United States account for at least 30
percent of total exports.
0
10
20
30
40
Tota
l
Serv
ice
s
Go
od
s
Tota
l
Serv
ice
s
Go
od
s
Exports Imports
United States ChinaGermany Japan
Percent of total
0
20
40
60
80
100
Exports Imports Exports Imports
Percent of total
Energy Electronics
Transport Chemicals
Machinery Other
GoodsServices
0
20
40
60
80
100
Ele
ctr
ical
Eq
uip
men
t
Ma
chin
ery
Tra
nsp
ort
Eq
uip
men
t
Ene
rgy
China United Kingdom
Japan Euro Area
Mexico+Canada Other
Percent of total
0
10
20
30
40
50
60
70
EAP ECA LAC MNA SAR SSA
United States China Other AEPercent of total
0
10
20
30
40
50
60
70
80
0
5
10
15
20
25
30
Mexic
o
Vie
tnam
Mala
ysia
Thaila
nd
Colo
mb
ia
Chin
a
Peru
Sri L
anka
India
Indon
esia
Percent of GDP
Percent of total (RHS)
Percent Percent
0
10
20
30
40
50
60
EAP ECA LAC MNA SAR SSA
Largest export share with the United States
30% or more of exports with the UnitedStates
Percent of EMDEs

SPEC IAL FOCUS GLOBAL ECONOMIC PROSPECTS | JANUARY 2017 63
and two-thirds in Asia (Goldberg and Tille 2008, 2016; Devereux and Shi 2013).
Commodity market links. �e United States is a large producer and consumer of commodities (Figure SF.6). For example, it has re-emerged as the largest producer of oil and natural gas in recent years, accounting for 13 percent of global oil production (similar to its share in the early 1990s). U.S. production is almost evenly split between natural gas and petroleum, in contrast to the predominantly petroleum-based production of other major hydrocarbon producers such as Russia and Saudi Arabia (EIA 2016). U.S. shale oil production, which tripled during 2009-14, requires little capital investment and can be brought onstream rapidly; hence, it has become a highly (exible source of global oil supply, responding quickly to price changes (BaKes et al. 2015).
�e United States is also the world’s largest biofuel producer, accounting for 42 percent of global production, and one-third of U.S. maize production. Rapid growth in maize-based production was encouraged by the Renewable Fuel Standard (RFS), mandated by the Energy Policy Act of 2005 and the Energy Independence and Security Act of 2007, which requires transportation fuel sold in the United States to contain a minimum volume of renewable fuels.
Historically, the United States has been a major consumer of agricultural, energy, and metal commodities. With the rise of large EMDEs, such as China and India, this role has diminished over time (World Bank 2015a). However, the United States is still the largest consumer of natural gas and oil, accounting for more than one-)fth of global consumption. It is the second largest consumer of a wide range of commodities, including aluminum, copper, lead, and coKee.
Synchronization of U.S.
and global cycles
Synchronization of business cycles. Business cycles in the United States, other advanced economies and EMDEs have been highly
FIGURE SF.5 U.S. financial flows: Composition and
partners
Because of its large financial system and economy, the United States is an
important source of FDI, portfolio flows, remittances and bank lending to
EMDEs across the world.
B. Portfolio inflows from the United
States
A. FDI inflows from the United States
D. Remittance inflows from the United
States C. Cross-border bank claims of U.S.
banks on selected EMDEs
Sources: Bank for International Settlements, International Monetary Fund, World Bank.
A. Share of FDI inflows from United States in total FDI inflows into (and in percent of GDP of) each
EMDE region, average of 2010-2014.
B. Share of portfolio investment from United States in total portfolio inflows into (and in percent of
GDP of) each EMDE region, average of 2010-2015.
C. Share of consolidated U.S.-headquartered BIS-reporting banks’ claims on each EMDE region in
total consolidated BIS-reporting banks’ claims on (and in percent of GDP of) each EMDE region,
average of 2010-2015.
D. Share of remittances inflows from United States in total remittances inflows into (and in percent of
GDP of) each EMDE region, average of 2010-2015.
synchronous (Figure SF.7). �is is partly a re(ection of the strength of global trade and )nancial linkages of the U.S. economy with the rest of the world. In addition, it is because of global shocks that had a common eKect on many countries at the same time. Business cycles in the United States are somewhat more correlated with those in other advanced economies than those in EMDEs (with the important exception of Mexico) because of deeper economic integration.
Concordance of cyclical turning points. International business cycle synchronization tends to be particularly strong when the U.S. economy is in recession but, over the phases of the U.S. business cycle, GDP growth in the rest of the world correlates substantially. For example,
0102030
40506070
80
0
2
4
6
8
10
12
14
Chile
Me
xico
Kazakhsta
n
Hun
gary
Mala
ysia
Tha
iland
Bra
zil
Pola
nd
Phili
ppin
es
South
Afr
ica
Percent of GDPPercent of total (RHS)
Percent Percent
0102030
40506070
80
0
5
10
15
20
25
South
Afr
ica
Mala
ysia
Me
xico
Chile
Hun
gary
Phili
ppin
es
Tha
iland
India
Indonesia
Ukra
ine
Percent of GDPPercent of total (RHS)
Percent Percent
051015
20253035
40
0
2
4
6
8
10M
exi
co
Mala
ysia
Hun
gary
Chile
India
Bra
zil
Phili
ppin
es
Colo
mbia
South
Afr
ica
Turk
ey
Percent of GDPPercent of total (RHS)
Percent Percent
0
20
40
60
80
100
120
0
1
2
3
4
5
Phili
ppin
es
Me
xic
o
Nepa
l
Nig
eria
India
Pakis
tan
Eth
iopia
Colo
mbia
Ukra
ine
Thaila
nd
Percent of GDPPercent of total (RHS)
Percent Percent

SPEC IAL FOCUS GLOBAL ECONOMIC PROSPECTS | JANUARY 2017 64
growth was on average higher in other advanced economies and EMDEs during periods of U.S. expansions than it was when the U.S. economy was in recession. More importantly, although the four recessions the global economy experienced since 1960 (1975, 1982, 1991, and 2009) were driven by a host of problems in many corners of the world, they all overlapped with severe recessions in the United States.4
�e global recession of 1975 coincided with the beginning of a prolonged period of stag(ation,
with low output growth and high in(ation in the United States. During the 1982 recession, the United States and several other advanced economies experienced a sharp decline in activity along with a steep increase in unemployment in the wake of anti-in(ationary monetary policies. �e economy again went into recession in July 1990 following a period of depressed activity in the housing market and a credit crunch. �e deep global recession of 2009 was driven by the global )nancial crisis, which had its origins in the U.S. mortgage market but turned into a truly global crisis after the collapse of Lehman Brothers in September 2008. �ese four U.S. recessions coincided with global recessions; there were, however, four other U.S. recessions post-1960 that did not.
An event study of the last two U.S. recessions, in 2001 and 2009, illustrates the concordance of the turning points of the U.S. business cycle with those of other advanced economies and EMDEs (Figure SF.7).5 �e 2009 recession was particularly severe for the United States whereas the U.S. economy experienced a mild recession in 2001 following the burst of the “dot com” bubble of the late 1990s. In the four quarters leading up to the last two U.S. business cycle troughs, other advanced economies also experienced a decline in the cyclical component of their GDP of, respectively, 0.5 and 4 percent, while their subsequent recoveries have been sluggish. Among EMDEs, slower activity was also observed around U.S. cyclical troughs.
Concordance statistics illustrate the degree of synchronization between the phases of the U.S. business and )nancial cycles and those of other economies. Business cycles are more highly synchronized than )nancial cycles: other countries tend to be in the same business cycle phase with the U.S. cycle roughly 80 percent of the time. While the degree of synchronization of )nancial cycles with the U.S. )nancial cycle is lower than that of business cycles, they are quite often in the same phase—about sixty percent of the time for
FIGURE SF.6 The U.S. economy and commodity markets
The United States accounts for more than one-fifth of global consumption
of oil and natural gas. It is the largest producer of oil and natural gas.
B. U.S. share of global production,
2015
A. U.S. share of global consumption,
2015
D. Oil and gas production, 2015 C. U.S. share of global crude oil
consumption and production
Sources: Haver Analytics, World Bank, BP Statistical Review of World Energy Efficiency, U.S. Energy
Information Administration.
A.B. Data for metals represent refined consumption and production. Iron ore consumption is
estimated with crude steel production. Grains include wheat, maize and rice; edible oils include
coconut oil, cottonseed oil, palm oil, palm kernel oil, peanut oil, rapeseed oil and soybean oil. Oil
includes inland demand plus international aviation and marine bunkers and refinery fuel and loss.
Coal includes commercial solid fuels only, i.e., bituminous coal, anthracite, lignite and brown coal,
and other commercial solid fuels. Natural gas excludes natural gas converted to liquid fuels but
includes derivatives of coal as well as natural gas consumed in gas-to-liquids transformation.
D. Oil and natural gas production in British thermal units (Btu), assuming that 1 barrel of crude oil is
equivalent to 5,729,000 Btu and 1 cubic foot of natural gas is equivalent to 1,032 Btu.
4Global recessions are contractions in inflation-adjusted output per capita accompanied by broad, synchronized declines in various other measures, such as world industrial production, employment, trade and capital flows, and energy consumption (Kose and Terrones 2015).
5Two U.S. business cycle peaks (March 2001 and December 2007) and two U.S. business cycle troughs (November 2001 and June 2009) are identified since 2000 by the NBER’s Business Cycle Dating Committee.
0 10 20 30
AluminumCopper
NickelZinc
LeadTin
Iron oreCoal
OilNatural gas
GrainsEdible oils
CottonPercent
0 10 20 30
AluminumCopper
NickelZinc
LeadTin
Iron oreCoal
OilNatural gas
GrainsEdible oils
Cotton
Percent
0
5
10
15
20
25
30
19
91
Q1
19
93
Q1
19
95
Q1
19
97
Q1
19
99
Q1
20
01
Q1
20
03
Q1
20
05
Q1
20
07
Q1
20
09
Q1
20
11
Q1
20
13
Q1
20
15
Q1
Production Consumption
Percent of world total
0
20
40
60
U.S. RussiaSaudiArabia
U.S. RussiaSaudiArabia
U.S. RussiaSaudiArabia
1990 2008 2015
Oil Natural gas
Quadrillion Btu per day

SPEC IAL FOCUS GLOBAL ECONOMIC PROSPECTS | JANUARY 2017 65
credit, housing, and equity price cycles (Figure SF.7). While it is di,cult to establish empirically whether the U.S. economy leads business and )nancial cycle turning points in other major economies, recent research indicates that the United States appears to in(uence the timing and duration of recessions in a number of other major economies (Francis, Owyang, and Soques 2015).
Spillovers from the United
States to the global
economy
Developments in the U.S. economy have signi)cant impacts on the global economy. Shocks to the U.S. economy transmit to the rest of the world through the wide range of channels discussed above. An acceleration in U.S. activity can lift growth in its trading partners directly, through an increase in import demand, and indirectly, by strengthening productivity spillovers embedded in trade.6 Given its sizable role in global commodity markets, an acceleration in U.S. activity tends to lift global commodity demand and raise prices. �is supports activity and eases balance of payments pressures in commodity exporters. Financial market developments in the United States may have even wider global implications. Fiscal stimulus in the United States could therefore be expected to boost domestic activity and generate cross-border spillovers through real and )nancial channels.
Independently of growth, policy, or )nancial market developments in the United States, shocks to con)dence of U.S. businesses and consumers can themselves reverberate across borders and be sources of business cycle (uctuations (Levchenko and Pandalai-Nayar 2015). Elevated uncertainty about changes in U.S. policies can reduce incentives to commit to capital investment at home and abroad, and this in turn could adversely aKect long-term global growth prospects (Kose and Terrones 2015).
6For a detailed analysis of the intensity of business cycle linkages between the United States and other countries, see Dai (2014); Dées and Vansteenkiste (2007); Canova (2005); Stock and Watson (2005); Kose (2003); Kose, Prasad, and Terrones (2004); Jansen and Stokman (2004); Eckmeier (2006); IMF (2007); and Roache (2008).
FIGURE SF.7 Synchronization of business and financial
cycles
Business cycles have been highly synchronized between the United
States, other advanced economies, and EMDEs. Business cycles in the
United States and the world are somewhat more synchronized than
financial cycles.
B. Growth during U.S. business
cycles, 1960-2015
A. Cyclical component of GDP
D. Concordance with U.S. business
and financial cycles
C. Correlations with U.S. business
cycles
F. Activity around the U.S. recession
of 2009
E. Activity around the U.S. recession
of 2001
Sources: Haver Analytics, World Bank, Kose and Terrones (2015), International Monetary Fund.
A. Cyclical component is defined as deviation from Hodrick-Prescott-filtered trend.
B. Annual average per capita growth rates in purchasing power parity during years of expansions and
recessions in the United States. Years of expansions and recessions are defined as those with annual
positive and negative GDP per capita purchasing power parity growth in the United States,
respectively. Other AEs exclude the United States.
C. Contemporaneous correlations between cyclical component of U.S. real GDP and cyclical
component of real GDP of advanced economies and EMDEs.
D. Average share of years in which business cycles in the United States and all economies were in
the same phase. A higher share suggests more synchronization between two countries.
E.F. The graph shows cyclical component of GDP measured as the deviation from trend GDP
computed using a Hodrick-Prescott filter on seasonally adjusted quarterly GDP around a trough in
U.S. business cycle (t = 0) indicated by the solid bar. Troughs are 2001Q4 and 2009 Q2, defined by
the National Bureau of Economic Research. The line refers to median of 35 advanced economies and
51 EMDEs.
-4
-3
-2
-1
0
1
2
3
4
200
0
200
2
200
4
200
6
200
8
201
0
201
2
201
4
201
6
US Other AEs EMDEs BRICSPercent
-2
-1
0
1
2
3
4
U.S. expansions U.S. recessions
United States Other AEs EMDEsPercent
0.0
0.2
0.4
0.6
0.8
AEs EMDEs BRICS
2001Q1-2007Q42007Q4-2016Q3
Correlation
0
20
40
60
80
100
Businesscycles
Creditcycles
Houseprice
cycles
Equityprice
cycles
Percent of total
-3
-2
-1
0
1
2
3
-4 -3 -2 -1 0 1 2 3 4
AEs EMDEs
Percent deviation from trend GDP
Quarters
-3
-2
-1
0
1
2
3
-4 -3 -2 -1 0 1 2 3 4
AEs EMDEs
Percent deviation from trend GDP
Quarters

SPEC IAL FOCUS GLOBAL ECONOMIC PROSPECTS | JANUARY 2017 66
Growth spillovers. U.S. growth shocks generally have sizable eKects on activity in the rest of the world. A 1 percentage point increase in U.S. growth could lift growth in advanced economies by 0.8 percentage point and in EMDEs by 0.6 percentage points after one year, while global growth could rise by 0.7 percentage point (Figure SF.8).7 �e impact on investment in these economies would be approximately twice as large. NAFTA members (Canada and Mexico) would particularly bene)t from trade spillovers (Yifan and Abeysinghe 2016). Terms of trade eKects through commodity markets would be another transmission channel (World Bank 2016c).
Financial market spillovers. �e role of the United States in global )nancial markets goes well beyond direct capital (ows to and from the United States.8 U.S. bond and equity markets are the largest and most liquid in the world. Swings in U.S. sovereign bond yields are often closely mirrored in the Euro Area and other large )nancial markets. Similarly, cross-border spillovers from U.S. equity markets are large and depend more on openness to the global economy than on the size of actual bilateral portfolio (ows
(Ehrmann, Fratzscher, and Rigobon 2011; Rose and Spiegel 2011). �is makes U.S. monetary policy and investor con)dence an important driver of global )nancial conditions (Ehrmann and Fratzscher 2009; Arteta et al. 2015; Rey 2015).
Because of its predominant use in global trade and )nancial transactions, broad-based U.S. dollar exchange rate movements have global implications. Episodes of U.S. dollar appreciation tend to coincide with bank deleveraging, tighter global )nancial conditions, greater incidence of )nancial crises and subdued EMDE growth.9 Although the share of private and public debt denominated in foreign currency has declined since the 1990s, the exposure of some EMDEs to foreign currency movements is still high, especially in commodity exporters, as well as importers that have received large capital in(ows after the global )nancial crisis (Arteta et al. 2016). If the U.S. dollar goes through a period of signi)cant appreciation, previous experience indicates that EMDEs with substantial short-term dollar-denominated debt could become vulnerable to rollover and interest rate risks and to a drying up of foreign exchange liquidity.10
Monetary policy spillovers. Changes in U.S. monetary policy have sizable cross-border eKects through their impact on domestic activity and global )nancial markets, including currency and asset markets. Since the global )nancial crisis, highly accommodative monetary policies in advanced countries have coincided with an acceleration in capital in(ows to EMDEs. In turn, higher U.S. interest rates could reduce such (ows, especially those intermediated by banks, and push up global interest rates.11
Although actual or expected changes in U.S. monetary policy have signi)cant impacts on U.S. and global long-term yields, the implications for EMDEs would likely depend on underlying
FIGURE SF.8 Spillovers from U.S. growth shocks
A 1 percentage point increase in U.S. growth could lift global growth by
about 0.7 percentage points over the following year.
A. Output growth in other advanced
economies
B. Output growth in EMDEs
Sources: World Bank; Haver Analytics; OECD.
Notes: See Annex SF.1A for details on the methodology.
7�is estimate for advanced economies is in line with other estimates for Canada (Swiston and Bayoumi 2008). For Mexico and Caribbean economies with strong economic ties to the United States, considerably larger spillovers in excess of 1 percentage point have been estimated (Sun and Samuel 2009; Swiston and Bayoumi 2008). 8See Berkmen et al. (2012); de Grauwe and Yi (2015); Frankel and Saravelos (2012); Helbling et al. (2011); Metiu, Björn, and Grill (2015).
9See Bruno and Shin (2015a and b); IMF (2015a and b); Druck, Magud, and Mariscal (2015); Abbate et al. (2016).
10See Chow et al. (2015); Chui, Fender, and Sushko (2014); McCauley, McGuire, and Sushko (2015). 11See Ammer et al. (2016); Glick and Leduc (2015); Georgiadis (2015); Borio and Zhu (2012); Bowman, Londono, and Sapriza (2015); Bruno and Shin (2015); Neely (2015).
0.0
0.5
1.0
1.5
2.0
On Impact 1 Year 2 Years
Percentage point
0.0
0.5
1.0
1.5
2.0
On Impact 1 Year 2 Years
Percentage point

SPEC IAL FOCUS GLOBAL ECONOMIC PROSPECTS | JANUARY 2017 67
FIGURE SF.9 Spillovers from U.S. interest rate shocks to
EMDEs
An increase in U.S. long-term yields supported by a stronger U.S.
economy (real shock) could lift EMDE equity prices and industrial
production. In contrast, an increase in yields driven by a sudden
reassessment of monetary policy expectations (monetary shock) could
have a sizable adverse effect on EMDE equity markets, exchange rates,
industrial production, and capital flows.
A. Impact of rising U.S. long-term
yields on EMDE equity prices
B. Impact of rising U.S. long-term
yields on EMDE industrial production
Sources: Haver Analytics, Bloomberg, World Bank estimates.
Notes: See Annex SF.1B for details on the methodology.
C. Impact of rising U.S. long-term
yields on EMDE real exchange rate
D. Impact of interest rate shock in
four major economies on EMDE
capital flows
drivers. For example, if a rise in long-term U.S. yields is supported by prospects of a strengthening U.S. economy (a favorable “real shock”), the net eKect for EMDEs could be positive (Figure SF.9). In particular, it could bolster equity valuations and activity, and lead to less pronounced currency pressures. Alternatively, if )nancial markets are surprised by prospects of a less accommodative stance of U.S. monetary policy, one that is not supported by strengthening growth, this could have adverse consequences for EMDEs through asset price and capital (ow channels (an adverse “monetary shock”). Financial stress associated with such a change could combine with domestic fragilities and increase the risks of sudden stops to capital in(ows to more vulnerable EMDEs.
�e ultimate impact on capital (ows of unexpected U.S. monetary policy tightening (beyond one warranted by strengthening U.S. activity) would also depend on policy actions of other major central banks. EKects would be ampli)ed if it coincided with rate increases by other major central banks or would be dampened if it coincided with rate cuts elsewhere. A 100 basis point increase in long-term U.S. bond yields could reduce capital (ows to EMDEs by 20-45 percent, with the upper bound of this range re(ecting simultaneous interest rate increases by other major central banks and the lower bound re(ecting unchanged monetary policy elsewhere.
Fiscal policy spillovers. U.S. )scal policy stimulus could generate international spillovers by raising U.S. demand for imports from abroad or by causing exchange rate pressures. Simulations using the Federal Reserve Board’s model (FRB/US) suggest that a )scal stimulus of 1 percent of GDP could be expected to raise GDP by between 0.7 and 1.5 percent after two years. However, the eKectiveness of )scal stimulus in lifting U.S. growth depends critically on the circumstances of its implementation. Fiscal multipliers—the additional output generated by an additional U.S. dollar of government de)cit—depend on the presence of economic slack, the reaction of monetary policy, and the nature of the )scal measures (Laforte and Roberts 2014; Brayton, Laubach, and Reifschneider 2014; Whalen and Reichling 2015).
In addition to this demand eKect, )scal stimulus in the United States could generate currency pressures, with )nancial stability implications for EMDEs. In particular, )scal stimulus could cause dollar appreciation, at least in the short run. �is could eventually lift exports of U.S. trading partners because of improved competitiveness. However, in the short-term, it might trigger )nancial stability concerns in economies with elevated U.S.-dollar denominated liabilities. Empirical evidence of the impact of U.S. )scal policy on the strength of the U.S. dollar is mixed, however.12 In addition, if U.S. )scal stimulus leads to a higher level of U.S. public debt in the long-term, this could cause an increase in global interest
12See Enders, Müller, and Scholl (2011); Ravn, Schmitt-Grohé, and Uribe (2012); and Corsetti, Meier, and Müller (2012); Forni and Gambetti (2016); and Auerbach and Gorodnichenko (2016).
-0.4
-0.2
0.0
0.2
0.4
0.6
0.8
1.0
1.2
1.4
Monetary Real
Percent
-4
-3
-2
-1
0
1
2
3
4
5
Monetary Real
Monetary RealPercent
-0.6
-0.4
-0.2
0.0
0.2
0.4
0.6
0.8
1.0
1.2
Monetary Real
Percent
-3
-2
-1
0
t t+4 t+8
Percent of GDP, deviation from baseline
Quarters

SPEC IAL FOCUS GLOBAL ECONOMIC PROSPECTS | JANUARY 2017 68
�e impact on other advanced economies would be broadly comparable.
Financial market volatility does not necessarily coincide with policy uncertainty, yet both appear to be detrimental to investment. Policy uncertainty is measured by the Economic Policy Uncertainty Index (EPU), a news-based measure of policy uncertainty (Baker, Bloom and Davies 2013). A sustained 10 percent increase in the index of U.S. EPU could, after one year, reduce U.S. output growth by about 0.15 percentage point, EMDE output growth by 0.2 percentage point, and EMDE investment growth by 0.6 percentage point (Figure SF.10).
Spillovers to the United
States from the global
economy
Important as the U.S. economy is to the global economy, the U.S. economy also bene)ts from the strength of its linkages with the rest of the world (Figure SF.11). Moreover, global economic and )nancial developments play an important role in driving activity and )nancial markets in the United States.
Global trade. In 2015, trade accounted for more than one-quarter of U.S. GDP (28 percent) and manufacturing output for slightly more than one-)fth (22 percent) of GDP. Most U.S. goods exports are manufacturing goods (87 percent of U.S. goods exports), followed by agricultural products (4 percent) and oil, gas and minerals (2 percent). �e most prominent goods export categories are petroleum oils (other than crude), motor vehicles and their parts, and electronic parts. Most U.S. goods and services exports are shipped to Canada, the EU, Mexico, and China, which altogether account for more than 60 percent of total U.S. exports. Export-intensive industries in the United States have tended to be more productive and oKered higher wages than non-export-intensive industries: during 1989-2009, on average, their total factor productivity growth was 51 percent higher; labor productivity was 10 percent higher; and wages were 17 percent higher (Council of Economic Advisors 2015).
FIGURE SF.10 Spillovers from U.S. uncertainty shocks
to EMDEs
A sustained increase in financial market volatility or policy uncertainty in the
United States would significantly slow U.S. growth, as well as output and
investment growth in other AEs and EMDEs.
B. Impact of 10-percent rise in VIX on
investment growth
A. Impact of 10-percent rise in VIX on
output growth
D. Impact of 10-percent rise in U.S.
EPU on investment growth C. Impact of 10-percent rise in U.S.
EPU on output growth
Sources: Haver Analytics, OECD, World Bank estimates.
Note: See Annex SF.1C for details on the methodology.
rates and be a source of adverse cross-border spillovers through tightening )nancial conditions (Cardarelli and Kose 2004).
Uncertainty spillovers. Increased uncertainty driven by )nancial market volatility or ambiguity about the direction and scope of policies could discourage investors—in the United States and elsewhere—that base their decisions about long-term investments on stable )nancing conditions and predictable policies. Sustained increases in )nancial market uncertainty, e.g., as captured in the implied volatility of the U.S. stock market (VIX), could set back output and investment growth in the United States, other advanced economies and EMDEs (Carrière-Swallow and Céspedes 2013; Bloom 2009). A 10 percent increase in the VIX could reduce average EMDE output growth by about 0.2 percentage point and EMDE investment growth by about 0.6 percentage point after one year (Figure SF.10).
-0.4
-0.3
-0.2
-0.1
0.0
U.S. AEs EMDEs
16-84 percent confidence bands
Median
Percentage point
-1.2
-0.9
-0.6
-0.3
0.0
U.S. AEs EMDEs
16-84 percent confidence bands
Median
Percentage point
-0.6
-0.4
-0.2
0.0
0.2
U.S. AEs EMDEs
16-84 percent confidence bands
Median
Percentage point
-1.0
-0.8
-0.6
-0.4
-0.2
0.0
0.2
U.S. AEs EMDEs
16-84 percent confidence bands
Median
Percentage point

SPEC IAL FOCUS GLOBAL ECONOMIC PROSPECTS | JANUARY 2017 69
Global value chain participation. Many U.S. companies are deeply integrated into global supply chains. As a result, U.S. exports themselves are often an input into other countries’ production for exports (“forward participation”). One-quarter of U.S. exports represents U.S. value added embodied in other countries’ exports. Such forward participation is particularly high in chemicals, business services, and electronics, and with China, Canada, and Mexico. “Backward participation” is more limited: the average import content of U.S. exports was 13 percent in 2014, well below the average for other advanced economies (27 percent). However, in some U.S. industries, imports account for more than 20 percent of inputs. �ese include apparel and leather products, motor vehicles, and computers and electronics (U.S. Trade Commission 2011). Imports are often essential components that do not have readily available domestic substitutes.
Multinational corporations. Much global value chain activity is conducted through U.S. multinational corporations and their a,liates abroad. Although U.S. multinationals account for less than 1 percent of the total number of U.S. )rms, since 1990, they accounted for one-third of U.S. real GDP growth and almost half of U.S. labor productivity growth (McKinsey Global Institute 2010). As part of global supply chains, U.S. multinationals rely heavily on exports and imports; in fact, the largest U.S. exporters are multinationals (Moran and Oldenski 2016). Multinationals’ presence in )nancial markets is large; for example, they account for about 85 percent of the stock market capitalization of the S&P500.
About 43 percent of total U.S. trade occurs within multinational )rms (intra-)rm trade), especially in the case of U.S. trade with advanced economies. Since the global )nancial crisis, intra-)rm trade has continued to grow robustly (especially with EMDEs) whereas arm’s-length trade has slowed sharply.
Access to foreign markets has also bene)ted domestic U.S. activity. For example, a 10 percent increase in foreign direct investment by U.S. multinationals abroad was accompanied by 2.6
FIGURE SF.11 Importance of the global economy for the
U.S. economy
Imported goods account for about one-sixth of consumption expenditures.
Multinational corporations make significant contributions to U.S. output,
exports, and employment. Global developments account for a sizable
fraction of variation in business cycles in the United States. Growth shocks
originating in other economies, especially in other advanced economies,
have a significant impact on activity in the United States.
B. Role of foreign multinational
corporations in the United States A. Share of imports in U.S.
consumption expenditures, 2009
D. Spillover to United States from 1
percentage point increase in global,
other AE and EMDE growth
C. Variance share of U.S. and G6
growth
Sources: McCully (2011), Bureau of Economic Analysis, World Bank estimates.
A. Share of imports in U.S. personal consumption expenditures. “Durables ex. cars, recr., hh. equip.”
stands for durables excluding motor vehicles and parts, recreational goods and vehicles, and
furnishings and durable household equipment. “Recreational goods” stands for recreational goods
and vehicles. “Durable household equipment” stands for furnishings and durable household
equipment. “Motor vehicles” stands for motor vehicles and parts. “Nondurables ex. en., cloth., footw.”
stands for nondurables excluding gasoline and other energy goods, clothing and footwear. “PCE”
stands for personal consumption expenditure and consists of goods and services.
B. Share of multinational corporations in U.S. sales, exports and imports of goods and employment.
“Sales” indicates sales of multinational corporations in gross output of U.S. private sector industries.
Data covers 2010-2013.
C. D. See Annex SF.1D for details on the methodology.
percent greater domestic investment in the United States (Desai, Foley, and Hines 2009). In turn, foreign multinationals operating in the United States provided 10 percent of U.S. employment and 19 percent of U.S. exports, on average, during 2010-13 (Figure SF.11).
Global !nance. Financial linkages between the U.S. and the rest of the world, including emerging market economies, have grown rapidly over the past decade, potentially leading to two-way spillovers. Financial market stress or sharp growth slowdowns in the rest of the world can put
05
101520253035
Clo
thin
g a
nd
footw
ea
r
Dura
ble
s e
x. cars
,re
cr.
, h
h. equ
ip.
Recre
ational
good
s
Moto
r vehic
les
Dura
ble
houshold
eq
uip
ment
Nondura
ble
s e
x.
en., c
loth
., footw
.
Goo
ds
PC
E
Serv
ices
Percent
0
5
10
15
20
25
30
Sales Exports Imports Employment
Percent of U.S. total
0
10
20
30
40
50
Global Factor AdvancedEconomy
Factor
IdiosyncraticFactors
Percent US G6
-0.4
-0.2
0.0
0.2
0.4
0.6
0.8
1.0
1.2
1.4
Global ex.U.S.
AE ex. U.S. EMDE
Percentage point GDP growthIndustrial production

SPEC IAL FOCUS GLOBAL ECONOMIC PROSPECTS | JANUARY 2017 70
pressure on the U.S. )nancial system (IMF 2012; 2013; 2014). For example, )nancial stress that raises risk premia and widens output gaps by 1 percent in some major economies, could widen the U.S. output gap by 0.1-0.35 percent (IMF 2013).
A signi)cant appreciation of the U.S. dollar, which could be driven by increasingly divergent monetary policies with other reserve currencies, weakening growth prospects in the rest of the world, or relatively sizable )scal stimulus in the United States, could have a negative impact on U.S. growth as well. For example, a 10 percent appreciation of the trade-weighted U.S. dollar, could reduce U.S. GDP from baseline by over 1½ percent after three years, assuming no change in monetary policy (Fischer 2015). �e adverse eKect would materialize only gradually, with over half of the impact occurring after more than a year. Monetary policy accommodation could substantially ease the impact of a strengthening dollar to about one-half to two-thirds of its direct trade eKect.13
Consumer and labor markets. About one-third of U.S. consumer spending is on goods, of which about one-sixth is on imported goods. �e share of imports in consumption expenditures is larger for durable goods (29 percent)—especially durable household equipment, motor vehicles, and recreational goods—and clothing and footwear (32 percent). �e United States hosts the world’s largest number of immigrants (Chandy and Seidel 2016). Immigrants accounted for 17 percent of the U.S. civilian labor force, on average, in 2015, and more than one-quarter in some parts of the United States. Immigrants originate from all over the world, but mainly from Mexico, China, and India.14
Spillovers from the world to the United States. Because of strengthening multidimensional linkages between the United States and the rest of the world, U.S. business cycles are highly
synchronized with the global business cycle. Global developments account for a sizable fraction of variation in business cycles in the United States. In addition, growth shocks originating in other economies, especially in other advanced economies, have a signi)cant impact on activity in the United States through demand spillovers (Bems, Johnson, and Yi 2010; Figure SF.11).15
Conclusion
Economic policy initiatives in the United States can have sizable ripple eKects around the world—a testament to the U.S. size and global integration. Continuing uncertainty about the direction of U.S. policies in itself could in(uence global growth prospects. �e incoming administration promises major changes in key areas, including )scal policy and international trade. Many questions arise about the domestic and global implications of these changes. Given limited knowledge to date about the scope and form of the new policies, it is too early to rigorously examine them, or to make detailed estimates of their implications, especially as regards the new direction on international trade. �is Special Focus aims to provide information that will assist assessments of policies as and when they are de)ned in operational terms and their global implications. Relevant questions on the role of the United States in the global economy are as follows:
What are the major channels of transmission of developments in the U.S. economy to other countries? �e United States is the world’s single largest economy: it accounts for roughly one-quarter of global output and about one-tenth of total trade (ows. It is also the single largest international creditor and debtor. Given its massive size and the strength of its ties with the global economy, shocks to the U.S. economy are transmitted globally through a variety of channels, including trade, )nance, and commodity market linkages.
15Some recent studies examine the impact of shocks originating in other countries on activity in the United States (Bayoumi and Swiston 2009; Osborn and Vehbi 2013; IMF 2014; Cashin, Mohaddes and Raissi 2016). For the cyclical spillovers between U.S. and global business cycles, see Kose, Otrok and Whiteman (2008); Dees and Saint-Guilhem (2009); Huidrom, Kose, and Ohnsorge (2016); World Bank (2016).
13See Erceg, Guerrieri, and Gust 2006; Laforte and Roberts (2014); Brayton, Laubach, and Reifschneider (2014). 14Immigration generally appears to raise aggregate wages and lower prices as well as stimulate investment and innovation (Peri 2010; Greenstone and Looney 2012; Hunt and Gaultier-Loiselle 2010; Chellaraj, Maskus and Mattoo 2008).

SPEC IAL FOCUS GLOBAL ECONOMIC PROSPECTS | JANUARY 2017 71
How strong are business cycle linkages between the United States and other economies? U.S. business cycles are highly synchronized with global business cycles. Growth is often higher in rest of the world during periods of U.S. expansions than it is during U.S. recessions. �e four global recessions since 1960 all coincided with severe recessions in the United States.
How large are global spillovers from shocks originating in the United States? Shocks to U.S. growth, changes in U.S. )scal and monetary policies, or uncertainty in U.S. )nancial markets or policies all could have global spillovers. For example, a surge in U.S. growth can be expected to accelerate activity in the rest of the world. In contrast, lingering uncertainty about the direction of U.S. policy could dampen activity and investment abroad.
How important is the global economy for the United States? Because of its size and reach, the United States is at the center of global trade and )nancial networks. U.S. multinational corporations and their a,liates abroad are deeply integrated into global supply chains. Financial linkages between the U.S. and the rest of the world, including emerging market economies, have grown rapidly over the past decade, widening the potential for spillovers in either direction. �ese two-way channels imply that, important as the U.S. economy is for the global economy, the U.S. economy is in turn aKected by developments in the rest of the world.
�is Special Focus aims to provide the background required to inform an assessment of U.S. policy initiatives and their global implications. U.S. growth is expected to regain only modest momentum to 2.2 percent in 2017, from a subdued 1.6 percent in 2016, predicated on a broadly neutral )scal stance expected for 2017. Given the uncertainty about the eventual shape of U.S. policies, these forecasts do not yet include the likely impact of U.S. policy changes.
Many details of the new administration’s policy plans have yet to be announced. For example, the new administration has signaled its intention to pursue more expansionary )scal policies, including
personal and corporate tax cuts and tax incentives to stimulate infrastructure upgrades, possibly coupled with other federal spending changes. Sizable )scal stimulus measures could result in faster-than-anticipated U.S. growth in the near term. However, the positive growth impact of these actions could be oKset by shifts in the pattern of federal government outlays that result in sizable net spending cuts, or by )scal sustainability concerns. Changes in some other U.S. policies, such as changes in trade policy, could also oKset the positive eKects of )scal stimulus, or could even set back growth. Until comprehensive and speci)c proposals are available, the overall impact of U.S. policy changes on U.S. and global activity cannot be assessed. However, the isolated impact of some individual components can be analyzed.
Reduction in corporate and personal income taxes. �e )scal proposals put forward by the new U.S. administration include a cut in the statutory corporate income tax rate from 35 to 15 percent. Such a corporate income tax cut could—by itself and without considering other policies by the new administration—boost U.S. GDP growth by around 0.6 percentage point after four quarters following implementation, and by cumulatively 0.9 to 1.3 percentage points after eight quarters, depending in particular on the reaction of monetary policy authorities (Annex SF.2).
�e new administration also proposed cutting personal income taxes, especially for the highest-income earners; reducing the number of individual income tax brackets; and changing the structure of tax deductions. If fully implemented, these measures could reduce the average tax rate on personal income by about 2.5 percentage points, and by over 7 percentage points for top income earners (Nunns et al. 2016). Such a cut could—by itself—increase U.S. GDP growth by around 0.3 percentage point after four quarters following implementation and by cumulatively 0.4 to 0.6 percentage point after eight quarters, again depending in particular on the reaction of monetary policy authorities (Annex SF.2).
Taken together, these corporate and personal income tax reforms could—without consideration

SPEC IAL FOCUS GLOBAL ECONOMIC PROSPECTS | JANUARY 2017 72
of additional policy changes by the new administration—raise U.S. GDP growth forecasts to 2.2-2.5 percent in 2017 and 2.5-2.9 percent in 2018 (Annex SF.2). �ese estimates depend on the timing of the tax cuts, the reaction of monetary policy authorities, the amount of slack remaining in the U.S. economy, and how businesses and households adjust their expectations to these policy changes. In addition, these estimates do not speci)cally take into account )scal sustainability considerations.
Stronger U.S. growth would help global activity by raising U.S. demand for trading partners’ exports. Empirical estimates indicate that a 1 percentage-point shock to U.S. growth could boost growth after one year by 0.8 percentage point in other advanced economies, and by 0.6 percentage point in EMDEs. In the illustrative scenario of reforms to U.S. corporate and personal income taxes discussed above, global growth could rise by up to 0.1 percentage point in 2017 if tax cuts are fully implemented in the second quarter of the year. In addition, global growth could rise by at least 0.3 percentage point in 2018, depending on the timing of tax cuts and the reaction of U.S. monetary policy authorities. Investment could respond even more strongly. While some of the proposed U.S. corporate tax reforms could potentially aKect corresponding )scal revenues in other countries where U.S. corporations operate, the net global impact of stronger activity and investment in the United States is likely to be positive (Clausing, Kleinbard, and Matheson 2016; Nicar 2015). �ese potential positive spillovers from U.S. personal and corporate income tax reforms could be ampli)ed or dampened by other policy changes.
For individual countries, the bene)ts of U.S. )scal stimulus would also depend on the impact on exchange rates. If a )scal stimulus were accompanied by U.S. dollar appreciation, debt burdens for EMDEs with elevated U.S. dollar-denominated liabilities would rise and become a potential source of )nancial strains.
Increase in infrastructure investment. �e new U.S. administration has signaled a number of measures to stimulate infrastructure investment,
but speci)cs remain to be clearly formulated for both the overall size and the choice of measures (and, hence, their impact on activity). �ere have been suggestions of increasing both public investment in transportation and infrastructure and of boosting private investment through tax credits. Empirical studies suggest that increases in government infrastructure investment tend to have large immediate eKects on activity, with )scal multipliers often estimated to be markedly above 1 (Auerbach and Gorodnichenko 2013; Bivens 2014; Whalen and Reichling 2015). Empirical evidence regarding the eKect of tax credit and policy-driven support to private investment in infrastructure in the United States is limited. Studies of comparable initiatives in Europe point to positive but limited net eKects (Claeys and Leandro 2016). Until additional details are unveiled, it is di,cult to quantify the potential impact of these measures on the outlook.
Changes in federal spending. �e new U.S. administration has suggested sizable cuts in non-defense spending, likely accompanied by increases in defense spending. While speci)c proposals have not yet been made, it is possible that, on net, overall federal spending will be substantially reduced. Accordingly, the impact of corporate and personal income tax cuts and infrastructure spending on aggregate demand could be oKset in the short term if overall federal spending is also cut. �is oKsetting eKect would depend on the size of the net reduction in government outlays and on the estimated )scal multiplier of various spending categories (Whalen and Reichling 2015).
Other policy proposals mentioned by the new administration include changes to trade agreements and import tariKs. If they lead to higher import costs, policy initiatives to renegotiate trade agreements could be detrimental to U.S. and global activity. For about one-quarter of the world’s countries, the United States is the largest trading partner. Moreover, given the signi)cant integration of many U.S. companies into global supply chains, there could be even larger adverse collateral eKects from imposing new trade barriers if other countries were to retaliate (Noland, Robinson, and Moran 2016). More detailed information is needed to quantify the

SPEC IAL FOCUS GLOBAL ECONOMIC PROSPECTS | JANUARY 2017 73
potential costs of any new trade policies. However, even without any policy action by the United States, heightened uncertainty about potential policy initiatives could set back already-weak global investment (Chapter 3). A 10 percent increase in the U.S. Economic Policy Uncertainty index or the VIX could reduce EMDE investment growth by 0.6 percentage point after a year.
Global spillovers. In sum, given that policy initiatives in the United States would have signi)cant global implications, a robust U.S. economy is critical for the health of the world economy. On the one hand, a well-targeted )scal stimulus could lead to stronger growth in the United States, which could be accompanied by sizable positive spillovers to the rest of the world over the short term. On the other hand, rising trade barriers and policy uncertainty could, through feedbacks, negatively aKect U.S. growth as well as the global economy.
Annex SF. 1 Cyclical
spillovers
A. Spillovers from U.S. growth
Figure SF.8 shows the cumulative impulse response of weighted average AE and EMDE GDP growth to a 1 percentage point increase in growth in real GDP in the United States. Growth spillovers to AE and EMDE are based on a Bayesian vector autoregression of global GDP growth excluding the United States and AE or EMDE, U.S GDP growth, the U.S. 10-year sovereign bond yield plus JP Morgan’s EMBI index and AE or EMDE GDP growth. �e oil price is exogenous. Bars represent medians, and error bars 16-84 percent con)dence bands. �e Sample for AE includes Euro Area (19 countries), Canada, Japan, and the United Kingdom and 19 EMDE for 1998Q1-2016Q2.
B. Spillovers from U.S. interest rate increases
Figure SF.9A-C shows impulse responses after 12 months from a panel vector autoregression model that includes EMDE industrial production, long-term bond yields, stock prices, nominal eKective
exchange rates and bilateral exchange rates against the U.S. dollar, and in(ation. Monetary and real shocks are exogenous regressors. Monetary and real shocks are de)ned as in Box 1 of Arteta et al. (2015). All data are monthly or monthly averages of daily data, spanning January 2013-September 2015. A total of for 23 EMDEs were included. For comparability, the size of U.S. real and monetary shocks is normalized such that each shock raises EMDE bond yields by 100 basis points on impact.
Figure SF.9D shows the impulse response of capital (ows to EMDEs to a 100 basis point increase in the U.S. term spread. �e results are based on a six-variable VAR model estimated over the period 2001Q1 to 2014Q4 for 64 EMDEs (Arteta et al. 2015). �e VAR model includes capital (ows to EMDEs (including foreign direct investment, portfolio investment, and other investment as a share of GDP), quarterly real GDP growth in EMDEs and G4 countries (United States, Euro Area, Japan, and the United Kingdom), real G4 short-term interest rates (three-month money market rates minus annual in(ation measured as changes in GDP de(ator), G4 term spread (10-year government bond yields minus three month money market rates), and the VIX index of implied volatility of S&P 500 options.
�e grey area shows the range of estimated eKects on capital in(ows depending on rate hikes of other major central banks. �e lower bound corresponds to unchanged policy rates by the European Central Bank (ECB), Bank of England, and Bank of Japan, implying a 40 basis points shock to global bond yields. �e upper bound corresponds to a 100 basis point increase in policy rates by the ECB, the Bank of England and the Bank of Japan (i.e., a 100 basis points shock to global bond yields). In the median case, global bond yields increase initially by 70 basis points, similar to the 2013 “taper tantrum”.
C. Spillovers from U.S. policy and financial market uncertainty
Figure SF.10 shows cumulative impulse responses after one year on output growth (A.C.) or investment growth (B.D.) in the United States, 23

SPEC IAL FOCUS GLOBAL ECONOMIC PROSPECTS | JANUARY 2017 74
other AEs, and 18 EMDEs to a 10-percent increase in the VIX (A.B.) or in the U.S. EPU (C.D.). Vector autoregressions are estimated for 1998Q1-2016Q2 with two lags.
�e model for the U.S. includes, in this order, uncertainty index (VIX or U.S. EPU), U.S. stock price index (S&P 500), U.S. 10-year bond yields, U.S. real GDP, and investment growth.
�e model for AEs includes uncertainty indexes (VIX or U.S. EPU), MSCI Index for advanced economies (MXGS), U.S. 10-year bond yields, aggregate real output, and investment growth in 23 other AEs.
�e model for EMDEs includes uncertainty indexes (VIX or U.S. EPU), the MSCI emerging market equity price index, J.P. Morgan Emerging Market Bond Index (EMBIG), aggregate real output and investment growth in 18 EMDEs. G7 real GDP growth, U.S. 10-year bond yields, and the MSCI world equity price index are added as exogenous regressors.
D. Spillovers from the global economy to the United States
Figure SF.11C shows the contribution of global, group-speci)c, and other factors to the variance of GDP growth. A dynamic factor model is estimated over the period 1985-2015, using a sample of 106 countries grouped into three regions: advanced markets (AE), emerging and frontier markets (EM-FM), and other developing countries. Variance decompositions are computed for each country and, within each country, for output. Each bar represents the variance share of U.S. and G6 output growth attributable to the global factor, the AE-speci)c factor, the country-speci)c factor and the idiosyncratic term.
Figure SF11.D shows cumulative impulse responses after one year of GDP or industrial production (IP) growth in the United States following a 1 percentage point increase in GDP or industrial production growth in 22 other AEs and 19 EMDEs (13 EMDEs for industrial production). “Global” indicates the weighted average impact of AEs and EMDEs. Vertical lines
indicate 16th-84th percentile con)dence bands. Vector autoregression models are estimated for 1998Q1-2016Q2 with four lags. �e model includes, in this order, global GDP or industrial production growth excluding the United States and AE or EMDE, U.S. GDP or industrial production growth, the U.S. 10-year sovereign bond yield plus JP Morgan’s EMBI index and AE or EMDE GDP or industrial production growth. �e oil price is exogenous.
Annex SF.2 Fiscal policy
simulations
�e impact of corporate and personal income tax changes on U.S. growth was simulated using the Federal Reserve Board’s model for the U.S. economy (FRB/U.S.). Simulations assume full implementation of both corporate and personal income tax cuts at once (i.e., no phasing in). �e lower estimate of the growth impact after eight quarters assumes that monetary policy adjusts following a traditional Taylor Rule. �e upper estimate assumes no monetary policy reaction.
Corporate income tax cut. A cut in the statutory corporate income tax from 35 percent to 15 percent is modelled. �e net loss of corporate tax revenues, caused by a 15 percentage-point reduction in the average eKective marginal tax rate implied by a 20 percentage-point statutory corporate income tax cut (Nunns et al. 2016), could amount to 1.2 percent of GDP in the )rst year. Implicitly, the )scal multiplier—the additional output generated for each additional dollar of tax losses—would be 0.4 in the )rst year, which is within the range of available estimates (Chahrour, Schmitt-Grohé, and Uribe 2012).
Personal income tax changes. A reduction in the average tax rate on personal income by about 2.5 percentage points is modelled (Nunns et al. 2016). �e net loss of personal income tax revenues caused by a 2.5 percentage point reduction in the average eKective marginal tax rate is estimated to be around 1.0 percent of GDP in the )rst year, with a corresponding )scal multiplier of 0.3. �is is at the lower end of the range of estimated )scal multipliers generally associated with personal

SPEC IAL FOCUS GLOBAL ECONOMIC PROSPECTS | JANUARY 2017 75
income tax cuts (0.3-1.5), but within the range of estimated )scal multipliers associated with personal income tax cuts targeted to higher-income households (0.1-0.6; Whalen and Reichling 2015).
Taken together, these corporate and personal income tax reforms could—without consideration of additional policy changes by the new administration—raise U.S. GDP growth forecasts to 2.2-2.5 percent in 2017 and 2.5-2.9 percent in 2018. �ese tax reforms could support stronger near-term growth by boosting households’ real disposable income and companies’ after-tax earnings and pro)t margins. According to the FRB/U.S. model simulations, the largest short-term growth eKect would be associated with the simulated corporate income tax cuts, with investment being boosted by a rise in corporate pro)ts and a reduction in the cost of capital. �e eKect on consumption would be more limited, as household savings are projected to increase following the personal income tax cut.
�e impact would depend on the timing of the implementation of the tax reforms and the monetary policy response. In particular, the upper bound of the range of simulated U.S. growth forecasts assumes that both corporate and personal income tax cuts are fully implemented in the second quarter of 2017, and monetary policy does not react to the change in )scal policy. In a more realistic scenario where monetary policy authorities adjust their policy stance, the growth impact is somewhat reduced, particularly in 2018.
�e lower bound of the range assumes both delayed implementation of the tax cuts to the )rst quarter of 2018 and a tightening of monetary policy in reaction to changes in )scal policy. In the case where monetary policy is allowed to react to a more rapid closing of the output gap, interest rates are estimated to increase by an additional 60 basis points after four quarters, and by up to 100 basis points after eight quarters. �e dollar would also appreciate, while in(ation would remain broadly unchanged. �e revenue loss for the government would increase the budget de)cit by around 2.4 percent of GDP after eight quarters.
References
Abbate, A., S. Eickmeier, W. Lemke, and M. Marcellino. 2016. “The Changing International Transmission of Financial Shocks: Evidence from a Classical Time-Varying FAVAR.” Journal of Money, Credit and Banking 48 (4): 573-601.
Ammer, J., M. De Pooter, C. Erceg, and S. Kamin. 2016. “International Spillovers of Monetary Policy.” Board of Governors of the Federal Reserve System IFDP Notes.
Arteta, C., M. A. Kose, F. Ohnsorge, and M. Stocker. 2015. “The Coming U.S. Interest Rate Tightening Cycle: Smooth Sailing or Stormy Waters?” Policy Research Note 15/02. World Bank, Washington, DC.
Arteta, C., M. A. Kose, M. Stocker, and T. Taskin. 2016. “Negative Interest Rate Policies: Sources and Implications.” Discussion Paper 11433. Centre for Economic Policy Research, London.
Auerbach, A., and Y. Gorodnichenko. 2013. “Fiscal Multipliers in Recession and Expansion.” In Fiscal Policy after the Financial Crisis Working Paper, edited by A. Alesina and F. Giavazzi. Chicago: University of Chicago Press.
________. 2016. “Effects of Fiscal Shocks in a Globalized World.” IMF Economic Review 64: 177–215.
Baffes, J., M. A. Kose, F. Ohnsorge, and M. Stocker. 2016. “The Great Plunge in Oil Prices: Causes, Consequences and Policy Implications.” Policy Research Note 1, World Bank, Washington, DC.
Baker, S., N. Bloom, and S. Davis. 2015. “Measuring Economic Policy Uncertainty.” NBER Working Paper 21633, National Bureau of Economic Research, Cambridge, MA.
Bayoumi, T., and A. Swiston. 2009. “Foreign Entanglements: Estimating the Source and Size of Spillovers Across Industrial Countries.” IMF Staff Papers 56: 353-383.

SPEC IAL FOCUS GLOBAL ECONOMIC PROSPECTS | JANUARY 2017 76
Bems, R., R. C. Johnson, and K. M. Yi. 2010. “Demand Spillovers and the Collapse of Trade in the Global Recession.” IMF Economic Review 58(2): 295-326.
Berkmen, S. P., Gelos, G., Rennhack, R., and Walsh, J. P. 2012. “The Global Financial Crisis: Explaining Cross-Country Differences in the Output Impact.” Journal of International Money and Finance, 31(1): 42-59.
Bivens, J. 2014. “The Short- and Long-Term Impact of Infrastructure Investments on Employment and Economic Activity in the U.S. Economy.” Economic Policy Institute. June 29.
Blanchard, O. 2016. “In Light of the Elections: Recession, Expansion and Inequality.” Peterson Institute for International Economics, Real Time Economic Issues Watch, November 14. https://piie.com/blogs/realtime-economic-issues-watch/light-elections-recession-expansion-and-inequality.
Bloom, N. 2009. “The Impact of Uncertainty Shocks.” Econometrica 77 (3): 623-685.
Borio, C. and H. Zhu. 2012. "Capital Regulation, Risk-Taking and Monetary Policy: A Missing Link in the Transmission Mechanism?" Journal of Financial Stability 8: 236-51.
Bown, C. 2016. “The Truth about Trade Agreements – and Why We Need Them.” VoxEU.org, November 29. http://voxeu.org/article/truth-about-trade-agreements-and-why-we-need-them.
Bowman, D., J. Londono, and H. Sapriza. 2015. "U.S. Unconventional Monetary Policy and Transmission to Emerging Market Economies." Journal of International Money and Finance 55: 27-59.
Brayton, F., T. Laubach, and D. Reifschneider. 2014. “The FRB/U.S. Model: A Tool for Macroeconomic Policy Analysis,” Board of Governors of the Federal Reserve System FEDS Notes.
Bruno, V., and H. Shin. 2015a. “Capital Flows and the Risk-Taking Channel of Monetary
Policy,” Journal of Monetary Economics 71:119-32.
________. 2015b. “Cross-Border Banking and Global Liquidity.” Review of Economic Studies 82 (2), 535-564.
Canzoneri, M. B., R. E. Cumby, and B. Diba. 2003. “New View on the Transatlantic Transmission of Fiscal Policy and Macroeconomic Policy Coordination.” In Monetary and Fiscal Policies in EMU, edited by M. Buti, 283–311. Cambridge: Cambridge University Press.
Cardarelli, R., and M. A. Kose. 2004. “The Economic Impact of U.S. Budget Policies.” in Christopher Towe and Martin Muhleisen ed., U.S. Fiscal Policies and Priorities for Long-Run Sustainability, IMF Occasional Paper No: 227. International Monetary Fund, Washington, DC.
Carrière-Swallow, Y.. and L. F. Céspedes. 2013. “The Impact of Uncertainty Shocks in Emerging Economies." Journal of International Economics 90(2): 316-325.
Cashin, P., K. Mohaddes, and M. Raissi (2012). “The Global Impact of the Systemic Economies and MENA Business Cycles.” Working Paper 12/255, International Monetary Fund, Washington, DC.
Chandy, L., and B. Seidel. 2016. “Donald Trump and the Future of Globalization.” Brookings Institution Up Front, November 18. https://www.brookings.edu/blog/up-front/2016/11/18/donald-trump-and-the-future-of-globalization/.
Chahrour, R., S. Schmitt-Grohé, and M. Uribe. 2012. “A Model-Based Evaluation of the Debate on the Size of the Tax Multiplier.” American Economic Journal: Economic Policy 4 (2): 28–45.
Chellaraj, G., Maskus, K. E. and A. Mattoo. 2008. “The Contribution of International Graduate Students to U.S. Innovation,” Review of International Economics 16 (3): 444–62.
Chow, J., F. Jaumotte, S. Park, and Y. Zhang. 2015. “Spillovers from Dollar Appreciation.” Working Paper No. 15/02, International Monetary Fund, Washington, D.C.

SPEC IAL FOCUS GLOBAL ECONOMIC PROSPECTS | JANUARY 2017 77
Chui, M. K., I. Fender, and V. Sushko, 2014. “Risks Related to EME Corporate Balance Sheets: the Role of Leverage and Currency Mismatch.” BIS Quarterly Review 2014: 35-47.
Claeys, G., and A. Leandro. 2016. “Assessing the Juncker Plan After One Year.” Bruegel, Brussels.
Clausing, K., E. Kleinbard, and T. Matheson. 2016. “U.S. Corporate Income Tax Reform and its Spillovers.” Working Paper 16/127, International Monetary Fund, Washington, DC.
Constancio, V. 2016. “Euro Area: Economic Outlook and Financial Sector Challenges.” Speech, 19th Euro Finance Week Opening Conference, November 14. European Central Bank, Frankfurt. https://www.ecb.europa.eu/press/key/date/2016/html/sp161114.en.html.
Council of Economic Advisors. 2015. Economic Report to the President. Washington, DC: Council of Economic Advisors.
Corsetti, G., A. Meier, and G. J. Müller. 2012. “Fiscal Stimulus with Spending Reversals.” The Review of Economics and Statistics 94 (4): 878–895.
De Grauwe, P., and Y. Ji. 2016. “International Correlation of Business Cycles in a Behavioural Macroeconomic Model.” CEPR Discussion Paper 11257. Centre for Economic Policy and Research, London. www.cepr.org/active/publications/discussion_papers/dp.php?dpno=11257.
De Hoyos, R. E., and L. Iacovone. 2013. “Economic Performance under NAFTA: A Firm-Level Analysis of the Trade-Productivity Linkages.” World Development 44: 180-193.
Dées, S., and A. Saint Guilhem. 2009. “The Role of the United States in the Global Economy and Its Evolution over Time.” Working Paper Series 1034, European Central Bank, Frankfurt.
Dées, S., and I. Vansteenkiste. 2007. “�e Transmission of US Cyclical Developments to the Rest of the World.” Working Paper 798, European Central Bank, Frankfurt.
Desai, M. A., C. F. Foley, and J. R. Hines. 2009. “Domestic Effects of the Foreign Activities of US Multinationals.” American Economic Journal: Economic Policy 1 (1): 181-203.
Devereux, M. B., and S. Shi. 2013. “Vehicle Currency.” International Economic Review 54 (1): 97-133.
Druck, P., N. E. Magud, and R. Mariscal. 2015. "Collateral Damage: Dollar Strength and Emerging Markets’ Growth" Working Paper 15/179, International Monetary Fund, Washington, DC.
Ehrmann, M., and M. Fratzscher. 2009. “Global Financial Transmission of Monetary Policy Shocks.” Oxford Bulletin of Economics and Statistics 71 (6): 739-759.
Ehrmann, M., M. Fratzscher, and R. Rigobon. 2011. “Stocks, Bonds, Money Markets and Exchange Rates: Measuring International Financial Transmission.” Journal of Applied Econometrics 26 (6): 948-974.
Eickmeier, S. 2007. "Business Cycle Transmission from the US to Germany—A Structural Factor Approach." European Economic Review 51 (3): 521-551.
Eldridge, L. P, and M. J. Harper. 2010. “Effects of Imported Intermediate Inputs on Productivity.” Monthly Labor Review 133 (6): 3-15.
Enders, Z., G. J. Müller, and A. Scholl. 2011. “How do Fiscal and Technology Shocks affect Real Exchange Rates? New Evidence for the United States.” Journal of International Economics 83: 53–69.
Erceg, C., L. Guerrieri, and C. Gust. 2006. “SIGMA: A New Open Economy Model for Policy Analysis.” International Finance Discussion Papers 835, Board of Governors of the Federal Reserve System, Washington, DC.
Faccini, R., H. Mumtaz, and P. Surico. 2016. “International Fiscal Spillovers.” Journal of International Economics 99: 31–45.

SPEC IAL FOCUS GLOBAL ECONOMIC PROSPECTS | JANUARY 2017 78
Fischer, S. 2015. “The Transmission of Exchange Rate Changes to Output and Inflation.” Speech, Monetary Policy Implementation and Transmission in the Post-Crisis Period conference, Board of Governors of the Federal Reserve System, November 12, Washington, DC.
Forni, M., and L. Gambetti. 2016. “Government Spending Shocks in Open Economy VARs.” Journal of International Economics 99: 68–84.
Francis, N., M. T. Owyang, and D. Soques. 2015. “Does the United States Lead Foreign Business Cycles?” Federal Reserve Bank of St. Louis Review 97 (2): 133-158.
Frankel, J., and G. Saravelos. 2012. “Can Leading Indicators Assess Country Vulnerability? Evidence from the 2008-09 Global Financial Crisis.” Journal of International Economics 87 (2): 216-231.
Frazer, G., and J. Van Biesebroeck. 2010. “Trade Growth under the African Growth and Opportunity Act.” The Review of Economics and Statistics 92 (1): 128-144.
Georgiadis, G. 2015. “Determinants of Global Spillovers from US Monetary Policy.” Journal of International Money and Finance 67: 41-61.
Glick, R., and S. Leduc. 2013. "The Effects of Unconventional and Conventional U.S. Monetary Policy on the Dollar." Working Paper 2013-11, Federal Reserve Bank of San Francisco.
Goldberg, L. S. and C. Tille. 2008. “Vehicle Currency Use in International Trade.” Journal of International Economics 76 (2): 177-192.
________. 2016. “Micro, Macro, and Strategic Forces in International Trade Invoicing: Synthesis and Novel Patterns.” Journal of International Economics 102: 173-187.
Greenstone M., and A. Looney. 2012. “What Immigration Means For U.S. Employment and Wages.” Brookings Institution, May 4. Washington, DC. https://www.brookings.edu/blog/jobs/2012/05/04/what-immigration-means-for-u-s-employment-and-wages/.
Handley, K. 2014. “Exporting Under Trade Policy Uncertainty: Theory and Evidence.” Journal of International Economics, 94 (1): 50-66.
Handley, K., and N. Limao. 2015. “Trade and investment under policy uncertainty: theory and firm evidence.” American Economic Journal: Economic Policy 7 (4): 189-222.
Helbling, T., R. Huidrom, M. A. Kose, and C. Otrok. 2011. “Do Credit Shocks Matter? A Global Perspective.” European Economic Review 55 (3): 340-353.
Huidrom, R., M. A. Kose, and F. Ohnsorge. 2016. “Challenges of Fiscal Policy in Emerging and Developing Economies.” CEPR Discussion Paper 11347. Centre for Economic Policy and Research, London.
Hunt, J., and M. Gauthier-Loiselle. 2010. “How Much Does Immigration Boost Innovation?” American Economic Journal: Macroeconomics 2 (2): 31–56.
IMF (International Monetary Fund). 2013. “2013 Spillover Report.” International Monetary Fund, Washington, DC.
________. 2014. “2014 Spillover Report.” International Monetary Fund, Washington, DC.
________. 2015a. “2015 Spillover Report.” International Monetary Fund, Washington, DC.
________. 2015b. “Spillovers from Dollar Appreciation.” International Monetary Fund, Washington, DC.
________. 2016. World Economic Outlook: Subdued Demand: Symptoms and Remedies. Washington, DC: International Monetary Fund.
________. 2007. World Economic Outlook: Spillovers and Cycles in the World Economy. Washington, DC: International Monetary Fund.
Jansen, W. J., and A. C. Stokman. 2004. “Foreign Direct Investment and International Business Cycle Comovement.” ECB Working Paper 401, European Central Bank, Frankfurt.

SPEC IAL FOCUS GLOBAL ECONOMIC PROSPECTS | JANUARY 2017 79
Kose, M. A. 2003. “Globalization and Business Cycles in the United States,” United States—Selected Issues, IMF Country Report, No. 03/245, Chapter VIII, 74-80. Washington, DC: International Monetary Fund.
Kose, M. A., Prasad, E. S. and M. E. Terrones. 2004. “Volatility and Comovement in Globalized World Economy: An Exploration,” in Macroeconomic Policies in the World Economy, edited by H. Siebert, 89-122. Berlin-Heidelberg: Springer-Verlag.
Kose, M. A., G. Meredith, and C. Towe. 2005. “How Has NAFTA Affected the Mexican Economy? Review and Evidence.” In Monetary Policy and Macroeconomic Stabilization in Latin America, edited by R. Langhammer and L. de Souza, 35-81. Berlin, Heidelberg: Springer-Verlag.
Kose, M. A., A. Rebucci, and A. Schipke. 2005. “Macroeconomic Implications of CAFTA-DR.” in Markus Rodlauer and Alfred Schipke ed., Central America: Global Integration and Regional Cooperation. IMF Occasional Paper 243, 7-40. International Monetary Fund, Washington, DC.
Kose, M. A., C. Otrok, and C. Whiteman. 2008. “Understanding the Evolution of World Business Cycles.” Journal of International Economics 75 (1): 110–130.
Kose, M. A., and M. E. Terrones. 2015. Collapse and Revival: Understanding Global Recessions and Recoveries. Washington, DC: International Monetary Fund.
Laforte, J. P. and J. Roberts. 2014. “November 2014 Update of the FRB/U.S. Model.”, Board of Governors of the Federal Reserve System FEDS Notes, https://www.federalreserve.gov/econresdata/notes/feds-notes/2014/november-2014-update-of-the-frbus-model-20141121.html.
Lane, P. R., and G. M. Milesi-Ferretti. 2007. "The External Wealth of Nations Mark II: Revised and Extended Estimates of Foreign Assets and Liabilities, 1970–2004." Journal of International Economics 73: 223-250.
Lederman, D., W. F. Maloney, and L. Serven. 2005. Lessons from NAFTA for Latin America and the Caribbean. Palo Alto, CA: Stanford University Press.
Mattoo, A., D. Roy, and A. Subramanian. 2003. “The Africa Growth and Opportunity Act and its Rules of Origin: Generosity Undermined?” The World Economy 26 (6): 829-851.
McCauley, R. N., P. McGuire, and V. Sushko, 2015. “Dollar Credit to Emerging Market Economies.” BIS Quarterly Review 2015: 27-41.
Metiu, N., B. Hilberg, and M. Grill. 2015. “Financial Frictions and Global Spillovers.” Discussion Paper 04/2015, Deutsche Bundesbank, Frankfurt.
McKinsey Global Institute. 2010. “Growth and Competitiveness in the United States: the Role of its Multinational Companies.” McKinsey & Company.
Moran T., and L. Oldenski. 2016. “How Offshoring and Global Supply Chains Enhance the US Economy.” Policy Brief 16-5, Peterson Institute for International Economics, Washington, DC.
Nicar, S. B. 2015. “International Spillovers from U.S. Fiscal Policy Shocks.” Open Economies Review 26 (5): 1081-1097.
Noland, M., G. Hufbauer, S. Robinson, and T. Moran. 2016. “Assessing Trade Agendas in the U.S. Presidential Campaign.” PIIE Briefing 16-6, Peterson Institute of International Economics, Washington, DC.
Neely, C. 2015. "Unconventional Monetary Policy Had Large International Effects." Journal of Banking and Finance 52: 101-111.
Nicar, S. B. 2015. “International Spillovers from U.S. Fiscal Policy Shocks.” Open Economy Review 26: 1081–1097
Nunns, J., L. Burman, B. Page, J. Rohaly, and J. Rose. 2016. “An Analysis of Donald Trump’s Revised Tax Plan.” Tax Policy Center, Washington, DC.

SPEC IAL FOCUS GLOBAL ECONOMIC PROSPECTS | JANUARY 2017 80
Osborn, D., and T. Vehbi. 2013. “Empirical Evidence on Growth Spillovers from China to New Zealand.” Working Paper 13 (17), New Zealand Treasury, Auckland.
Peri, G., 2010. “The Effect of Immigrants on U.S. Employment and Productivity.” FRBSF Economic Letter 26: 1-5.
Ravn, M. O., S. Schmitt-Grohé, and M. Uribe. 2012. “Consumption, Government Spending, and the Real Exchange Rate.” Journal of Monetary Economics 59 (3): 215–234.
Rey, H. 2015. “International Credit Channel and Monetary Policy Autonomy.” Paper prepared for the 15th Jacques Polak IMF Annual Research Conference, International Monetary Fund, Washington, DC.
Roache, S. K. 2008. “Central America’s Regional Trends and U.S. Cycles,” IMF Working Paper 08/50, International Monetary Fund, Washington, DC.
Romalis, J. 2007. “NAFTA’s and CUSFTA’s Impact on International Trade,” The Review of Economics and Statistics 89 (3): 416–435.
Rose, A., and M. Spiegel. 2011. “Cross-Country Causes and Consequences of the Crisis: An Update.” European Economic Review 55 (3): 309–324.
Spence, M. 2016. “Donald Trump and the New Economic Order.” Project Syndicate. November 29.https://www.project-syndicate.org/commentary/nationalist-approach-to-economic-policy-by-michael-spence-2016-11.
Stock, J. H. and M. W. Watson. 2005. “Understanding Changes in International Business Cycle Dynamics.” Journal of the European Economic Association 3 (5): 968-1006.
Sun, Y., and W. Samuel. 2009. “ECCU Business Cycles: Impact of the United States.” Working
Paper 09/71, International Monetary Fund, Washington, DC.
Swiston, A., and M.T. Bayoumi. 2008. “Spillovers across NAFTA.” Working Paper 08/3, International Monetary Fund, Washington, DC.
U.S. Energy Information Administration (EIA). 2016. Short-Term Energy Outlook November 2016. Washington, DC.
United States International Trade Commission. 2011. “The Economic Effects of Significant U.S. Import Restraints. Seventh Update 2011. Special Topic: Global Supply Chains.” Investigation 332-325. Washington, DC.
Whalen, C., and F. Reichling. 2015. “The Fiscal Multiplier and Economic Policy Analysis in the United States.” Working Paper 2015/02, Congressional Budget Office, Washington, DC.
World Bank. 2015a. “Commodity Markets Outlook.” July. World Bank: Washington, DC.
________. 2015b. Having Fiscal Space and Using It: Global Economic Prospects January 2015. Washington, DC: World Bank.
________. 2016a. Spillovers and Weak Growth: Global Economic Prospects January 2016. Washington, DC: World Bank.
________. 2016b. Migration and Remittances: Recent Developments and Outlook. Migration and Development Brief. Washington, DC: World Bank.
________. 2016c. OPEC in Historical Context: Commodity Markets Outlook October 2016. Washington, DC: World Bank.
Yifan, S., and T. Abeysinghe. 2016. International Transmission of Growth Shocks and the World Business Cycle. National University of Singapore, Department of Economics SCAPE Working Paper Series 2016/02.

REGIONAL OUTLOOKS
CHAPTER 2


Recent developments
Growth in the East Asia and Pacific (EAP) region slowed slightly, from 6.5 percent in 2015 to 6.3 percent in 2016, in line with previous expectations (Table 2.1.1). In China, output expanded at a 6.7 percent rate in 2016 (Figure 2.1.1). Output growth in the region excluding China was 4.8 percent, unchanged from 2015, as a modest acceleration in commodity importers was offset by weaker growth in commodity exporters, which continue to adjust to lower commodity prices. Narrowing domestic and external imbalances, and stronger policy buffers amid solid growth, have contributed to improved regional resilience to external headwinds (World Bank 2016a).
China
Growth in China continues to slow gradually, and activity is rebalancing away from industry to services (Zhang 2016). Output expanded by an estimated 6.7 percent in 2016, slightly down from 6.9 percent in 2015. The services sector, which
now constitutes about half of GDP, has overtaken industry as a driver of growth. Industrial production growth has stabilized at around 6 percent year-on-year after several years of sluggish activity due to widespread overcapacity. As overcapacity eased and prices of raw materials began to recover, producer price inflation, which has been negative since 2012, bottomed out.
Accommodative policies continued to support economic activity, including multiple policy interest rate cuts in 2015 that were complemented by fiscal measures since mid-2015. Policy-supported infrastructure investment, has partly offset a decline in private investment (Chapters 1 and 3; Lardy and Huang 2016). Accommodative monetary policy continued to fuel credit growth, led by a rapid expansion of lending to households (around 19.5 percent on average in 2016 compared to 16 percent on average in 2015). Total credit to the non-financial sector (core debt) rose to new highs (255 percent of GDP in the second quarter of 2016) (BIS 2016). Housing prices in major cities also reached new records. In 2016, prices grew on average by 47 percent in Shenzhen, around 30 percent in Hefei, Nanjing, Shanghai, and Xiamen, and 20 percent in Beijing. Prices started to stabilize in Shenzhen since May,
Note: This section was prepared by Ekaterine Vashakmadze with contributions from Hideaki Matsuoka, Jongrim Ha, and Shu Yu. Research assistance was provided by Liwei Liu.
Regional output expanded by an estimated 6.3 percent in 2016, slightly slower than in 2015. Strong domestic spending, supported by generally benign financing conditions, largely offset weak export growth. China continued on the path of gradual deceleration and rebalancing. In the rest of the region, growth remained steady at 4.8 percent, as higher growth in commodity importers offset a slowdown in commodity exporters, which continue to adjust to lower prices. During 2017-19, regional growth is expected to moderate to 6.1 percent, with a gradual slowdown in China partly offset by a pickup in the rest of the region. Downside risks to the outlook increased compared to June. They include heightened policy uncertainty in major advanced economies; financial market disruptions; growth disappointments in major economies; as well as rising protectionist sentiments. Key policy challenges include an orderly rebalancing in China, and strengthening medium-term fiscal policies and macro-prudential frameworks across the region. Structural reforms that support long-term growth are a priority to mitigate the effects of protracted weakness in advanced economies.

CHAPTER 2 .1 GLOBAL ECONOMIC PROSPECTS | JANUARY 2017 84
followed by other major cities since October, reflecting tighter property regulations.
Financial markets have remained stable since February 2016. Capital outflows have eased, but remain sizable (net capital outflows were estimated at around 4 percent of GDP in the second quarter of 2016) (Figure 2.1.2). Foreign reserves continued to fall in 2016 (declining $0.3 trillion during January-November 2016), but at a slower pace than in 2015. The renminbi has depreciated around 7 percent against the U.S. dollar and around 5 in trade-weighted terms during 2016. Notwithstanding these movements, the renminbi remains about 40 percent above the 2005 levels in nominal trade-weighted terms
(about 50 percent above the 2005 levels in real trade-weighted terms).
China’s net foreign asset position remains firmly positive (16.3 percent of GDP at the end of the first quarter of 2016).
Rest of the region
Growth in the rest of the region remained at 4.8 percent—close to its long-term average, as feeble external demand was largely offset by robust domestic demand. Low and declining inflation enabled EAP central banks to ease or maintain accommodative monetary policy stances in 2016 (Figure 2.1.3). Growth picked up in commodity importers, led by Thailand and the Philippines. In the Philippines, growth was boosted by the accelerated implementation of public investment projects and continued strong growth of services exports. In Thailand, activity was further buoyed by improved confidence. Exports of goods provided support to growth in Cambodia, which enjoys sizable foreign direct investment into its garments sector (World Bank 2016b). Severe drought and weak exports weighed on growth in Vietnam.
An acceleration of output in commodity importers was offset by softening activity in commodity exporters (Lao PDR, Malaysia, Myanmar, Mongolia, Papua New Guinea), which continue to adjust to lower commodity prices. In Malaysia, lower revenue from energy exports narrowed the current account surplus and weighed on growth, but resilient domestic demand provided some support. In Myanmar, growth moderated reflecting a correction in the real estate market, an adjustment in the construction sector, and weak external demand. Growth slowdown was sharper in smaller, less diversified commodity exporters (Mongolia and Papua New Guinea), where the adjustment involved a correction of large imbalances. In contrast, Indonesia—the largest commodity-exporting country in the region—has adjusted rapidly to lower commodity prices. Furthermore, accommodating monetary policy helped lift domestic demand, contributing to a modest rise in Indonesian growth to 5.1 percent in 2016.
FIGURE 2.1.1 Growth
Growth slowed to 6.3 percent in 2016 and is expected to edge down to 6.1
percent in 2017-19. This reflects the gradual slowdown in China and a
modest pickup in the rest of the region. Strong domestic demand—helped
by low inflation, easier financing conditions, and robust FDI flows—has
largely offset weak export growth.
B. GDP components A. GDP growth and contributions
D. FDI C. Exports of goods and services
Sources: Haver Analytics; International Monetary Fund; United Nations Conference on Trade and
Development; World Development Indicators, World Bank.
A. Commodity exporters include Indonesia, Malaysia, Mongolia, Myanmar, Papua New Guinea,
Tonga, and Timor-Leste. Commodity importers include Cambodia, the Philippines, Samoa, the
Solomon Islands, Thailand, Tuvalu, Vanuatu, and Vietnam. 1990-08 and 2003-08 show average
GDP growth.
B. Commodity exporters include Indonesia, Lao, PDR, and Malaysia. Commodity importers include
Cambodia, Philippines, Solomon Islands, Thailand, and Vietnam.
C. For Vietnam and China, 2016 data are exports of goods.
D. FDI inflows. Weighted average.
-5
-1
3
7
11
201
1-1
2
201
3-1
4
20
15
20
16f
201
1-1
2
201
3-1
4
20
15
20
16f
201
1-1
2
201
3-1
4
20
15
20
16f
Consumption InvestmentExports Imports1990-08 2003-08
Percent
China Commodity importers (ex. China)
Commodity exporters
0
4
8
12
Con
sum
ption
Investm
ent
Con
sum
ption
Investm
ent
Con
sum
ption
Investm
ent
2010-14 2015 2016f
1990-08 2003-08
Percent
China Commodity exporters
Commodity importers (ex. China)
-6
-1
4
9
14
19
Ch
ina
Vie
tnam
Thaila
nd
Phili
pp
ines
Ind
on
esia
Mala
ysia
1990-08 2010-13 2014-15
2016Q1 2016Q2 2016Q3
Percent
Commodity exporters
Commodity importers
0
1
2
3
4
Commodity importers(ex. China)
Commodity exporters
2011 2012 2013 20142015 1990-08 2003-08
Percent of GDP

EAST AS IA AND PAC IF IC GLOBAL ECONOMIC PROSPECTS | JANUARY 2017 85
Following a period of stability since February 2016, financial markets experienced renewed volatility toward the end of the year amid heightened policy uncertainty in the United States and market reaction to the U.S. federal funds rate hike in December. Net capital inflows, which had resumed in 2016 reflecting accommodative monetary policies in advanced economies, eased towards the end of the year (Figure 2.1.4). In contrast to global trends, FDI to the EAP region remained buoyant, especially to Cambodia, Indonesia, Lao PDR, Malaysia, Myanmar, Thailand, and Vietnam. Economic liberalization, regional integration, including through Association of Southeast Asian Nations (ASEAN) Economic Community (AEC), and a return of domestic political stability were among the reasons for the resilience of FDI to the EAP region (Uttama 2016). Chinese investors continue to be heavily involved in various projects across the region and Japan remains another important source of FDI flows to several regional economies.
Corporate and sovereign risk spreads, which rose across the region in late 2015 and early 2016, have generally narrowed (IMF 2016a). Regional currencies have remained broadly stable against the U.S. dollar for most of 2016, with the exception of the Mongolian tugrik. However, they came under renewed pressure in the last quarter of the year, especially in Malaysia, reflecting heightened global volatility and prompting authorities to introduce additional measures to enhance liquidity in the foreign exchange market.
Vulnerabilities
In China, the continued rapid expansion of credit to state-owned enterprises and households has increased macroeconomic risks (Arslanalp and Tsuda 2014, World Bank 2016a; Figure 2.1.5). Policy tightening in Indonesia (until 2015) and tighter macro-prudential regulations in Malaysia and Thailand have helped contain financial stability risks (BIS 2016; IMF 2015a,b). However, household balance sheets in Malaysia and Thailand remain vulnerable due to elevated borrowing before the 2013 taper tantrum. Sizable external financing requirements remain a source of vulnerability in Indonesia, while shallow policy
buffers are a concern in smaller countries (Mongolia, Papua New Guinea, especially, and to some extent in Lao PDR and Vietnam). In the Philippines and Vietnam, credit continues to grow rapidly, although the stock of debt remains at moderate levels.
Outlook
The baseline forecast envisages an easing in growth to 6.1 percent on average in 2017-19, in line with June projections. This involves a gradual slowdown in China, which offsets a pickup of activity in the rest of the region. Growth in the region excluding China is projected to accelerate from 4.8 percent in 2016 to 5.2 percent on average in 2018-19. This largely reflects a
FIGURE 2.1.2 China: Activity, exchange rates, and
external accounts
Growth in China continues to gradually slow and rebalance. The services
sector, which now constitutes about half of GDP, has overtaken industry as
a driver of growth. Producer price inflation bottomed out, as adjustment in
overcapacity sectors eased and prices of raw materials leveled off.
Financial markets have stabilized. Net capital outflows have eased after a
20 percent drawdown of foreign reserves from the August 2014 peak.
Pressures on the renminbi also eased.
B. Consumer and producer price
indexes A. Real GDP growth
D. Balance of payments C. Nominal and real effective
exchange rates
Sources: Bloomberg, Haver Analytics, International Monetary Fund, World Bank.
D. e = estimate.
0
2
4
6
8
10
12
14
201
0
201
1
201
2
201
3
201
4
201
5
Q1 2
01
6
Q2 2
01
6
Q3 2
01
6
Industry and construction
Services
GDP
Percent, year-on-year
-8
-6
-4
-2
0
2
4
6
8
10
Feb-1
0
No
v-1
0
Aug-1
1
Ma
y-1
2
Feb-1
3
No
v-1
3
Aug-1
4
Ma
y-1
5
Feb-1
6
No
v-1
6
Consumer price indexProduction price index
Percent, year-on-year
-2
-1
0
1
2
3
80
90
100
110
120
130
Q3
2012
Q1
2013
Q3
2013
Q1
2014
Q3
2014
Q1
2015
Q3
2015
Q1
2016
Q3
2016
Onshore vs offshore rate spread (RHS)Nominal vs. USDREER CPI based
Index. Jan. 2010=100 Percent
-8
-6
-4
-2
0
2
4
6
201
1
201
2
201
3
201
4
201
5
Q1 2
01
6
Q2 2
01
6
Q3
20
16
e
Current accountNet capital flowsChange in reserves
Percent of GDP

CHAPTER 2 .1 GLOBAL ECONOMIC PROSPECTS | JANUARY 2017 86
Commodity exporters
Growth in commodity-exporting economies is projected to recover from 4.9 percent in 2016 to its long-term average of 5.3 percent in 2018, as they make progress in adjusting to the lower commodity price environment. In Indonesia, growth is expected to accelerate from 5.1 percent in 2016 to 5.4 percent on average in 2017-19, helped by a pickup in private investment (World Bank 2016c). In Malaysia, growth is projected to recover to 4.5 percent in 2017-19 as adjustment to lower energy prices eases and commodity prices stabilize (World Bank 2016d). In Myanmar, growth is projected at 7 percent on average in 2017-18, helped by a pickup in foreign and domestic private investment. In Lao PDR, growth is expected to remain around 7 percent, supported by investment in the power sector and growing regional integration (Table 2.1.2).
The growth outlook has deteriorated markedly in several small commodity exporters of the region, where the terms-of-trade shock has exacerbated domestic vulnerabilities (Mongolia, Papua New Guinea). Part of the slowdown in Papua New Guinea was related to Liquefied Natural Gas (LNG) output reaching capacity in 2015-16. In Timor-Leste, growth in the non-oil economy is expected to rebound to between 5 and 6 percent in the medium term, led a recovery of public investment.
Commodity importers
Growth in commodity-importing economies is projected to remain at around 5.0 percent on average in 2018-2019, in line with the long-term average. Helped by improved confidence and accommodative policies, growth in Thailand is projected to rise toward its trend rate of about 3.4 percent. Among the large commodity importers, Vietnam and the Philippines continue to have the strongest growth prospects, al- though capacity constraints will likely limit acceleration in the medium term and could cause overheating pressures. In the Philippines, growth is projected to accelerate to 6.8 percent on average in 2017-19, supported by ongoing infrastructure projects, strong consumption, buoyant inflows of
recovery of growth in commodity exporters to its long-term average rate. Growth in commodity importers excluding China is projected to remain broadly stable.
China
In China, growth is projected to continue its orderly slowdown from 6.7 percent in 2016 to 6.4 percent in 2017-19. Macroeconomic policies are expected to support key domestic drivers of growth despite the softness of external demand, weak private investment, and overcapacity in some sectors. The pace of rebalancing from investment to consumption, and from industry to services is expected to moderate. This outlook depends on the smooth progress of structural reforms, including progress in reducing financial excesses.
FIGURE 2.1.3 EAP region: Selected indicators
Since the taper tantrum of mid-2013, policy tightening in Indonesia (until
2015), and tighter macro-prudential regulations in the rest of the region,
have helped to reduce, but did not eliminate vulnerabilities. Credit growth
has moderated across the region (except in China, the Philippines and
Vietnam). In combination with low inflation, this enabled EAP central banks
to ease or maintain an accommodative monetary policy stance in 2016.
Low and declining inflation has helped to lower bond yields, but they
remain relatively elevated in Indonesia and Vietnam by comparison to other
regional EMDEs.
B. Credit growth A. Policy rates
D. Ten-year sovereign bond yields C. Inflation
Sources: Haver Analytics, International Monetary Fund, World Bank.
A. Policy rates are average of end-of-period data.
B. Average year-on-year growth from January to September for 2016. Data for Vietnam in 2016 are
through August and China through October.
D. Last observation is December, 2016.
0
4
8
12
16
Vie
tna
m
Chin
a
Ph
ilip
pin
es
Th
aila
nd
Mo
ngo
lia
Ind
one
sia
Mala
ysia
2011-12 2013-15 Q1 2016Q2 2016 Q3 2016
Percent
Commodityimporters
Commodityexporters
0
5
10
15
20
25
Th
aila
nd
Chin
a
Phili
pp
ine
s
Vie
tnam
Ind
one
sia
Mala
ysia
2011 2012 20132014 2015 2016
Percent
Commodityimporters
Commodityexporters
0
2
4
6
8
10
Chin
a
EA
P (
ex.
Ch
ina)
Com
mo
dity
imp
ort
ers
(e
x.
Chin
a)
Com
mo
dity
expo
rters
2011 2012-14 20152016 2003-08
Percent
0
3
6
9
12
Vie
tnam
Phili
pp
ines
Thaila
nd
Chin
a
Ind
one
sia
Mala
ysia
2016 Latest 2003-082008-10 2011-15
Percent
Commodityexporters
Commodityimporters

EAST AS IA AND PAC IF IC GLOBAL ECONOMIC PROSPECTS | JANUARY 2017 87
remittances, and strong revenue from services exports. In Vietnam, output is expected to expand at an average of 6.3 percent in 2017-19, with all categories of demand buoyed by strong FDI and manufacturing exports. Growth prospects are also strong in Cambodia. Growth will ease only slightly, and will remain around 6.9 percent in 2016–18, supported by strong garment exports, and real estate and construction activities.
The outlook for the small Pacific Island countries depends on the development of regional fisheries and growth in tourism. They remain vulnerable to risks arising from natural disasters, climate change, terms-of-trade shocks, and sharp declines in FDI.
Risks
Risks to the baseline forecast have tilted further to the downside since June. They include heightened policy uncertainty in the United States and Europe amid mounting protectionist pressures, financial market disruptions, and growth disappointments in major economies.
Policy uncertainty, either domestic or in major advanced economies, tends to raise risk premiums and depress investment and activity (Chapters 1 and 3). According to estimates, a one standard deviation shock to an index of domestic political risks, which is a low probability risk in the EAP region, reduces emerging market and developing economy (EMDE) investment growth by about 2 percentage points within a year (Chapter 3, Box 2). A similar shock to uncertainty in major advanced economies could roil financial markets (Figure 2.1.6). Furthermore, should the uncertainty in major economies materialize into an actual slowdown in activity, the outlook for EAP growth would weaken as trade declines and financial flows slow.
In addition to heightened policy uncertainty in key major advanced economies, protectionist pressures have mounted globally, contributing to a post-crisis high in new trade restrictions in 2016. Rising protectionist sentiments creates uncertainty about the future of well-established trading relationships, thereby adding risks to the regional outlook. Even within the parameters of current
international safeguards, WTO members could legally triple import tariffs (Chapter 1). These welfare losses would disproportionately affect the more open economies in the EAP region, which relies on trade as a key engine for growth.
An unexpected deceleration in major economies, especially in the Unites States or weaker-than-expected global trade would dampen growth in the region (Figure 2.1.7). A faster-than-expected slowdown in China would also have sizable regional spillovers (Dizioli et al. 2016; Zhai and Morgan 2016; World Bank 2016b). A one-time, 1-percentage-point unexpected decline in China's growth rate reduces growth by around 0.4 percentage point after two years in Indonesia, Malaysia, and Thailand. The magnitude of
FIGURE 2.1.4 EAP region: Selected indicators (cont’d)
Unlike Thailand, current account surpluses narrowed in Malaysia and the
Philippines, while tight policies until 2015 helped to reduce current account
deficit in Indonesia. Financial market conditions have been stable in the
second and third quarters of 2016 and have been accompanied by net
capital inflows to the region. Regional currencies, except the Mongolian
tugrik, as well as equity and bond markets have recovered before renewed
market volatility in late 2016, which was related to heightened policy
uncertainty in the advanced economies.
B. Current account balances, capital
flows and change in reserves A. Current account balances
D. Stock markets C. Currency changes against the U.S.
dollar
Sources: Bloomberg, Haver Analytics, International Monetary Fund, World Bank staff estimates.
B. Sample includes Indonesia, Malaysia, Thailand, and Philippines; e = estimate.
C. Positive values indicate depreciation.
D. Percent change. 2016 data are through November.
-6
-1
4
9
14
Thaila
nd
Chin
a
Phili
ppin
es
Vie
tnam
Mala
ysia
Indonesia
2012 2013-152016Q1-Q3 1990-082003-08
Percent of GDP
Commodityimporters
Commodityexporters
-3
-2
-1
0
1
2
3
4
20
11
20
12
20
13
20
14
20
15
Q1
20
16
Q2
20
16
Q3 2
01
6e
Current account Net capital flows
Percent of GDP
-10
0
10
20
30
40
Phili
ppin
es
Ch
ina
Tha
ilan
d
Vie
tna
m
So
lom
on
Isla
nd
s
Mon
go
lia
Ma
lays
ia
Indo
nesia
Jan 2015-Dec 2016Jan 2016-Aug 2016Aug 2016-Dec 2016
Percent
Commodityexporters
Commodityimporters
-20
-10
0
10
20
30
Phili
pp
ine
s
Ch
ina
Th
aila
nd
Vie
tnam
Mala
ysia
Ind
on
esia
Jan 2015-Dec 2016Jan 2016-Aug 2016Aug 2016-Dec 2016
Percent
Commodity exporters
Commodity importers

CHAPTER 2 .1 GLOBAL ECONOMIC PROSPECTS | JANUARY 2017 88
similar to the episodes in August 2015 and January-February 2016 when capital inflows to the EAP region fell. Abrupt deterioration of financing conditions would lead to higher debt-service burdens and increased debt-rollover risks. The large, financially integrated economies in the region with sizable external, foreign-currency-denominated, and/or short-term debt—such as Malaysia and, to a lesser degree, Thailand—would be most exposed. There is a risk of financial stress among corporates and households, which could spill over to the banking sector.
Policy challenges
Robust growth has lifted regional GDP well above its pre-crisis level, and China has made progress in rebalancing. However, heightened policy uncertainty, including trade openness in major advanced economies amid rising protectionist sentiments, would limit the ability of global demand to continue supporting medium- and long-term regional growth. Other growth limiting factors are regional in nature and include a continued slowdown in China, worsening demographics in major EMDEs in the region (China, Malaysia, Thailand), and sizable vulnerabilities in some countries.
Against this backdrop, the region faces three main challenges: completing China’s transition to a slower but more sustainable and balanced growth path; addressing fiscal and financial imbalances across the region to further boost its resilience in the face of heightened global uncertainty; and implementing structural reform that help in overcoming concerns about aging populations, weak external demand, and rising protectionist sentiments.
China’s transition
To complete rebalancing, China would need to advance reforms in the corporate sector, bring credit growth to more sustainable levels, and strengthen its intergovernmental fiscal system. The process of eliminating excess industrial capacity could be accelerated and deepened (IMF 2016c). To facilitate a reallocation of factors of production toward more productive sectors, and away from
spillovers from China would be more pronounced if growth shocks are amplified by deteriorated confidence (Arslanalp et al. 2016; IMF 2016b, World Bank 2016e).
Finally, the baseline forecast is sensitive to a faster-than-expected monetary policy shift in the United States and to changes in global risk aversion. The latter could trigger financial volatility, perhaps
FIGURE 2.1.5 Vulnerabilities
In China, a sharp increase in house prices, particularly in first-tier cities,
raised financial stability concerns. Foreign currency reserves are generally
adequate but, in a few cases, foreign indebtedness is high. Stocks of
outstanding domestic debt remain elevated in China, Malaysia, and
Thailand.
B. Total debt and real GDP growth in
China
A. Housing prices in China
D. Total debt C. Fiscal balances
Sources: Bank of International Settlements, Haver Analytics, International Monetary Fund, Quarterly
External Debt Statistics, World Bank.
C.E. MYS = Malaysia, PHL = Philippines, THA = Thailand, KHM = Cambodia, LAO = Lao, PDR, VNM
= Vietnam, IDN = Indonesia, CHN = China, MNG = Mongolia.
D. Peak data for China is in 2016, Malaysia in 2015, Thailand in 1997, and Indonesia in 2001.
E. For Malaysia, short-term debt data is for 2015Q4, 2016Q2 data is not available.
F. The data are from 2016. External financing needs for Mongolia is 391.4.
F. External financing needs E. External debt
-10
0
10
20
30
40
Mar-
12
Ju
l-12
Nov-1
2
Mar-
13
Ju
l-13
Nov-1
3
Mar-
14
Ju
l-14
Nov-1
4
Mar-
15
Ju
l-15
Nov-1
5
Mar-
16
Ju
l-16
Nov-1
6
1st tier1st tier (excl. Shenzhen)2nd tier3rd tier
Percent, year-on-year
Dash line: 2011-16 average
-20
-16
-12
-8
-4
0
MY
S
PH
L
TH
A
KH
M
LA
O
VN
M
IDN
CH
N
MN
G
2009 2015 2016Percent of GDP
Improvement Deterioration
0
40
80
120
160
200
240
280
20
07
20
15
201
6Q
2
20
07
20
15
201
6Q
2
20
07
20
15
201
6Q
2
20
07
20
15
201
6Q
2
China Malaysia Thailand Indonesia
Public debtHousehold debtCorporation debtPeak
Percent of GDP
6
8
10
12
14
16
0
50
100
150
200
250
30020
06
20
07
20
08
20
09
20
10
20
11
20
12
20
13
20
14
20
15
20
16
f
Debt GDP growth (RHS)
Percent of GDP Percent, year-on-year
0
25
50
75
100
Mo
ng
olia
Mala
ysia
Ind
one
sia
Ca
mb
od
ia
Vie
tnam
Ph
ilippin
es
Chin
a
Th
aila
nd
Lao
, P
DR
Percent of FX reserves
Percent of GDP
Percent391.4
010203040506070
0
15
30
45
60
75
20
12
201
6Q
2
20
12
201
6Q
2
20
12
201
6Q
2
20
12
201
6Q
2
20
12
201
6Q
2
MYS IDN THA PHL CHN
External debtShort-term debt (RHS)
Percent of GDP Percent of total

EAST AS IA AND PAC IF IC GLOBAL ECONOMIC PROSPECTS | JANUARY 2017 89
For commodity producers (Indonesia, Malaysia, Mongolia, Papua New Guinea), the new era of lower commodity prices underscores the need to enhance fiscal frameworks and improve the operations of institutions that manage commodity price volatility, such as sovereign wealth funds. Reforms to state-owned enterprises—for example, measures that enhance transparency and governance—could reduce pressure on fiscal resources (Thailand, Vietnam). In the Philippines
stagnating sectors with excess capacity, authorities should reduce administrative controls in the financial sector, in favor of a more market-based allocation of capital. Reducing high leverage requires enhanced macro-prudential regulations. Short-term counter-cyclical fiscal measures may be appropriate, but they need to be undertaken within a medium-term fiscal consolidation framework. As the economy rebalances, lower public investment at the subnational level could make it easier for local governments to manage debt, including contingent liabilities from off-budget activities (Jin and Rial 2016). Institutional reforms—such as better corporate governance, enhanced auditing and accounting standards, and stronger regulatory frameworks—are also needed. The reforms of state-owned enterprises (SOEs) could be accelerated over time: sectors dominated by SOEs would benefit from opening up (Leutert 2016); their traditional privileges could be eliminated to ensure a level playing field; and inefficient SOEs could be closed in an orderly way.
Addressing imbalances
EAP countries face a variety of fiscal challenges. Medium-term fiscal consolidation is needed to rebuild the policy buffers in a majority of countries (Indonesia, Lao PDR, Malaysia, Mongolia, Papua New Guinea, Vietnam). This can be achieved through improved revenue mobilization (Cambodia, Indonesia, Lao PDR, the Philippines), reduced dependence on revenue from energy sectors (Malaysia, Mongolia, Papua New Guinea), and improved public expenditure efficiency (Indonesia, Lao PDR, Vietnam).
A rebalancing of public expenditures and greater public-private cooperation will help address infrastructure deficits (Box 2.1.1). For infrastructure investment to be productive, reforms are needed to make the public sector more effective. These include developing and implementing rigorous, transparent, and accountable processes for project selection, appraisal, procurement, and evaluation, as well as improved processes for operating and maintaining assets. Better fiscal institutions would provide a firm basis for such reforms (IMF 2016b).
FIGURE 2.1.6 Risk of uncertainty in major advanced
economies
Risks to the baseline forecast have tilted further to the downside since
June reflecting heightened policy uncertainty in the United States and
Europe. A confidence shock in major advanced economies, still the main
trading partners for many EAP countries, could further dent regional
investment growth, which is already below the long-term average.
B. Trade and financial exposures to
major advanced economies, 2010-15
average
A. Share of major economies in world
economy, 2010-15
D. Impact of 10 percent increase in
VIX on EMDE investment growth
C. Largest trade and financial
exposures to major advanced
economies, 2010-15
Sources: Bank for International Settlements, Haver Analytics, International Monetary Fund, World
Bank.
A. Trade (A) includes both exports and imports. Exports (B) includes goods exports only. Foreign
claims refer to total claims of BIS-reporting banks on foreign banks and nonbanks. Stock market
capitalization is the market value of all publicly-traded shares. “U.S.” stands for United States; “EU”
stands for European Union. FDI data only available to 2014.
C. Goods exports to the United States/European Union, remittances from the United States/European
Union, and FDI from the United States/European Union (all in percent of GDP). Chart shows only the
countries with the largest exposures to the United States and European Union. For exposures to
remittances, some countries such as Samoa and Tonga also have the highest remittance to GDP
ratios worldwide. FDI data are FDI stock.
D. Cumulative responses of EMDE investment to a 10 percent increase in the VIX. Solid lines
indicate the median responses and the dotted lines indicate 16-84 percent confidence intervals.
Vector autoregressions are estimated for the sample for 1998Q1-2016Q2. The model includes, in this
order, the VIX, MSCI Emerging Markets Index (MXEM), J.P.Morgan Emerging Markets Bond Index
(EMBIG), aggregate real output and investment growth in 18 EMDEs with G7 real GDP growth, U.S.
10-year bond yields, and MSCI World Index as exogenous regressors and estimated with two lags.
0
20
40
60
80
100
GDP(market
exchangerates)
GDP(PPP)
Trade Foreignclaims
Stockmarket
capitalization
U.S. China EU Japan OtherPercent of total
0
20
40
60
80
100
Exports InwardFDI
Remittanceinflows
Portfolioliabilities
Foreignclaims
U.S. China EU Japan OtherPercent of total
0
10
20
30
Cam
bo
dia
Vie
tna
mM
ala
ysia
Tha
ilan
dC
hin
a
Ma
lays
iaT
ha
ilan
dP
hili
ppin
es
Indo
ne
sia
Vie
tna
m
Vie
tna
mP
hili
ppin
es
Fiji
Cam
bo
dia
Tha
ilan
dExports FDI Remittances
European Union
United States
Percent of GDP
-2.0
-1.5
-1.0
-0.5
0.0
1 2 3 4 5 6 7 8
Quarter
Percentage points

CHAPTER 2 .1 GLOBAL ECONOMIC PROSPECTS | JANUARY 2017 90
and Thailand, where an expansionary fiscal stance could be appropriate in the short-term, policies should also be framed in the overall context of a sustainable medium-term fiscal framework.
Addressing financial imbalances and reducing financial vulnerabilities, including those of households and corporates, requires strengthened macro-prudential frameworks (IMF 2015c; World Bank 2016a). This will help mitigate the risks in the event of market turmoil (IMF 2016d; World Bank 2016a-c). Improved regulatory oversight and supervision is needed for the nonbank financial sector (Cambodia, the Philippines, Malaysia, Thailand). Banking sector reforms rank high for improving efficiency and the allocation of capital
in Cambodia, Lao PDR, Mongolia, and Vietnam. In several countries, including the Philippines, Cambodia, Thailand, and Vietnam, there is significant scope to strengthen regulatory oversight and micro-prudential risk management (Abino et al. 2014, IMF 2016 d-g, Ly 2016, World Bank 2016a,b).
Structural reforms
Rising international trade has been an important driver of growth in EAP region. The region took full advantage of globalization, opening up its economies to trade and foreign direct investment, and exploiting competitive advantages in the manufacturing sector. However, protracted weakness in advanced economies, stalling tra- de liberalization, and an increased risk of protectionism are dimming prospects for the long-run expansion of trade. In China and several other major economies, additional limitation to long-term growth stem from aging populations, slower labor force growth, and slower pro-ductivity growth. These factors highlight the importance of policies that boost domestic sources of long-term growth.
The region has plenty of potential for decades of rapid urban development (World Bank 2015a). Although more than 400 million people moved to cities between 2000 and 2015, the share of people living in urban centers in the EAP region remains at 54 percent in 2015 (49 percent excluding China), and remains well below the advance economy average (80.3 percent) in the majority of the regional economies (Figure 2.1.8).1 China’s current urbanization rate is 55.6 percent, with only 23.7 percent of China’s population in urban agglomerations compared to 45.3 percent in the United States. An increased urban share of the population can lift GDP per capita and support convergence of the region with advanced economies.2 Mutually supporting measures that encourage private sector investment and public investment in infrastructure and social services can
1The fastest annual rates of urban expansion were in Cambodia, followed by China and Vietnam. 2There is a direct link between urbanization and income growth (World Bank 2015a).
FIGURE 2.1.7 Spillovers from the United States and the
Euro Area
A slowdown in U.S. or Euro Area output growth would reduce output
growth in EMDEs considerably. EMDE investment would respond more
strongly, possibly reflecting investor concerns about long-term growth
prospects.
B. Output growth: Impact of 1
percentage point slowdown in Euro
Area output growth on EMDEs
A. Output growth: Impact of 1
percentage point slowdown in U.S.
output growth on EMDEs
D. Investment growth: Impact of 1
percentage point slowdown in Euro
Area output growth on EMDEs
C. Investment growth: Impact of 1
percentage point slowdown in U.S.
output growth on EMDEs
Sources: Haver Analytics, International Monetary Fund, World Bank.
Notes: Cumulative impulse response of weighted average EMDEs’ output growth (A.B.) or investment
growth (C.D.) at 1-8 quarter horizons to a 1 percentage point decline in growth in real GDP in the
United States (A.C.) and Euro Area (B.D.). Growth spillovers based on a Bayesian vector
autoregression of world GDP (excluding the source country of spillovers), output growth in the source
country of the shock, the U.S. 10-year sovereign bond yield pulse JP Morgan’s EMBI index,
investment (C.D.) or output (A.B.) in EMDEs excluding China and oil price as an exogenous variable.
Solid lines indicate the median responses and the dotted lines indicate 16-84 percent confidence
intervals.
-2.0
-1.5
-1.0
-0.5
0.0
1 2 3 4 5 6 7 8
Percentage points
Quarter
-2.5
-2.0
-1.5
-1.0
-0.5
0.0
0.5
1 2 3 4 5 6 7 8
Percentage points
Quarter
-5
-4
-3
-2
-1
0
1
1 2 3 4 5 6 7 8
Percentage points
Quarter
-6
-5
-4
-3
-2
-1
0
1
1 2 3 4 5 6 7 8
Percentage points
Quarter

EAST AS IA AND PAC IF IC GLOBAL ECONOMIC PROSPECTS | JANUARY 2017 91
facilitate inclusive and sustainable urban growth. National urbanization strategies could lead to more livable environments in high-density urban areas, making land more accessible and on a fair and transparent basis. Governments can encourage facilities that deal with the needs of recent migrants. Well-coordinated urban services across municipal boundaries would reduce metropolitan fragmentation (ADB 2016; Creehan 2015; Bryson and Nelson 2016; World Bank and Development Research Center of the State Council, China 2014). With the large share of the workforce in the region still engaged in agriculture, future gains from structural transformation could be substantial. At the same time, continued reforms in the sector are needed to create opportunities for the rural population both within and outside farming.
Complementary reform priorities include improvements in the business climate and reductions in the cost of Doing Business (Cambodia, Lao PDR, Myanmar, Papua New Guinea, Timor-Leste, and the small Pacific Islands; ADB 2016). Cambodia, Lao PDR, Myanmar, Papua New Guinea, and the Solomon Islands rank particularly low on the 2015 Corruption Perception Index reported by Transparency International and other governance indicators. Enhanced transparency, strengthened accountability, and more responsiveness of state institutions to the needs of the private sector would bolster investor confidence. High-quality education would raise labor-force skills, and promote productivity growth. Reforms that reduce barriers to females in the workplace are an effective way to increase participation rates and productivity.
Lower non-tariff barriers would further expand global and regional trade and improve the international allocation of investment, thereby boosting productivity and competitiveness. In particular, barriers to services trade remain elevated for many countries of the region (Indonesia, Malaysia, the Philippines, Thailand). Restrictions on foreign control and ownership, discretionary licensing, and limits on the operations of foreign companies have significant negative impacts on the delivery of services across
FIGURE 2.1.8 Policy challenges
The region retains significant potential for convergence-driven growth. The
share of people living in urban centers in the EAP region is well below the
advanced economy average. China’s current urbanization rate is 55.6
percent, with only 23.7 percent of China’s population in urban
agglomerations compared to 36.1 percent in OECD country average.
Across the region, there is room to improve business environments and
institutions.
B. Population in urban settlements of
more than 1 million inhabitants A. Urbanization rate
D. Ease of doing business, China C. Ease of doing business, EAP
Sources: World Development Indicators, World Bank; Doing Business 2017, World Bank.
C.D. The distance to frontier score helps assess the absolute level of regulatory performance over
time. An economy’s distance to frontier is reflected on a scale from 0 to 100, where 0 represents the
lowest performance and 100 represents the frontier.
C. For Thailand, the score in 2017 declined so the improvement data is not showed.
D. Business means Starting a business, Contracts means Enforcing contracts, Property means
Registering property, Trading means Trading across borders, Electricity means Getting electricity,
Taxes means Paying taxes, Credit means Getting credit, Insolvency means Resolving insolvency,
Construction permits means Dealing with construction permits and Minority investors means
Protecting minority investors.
0
20
40
60
80
100
Ma
lays
ia
Mon
go
lia
Ch
ina
Indo
ne
sia
Tha
ilan
d
Phili
ppin
es
Lao
, P
DR
Mya
nm
ar
Vie
tna
m
Tong
a
Cam
bo
dia
2000 2010 2015 OECDPercent
0
1
2
3
4
0
10
20
30
40
50
Chin
a
Mala
ysia
Th
aila
nd
Ph
ilippin
es
Vie
tnam
Ca
mb
od
ia
Ind
one
sia
2000 20102015 OECDU.S. 2000-15 growth (RHS)
Percent Percent
40
50
60
70
80
90
100
Busin
ess
Co
ntr
acts
Pro
pert
y
Tra
din
g
Ele
ctr
icity
Taxes
Cre
dit
Insolv
en
cy
2015 20172015 Overall 2017 Overall
Score
Min
ori
ty
inve
sto
rs
Con
str
uction
perm
its
0
2
4
6
8
10
0
20
40
60
80
100M
ala
ysia
Tha
ilan
d
Ch
ina
Vie
tna
m
Indo
ne
sia
Ph
ilip
pin
es
2010 2017 Improvement (RHS)
Score Score
borders. In addition, foreign entry restrictions in some EAP countries are prohibitive for many professional services such as legal, accounting, or engineering.
Regional partnerships and trade agreements, including the ASEAN economic community and the proposed Regional Comprehensive Economic Partnerships, will help stimulate structural reforms and promote stable income growth. These partnerships can also help the region to mitigate the impact of rising protectionism, resist pressures for protectionist measures, and boost the region’s resilience, as it did during both the Asian financial crisis in 1997 and global financial crisis in 2008-09.

CHAPTER 2 .1 GLOBAL ECONOMIC PROSPECTS | JANUARY 2017 92
2014 2015 2016 2017 2018 2019 2015 2016 2017 2018
Estimates Projections (percentage point difference
from June 2016 projections)
EMDE EAP, GDPa
6.7 6.5 6.3 6.2 6.1 6.1 0.0 0.0 0.0 0.0
(Average including countries with full national accounts and balance of payments data only)b
EMDE EAP, GDPb 6.7 6.5 6.3 6.2 6.1 6.1 0.0 0.0 0.1 0.0
GDP per capita (U.S. dollars) 6.0 5.7 5.7 5.5 5.5 5.5 0.0 0.1 0.0 0.0
PPP GDP 6.6 6.4 6.3 6.1 6.1 6.1 0.0 0.0 0.0 0.0
Private consumption 7.9 7.1 6.9 7.0 7.0 7.0 0.1 0.0 0.0 0.0
Public consumption 3.0 6.3 6.1 5.9 5.8 5.8 -0.1 0.0 0.0 0.0
Fixed investment 6.7 6.6 6.4 6.2 5.7 5.7 0.0 0.0 -0.1 0.0
Exports, GNFSc 5.2 2.6 3.3 4.3 4.8 4.8 0.1 -0.1 0.0 0.0
Imports, GNFSc 4.5 2.3 3.9 4.7 5.4 5.4 0.2 -0.1 -0.1 0.0
Net exports, contribution to growth 0.3 0.2 -0.1 0.0 -0.1 -0.1 0.0 0.0 0.0 0.0
Memo items: GDP
East Asia excluding China 4.7 4.8 4.8 5.0 5.2 5.2 0.0 0.0 0.1 0.0
China 7.3 6.9 6.7 6.5 6.3 6.3 0.0 0.0 0.0 0.0
Indonesia 5.0 4.8 5.1 5.3 5.5 5.5 0.0 0.0 0.0 0.0
Thailand 0.8 2.8 3.1 3.2 3.3 3.4 0.0 0.6 0.5 0.3
TABLE 2.1.1 East Asia and Pacific forecast summary
(Real GDP growth at market prices in percent, unless indicated otherwise)
Source: World Bank.
World Bank forecasts are frequently updated based on new information and changing (global) circumstances. Consequently, projections presented here may differ from those contained in
other Bank documents, even if basic assessments of countries’ prospects do not differ at any given moment in time.
a. EMDE refers to emerging market and developing economy. GDP at market prices and expenditure components are measured in constant 2010 U.S. dollars. Excludes American Samoa
and Democratic People's Republic of Korea.
b. Sub-region aggregate excludes American Samoa, Democratic People's Republic of Korea, Fiji, Kiribati, the Marshall Islands, the Federated States of Micronesia, Myanmar, Palau, Papua
New Guinea, Samoa, Timor-Leste, Tonga, and Tuvalu, for which data limitations prevent the forecasting of GDP components.
c. Exports and imports of goods and non-factor services (GNFS).
For additional information, please see www.worldbank.org/gep.
2014 2015 2016 2017 2018 2019 2015 2016 2017 2018
Estimates Projections (percentage point difference
from June 2016 projections)
Cambodia 7.1 7.0 7.0 6.9 6.9 6.8 0.0 0.1 0.1 0.1
China 7.3 6.9 6.7 6.5 6.3 6.3 0.0 0.0 0.0 0.0
Fiji 5.3 4.1 2.4 3.9 3.7 3.5 0.1 0.0 0.1 0.2
Indonesia 5.0 4.8 5.1 5.3 5.5 5.5 0.0 0.0 0.0 0.0
Lao PDR 7.5 7.4 7.0 7.0 6.8 7.2 0.4 0.0 0.0 0.0
Malaysia 6.0 5.0 4.2 4.3 4.5 4.5 0.0 -0.2 -0.2 -0.2
Mongolia 8.0 2.3 0.1 2.0 3.5 3.7 0.0 -0.6 -0.7 -2.7
Myanmar 8.0 7.3 6.5 6.9 7.2 7.3 0.3 -1.3 -1.5 -1.1
Papua New Guinea 7.4 6.8 2.4 3.0 3.2 3.0 -1.8 -0.6 -1.1 0.3
Philippines 6.2 5.9 6.8 6.9 7.0 6.7 0.1 0.4 0.7 0.8
Solomon Islands 2.0 3.3 3.0 3.3 3.0 3.0 0.0 0.0 0.0 0.0
Thailand 0.8 2.8 3.1 3.2 3.3 3.4 0.0 0.6 0.5 0.3
Timor-Lesteb 5.9 4.3 5.0 5.5 6.0 5.5 0.0 0.0 0.0 0.5
Vietnam 6.0 6.7 6.0 6.3 6.3 6.2 0.0 -0.2 0.0 0.0
TABLE 2.1.2 East Asia and Pacific country forecastsa
(Real GDP growth at market prices in percent, unless indicated otherwise)
Source: World Bank.
World Bank forecasts are frequently updated based on new information and changing (global) circumstances. Consequently, projections presented here may differ from those contained in
other Bank documents, even if basic assessments of countries’ prospects do not significantly differ at any given moment in time.
a. GDP at market prices and expenditure components are measured in constant 2010 U.S. dollars. Excludes American Samoa and Democratic People's Republic of Korea.
b. Non-oil GDP. Timor-Leste's total GDP, including the oil economy, is roughly four times the non-oil economy, and highly volatile, sensitive to changes in global oil prices and local
production levels.
For additional information, please see www.worldbank.org/gep.

EAST AS IA AND PAC IF IC GLOBAL ECONOMIC PROSPECTS | JANUARY 2017 93
BOX 2.1.1 Investment developments and outlook: East Asia and Pacific
Investment growth in the East Asia and Pacific (EAP) region has been stronger than in the average EMDE but has declined steadily over the past decade. Following a decline in 2010-14, investment growth in the East Asia and Pacific (EAP) region has since stabilized. To a large extent, the deceleration represents an necessary adjustment from previously elevated growth rates, which were temporarily boosted by the post-crisis government stimulus. In China, this process has involved economic rebalancing towards domestic consumption and the services sectors. In other economies, adjustment to lower commodity prices has been a factor. Investment needs remain sizable across the region, reflecting significant demographic and income shifts, and rapid urbanization.
During 2010-15, East Asia and Pacific accounted for almost one-half of the growth in global investment, and one-quarter of the global level. Investment growth has steadily declined from 12.1 percent in 2010 to 6.5 percent on average in 2015-16—well below the double-digit rates of 2003-2008. The slowdown has been broad based and reflected decelerating public as well as private investment. This box discusses the following questions.
• How has investment growth in the region evolved?
• What are the remaining investment needs?
• Which policies can help address investment needs?
The slowdown in investment growth in the EAP region was concentrated in China and commodity exporters. To some extent, the deceleration represents a necessary adjustment from high pre-crisis growth rates and the post-crisis policy stimulus. The process has involved economic rebalancing, from manufacturing industry to services, and from investment (in excess of 40 percent of GDP) and exports to domestic consumption. In other economies, the cycle in commodity markets, from a decade of high prices to recent weakness, has been a factor. Despite several decades of rapid investment growth, requirements in the areas of transport, health and education, and environmental protection, remain sizable across the region.
How has investment growth in the region evolved?
Investment growth in East Asia and Pacific has steadily declined—from 12.1 percent in 2010 to 6.5 percent on average in 2015-16. This is well below the region’s double-digit growth rates of 2001-2008, but higher than in other EMDE regions. The slowdown was particularly pronounced in China (Figure 2.1.1.1). It reflected a deceleration in the public as well as the private sector, as the coordinated fiscal stimulus following the global financial crisis was unwound (especially in China).
In China, investment growth slowed sharply from a 22.8 percent peak in 2009 to 6.5 percent on average in 2015-
16. The deceleration reflected a rebalancing towards more sustainable growth. The rebalancing of the economy has involved a shift from capital accumulation (in excess of 40 percent of GDP) and exports to domestic consumption, and from manufacturing industry to services. By 2015-16, the drivers of investment growth have changed (Box 3.3). Large debt stocks resulting from record-high credit growth in 2010-13 continue to weigh on investment growth. Nevertheless, China’s investment rate remains elevated at 43 percent of GDP in 2016.
Until 2015, commodity importers other than China faced investment headwinds from tight monetary, fiscal, and prudential policies that were designed to contain rapid credit growth. Also, the uncertainty due to political problems in Thailand and delays in investment project approvals in the Philippines held back investment in these countries.
In commodity exporters in the region, investment growth slowed sharply during 2012-14. In large commodity-exporting economies (Indonesia and Malaysia), this slowdown mainly reflected policy tightening in response to financial market stress during the 2013 Taper Tantrum, and to weaker terms-of-trade as a result of declines in commodity prices (especially raw materials, fertilizers, metals and minerals) from their early-2011 peaks. In smaller, more heavily commodity-dependent economies, investment contracted as foreign direct investment for mining sector projects declined, and as domestic policies tightened sharply in response to balance of payments stress (World Bank 2015b).
Since 2015, investment growth has begun to recover in the EAP region, with the exception of China, where it stabilized at around 6.5 percent. This has reflected a number of developments: stabilizing commodity prices; more accommodative policies amid low inflation and benign global financial conditions; and buoyant foreign direct investment inflows (FDI). Various factors contributed to the increased FDI: a reduction of political turbulence in Thailand; improved prospects for electronics manufacturing under WTO membership for Vietnam; and the opening up in Myanmar that began in 2011. In China, the composition of FDI has shifted from manufacturing—
Note: This box was prepared by Ekaterine Vashakmadze. Research assistance was provided by Liwei Liu.

CHAPTER 2 .1 GLOBAL ECONOMIC PROSPECTS | JANUARY 2017 94
held back by rising wages and production costs, especially in coastal regions—towards services, and from lower value-added products towards higher value-added products such as cars (UNCTAD 2016).
What are the remaining investment needs?
Infrastructure needs and priorities. Income and demographic shifts, and rapid urbanization are the three main forces driving investment needs in the region (World Bank 2015c, 2016f). Rapid urbanization, large-scale migration, and population aging place heavy strains on urban infrastructure for housing, transportation, healthcare, and education. Meeting the growing demands requires choosing a balance between economic growth and
environmental protection (ESCAP 2015).1 Estimates of costs vary widely (Inderst 2016; Bhattacharyay 2012; McKinsey 2014; HSBC 2013). The largest costs involve road construction and upgrading, energy infrastructure, and real estate development (HSBC 2013; McKinsey 2014; Deutsche Bank 2016). The region shows a significant disparity in density and quality of transport networks, electricity provision and housing, with greater gaps in China, Indonesia, and lower-income ASEAN economies (primarily because of large landmass and population size). There is substantial demand for
BOX 2.1.1 Investment developments and outlook: East Asia and Pacific (continued)
1For example, in addition to 170 cities in China with populations exceeding 1 million, China is expected to gain 292 million city-dwellers by 2050 (World Economic Forum 2015).
A. Investment growth B. Investment growth C. Terms of trade change
D. Monetary policy rates E. FDI: Groups F. FDI: Countries
FIGURE 2.1.1.1 Investment growth
Investment growth in the EAP region has stabilized at moderate levels in 2015-16 following a gradual decline in 2010-13. This
decline reflected a steady slowdown in China and a sharp deceleration of investment growth in commodity exporters through
end-2013. Since early-2014, investment growth has begun to recover in major commodity exporters as their terms-of-trade
bottomed out and major central banks embarked on easing cycles. Foreign direct investment (FDI) to the EAP region
remained buoyant and supported investment growth.
Sources: Haver Analytics; International Monetary Fund; United Nations Conference on Trade and Development; World Bank; World Development Indicators, World Bank.
A. GDP-weighted averages.
C. Investment-weighted averages. Commodity exporters include Indonesia, Malaysia, Myanmar, and Papua New Guinea. Commodity importers include Cambodia, the
Philippines, Thailand, and Vietnam. An increase denotes an improvement in terms-of-trade.
D. Policy rates are the average of end-of-period data.
E. FDI inflows. Weighted averages.
F. For difference from 1990-14 average, positive values indicate improvement of FDI inflows. LAO = Lao, PDR, KHM = Cambodia, VNM = Vietnam, MMR = Myanmar,
MYS = Malaysia, THA = Thailand, IDN = Indonesia, PHL = Philippines, MNG = Mongolia, PNG = Papua New Guinea, PLW = Palau.
0
4
8
12
16
20
10
Q1
20
10
Q3
20
11
Q1
20
11
Q3
20
12
Q1
20
12
Q3
20
13
Q1
20
13
Q3
20
14
Q1
20
14
Q3
20
15
Q1
20
15
Q3
20
16
Q1
20
16
Q3
EAP EAP ex. China EMDE
Percent, year-on-year
-6
-4
-2
0
2
4
6
2010 2011 2012 2013 2014 2015
PercentCommodity exporters
Commodity importers
0
4
8
12
16
Mo
ng
olia
Ind
one
sia
Ma
laysia
Chin
a
Vie
tna
m
Ph
ilipp
ines
Th
aila
nd
2000-05 2006-082011-12 2013-15H1 2016 H2 2016
Percent
Commodity exporters Commodity importers
0
1
2
3
4
Commodity exporters Commodity importersex. China
2011 2012 2013 2014
2015 1990-08 2003-08
Percent of GDP
-8
-3
2
7
12
LA
O
KH
M
VN
M
MM
R
MY
S
TH
A
IDN
PH
L
MN
G
PN
G
PL
W
2015Difference from 1990-08 average
Percent of GDP
0
4
8
12
1620
10
20
12
20
14
20
10
20
12
20
14
20
10
20
12
20
14
20
10
20
12
20
14
EAP EAP ex.China
EMDE China
1990-2008 avg 2003-08 avgPercent

EAST AS IA AND PAC IF IC GLOBAL ECONOMIC PROSPECTS | JANUARY 2017 95
upgrading and maintenance of infrastructure in other regional economies, including Malaysia, the Philippines, and Thailand.
Infrastructure upgrades and challenges. Despite some remarkable successes, providing adequate transport
BOX 2.1.1 Investment developments and outlook: East Asia and Pacific (continued)
FIGURE 2.1.1.2 Investment growth slowdown and investment needs
In 2014, virtually all EAP economies recorded investment growth below their long-term average, mainly reflecting weak
private investment. A rebound of investment in 2015 helped, but investment growth remains below its long-term average in
more than half of EAP economies. Long-term forecasts suggest continued weakness in investment growth, while sizable
investment needs remain in infrastructure.
Sources: Battacharya (2012), China Economic and Industry Data Database (CEIC), Consensus Economics, General Statistics Office of Vietnam, Haver Analytics, Inderst
(2016), Investment and Capital Stock database, International Monetary Fund, World Bank.
A. Share of countries in EAP region with investment growth below the long-term (1990-2008) average or negative investment growth (“Contracting”).
B. Weighted averages of gross fixed capital formation growth rates in the public and private sectors, respectively, in constant 2005 U.S. dollars. The sample includes nine
EAP economies.
C. Five-year ahead consensus forecasts made in the year denoted. Weighted average.
A. Share of countries with weak investment growth B. Contributions to investment growth
C. Long-term investment growth expectations D. Infrastructure investment needs , East and Southeast Asia
networks, power, water, and other facilities remains a challenge across much of the region (Figure 2.1.1.2).
Infrastructure projects underway. Extensive construction activities are underway in the region (BMI 2016). Transport, especially rail, accounts for the largest share.
0
25
50
75
100
2010 2011 2012 2013 2014 2015
Below long-term average Contracting
Percent
-2
0
2
4
6
8
10
12
14
201
0
201
1
201
2
201
3
201
4
201
5
201
0
201
1
201
2
201
3
201
4
201
5
Commodity exporters Commodity importers
Percentage points
Public Private
0
1
2
3
4
Energy Transport Telecoms Water andSanitation
Percent of GDP
0
1
2
3
4
5
6
7
8
2010 2011 2012 2013 2014 2015 2016
Percent

CHAPTER 2 .1 GLOBAL ECONOMIC PROSPECTS | JANUARY 2017 96
The aim is to integrate the region's transport networks, and to accommodate rapid urbanization.2 These projects are supported by government initiatives such as the China's One Belt One Road.
• China’s highway network more than doubled in size between 2004 and 2014, and the share of high-speed railways was boosted from 33 percent to 50 percent of total railway kilometers. Yet, transport density still
falls far short of that in advanced economies. Infrastructure needs vary considerably across Chinese regions, and range from high-profile projects (such as high-speed railways) to installing basic municipal infrastructure and pollution-reducing or -reversing technologies (World Bank 2013a, World Bank and DRC 2014).
• Lack of adequate infrastructure are the main cause of Indonesia's high logistics costs (around 17 percent of companies’ total expenditure). Transport costs are high. About one-quarter of the population of Indonesia remains without electricity.
BOX 2.1.1 Investment developments and outlook: East Asia and Pacific (continued)
A. Ranking of overall infrastructure B. Environmental performance C. Population living in slums
D. Quality of port infrastructure E. Air pollution, mean annual exposure:
regions F. Air pollution, mean annual exposure:
countries
FIGURE 2.1.1.3 Infrastructure indicators
Despite significant progress, in general, providing adequate transport networks, power, water and other facilities remains a
challenge across much of the region. EAP regional economies are confronted by environmental problems that threaten to
undermine future growth and regional stability.
Sources: Environmental Performance Index; World Economic Forum; World Development Indicators, World Bank.
A. Ranking of 140 countries according to the quality of their infrastructure. 1= the best, 140 = the worst.
B. The Environmental Performance Index (EPI) is constructed through the calculation and aggregation of 20 indicators reflecting national-level environmental data, including
child mortality, wastewater treatment, access to drinking water, access to sanitation, and air pollution average exposure to PM2.5. These indicators use a “proximity-to-target”
methodology, which assesses how close a particular country is to an identified policy target. Scores are then converted to a scale of 0 to 100, with 0 being the farthest from
the target (worst observed value) and 100 being closest to the target (best observed value).
C. Latest data are as of 2014.
D. 1= extremely underdeveloped to 7= well developed and efficient by international standards.
E.F. This measures the average level of exposure of a nation's population to concentrations of suspended particles measuring less than 2.5 microns in aerodynamic
diameter, which are capable of penetrating deep into the respiratory tract and causing severe health damage. Exposure is calculated by weighting mean annual
concentrations of PM2.5 by population in both urban and rural areas. Latest data are as of 2013.
E. SAS is South Asia region; EAP is East Asia & Pacific region; MENA is Middle East & North Africa region; SSA is Sub-Saharan Africa region, ECA is Europe & Central Asia
region, LAC is Latin America & Caribbean region.
0
20
40
60
80
100
120
140
Mala
ysia
Chin
a
Tha
iland
Ind
on
esia
Lao
, P
DR
Vie
tna
m
Cam
bod
ia
Mon
go
lia
Phili
pp
ines
2011-12 2016-17Ranking
0
20
40
60
Mala
ysi
a
Thaila
nd
Vie
tnam
Ind
one
sia
Phili
ppin
es
Ch
ina
La
o,
PD
R
Cam
bo
dia
Mya
nm
ar
2010 2014Index
0
1
2
3
4
5
6
7
Mala
ysia
Ch
ina
Thaila
nd
Indo
ne
sia
Ca
mbo
dia
Vie
tnam
Phili
ppin
es
La
o, P
DR
2007 2016-17 OECD U.S.Score
0
10
20
30
40
50
SA
S
EA
P
ME
NA
SS
A
EC
A
LA
CLatest World
Micrograms per cubic meter
0
10
20
30
40
50
60
Chin
a
Myan
mar
Vie
tna
m
Th
aila
nd
Cam
bodia
Ind
on
esi
a
Mala
ysia
Ph
ilipp
ines
Mon
go
lia Fiji
1990 Latest OECD U.S.Micrograms per cubic meter
2Planning is underway for high-speed rail across the region, including a major network expansion in China, projects in Thailand, Indonesia, Singapore/Malaysia, Lao PDR, and Vietnam.
0
10
20
30
40
50
60
Cam
bo
dia
Mon
golia
Mya
nm
ar
Phili
ppin
es
Vie
tnam
Ch
ina
Thaila
nd
Ind
one
sia
Latest EAP LAC SASPercent of urban population

EAST AS IA AND PAC IF IC GLOBAL ECONOMIC PROSPECTS | JANUARY 2017 97
A. Health expenditure B. Life expectancy, by country C. Mortality rate, under-5
D. Quality of math and science education E. Country capacity to retain or attract
talent F. Gross enrollment ratio, tertiary
FIGURE 2.1.1.4 Health and education
East Asia and the Pacific made great progress towards education and human development outcomes, including child survival,
nutrition and education outcomes. Despite the evident progress in the region, some countries still face significant challenges
and serious education and human-resource shortfalls.
Sources: Haver Analytics; World Development Indicators, World Bank; World Economic Forum.
A.B.F. Latest data are as of 2014.
C. Probability of dying between birth and exactly five years of age expressed per 1000 live birth. Latest data are as of 2015.
D.E. The score is from 1 to 7. Higher value means the country is in a good performance. The OECD and EMDE average is the simple average of all the countries in the
subgroupings.
• In Lao PDR, Cambodia, and Vietnam, investment in basic road infrastructure is a priority (World Bank and Vietnam Ministry of Planning 2016).
• In Malaysia, high-profile projects like the expansion of the public transport system in Kuala Lumpur, and airport and port upgrades, are anticipated to proceed through 2020. Middle-income ASEAN countries in general, such as Malaysia and Thailand, are still investing heavily in the rail and public transport systems.
• The Philippines is particularly weak with regard to transport and trade-related infrastructure. It continues to rank above 100 globally in the overall state of its infrastructure (World Economic Forum 2015), with particularly low rankings for the quality of its seaports
and airports. About one-quarter of the population remains without electricity.
• In many East Asian countries, about a third of the population lives in substandard housing (Figure 2.1.1.3).
Education and health care. The region has made great progress in human development outcomes, including child survival, nutrition, and education. Despite this progress, the region still faces serious education and human-resource shortfalls (Figure 2.1.1.4).
• Health care. EMDEs in the EAP region have reduced child mortality rates by an average of two-thirds between 1990 and 2015. However, child mortality rates in Lao PDR, Myanmar, and Papua New Guinea, and Timor-Leste are still well above global averages.
BOX 2.1.1 Investment developments and outlook: East Asia and Pacific (continued)
60
65
70
75
80
85
Ch
ina
Vie
tna
m
Ma
lays
ia
Th
aila
nd
Fiji
Mon
go
lia
Indo
ne
sia
Ph
ilip
pin
es
Tim
or-
Le
ste
Ca
mb
odia
So
lom
on
Isl
an
ds
Mya
nm
ar
Pa
pu
a N
ew
Gu
ine
a
Latest OECD World EAPYears
0
20
40
60
80
Mala
ysia
Ch
ina
Th
aila
nd
Vie
tnam Fiji
Mo
ngo
lia
Ind
one
sia
Ph
ilipp
ine
s
So
lom
on
Isl
an
ds
Ca
mb
od
ia
Mya
nm
ar
Tim
or-
Le
ste
Pap
ua
Ne
w G
uin
ea
La
o, P
DR
Latest OECD World EAPPercent
0
1
2
3
4
5
6
Mala
ysi
a
Mon
golia
Chin
a
Ind
one
sia
Vie
tnam
Phili
pp
ines
Tha
iland
Lao,
PD
R
Cam
bo
dia
2016-17 EMDE OECD EAPScore
0
1
2
3
4
5
6
Mala
ysia
Chin
a
Ind
on
esi
a
Th
aila
nd
Lao
, P
DR
Ph
ilipp
ines
Cam
bodia
Vie
tna
m
Mon
go
lia
2016-17 EMDE OECD EAPScore
02468
101214
Vie
tna
m
Th
aila
nd
Ca
mb
od
ia
Ch
ina
Solo
mo
n I
sla
nd
s
Mo
ngo
lia
Ph
ilip
pin
es
Fiji
Pa
pua
Ne
w G
uin
ea
Ma
lays
ia
Ind
on
esi
a
Myan
ma
r
La
o,
PD
R
Tim
or-
Le
ste
Latest OECD World EAPPercent of GDP
01020304050607080
Mo
ng
olia
Th
aila
nd
Chin
a
Ph
ilipp
ines
Indon
esia
Vie
tna
m
Ma
lays
ia
Latest OECD World EAPPercent

CHAPTER 2 .1 GLOBAL ECONOMIC PROSPECTS | JANUARY 2017 98
In addition, the region has historically faced a high burden of disease from infectious diseases, some of which have potential global reach (e.g., SARS and pandemic influenza). Within a generation, rates of non-communicable diseases (NCDs) are expected to rise, and infectious diseases are expected to remain a risk associated with high population mobility and environmental degradation (Anbumozhi and Ponciano 2015). Adjusting to these long-run trends will require public investment in basic infrastructure, education, health and environmental protection.
• Education. Although enrollment in primary education in the region is almost universal, there are deficiencies in student retention (Cambodia, Lao PDR, Myanmar), quality of education (Thailand, Malaysia, Vietnam, Cambodia, Lao PDR), and knowledge gained as measured by literacy rates (Papua New Guinea, Timor-Leste, Lao PDR, Cambodia).
Environmental challenges. Many countries in the region are confronted by environmental problems that threaten to undermine future growth and stability. The main challenges include water management, deforestation and land degradation, air pollution, and climate change (Lee and Pang 2015). In several major cities in China, air and water pollution presents a growing health risk. Pollution levels have also risen in Myanmar, Vietnam, Thailand, and Cambodia since 2010.
Which policies can help address investment
needs?
Greater spending efficiency will help increase the benefits of public investment. Private sector participation can help improve efficiency, and at the same time provide funding. Several reforms can help realize the potential benefits of public-private-partnerships. Governments can centralize agencies that coordinate national infrastructure, in cooperation with the private sector and multilateral agencies. Multilateral Development Banks can work with the private sector to provide quality and governance assurances. Standardization and a global “code of conduct” can enhance confidence in the private sector as a good partner. This could include a regulatory framework, transparency principles, and a system for dispute resolution (McKinsey 2013).
Confidence in the business environment is central to encouraging private investment. Measures to improve the environment include cutting red tape, clarifying laws and regulations, allowing greater market access to foreign
companies, opening more investment areas to private enterprise (especially in services sectors), and cutting financing costs. Reforms to deepen capital markets and to strengthen banking systems (e.g., through faster and more effective insolvency procedures) can encourage private financing.
In education, policy priorities include a focus on developing skills that are a high priority in labor markets, keeping in mind that requirements differ across country and sector. Primary and secondary education must focus on quality and on learning outcomes, and on building effective educational systems based on autonomy and accountability. The relevance of higher education, vocational education, and training can be improved by giving institutions the capacity and incentives to meet labor market demand, and by providing information to improve the matching between job openings and the skills of prospective workers (World Bank 2014a). In health, ensuring access to good quality services, without imposing financial hardship, will entail reforms to the insurance regime, and a shift of focus from hospitals toward high-quality primary care.
For environmental sustainability, the complexity of challenges underlines that there are no easy or universal solutions to environmental problems across the region. However, a number of initiatives would be appropriate. These include a focus on common benefits; an emphasis on stakeholder participation; a commitment to scientific and technological research; an emphasis on long-term planning; reforms to align resource and utilities pricing with cost, including externalities; improvements in governance and general institutional capacity; and a strengthening of regionally coordinated approaches and international support (Anbumozhi and Ponciano 2015).
Investment growth in EAP is unlikely to revert to the high rates of the previous decade. Demands for capital formation in the region will nevertheless remain relatively high, and governments and multilateral agencies will remain important providers of funding. The establishment of the Asia Infrastructure Investment Bank provides a new source of funding. In March 2016, the Japan International Cooperation Agency signed an agreement with the Asian Development Bank to establish a new $1.5 billion fund to support private infrastructure investments across the Asia-Pacific region. In order to have the desired impact, it is important that investments go to economically viable projects. Close coordination of regional and global initiatives will help reduce duplication and inconsistencies in public investment projects (BMI 2016).
BOX 2.1.1 Investment developments and outlook: East Asia and Pacific (continued)

Recent developments
Regional output is estimated to have expanded 1.2 percent in 2016, following 0.5 percent growth in 2015, as the recession in Russia, which accounts for almost 40 percent of regional GDP, eased (Table 2.2.1). Excluding Russia, regional growth in 2016 declined to 2.4 percent from 3.5 percent in 2015 as the Turkish economy slowed amid political uncertainty. Regional activity was supported by stabilizing commodity prices, accommodative policies, reduced geopolitical tensions (Russia, Ukraine), and improved overall confidence for most of 2016.1
Financial markets, which were generally stable for most of 2016, turned more volatile in the fourth quarter amid heightened policy uncertainty from
both external (the United States and Europe) and domestic (particularly Turkey) factors (Figure 2.2.1). Exchange rates and asset prices, which recouped some of their earlier losses in mid-2016, came under renewed pressure in the fourth quarter, especially in several large western economies with relatively high levels of domestic policy uncertainty and significant vulnerabilities. Turkish lira fell to a record low against the U.S. dollar in December. In contrast, a modest recovery of commodity prices since November supported further rebound of exchange rates and asset prices in energy exporters (Kazakhstan and Russia).
Monetary and fiscal policies followed different courses in the region. Russia and Kazakhstan cut their policy interest rates to support activity, despite above-target or above-trend inflation. Azerbaijan, where inflationary pressures persisted throughout 2016, maintained its tight monetary stance. Turkey raised its benchmark rate for the first time in almost three years in November 2016 amid a depreciating currency and weak external demand. Kazakhstan deployed a fiscal stimulus package equivalent to around 2 percent of GDP on net. Romania implemented a pro-cyclical value-added tax cut.
Regional growth accelerated from 0.5 percent in 2015 to 1.2 percent in 2016, in line with expectations, due mainly to an easing of the recession in Russia as oil prices stabilized. Excluding Russia, regional growth slowed to 2.4 percent in 2016 from 3.5 percent in 2015, reflecting a slowdown in Turkey amid political uncertainty. In the eastern part of the region performance was mixed: activity picked up in Ukraine after two years of deep recession, growth continued to slow in Kazakhstan, and output contracted in Azerbaijan. In the western part of the region growth generally remained robust, despite moderating in several major countries (Turkey, Poland, and Hungary). Regional growth is expected to rise to 2.8 percent on average in 2018-19, driven mainly by a recovery in commodity exporters and Turkey. Risks remain tilted to the downside, and include the possibility of further weakness in commodity prices, disruptions in financial markets, slower-than-expected Euro Area growth, and political uncertainty. Key policy challenges include ensuring macroeconomic stability during the adjustment to lower commodity prices and dealing with sizable macroeconomic and financial vulnerabilities. Structural reforms would boost potential growth and mitigate the long-term effects of the lackluster external environment and aging populations.
Note: This section was prepared by Yoki Okawa and Ekaterine Vashakmadze with contributions from Jongrim Ha and Hideaki Matsuoka. Research assistance was provided by Shituo Sun. 1The eastern part of the region comprises Eastern Europe (Bela-rus, Moldova, Ukraine), South Caucasus (Armenia, Azerbaijan and Georgia), Central Asia (Kazakhstan, the Kyrgyz Republic, Tajikistan, Turkmenistan, Uzbekistan) and Russia. The western part of the region includes Central Europe (Bulgaria, Croatia, Hungary, Poland Romania) and the Western Balkans (Albania, Bosnia and Herzegovina, Kosovo, FYR Macedonia, Montenegro, Serbia), and Turkey.

CHAPTER 2 .2 GLOBAL ECONOMIC PROSPECTS | JANUARY 2017 100
In Russia, the output contraction eased to -0.6 percent in 2016, from -3.7 percent in 2015 (Figure 2.2.2 and Table 2.2.2). Russia’s contraction was shallower than projected in June because of overall accommodative fiscal policy in 2016 with the temporary suspension of the fiscal rule and banking sector capital and liquidity injections (IMF 2016h; World Bank 2016g). The flexible exchange rate, which depreciated in real effective terms from 2014 to early 2016, was also a supporting factor. Investment bottomed out faster than expected, as firms started rebuilding inventories, and the contraction in consumption eased as inflation declined to pre-crisis levels.
Growth slowed to 0.9 percent in Kazakhstan and the output contracted in Azerbaijan. The erosion of foreign exchange reserves in an attempt to support their currencies, following the commodity price bust, led to the abandonment of fixed exchange rates in favor of a float in Kazakhstan and a managed float in Azerbaijan (Horton et al. 2016; IMF 2016i). The acute phase of the shock might be over in both countries. However, activity in these countries have been held back by contractions in non-oil activity, particularly the services sector (Kazakhstan) and construction (Azerbaijan), which had previously been supported by public investment (IMF 2015b). Weak growth in Russia, Azerbaijan, and Kazakhstan continues to weigh on Central Asia and the South Caucasus. Growth has remained below long-term trends in Armenia, Georgia, the Kyrgyz Republic, and Tajikistan in 2016.
Growth in Eastern European sub-region is bottoming out after two years of sharp recession. Ukraine grew by 1 percent in 2016, a broad-based recovery from the almost 10 percent contraction in 2015. This reflected an easing of the conflict in eastern Ukraine, along with the impact of significant reforms undertaken during 2014-15 to stabilize the economy and reduce large imbalances. The Second Review of the IMF program was approved in September 2016, which helped to release some previously committed donor funds. Inflation has remained below 15 percent since April, and the exchange rate has stabilized since September. Growth in Moldova bottomed out, and the contraction in Belarus eased, partly because of the recovery in Russia and Ukraine.
Activity in the western part of the region, which is comprised of commodity importers that are more closely linked to, or are members of, the European Union (EU), has generally remained robust. Growth accelerated in Albania, Croatia, Romania, and Serbia reflecting strong domestic demand supported by low energy prices, faster investment growth helped by the disbursement of EU structural funds, labor market improvements, particularly in Albania, and the VAT tax cut in Romania. Strong exports of goods and services to the Euro Area were additional supportive factors in Croatia and Romania. In contrast, easing of
FIGURE 2.2.1 Growth
Regional growth rebounded in 2016, mainly because of an easing of the
recession in Russia. The improved regional performance was supported
by stabilization in financial markets until the third quarter. Growth is
expected to continue to strengthen, led by commodity exporters, but will
likely remain below its long-run average.
B. Currency volatility A. Regional economic performance
D. Growth in commodity exporters
and importers
C. Growth by sub-regions
Sources: Bloomberg, World Bank.
A. Weighted averages. Growth is year-on-year percent change. EMDE ECA = emerging market and
developing economies in European and Central Asia. Shadow area indicates projections. The sample
includes 24 EMDEs in European and Central Asia.
B. Currency volatility is the 1-month implied volatility for the exchange rate. The volatility of last day in
2015 is set to 100. Last observation is December 21, 2016.
C.D. Weighted averages. Year-on-year real growth. Long term average is for 1995-2008.
C. The western part of the region includes Albania, Bulgaria, Bosnia and Herzegovina, Croatia,
Hungary, Kosovo, the FYR Macedonia, Montenegro, Poland, Romania, Serbia and Turkey. The
eastern part of region includes Armenia, Azerbaijan, Belarus, Georgia, Kazakhstan, the Kyrgyz
Republic, Moldova, Russia, Tajikistan, Turkmenistan, Ukraine, and Uzbekistan.
D. Commodity exporters include Albania, Armenia, Azerbaijan, Kazakhstan, Kyrgyz Republic, Russia,
Tajikistan, Turkmenistan, Ukraine, and Uzbekistan. Commodity importers include Bulgaria, Bosnia
and Herzegovina, Belarus, Georgia, Croatia, Hungary, Kosovo, FYR Macedonia, Moldova,
Montenegro, Poland, Romania, Serbia, and Turkey.
-4
-2
0
2
4
6
20
12
20
13
20
14
20
15
20
16
20
17
20
18
20
19
EMDE ECACommodity exportersCommodity importers excl. Turkey
Percent
020406080
100120140160180
Ja
n-1
6
Feb
-16
Mar-
16
Apr-
16
May-1
6
Ju
n-1
6
Jul-
16
Aug
-16
Sep
-16
Oct-
16
Nov-1
6
Dec-1
6
Russia Poland Turkey
Index, end 2015=100
-4
-2
0
2
4
6
8
201
4
201
5
201
6
201
7
201
8
201
4
201
5
201
6
201
7
201
8
201
4
201
5
201
6
201
7
201
8
ECA Western Eastern
2003-08 average 1995-2008 averagePercent
-4
-2
0
2
4
6
8
201
4
201
5
201
6
201
7
201
8
201
4
201
5
201
6
201
7
201
8
Commodity exporters Commodity importers
2003-08 average 1995-2008 averagePercent

EUROPE AND CENTRAL ASIA GLOBAL ECONOMIC PROSPECTS | JANUARY 2017 101
domestic demand weighed on growth in Hungary, Poland, and Turkey. In Turkey, activity contracted in the third quarter of 2016, for the first time since 2009, in the wake of the failed coup attempt and resulting deterioration of business conditions.
Vulnerabilities
Several countries in ECA have enhanced their policy frameworks and their resilience to external shocks in recent years, but vulnerabilities in the region are numerous. Some countries face substantial financing needs in excess of reserves. Albania, Georgia, the Kyrgyz Republic, and Turkey are running current account deficits, which are often financed by volatile portfolio flows. Albania, Belarus, Croatia, Hungary, Montenegro, Poland, and Ukraine, are at risk from elevated sovereign debt levels. Croatia, Georgia, Kazakhstan, and Turkey have high stocks of private debt denominated in foreign currencies, the legacy of rapid credit growth in the aftermath of the global financial crisis.
Outlook
Growth in the region is expected to accelerate to 2.7 percent on average in 2017-19, driven by a recovery in commodity-exporting economies and improved confidence. This outlook is predicated on a continued, but modest, recovery in commodity prices and easing geopolitical tensions.
Growth in the western part of the region, which is close to its long-term average, is projected to remain robust. The economies in the east of the region are expected to continue to strengthen, although growth is projected to remain well below both long-term and pre-crisis averages. Growth in major energy exporters is being held back by weakness in non-oil sectors (IMF 2015a).
Russia’s economy will resume growth in 2017, as the adjustment to low oil prices is completed. However, in the baseline scenario, growth will likely remain below the 1995-2008 average of 4.1 percent, partly reflecting persistently low oil prices. The adjustment to the negative terms-of-trade shock in Azerbaijan and Kazakhstan is
FIGURE 2.2.2 Country developments
Recessions in Russia and Ukraine have bottomed out. In Turkey, sharp
drop in confidence led to a contraction of activity in the third quarter.
Activity moderated in Poland. Growth slowed in Kazakhstan and output
contracted in Azerbaijan, reflecting gradual adjustment to low commodity
prices.
B. Turkey A. Russian Federation
F. Azerbaijan E. Ukraine
Source: Haver Analytics.
A.-F. Industrial production are year-on-year growth, not seasonally adjusted. Current account
balances are seasonally adjusted. Last observation is 2016Q3 for Russia, Turkey, Poland, and
Ukraine. Last observation is 2016Q2 for Kazakhstan and Azerbaijan except industrial production.
D. Kazakhstan C. Poland
-6
-4
-2
0
2
4
6
-6
-4
-2
0
2
4
6
20
12
20
13
20
14
Q1
20
14
Q2
20
14
Q3
20
14
Q4
20
15
Q1
20
15
Q2
20
15
Q3
20
15
Q4
20
16
Q1
20
16
Q2
20
16
Q3
Current account (RHS)Industrial productionGDP
Percent of GDPPercent, year-on-year
-8
-4
0
4
8
12
16
-6
-3
0
3
6
9
12
20
12
20
13
20
14
Q1
20
14
Q2
20
14
Q3
20
14
Q4
20
15
Q1
20
15
Q2
20
15
Q3
20
15
Q4
20
16
Q1
20
16
Q2
20
16
Q3
Current account(RHS)Industrial productionGDP
Percent, year-on-year Percent of GDP
-4
-2
0
2
4
6
-4
-2
0
2
4
6
20
12
20
13
20
14
Q1
20
14
Q2
20
14
Q3
20
14
Q4
20
15
Q1
20
15
Q2
20
15
Q3
20
15
Q4
20
16
Q1
20
16
Q2
20
16
Q3
Current account (RHS)Industrial productionGDP
Percent, year-on-year Percent of GDP
-9
-6
-3
0
3
6
9
12
-6
-4
-2
0
2
4
6
8
20
12
20
13
20
14
Q1
20
14
Q2
20
14
Q3
20
14
Q4
20
15
Q1
20
15
Q2
20
15
Q3
20
15
Q4
20
16
Q1
20
16
Q2
20
16
Q3
Current account (RHS)
Industrial production
GDP
Percent, year-on-year Percent of GDP
-20
-15
-10
-5
0
5
-24
-18
-12
-6
0
6
20
12
20
13
20
14
Q1
20
14
Q2
20
14
Q3
20
14
Q4
20
15
Q1
20
15
Q2
20
15
Q3
20
15
Q4
20
16
Q1
20
16
Q2
20
16
Q3
Current account (RHS)Industrial productionGDP
Percent, year-on-year Percent of GDP
-20
-10
0
10
20
-10
-5
0
5
1020
12
20
13
20
14
Q1
20
14
Q2
20
14
Q3
20
14
Q4
20
15
Q1
20
15
Q2
20
15
Q3
20
15
Q4
20
16
Q1
20
16
Q2
20
16
Q3
Current account (RHS)
Industrial productionGDP
Percent, year-on-year Percent of GDP
projected to level off in 2017, as commodity prices stabilize and economic imbalances narrow (Figure 2.2.3; IMF 2015d). Further adjustments that are required in the fiscal and banking spheres constrain the outlook for investment given the high capital intensity of the extractive industry. Strengthened activity in Russia and Kazakhstan will support other economies in the region (Armenia, Belarus, the Kyrgyz Republic) through

CHAPTER 2 .2 GLOBAL ECONOMIC PROSPECTS | JANUARY 2017 102
for commodity imports. Differences in prospects among countries stem from domestic factors. Romania’s strong growth in 2016, boosted by pro-cyclical VAT cut, will stabilize in 2017. In Hungary, growth is projected to accelerate to 2.7 percent on average reflecting a recovery of public investment, including the infrastructure projects financed by EU funds.
In Turkey, growth projected to recover to 3.0 percent in 2017 and 3.6 percent, on average, in 2018-19 helped by improved confidence. However, downside risks to the outlook increased compared to June, reflecting political uncertainty and financial market volatility. Growth in Poland is projected to remain around 3.3 percent in 2017-19, supported by robust domestic demand, especially private consumption. Weak demand from main trading partners, including the United Kingdom and Euro Area, will limit the prospects of further acceleration.
Risks
The risks in the region remains tilted to the downside. The main risks could come from lower commodity prices, financial market disruption, political uncertainty or slower growth in advanced economies, including Europe and the United States, and geopolitical uncertainty in the region.
The primary downside risk for Russia and the eastern part of the region is a stalling or reversing recovery of global energy prices. For energy exporters (Azerbaijan, Kazakhstan, Russia, Turkmenistan, Uzbekistan), energy price shocks could affect macroeconomic stability through spillovers to other sectors, such as construction and transportation, fiscal pressures, strains on the exchange rate, inflation or financial system instability. Financial strains and fiscal deteriora-tion could trigger a pro-cyclical policy tightening to preserve fiscal and reserve buffers, which could include public spending cuts and policy interest rate increases. A deeper or longer-than-expected recession in Russia could generate intensified spillovers for the rest of the eastern part through reduced remittance flows and lower demand for exports (Armenia, Belarus, Georgia, the Kyrgyz Republic, Moldova, Tajikistan, Uzbekistan).
rising trade and remittances. Regional integration initiatives (e.g., the Eurasian Economic Union, EEU, the European Union, EU) could help.
Among oil importers, output in Ukraine, which returned to expansion in 2016, is expected to grow as the security situation improves and domestic economic reforms gain traction. Growth in 2017 is projected at 2 percent—unchanged from the June projection. While Ukraine made progress in reforming public finances, debt management, energy subsidies, and the banking system, efforts to address government ineffectiveness, privatization of state-owned enterprises, and pension reform have been delayed (IMF 2016j).
The outlook for countries in the western part of region is mixed. On average, growth is expected to remain steady in Central Europe, despite lower trading partner growth and gradually rising prices
FIGURE 2.2.3 Policy responses to lower oil prices and
growth
Russia responded to lower oil prices and international sanctions by
allowing an early and sharp depreciation of its currency. In Kazakhstan
and Azerbaijan, exchange rate adjustments were implemented in late 2015
to early 2016.
B. Inflation A. Real effective exchange rate
D. Real GDP C. Fiscal balance
Sources: Haver Analytics, International Monetary Fund, World Bank.
B. Inflation is annualized quarter-on-quarter consumer price growth. Last observation is 2016Q3.
C. Revenue is general government revenue; expenditure is general government total expenditure;
balance is general government net lending/borrowing.
D. 2016 data are estimates.
70
80
90
100
110
120
130
20
10
20
11
20
12
20
13
20
14
Q1
20
14
Q2
20
14
Q3
20
14
Q4
20
15
Q1
20
15
Q2
20
15
Q3
20
15
Q4
20
16
Q1
20
16
Q2
20
16
Q3
Russia Kazakhstan Azerbaijan
Index, 2010Q1=100
-10
0
10
20
30
40
5020
13
20
14
Q1
20
14
Q2
20
14
Q3
20
14
Q4
20
15
Q1
20
15
Q2
20
15
Q3
20
15
Q4
20
16
Q1
20
16
Q2
20
16
Q3
Russia Kazakhstan AzerbaijanPercent
-12
-8
-4
0
4
8
12
-50-40-30-20-10
01020304050
20
13
20
14
20
15
20
16
20
13
20
14
20
15
20
16
20
13
20
14
20
15
20
16
Russia Kazakhstan Azerbaijan
Revenue Expenditure Balance (RHS)
Percent of GDP Percent of GDP
70
75
80
85
90
95
100
105
110
20
10
20
11
20
12
20
13
20
14
20
15
20
16
Russia Kazakhstan Azerbaijan
Index, 2014=100

EUROPE AND CENTRAL ASIA GLOBAL ECONOMIC PROSPECTS | JANUARY 2017 103
U.S. monetary tightening could be accompanied by bouts of heightened risk aversion and financial stress, which in the past have led to slowing international capital flows with damaging consequences for activity and employment in the region. The economies with significant external financing needs are particularly sensitive to a potential reversal of capital flows (Figure 2.2.6).
Global policy uncertainty has significantly increased following the elections in the United States and the United Kingdom’s decision to leave the European Union. The region, especially its western part, has strong ties with the European Union. Heightened uncertainty in advanced economies—in Europe or elsewhere—could have significant impact on trade, external balances, and regional growth prospects. If this risk materializes, the scope for the countercyclical policies could be limited for many countries (Albania, Belarus, Croatia, Hungary, Montenegro, Russia, Serbia, Ukraine; Figure 2.2.4, 2.2.5).
An escalation of geopolitical tensions would also set back growth. Risks include rising tensions in Eastern Ukraine, the conflict in Syria, and the refugee crisis. In Turkey, while a sharp contraction in activity after the failed coup attempt in July is expected to ease gradually in the baseline scenario, uncertainty on the future prospect remain elevated and risks to the outlook are tilted to the downside. If geopolitical and domestic political tensions delay the implementation of necessary reforms and discourage investment, long-term growth prospects would also be adversely affected.
Policy challenges
Despite the recent recovery, growth in the ECA region remains below trend. In several countries (Belarus, Croatia, Ukraine), GDP is still below pre-crisis levels. The high volatility of output in the region hinders its growth prospects (Figure 2.2.6). The key policy challenge for the region is to lift growth back to a stable trend rate. This requires policies that promote macroeconomic and political stability, economic diversification, and improved resilience to external headwinds.
FIGURE 2.2.4 Risks of heightened policy uncertainty in
major advanced economies
The region, especially its western part, has strong ties with the European
Union. Heightened uncertainty in advanced economies—in Europe or
elsewhere—could have significant impact on trade, external balances, and
regional growth prospects. A slowdown in U.S. or Euro Area growth would
reduce growth and investment in EMDEs considerably.
B. Trade and financial exposures to
major advanced economies
A. Trade and financial exposures to
major advanced economies
D. Cumulative impact of higher EU
policy uncertainty on ECA investment
C. Cumulative impact of higher
volatility on EMDE investment
Sources: Baker, Davies, and Bloom (2016); Bank for International Settlements; Haver Analytics;
World Bank; International Monetary Fund.
A.B. Foreign claims refer to stock of total claims of BIS-reporting banks on foreign banks and
non-banks. Trade refers to goods exports and imports. Data is average of 2010-15.exports to the
United States/Euro Area, remittances from the United States/Euro Area, and FDI from the United
States/Euro Area (all in percent of GDP). FDI is stock of total FDI. Figure B. shows only the countries
with the largest exposures to the United States and Euro Area.
C.D. Cumulative impulse response using a vector autoregression for 18 EMDEs for 1998Q1-2016Q2.
Details of the methodology are provided in Annex SF3.2B. Solid lines indicate median responses and
dotted lines indicate 16-84 percent confidence intervals. Endogenous variables follow this Cholesky
ordering, the VIX or Economic Policy Uncertainty (EPU) Index for the EU, EMDE stock price index,
EMDE bond price index, and aggregate real output and investment in EMDEs. Exogenous regressors,
included with two lags, are G7 real GDP growth, world stock price index, and U.S. 10-year bond
yields. For the estimation of the impact of EU uncertainty (as measured by the EPU, Figure 2.2.4D),
the sample includes EMDEs in Europe and Central Asia (Bulgaria, Hungary, Poland, Romania,
Russia, Turkey).
E.F. Bars indicate median cumulative impulse responses (vertical lines indicate 16-84th percentile
confidence intervals) from a Bayesian structural vector autoregression for 1998Q1–2016Q2, using
weighted average data for 18 EMDEs. The regression includes, in this Cholesky ordering, weighted
average output growth in major advanced economies and China (excluding either the United States
or the Euro Area); U.S. or Euro Area output growth; U.S. 10-year sovereign bond yield; JP Morgan’s
EMBI index; and aggregate output growth or investment growth in EMDEs (excluding China).
The oil price growth is included as an exogenous regressor in the model. Details are elaborates
in Annex 3.2C.
0
20
40
60
80
100
Exports InwardFDI
Remittanceinflows
Portfolioliabilities
Foreignclaims
US China EU Japan Other
Percent of total
0
20
40
60
80
Hun
ga
ryB
ulg
aria
Pola
nd
Maced
on
ia, F
YR
Ro
ma
nia
Hun
ga
ryB
ulg
aria
Pola
nd
Maced
on
ia, F
YR
Ro
ma
nia
Mo
ldova
Bosnia
& H
erz
.A
lba
nia
Serb
iaM
on
tene
gro
Exports FDI Remittances
European Union United StatesPercent of GDP
-2.0
-1.5
-1.0
-0.5
0.0
1 2 3 4 5 6 7 8
Quarter
Percentage points
-2.0
-1.5
-1.0
-0.5
0.0
1 2 3 4 5 6 7 8
Quarter
Percentage points
F. Cumulative Impact of Euro Area
growth slowdown on EMDE countries
E. Cumulative Impact of U.S. growth
slowdown on EMDE countries
-5
-4
-3
-2
-1
0
On impact 1 year
Output growthInvestment growth
Percentage points
-5
-4
-3
-2
-1
0
On impact 1 year
Output growthInvestment growth
Percentage points

CHAPTER 2 .2 GLOBAL ECONOMIC PROSPECTS | JANUARY 2017 104
Cyclical policies
Exchange rate flexibility and monetary policy credibility. For countries hit by large terms-of-trade shocks, especially in the eastern part of the region, it is critical to employ policies to promote adjustment to the new era of low oil prices. These include exchange rate flexibility, policy predictability, and an agile business environment (Svensson 2010; Mollick et al. 2011). The adoption of new monetary policy frameworks could strengthen policy credibility in countries that have recently allowed more exchange rate flexibility, such as Azerbaijan and Kazakhstan. Safeguarding macroeconomic stability and managing volatility is important for commodity importers as well, especially for economies closely related to oil-exporting countries (Armenia, Georgia, Moldova, the Kyrgyz Republic). These countries have limited monetary policy buffers, high dollarization rates,
and high risks emanating from elevated foreign currency-denominated private debt.
Financial-sector risk management. Economies with high and rising debt, unhedged foreign liabilities, or heavy reliance on short-term borrowing to fund longer-term investments (Azerbaijan, Hungary, Kazakhstan, and Turkey) would benefit from stronger risk management (IMF 2016k; Claessens 2015), such as requiring greater capital and liquidity buffers for financial institutions exposed to leveraged corporates. Strengthened governance in state-owned enterprises can help contain the buildup of corporate debt. Reforms to insolvency and bankruptcy laws would, among other improvements, allow a more rapid and orderly resolution of distressed companies.
Rebuilding fiscal policy buffers. Improving macroeconomic stability requires fiscal consolidation over the medium term. With few exceptions, commodity importers have limited fiscal buffers, reflecting elevated government debt or large deficits. Commodity exporters, who had smaller deficits than importers, saw a deterioration in fiscal balances as well as from a decline in commodity-related revenue. Unless severe downside risks materialize, the priority in many countries is to rebuild policy buffers and implement fiscal reforms.
For fiscal consolidation, in addition to reducing spending, countries need to broaden their tax base and strengthen tax administration. In Russia, a gradual increase in revenues would support fiscal consolidation. In Ukraine, the fiscal outlook remains challenging, with the general deficit, including Naftogaz, projected at almost 4 percent of GDP in 2016. Measures to improve the quality of public spending, consistent with medium-term expenditure frameworks, would also be appropriate.
Many commodity-exporting economies in the region have sovereign wealth funds, which have helped reduce pro-cyclicality of fiscal policy (Bleaney and Halland 2016; World Bank 2016g). The rules governing these funds could be strengthened to ensure greater counter-cyclicality and intergenerational equity. For example, Russia
FIGURE 2.2.5 Vulnerabilities
External imbalances and fiscal vulnerabilities are elevated in the region.
Short-term financing needs exceed reserves in most countries, particularly
among commodity importers.
B. External debt, 2016 A. External financing needs, 2016
D. Fraction of countries with fiscal
deficit
C. Fraction of countries with current
account deficit
Sources: Haver Analytics, International Monetary Fund, World Bank.
A. External financing needs are defined as amount of external debt repayment, within one year which
includes the short-term and long-term debt, plus current account deficit over foreign reserves.
Number in red (537.1) indicates maximum external financing need in percent of foreign reserves
among commodity exporters.
C.D. Data is for all EMDE European and Central Asia countries whose data are available.
0
10
20
30
0
50
100
150
Com
mod
ityexport
ers
Com
mod
ityim
po
rters
Com
mod
ityexport
ers
Com
mod
ityim
po
rters
External debt Short-term debt (RHS)
Range MedianPercent of GDP Percent of total
0
20
40
60
80
100
2012 2014 2016
Surplus DeficitPercent of total
0
20
40
60
80
100
2012 2014 2016
Surplus DeficitPercent of total
0
50
100
150
200
250
300
Commodityexporters
Commodityimporters
Range MedianPercent of foreign reserves
537.1

EUROPE AND CENTRAL ASIA GLOBAL ECONOMIC PROSPECTS | JANUARY 2017 105
established two separately managed wealth funds, one to facilitate macroeconomic stabilization, and the other to fund long term pension obligations.
Structural reforms
Enhancing productive investment. A sustained recovery in the region requires strengthening investment (Box 2.2.1, Chapter 3; World Bank 2015d). However, a legacy of financial imbalances weighs on investment growth. Policies that boost private investment, encourage more efficient use of public resources, and effective public-private partnerships (PPP) will be critical for recovery. These include reforms to deepen capital markets and strengthen banking systems, such as through faster and more effective insolvency procedures. Improved coordination and deployment of existing regional and global investment initiatives and funds, including EU structural funds, would be useful.
Diversification. Hydrocarbons account for more than 70 percent of goods exports in many countries in the eastern part of the region (Azerbaijan, Kazakhstan, Russia, Turkmenistan). Diversification, which is associated with higher growth and lower output volatility, should rank high among policy priorities (Papageorgiou and Spatafora 2012; Cavalcanti et al. 2015). The use of revenues from natural resources to build up infrastructure, advance education, and improve institutions can promote diversification (Gill et al. 2014). International experience suggests that reducing commodity dependence can be successful over time when the government makes an adequate commitment of time and political effort (Indonesia, Malaysia, Mexico; Cherif, Hasanov, and Zhu 2016).
Labor markets. Many countries in the western part of the region continue to suffer from double-digit unemployment rates. This problem is particularly pronounced in the Western Bal-kans. Labor market reforms, combined with reforms to improve the business environment, would boost productivity and job creation (Kovtun et al. 2014). Reforms would enable existing firms to grow, become more productive, or exit the market. They would also tap into
entrepreneurship potential, so that new firms emerge and succeed quickly and inexpensively.
Labor market initiatives could involve education and training, incentives to be mobile, and regulations eliminating barriers to minorities, women, youth and older workers. (World Bank 2014b). Better quality education and closer alignment with employers’ needs can reduce the skill mismatches that contribute to underemployment (Sondergaard and Murthi 2012). Countries could improve their producti-vity by lowering barriers to service sector liberalization and by reducing administrative burdens on businesses.
FIGURE 2.2.6 Policy challenges
GDP growth in the ECA region is the slowest and most volatile among
EMDE regions after the global financial crisis in 2008-09. Low government
effectiveness in some sub-regions and high trade concentration in oil
exporters can be contributing factors to the high volatility. In some
economies, in Western Balkan in particular, lowering high unemployment
rates is one of the key challenges.
B. Government effectiveness, 2015 A. Growth level and volatility, 2008-15
D. Unemployment rate, 2015 C. Trade concentration
Sources: Haver Analytics, United Nations Conference on Trade and Development, World Bank.
A. Mean and standard deviation of annual regional GDP growth rate from 2008 to 2015. EAP = East
Asia and Pacific, ECA = Europe and Central Asia, LAC = Latin America and the Caribbean, MNA =
Middle East and North Africa, SAR = South Asia, SSA = Sub-Saharan Africa. Regional GDP only
includes the EMDE countries.
B. The indicator reflects perceptions of the quality of public services, the quality of the civil service
and the degree of its independence from political pressures, the quality of policy formulation and
implementation, and the credibility of the government's commitment to such policies. The data is for
2015. The index ranges from -2.5 (weak) to 2.5 (strong) governance performance.
C. The trade concentration index is a measure of the degree of product concentration of exports from
UNCTAD. An index value closer to 1 indicates higher concentration. EMDE 2014 is the average value
weighted by real GDP for the emerging and developing economies in 2014.
D. Data is for 2015.
-1.0
-0.5
0.0
0.5
1.0
CentralEurope
WesternBalkans
SouthCaucasus
EasternEurope
CentralAsia
RangeMedian
Index
0.0
0.2
0.4
0.6
0.8
1.0
Azerb
aija
n
Ka
zakhsta
n
Ru
ssia
Turk
ey
Pola
nd
2005 2014 EMDE2014Index
0
5
10
15
20
25
30
Ea
ste
rnE
uro
pe
Cen
tral
Euro
pe
Cen
tral
Asia
So
uth
Cauca
sus
Weste
rnB
alk
ans
Range MedianPercent of labor force
EAP
ECA
LACMNA
SAR
SSA
0
1
2
3
4
5
6
7
8
9
0 1 2 3 4Standard deviation of growth
Average growth in percent

CHAPTER 2 .2 GLOBAL ECONOMIC PROSPECTS | JANUARY 2017 106
2014 2015 2016 2017 2018 2019 2015 2016 2017 2018
Estimates Projections (percentage point difference
from June 2016 projections)
EMDE ECA, GDPa 2.3 0.5 1.2 2.4 2.8 2.9 0.6 0.0 -0.1 0.0
EMDE ECA, GDP excl. Russia 3.4 3.5 2.4 3.0 3.4 3.6 1.0 -0.5 -0.2 0.0
(Average including countries with full national accounts and balance of payments data only)b
EMDE ECA, GDPb 2.3 0.5 1.2 2.4 2.7 2.9 0.7 0.0 0.0 -0.1
GDP per capita (U.S. dollars) 1.8 0.1 0.9 2.1 2.6 2.7 0.6 0.0 -0.1 0.0
PPP GDP 2.1 0.2 1.1 2.4 2.8 2.9 0.5 0.0 0.0 0.0
Private consumption 1.3 -2.8 2.0 2.6 3.0 3.0 0.2 0.1 0.1 0.0
Public consumption 2.2 1.1 0.7 1.2 1.4 1.4 -0.5 -0.5 0.0 -0.1
Fixed investment 2.0 0.4 0.3 4.6 6.7 5.4 2.5 1.3 0.2 1.0
Exports, GNFSc 2.9 3.0 2.3 3.1 3.4 3.6 0.2 -0.8 -0.5 -0.2
Imports, GNFSc -0.8 -6.2 3.3 4.7 6.2 5.0 0.8 0.0 0.0 -0.1
Net exports, contribution to
growth 1.2 2.9 -0.2 -0.3 -0.7 -0.3 -0.3 -0.3 -0.1 0.0
Memo items: GDP
Central Europed 3.0 3.6 2.9 3.1 3.2 3.2 0.2 -0.5 -0.2 0.0
Western Balkanse 0.5 2.3 2.7 3.2 3.6 3.7 0.0 0.0 0.1 -0.1
Eastern Europef -3.8 -7.7 -0.1 1.3 2.5 2.6 0.1 0.2 0.1 0.2
South Caucasusg 2.7 1.6 -1.2 2.1 3.0 2.9 0.0 -0.7 0.4 0.8
Central Asiah 5.5 3.1 2.8 3.8 4.8 5.1 0.1 0.7 0.4 0.2
Russia 0.7 -3.7 -0.6 1.5 1.7 1.8 0.0 0.6 0.1 -0.1
Turkey 5.2 6.1 2.5 3.0 3.5 3.7 2.1 -1.0 -0.5 -0.1
Poland 3.3 3.9 2.5 3.1 3.3 3.4 0.3 -1.2 -0.4 -0.2
TABLE 2.2.1 Europe and Central Asia forecast summary
(Real GDP growth at market prices in percent, unless indicated otherwise)
Source: World Bank.
World Bank forecasts are frequently updated based on new information and changing (global) circumstances. Consequently, projections presented here may differ from those contained in
other Bank documents, even if basic assessments of countries’ prospects do not differ at any given moment in time.
a. EMDE refers to emerging market and developing economy. GDP at market prices and expenditure components are measured in constant 2010 U.S. dollars.
b. Sub-region aggregate excludes Bosnia and Herzegovina, Kosovo, Montenegro, Serbia, Tajikistan, and Turkmenistan, for which data limitations prevent the forecasting of GDP
components.
c. Exports and imports of goods and non-factor services (GNFS).
d. Includes Bulgaria, Croatia, Hungary, Poland, and Romania.
e. Includes Albania, Bosnia and Herzegovina, Kosovo, FYR Macedonia, Montenegro, and Serbia.
f. Includes Belarus, Moldova, and Ukraine.
g. Includes Armenia, Azerbaijan, and Georgia.
h. Includes Kazakhstan, Kyrgyz Republic, Tajikistan, Turkmenistan, and Uzbekistan.
For additional information, please see www.worldbank.org/gep.

EUROPE AND CENTRAL ASIA GLOBAL ECONOMIC PROSPECTS | JANUARY 2017 107
2014 2015 2016 2017 2018 2019 2015 2016 2017 2018
Estimates Projections
Albania 1.8 2.6 3.2 3.5 3.5 3.7 0.2 0.0 0.0 -0.3
Armenia 3.6 3.0 2.4 2.7 3.0 3.2 0.0 0.5 -0.1 0.1
Azerbaijan 2.0 1.1 -3.0 1.2 2.3 2.3 0.0 -1.1 0.5 1.0
Belarus 1.7 -3.9 -2.5 -0.5 1.3 1.4 0.0 0.5 0.5 1.0
Bosnia and Herzegovina 1.1 3.0 2.8 3.2 3.7 3.9 -0.2 0.2 0.1 0.2
Bulgaria 1.3 3.6 3.5 3.2 3.1 3.1 0.6 1.3 0.5 0.1
Croatia -0.4 1.6 2.7 2.5 2.5 2.6 0.0 0.8 0.5 0.1
Georgia 4.6 2.8 3.4 5.2 5.3 5.0 0.0 0.4 0.7 0.3
Hungary 4.0 3.1 2.1 2.6 2.8 2.7 0.2 -0.5 0.2 0.5
Kazakhstan 4.2 1.2 0.9 2.2 3.7 4.0 0.0 0.8 0.3 0.0
Kosovo 1.2 4.1 3.6 3.9 3.7 3.6 0.5 0.0 -0.1 -0.4
Kyrgyz Republic 4.0 3.5 2.2 3.0 3.7 4.9 0.0 -1.2 -0.1 -0.4
Macedonia, FYR 3.6 3.8 2.0 3.3 3.7 4.0 0.1 -1.7 -0.7 -0.3
Moldova 4.8 -0.5 2.2 2.8 3.3 3.7 0.0 1.7 -1.2 -1.2
Montenegro 1.8 3.4 3.2 3.6 3.0 3.0 0.0 -0.5 0.5 0.0
Poland 3.3 3.9 2.5 3.1 3.3 3.4 0.3 -1.2 -0.4 -0.2
Romania 3.1 3.7 4.7 3.7 3.4 3.2 0.0 0.7 0.0 0.0
Russia 0.7 -3.7 -0.6 1.5 1.7 1.8 0.0 0.6 0.1 -0.1
Serbia -1.8 0.8 2.5 2.8 3.5 3.5 0.0 0.7 0.5 0.0
Tajikistan 6.7 6.0 6.0 4.5 5.2 4.5 1.8 2.0 -0.3 -0.1
Turkey 5.2 6.1 2.5 3.0 3.5 3.7 2.1 -1.0 -0.5 -0.1
Turkmenistan 10.3 6.5 6.2 6.5 6.8 7.0 0.0 1.2 1.5 1.8
Ukraine -6.6 -9.9 1.0 2.0 3.0 3.0 0.0 0.0 0.0 0.0
Uzbekistan 8.1 8.0 7.3 7.4 7.4 7.4 0.0 0.0 0.2 0.2
(percentage point difference
from June 2016 projections)
TABLE 2.2.2 Europe and Central Asia country forecastsa
(Real GDP growth at market prices in percent, unless indicated otherwise)
Source: World Bank.
World Bank forecasts are frequently updated based on new information and changing (global) circumstances. Consequently, projections presented here may differ from those contained in
other Bank documents, even if basic assessments of countries’ prospects do not significantly differ at any given moment in time.
a. GDP at market prices and expenditure components are measured in constant 2010 U.S. dollars.
For additional information, please see www.worldbank.org/gep.

CHAPTER 2 .2 GLOBAL ECONOMIC PROSPECTS | JANUARY 2017 108
BOX 2.2.1 Recent investment slowdown: Europe and Central Asia
Investment growth in the region declined from 10.2 percent in 2011 to 0.4 percent in 2015. The slowdown was initially concentrated in Central Europe and reflected mainly the spillovers from the Euro Area’s debt crisis of 2011-12. A recovery of investment growth in Central and South-Eastern Europe started in 2014, but this was more than offset by investment contractions in Russia and other oil-exporting economies. Policy uncertainties and weak banking systems will likely limit regional investment growth in the near-term. The investment slowdown has come at a time when investment needs are sizable. In many commodity-importing economies, years of underinvestment have left substantial infrastructure deficits. Investment is key to boosting productivity and creating hospitable conditions for new growth sectors. However, efforts to address under-investment are likely to be constrained by the need for sustainable financing.
Europe and Central Asia (ECA) accounted for 5 percent of global investment during 2010-15. Investment growth in the region decreased sharply, from a 10.2 percent in 2010 to 0.4 percent in 2015. Partial data for 2016 suggest that investment is bottoming out in 2016, led by easing investment contractions in Russia and Ukraine. However, regional investment growth remains well below its long-term (1995-2008) average of 6.5 percent a year.
This box discusses the following questions.
• How has investment growth in the region evolved?
• What are the region’s current and prospective investment needs?
• Which policies can help meet these needs?
The slowdown in investment growth in the ECA region was initially concentrated in the Central Europe in the aftermath of the Euro Area’s debt crisis of 2011-12 and associated recession. The post-crisis recovery in Central Europe was weak, reflecting impaired banking systems and corporate sectors in the aftermath of the Euro Area crisis. Lingering concerns about armed conflict and related geopolitical tensions (Russia, Ukraine), policy uncertainty in several major regional economies, and adjustment to the terms-of-trade shock in energy exporters (Russia, Azerbaijan, Kazakhstan) have weighed on regional investment growth.
Meanwhile, current and prospective investment needs are sizable. Investment and major reforms are needed to increase productivity and set the stage for a sustained growth recovery. However, efforts to address under-investment are likely to be constrained by the need for sustainable financing.
How has investment growth in the region evolved?
He recent investment growth slowdown was sharp and broad based. In 2015, investment growth remained below its long-term averages in three-quarters of the countries in the region, and was negative in one-quarter of them, including Belarus, Russia, and Ukraine (Figure 2.2.1.1). Between 2010 and 2015, investment growth trends differed markedly between commodity importers, which are located in Central, Eastern, and Southeastern Europe, and commodity exporters, mainly Russia and the economies of Central Asia.
The overall slowdown was partly a correction from historically high investment growth prior to the global financial crisis. Pre-crisis, large capital inflows and credit booms fueled investment growth in the western part of the region as financial systems became more integrated with those in the Euro Area. Proximity to, and rapid convergence with, the Euro Area appeared to promise bright growth prospects as regional labor and product markets became increasingly intertwined (World Bank 2010). In the eastern part of the region, pre-crisis investment growth was buoyed by resource development encouraged by high global commodity prices.
In general, in commodity-importing EMDEs, investment financing became difficult to obtain from domestic banking sectors that were still healing from the crisis and pre-crisis credit booms (Hungary, Moldova, Serbia). The 2012-13 debt crisis and subsequent weak growth prospects in the Euro Area weighed on investor sentiment (Chapter 3). Weak trade growth and lower capital inflows reduced prospects for strong investment returns and increased financing costs. Net capital inflows exceeded 10 percent of GDP before the crisis but have been negative since 2013 in the Central and Southeastern Europe. Large foreign currency-denominated debt amplified the damage to the banking sector (EBRD 2015a). In some countries, this was compounded by policy uncertainty and lack of public
Note: This section was prepared by Yoki Okawa and Ekaterine Vashakmadze. Research assistance was provided by Shituo Sun, Trang Thi Thuy Nguyen, and Liwei Liu.

EUROPE AND CENTRAL ASIA GLOBAL ECONOMIC PROSPECTS | JANUARY 2017 109
BOX 2.2.1 Recent investment slowdown: Europe and Central Asia (continued)
A. Investment growth by region B. Five-year-ahead investment growth
expectations
C. Share of ECA economies with weak
investment growth
D. Foreign direct investment inflows E. Terms of trade change F. ICRG index of political stability
FIGURE 2.2.1.1 Investment growth slowdown in Europe and Central Asia, 2010-15
Regional investment growth declined from 10.2 percent in 2011 to 0.4 percent in 2015. Initially, the decline was concentrated
in the western part of the region and reflected spillovers from the Euro Area crisis. The recovery of investment growth in the
western parts of the region in 2014-15 was outweighed by a contraction in oil-exporting economies in the eastern parts of the
region, which suffered a major terms-of-trade shock as a result of the oil price drop. Recession in Russia was exacerbated by
international sanctions.
Sources: Consensus Forecasts, EBRD (2015a), Eurostat, Haver Analytics, World Bank.
A.C. Investment growth rates are weighted averages of gross fixed capital formation growth rates in the public and private sectors, respectively, in constant 2005 U.S.
dollars.
A. The eastern part of the region comprises Eastern Europe (Belarus, Moldova, and Ukraine), South Caucasus (Armenia, Azerbaijan and Georgia), Central Asia
(Kazakhstan, Kyrgyz Republic, Tajikistan, Turkmenistan, and Uzbekistan) and Russia. The western part of the region includes Central Europe (Bulgaria, Croatia, Hungary,
Poland and Romania) and the Western Balkans (Albania, Bosnia and Herzegovina, Kosovo, FYR Macedonia, Montenegro, and Serbia), and Turkey.
B. Five-year ahead Consensus Forecasts as of the latest available month in the year denoted. C. Share of ECA economies with investment growth below its long-term average or negative.
D. MNE = Montenegro, TKM = Turkmenistan, GEO = Georgia, ALB = Albania, AZE = Azerbaijan, SRB = Serbia, KSV = Kosovo, BGR = Bulgaria, MDA = Moldova, Republic
of, UKR = Ukraine, TJK = Tajikistan, BLR = Belarus, TUR = Turkey, KAZ = Kazakhstan, ROM = Romania, MKD = FYR Macedonia, ARM = Armenia, UZB = Uzbekistan, BIH
= Bosnia and Herzegovina, RUS = Russia.
E. Investment-weighted average. A decline denotes a terms of trade deterioration.
F. ICRG is the International Country Risk Guide, an investment-weighted average of political stability produced by the PRS Group. A higher index denotes greater political
stability.
investment (Figure 2.2.1.2). Recovery has been gradual since 2013, despite support from accommodative monetary and fiscal policies in some countries, and sharply lower oil prices that lifted business confidence and real incomes.
In commodity-exporting EMDEs, the global financial crisis-related fiscal stimulus supported double-digit investment growth in 2010. Investment growth remained robust until 2013, but slowed sharply once oil prices started sliding in
2014. Since mid-2014, investment has contracted year-on-year in every quarter, weighed down by the following factors: the unfolding conflict in Ukraine, intermittent border tensions in the Caucasus, international sanctions that heavily restricted access to finance in Russia, a severe terms-of-trade shock that hit energy exporters (Azerbaijan, Kazakhstan, Russia), and contracting public sector investment. Neighboring countries suffered from spillover effects, including weaker trade, remittances, and foreign direct investment (World Bank 2016h).
-5
0
5
10
15
20
20
10
20
11
20
12
20
13
20
14
20
15
20
10
20
11
20
12
20
13
20
14
20
15
20
10
20
11
20
12
20
13
20
14
20
15
20
10
20
11
20
12
20
13
20
14
20
15
WesternRegion
EasternRegion
Overall
Europe and Central Asia EMDE
1995-2008 avg 2003-08 avgPercent
0
1
2
3
4
5
6
7
8
9
2010 2011 2012 2013 2014 2015
Commodity exportersCommodity importers
Percent
0
25
50
75
2010 2011 2012 2013 2014 2015
Below long-term average ContractingPercent
-6
-1
4
9
14
19
MN
ET
KM
GE
OA
LB
AZ
ES
RB
KS
VB
GR
MD
AU
KR
TJK
BL
RT
UR
KA
ZR
OM
MK
DA
RM
UZ
BB
IHR
US
2015 Difference from 1990-2014 average
Percent of GDP
-30
-20
-10
0
10
20
30
2010 2011 2012 2013 2014 2015
Commodity exporters
Commodity importers
Percent
50
52
54
56
58
60
62
64
66
68
2010 2011 2012 2013 2014 2015
Commodity exporters
Commodity importers
Index

CHAPTER 2 .2 GLOBAL ECONOMIC PROSPECTS | JANUARY 2017 110
What are current and prospective investment needs?
Infrastructure needs are sizable across the ECA region. The additional investment needed to reach the investment levels of economies at similar stages of development has been estimated at 1.3 percent of GDP per year, on average
(EBRD 2015a; Figure 2.2.1.3).1 Investment priorities vary widely across the region.
• Russia has implemented important upgrades in certain types of infrastructure, especially railways, mobile-cellular telephone networks, and airlines. However, the overall quality of infrastructure lags many EMDEs at similar levels of development. Roads, port and air transport infrastructure, and electricity supply all need considerable upgrading. The energy extraction sector requires an estimated $1.9-$3.3 trillion in investment between 2014 and 2035, while the power generation sector requires $600 billion (International Energy Agency 2014; Russian Investment Agency 2015).
• Infrastructure in Turkey exceeds average EMDE quality, but it has come under pressure as strife in neighboring countries has brought waves of immigrants: Turkey currently accommodates about 56 percent of all registered Syrian refugees. Annual energy investments of $12 billion are required to meet the country’s development goals, to diversify the sector, and to help narrow Turkey’s current account deficit by reducing energy imports (Winrow 2015; Republic of Turkey, Ministry of Energy and Natural Resources 2014). Turkey plans to increase renewable sources of energy, including nuclear, and improve energy efficiency (EBRD 2015b). From 2014 to 2018, total infrastructure investment needs are estimated at $350 billion (EBRD 2015b).
• For landlocked Central Asia, developing and upgrading infrastructure are critical for connectivity and reducing dependence on extractive industries. Investment in the energy sector will help to improve electricity access, a major concern for business (ADB 2016). Waste water systems in rural areas are also underfunded.
• In other countries in the ECA region, port, road, and railway infrastructure needs improvement, and logistics infrastructure needs to be upgraded to foster trade and investment (Bosnia and Herzegovina, Bulgaria). Border bottlenecks should be addressed and customs infrastructure improved. Upgrading water supply and irrigation systems will enhance productivity in agriculture and reduce environmental degradation (Azerbaijan, Bosnia and Herzegovina, Serbia, Uzbekistan).
BOX 2.2.1 Recent investment slowdown: Europe and Central Asia (continued)
1In addition to 24 countries in ECA region, the estimate includes the Arab Republic of Egypt, Estonia, Jordan, Latvia, Lithuania, Mongolia, Morocco, the Slovak Republic, Slovenia, and Tunisia.
FIGURE 2.2.1.2 Investment decomposition,
2010-15
After the global financial crisis, public investment growth
slowed or turned negative across the region. In Central
Europe, the slowdown in investment was driven mainly
by weak manufacturing sector investment.
Sources: Haver Analytics, International Monetary Fund, World Bank.
A. Investment growth rates are growth rates of subgroup aggregated gross
fixed capital formation in constant 2010 U.S. dollars.
B. EU4 (Bulgaria, Hungary, Poland, Romania). Sectorial allocation of
investment is not available for other countries.
A. Contributions to investment growth
B. Contribution to investment in Central Europe
-8
-6
-4
-2
0
2
4
6
8
10
12
2010
2011
2012
2013
2014
2015
2010
2011
2012
2013
2014
2015
2010
2011
2012
2013
2014
2015
Commodity exportersexcl. Russia
Commodity importers Russia
Percentage points Public Private
0
50
100
150
200
20
01
20
02
20
03
20
04
20
05
20
06
20
07
20
08
20
09
20
10
20
11
20
12
20
13
20
14
20
15
Others Real estate ICT
Construction Manufacturing Agriculture
Billion EUR

EUROPE AND CENTRAL ASIA GLOBAL ECONOMIC PROSPECTS | JANUARY 2017 111
and literacy rates are high. On average, the ECA region scores above average among EMDE regions in several education and health indicators. Nevertheless, shortcomings remain. Levels of learning achievement are low in several countries, and socio-economic and ethnic disparities in education persist. Among the basic education indicators, regional gaps are most apparent for math and
BOX 2.2.1 Recent investment slowdown: Europe and Central Asia (continued)
FIGURE 2.2.1.3 Investment gaps and
projects
Amid sizable investment gaps across the region, large-
scale infrastructure investment projects are underway.
Sources: Central Asia Regional Economic Cooperation (CAREC),
European Investment Bank.
A. Range of different investment gap estimates for each region from EBRD
(2015a). EBRD countries includes Estonia, Latvia, Lithuania, the Slovak
Republic, Slovenia Mongolia, Egypt, Jordan, Morocco, Tunisia in addition to
24 countries in ECA region. Financing gap for Central Asia and the
Caucasus includes all infrastructure financing requirements that are not
covered by national governments. For Central Asia, the range is GDP
weighted average for Azerbaijan, Kazakhstan, Kyrgyz Republic, Mongolia,
Tajikistan, and Uzbekistan.
B. Total value of approved CAREC related projects in Azerbaijan,
Kazakhstan, Kyrgyz Republic, Mongolia, Pakistan, Tajikistan and
Uzbekistan.
A. Investment gaps
B. Projects in Central Asia
0
5
10
EB
RD
coun
trie
s
Ce
ntr
al E
uro
pe
and
th
e B
alti
c
So
uth
-easte
rnE
uro
pe
Easte
rn E
uro
pe
and t
he
Cau
casu
s
Tu
rke
y
Russi
a
Centr
al A
sia
Range
Percent of GDP
0
1
2
2013 2014 2015
Transport EnergyUSD,billions
Initiatives are already underway to improve infrastructure in the region:
• In Russia, for example, several hundred infrastructure projects were announced in the past five years, with more than half scheduled for completion by 2020. These projects are mostly in more densely populated western Russia. The largest allocations are for transport infrastructure (especially high-speed rail, and road and bridge construction). But there are also a large number of projects to improve the supply of utilities (electric power, gas, and water).
• Turkey has initiated several public-private partnership (PPP) projects, including the Caspian and Middle Eastern oil and gas pipeline and the $10.2 billion Istanbul Grand Airport. Countries in Central Asia—aspiring to become an overland transit and energy hub linking Chinese and European markets—has initiated investment projects in energy and transport sectors. In the energy sector, major projects include a pipeline from Turkmenistan to India, gas sector development in Uzbekistan, and hydroelectric power in Tajikistan. In the transport sector, key projects include highways in Kazakhstan, railroads linking Tajikistan and Kyrgyz Republic to China and the Islamic Republic of Iran, ports in Turkmenistan and Kazakhstan, and an airport in Kyrgyz Republic.
• In Central and South Eastern Europe, the investment pipeline largely reflects EU funding to further integrate the EU member states of the region with Western European countries.
Climate adaptation and energy efficiency. ECA is an energy-intensive region that relies heavily on non-renewable energy (Figure 2.2.1.4). Belarus, Bosnia and Herzegovina, and Turkey are implementing policy reforms (such as cost-based energy pricing) and investments in both public infrastructure and private industry, including renewable energy and energy efficiency, in partnership with the World Bank. Efforts to adapt to climate change include improved water resource management (flood protection, water loss reduction, irrigation efficiency) in Kazakhstan; climate-smart agriculture (switching to more resilient crops) in Tajikistan; and better weather forecasting and climate change monitoring in Russia.
Education and health. The region has made significant advances in the area of human development, including reductions in child mortality rates. Many countries in the region have achieved universal primary enrollment and gender parity in both primary and secondary education,

CHAPTER 2 .2 GLOBAL ECONOMIC PROSPECTS | JANUARY 2017 112
FIGURE 2.2.1.4 Infrastructure indicator
The quality of infrastructure in the most of the region is substantially below OECD average. Investment gaps remain large in
transportation and energy. Port container traffic is limited, highlighting the region’s reliance on road, air, and rail transport. The
quality of air and road transport infrastructure remains well below OECD averages in most of the region. The region is energy
intensive and heavily reliant on non-renewable energy.
Sources: EBRD (2015a), Haver Analytics, World Bank, World Economic Forum.
A. The score is overall quality of infrastructure. The score from 1 to 7 (best). Investment is the share of fixed capital formation as a percent of GDP. OECD average is the
average investment share of OECD countries from 1990 to latest.
B. Regional sum of container port traffic (TEU: 20 foot equivalent) per current USD GDP in millions in 2014.
C.D. The score is from 1 to 7 (best). The OECD and EMDE average are the simple average of all the countries in the respective subgroupings.
E. Regional aggregated number. Data are in 2014 or latest available data. GDP data are in constant 2011 “international dollars.”
F. Share of renewable energy consumption as percent of total final energy consumption in 2012. EMDE averages are the simple average of all the countries in the re-
spective subgroupings.
A. Overall infrastructure quality B. Port container traffic C. Quality of air transport
D. Quality of roads
BOX 2.2.1 Recent investment slowdown: Europe and Central Asia (continued)
science education. The region scores well below the EMDE average on attracting and retaining talent (Figure 2.2.1.5). Building a highly skilled workforce will require improving the quality of education, investing in on-the-job training, and using talent more effectively.
Which policies can help address investment needs?
Unmet investment needs limit growth in the region, along with governance, financial, and labor market obstacles (World Bank 2015e-h; World Bank and Vietnam 2016; World Bank 2016h; EBDR 2015a). While policy priorities depend on country circumstances, appropriate cyclical and
structural policies are needed in all cases to raise investment growth (Chapter 3). Fiscal policy could help most directly by expanding public investment while monetary policy could boost activity by lowering financing costs. Structural reforms could address factors holding back private investment, including by boosting productivity and aggregate growth prospects and improving the business climate.
Many EMDEs in the ECA region remain under pressure to consolidate their fiscal positions to reduce high debt-to-GDP ratios and ensure long-term fiscal sustainability (Georgia, Hungary, Chapter 2). This constrains their ability to finance public investment and places a premium
0
1
2
3
4
5
6
Ea
ste
rnE
uro
pe
Ce
ntr
al
Eu
rop
e
Ce
ntr
al
Asia
Sou
thC
au
casus
We
ste
rnB
alk
ans
Range MedianScore
2
3
4
5
6
Ea
ste
rnE
uro
pe
Ce
ntr
al
Eu
rop
e
Ce
ntr
al
Asia
Sou
thC
au
casus
We
ste
rnB
alk
ans
Range Median OECD medianScore
0
5
10
15
20
Ea
st A
sia
&P
acifi
c
Mid
dle
East
&N
. A
fric
a
La
tin A
meri
ca
& C
arib
be
an
So
uth
Asia
Sub
-Sa
hara
nA
fric
a
Euro
pe
&C
en
tra
l A
sia
Container traffic per GDP
2
3
4
5
6
Ea
ste
rnE
uro
pe
Ce
ntr
al
Eu
rop
e
Ce
ntr
al
Asia
Sou
thC
au
casus
We
ste
rnB
alk
ans
Range Median OECD medianScore
E. Energy use intensity F. Share of renewable energy
0
50
100
150
200
Sub
-Sa
hara
nA
fric
a
Ea
st A
sia
&P
acifi
c
Euro
pe
&C
en
tra
l A
sia
OE
CD
Mid
dle
East
&N
. A
fric
a
So
uth
Asia
La
tin A
meri
ca
& C
arib
be
an
Energy use per GDP
0
10
20
30
40
50
60
70
ECAenergy exporter
ECAenergy importer
Range
Median
EMDE median (energy exporter)
EMDE median (energy importer)
Percent

EUROPE AND CENTRAL ASIA GLOBAL ECONOMIC PROSPECTS | JANUARY 2017 113
BOX 2.2.1 Recent investment slowdown: Europe and Central Asia (continued)
FIGURE 2.2.1.5 Human development indicators
Health and educational expenditure is highest among EMDE region and close to the OECD average. The region made
significant advances in the area of human development. Nevertheless, important shortcomings remain. Among the basic
education indicators, the region scores below the OECD average in math and science outcomes. The region also lags behind
both the OECD and the EMDE average in attracting and retaining talent.
Sources: Haver Analytics, World Bank, World Economic Forum.
A. Blue bars denote range of unweighted regional averages across EMDE regions. Health expenditure per capita in purchasing power parity terms, unweighted averages
of 199 EMDEs, 34 AEs, and 19 ECA economies. Access to improved sanitation facilities (in percent of population), unweighted averages for 150 EMDEs, 33 AEs, and 22
ECA economies. Access to improved water sources (in percent of population), unweighted averages for 148 EMDEs, 34 AEs, and 22 ECA economies. Latest available
data available during 2011-15.
B. Blue bars denote range of unweighted regional averages across EMDE regions. Government expenditure per primary student (in percent of per capita income), un-
weighted averages of 87 EMDEs, 32 AEs, and 10 ECA economies. Pupil-teacher ratio in primary education (headcount basis), unweighted averages for 165 EMDEs, 31
AEs, and 20 ECA economies. Latest available data available during 2011-15.
C.D. The score is from 1 to 7 (best). The OECD and EMDE average are the simple averages of all the countries in the respective subgroupings.
A. Selected health care indicators B. Selected education indicators
C. Math and science outcomes D. Attracting and retaining talent
0
20
40
60
80
100
120
0
1000
2000
3000
4000
5000
Health expenditure(LHS)
Improved sanitation(RHS)
Improved watersource (RHS)
Per capita
Range AE EMDE ECA
Percent of population
0
5
10
15
20
25
30
35
40
45
Government expenditure Pupil-teacher ratio
Percent of per capita income, ratio
Range AE EMDEs ECA
0
1
2
3
4
5
6
Ukra
ine
Alb
ania
Cro
atia
Arm
enia
Se
rbia
Ru
ssia
Pola
nd
Mo
nte
ne
gro
Ka
zakhsta
n
Ma
cedo
nia
, F
YR
Mo
ldo
va
Bu
lgari
a
Tajik
ista
n
Azerb
aija
n
Hu
ng
ary
Bo
snia
& H
erz
.
Geo
rgia
Turk
ey
Kyrg
yz
Rep
ublic
2016-2017 OECD averageScore
0
1
2
3
4
5
Azerb
aija
n
Tajik
ista
n
Ka
zakhsta
n
Ru
ssia
Ukra
ine
Arm
enia
Geo
rgia
Turk
ey
Bu
lgari
a
Mo
nte
ne
gro
Pola
nd
Alb
ania
Kyrg
yz
Rep
ublic
Hu
ng
ary
Ma
cedo
nia
, F
YR
Cro
atia
Bo
snia
& H
erz
.
Mo
ldo
va
Serb
ia
2016-2017 OECD averageScore
on reforms that encourage private investment. Only a few regional economies can tap debt markets to finance infrastructure, while weak domestic banking systems and underdeveloped capital markets restrict the ability of governments to borrow domestically.
With weak growth, limited fiscal resources, and net capital outflows, the gap between infrastructure needs and the
ability of governments to meet those needs may widen. This places a premium on measures to improve investment efficiency and to obtain funding from multilateral sources or the private sector.
Investment efficiency. Effective public investments can meet needs with less cost (Dabla-Norris et. al. 2012), but regional institutional capacities fall behind the standards in

CHAPTER 2 .2 GLOBAL ECONOMIC PROSPECTS | JANUARY 2017 114
BOX 2.2.1 Recent investment slowdown: Europe and Central Asia (continued)
FIGURE 2.2.1.6 Institutional quality
Various measures of institutional efficiency in the ECA
region are below the advanced-economy average. The
western part of the region performs better than the
eastern part on every measure. Governance and stability
indicators in the eastern part of the region are often
worse than the EMDE average.
Source: World Bank.
A.B. The blue bars mark the range. EMDE is Emerging Market and
Developing Economies. ECA stands for the Europe and Central Asia. The
eastern part of the region comprises Eastern Europe (Belarus, Moldova, and
Ukraine), South Caucasus (Armenia, Azerbaijan and Georgia), Central Asia
(Kazakhstan, Kyrgyz Republic, Tajikistan, Turkmenistan, and Uzbekistan)
and Russia. The western part of the region includes Central Europe
(Bulgaria, Croatia, Hungary, Poland and Romania) and the Western Balkans
(Albania, Bosnia and Herzegovina, Kosovo, FYR Macedonia, Montenegro,
and Serbia), and Turkey. Scores range from 0 (not efficient) to 5 (efficient).
Data from 2015 or latest available data.
A. Government and policy efficiency
B. Governance and stability
advanced economies in this area (Figure 2.2.1.6). The eastern part of the ECA region ranks particularly low in relevant measures, including social stability, government effectiveness, and corruption. The efficiency of investments can be enhanced through a strategic, rigorous and transparent project selection mechanism and through strong institutions able to fund, manage, execute and monitor project implementation (Chapter 3).
Private funding. Policy efforts can be geared toward developing private funding sources for investment. Many countries still lack adequate frameworks for effective public-private partnerships (PPP), which can improve the effectiveness of public investment (Engel, Fischer, and Galetovic 2014). Capital market reforms can help channel domestic savings towards private investment (EBRD 2015a).
Multilateral funding sources. The region, especially the South Caucasus and Central Asia, will continue to depend on financial support from multilateral development institutions like the European Bank for Reconstruction and Development (EBRD), the Asian Development Bank (ADB), and the World Bank. Countries in Central Asia will likely be the largest beneficiaries of China’s “One Belt, One Road” (OBOR) initiative, due to their locations and natural resource abundance. EU structural funds will continue to play an important role in closing investment gaps in Central and South Eastern Europe.
0
1
2
3
4
5
Ad
vanced
EC
A W
est
EC
A E
ast
EM
DE
Ad
vanced
EC
A W
est
EC
A E
ast
EM
DE
Control of Corruption Political Stability and Safety
Range AverageIndex
0
1
2
3
4
5
Advanced
EC
A W
est
EC
A E
ast
EM
DE
Advanced
EC
A W
est
EC
A E
ast
EM
DE
Government Effectiveness Regulatory Quality
Range AverageIndex

Recent developments
Overview
Weighed down by depressed commodity prices, slowing global growth, and domestic challenges among its largest economies, economic activity in the Latin American and the Caribbean (LAC) region contracted for the second consecutive year in 2016—the first time this has happened since the debt crisis of the early 1980s (Figure 2.3.1). The contraction in regional output, estimated at 1.4 percent in 2016, was more than double that of the previous year. For the third successive year the region registered the lowest growth rate among the six EMDE regions.
South America, with a large share of major commodity exporters, saw GDP contract 2.8 percent in 2016, larger than the 1.9 percent contraction in 2015. In Mexico and Central America, growth slowed from 2.8 percent in 2015 to 2.3 percent, in line with the slowdown in the U.S. economy. The Caribbean economy
decelerated to 3.2 percent in 2016 after growing 3.4 percent in 2015.
Domestic economic challenges among the region’s largest economies were major factors behind the weakness in activity. Argentina and Brazil imple-mented tighter policies and reforms to reduce macroeconomic distortions. República Bolivariana de Venezuela suffered double-digit negative growth in 2016 due to a combination of persistent distortionary policies and low oil prices, which have led to severe economic imbalances.
The region also faces challenges stemming from international economic conditions. Despite some recent gains, commodity prices remain low relative to the immediate post-crisis years, contributing to the broad-based slowdown in economic activity across the region. Several countries experienced equity market turbulence and currency depreciation following the U.S. elections.
Financial sector
Through most of 2016, accommodative monetary policy in advanced economies encouraged inves-tors to seek out higher yields in EMDE assets. Investors’ sentiment toward the LAC region also improved thanks to the modest recovery in oil
Output in Latin America and the Caribbean is estimated to have contracted 1.4 percent in 2016, the second consecutive year of negative growth. This weakness was due to the combined effects of low commodity prices and domestic economic challenges in large economies. In South America, where a large share of countries are commodity exporters, GDP growth contracted 2.8 percent. Growth in Mexico and Central America slowed to 2.3 percent, while growth in the Caribbean decelerated to 3.2 percent. Regional growth is projected to recover, reaching 2.6 percent in 2019, as domestic constraints loosen and fiscal consolidation is completed. Downside risks to the outlook include rising policy uncertainty among advanced economies, a renewed slide in commodity prices, and weaker-than-expected activity among the region’s largest economies. A key policy challenge is to nurture the nascent and fragile recovery, particularly in South America, while completing the fiscal adjustment to lower commodity revenues.
Note: This section was prepared by Derek H. C. Chen and Dana Vorisek, with contributions from Lei Ye, Jongrim Ha, Hideaki Matsuoka, and Eung Ju Kim. Research assistance was provided by Liwei Liu.

CHAPTER 2 .3 GLOBAL ECONOMIC PROSPECTS | JANUARY 2017 116
FIGURE 2.3.1 Growth
Regional growth contracted for the second consecutive year in 2016—the
first multi-year recession in more than 30 years. The weakness is
underpinned by the severe contraction in South America, which has a
large share of major commodity exporters. The other two sub-regions—
Mexico and Central America and the Caribbean, which have closer links
with the United States—posted positive growth.
B. Regional and sub-regional growth A. LAC regional growth
Sources: Haver Analytics, World Bank.
Notes: Regional and sub-regional aggregates are presented as GDP-weighted averages.
e=estimated.
B. Regional and subregional country coverage is as in Table 2.3.1.
C. South America includes Argentina, Bolivia, Brazil, Chile, Colombia, Ecuador, Peru, Paraguay,
Uruguay, and República Bolivariana de Venezuela. Commodity price index is calculated as a
weighted average of the World Bank’s energy (60 percent) and non-energy (40 percent) commodity
indexes.
D. Mexico and Central America include Costa Rica, El Salvador, Guatemala, Honduras, Mexico,
Nicaragua, and Panama.
led by Argentina, which returned to the market with a $16.5 billion sovereign issue in April—the second-largest international bond sale ever by an EMDE. With prospects of policy change, Brazil issued $17.5 billion in the first nine months of 2016, despite the loss of its investment-grade credit rating. Some small countries (the Dominican Republic, Ecuador, Guatemala, Trinidad and Tobago, Uruguay) also took advantage of investor appetite and issued bonds. Jamaica went to the market in August to exchange $785 million high-coupon bonds coming due in 2017–19 for lower-cost bonds maturing in 2039. LAC bond spreads have declined by more than those of other regions, signaling improving investor confidence (Figure 2.3.2).
Similarly, equities across the region rallied in 2016. Stock indexes gained in Argentina, Brazil, Chile, Colombia, Mexico, and Peru, with Peru’s S&P Lima General Index rising more than 50 percent on improving investor confidence. Meanwhile, several currencies strengthened, led by the Brazilian real and the Colombian peso. Both the Argentine and Mexican peso depreciated, however, especially following the U.S. elections.1
The South American banking system is vulnerable to rising financing costs due to the downturn in the mining sector and soft general economic activity. In particular, the share of non-performing loans has increased (Figure 2.3.3).
Inflation and monetary policy
Regional consumer price inflation continued to edge up in 2016, with divergent paths among the sub-regions (Figure 2.3.4). In South America, rates remain elevated relative to inflation target bands, reflecting depreciated currencies and high food costs due to adverse weather conditions. Accordingly, South American central banks kept a tight monetary policy stance for most of 2016. In contrast, inflation continued to be benign among Central American and Caribbean economies, the vast majority of which are oil importers and have benefited from low oil prices.
1Coppola, Lagersborg, and Mustafaoglu (2016) find that the Argentine peso was overvalued by 39 percent before the 2015 exchange rate reunification.
D. Growth in Mexico, Central America,
and the United States
C. Commodity prices and growth in
South America
prices and stabilization of other commodity prices. Business-friendly and market-oriented govern-ments in Argentina and Brazil, and Argentina’s settlement with “holdout” creditors, also benefited sentiment. Also, LAC assets were trading at large discounts, making them attractive to investors. After two consecutive years of outflows, capital inflows to the region resumed in 2016, with rallies across various asset classes for most of the year, including bonds and equities.
After rising from a monthly average of $10.8 billion between January and October 2016, up from a monthly average of $5.5 billion in 2015, regional bond issuance plunged to $1.1 billion in November. The increase prior to November was
0
7
-4
-2
0
2
4
6
8
19
80
19
83
19
86
19
89
19
92
19
95
19
98
20
01
20
04
20
07
20
10
20
13
20
16
Multi-year recession Actual EstimatedPercent
-3
-1
1
3
5
LAC SouthAmerica
Mexicoand Central
America
Caribbean
2014 2015 2016ePercent
0
40
80
120
160
-4
-2
0
2
4
6
8
10
20
00Q
1
20
01Q
3
20
03Q
1
20
04Q
3
20
06Q
1
20
07Q
3
20
09Q
1
20
10Q
3
20
12Q
1
20
13Q
3
20
15Q
1
20
16Q
3
South America GDP growthCommodity price index (2010=100, RHS)
Percent, year-on-year
-6
-4
-2
0
2
4
6
8
200
0Q
1
200
1Q
3
200
3Q
1
200
4Q
3
200
6Q
1
200
7Q
3
200
9Q
1
201
0Q
3
201
2Q
1
201
3Q
3
201
5Q
1
201
6Q
3
Mexico and Central AmericaUnited States
Percent, year-on-year

LAT IN AMER ICA AND THE CAR IBBEAN GLOBAL ECONOMIC PROSPECTS | JANUARY 2017 117
Inflation in Brazil moved down through 2016, though exchange rate depreciation is keeping the cost of imports high. The central bank maintained the Selic policy rate at a 10-year high of 14.25 percent for 15 months, before making two rate cuts, in October and November. Inflation in Colombia has been boosted by higher food costs, reflecting supply problems caused by drought in 2015 and by a truckers’ strike in July 2016. The central bank has raised its policy interest rate 11 times since September 2015. In Argentina, the central bank announced the adoption of a formal inflation targeting regime, to begin in 2017, in order to bring inflation to the single digits by 2019. And in República Bolivariana de Venezuela, chronic monetization of the public sector deficit has caused an acceleration of prices toward hyperinflation.
In Central America and in the Caribbean, where inflation and growth have been low, central banks have mostly implemented accommodative monetary policies. Falling consumer prices in Costa Rica, for example, encouraged its central bank to keep its policy interest rate at a 10-year low. In Jamaica, inflation reached record lows of below 2 percent in the second half of 2016. Mexico was an exception in the sub-region, with its central bank tightening policy rates to stem the depreciation of the peso, most recently in mid-December. While inflation has been creeping up, it has remained well within the 2–4 percent target band.
Fiscal policy
Low commodity prices and weak economic activity have reduced fiscal revenues and increased pressure on fiscal balances and public debt levels across the region (Figure 2.3.5). Oil exporters—such as Colombia, Ecuador, Trinidad and Tobago, and República Bolivariana de Venezuela—have been particularly hard hit. Similarly, Central America has been affected by low agricultural and metal prices. Most countries have been undergoing fiscal consolidation—except for Chile and Peru, which have been implementing expansionary fiscal policies to support growth.
In several South American commodity-exporting economies, deficits have ballooned since 2013. Colombia’s deficit widened under the impact of depressed oil revenues, while higher interest payments have pushed up expenditures. With the sharp contraction in economic activity, Brazil’s overall deficit had been widening until recently.
FIGURE 2.3.2 Financial sector
Investor sentiment toward the region improved through much of 2016, in
part reflecting the installation of new and more business-friendly and
market-oriented governments in Argentina and Brazil. Bond issuance to
the region resumed, easing regional financial conditions, before plunging
in November. Several countries experienced equity market turbulence and
currency depreciation following the U.S. elections.
B. Major stock market indexes A. International bond issuance
Sources: Dealogic, Haver Analytics, J.P. Morgan, World Bank.
A. Data includes sovereign and corporate bond issuance. “Others” are Chile, Colombia, Costa Rica,
Dominican Republic, Ecuador, Guatemala, Jamaica, Panama, Paraguay, Peru, Trinidad and Tobago,
and Uruguay. 2016Q4 includes October and November data.
C.D. Last observation is December 15, 2016.
E. 2016 covers January 1, 2016 to December 19, 2016.
F. Last observation is November 2016.
D. Sovereign bond spreads C. Sovereign bond spreads
F. Real effective exchange rates E. Spot exchange rates against U.S.
dollar
0
10
20
30
40
50
20
15Q
1
20
15Q
2
20
15Q
3
20
15Q
4
20
16Q
1
20
16Q
2
20
16Q
3
20
16Q
4
Argentina Brazil
Mexico Others
U.S. dollar billions
-40
-20
0
20
40
60
80
Jan
-15
Ma
r-1
5
Ma
y-1
5
Jul-1
5
Sep-1
5
No
v-1
5
Jan
-16
Ma
r-1
6
Ma
y-1
6
Jul-1
6
Sep-1
6
No
v-1
6
Percent, year-on-year
Argentina Brazil Chile
Colombia Mexico Peru
0
100
200
300
400
500
600
700
Feb
-15
Ap
r-15
Jun
-15
Aug
-15
Oct
-15
Dec-1
5
Feb
-16
Ap
r-16
Jun
-16
Aug
-16
Oct
-16
Dec-1
6
Brazil Dominican RepublicColombia PeruMexico Chile
Basis points
0
1000
2000
3000
4000
5000
Feb-1
5
Ap
r-1
5
Jun
-15
Aug-1
5
Oct-
15
De
c-1
5
Feb-1
6
Ap
r-1
6
Jun
-16
Aug-1
6
Oct-
16
De
c-1
6
Belize Ecuador Venezuela, RBBasis points
-35
-25
-15
-5
5
15
25
Arg
en
tina
Me
xic
o
Co
sta
Ric
a
Dom
inic
an
Re
pu
blic
Pe
ru
Gua
tem
ala
Ch
ile
Colo
mb
ia
Bra
zil
2014 2015 2016Percent
-25
-15
-5
5
15
25M
exi
co
Arg
entina
Do
min
ican
Re
pu
blic
Pe
ru
Pa
ragu
ay
Ch
ile
Co
lom
bia
Uru
gu
ay
Bra
zil
2014 2015 YTD 2016
Percent change during period

CHAPTER 2 .3 GLOBAL ECONOMIC PROSPECTS | JANUARY 2017 118
FIGURE 2.3.3 Banking systems
Banking systems in South America have reported a rise in non-performing
loans, while capital ratios in Mexico and Central America have declined.
B. Capital adequacy: ratio of
regulatory tier 1 capital to risk-
weighted assets
A. Ratio of non-performing loans to
total gross loans
Sources: Haver Analytics, World Bank.
Note: Subregional aggregates are presented as GDP-weighted averages. South America includes
Argentina, Brazil, Chile, Colombia, Ecuador, Paraguay and Peru. Mexico and Central America
includes Costa Rica, El Salvador Guatemala, Honduras, Mexico, and Panama. Long-term average
2008Q1-2015Q4.
Budget deficits in Mexico and Central America have been shrinking. In Mexico, this reflects numerous expenditure cuts and the 2014 tax reform, which introduced new revenue sources. Several Caribbean economies are expected to see fiscal improvement in the medium term, on the basis of consolidation efforts. However, the overall sub-regional balance was weighed down by the sub-region’s two largest economies, the Dominican Republic and Trinidad and Tobago. Compared to an exceptional surplus in 2015, the Dominican Republic’s overall fiscal deficit widened in 2016 to around its post-financial cri-sis average. Despite numerous reforms over the years, revenue-generating capacity in the Dominican Republic remains weak, largely because of persistently high levels of informality, tax evasion, and existing tax exemptions. Trinidad and Tobago’s fiscal deficit widened on weak oil revenues.
External sector
A number of countries in the region (Mexico excepted) saw more robust export growth in 2016 than in 2015. Together with muted import demand due to the economic slowdown, the uptick in exports contributed a significant narrowing of current account deficits in 2016 (Figure 2.3.6). In South America, Peru saw an export surge of more than 8 percent in the first half of 2016, mainly reflecting a large increase in copper production. In Brazil, the still weak real lifted exports in the first half of 2016, sharply reducing the country’s current account deficit.
In Mexico, moderating demand from the United States weighed on export growth. Other Central American and Caribbean econo-mies saw accelerating exports, despite slowing U.S. demand. Costa Rica’s exports to the United States for January to August 2016 rose by 5 percent year-on-year. The current account balance for the Dominican Republic switched to a surplus in the first half of 2016 on strong receipts from remittances and tourism, and low oil prices.2
FIGURE 2.3.4 Inflation and monetary policy
Inflation remains elevated in South America but moderate in Mexico and
Central America and in the Caribbean, providing scope for monetary policy
accommodation in these two sub-regions.
B. Core inflation A. Consumer price inflation
Source: Haver Analytics, Central Bank News, World Bank.
Note: GDP-weighted averages. e = estimate.
A.B. 2015 data shows the simple average of monthly observations of year-on-year inflation from
January to December 2015. YTD 2016 shows the simple average from January 2016 to November
2016.
C. South America: Policy interest
rates D. Mexico and Central America:
Policy interest rates
2.0
2.5
3.0
3.5
4.0
20
14Q
1
20
14Q
2
20
14Q
3
20
14Q
4
20
15Q
1
20
15Q
2
20
15Q
3
20
15Q
4
20
16Q
1
20
16Q
2
South AmericaMexico and Central AmericaLong-term average: South AmericaLong-term average: Mexico and Central America
Percent
11
12
13
14
15
16
20
14Q
1
20
14Q
2
20
14Q
3
20
14Q
4
20
15Q
1
20
15Q
2
20
15Q
3
20
15Q
4
20
16Q
1
20
16Q
2
South AmericaMexico and Central AmericaLong-term average: South AmericaLong-term average: Mexico and Central America
Percent
-2
0
2
4
6
8
10
Bra
zil
Co
lom
bia
Para
gu
ay
Ch
ile
Peru
Gua
tem
ala
Jam
aic
a
Nic
ara
gua
Mexi
co
Do
min
ican
Re
pu
blic
Cost
a R
ica
Headline 2015Headline YTD 2016Upper & lower inflation targets
Percent, year-on-year
-2
2
6
10
Bra
zil
Colo
mbia
Para
guay
Chile
Peru
Guate
mala
Nic
ara
gua
Mexic
o
Dom
inic
an
Repub
lic
Costa
Ric
a
Core 2015 Core YTD 2016
Percent, year-on-year
0
4
8
12
16
0
2
4
6
8
10
Feb-1
4
Ma
y-1
4
Aug-1
4
No
v-1
4
Feb-1
5
Ma
y-1
5
Aug-1
5
No
v-1
5
Feb-1
6
Ma
y-1
6
Aug-1
6
No
v-1
6
Chile Colombia ParaguayPeru Brazil (RHS)
Percent
0
2
4
6
8
10
Feb-1
4
Ma
y-1
4
Aug-1
4
No
v-1
4
Feb-1
5
Ma
y-1
5
Aug-1
5
No
v-1
5
Feb-1
6
Ma
y-1
6
Aug-1
6
No
v-1
6
Percent MexicoCosta RicaDominican RepublicGuatemalaHonduras
2World Bank (2016i) analyzes the variations in export performance across countries by looking at differences in exchange rates and external demand.

LAT IN AMER ICA AND THE CAR IBBEAN GLOBAL ECONOMIC PROSPECTS | JANUARY 2017 119
Poverty
Poverty rates remain lower in South America than in Mexico, Central America, and the Caribbean. However, with unemployment rates stable or rising and real wages stagnating in 2016, poverty may have increased in South America (Figure 2.3.7). Kis threatens to reverse some of the poverty reduction achieved earlier in the decade. In contrast, poverty rates are still on the decline in the Mexico and Central America and the Caribbean sub-regions. A reduction in unemployment rates and higher real wages since 2013 underpin this improvement.
While there have been signiLcant gains in reducing poverty over the past decades, income inequality remains high relative to other emerging and developing regions. Eight of the ten most unequal countries in the world (as measured by Gini indexes) are in Latin America and the Caribbean (World Bank 2016j). While inequality in Central America declined notably in the most recently available data, it increased in some Southern Cone countries. Increasing growth in income or consumption expenditure of the poorest 40 percent of people in these highly unequal countries is key to further reducing poverty (World Bank 2016j).
Outlook
Regional output growth is projected to resume in 2017, and to rise steadily to 2.6 percent in 2019 (Figure 2.3.8). The improving outlook is largely driven by an envisaged return to positive growth in Brazil, the region’s largest economy.
The timing of the growth pickup in the region is expected to be different across the sub-regions. Growth in South America is assumed to bot- tom out in 2016 and then gain momentum from 2017, reaching 2.4 percent in 2019. In Mexico and Central America, growth is projected to begin accelerating in 2018, reaching 2.9 percent in 2019.
Global headwinds, such as policy uncertainty in the United States and subdued growth among other major trading partners, will weigh on
economies across the region, at least in the near term. However, commodity prices are projected to stabilize and to gradually recover, providing modest relief for regional commodity exporters with improved terms of trade and increased fiscal and export revenues.
Within the region, several countries are implementing fiscal consolidation and reforms. As these are completed, economies will be on a better fiscal footing, with space for urgently needed public investment projects to promote growth in the medium term. Economic activity will be supported by exports, which are still benefiting from a competitive edge derived from prior depreciations. These competitiveness effects will
FIGURE 2.3.5 Fiscal policy
Low commodity prices and slow economic growth have led to lower fiscal
revenues and greater pressures on fiscal balances and debt levels across
the region. Despite fiscal consolidation in a number of countries, deficits
have continued to rise in South America and the Caribbean, and debt is
rising in several South American countries.
B. Government structural balance A. Overall fiscal balance
Sources: International Monetary Fund, Haver Analytics, World Bank.
Notes: Regional and subregional aggregates are presented as GDP-weighted averages.
e = estimate.
A. Regional and subregional country coverage is as in Table 2.3.1.
B. Structural balances are cyclically adjusted.
C. South America includes Argentina, Bolivia, Brazil, Chile, Colombia, Ecuador, Paraguay, Peru, and
Uruguay. Central America and the Caribbean includes Costa Rica, Dominican Republic, Guatemala,
Honduras, and Nicaragua.
D. Data reflects gross government debt.
D. General government debt C. Government consumption growth
-10
-8
-6
-4
-2
0
2
Arg
entin
a
Bra
zil
Chile
Colo
mbia
Ecu
ador
Para
guay
Peru
Uru
guay
Mexi
co
Panam
a
2013 2016ePercent of potential GDP
Dom
inic
an
Repu
blic
-1
0
1
2
3
4
5
LAC SouthAmerica
CentralAmericaand the
Caribbean
Mexico
2014 2015 H1 2016Percent, year-on-year
-10
-8
-6
-4
-2
0
LAC SouthAmerica
Mexico andCentralAmerica
Caribbean
2013 2014
2015 2016e
Percent of GDP
0
10
20
30
40
50
60
70
Bra
zil
Colo
mbia
Ecu
ad
or
Chile
El S
alv
ad
or
Mexic
o
2014 2015 H1 2016
Percent of GDP

CHAPTER 2 .3 GLOBAL ECONOMIC PROSPECTS | JANUARY 2017 120
be partially offset by weak growth in advanced economies.
South America saw a sharper recession in 2016 than in 2015, but the sub-region is expected to rebound in 2017. Domestic constraints appear to be easing in Argentina and Brazil, with the new governments focused on implementing reforms to ease macroeconomic and fiscal imbalances. Colombia and Ecuador, which are struggling with low fiscal revenues from depressed oil prices, will see weak growth in 2017. República Bolivariana de Venezuela continues to suffer from severe economic imbalances, and economic contraction is expected to persist. Due to elevated government deficits, and the accelerating inflation rate, reforms are needed to consolidate the budget and to end the monetizing of the deficit.
While the outlook for Mexico and Central America is relatively better than for South America, growth expectations have deteriorated since mid-2016. Investment in Mexico is envisaged to weaken in 2017, in part due to policy uncertainty in the United States and policy uncertainty around domestic elections in 2018. Mexico is expected to see robust private consumption, however, buoyed by low inflation, low unemployment, increasing real wages, and strong remittance inflows. Reforms in some countries in the Mexico and Central America sub-region have enhanced tax collection and reduced fiscal deficits (Mexico, Panama), making expansionary fiscal policy an option, if needed. Although global conditions are not conducive to robust growth in international trade, weak currencies may give a competitiveness boost to the sub-region’s exports.
In the Caribbean, growth is expected to rise modestly in the medium term after remaining broadly stable in 2017. In the Dominican Republic, the sub-region’s largest economy, growth will ease in 2017 on the completion of large construction projects and lower government outlays.
Risks
Risks to the regional growth outlook are tilted to the downside. While each risk, if realized,
FIGURE 2.3.7 Unemployment and earnings
Unemployment was stable or rising and wage growth was lackluster in
most LAC countries 2016. Mexico was a notable exception, however.
These conditions may have contributed to an increase in poverty.
B. Earnings A. Unemployment rates
Sources: Haver Analytics, World Bank.
A. Data for Q1-Q3 2016 is the average during that period; data for 2013 is the average for Q1-Q4
2013. For Argentina, 2016 data is available in only Q1 and Q2. For Ecuador, 2013 data is available
only for Q2 and Q4.
B. “Earnings” is earnings or wages, deflated by the CPI. Data for Q1-Q3 2016 is the average during
that period. Data for 2013 is the average for Q1-Q4 2013.
FIGURE 2.3.6 External sector
Relative to their peaks in 2012-13, regional currencies are still weak in real
terms, despite some recent appreciation. This has supported export
growth in many countries and contributed to a reduction in current account
deficits. In Mexico and Central America, continued strong growth of
remittance inflows has also supported falling current account deficits.
Tourism growth in a number of Caribbean countries, which had been
robust, slowed or declined in 2016.
B. Remittances A. Export growth
Sources: Haver Analytics, UN World Tourism Organization, World Bank.
A. Export data reflects good s and services.
B. South America includes Bolivia, Brazil, Colombia, Ecuador, Paraguay, and Peru. Mexico and
Central America includes Costa Rica, El Salvador, Guatemala, Honduras, Mexico, Nicaragua,
and Panama. Caribbean includes Belize, Dominica, Dominican Republic, Grenada, Guyana, Haiti,
Jamaica, St. Lucia, St. Vincent and the Grenadines, and Suriname.
D. 2016 data is quarterly. For Antigua and Barbuda, the Dominican Republic, and Trinidad and
Tobago, YTD 2016 reflects data through Q3. For all other countries, YTD 2016 reflects data
through Q2.
D. Tourist arrivals C. Current account balance
-8
-4
0
4
8
Peru
Bra
zil
Arg
entina
Colo
mb
ia
Ecuador
Chile
Uru
guay
Boliv
ia
Costa
Ric
a
Mexic
o
H1 2015 H1 2016Percent, year-on-year
Do
min
ican
Rep
ublic
-6
-2
2
6
10
-4
-1
2
5
8
201
4
201
5
20
16
e
201
4
201
5
20
16
e
201
4
201
5
20
16
e
201
4
201
5
20
16
e
LAC SouthAmerica
Mexico andCentralAmerica
Caribbean
Growth
Level (RHS)
Percent Percent of GDP
-8
-6
-4
-2
0
2
4
Uru
gua
y
Bra
zil
Arg
entina
Peru
Colo
mbia
Gua
tem
ala
Dom
inic
an
Rep
ublic
Costa
Ric
a
Mexic
o
H1 2015 H1 2016Percent of GDP
-6-30369
1215
Anting
ua
an
dB
arb
ud
a
Ba
ha
ma
s, T
he
Ba
rba
do
s
Do
min
can
Rep
ub
lic
Gre
na
da
Jam
aic
a
St.
Kitt
sa
nd
Ne
vis
St.
Lucia
Tri
nid
ad
an
dT
ob
ago
20142015YTD 2016
Percent growth, year-over-year
-4
-2
0
2
4
6
Me
xic
o
Costa
Ric
a
Ecua
do
r
Uru
gua
y
Chile
Colo
mbia
Bra
zil
2016 Q1-Q3 2013
Percent change, year-over-year
0
2
4
6
8
10
12
Mexic
o
Ecu
ador
Dom
inic
an
Republic
Chile
Peru
Uru
guay
Arg
entin
a
Costa
Ric
a
Colo
mbia
Bra
zil
2016 Q1-Q3 2013Percent

LAT IN AMER ICA AND THE CAR IBBEAN GLOBAL ECONOMIC PROSPECTS | JANUARY 2017 121
would likely have differentiated effects across the sub-regions, the realization of an individual risk or a combination of risks would weigh on regional growth.
Rising policy uncertainty among advanced economies. Policy uncertainty increased in the United States and the Euro Area last year. Given that these two economies are the largest economic partners of the LAC region, policy changes, such as restricting trade with the region or migration from the region, could have sustained repercussions on Latin America and the Caribbean (Figure 2.3.9). Estimates show that an increase in financial uncertainty (proxied by an increase in the VIX index) is likely to lead to a notable reduction in investment growth in EMDEs generally, and LAC countries in particular. Moreover, should policy uncertainty weigh on advanced economy growth, slower U.S. and Euro Area growth could have additional negative effects on EMDE growth and investment (Figure 2.3.10).
Renewed slide in commodity prices. Given the region’s large exposure to commodity prices, and the weakened state of fiscal balances in several economies, renewed declines in commodity prices would be severely detrimental to the regional outlook, as well as the prospects of regional commodity exporters. (Fernandez, Gonzalez, and Rodriguez 2015).
Protracted weakness in large economies in the region. The outlook is predicated on a bottoming out in Brazil and Argentina between the end of 2016 and the first half of 2017. Should the weakness in Brazil, Argentina, or República Bolivariana de Venezuela persist for longer than expected, regional growth would be lower than projected.
Sharper-than-expected tightening by the U.S. Federal Reserve. The U.S. Federal Reserve is expected to further tighten monetary policy gradually. However, a reassessment of the pace of U.S. tightening by market participants could lead to swings in interest rates, volatility in capital flows, and marked depreciations of leading Latin America and the Caribbean currencies, which could increase borrowing costs and have negative
repercussions for debt repayment in the region’s more vulnerable economies.3
Policy challenges
The Latin America and Caribbean region is on the verge of recovery after two years of recession. Given low growth among the region’s major trading partners, and with commodity prices stabilizing around current lows, supporting a cyclical recovery is an immediate high-priority challenge. For the medium term, economies must focus on structural reforms to rebuild policy buffers, to reduce dependence on primary commodities, and to increase investment. Such reforms will harness advances in productivity as the engine of growth (de la Torre, Didier, and Pinat 2014).4
Supporting the recovery. The regional outlook assumes a bottoming out and recovery of the
FIGURE 2.3.8 Regional outlook
Regional growth is expected to recover to positive territory in 2017 and
gradually strengthen, underpinned by a recovery in South America.
Commodity prices are expected to gradually recover, improving fiscal and
export revenues of commodity exporters.
B. Selected commodity prices A. Regional growth forecasts
Sources: World Bank.
Notes: Regional and subregional aggregates are presented as GDP-weighted averages.
e=estimated, f=forecast.
A. Regional and subregional country coverage is as in Table 2.3.1.
-3
-2
-1
0
1
2
3
4
LAC SouthAmerica
Mexicoand Central
America
Caribbean
2016e 2017f 2018f 2019fPercent
-50
-40
-30
-20
-10
0
10
Cru
de
oil
Soyb
ean
s
Wh
ea
t
Iron
ore
Cop
pe
r
Go
ld
2015 2016e 2017f 2018f
Percent change, year-on-year
3LAC economies have continued to de-dollarize (in terms of bank deposits in dollars) since the global financial crisis (Catao and Terrones 2016). This could have positive or negative impacts on debt repayment obligations, depending on the direction of exchange rate movements. 4Celasun et al. (2015) argue that rebuilding fiscal buffers, which deteriorated in the aftermath of the global financial crisis, should be an important priority for large LAC economies. They show that, across Brazil, Colombia, and Mexico consolidations of about 2-3 percentage points of GDP are necessary to allow debt ratios to trend down.

CHAPTER 2 .3 GLOBAL ECONOMIC PROSPECTS | JANUARY 2017 122
South American economy by the first half of 2017. While it will be important for governments to nurture and support the nascent recovery, most governments in South America have limited policy space for counter-cyclical policies. Revenues have deteriorated sharply over the past couple of years, due to weak economic growth and depressed commodity prices. Monetary policy continues to be constrained by a combination of weak growth, elevated inflation, and volatile currencies, despite some recent easing of inflationary and exchange rate depreciation pressures. A carefully crafted fiscal-monetary policy mix will be necessary to provide a conducive environment for stronger domestic demand, especially in light of larger downside risks to global growth.
Fiscal reforms and public capital investment. Fiscal adjustment often entails slashing investment to key areas such as infrastructure. While this policy path quickly eases fiscal pressures, it fails to address the structural weaknesses hindering governments’ ability to decrease current spending or increase revenue. Decreased infrastructure investment may also inflict further harm to long-term growth. Given that investment levels in Latin America and the Caribbean are already low compared to other EMDE regions, and have been contracting since 2014, it is critical for governments and the private sector to increase capital investment to expand potential growth (Garcia-Escribano, Goes, and Karpowicz 2015; Cerra et al. 2016; Box 2.3.1; Chapter 3). To narrow fiscal deficits, governments will need to engage in deeper reforms to achieve better-quality revenue and spending, while maintaining investments that increase long-term growth (Corral et al. 2016). Measures to improve tax revenue collection—such as broadening the tax base, reducing tax evasion, and diversifying away from commodity-based taxes—will help improve fiscal positions and instill confidence.
In Brazil, the National Congress recently approved a constitutional amendment that introduces a cap on real federal expenditure growth, and is also discussing a pension reform. Both of these reforms will improve medium- and long-term fiscal prospects. In other countries, there have been delays in implementing reforms. For example, in
FIGURE 2.3.9 Risks of uncertainty in major advanced
economies
The United States and the European Union account for more than half of
exports and over four-fifths of remittance inflows. For South America, the
Euro Area is the largest economic trading partner and source of capital
flows, while Mexico and Central America and the Caribbean are deeply
connected to the United States. Heightened policy uncertainty in the
United States could decrease investment in EMDEs and impact growth,
including in the LAC region.
B. South America: Trade and financial
exposures to major economies
A. LAC: Trade and financial
exposures to major economies
D. Caribbean: Trade and financial
exposures to major economies
C. Mexico and Central America:
Trade and financial exposures
to major economies
Sources: Bank for International Settlements, Haver Analytics, International Monetary Fund, World
Bank.
A.-D. 2010-15 averages. Exports include goods exports only. Foreign claims refer to total claims of
BIS-reporting banks on foreign banks and nonbanks. Stock market capitalization is the market value
of all publicly-traded shares. FDI data is available only to 2014. “U.S.” stands for United States; “EU”
stands for European Union.
E. Figure shows goods exports to the United States/European Union, remittances from the United
States/European Union, and FDI from the United States/European Union (all in percent of LAC
countries’ GDP). FDI is presented as a stock. Other indicators are flows. FDI calculations exclude
LAC countries with populations of less than 3 million.
F. Cumulative responses of EMDE investment to a 10 percent increase in the VIX. Solid lines indicate
the median responses and the dotted lines indicate 16-84 percent confidence intervals. The model
includes, in this order, the VIX, MSCI Emerging Markets Index (MXEM), J.P.Morgan Emerging
Markets Bond Index (EMBIG), aggregate real output and investment growth in 18 EMDEs with G7
real GDP growth, U.S. 10-year bond yields, and MSCI World Index as exogenous regressors and
estimated with two lags. Vector autoregressions are estimated with sample for 1998Q1-2016Q2.
F. Impact of 10 percent increase in VIX
on EMDE investment growth
E. Largest trade and financial
exposures to major advanced
economies
0
20
40
60
80
100
Exports InwardFDI
Remittanceinflows
Portfolioliabilities
Foreignclaims
U.S. China EU Japan OtherPercent of total
0
20
40
60
80
100
Exports InwardFDI
Remittanceinflows
Portfolioliabilities
Foreignclaims
U.S. China EU Japan OtherPercent of total
0
20
40
60
80
100
Exports InwardFDI
Remittanceinflows
Portfolioliabilities
Foreignclaims
U.S. China EU Japan OtherPercent of total
0
20
40
60
80
100
Exports InwardFDI
Remittanceinflows
Portfolioliabilities
Foreignclaims
U.S. China EU Japan OtherPercent of total
0
10
20
30
Mexic
o
Guya
na
Beliz
e
Nic
ara
gua
Ecua
do
r
Chile
Pa
nam
a
Uru
gua
y
Mexic
o
Hon
du
ras
Haiti
El S
alv
ado
r
Jam
aic
a
Gua
tem
ala
Exports FDI Remittances
European Union United StatesPercent of GDP
-2.0
-1.5
-1.0
-0.5
0.0
1 2 3 4 5 6 7 8
Quarter
Percentage points
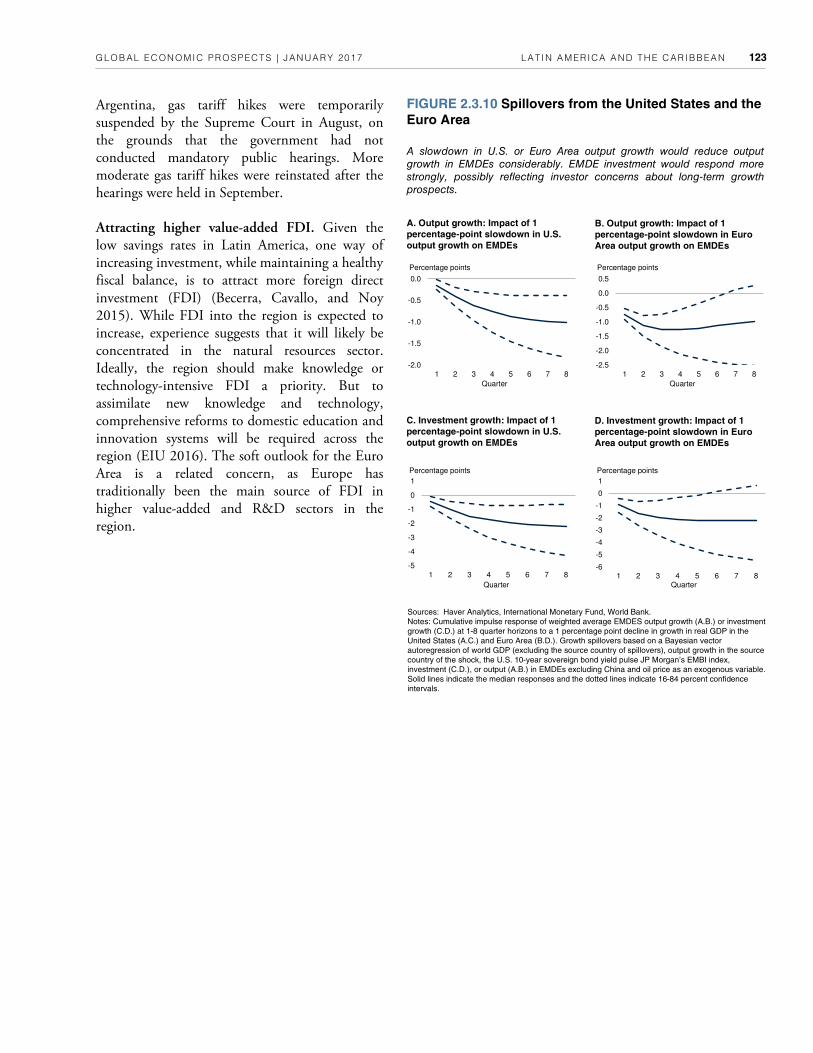
LAT IN AMER ICA AND THE CAR IBBEAN GLOBAL ECONOMIC PROSPECTS | JANUARY 2017 123
Argentina, gas tariff hikes were temporarily suspended by the Supreme Court in August, on the grounds that the government had not conducted mandatory public hearings. More moderate gas tariff hikes were reinstated after the hearings were held in September.
Attracting higher value-added FDI. Given the low savings rates in Latin America, one way of increasing investment, while maintaining a healthy fiscal balance, is to attract more foreign direct investment (FDI) (Becerra, Cavallo, and Noy 2015). While FDI into the region is expected to increase, experience suggests that it will likely be concentrated in the natural resources sector. Ideally, the region should make knowledge or technology-intensive FDI a priority. But to assimilate new knowledge and technology, comprehensive reforms to domestic education and innovation systems will be required across the region (EIU 2016). The soft outlook for the Euro Area is a related concern, as Europe has traditionally been the main source of FDI in higher value-added and R&D sectors in the region.
FIGURE 2.3.10 Spillovers from the United States and the
Euro Area
A slowdown in U.S. or Euro Area output growth would reduce output
growth in EMDEs considerably. EMDE investment would respond more
strongly, possibly reflecting investor concerns about long-term growth
prospects.
B. Output growth: Impact of 1
percentage-point slowdown in Euro
Area output growth on EMDEs
A. Output growth: Impact of 1
percentage-point slowdown in U.S.
output growth on EMDEs
Sources: Haver Analytics, International Monetary Fund, World Bank.
Notes: Cumulative impulse response of weighted average EMDES output growth (A.B.) or investment
growth (C.D.) at 1-8 quarter horizons to a 1 percentage point decline in growth in real GDP in the
United States (A.C.) and Euro Area (B.D.). Growth spillovers based on a Bayesian vector
autoregression of world GDP (excluding the source country of spillovers), output growth in the source
country of the shock, the U.S. 10-year sovereign bond yield pulse JP Morgan’s EMBI index,
investment (C.D.), or output (A.B.) in EMDEs excluding China and oil price as an exogenous variable.
Solid lines indicate the median responses and the dotted lines indicate 16-84 percent confidence
intervals.
D. Investment growth: Impact of 1
percentage-point slowdown in Euro
Area output growth on EMDEs
C. Investment growth: Impact of 1
percentage-point slowdown in U.S.
output growth on EMDEs
-2.0
-1.5
-1.0
-0.5
0.0
1 2 3 4 5 6 7 8
Percentage points
Quarter
-2.5
-2.0
-1.5
-1.0
-0.5
0.0
0.5
1 2 3 4 5 6 7 8
Percentage points
Quarter
-5
-4
-3
-2
-1
0
1
1 2 3 4 5 6 7 8
Percentage points
Quarter
-6
-5
-4
-3
-2
-1
0
1
1 2 3 4 5 6 7 8
Percentage points
Quarter
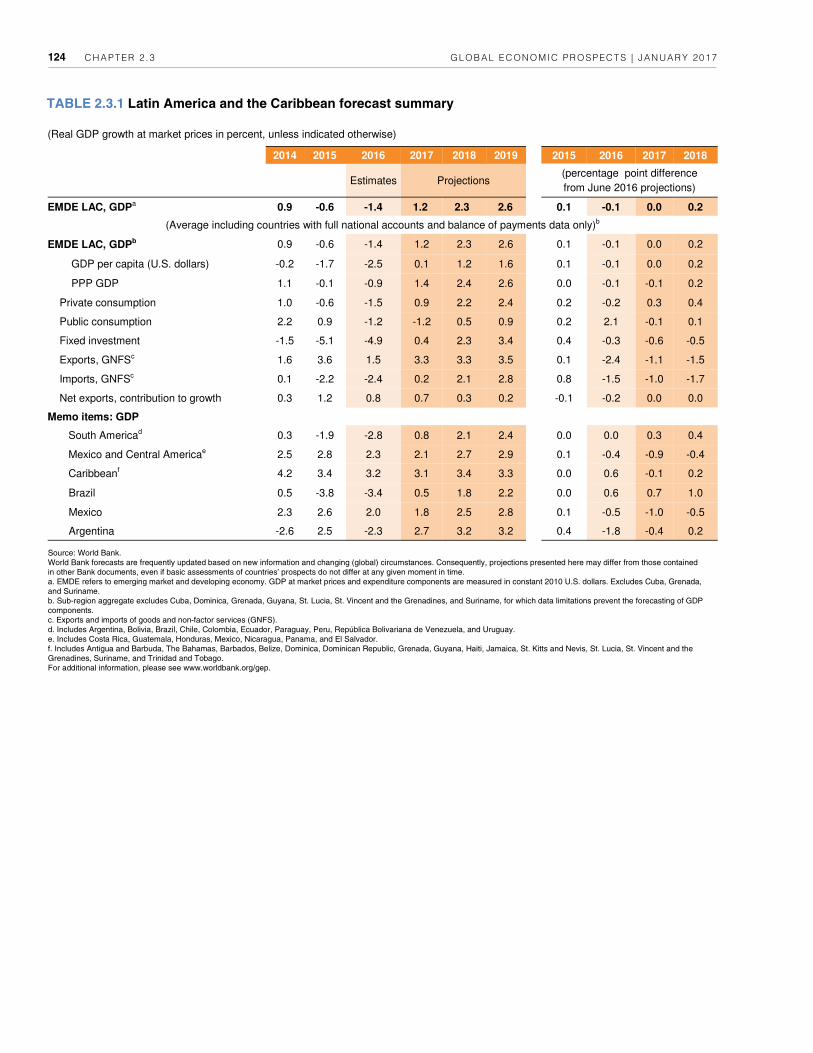
CHAPTER 2 .3 GLOBAL ECONOMIC PROSPECTS | JANUARY 2017 124
(Real GDP growth at market prices in percent, unless indicated otherwise)
2014 2015 2016 2017 2018 2019 2015 2016 2017 2018
Estimates Projections (percentage point difference
from June 2016 projections)
EMDE LAC, GDPa
0.9 -0.6 -1.4 1.2 2.3 2.6 0.1 -0.1 0.0 0.2
(Average including countries with full national accounts and balance of payments data only)b
EMDE LAC, GDPb 0.9 -0.6 -1.4 1.2 2.3 2.6 0.1 -0.1 0.0 0.2
GDP per capita (U.S. dollars) -0.2 -1.7 -2.5 0.1 1.2 1.6 0.1 -0.1 0.0 0.2
PPP GDP 1.1 -0.1 -0.9 1.4 2.4 2.6 0.0 -0.1 -0.1 0.2
Private consumption 1.0 -0.6 -1.5 0.9 2.2 2.4 0.2 -0.2 0.3 0.4
Public consumption 2.2 0.9 -1.2 -1.2 0.5 0.9 0.2 2.1 -0.1 0.1
Fixed investment -1.5 -5.1 -4.9 0.4 2.3 3.4 0.4 -0.3 -0.6 -0.5
Exports, GNFSc 1.6 3.6 1.5 3.3 3.3 3.5 0.1 -2.4 -1.1 -1.5
Imports, GNFSc 0.1 -2.2 -2.4 0.2 2.1 2.8 0.8 -1.5 -1.0 -1.7
Net exports, contribution to growth 0.3 1.2 0.8 0.7 0.3 0.2 -0.1 -0.2 0.0 0.0
Memo items: GDP
South Americad 0.3 -1.9 -2.8 0.8 2.1 2.4 0.0 0.0 0.3 0.4
Mexico and Central Americae 2.5 2.8 2.3 2.1 2.7 2.9 0.1 -0.4 -0.9 -0.4
Caribbeanf 4.2 3.4 3.2 3.1 3.4 3.3 0.0 0.6 -0.1 0.2
Brazil 0.5 -3.8 -3.4 0.5 1.8 2.2 0.0 0.6 0.7 1.0
Mexico 2.3 2.6 2.0 1.8 2.5 2.8 0.1 -0.5 -1.0 -0.5
Argentina -2.6 2.5 -2.3 2.7 3.2 3.2 0.4 -1.8 -0.4 0.2
TABLE 2.3.1 Latin America and the Caribbean forecast summary
Source: World Bank.
World Bank forecasts are frequently updated based on new information and changing (global) circumstances. Consequently, projections presented here may differ from those contained
in other Bank documents, even if basic assessments of countries’ prospects do not differ at any given moment in time.
a. EMDE refers to emerging market and developing economy. GDP at market prices and expenditure components are measured in constant 2010 U.S. dollars. Excludes Cuba, Grenada,
and Suriname.
b. Sub-region aggregate excludes Cuba, Dominica, Grenada, Guyana, St. Lucia, St. Vincent and the Grenadines, and Suriname, for which data limitations prevent the forecasting of GDP
components.
c. Exports and imports of goods and non-factor services (GNFS).
d. Includes Argentina, Bolivia, Brazil, Chile, Colombia, Ecuador, Paraguay, Peru, República Bolivariana de Venezuela, and Uruguay.
e. Includes Costa Rica, Guatemala, Honduras, Mexico, Nicaragua, Panama, and El Salvador.
f. Includes Antigua and Barbuda, The Bahamas, Barbados, Belize, Dominica, Dominican Republic, Grenada, Guyana, Haiti, Jamaica, St. Kitts and Nevis, St. Lucia, St. Vincent and the
Grenadines, Suriname, and Trinidad and Tobago.
For additional information, please see www.worldbank.org/gep.

LAT IN AMER ICA AND THE CAR IBBEAN GLOBAL ECONOMIC PROSPECTS | JANUARY 2017 125
2014 2015 2016 2017 2018 2019 2015 2016 2017 2018
Estimates Projections (percentage point difference
from June 2016 projections)
Argentina -2.6 2.5 -2.3 2.7 3.2 3.2 0.4 -1.8 -0.4 0.2
Belize 4.1 2.9 -1.0 1.5 2.0 2.5 2.0 -1.8 -0.3 -0.2
Bolivia 5.5 4.8 3.7 3.5 3.4 3.4 0.0 0.0 0.1 0.0
Brazil 0.5 -3.8 -3.4 0.5 1.8 2.2 0.0 0.6 0.7 1.0
Chile 1.9 2.3 1.6 2.0 2.3 2.5 0.2 -0.3 -0.1 0.0
Colombia 4.4 3.1 1.7 2.5 3.0 3.3 0.0 -0.8 -0.5 -0.5
Costa Rica 3.0 3.7 4.3 3.9 3.7 3.7 0.9 1.0 0.3 -0.3
Dominica 3.7 -2.5 1.3 2.8 2.7 2.7 1.5 -1.2 0.8 0.7
Dominican Republic 7.6 7.0 6.8 4.5 4.2 4.0 0.1 1.8 0.2 0.2
Ecuador 4.0 0.2 -2.3 -2.9 -0.6 1.0 -0.1 1.7 1.1 -0.6
El Salvador 1.4 2.5 2.2 1.9 2.0 2.0 0.0 0.0 -0.4 -0.3
Guatemala 4.2 4.1 2.9 3.2 3.4 3.4 0.0 -0.6 -0.3 -0.2
Guyana 3.8 3.2 2.6 3.8 3.9 4.1 0.2 -1.4 -0.1 0.1
Haitib 2.8 1.2 1.2 -0.6 1.5 2.0 0.0 0.3 -2.5 -0.7
Honduras 3.1 3.6 3.7 3.5 3.4 3.2 0.0 0.3 0.0 -0.1
Jamaica 0.7 1.0 1.6 2.0 2.3 2.5 0.1 0.1 -0.2 -0.3
Mexico 2.3 2.6 2.0 1.8 2.5 2.8 0.1 -0.5 -1.0 -0.5
Nicaragua 4.6 4.9 4.5 4.0 3.9 3.8 0.0 0.1 -0.2 -0.2
Panama 6.1 5.8 5.4 5.4 5.5 5.5 0.0 -0.6 -0.7 -0.7
Paraguay 4.7 3.1 3.8 3.6 3.3 3.3 0.1 0.8 0.4 -0.1
Peru 2.4 3.3 4.0 4.2 3.8 3.6 0.0 0.5 0.7 0.6
St. Lucia -0.7 1.3 1.0 1.8 2.2 2.5 -0.3 -0.5 -0.2 0.2
St. Vincent and the Grenadines 0.2 0.6 2.0 2.2 2.4 2.4 -1.2 -0.4 -0.9 -0.7
Surinamec 0.4 -2.7 -7.0 0.5 1.1 1.3 ... ... ... ...
Trinidad and Tobago 0.8 -1.8 -2.8 2.3 3.6 3.2 0.2 -0.8 0.3 1.1
Uruguay 3.2 1.0 0.7 1.6 2.5 3.7 0.0 0.0 0.0 0.0
Venezuela, RB -3.9 -5.7 -11.6 -4.3 0.5 1.0 0.0 -1.5 -0.9 -1.1
TABLE 2.3.2 Latin America and the Caribbean country forecastsa
(Real GDP growth at market prices in percent, unless indicated otherwise)
Source: World Bank.
World Bank forecasts are frequently updated based on new information and changing (global) circumstances. Consequently, projections presented here may differ from those contained in
other Bank documents, even if basic assessments of countries’ prospects do not significantly differ at any given moment in time.
a. GDP at market prices and expenditure components are measured in constant 2010 U.S. dollars.
b. GDP is based on fiscal year, which runs from October to September of next year.
c. Growth rates for Suriname were not published in June 2016.
For additional information, please see www.worldbank.org/gep.

CHAPTER 2 .3 GLOBAL ECONOMIC PROSPECTS | JANUARY 2017 126
BOX 2.3.1 Recent investment slowdown: Latin America and the Caribbean
Investment growth in the region dropped from 12.5 percent in 2010 to -4.8 percent in 2015, reflecting political and policy uncertainty in several of the region’s major economies, a severe terms-of-trade deterioration, and a broad-based slowdown in economic growth across the region. Remaining investment needs are sizable, especially in education and infrastructure.
Latin America and the Caribbean (LAC) accounted for 7 percent of global investment in 2010-15.1 During this period, investment growth slowed sharply in the region, from about 12.5 percent in 2010 to -4.8 percent in 2015, well below its long-term (1990-2008) average of 4.6 percent. Regional investment is projected to decline further, by more than 1 percent, in 2016.
This box discusses the following questions.
• How has investment growth in the region evolved?
• What were the main sources of the investment slowdown?
• What are current and prospective investment needs?
• Which policies can address these investment needs?
The decline in investment growth in the LAC region in 2010-15 was concentrated in commodity exporters. It reflected domestic macroeconomic challenges, a sharp terms-of-trade deterioration resulting from declines in global commodity prices, and slowdowns in economic growth, with outright recessions in some cases. Current and prospective investment needs are sizable, especially in education and infrastructure.
How has regional investment growth evolved?
The LAC region accounted for 7 percent of global investment during 2010-15, less than LAC’s 8 percent share of global output. This investment underperformance reflects low investment-to-GDP ratios in LAC, averaging around 22 percent during 2010-15, significantly below the EMDE average of 32 percent. Current private investment-to-GDP ratios have fallen below levels prior to the global financial crisis (IMF 2015e).
Regional investment has contracted since 2014 amid deep recessions in several of the region’s largest economies
(Argentina, Brazil, República Bolivariana de Venezuela) and growth slowdowns in the rest of the region (Figure 2.3.1.1). In 2015, investment growth was below its long-term average in two-thirds of LAC economies and negative in one-third of them (Brazil, Chile, Ecuador, Jamaica, and Peru). Preliminary data point to a further investment decline in the first half of 2016.
The declines mark a sharp reversal of the region’s robust investment growth before 2010, when LAC countries were buoyed by robust overall growth prospects, still-elevated commodity prices, and relative political stability in the region. During 2010-15, investment growth averaged 3.9 percent, significantly below the 7.8 percent average during 2003-08. The recent weakening of investment growth has returned investment-to-GDP ratios near their levels in the early 2000s. The slowdown in investment growth has been broad-based across various sectors, and across public and private investment. In light of the weakened economic growth prospects for the region, investment growth is expected to remain low in the short to medium term.
South America, with a large share of commodity exporters, experienced the sharpest downturn in investment growth in the LAC region as these economies’ terms of trade deteriorated sharply (World Bank 2016k; IMF 2015e). Investment in Mexico and many other countries in Central America has been more robust as reform agendas, especially in Mexico, have bolstered confidence. Investment growth has also picked up in the Caribbean, partly due to strong construction growth supporting the tourism sector.
What were the main sources of the investment
slowdown?
The post-crisis slump in commodity prices and associated deterioration in the terms-of-trade triggered sharp investment drops in commodity-producing sectors, in particular mining, across the region (IMF 2015e, World Bank 2016l; Figure 2.3.1.2). Investment also declined in non-commodity-producing sectors. Public investment was curtailed as fiscal revenues shrank and fiscal deficits widened as a result of lower commodity prices and slowing growth. Private investment declined as investor confidence in growth prospects waned, especially among major commodity exporters (IADB 2016, IMF 2015b). Political
Note: This box was prepared by Derek Chen. 1Throughout this box, unless otherwise specified, investment refers to real gross fixed capital formation (public and private combined). For the sake of brevity, “investment” is understood to indicate investment levels. Investment growth is measured as the annual percent change in real investment.

LAT IN AMER ICA AND THE CAR IBBEAN GLOBAL ECONOMIC PROSPECTS | JANUARY 2017 127
BOX 2.3.1 Recent investment slowdown: Latin America and the Caribbean (continued)
FIGURE 2.3.1.1 Investment growth slowdown
Partly due to weak overall economic growth, investment growth slowed sharply during 2010-15. The investment slowdown
was broad-based across various sectors and across both private and public investment. Investment growth is expected to
remain low and may decline further in the short to medium term.
Sources: Haver Analytics, International Monetary Fund, Oxford Economics, World Bank.
A. GDP-weighted averages. Includes quarterly data for Bolivia, Brazil, Chile, Colombia, Costa Rica, Guatemala, Mexico, Nicaragua, Paraguay, Peru, and Uruguay.
Central America includes Costa Rica, Guatemala, Mexico, and Nicaragua. “EMDE” stands for emerging market and developing economies.
B. Averages weighted by investment levels. “SA” stands for South America. “MCC” stands for Mexico, Central America, and the Caribbean.
E. For Chile, 2003-08 data begins in 2004.
F. Figure shows growth rates of gross fixed capital formation in constant 2010 U.S. dollars.
A. Quarterly investment growth B. Regional investment growth C. Share of countries with investment
growth below its long-term average
D. Share of countries with contracting
investment
E. Investment growth by sectors F. Composition of investment growth
and policy uncertainty has also dampened investor confidence and discouraged investment expenditures in several countries in recent years (Argentina, Brazil, Haiti, República Bolivariana de Venezuela) (IMF 2016l).
Tightening financing conditions in the region further weighed on investment. As the U.S. Federal Reserve began to reduce monetary accommodation in 2014-15, currencies of major commodity exporters in the region depreciated against the dollar, some by around 30 percent in 2015 (Brazil, Colombia). Coupled with severe weather conditions that affected domestic food supplies, upward pressures on inflation led some central banks in the region, especially in South America, to raise interest rates in 2015-16 to contain price rises despite weak output growth
(Argentina, Brazil, Chile, Colombia), further dampening investment growth.
What are current and prospective investment needs?
Investment needs in the region remain significant. The low quality of infrastructure and poor skills of the labor force are bottlenecks to the achievement of faster productivity growth, for example in Brazil (World Bank 2016k), and to poverty reduction. Infrastructure has not kept pace with urbanization in the region (IADB 2010), while the majority of the poor in LAC are in urban areas. Immediate needs for investment in infrastructure and education have also been identified in country studies of Belize, Bolivia,
-10
-5
0
5
10
15
20
20
10Q
1
20
10Q
3
20
11Q
1
20
11Q
3
20
12Q
1
20
12Q
3
20
13Q
1
20
13Q
3
20
14Q
1
20
14Q
3
20
15Q
1
20
15Q
3
20
16Q
1
20
16Q
3LAC Central America EMDE
Percent, year-on-year
-10
-5
0
5
10
15
20
11
20
13
20
15
20
11
20
13
20
15
20
11
20
13
20
15
20
11
20
13
20
15
SA MCC LAC EMDE
1990-2008 avg 2003-08 avgPercent
0
25
50
75
2010 2011 2012 2013 2014 2015
Percent
0
25
50
75
2010 2011 2012 2013 2014 2015
Percent
05
10152025
Con
stru
ctio
n
Machin
ery
Ove
rall
Con
stru
ctio
n
Machin
ery
Ove
rall
Con
stru
ctio
n
Machin
ery
Ove
rall
Chile Colombia Mexico
Percent
2003-08 2010-15
-5
0
5
10
15
20
Pri
vate
Pu
blic
Pri
vate
Pu
blic
Pri
vate
Pu
blic
Pri
vate
Pu
blic
Pri
vate
Pu
blic
Pri
vate
Pu
blic
ElSalvador
Honduras Mexico Nicaragua Peru Uruguay
Percent 2003-08 2010-15

CHAPTER 2 .3 GLOBAL ECONOMIC PROSPECTS | JANUARY 2017 128
FIGURE 2.3.1.2 Correlates of investment growth slowdown
The investment slowdown has coincided with severe terms-of-trade deteriorations, sharp output growth slowdowns, slowing
FDI inflows, political tensions, and domestic policy tightening. Over the medium term, investment growth is expected to
remain low.
Sources: Haver Analytics, Consensus Economics, World Economic Forum (2016), World Bank.
A. GDP-weighted averages. “SA” stands for South America. “MCC” stands for Mexico, Central America, and the Caribbean.
B. Consensus Economics five-year ahead investment growth forecasts.
C. GDP-weighted average annual change in terms of trade. Negative value indicates deterioration. Energy exporters include Bolivia, Colombia and Ecuador. Non-energy
commodity exporters include Argentina, Brazil, Chile, Costa Rica, Guatemala, Honduras, Nicaragua, Panama, Paraguay, Peru, and Uruguay. Commodity importers
include Dominican Republic, El Salvador, Haiti, and Mexico.
D. ICRG is the International Country Risk Guide, an index of political stability produced by the PRS Group. A decline indicates greater political instability.
A. Regional output growth B. Long-term investment growth forecasts
C. Terms of trade changes D. ICRG index of political stability
BOX 2.3.1 Recent investment slowdown: Latin America and the Caribbean (continued)
Colombia, Costa Rica, El Salvador, Guatemala, Haiti, Honduras, Panama, and Uruguay (World Bank 2015i-q, and 2016l).
Infrastructure investment. On average across the 16 EMDEs in LAC over 2008-2013, infrastructure investment amounted to just 3.7 percent of GDP, well below the 5-6
percent of GDP required just to sustain current economic growth rates (IADB 2016m; Bhattacharya, Romani, and Stern 2012; Kohli and Basil 2010; Fay and Yepes 2003; Calderón and Servén 2003; and Perrotti and Sánchez 2011). Apart from low investment levels, the quality of infrastructure in the LAC region is poor relative to that of advanced economies and Asian emerging markets. The
-2
0
2
4
6
8
20
10
20
11
20
12
20
13
20
14
20
15
20
10
20
11
20
12
20
13
20
14
20
15
20
10
20
11
20
12
20
13
20
14
20
15
20
10
20
11
20
12
20
13
20
14
20
15
SA MCC LAC EMDE
1990-2008 avg 2003-08 avgPercent
4
5
6
7
8
9
10
11
2010 2011 2012 2013 2014 2015
LAC Argentina Brazil
Chile Colombia Mexico
Peru
Percent
58
60
62
64
66
68
70
2010 2011 2012 2013 2014 2015
Index
Commodity exporters
Commodity importers
-20
-15
-10
-5
0
5
10
15
2010 2011 2012 2013 2014 2015
Percent
Energy exporters
Non-energy commodity exporters
Commodity importers

LAT IN AMER ICA AND THE CAR IBBEAN GLOBAL ECONOMIC PROSPECTS | JANUARY 2017 129
BOX 2.3.1 Recent investment slowdown: Latin America and the Caribbean (continued)
FIGURE 2.3.1.3 Investment needs
A number of LAC countries rank poorly on access to quality infrastructure. Important among current investment needs are
infrastructure and education, in terms of both quantity and quality.
Sources: World Bank (2017), World Economic Forum (2016).
A. Rankings out of 138 countries.
B. Rankings out of 190 countries.
C. Blue bars denote range of unweighted regional averages across EMDE regions. Government expenditure per primary student (in percent of per capita income),
unweighted averages of 87 EMDEs, 32 AEs, and 20 LAC economies. Pupil-teacher ratio in primary education (headcount basis), unweighted averages for 165 EMDEs,
31 AEs, and 23 LAC economies. Latest available data available during 2011-15.
D. Blue bars denote range of unweighted regional averages across EMDE regions. Health expenditure per capita in purchasing power parity terms, unweighted averages
of 199 EMDEs, 34 AEs, and 31 LAC economies. Access to improved sanitation facilities (in percent of population), unweighted averages for 150 EMDEs, 33 AEs, and 28
LAC economies. Access to improved water sources (in percent of population), unweighted averages for 148 EMDEs, 34 AEs, and 30 LAC economies. Latest available
data available during 2011-15.
A. Quality of infrastructure B. Ease of accessing electricity
C. Selected education indicators D. Selected health care indicators
average LAC economy ranked 82nd out of 138 economies (around the 40th percentile) on quality of infrastructure (World Economic Forum 2016; Figure 2.3.1.3). Priority infrastructure needs in the region include improving road conditions through maintenance and rehabilitation (Uruguay), upgrading infrastructure relating to energy (Panama), increasing access to electricity in rural areas
(Bolivia), enhancing the quality of roads and ports (Costa Rica), and reducing the prices of electricity (Costa Rica).
Education. While public education expenditure in the region is on par with the EMDE average, various metrics of the quality of education systems, such as the average student-teacher ratio, fall short of EMDE comparators.
0
20
40
60
80
100
120
140
Barb
ado
s
Pa
na
ma
Chile
Ecua
do
r
Mexic
o
Jam
aic
a
Hon
du
ras
Uru
gua
y
Gu
ate
mala
El S
alv
ado
r
Dom
inic
an R
epu
blic
Nic
ara
gua
Co
sta
Ric
a
Arg
en
tina
Colo
mbia
Bo
livia
Peru
Bra
zil
Ven
ezu
ela
, R
B
Para
gua
y
LAC average
EMDE average
AE average
Rank
0
20
40
60
80
100
120
140
Gu
ate
ma
la
Pan
am
a
Costa
Ric
a
Uru
gua
y
Bra
zil
Pe
ru
Ch
ile
Co
lom
bia
Arg
en
tina
Ba
rba
do
s
Ecua
do
r
Me
xico
Nic
ara
gu
a
Bo
livia
Jam
aic
a
Pa
rag
ua
y
El S
alv
ado
r
Ha
iti
Ho
nd
ura
s
Dom
inic
an R
ep
ublic
Ven
ezue
la, R
B
LAC averageEMDE averageAE average
Rank
0
5
10
15
20
25
30
35
40
45
Government expenditure Pupil-teacher ratio
Percent of per capita income, ratio
Range AE EMDEs LAC
0
20
40
60
80
100
120
0
1500
3000
4500
Health expenditure(LHS)
Improved sanitation(RHS)
Improved watersource (RHS)
Per capita
Range AE EMDE LAC
Percent of population

CHAPTER 2 .3 GLOBAL ECONOMIC PROSPECTS | JANUARY 2017 130
Urgent education needs include improved pre-school education and access to early childhood education; better teacher training and quality; and a reorientation of education programs towards employer needs, such as information technology and English language skills (Belize, Bolivia, Costa Rica, El Salvador, Guatemala, Panama).
Public health. The region’s public health expenditures are slightly above that of EMDE comparators. Health infrastructure, such as access to improved sanitation and improved water sources, exceeds that of EMDE peers. However, urgent health care investment needs remain (World Bank 2015j, n). These include tackling malnutrition (Guatemala), increasing access to improved sanitation in rural and urban areas, and access to specialized health care services for women and children (Bolivia).
Which policies can help address investment
needs?
While policy priorities differ across countries, most economies in the region have limited funds to expand public investment spending. The lack of resources places a
premium on the efficiency of public investment, which may be enhanced by leveraging public funds with public-private partnerships and implementing reforms to stimulate private investment.
• Strengthening the efficiency of public investment includes streamlining the process for the development, approval, and selection of projects (IADB 2016). Transparency in the project selection process and its monitoring and coordination between multiple stakeholders can help remove inefficiencies.
• Several countries have begun to develop public-private partnership frameworks (Chile, Colombia, Peru). If designed well, these can improve the efficiency of public investment spending (Engel, Fischer, and Galetovic 2014).
• LAC economies rank low on ease of business startup and tax compliance (South America and Central America), as well as trading across borders and registering property (Caribbean and South America) (World Bank 2017). Reforms to ease these constraints can also encourage investment.
BOX 2.3.1 Recent investment slowdown: Latin America and the Caribbean (continued)

Recent developments
Growth
The Middle East and North Africa grew by an estimated 2.7 percent in 2016, down from 3.2 percent in 2015.1 Growth was higher in oil-importing economies than in oil exporters, yet it slowed in both groups. Regional growth was 1.5 percentage points below its 1991-2008 average (Figure 2.4.1, Table 2.4.1).
Conflict plagues the region. The failed ceasefire in Syria in the fall of 2016, ongoing war in the Republic of Yemen, continued struggle in Iraq against the Islamic State (ISIS), and political crisis in Libya make clear that the cycle of conflict
continues, with deep domestic and international effects. Exodus and internal displacement from conflict-affected countries has generated a humanitarian disaster. Infrastructure has been destroyed; access to food, water, utilities, and basic services has been curtailed; and health conditions have deteriorated. Cross-border spillovers—trade disruptions, fiscal pressures from spending demands for refugees and security, and weakened tourism—continue to ripple through the region (Rother et al. 2016).2
The slowdown in activity in 2016 was most notable in Gulf Cooperation Council (GCC) countries, where growth decelerated by nearly 2 percentage points. Oil sector weakness spread to non-oil sectors. In addition to holding back output growth in oil-exporting countries, the recent period of low oil prices has been associated with a slowdown in investment growth, predominantly through a severe terms-of-trade deterioration (Box 2.4.1). Yet GDP growth in the Islamic Republic of Iran and in Iraq is estimated to have strengthened considerably last year, bolstered by large gains in oil production and, in the former, a recovery in the agriculture,
Growth in the Middle East and North Africa is set to accelerate through 2018 following the bottoming out of oil prices in 2016. For oil exporting economies, despite robust growth in the Islamic Republic of Iran, the recovery will be slightly slower than expected in mid-2016, reflecting fiscal consolidation plans (Gulf Cooperation Council countries and Iraq) and oil production capacity constraints (Iraq). Growth is projected to be somewhat more robust in oil importers than expected in mid-2016, driven by a broad-based strengthening of activity in these countries. Key risks to the outlook are a weaker-than-expected rise in oil prices and conflict-related spillovers. Challenges include staying the course with policy adjustment, particularly fiscal policy, to support medium-term macroeconomic stability; diversifying away from oil; developing more dynamic private sectors; and harnessing potential demographic benefits.
Note: This section was prepared by Dana Vorisek, with contributions from Jongrim Ha and Hideaki Matsuoka. Research assistance was provided by Shituo Sun. 1The World Bank’s Middle East and North Africa aggregate includes 16 economies, and is grouped into three subregions. Bahrain, Kuwait, Oman, Qatar, Saudi Arabia, and the United Arab Emirates comprise the Gulf Cooperation Council (GCC); all are oil exporters. Other oil exporters in the region are Algeria, the Islamic Republic of Iran, and Iraq. Oil importers in the region are Djibouti, the Arab Republic of Egypt, Jordan, Lebanon, Morocco, Tunisia, and West Bank and Gaza. The Syrian Arab Republic, the Republic of Yemen, and, as of this publication of Global Economic Prospects, Libya, are excluded from regional growth aggregates due to data limitations. The adjustment in the country set means that aggregate regional and subregional data in this version of Global Economic Prospects do not match those in previous versions.
2Using annual data for 1970–2014, Rother et al. (2016) find that countries bordering an area of high-intensity conflict experience an average annual decline in GDP of 1.4 percentage points. The impact is found to be even higher, at 1.9 percentage points, for countries in the Middle East and North Africa region.

CHAPTER 2 .4 GLOBAL ECONOMIC PROSPECTS | JANUARY 2017 132
automotive production, and trade and transport sectors (IMF 2016m).
Among oil-importing economies, growth in Egypt dipped slightly, to 4.3 percent, in FY2016. Foreign currency shortages held back manufacturing production, and tourism fell off after the crash of a Russian airliner in the Sinai Peninsula in October 2015. Growth in Morocco eased 3 percentage points in 2016 to an estimated 1.5 percent, due largely to a drought-related contraction in the agricultural sector. A notable bright spot is Tunisia, where an uptick in growth from 0.8 percent to an estimated 2.0 percent reflects rising investment and government spending. Across commodity-importing countries, tourism sectors are still struggling from terrorist
incidents and conflict spillovers. Only in Lebanon has tourism picked up as arrivals from Europe have recovered. Together with a strong real estate sector activity, strengthening tourism contributed to a modest growth recovery in that country in 2016.
Current account and fiscal balances
In addition to constraining growth, the decline in oil prices between 2014 and 2016 led to an acute deterioration of external and fiscal balances in oil-exporting countries (Figure 2.4.2). The major exception was the Islamic Republic of Iran, which was relatively less impacted by the oil price plunge because its oil proceeds had already been significantly reduced with the tightening of international sanctions several years prior. A steep slowdown in import growth and large public spending cuts among oil exporters in 2016 stabilized fiscal and current account balances in most oil-exporting countries, but only after they had reached historically high levels.
In oil-importing economies, falling oil prices helped Lebanon, Morocco, and Tunisia lower their current account deficits in 2016. Egypt, on the other hand, experienced balance of payment pressures stemming from a drop in remittances and official transfers (more than 70 percent of remittances to Egypt came from GCC countries in 2014 and 2015) and weakened tourism activity following several high-profile terrorism incidents (Figure 2.4.3). This wiped out Egypt’s progress on reducing its current account deficit in the three years to 2014, bringing the deficit to 5.5 percent of GDP in fiscal year 2016.
From a weak starting position, oil importers have made limited progress in bringing down fiscal deficits during the period of low oil prices, although Jordan and Morocco have shown improvements. In Morocco, this has been achieved through the elimination of subsidies on diesel and gasoline and greater control of the wage bill. Jordan has reformed fuel subsidies and its electricity sector. However, the magnitude of fiscal adjustment in oil-importing countries has been insufficient to put government debt on a downward path in recent years. Debt stands at
FIGURE 2.4.1 Growth
Growth in the Middle East and North Africa slowed in 2016 in both oil-
exporting and oil-importing economies. In GCC countries, the non-oil
sector decelerated notably, reflecting fiscal consolidation and links to the
weak oil sector. Growth in non-GCC oil exporters, on the other hand,
strengthened, reflecting large increases in oil production in Iraq and the
Islamic Republic of Iran. A drought in Morocco led to a large contraction in
the agricultural sector.
B. Non-oil-sector GDP growth in GCC A. GDP growth
Sources: Haver Analytics, International Energy Agency, national statistical agencies, World Bank.
A. Non-GCC oil exporters are Algeria, Iraq, and the Islamic Republic of Iran.
B. Figure shows real growth on a year-over-year basis.
C. Figure reflects growth in combined crude oil, natural gas liquid, and nonconventional oil production.
D. Figure shows real growth on a year-over-year basis. The agricultural sector represents 14 percent
of gross value added in Morocco.
D. Agricultural sector growth in
Morocco
C. Oil and gas production
0
1
2
3
4
5
ME
NA
Oil
impo
rters
GC
C
No
n-G
CC
oil
export
ers
2015 2016 1991-2008Percent
-2
0
2
4
6
8
10
20
11
Q2-
20
14
Q2
avera
ge
20
15
Q4
20
16
Q1
20
16
Q2
Saudi Arabia Qatar Abu DhabiPercent
-10
-5
0
5
10
15
20
25
Bah
rain
Alg
eri
a
Qa
tar
Sa
ud
iA
rab
ia
Om
an
Un
ited
Ara
bE
mira
tes
Ku
wa
it
Ira
q
Ira
n,
Isla
mic
Rep
.
Jan-Nov 2014 y/yJan-Nov 2015 y/yJan-Nov 2016 y/y
Percent growth
-15
-10
-5
0
5
10
15
20
15
Q1
-Q4
ave
rage
20
16
Q1
20
16
Q2
20
16
Q3
Percent

MIDDLE EAST AND NORTH AFR ICA GLOBAL ECONOMIC PROSPECTS | JANUARY 2017 133
FIGURE 2.4.2 External and fiscal positions
The drop in oil prices that began in 2014 led to an acute deterioration in
fiscal and external balances in oil-exporting countries. These balances
stabilized in 2016, in part due to sizable cuts in government spending. Oil-
importing countries have made limited progress in improving current
account balances in the low oil price environment, and they face large and
still growing levels of debt.
B. Fiscal balances A. Current account balances
D. Government debt C. Government spending growth, oil
exporters
Sources: Haver Analytics, International Monetary Fund, World Bank.
A.B.D. Figure reflects the GDP-weighted average for the two country groups.
nearly 100 percent of GDP in Egypt, almost 95 percent Jordan, and close to 145 percent in Lebanon. The slowdown in GDP growth in 2016 in some countries (Morocco and Jordan) has also contributed to a rise in debt-to-GDP ratios.
Inflation
Low global oil prices and exchange rate pegs to the U.S. dollar have kept import prices, and hence consumer price inflation, low (or negative) in most oil-importing economies (Figure 2.4.4). Yet deflation in Jordan and Lebanon is easing somewhat. Egypt is an outlier. There, strong inflationary pressure was accompanied by a growing gap between the official and black market exchange rates during FY2016 (the year ended June 30, 2016). The gap closed following the floating of the exchange rate in early November, but the long-delayed introduction of a value-added tax in October (of 13 percent, and set to rise to 14 percent as of fiscal year 2017/18) and rising import prices as a result of the flotation may result in an additional jump in inflation. This will be temporary, however, assuming monetary policy contains second-round effects.
Inflation conditions are mixed in oil exporters. In the Islamic Republic of Iran, tighter monetary policy and low global food prices in recent years have been instrumental in reducing inflation from very high levels early in the decade, notwithstanding the uptick observed in recent months. In Algeria, the recent rise in inflation is the result of a currency devaluation in 2015. As yet, the rise in capital flows to GCC countries does not appear to have contributed to a rise in domestic prices, and the gap between spot and forward exchange rates (a measure of speculation about exchange rate devaluation or de-pegging) has narrowed significantly from early-2015 peaks. Inflation in GCC countries has been relatively stable following the removal of fuel and utility subsidies in several countries in 2016.
Financial sectors
For GCC countries, the impact of low oil prices on the financial sector has become increasingly pronounced. Banks’ deposit growth, particularly
FIGURE 2.4.3 Egypt: balance of payment pressures
The detrimental impact of low oil prices on oil-exporting countries has
contributed to a drop in remittance inflows and official transfers to Egypt. At
the same time, tourism in Egypt has been negatively impacted, especially
after the Russian plane crash above Egypt’s Sinai and the subsequent
flight suspensions by major countries due to the perceived security risks.
Together, these trends have generated balance of payments pressures.
B. Tourism arrivals A. Remittances and official transfers
Sources: Haver Analytics, World Bank.
A. Data is seasonally adjusted. Vertical line marks the start of the decline in global oil prices. Last
observation is 2016Q2.
B. Data is seasonally adjusted. Vertical line marks the downing of a Russian airliner in Egypt. Last
observation is 2016Q2.
0.2
0.4
0.6
0.8
1.0
1.2
1.4
20
10
Q3
20
11
Q1
20
11
Q3
20
12
Q1
20
12
Q3
20
13
Q1
20
13
Q3
20
14
Q1
20
14
Q3
20
15
Q1
20
15
Q3
20
16
Q1
Millions
-12
-8
-4
0
4
8
12
16
20
13
20
14
20
15
20
16
Oil exporters
Oil importers
Percent of GDP
-12
-8
-4
0
4
8
12
16
20
13
20
14
20
15
20
16
Oil exporters
Oil importers
Percent of GDP
-25
-15
-5
5
15
25A
lge
ria
Bah
rain
Ira
n,
Isla
mic
Rep
.
Ira
q
Ku
wa
it
Om
an
Qa
tar
Sa
ud
i A
rab
ia
Un
ited
Ara
bE
mira
tes
2015 2016Percent
10
20
30
40
50
60
70
80
90
20
13
20
14
20
15
20
16
Oil exportersOil importers
Percent of GDP
0
1
2
3
4
5
20
10
Q2
20
10
Q4
20
11
Q2
20
11
Q4
20
12
Q2
20
12
Q4
20
13
Q2
20
13
Q4
20
14
Q2
20
14
Q4
20
15
Q2
20
15
Q4
20
16
Q2
Remittances
Official transfers (net)
US$ billions

CHAPTER 2 .4 GLOBAL ECONOMIC PROSPECTS | JANUARY 2017 134
the part sourced from the government, is lagging well behind credit growth, and is in some cases contracting because of growing public finance needs and slowing economic activity. Liquidity
conditions, as measured by banks’ loan-to-deposit ratios, steadily tightened in 2016 as a result in several countries, most notably in Qatar and Saudi Arabia (Figure 2.4.5). Central banks responded by injecting liquidity into banks, among other actions. For Saudi Arabia, however, central bank actions have failed to contain a rise in the cost of interbank funding. Increasing government reliance on international debt issuance, which rose in 2016 as these countries financed large fiscal deficits, may help to relieve some of the liquidity pressure on domestic banking sectors.3
Aside from the liquidity squeeze, banking sectors in GCC countries have been resilient through the period of low oil prices, with capital ratios adequate and non-performing loan (NPL) ratios low. Banks are uncompetitive, however, and lending is highly concentrated among large, well-established firms (Caggiano and Calice 2016). In most oil-importing countries, as well, banking systems are broadly stable. Tunisia, with elevated NPLs, is an exception, although banking regulation passed in July 2016 to tighten prudential standards and establish a deposit guarantee fund is expected to improve banking stability in the medium term. And while banking sector indicators remain sound in Egypt, reliance on banks to finance growing government budget deficits and the foreign currency shortage is restraining business and household borrowing.
Recent reforms
Despite difficult macroeconomic conditions, there has been progress on fiscal adjustment and structural reform since mid-2016. Kuwait increased fuel prices in August, as did the United Arab Emirates in September. Oman is scheduled to remove electricity subsidies for large users in January. Saudi Arabia announced significant reductions to public wage spending in September, one of the many provisions of the National Transformation Plan approved in June. Several oil-exporting economies have cut capital spending.
FIGURE 2.4.4 Inflation
Reflecting exchange rate pegs and low international commodity prices,
inflation in most oil-importing economies remains low. A modest recovery in
commodity prices in the second half of 2016 has contributed to a mild
increase in inflation from negative levels in Lebanon and Jordan. Egypt is
an exception, where high rates of inflation were accompanied by a
growing gap between the official and unofficial exchange rates for much of
2016, though the gap closed following the floating of the Egyptian pound in
early November.
B. Inflation: Oil-exporting economies A. Inflation: Oil-importing economies
Sources: Haver Analytics, Iraq’s Central Statistical Organization, World Bank.
A. Data is seasonally adjusted. Last observation is October 2016 for Lebanon and Morocco and
November 2016 for other economies.
B. GCC line reflects median of the six member economies. Data for all economies except Iraq is
seasonally adjusted. The period of very high inflation that the Islamic Republic of Iran experienced
starting in early 2011, when inflation peaked at 45 percent, is not shown for ease of presentation.
Last observation is November 2016 for Islamic Republic of Iran and Oman and October for other
economies.
FIGURE 2.4.5 Financial conditions in GCC
The impact of low oil prices on the financial sectors in GCC countries has
become increasingly pronounced, pushing down government deposits in
banks, and contributing to a rise in the cost of interbank funding in some
countries, particularly in Saudi Arabia. Reduced reliance on bank
borrowing in favor of international bond issuance by GCC governments
may relieve some of the liquidity pressure in banks.
B. International sovereign bond
issuance A. Loan-to-deposit ratios
Sources: Haver Analytics, Dealogic, World Bank.
A. Saudi Arabia line reflects private sector loan-to-deposit ratio. For other countries, total
loan-to-deposit ratio is shown. Last observation is October 2016.
B. Data for United Arab Emirates is the sum of issuance by Abu Dhabi, Dubai, Ras al Khaimah, and
Sharjah. 2016H2 bar reflects issuance through December 14, 2016.
-5
0
5
10
15
20
Jan
-13
Ap
r-13
Jul-
13
Oct-
13
Jan
-14
Ap
r-14
Jul-
14
Oct-
14
Jan
-15
Ap
r-15
Jul-
15
Oct-
15
Jan
-16
Ap
r-16
Jul-
16
Oct-
16
Egypt, Arab Rep. JordanLebanon MoroccoWest Bank & Gaza Tunisia
Percent, year-on-year
-5
0
5
10
15
20
Jan
-13
Ap
r-13
Jul-
13
Oct-
13
Jan
-14
Ap
r-14
Jul-
14
Oct-
14
Jan
-15
Ap
r-15
Jul-
15
Oct-
15
Jan
-16
Ap
r-16
Jul-
16
Oct-
16
Algeria Iran, Islamic Rep. Iraq GCCPercent, year-on-year
75
85
95
105
115
125
135
Oct
-201
3
Feb
-201
4
Jun
-201
4
Oct
-201
4
Feb
-201
5
Jun
-201
5
Oct
-201
5
Feb
-201
6
Jun
-201
6
Oct
-201
6
Saudi ArabiaQatarUnited Arab Emirates
Percent
0
5
10
15
20
25
2014 2015 2016H1 2016H2
Saudi ArabiaQatarUnited Arab EmiratesBahrainOman
US$ billions
3GCC countries have also financed deficits through sovereign wealth funds (SWFs) and other fiscal buffers. Non-GCC oil-exporting countries with large fiscal deficits (Algeria and Iraq) have relied heavily on such sources.

MIDDLE EAST AND NORTH AFR ICA GLOBAL ECONOMIC PROSPECTS | JANUARY 2017 135
Tunisia’s parliament passed legislation that will simplify the steps required to set up investment projects and ease repatriation of project profits to foreign investors. Jordan enacted legislation to enable direct investment in energy and infrastructure projects from GCC countries (IMF 2016n). Across the region, there was an acceleration in the pace of business reforms in 2016, although the business environment remains poor relative to other regions (World Bank 2017).
Following two years of unrestrained output to gain market share, OPEC decided at the end of November to limit production to 32.5-33 million barrels per day in 2017. This was followed, in early December, by an agreement between OPEC and non-OPEC producers to curtail production. The plan, if implemented, would be the first agreed production cut since 2008.
Outlook
Growth in the Middle East and North Africa is forecast to recover modestly, to 3.1 percent in 2017 and to 3.3 percent in 2018 and 2019, with the pickup in activity strongest among oil-importing countries (Figure 2.4.6). Growth in oil exporters is projected to rise at a slower pace, supported by an envisaged upturn in oil prices from an average of $43 per barrel in 2016 to $55 in 2017, $60 in 2018, and $63 in 2019 and unchanged conflict conditions. Continued rebalancing in the global oil market, as consumption rises and non-OPEC supply declines, will support the envisaged rise in prices.
Among oil exporters, the pace of recovery will be slower than expected in June 2016, largely because of developments in Saudi Arabia and Iraq (Table 2.4.2). While growth in GCC countries will rise—particularly in Qatar in 2017, with new gas production expected to come onstream—the pace will remain well below its long-term average. The growth forecast for Saudi Arabia, at 1.6 percent in 2017 and 2.5 percent in 2018, has been lowered as more details about the country’s fiscal and structural adjustment plans emerged and as the scope of the slowdown in the non-oil sector became clearer.
Growth in non-GCC oil-exporting countries is expected to be slightly above long-term average rates through 2019, supported mainly by the robust Iranian outlook. Growth in the Islamic Republic of Iran depends critically on the successful negotiation of deals to bring foreign investment into the country, but the forecast also reflects the government’s intention to continue to expand oil production. Iraq is expected to experience a significant growth slowdown in 2017 due to oil production capacity constraints and cuts in public investment under the fiscal consolidation program. Algeria is set to experience a slow slide in growth rates, as spending on public works has been slashed and meaningful tax and subsidy reform has been delayed.
Oil-importing countries are expected to experience a broad-based growth acceleration during the forecast period, with growth returning to just under its long-term average by 2019. In Egypt, the pace of growth, currently envisaged to rise to 5.4 percent in FY2019 (after dipping to 4.0 percent in FY2017), is highly dependent on two issues: how quickly the economy can adjust to the adoption of a floating exchange rate regime that occurred in November, and how rapidly the government applies fiscal consolidation. Higher agricultural sector output in Morocco is expected to support a
FIGURE 2.4.6 Growth outlook
Regional growth is expected to accelerate during the forecast period in
both oil-exporting and oil-importing countries but will remain well below the
long-term average in GCC countries. The outlook is highly dependent on
the path of oil prices, which has been revised up modestly since mid-2016. The end-November OPEC agreement to cut production is not expected to
significantly impact global oil prices.
B. Oil price outlook A. GDP growth
Sources: Haver Analytics, National Statistical Agencies, World Bank.
A. Non-GCC oil exporters are Algeria, Iraq, and the Islamic Republic of Iran.
B. Historical oil prices reflect the average of monthly data for each given year. All historical and
forecasted oil prices are in nominal U.S. dollars.
0
1
2
3
4
5
ME
NA
Oil
impo
rters
GC
C
No
n-G
CC
oil
export
ers
2016 2017 2018 2019 1991-2008Percent
30
40
50
60
70
80
90
100
110
200
7
200
8
200
9
201
0
201
1
201
2
201
3
201
4
201
5
201
6
201
7
201
8
201
9
Historical priceAverage price, 2014M7-2016M11
US$ per barrel
Currentforecast
June 2016 forecast
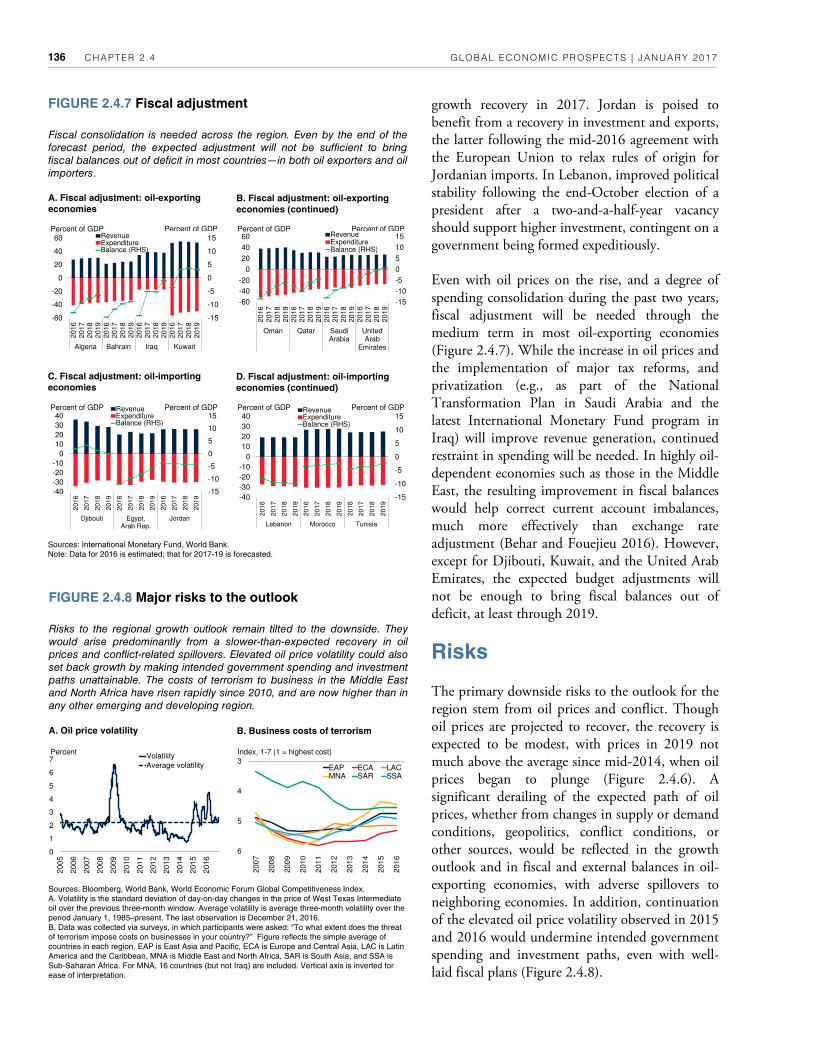
CHAPTER 2 .4 GLOBAL ECONOMIC PROSPECTS | JANUARY 2017 136
growth recovery in 2017. Jordan is poised to benefit from a recovery in investment and exports, the latter following the mid-2016 agreement with the European Union to relax rules of origin for Jordanian imports. In Lebanon, improved political stability following the end-October election of a president after a two-and-a-half-year vacancy should support higher investment, contingent on a government being formed expeditiously.
Even with oil prices on the rise, and a degree of spending consolidation during the past two years, fiscal adjustment will be needed through the medium term in most oil-exporting economies (Figure 2.4.7). While the increase in oil prices and the implementation of major tax reforms, and privatization (e.g., as part of the National Transformation Plan in Saudi Arabia and the latest International Monetary Fund program in Iraq) will improve revenue generation, continued restraint in spending will be needed. In highly oil-dependent economies such as those in the Middle East, the resulting improvement in fiscal balances would help correct current account imbalances, much more effectively than exchange rate adjustment (Behar and Fouejieu 2016). However, except for Djibouti, Kuwait, and the United Arab Emirates, the expected budget adjustments will not be enough to bring fiscal balances out of deficit, at least through 2019.
Risks
The primary downside risks to the outlook for the region stem from oil prices and conflict. Though oil prices are projected to recover, the recovery is expected to be modest, with prices in 2019 not much above the average since mid-2014, when oil prices began to plunge (Figure 2.4.6). A significant derailing of the expected path of oil prices, whether from changes in supply or demand conditions, geopolitics, conflict conditions, or other sources, would be reflected in the growth outlook and in fiscal and external balances in oil-exporting economies, with adverse spillovers to neighboring economies. In addition, continuation of the elevated oil price volatility observed in 2015 and 2016 would undermine intended government spending and investment paths, even with well-laid fiscal plans (Figure 2.4.8).
FIGURE 2.4.7 Fiscal adjustment
Fiscal consolidation is needed across the region. Even by the end of the
forecast period, the expected adjustment will not be sufficient to bring
fiscal balances out of deficit in most countries—in both oil exporters and oil
importers.
B. Fiscal adjustment: oil-exporting
economies (continued)
A. Fiscal adjustment: oil-exporting
economies
D. Fiscal adjustment: oil-importing
economies (continued)
C. Fiscal adjustment: oil-importing
economies
Sources: International Monetary Fund, World Bank.
Note: Data for 2016 is estimated; that for 2017-19 is forecasted.
FIGURE 2.4.8 Major risks to the outlook
Risks to the regional growth outlook remain tilted to the downside. They
would arise predominantly from a slower-than-expected recovery in oil
prices and conflict-related spillovers. Elevated oil price volatility could also
set back growth by making intended government spending and investment
paths unattainable. The costs of terrorism to business in the Middle East
and North Africa have risen rapidly since 2010, and are now higher than in
any other emerging and developing region.
B. Business costs of terrorism A. Oil price volatility
Sources: Bloomberg, World Bank, World Economic Forum Global Competitiveness Index.
A. Volatility is the standard deviation of day-on-day changes in the price of West Texas Intermediate
oil over the previous three-month window. Average volatility is average three-month volatility over the
period January 1, 1985–present. The last observation is December 21, 2016.
B. Data was collected via surveys, in which participants were asked: “To what extent does the threat
of terrorism impose costs on businesses in your country?” Figure reflects the simple average of
countries in each region. EAP is East Asia and Pacific, ECA is Europe and Central Asia, LAC is Latin
America and the Caribbean, MNA is Middle East and North Africa, SAR is South Asia, and SSA is
Sub-Saharan Africa. For MNA, 16 countries (but not Iraq) are included. Vertical axis is inverted for
ease of interpretation.
-15
-10
-5
0
5
10
15
-60
-40
-20
0
20
40
60
20
16
20
17
20
18
20
19
20
16
20
17
20
18
20
19
20
16
20
17
20
18
20
19
20
16
20
17
20
18
20
19
Algeria Bahrain Iraq Kuwait
RevenueExpenditureBalance (RHS)
Percent of GDP Percent of GDP
-15
-10
-5
0
5
10
15
-60
-40
-20
0
20
40
60
20
16
20
17
20
18
20
19
20
16
20
17
20
18
20
19
20
16
20
17
20
18
20
19
20
16
20
17
20
18
20
19
Oman Qatar SaudiArabia
UnitedArab
Emirates
RevenueExpenditureBalance (RHS)
Percent of GDP Percent of GDP
-15
-10
-5
0
5
10
15
-40
-30
-20
-10
0
10
20
30
40
2016
2017
2018
2019
2016
2017
2018
2019
2016
2017
2018
2019
Djibouti Egypt,Arab Rep.
Jordan
RevenueExpenditureBalance (RHS)
Percent of GDP Percent of GDP
-15
-10
-5
0
5
10
15
-40
-30
-20
-10
0
10
20
30
40
2016
2017
2018
2019
2016
2017
2018
2019
2016
2017
2018
2019
Lebanon Morocco Tunisia
RevenueExpenditureBalance (RHS)
Percent of GDP Percent of GDP
0
1
2
3
4
5
6
7
200
5
200
6
200
7
200
8
200
9
201
0
201
1
201
2
201
3
201
4
201
5
201
6
Volatility
Average volatility
Percent3
4
5
6
200
7
200
8
200
9
201
0
201
1
201
2
201
3
201
4
201
5
201
6
EAP ECA LACMNA SAR SSA
Index, 1-7 (1 = highest cost)

MIDDLE EAST AND NORTH AFR ICA GLOBAL ECONOMIC PROSPECTS | JANUARY 2017 137
Spillovers from existing conflicts in several countries and a heightened incidence of terrorism, which have already had significant damage on physical and human capital, also remain a risk for regional growth (World Bank 2016n). The economic, security, and humanitarian spillovers from the prolonged conflict in Syria could have yet more adverse spillovers on neighboring countries. In Iraq, notwithstanding the recent gains in the fight against ISIS, there is a medium- to long-term risk of economic disruption through rising sectarianism. Escalating conflict-related risks could be expected to increase economic uncertainty and slow investment. The costs of terrorism to business in the Middle East and North Africa are already higher than in other emerging and developing regions.
Across the region, deep fiscal and structural reforms on the horizon could trigger popular discontent among populations reliant on government support for products and services, with possible negative spillovers for confidence, foreign investment, and growth. In Algeria, for instance, long delays in tax and subsidy reform, despite acute fiscal pressures, likely reflect the political risk related to scaling back longstanding food and fuel subsidies. Similar political risk was likely behind Egyptian authorities’ reluctance to implement an additional round of fuel subsidy reductions in FY2016. The social response to subsidy reform in the Middle East and North Africa in recent years has been mixed. In some countries, the process has been marked by vigorous protests. In others, compensatory measures, such as targeted cash transfers, have contributed to a calmer reception (Verne 2016).
Spillovers from major economies, as well, could impact economic conditions in the Middle East and North Africa. The region relies principally on the European Union for financial flows, although the United States contributes materially to flows to certain countries (Figure 2.4.9). The stock of U.S. foreign direct investment (FDI) in Egypt, for instance, averaged 6 percent of domestic GDP during 2010–15, and 5 percent in Qatar. Lebanon received remittance inflows from the United States of more than 3 percent of its GDP during the same period. Heightened policy uncertainty in the
United States or the Euro Area could potentially reduce these shares significantly. A growth or investment slowdown in either the United States or the Euro Area could be expected to be accompanied by slowing output or investment growth across emerging and developing economies (Figure 2.4.10). For GCC countries, the normalization of monetary policy in the United States could pose an indirect risk to growth. The cost of external financing, on which countries in
FIGURE 2.4.9 Risks of uncertainty in major advanced
economies
Among major advanced economies, the Middle East and North Africa is
reliant principally on the European Union as an export destination and a
source of financial inflows, though the United States contributes materially
to financial inflows in some countries. This suggests some potential
negative effects from an increase in U.S. policy uncertainty.
B. Share of major economies in world
economy, 2010-15 average
A. Trade and financial exposures to
major economies, 2010-15 average
D. Impact of 10 percent increase in
VIX on EMDE investment growth
C. Largest trade and financial
exposures to major advanced
economies, 2010-15 average
Sources: Bank for International Settlements, Haver Analytics, International Monetary Fund, World
Bank.
A.B.C. Exports (A.) includes exports of goods only. Foreign claims refer to total claims of
BIS-reporting banks on foreign banks and nonbanks. Stock market capitalization is the market value
of all publicly-traded shares. FDI data is available only to 2014. Inward FDI and portfolio investment
are presented as stocks. Other indicators are flows. Trade (B.) includes both exports and imports.
“US” stands for United States; “EU” stands for European Union.
C. Figure shows exports to the United States/European Union, remittances from the United States/
European Union, and FDI from the United States/European Union (all in percent of GDP). Chart
shows only the countries with the largest exposures to the United States and Euro Area. FDI is
presented as a stock. Other indicators are flows.
D. Cumulative responses of EMDE investment to a 10 percent increase in the VIX. Solid lines
indicate the median responses and the dotted lines indicate 16-84 percent confidence intervals.
Vector autoregressions are estimated with sample for 1998Q1-2016Q2. The model includes, in this
order, the VIX, MSCI Emerging Markets Index (MXEM), J. P.Morgan Emerging Markets Bond Index
(EMBIG), aggregate real output and investment growth in 18EMDEs with G7 real GDP growth, U.S.
10-year bond yields, and MSCI World Index as exogenous regressors and estimated with two lags.
0
10
20
30
40
50
Lib
ya
Tu
nis
ia
Alg
eri
a
Moro
cco
Ira
q
Egyp
t, A
rab
Rep
.
Moro
cco
Qa
tar
Lib
ya
Alg
eri
a
Le
ba
no
n
Moro
cco
Tu
nis
ia
Jord
an
Djib
outi
Exports FDI Remittances
European Union United States
Percent of GDP
-2.0
-1.5
-1.0
-0.5
0.0
1 2 3 4 5 6 7 8
Quarter
Percentage points
0
20
40
60
80
100
GDP(market
exchangerates)
GDP(PPP)
Trade Foreignclaims
Stockmarket
capitalization
U.S. China EU Japan Other
Percent of total
0
20
40
60
80
100
Exports InwardFDI
Remittanceinflows
Portfolioliabilities
Foreignclaims
U.S. China EU Japan Other
Percent of total

CHAPTER 2 .4 GLOBAL ECONOMIC PROSPECTS | JANUARY 2017 138
the region are becoming more dependent, would rise. In addition, maintenance of currency pegs with the U.S. dollar would require central banks to raise domestic interest rates, despite the environment of subdued economic activity.
Policy challenges
Countries in the Middle East and North Africa face four key economic challenges: ensuring macroeconomic stability, of which sound public finances are a key aspect; diversifying oil-exporting economies away from hydrocarbons; facilitating a more dynamic private sector; and harnessing the benefits of the region’s demographic profile through labor market reforms.
Macroeconomic stability
Sustained efforts to achieve more sustainable fiscal positions in both oil-exporting and oil-importing countries in the region are essential for macroeconomic stability. Authorities who have announced country-level plans to broaden tax bases and improve fiscal discipline will now need to carry them out. Credible fiscal plans and their robust implementation are critical to maintaining good sovereign credit ratings and access to international financing.
Appropriate monetary and financial sector policies will help support fiscal sustainability. Banking sectors in GCC countries remain sound, but it is possible that selectivity in lending may increase and borrowing costs for public and private sector clients will rise and that asset quality will come under pressure. Empirical evidence suggests that changes in oil prices in these countries have a significant impact on non-performing loan ratios (Khandelwal, Miyajima, and Santos 2016; Miyajima 2016).
In Egypt, the central bank must navigate the recent move to a more flexible exchange rate regime. Gradually reducing inflation is a priority, including by ensuring that the new value-added tax results in only a one-time increase in inflation rather than an ongoing spiral. In the Islamic Republic of Iran, the central bank needs to complete the unification of the exchange rate, which is behind schedule, and address weaknesses in the banking sector. Tight banking sector supervision and regulation will help reduce high levels of nonperforming loans and increase low bank capital. Continued efforts to tighten anti-money laundering regulations and combat the financing of terrorism will help to reintegrate Iranian banks into the global financial system.
Diversification
For oil exporters in the region, diversifying away from dependence on oil is important to reduce the boom-bust cycles related to oil price developments. While there has been some progress over the long term (for example in Bahrain and the United Arab Emirates), dependence on oil
FIGURE 2.4.10 Spillovers from the United States and the
Euro Area
A slowdown in U.S. or Euro Area output growth would reduce output
growth in EMDEs considerably. EMDE investment would respond more
strongly, possibly reflecting investor concerns about long-term growth
prospects.
B. Output growth: Impact of 1
percentage point slowdown in Euro
Area output on EMDEs
A. Output growth: Impact of 1
percentage point slowdown in
U.S. output growth on EMDEs
D. Investment growth: Impact of 1
percentage point slowdown in Euro
Area output growth on EMDEs
C. Investment growth: Impact of 1
percentage point slowdown in U.S.
output growth on EMDEs
Sources: Haver Analytics, International Monetary Fund, World Bank.
Notes: Cumulative impulse response of weighted average EMDES output growth (A.B.) or investment
growth (C.D.) at 1-8 quarter horizons to a 1 percentage point decline in growth in real GDP in the
United States (A.C.) and Euro Area (B.D.). Growth spillovers based on a Bayesian vector
autoregression of world GDP (excluding the source country of spillovers), output growth in the source
country of the shock, the U.S. 10-year sovereign bond yield pulse JP Morgan’s EMBI index,
investment (C.D.) or output (A.B.) in EMDEs excluding China and oil price as an exogenous variable.
Solid lines indicate the median responses and the dotted lines indicate 16-84 percent confidence
intervals.
-2.0
-1.5
-1.0
-0.5
0.0
1 2 3 4 5 6 7 8
Percentage points
Quarter
-2.5
-2.0
-1.5
-1.0
-0.5
0.0
0.5
1 2 3 4 5 6 7 8
Percentage points
Quarter
-5
-4
-3
-2
-1
0
1
1 2 3 4 5 6 7 8
Percentage points
Quarter
-6
-5
-4
-3
-2
-1
0
1
1 2 3 4 5 6 7 8
Percentage points
Quarter

MIDDLE EAST AND NORTH AFR ICA GLOBAL ECONOMIC PROSPECTS | JANUARY 2017 139
FIGURE 2.4.11 Policy challenges
The extended period of low oil prices has reinforced the need for oil
exporters to diversify their economies. Across the region, there is a need to
undertake reforms to facilitate a more dynamic private sector. Such reforms
could help reduce high reliance on the public sector employment across
the region and, in the medium and long term, create more jobs for the large
working-age population.
B. Export dependence on
hydrocarbons
A. Economic dependence on
hydrocarbons
D. Working-age population C. Firms’ perceived obstacles
Sources: Haver Analytics; European Bank for Reconstruction and Development (EBRD), European
Investment Bank (EIB), and World Bank (2016); World Integrated Trade Solutions (WITS); United
Nations.
A. Figure shows the simple average of the share of oil and gas production in GDP over the indicated
year spans. Qatar shows the share of mining and quarrying (which includes oil and gas) in GDP.
B. Figure shows the simple average of the share of oil and gas exports as a share of total goods
exports over the indicated year spans.
C. Individual bars reflect the share of firms choosing the indicated issue as their top obstacle in
firm-level surveys conducted in 2013. “Informal sector” category was presented as “informal sector
policies” in surveys.
D. Figure shows simple average of working-age population across countries in each region. Markers
along the lines indicate the peak of the working-age population share; in Sub-Saharan Africa, the
share is expected to peak in 2075. EAP is East Asia and Pacific, ECA is Europe and Central Asia,
LAC is Latin America and the Caribbean, MNA is Middle East and North Africa, SAR is South Asia,
and SSA is Sub-Saharan Africa.
remains strong (Figure 2.4.11). Government reliance on oil and gas for revenue is substantial. Further, as hydrocarbon industries are largely publicly owned, it will be important to address shortcomings in private sector development, so that the direct negative effects of oil price fluctuations are not so concentrated. This includes implementing policies to reduce reliance on jobs in the public sector, which accounts for 80 percent or more of employment of nationals in some GCC countries (Sommer et al. 2016). In the short and medium term, however, the deteriorating environment for global trade will be a challenge to developing non-oil sources of export revenue.
Private sector development
In oil-importing economies, as well, reforms to facilitate a more dynamic private sector will yield important dividends. Enterprise surveys covering the seven oil-importing economies in the region highlight four primary reform needs: improving the business environment, including reducing corruption and improving electricity supply; reducing financial exclusion, especially for small- and medium-size firms; improving labor market participation and labor productivity, including bolstering employment opportunities for women and youth and enhancing labor force skills; and increasing openness to trade, including through more effective customs and trade regulations (EBRD, EIB, and World Bank 2016). The most formidable obstacle cited in enterprise surveys, however, is political instability.
Harnessing demographic benefits
Domestic authorities across the region must adjust policy in order to seize the benefits of the region’s demographic profile. Not only does the region have the highest share of working-age population among all developing regions, but the share of working-age population is expected to continue to grow through 2035, much longer than in several other emerging and developing regions. A growing working-age population share can confer important benefits, including higher growth and lower poverty (World Bank 2015c). However, taking advantage of this will depend on sufficient employment opportunities for those of working
0
20
40
60
80
100
Alg
eri
a
Ba
hra
in
Ira
q
Ku
wa
it
Om
an
Qa
tar
Sau
di
Ara
bia
Unite
d A
rab
Em
irate
s
1996-2000 2001-052006-10 2011-15
Percent of GDP
0
20
40
60
80
100
Alg
eri
a
Ba
hra
in
Ira
q
Ku
wa
it
Om
an
Qa
tar
Sa
ud
iA
rab
iaU
nite
d A
rab
Em
ira
tes
Ye
me
n,
Rep
.
2001-05 2006-10 2011-15Percent of exports
0
10
20
30
40
50
60P
olit
ical
inst
abili
ty
Ele
ctr
icity
Acc
ess to
finance
Corr
uption
Info
rmal
secto
r
Tax r
ate
s
Work
ers
'education
Egypt, Arab Rep.JordanLebanonMoroccoTunisia
Percent of firms
5052545658606264666870
1980
1985
1990
1995
2000
2005
2010
2015
2020
2025
2030
2035
2040
2045
2050
EAP ECA LAC
MNA SAR SSA
Percent of population aged 15-64
age. Unemployment rates, particularly among youth, remain very high, while the capacity of labor markets to absorb new entrants will decline in the medium term in some countries (IMF 2016o). Demographic and labor market conditions highlight the urgency of reducing incentives to work in the public sector, better aligning the skills and education of the young workforce to market demands, and lessening labor law rigidity. Fostering a more inclusive economic environment may improve social cohesion (OECD 2016) and help prevent violent extremism in the region (World Bank 2016o).

CHAPTER 2 .4 GLOBAL ECONOMIC PROSPECTS | JANUARY 2017 140
2014 2015 2016 2017 2018 2019 2015 2016 2017 2018
Estimates Projections (percentage point difference
from June 2016 projections)
EMDE MENA, GDPa
3.3 3.2 2.7 3.1 3.3 3.4 0.4 -0.1 0.0 -0.1
(Average including economies with full national accounts and balance of payments data only)b
EMDE MENA, GDPb 3.4 3.2 2.6 3.1 3.4 3.5 0.5 -0.1 0.0 0.1
GDP per capita (U.S. dollars) 1.4 1.3 0.9 1.5 2.0 2.1 0.5 -0.1 0.0 0.2
PPP GDP 3.5 3.2 2.8 3.3 3.6 3.7 0.5 -0.1 0.0 0.1
Private consumption 6.3 2.3 2.8 3.0 3.4 3.5 -0.3 0.0 0.0 0.1
Public consumption 7.0 -0.5 -0.6 0.9 2.1 2.3 -2.8 -0.8 0.2 -0.1
Fixed investment 6.6 2.7 -1.4 3.7 3.5 3.9 5.3 1.0 1.9 1.2
Exports, GNFSc 2.4 0.9 4.9 5.2 4.9 5.0 -2.6 0.0 0.6 0.5
Imports, GNFSc 7.1 -1.3 0.8 4.9 5.2 5.4 -2.2 1.3 1.6 1.2
Net exports, contribution to growth -1.7 1.0 2.0 0.6 0.3 0.3 -0.4 -0.6 -0.4 -0.4
Memo items: GDP
Oil exporters 3.4 3.1 2.7 2.9 3.1 3.1 0.5 -0.1 -0.1 -0.1
GCC countriesd 3.2 3.5 1.6 2.2 2.6 2.7 0.6 -0.4 -0.1 -0.1
Saudi Arabia 3.6 3.5 1.0 1.6 2.5 2.6 0.1 -0.9 -0.4 0.2
Iran, Islamic Rep. 4.3 1.7 4.6 5.2 4.8 4.5 0.1 0.2 0.3 0.1
Oil importers 3.0 3.6 3.0 3.9 4.2 4.5 0.3 0.1 0.2 0.2
Egypt, Arab Rep. 3.7 4.4 4.2 4.4 5.1 5.4 0.8 0.4 0.0 0.5
Fiscal year basis 2.9 4.4 4.3 4.0 4.7 5.4 0.2 1.0 -0.2 0.1
Source: World Bank.
World Bank forecasts are frequently updated based on new information and changing (global) circumstances. Consequently, projections presented here may differ from those contained in
other Bank documents, even if basic assessments of countries’ prospects do not differ at any given moment in time.
a. EMDE refers to emerging market and developing economy. GDP at market prices and expenditure components are measured in constant 2010 U.S. dollars. Excludes Libya, Syrian Arab
Republic and Republic of Yemen due to data limitations.
b. Sub-region aggregate excludes Djibouti, Iraq, and West Bank and Gaza, for which data limitations prevent the forecasting of GDP components.
c. Exports and imports of goods and non-factor services (GNFS).
d. Gulf Cooperation Council (GCC) countries includes Bahrain, Kuwait, Oman, Qatar, Saudi Arabia, and United Arab Emirates.
For additional information, please see www.worldbank.org/gep.
TABLE 2.4.1 Middle East and North Africa forecast summary
(Real GDP growth at market prices in percent, unless indicated otherwise)

MIDDLE EAST AND NORTH AFR ICA GLOBAL ECONOMIC PROSPECTS | JANUARY 2017 141
2014 2015 2016 2017 2018 2019 2015 2016 2017 2018
Estimates Projections (percentage point difference
from June 2016 projections)
Algeria 3.8 3.9 3.6 2.9 2.6 2.8 1.0 0.2 -0.2 -0.1
Bahrain 4.4 2.9 2.0 1.8 2.1 2.4 0.0 -0.2 -0.2 0.2
Djibouti 6.0 6.5 6.5 7.0 7.0 7.0 0.0 0.0 0.0 0.0
Egypt, Arab Rep. 3.7 4.4 4.2 4.4 5.1 5.4 0.8 0.4 0.0 0.5
Fiscal year basis 2.9 4.4 4.3 4.0 4.7 5.4 0.2 1.0 -0.2 0.1
Iran, Islamic Rep. 4.3 1.7 4.6 5.2 4.8 4.5 0.1 0.2 0.3 0.1
Iraq 0.1 2.9 10.2 1.1 0.7 1.1 0.5 3.0 -3.6 -4.5
Jordan 3.1 2.4 2.3 2.6 3.1 3.4 0.0 -0.7 -0.7 -0.5
Kuwait 0.5 1.8 2.0 2.4 2.6 2.8 3.1 0.7 0.8 0.2
Lebanon 1.8 1.3 1.8 2.2 2.3 2.5 -0.2 0.0 -0.1 -0.2
Morocco 2.6 4.5 1.5 4.0 3.5 3.6 0.1 -0.2 0.6 -0.1
Omanb 2.5 5.7 2.5 2.9 3.4 3.6 2.4 0.9 1.0 0.8
Qatar 4.0 3.6 1.8 3.6 2.1 1.3 -0.3 -1.5 0.1 -1.9
Saudi Arabia 3.6 3.5 1.0 1.6 2.5 2.6 0.1 -0.9 -0.4 0.2
Tunisia 2.3 0.8 2.0 3.0 3.7 4.0 0.0 0.2 0.5 0.7
United Arab Emirates 3.1 3.8 2.3 2.5 3.0 3.3 0.4 0.3 0.1 0.0
West Bank and Gaza -0.2 3.5 3.3 3.5 3.5 3.6 0.0 0.0 0.0 -0.1
Source: World Bank.
World Bank forecasts are frequently updated based on new information and changing (global) circumstances. Consequently, projections presented here may differ from those contained in
other Bank documents, even if basic assessments of economies’ prospects do not significantly differ at any given moment in time.
a. GDP at market prices and expenditure components are measured in constant 2010 U.S. dollars. Excludes Libya, Syrian Arab Republic, and Republic of Yemen due to data limitations.
b. A recent rebasing of Oman's GDP has resulted in significant revisions to historical and forecast growth rates compared to June 2016.
For additional information, please see www.worldbank.org/gep.
TABLE 2.4.2 Middle East and North Africa economy forecastsa
(Real GDP growth at market prices in percent, unless indicated otherwise)

CHAPTER 2 .4 GLOBAL ECONOMIC PROSPECTS | JANUARY 2017 142
BOX 2.4.1 Recent investment slowdown: Middle East and North Africa
Severe terms-of-trade deteriorations and uncertainty associated with deep political changes have weighed on investment in the region. Investment growth slowed from 4.4 percent in 2010 to 2.6 percent in 2015. Investment needs remain sizable in non-Gulf Cooperation Council EMDEs in the region, especially in transport and energy infrastructure.
The Middle East and North Africa (MNA) accounted for 4 percent of global investment, on average, during 2010–15.1 Investment growth in the region slowed from 4.4 percent in 2010 to 2.6 percent in 2015, far below the long-term (1990–2008) average of 7.2 percent, with considerable divergence among oil exporters and importers (Figure 2.4.1.1).
This box discusses the following questions:
• How has investment growth in the region evolved?
• What were the main sources of the investment slowdown?
• What are the remaining investment needs?
• Which policies can help address investment needs?
The Box documents the recent slowdown in investment growth in the Middle East and North Africa due to the severe terms-of-trade deteriorations in oil-exporting economies and uncertainty associated with deep political changes in several oil-importing economies. Remaining investment needs are sizable, especially in the transport and energy sectors.
How has investment growth in the region
evolved?
In 2015, investment growth remained below its long-term average in 70 percent of EMDEs in the region, and investment contracted 30 percent of the EMDEs in the region. However, investment developments have diverged between oil exporters and oil importers since the broad-based slowdown in investment growth during 2010–13.
Investment growth in oil-exporting economies has evolved in line with oil prices, which rose rapidly in 2010 and 2011. When the steep oil price decline began in mid-2014, governments initially responded with additional fiscal stimulus, often in the form of public investment. As
a result, investment growth in oil-exporting economies rose more than 3 percentage points in 2014, to 7.3 percent. Yet, sharp oil revenue losses and fiscal constraints brought project delays and cancellations in 2015. Investment growth fell to an average of 2.4 percent in 2015, the slowest pace since 1994, and investment contracted in three of the four largest oil-exporting economies in the region (Algeria, Islamic Republic of Iran, and Saudi Arabia). Preliminary data suggest further contraction in investment in 2016 in oil-exporting economies. For example, Saudi Arabia, the largest economy in the region, experienced a 16 percent year-on-year contraction in the first half of the year.
Among oil-importing countries, investment growth de-celerated sharply in 2011, to 0.2 percent, when mounting political tensions during the Arab Spring were rapidly followed by an intensifying Euro Area sovereign debt crisis. The sharp recovery of investment growth in 2015, to 4.0 percent, reflected efforts to address infrastructure needs in the Arab Republic of Egypt and Morocco, the two largest oil-importing economies in the region, while investment contracted in several smaller oil importers (Jordan, Lebanon, Tunisia). The private sector contributed more strongly than the public sector to investment growth in Egypt, a typical pattern among oil importers. Even with the recovery in 2015, investment growth in oil-importing countries was still below the long-term average of 5.1 percent. Heightened balance of payments and fiscal pressures in Egypt were likely accompanied by weaker investment growth in 2016. Recently-implemented structural reforms and expan-sionary policy among oil-importing countries may lift investment in the medium term, however (IMF 2016p).
What were the main sources of the investment
slowdown?
A severe terms-of-trade deterioration in oil exporters, far-reaching political changes, and spillovers from armed conflict in several countries in the region weighed heavily on activity and sentiment. As growth prospects dimmed, especially among oil-exporting countries, investment growth slowed sharply across the region.
Oil-exporting countries—where oil and gas accounts for, on average, 40 percent of GDP, 70 percent of fiscal revenues, and 80 percent of goods exports—have been
Note: This box was prepared by Dana Vorisek. 1Throughout this box, unless otherwise specified, investment refers to real gross fixed capital formation (public and private combined). For the sake of brevity, “investment” is understood to indicate investment levels. Investment growth is measured as the annual percent change in real investment.
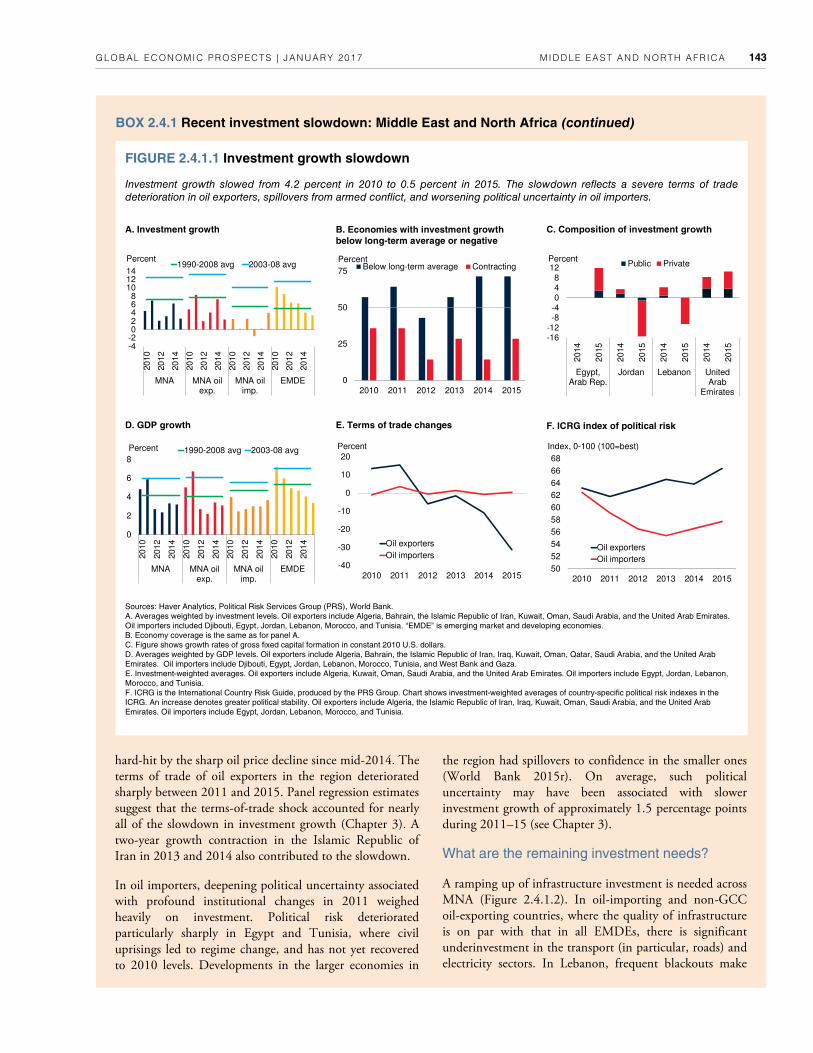
MIDDLE EAST AND NORTH AFR ICA GLOBAL ECONOMIC PROSPECTS | JANUARY 2017 143
BOX 2.4.1 Recent investment slowdown: Middle East and North Africa (continued)
A. Investment growth B. Economies with investment growth
below long-term average or negative
C. Composition of investment growth
D. GDP growth E. Terms of trade changes F. ICRG index of political risk
FIGURE 2.4.1.1 Investment growth slowdown
Investment growth slowed from 4.2 percent in 2010 to 0.5 percent in 2015. The slowdown reflects a severe terms of trade
deterioration in oil exporters, spillovers from armed conflict, and worsening political uncertainty in oil importers.
Sources: Haver Analytics, Political Risk Services Group (PRS), World Bank.
A. Averages weighted by investment levels. Oil exporters include Algeria, Bahrain, the Islamic Republic of Iran, Kuwait, Oman, Saudi Arabia, and the United Arab Emirates.
Oil importers included Djibouti, Egypt, Jordan, Lebanon, Morocco, and Tunisia. “EMDE” is emerging market and developing economies.
B. Economy coverage is the same as for panel A.
C. Figure shows growth rates of gross fixed capital formation in constant 2010 U.S. dollars.
D. Averages weighted by GDP levels. Oil exporters include Algeria, Bahrain, the Islamic Republic of Iran, Iraq, Kuwait, Oman, Qatar, Saudi Arabia, and the United Arab
Emirates. Oil importers include Djibouti, Egypt, Jordan, Lebanon, Morocco, Tunisia, and West Bank and Gaza.
E. Investment-weighted averages. Oil exporters include Algeria, Kuwait, Oman, Saudi Arabia, and the United Arab Emirates. Oil importers include Egypt, Jordan, Lebanon,
Morocco, and Tunisia.
F. ICRG is the International Country Risk Guide, produced by the PRS Group. Chart shows investment-weighted averages of country-specific political risk indexes in the
ICRG. An increase denotes greater political stability. Oil exporters include Algeria, the Islamic Republic of Iran, Iraq, Kuwait, Oman, Saudi Arabia, and the United Arab
Emirates. Oil importers include Egypt, Jordan, Lebanon, Morocco, and Tunisia.
hard-hit by the sharp oil price decline since mid-2014. The terms of trade of oil exporters in the region deteriorated sharply between 2011 and 2015. Panel regression estimates suggest that the terms-of-trade shock accounted for nearly all of the slowdown in investment growth (Chapter 3). A two-year growth contraction in the Islamic Republic of Iran in 2013 and 2014 also contributed to the slowdown.
In oil importers, deepening political uncertainty associated with profound institutional changes in 2011 weighed heavily on investment. Political risk deteriorated particularly sharply in Egypt and Tunisia, where civil uprisings led to regime change, and has not yet recovered to 2010 levels. Developments in the larger economies in
the region had spillovers to confidence in the smaller ones (World Bank 2015r). On average, such political uncertainty may have been associated with slower investment growth of approximately 1.5 percentage points during 2011–15 (see Chapter 3).
What are the remaining investment needs?
A ramping up of infrastructure investment is needed across MNA (Figure 2.4.1.2). In oil-importing and non-GCC oil-exporting countries, where the quality of infrastructure is on par with that in all EMDEs, there is significant underinvestment in the transport (in particular, roads) and electricity sectors. In Lebanon, frequent blackouts make
0
25
50
75
2010 2011 2012 2013 2014 2015
Below long-term average ContractingPercent
-16-12-8-4048
12
20
14
20
15
20
14
20
15
20
14
20
15
20
14
20
15
Egypt,Arab Rep.
Jordan Lebanon UnitedArab
Emirates
Public PrivatePercent
0
2
4
6
8
20
10
20
12
20
14
20
10
20
12
20
14
20
10
20
12
20
14
20
10
20
12
20
14
MNA MNA oilexp.
MNA oilimp.
EMDE
1990-2008 avg 2003-08 avgPercent
-40
-30
-20
-10
0
10
20
2010 2011 2012 2013 2014 2015
Percent
Oil exporters
Oil importers
50
52
54
56
58
60
62
64
66
68
2010 2011 2012 2013 2014 2015
Index, 0-100 (100=best)
Oil exporters
Oil importers
-4-202468
101214
20
10
20
12
20
14
20
10
20
12
20
14
20
10
20
12
20
14
20
10
20
12
20
14
MNA MNA oilexp.
MNA oilimp.
EMDE
1990-2008 avg 2003-08 avgPercent

CHAPTER 2 .4 GLOBAL ECONOMIC PROSPECTS | JANUARY 2017 144
BOX 2.4.1 Recent investment slowdown: Middle East and North Africa (continued)
FIGURE 2.4.1.2 Infrastructure, health, and education indicators
Infrastructure investment needs are high, especially in electricity and transport. While the Middle East and North Africa per-
forms well relative to other EMDEs on basic health measures, it is at or below the EMDE average in terms of education indica-
tors, despite considerable long-term gains.
Sources: Estache et al. (2013), World Economic Forum Global Competitiveness Index, World Bank.
A. Values are constant 2005 U.S. dollars and indicate annual investment needs for 2011-20. Oil importers include Djibouti, Egypt, Jordan, Lebanon, Morocco, and Tuni-
sia. Non-GCC oil exporters include Algeria, the Islamic Republic of Iran, Iraq, Libya, Syria, and the Republic of Yemen. Gulf Cooperation Council (GCC) countries include
Bahrain, Kuwait, Oman, Qatar, Saudi Arabia, and the United Arab Emirates.
B. Unweighted averages of survey data. Data was collected using the question: “How would you assess general infrastructure (e.g., transport, telephony, energy) in your
country? (1 = extremely underdeveloped—among the worst in the world; 7 = extensive and efficient—among the best in the world).” Oil importers include Egypt, Jordan,
Lebanon, Morocco, and Tunisia. Non-GCC oil exporters include Algeria, the Islamic Republic of Iran, Libya, and the Republic of Yemen. GCC countries include Bahrain,
Kuwait, Oman, Qatar, Saudi Arabia, and the United Arab Emirates.
C. Blue bars denote range of unweighted regional averages across EMDE regions. Health expenditure per capita in purchasing power parity terms, unweighted averages
of 199 EMDEs, 34 AEs, and 17 MNA economies. Access to improved sanitation facilities (in percent of population), unweighted averages for 150 EMDEs, 33 AEs, and
19 MNA economies. Access to improved water sources (in percent of population), unweighted averages for 148 EMDEs, 34 AEs, and 18 MNA economies. Latest availa-
ble data available during 2011-15.
D. Blue bars denote range of unweighted regional averages across EMDE regions. Government expenditure per primary student (in percent of per capita income),
unweighted averages of 87 EMDEs, 32 AEs, and 8 MNA economies. Pupil-teacher ratio in primary education (headcount basis), unweighted averages for 165 EMDEs,
31 AEs, and 14 MNA economies. Latest available data available during 2011-15.
A. Infrastructure investment needs B. Quality of infrastructure
C. Selected health care indicators D. Selected education indicators
2
3
4
5
6
200
7
200
8
200
9
201
0
201
1
201
2
201
3
201
4
201
5
201
6
Oil importers Non-GCC oil exporters
GCC EMDE
Index, 1-7 (7=best)
0
20
40
60
80
100
120
0
500
1000
1500
2000
2500
3000
3500
4000
4500
Healthexpenditure (LHS)
Improvedsanitation (RHS)
Improved watersource (RHS)
Per capita
Range AE EMDE MNA
Percent of population
0
5
10
15
20
25
30
35
40
45
Government expenditure Pupil-teacher ratio
Percent of per capita income, ratio
Range AE EMDEs MNA
0
5
10
15
20
25
Electricity Transport ICT Water andsanitation
Oil importers
Non-GCC oil exporters
GCC
US$, billions
MIDDLE EAST AND NORTH AFR ICA GLOBAL ECONOMIC PROSPECTS | JANUARY 2017 145
electricity a binding constraint to competitiveness and doing business, and in recent years this was also the case in Egypt (World Bank 2015r; Le Borgne and Jacobs 2016). Large numbers of Syrian refugees in Jordan and Lebanon have compounded existing strains on infrastructure in those countries. In Syria, the cost of rebuilding infrastructure damaged or destroyed by war is estimated to be on the order of $100–200 billion (Gobat and Kostial 2016). Iraq, as well, faces large infrastructure investment needs, which have risen as a result of conflict.
GCC countries also have outstanding infrastructure investment needs, predominantly in electricity generation. With higher income levels, however, these countries also have greater capacity to fulfill such needs (IMF 2014a). GCC countries’ planned medium-term public spending on infrastructure generally tracks their infrastructure investment needs, while planned spending in oil-importing and non-GCC oil-exporting countries lags far behind needs (Ianchovichina et al. 2013).
Besides contributing to growth, higher investment in infrastructure could also help improve labor market conditions in MNA. One study estimated that each $1 billion of infrastructure investment has the potential to generate 110,000 infrastructure-related jobs, on average, in oil-importing MNA countries (Estache et al. 2013). It is key that countries prioritize investment projects to suit country conditions, however.
BOX 2.4.1 Recent investment slowdown: Middle East and North Africa (continued)
MNA scores well relative to other emerging and developing regions on basic health measures. However, the region is at or below the EMDE average in terms of education indicators, despite considerable long-term gains (World Bank 2011). MNA does not necessarily need to increase the level of investment in education, which has risen substantially over several decades, but rather to invest with the goal of increasing the quality of education, thereby supporting growth and lowering poverty (World Bank 2008).
Which policies can help address investment
needs?
Several policy measures could support investment in MNA. Across the region, the scaling back of subsidies since 2014 has created space for increased public spending on investment in infrastructure, health, and education (IMF 2016p). High public sector wage expenditures could be reduced, with funds reallocated to investment. Improvements in governance and investor protection could also support private sector investment, as could incentives to undertake public-private partnerships (e.g., in Morocco; EBRD 2015a). In some oil importers, the electricity sector would benefit from additional privatization (Lebanon) or efforts to incentivize the private sector’s contribution to electricity generation (Egypt). Finally, improved security conditions in the region are a prerequisite for a sustained pickup in investment.


Recent developments
Growth
South Asia’s growth remained steady at an estimated 6.8 percent in 2016, the same pace as in 2015, buoyed by robust domestic demand (Figure 2.5.1). South Asia is now the fastest-growing emerging market and developing economy (EMDE) region. Since 2013, the region has consistently exceeded its long-term growth average of 6 percent during 2000-14, benefitting from mutually reinforcing tailwinds of sustained low commodity prices, infrastructure investment, and generally accommodative monetary and fiscal policies. Limited global integration has shielded South Asia from negative external spillovers (World Bank 2016e). Growth in India (a country that represents four-fifths of South Asia’s GDP) is estimated to reach 7.0 percent in FY2017 (ending on 31 March 2017), accounting for much of the region’s expansion. Excluding India, the region grew 5.3 percent, with wide variations among countries (Table 2.5.1). Regional growth is
slightly below June projections, mainly reflecting a modest downgrade to India’s brisk expansion.
India’s growth in the first half of FY2017 was underpinned by robust private and public consumption, which offset slowing fixed investment, subdued industrial activity, and lethargic exports (Figure 2.5.2). Consumption was supported by lower energy costs, public sector salary and pension increases, and favorable monsoon rains, which boosted urban and rural incomes. Economic activity also benefitted from a pickup in foreign direct investment (FDI) and an increase in public infrastructure spending. Unexpected ‘demonetization’—the phasing out of large-denomination currency notes which were subsequently replaced with new ones—weighed on growth in the third quarter of FY2017.1 Weak industrial production and manufacturing and services purchasing managers’ indexes (PMI), further suggest a set back to activity in the fourth quarter of FY2017. A retrenchment in private
Economic activity in South Asia expanded by an estimated 6.8 percent in 2016, buoyed by robust domestic demand. India continued to post strong growth, reflecting ongoing tailwinds from low oil prices and support from structural reforms. Excluding India, regional growth is estimated at 5.3 percent in 2016; however, there were notable differences within the region depending on security issues, domestic policies, and reliance on remittance flows. Looking ahead, growth in the region is projected to edge up to an average of 7.3 percent in 2017-19, supported by dividends from ongoing policy reforms and strong domestic demand. Sluggish recovery in key export markets, weak private investment, and security challenges pose headwinds to the outlook. Risks are tilted to the downside, including reform setbacks, heightened domestic insecurity and political tensions, and unexpected tightening of financing conditions. Structural reforms, aided by supportive macroeconomic policies, could help mitigate some of the risks, and bolster the region’s long-term growth prospects.
Note: This section was prepared by Boaz Nandwa with contribu-tions from Jongrim Ha and Hideaki Matsuoka. Research assistance was provided by Anh Mai Bui and Shituo Sun.
1On November 8, 2016, the Indian government announced phasing out of large-denomination currency notes (Rs. 500 and Rs. 1,000, representing 86 percent of the total currency in circulation) as legal tender. They were immediately replaced with new Rs. 500 and Rs. 2,000 currency notes. This was undertaken to curb corruption, tax evasion, and counterfeiting. The withdrawal from circulation started immediately and ended on December 30, 2016.

CHAPTER 2 .5 GLOBAL ECONOMIC PROSPECTS | JANUARY 2017 148
investment, reflecting excess capacity, corporate deleveraging, and credit constraints due to impaired commercial banks’ balance sheets, also had an adverse effect on activity (Chapter 3; Box 2.5.1). For the whole of FY2017, growth is expected to decelerate to a still robust 7.0 percent.
In Pakistan, GDP growth (at factor cost) is expected to rise to 5.2 percent in FY2017 (ending 30 June 2017; Table 2.5.1). The uptick in activity was spurred by a combination of low commodity prices, rising infrastructure spending, and reforms that lifted domestic demand and improved the business climate (World Bank 2016p). The successful conclusion of Special Drawing Rights (SDR) 4.393 billion IMF Extended Fund Facility (EFF) program, aimed at supporting reforms and reducing fiscal and external sector vulnerabilities, lifted consumer and investor confidence. On October 5th, 2016, Pakistan tapped the
international market and issued a $1 billion five-year dollar-denominated Sukuk (Islamic) bond. The interest rate paid on the bond was lower compared to what the country paid two years ago for raising a similar amount using the same instrument. These positive factors more than offset weak industrial activity, the adverse impact of unfavorable weather on agriculture output, and terrorist attacks in urban areas.
In Sri Lanka, growth remained steady at 4.8 percent in 2016 from the previous year, boosted by strong activity in the construction and services (particularly tourism) sectors, as well as resumption of the $1.4 billion Colombo Port City real estate project. In addition, a loan of $1.5 billion from the IMF, under the EFF program, relieved balance of payments stress (IMF 2016q). However, flooding, a slowdown in exports, and a deceleration in private investment weighed on activity. Bangladesh’s growth is expected to ease to a still solid 6.8 percent in FY2017 (ending on 30 June 2017), from the official estimate of 7.1 percent in the previous fiscal year. Domestic security challenges compounded weak external demand and a mild pickup in private investment, offsetting an uptick in infrastructure spending and increased public sector wages (World Bank 2016q).2 A slowdown in oil-rich Gulf Cooperation Council (GCC) economies has led to receding remittances inflows to both Bangladesh and Sri Lanka, dampening private consumption and investment (De et al. 2016).
Elsewhere in the region, growth was mixed (Table 2.5.2). Nepal is set to rebound to an estimated 5.0 percent growth in FY2017 (ending on 15 July 2017), up from 0.6 percent posted in FY2016. An acceleration in post-earthquake reconstruction, together with favorable monsoon rains, will support economic activity. Lifting of the southern border blockade with India has normalized trade and eased supply-side bottlenecks. A slowdown in growth of remittances inflows from the GCC countries, however, has weighed on consumption and investment. Bhutan’s growth ticked up to an
FIGURE 2.5.1 Economic activity in South Asia
Growth in South Asia region (SAR) is estimated to remain steady at 6.8
percent in 2016, supported by robust domestic demand. South Asia’s
strong growth, driven by solid activity in India, exceeded the average of
EMDEs. Excluding India, growth edged up to 5.3 percent, with significant
heterogeneity across the countries. The region’s growth is projected to
strengthen to an average of 7.3 percent during 2017-19, benefitting from
policy reforms and accommodative monetary and fiscal policies.
B. Growth: Components of GDP A. GDP Growth in SAR
D. Growth: Components of GDP C. GDP Growth: SAR vs. EMDE
Sources: Haver Analytics, World Bank. A.-D. SAR is the South Asia region, comprised of the following: Afghanistan, Bangladesh, Bhutan, India, Pakistan, Maldives, Nepal, and Sri Lanka. 2016e is the estimated value and 2017f is forecast value. C.D. EMDE refers to emerging market and developing economies.
0
2
4
6
8
10
12
India
Ban
gla
desh
SA
R
Bh
uta
n
Sri
La
nka
Pakis
tan
Ma
ldiv
es
Nepa
l
Afg
ha
nis
tan
2015 2016e 2017f 2000-2014
Percent, year-on-year
2Bangladesh became one of the first countries to receive financing of a $165 million loan in 2016 from the Asian Infrastructure Investment Bank (AIIB) for electricity grid coverage expansion and an additional $60 million to build a gas transmission pipeline from Chittagong to Bakhrabad.
012345678
201
3
201
4
201
5
20
16e
201
3
201
4
201
5
20
16e
201
3
201
4
201
5
20
16e
EMDE SAR(incl. India)
SAR(excl. India)
Percent, year-on-year
1990-2008
-10
0
10
202
01
3
201
4
201
5
20
16
e
Consumption Investment
Exports Imports
GDP
Percent
02468
10
Invest
ment
Consum
ption
Invest
ment
Consum
ption
Invest
ment
Consum
ption
EMDE SAR SAR(excl. India)
2015 2016e 1990-2008Percent

SOUTH AS IA GLOBAL ECONOMIC PROSPECTS | JANUARY 2017 149
estimated 7.4 percent in 2016, lifted by tourism and construction of three major hydropower projects. Growth in Maldives rose to 3.5 percent in 2016, driven by construction and public infrastructure spending. Afghanistan recorded the weakest growth in the region, estimated at 1.2 percent in 2016. This is largely due to slowing domestic demand, deteriorating security, and drought which affected agriculture output. Resettlement of returning refugees from Pakistan further exerted fiscal pressure, constraining infrastructure investment.
External balances
Lower energy import bills mitigated the negative impact of reduced exports and remittances on current account balances which, except for Bangladesh, mostly continued to be in the deficit (Figure 2.5.3). Higher capital inflows contributed to reserves accumulation and helped stabilize the value of local currencies against the U.S. dollar. In a few countries (India, Pakistan), the trade-weighted real exchange rate appreciated, weakening export competitiveness (Eichengreen and Gupta 2013). Subdued external demand and increased non-energy imports in Sri Lanka weighed on its current account balance. In Bhutan, the current account deficit remained elevated, reflecting increased imports for the construction of hydropower projects. Increased imports for post-earthquake reconstruction amid receding remittances in Nepal worsened its current account balance.
Inflation
Regional inflation decelerated from 8.9 percent in 2015 to 5.7 percent in 2016, aided by improved harvests after favorable monsoon rains (Bangladesh, India, Sri Lanka), fiscal restraint (India, Pakistan), and pass-through of nominal exchange rate appreciation (Bangladesh, Pakistan). Reductions in administered prices (India) and lower energy costs contributed to easing inflationary pressures (Chinoy, Kumar, and Mishra 2016). With inflation in most countries within central bank target bands (Figure 2.5.4), monetary policy stances across the region remained broadly accommodative, except for Sri Lanka, where policy was tightened in the second
half of 2016 to contain rising inflation and to stabilize the Sri Lankan rupee.
Fiscal positions
Budget consolidation in Pakistan and Sri Lanka helped lower structural fiscal deficits in 2016, bringing them below the 2010-13 average of 7 percent of GDP (Figure 2.5.5). Reductions in energy subsidies and an increase in excise taxes eased spending pressures (India, Pakistan, Sri Lanka), but this was partly offset by public sector wage increases (Bangladesh, India), as well as political disagreements in the coalition government on spending priorities (Sri Lanka). Some efforts were made across the region to raise revenues. In India, a one-off revenue windfall from the Income Disclosure Scheme was offset by shortfalls from the telecommunication spectrum auction. Besides curbing discretionary spending, Sri Lanka’s revenue-raising efforts gained traction under the IMF’s EFF program, notably by
FIGURE 2.5.2 Economic activity in India
India accounts for almost four-fifths of SAR GDP. Robust private and
public consumption is likely to offset slowing fixed investment, weak
manufacturing activity, and lethargic exports In India.
B. Purchasing Managers’ Index (PMI) A. India GDP Growth
D. Merchandise exports C. Industrial production
Sources: Haver Analytics, World Bank. A. Real GDP growth change since 2014Q3 is the two-year quarterly change. The latest data point is 2016Q3. B. Index numbers greater than 50 denotes expansion and vice versa. C. Industrial production data is seasonally adjusted. The last observation is 2016Q3 for India and Pakistan, and 2016Q2 for Sri Lanka. D. Exports measured in values. The last observation is October 2016 for India and Pakistan, September for Sri Lanka and August for Bangladesh.
40
45
50
55
60
Jan-1
5
Mar-
15
Ma
y-1
5
Jul-1
5
Se
p-1
5
No
v-1
5
Jan-1
6
Mar-
16
Ma
y-1
6
Jul-1
6
Se
p-1
6
No
v-1
6
India Brazil China RussiaIndex
-6
-4
-2
0
2
4
6
8
201
4Q
2
201
4Q
3
201
4Q
4
201
5Q
1
201
5Q
2
201
5Q
3
201
5Q
4
201
6Q
1
201
6Q
2
201
6Q
3
India Pakistan Sri Lanka
Percent, quarter-on-quarter
-60
-40
-20
0
20
40
60
80
Dec-1
4
Fe
b-1
5
Apr-
15
Ju
n-1
5
Au
g-1
5
Oct-
15
Dec-1
5
Fe
b-1
6
Apr-
16
Ju
n-1
6
Au
g-1
6
Oct-
16
India Pakistan
Sri Lanka Bangladesh
Percent, annualized quarter-on-quarter
-8
-4
0
4
8
12
16
GD
P
Co
nsu
mp
tion
Inve
stm
ent
Net e
xpo
rts
Change since 2014Q3Change since 2015Q3
Percent

CHAPTER 2 .5 GLOBAL ECONOMIC PROSPECTS | JANUARY 2017 150
lowering the value-added tax (VAT) threshold for wholesale and retail trading, reduced exemptions, and greater tax collection efficiency (World Bank 2016r). In several economies, privatization receipts from state-owned enterprises (SOE) fell short of expectations (India, Pakistan). Large-scale borrowing to fund infrastructure projects (Maldives, Pakistan, Sri Lanka) has led to elevated public debt (Benno and Ramayandi 2015).
Reforms
Notwithstanding remaining room for an impro-vement in regional business climates, investor confidence in South Asia has been lifted by positive progress in the policy environment (Lopez‐Acevedo, Medvedev, and Palmade 2016; Borin and Di Stefano 2016; World Bank 2016p).
Four key reforms in India were passed in 2016. First, a bankruptcy and insolvency code was enacted, making it easier to close failing businesses
and recover debts. Second, rules governing FDI underwent sweeping liberalization, allowing for 100 percent ownership in previously restricted sectors. Third, the Goods and Services Tax (GST) Amendment Bill was passed; this aims to streamline the country’s complex tax system, reduce fragmentation in markets for goods and services, lower business costs, and widen the tax base. Fourth, the government and the Reserve Bank of India agreed on a monetary policy framework that includes setting up a monetary policy committee and agreeing on a flexible inflation target, with a 2–6 percent range. This should enhance the Reserve Bank of India’s operational independence, and help to anchor inflation expectations (Mishra, Montiel, and Sengupta 2016; Cabral, Carneiro, and Mollick 2016; Samarina, Terpstra, and De Haan 2014). In addition, the Reserve Bank of India strengthened bank resolution procedures by establishing a single Financial Resolution Authority (FRA) that brought state-owned banks under the resolution framework and placed restrictions on the usage of bail-ins clause resolutions. Robust implementation of these legislative changes will be key to transforming the accompanying boost to confidence into greater activity.
Pakistan implemented various reforms under the IMF’s EFF program and World Bank’s Development Policy Credits; tackling key structural challenges, such as, reforms to ease energy constraints, tax policy and administrative reforms to raise revenues, and strengthening independence of the State Bank of Pakistan to reduce vulnerabilities. In addition to undertaking reforms under the IMF’s EFF program, Sri Lanka received $100 million from the World Bank in mid-2016 to support the government’s reform agenda in reducing impediments to private sector competitiveness, increasing transparency, and improving fiscal sustainability (World Bank 2016s). Bhutan’s government approved a debt policy in 2016 aimed at ensuring public debt sustainability by establishing an external debt threshold and implementing a Medium-Term Debt Management Strategy. Despite these improvements, critical land and labor reforms have largely stalled in most of the region.
FIGURE 2.5.3 External sector developments
Lower energy import bills helped contain current account deficits but were
partly offset by diminished remittances from the GCC countries. FDI
inflows, mainly to India and Pakistan, contributed to an accumulation of
reserves.
B. FDI inflows A. Current account balance
D. Remittances inflows C. Reserves
Sources: Haver Analytics; World Development Indicator, World Bank; World Economic Outlook, International Monetary Fund. C. Reserves coverage are months of imports covered. The last observation is October 2016.
-4
-3
-2
-1
0
1
2
Ban
gla
desh
India
Sri
La
nka
Pakis
tan
2013 2014 2015 2016ePercent of GDP
0.0
0.5
1.0
1.5
2.0
2.5
20
12
20
13
20
14
20
15
India Pakistan
Percent of GDP
02468
101214
Ban
gla
desh
India
Sri
La
nka
Pakis
tan
2015 Jan LatestMonths of imports
0
10
20
30
40
Ba
ng
lad
esh
Ind
ia
Nep
al
Pakis
tan
Sri
Lan
ka
So
uth
Asia
2013 2014 2015 2000-2007Percent of GDP

SOUTH AS IA GLOBAL ECONOMIC PROSPECTS | JANUARY 2017 151
Outlook
Growth prospects for South Asia remain robust, albeit uneven, across the region. Regional growth in 2017 is projected at 7.1 percent, firming to 7.4 percent during 2018-19, with continued support from strong growth in India. Excluding India, growth will pickup to 5.5 percent in 2017 and remain broadly stable at an average pace of 5.8 percent thereafter. The growth pickup is predicated on robust private and public consumption, infrastructure spending, and a rebound in private investment.
Accommodative monetary policy stance is expected to support activity (Bangladesh, India, Pakistan). With oil prices projected to stay subdued (World Bank 2016t), regional inflation is forecast to remain below an average of 6 percent during 2017-19, providing space for ongoing monetary policy accommodation and supporting real incomes and consumption. Fiscal policy is also likely to become more accommodative as a result of additional fiscal spending due to public sector wage hikes (Bangladesh, India) and approaching general elections in 2018 (Pakistan) and 2019 (India).
India is expected to regain its momentum, with growth rising to 7.6 percent in FY2018 and strengthening to 7.8 percent in FY2019-20. Various reform initiatives are expected to unlock domestic supply bottlenecks and raise productivity. Infrastructure spending should improve the business climate and attract investment in the near-term (Calderon, Moral-Benito, and Servén 2011). The “Make in India” campaign may support India’s manufacturing sector, backed by domestic demand and further regulatory reforms (Siddhartha 2015). Moderate inflation and a civil service pay hike should support real incomes and consumption, assisted by bumper harvests after favorable monsoon rains. A benefit of ‘demonetization’ in the medium-term may be liquidity expansion in the banking system, helping to lower lending rates and lift economic activity.
In Pakistan, growth (at factor cost) is forecast to accelerate from 5.5 percent in FY2018 to 5.8
FIGURE 2.5.4 Exchange rate and inflation developments
Nominal exchange rates remained broadly stable, with trend appreciation
in the real effective exchange rate in India and Pakistan. Modest domestic
inflation reflected low energy prices and good monsoon rains. Central
banks responded by easing monetary policy.
B. Real effective exchange rate A. Nominal exchange rates
D. Central bank policy rates C. Inflation rates
Sources: Haver Analytics, National Central Banks, World Bank. A. Last observation is November 2016. B. Last observation is November 2016. D. Last observation is November 2016.
FIGURE 2.5.5 Fiscal developments
Lower energy prices enabled some countries to reduce energy subsidies
(India, Pakistan), or eliminate tax exemptions (Pakistan, Sri Lanka).
However, increases in public sector wage (Bangladesh, India) and fiscal
slippages (Pakistan, Sri Lanka) could imperil the path to fiscal
sustainability.
B. Public debt A. Structural fiscal balance
Sources: Haver Analytics; International Monetary Fund; World Economic Outlook, World Bank. A.B. 2016e means estimated value.
0
20
40
60
80
100
120
140
160
Ja
n-1
4
Apr-
14
Ju
l-1
4
Oct-
14
Ja
n-1
5
Apr-
15
Ju
l-1
5
Oct-
15
Ja
n-1
6
Apr-
16
Ju
l-1
6
Oct-
16
India Pakistan Sri Lanka BangladeshLCU per US dollar
0
2
4
6
8
10
Ban
gla
desh
India
Pakis
tan
Sri
La
nka
CPI Inflation target Core inflationPercent
5
6
7
8
Ma
y-1
5
Aug
-15
Nov-1
5
Feb
-16
Ma
y-1
6
Aug
-16
Nov-1
6
India PakistanSri Lanka Bangladesh
Percent
-10
-8
-6
-4
-2
0
Ban
gla
desh
India
Pakis
tan
Sri
La
nka
2014 20152016e 2010-2013
Percent of GDP
0
20
40
60
80
Ba
ng
lade
sh
Ind
ia
Nep
al
Pakis
tan
Sri L
an
ka
2015 2016Percent of GDP
90
100
110
120
130
Jan
-14
Ap
r-14
Jul-
14
Oct-
14
Jan
-15
Ap
r-15
Jul-
15
Oct-
15
Jan
-16
Ap
r-16
Jul-
16
Oct-
16
IndiaPakistan
Index, Jan 2014=100
percent a year in FY2019-20, reflecting improvements in agriculture, infrastructure, energy, and external demand. Construction of the new Khanki barrage in the province of Punjab is set to be completed in early 2017. This is
CHAPTER 2 .5 GLOBAL ECONOMIC PROSPECTS | JANUARY 2017 152
expected to provide irrigation to one million hectares of fertile farmland, boosting agriculture. Ongoing progress on the gas pipeline and electricity imports from the Islamic Republic of Iran, will ease energy constraints. The Chinese-Pakistan Economic Cooperation (CPEC) project will increase investment in the medium-term, and alleviate transportation bottlenecks and electricity shortages.3
Weak remittances inflows and subdued con- sumption are foreseen to weigh on Bangladesh’s growth, projected to edge down to 6.5 percent in FY2018, but rebound to 6.7 percent in FY2019 and 7.0 percent thereafter in the forecast horizon, supported by infrastructure spending and a pickup in exports. An improved security situation is also expected to attract private investment and FDI. Construction of Padma Bridge connecting southwest of the region with the rest of the county and a liquefied natural gas terminal will alleviate infrastructure and energy bottlenecks in the medium-term. However, Bangladesh’s high recurring expenditures and a stagnant revenue-to-GDP ratio will likely pose obstacles for the funding of needed infrastructure development. In Sri Lanka, growth is expected to climb to an average of 5.1 percent in 2017-19, supported by increased private consumption and an uptick in FDI. Fiscal consolidation amounting to 3.5 percent of GDP by 2020 will lift investor sentiment, but weigh on growth and, especially, infrastructure spending in the near-term (World Bank 2015t). Political deadlock in the coalition government, on near-term spending priorities, could hinder the pace of reforms.
Following the rebound in FY2017, Nepal’s growth is expected to ease in the forecast period in line with the country’s potential. Continued post-earthquake reconstruction efforts, uptick in manufacturing activity, and resumption of tourism will support economic activity. A slowing growth of remittances—which account for a third
of the GDP—will continue to weigh on growth. Inflation is projected to subside to an average pace of 8 percent in the medium-term. Continuing reconstruction-related imports, and slowdown in remittances, are expected to turn current account surpluses into deficits in the forecast period.
Growth in Bhutan is projected to rise to an average of 11.1 over the forecast horizon. The strong rise in capital equipment spending in for major hydropower projects will widen the current account in the near-term, but improve growth in the medium-term. With the commissioning of hydropower plants in 2017-19, and increased exports of electricity to India, the current account deficit is expected to narrow. Since the currencies of Bhutan and Nepal are pegged to the Indian rupee, their exports could suffer from a loss of competitiveness should India’s currency appreciate against major currencies (Burke and Paudel 2015). Maldives is foreseen to post an average growth of 4.3 percent in 2017-19, following a rebound in tourism.
Afghanistan faces a difficult path to recovery. Even though growth is projected to climb to 1.8 percent in 2017 and 3 percent in 2018-19, deteriorating security, a surge in return of displaced persons, and adverse weather conditions will be a drag on activity. Under-execution of budget plans and reductions in foreign aid will dampen domestic demand and widen the current account deficit. This may be partially mitigated by the lifting of sanctions on the Islamic Republic of Iran, which could boost trade and investment for Afghanistan (Devarajan, Ianchovichina, and Lakatos 2016). In addition, low prices of oil and gas imports from the Islamic Republic of Iran could also ease energy constraints and alleviate current account pressures.
Risks
Risks to the outlook are tilted to the downside. Domestic risks include: slippages in addressing fiscal imbalances, further deterioration in financial and corporate sector stability (Bangladesh, India), rising debt levels (India, Maldives, Pakistan, Sri Lanka), and persistent security and political tensions (Afghanistan, Bangladesh, Maldives,
3 An additional $5.5 billion was committed by China in 2016 towards the construction of Peshwar-Karachi railway line, a major cargo and human transit corridor. Further, Pakistan became one of the first countries to receive financing of $100 million from the AIIB towards the M-4 motorway, considered vital to the CPEC transportation project.

SOUTH AS IA GLOBAL ECONOMIC PROSPECTS | JANUARY 2017 153
Pakistan) (Figure 2.5.6). External risks are moderate, given South Asia’s limited global integration. They include heightened policy uncertainty in the United States and Euro Area, unexpected tightening of financing conditions, a jump in energy prices, and a prolonged slowdown in key export markets (Figure 2.5.7).
In India, cash accounts for more than 80 percent of the number of transactions. In the short-term, ‘demonetization’ could continue to disrupt business and household economic activities, weighing on growth (Rogoff 2016). Further, the challenges encountered in phasing out large currency notes and replacing them with new ones may pose risks to the pace of other economic reforms (e.g., Goods and Services Tax, labor, and land reforms). Spillovers from India to Nepal and Bhutan, through trade and remittances channels, could also negatively impact growth to these neighboring smaller economies.
Uncertainty about fiscal consolidation could weigh on confidence in the near-term. Increases in public sector salaries (Bangladesh, India), and other slippages in fiscal consolidation (Sri Lanka), cast doubt on commitment to reduce public debt growth to more sustainable levels. Furthermore, a sudden rebound in energy prices could contribute to a reintroduction or an increase in expenditures on subsidies, raising fiscal deficits. Impaired commercial banks’ balance sheet, especially of state-owned banks (Bangladesh, India, Pakistan), would contribute to fiscal strain should recapitalization by the government become necessary.
High levels of non-performing bank loans (Bangladesh, India, Pakistan) make banks vulnerable to financial stress and weigh on new lending. In addition, excess capacity in India has led to sizable losses by corporations, heightening loss provisions by banks, and limiting credit ex-pansion for consumption and investment. In Pakistan, sovereign guarantees associated with the CPEC project elevate fiscal risks over the medium-term. Finally, upcoming general elec-tions in 2018 (Pakistan) and 2019 (India) could lead to expansionary fiscal policy and widening fiscal deficits.
Security and geopolitical tensions in the region could derail growing regional integration, including in the apparel sector (Lopez-Acevedo, Medvedev, and Palmade 2016). Terrorist and militant attacks (Afghanistan, Bangladesh, Pakistan), political unrest (Bangladesh, Maldives, Nepal), and border disputes (India-Pakistan) presents risks to the region. If these intensify, risk premiums and financing costs could rise sharply. Furthermore, increased spending on security could exacerbate fiscal vulnerabilities.
Although South Asia is less integrated globally than other EMDE regions, external risks could arise from weaker growth in key export markets—the United States, the United Kingdom, European Union, Russia, and the GCC countries (World Bank 2016e; Figure 2.5.8). Moreover, an unexpected tightening of financing conditions
FIGURE 2.5.6 Vulnerabilities
Increased provisions for non-performing loans highlight risks to financial
stability, credit growth, and investment. In India, credit to corporates
declined in 2016, reflecting distressed bank assets. Bond spreads for
Pakistan and Sri Lanka narrowed in 2016, due to improvements in the
investment climate. Elevated short-term external debt in Bangladesh and
Sri Lanka, relative to their reserves, is a source of concern.
B. Credit growth A. Non-performing loans
D. Short-term external debt C. Emerging Market Bond Index
spreads
Sources: Bloomberg, Haver Analytics, World Bank. A. Last observations are 2015. B. e refers to estimated value. C. Last observations are December 2016.
0
5
10
15
20
Afg
han
ista
n
Bh
uta
n
Ban
gla
desh
India
Sri
La
nka
Pakis
tan
2015 Max 2010-2014
Percent of total loans
0
1
2
3
4
5
6
Ban
gla
desh
India
Pakis
tan
Sri
La
nka
2015 2016ePercent
0
200
400
600
800
1000
1200
1400
1600
20
10
20
11
20
12
20
13
20
14
20
15
20
16
Sri Lanka Pakistan
Index
0
5
10
15
20
25
0
5
10
15
20
25
2013
2015
2013
2015
2013
2015
2013
2015
Bangladesh India Sri Lanka Pakistan
Reserve (RHS)
Percent of total external debt Percent of GDP

CHAPTER 2 .5 GLOBAL ECONOMIC PROSPECTS | JANUARY 2017 154
raise inflation above targets and de-anchor inflation expectations. This would compel central banks to tighten monetary policy, which would reduce credit growth and investment. Furthermore, an uptick in energy prices could raise the energy import bill, exacerbating current account deficits. An increase in energy costs could also lead to reintroduction of subsidies, with detrimental consequences for fiscal deficits.
Policy challenges
South Asia has been a success story in recent years, with high growth, and considerable progress in poverty reduction (Romer 2016). The key challenge is to sustain that success in the face of future headwinds. Removal of structural barriers to growth, pursuit of greater international integration, improved productivity, and further fiscal and financial reforms are imperative (Figure 2.5.9).
Fiscal risks
Continued fiscal consolidation and an acceleration of SOE reforms is a priority to help ease budgetary pressures, to contain rising debt levels, and to lift investor confidence. A transparent medium-term framework for the budget would help build fiscal buffers (India, Pakistan) and stabilize public debt (Nepal, Sri Lanka). Improved public financial management and efficiency at national and subnational levels (e.g., through fiscal rules), would help to anchor expectations of fiscal sustainability. Revenue ratios in the region are low by comparison with other EMDE regions (World Bank 2016a). In addition, to meet fiscal targets without substantially reducing public investment needs, better revenue collection is important. This can be achieved through streamlining direct and indirect taxes (Bangladesh, Sri Lanka), by expanding the tax base (India, Pakistan, Sri Lanka), further rationalizing subsidies (Bangladesh, India, Pakistan), and by improving the efficiency of tax collection (Bangladesh, Sri Lanka). Reforming and privatizing SOE could also lessen strains on the budget and reduce fiscal risks (e.g., rising contingent liabilities in state-owned banks in India). Revenue-led fiscal consolidation needs to take into consideration its impact on poverty and inequality.
FIGURE 2.5.7 Risks of uncertainty in major advanced
economies
Compared to other EMDE regions, SAR is less integrated in the global
economy, constrained by poor business environment that weighs on
competitiveness and investor sentiment. Some countries have trade
(Bangladesh India, Pakistan, Sri Lanka) and finance (India) exposure to
advanced economies, and most of them have remittances inflow exposure
to the GCC economies. A prolonged period of heightened uncertainty in
advanced economies would have adverse impact on investment in
EMDEs.
B. Trade and financial exposures to
major advanced economies, 2015 A. Share of major economies in world
economy, 2010-15
D. Impact of 10 point increase in VIX
on EMDE investment growth C. Largest trade and financial
exposures to major advanced
economies, 2015
Sources: World Bank, International Monetary Fund, Haver Analytics. A. Trade (A) includes both exports and imports. Exports (B) include goods exports only. Foreign claims refer to total claims of BIS-reporting banks on foreign banks and nonbanks. Stock market capitalization is the market value of all publicly-traded shares. “FDI data (C) only available to 2014. D. Cumulative responses of EMDE investment to a 10 percent increase in the VIX. Solid lines indicate the median responses and the dotted lines indicate 16-84 percent confidence intervals. Vector autoregressions are estimated for the sample for 1998Q1-2016Q2. The model includes, in this order, the VIX, MSCI Emerging Markets Index (MXEM), J.P.Morgan Emerging Markets Bond Index (EMBIG), aggregate real output and investment growth in 18 EMDEs with G7 real GDP growth, U.S. 10-year bond yields, and MSCI World Index as exogenous regressors and estimated with two lags.
0
20
40
60
80
100
GDP(market
exchangerates)
GDP(PPP)
Trade Foreignclaims
Stockmarket
capitalization
US China EU Japan OtherPercent of total
0
20
40
60
80
100
Exports InwardFDI
Remittanceinflows
Portfolioliabilities
Foreignclaims
US China EU Japan Other
Percent of total
0
2
4
6
8
10
12
Ban
gla
desh
Sri L
anka
India
Pakis
tan
Mald
ive
s
India
Mald
ive
s
Pakis
tan
Sri L
anka
Ban
gla
desh
Nepal
Sri L
anka
Pakis
tan
Ban
gla
desh
India
Exports FDI Remittances
European Union United States
Percent of GDP
-2.0
-1.5
-1.0
-0.5
0.0
1 2 3 4 5 6 7 8
Quarter
Percentage points
amid further normalization of monetary policy in the United States could exert upward pressure on financing costs (Gertler and Karadi 2015) and lead to currency depreciation (Arteta et al. 2015; Clark et al. 2016). Besides impacting inflation, currency pressures could make short-term debt rollover expensive (Patra et al. 2016; Chow 2015; Davis 2015).
As a net energy-importing region, continued low energy prices have provided support to disposable incomes and domestic demand (World Bank 2016t). A sudden increase in energy prices could

SOUTH AS IA GLOBAL ECONOMIC PROSPECTS | JANUARY 2017 155
Financial sector risks
In view of concerns about impaired bank asset quality in the region, it is necessary to enhance financial sector stability and to minimize spillovers to the rest of the economy from possible banking sector stress (Claessens 2015). Reforms in corporate governance are important; to reduce leverage and to improve the quality of bank lending. Banking sector reforms can improve the efficiency in allocation of credit (Bangla- desh, India), and help to curtail excessive credit growth (Sri Lanka). Appropriate reforms include strengthening supervision and raising capital requirements. In India, a network of 27 listed public sector banks account for almost three-quarters of the banking system by assets. Increasing competition in the banking sector could improve corporate governance and reduce non-performing loans. In some cases, consolidation of commercial banks is warranted (Hariyama, Montgomery, and Takahashi 2014). Capital market development would allow firms to use debt instruments (bonds), thereby easing reliance on borrowing from banks but could increase vulnerabilities to external shocks (World Bank 2016v; Sophastienphong, Mu, and Saporito 2008).
Structural reforms
Structural reforms to raise potential growth and increase productivity are a priority. This can be accomplished through global value chain integration, investments in human capital, improved labor markets, and greater labor force participation by female, and in the formal sector. Measures to counter high youth unemployment in the region would have a large pay-off over time (Dabla-Norris, Ho, and Kyobe 2016).
Integration in global value chains has been associated with higher growth in other regions (Farole and Pathikonda 2016). South Asia is one of the least internationally integrated regions. Poor infrastructure connectivity and a weak business environment weigh on competitiveness. Reducing infrastructure gaps and an improving business climate would allow new productive sectors to develop, generate jobs, and foster their integration into global value chains (Lopez‐
Acevedo and Robertson 2016). Improved global and intra-regional integration could further encourage the developments of South Asian supply chains, and broaden export opportunities. South Asian economies should be able to leverage their low-cost, labor-intensive, manufacturing sectors to this end.
Investment in human capital will help raise potential growth and productivity as the region shifts from basic manufacturing to more innovative, knowledge-based industries (Aturupane et al. 2014). Improvements in the formal education system and other training programs will be needed to prepare workers for jobs in the modern manufacturing and services
FIGURE 2.5.8 Spillovers from the United States and the
Euro Area
A slowdown in U.S. or Euro Area output growth would reduce output
growth in EMDEs considerably. EMDE investment would respond more
strongly, possibly reflecting investor concerns about long-term growth
prospects.
B. Output growth: Impact of 1
percentage point slowdown in Euro
Area output growth on EMDEs
A. Output growth: Impact of 1
percentage point slowdown in U.S.
output growth on EMDEs
D. Investment growth: Impact of 1
percentage point slowdown in Euro
Area output growth on EMDEs
C. Investment growth: Impact of 1
percentage point slowdown in U.S.
output growth on EMDEs
Sources: Haver Analytics, International Monetary Fund, World Bank. Notes: Cumulative impulse response of weighted average EMDEs output growth (A.B.) or investment growth (C.D.) at 1-8 quarter horizons to a 1 percentage point decline in growth in real GDP in the United States (A.C.) and Euro Area (B.D.). Growth spillovers based on a Bayesian vector autoregression of world GDP (excluding the source country of spillovers), output growth in the source country of the shock, the U.S. 10-year sovereign bond yield pulse JP Morgan’s EMBI index, investment (C.D.) or output (A.B.) in EMDEs, excluding, China and oil price as an exogenous variable. Solid lines indicate the median responses and the dotted lines indicate 16-84 percent confidence intervals.
-2.0
-1.5
-1.0
-0.5
0.0
1 2 3 4 5 6 7 8
Percentage points
Quarter
-2.5
-2.0
-1.5
-1.0
-0.5
0.0
0.5
1 2 3 4 5 6 7 8
Percentage points
Quarter
-5
-4
-3
-2
-1
0
1
1 2 3 4 5 6 7 8
Percentage points
Quarter
-6
-5
-4
-3
-2
-1
0
1
1 2 3 4 5 6 7 8
Percentage points
Quarter

CHAPTER 2 .5 GLOBAL ECONOMIC PROSPECTS | JANUARY 2017 156
industries (Romer 2016). While access to basic education is generally adequate, quality is a concern and access to higher levels of education remain low compared to the East Asia and Pacific region (UNESCO 2014). Greater workplace-based and vocational training can help build skills that are relevant in changing economies. Lifting labor market barriers are needed to increase the mobility and flexibility of workforce (Shirke and Srija 2014). Reforms should create new opportunities for female workers to participate in the labor force, introduce greater flexibility in labor markets and reduce taxes on low-paid workers. Easing entry restrictions in the product and services markets (India, Pakistan) and easing regulatory burdens (Bangladesh, India, Pakistan) would encourage investment and growth in export-led sectors (Alfaro and Chari 2014).
Regulatory reforms to promote household enterprises in retail and wholesale trades (Bangladesh, Pakistan) can unlock the potential of small- and medium-size enterprises (Abeberese 2016; Pachouri and Sharma 2016). Appropriate reforms would reduce the number of permits (and the associated delays) required to start and operate
a business. For example, compared to an average of 103 days in EMDEs, connecting to electricity can take 429 days in Bangladesh and 181 days in Pakistan (World Bank 2016w). In addition, lower collateral requirements would improve access to finance and decrease the cost of credit for small businesses (Loayza 2016). Under the right conditions, small and medium-sized firms can be major creators of jobs.
Over two-thirds of the population in South Asia resides in rural areas (World Bank 2016u). Almost 70 percent of India’s population live in villages, and 75 percent of this population constitute the majority of the extreme poor (Tewari 2015). Reforms to raise agricultural productivity, and thereby rural incomes, therefore, have a major role to play in poverty alleviation (Maitra et al. 2016). Increased access to irrigation, use of high-yield varieties, and improved market access could boost productivity. Encouraging diversification through labor-intensive agri-business activities such as food processing, and fostering greater value added agricultural production will create job opportunities, and lessen incentive to move to already densely-populated cities.
FIGURE 2.5.9 Policy challenges
Further structural reforms to improve the business environment and labor market efficiency are imperative to attract investment and create
jobs. This will contribute to a continuation of the poverty reduction experienced over the past decade.
B. Labor market efficiency A. Doing Business, 2016 C. Extreme poverty
Sources: Haver Analytics; World Development Indicator, World Bank. A. An economy’s distance to frontier is reflected on a scale from 0 to 100, where 0 represents the lowest performance and 100 represents the frontier. B. Higher score means more efficient. C. Extreme poverty is calculated by the rule: Poverty headcount ratio at $1.90 a day (2011 PPP) (percent of population).
0102030405060708090
100
Sta
rtin
g a
Bu
sine
ss
De
alin
g w
ith
Co
nstr
uct
ion
Pe
rmits
Gett
ing
Ele
ctrici
ty
Payin
g T
axes
Tra
din
g A
cross
Bo
rders
Enfo
rcin
gC
ontr
acts
Re
solv
ing
Inso
lvency
India Pakistan Sri Lanka
Bangladesh Afghanistan EMDE
Distance to Frontier score
0
5
10
15
20
25
30
35
India
Ne
pal
Bang
lad
esh
Sri
La
nka
Pakis
tan
2014-15
2015-16
Percentile among ranked countries
0
10
20
30
40
50
60
70
Ba
ngla
de
sh
Bh
uta
n
Ind
ia
Mald
ives
Nep
al
Pakis
tan
Sri L
an
ka
2000 or earliest 2012 or latestPercent

SOUTH AS IA GLOBAL ECONOMIC PROSPECTS | JANUARY 2017 157
TABLE 2.5.1 South Asia forecast summary
(Real GDP growth at market prices in percent, unless indicated otherwise)
Source: World Bank. World Bank forecasts are frequently updated based on new information and changing (global) circumstances. Consequently, projections presented here may differ from those contained in other Bank documents, even if basic assessments of countries’ prospects do not differ at any given moment in time. a. EMDE refers to emerging market and developing economy. GDP at market prices and expenditure components are measured in constant 2010 U.S. dollars. b. National income and product account data refer to fiscal years (FY) for the South Asian countries, while aggregates are presented in calendar year (CY) terms. The fiscal year runs from July 1 through June 30 in Bangladesh and Pakistan, from July 16 through July 15 in Nepal, and April 1 through March 31 in India. 2017 data for Bangladesh, India, and Pakistan cover FY2016/17. c. Sub-region aggregate excludes Afghanistan, Bhutan, and Maldives, for which data limitations prevent the forecasting of GDP components. d. Exports and imports of goods and non-factor services (GNFS). For additional information, please see www.worldbank.org/gep.
2014 2015 2016 2017 2018 2019 2015 2016 2017 2018
Estimates Projections (percentage point difference
from June 2016 projections)
EMDE South Asia, GDPa, b 6.7 6.8 6.8 7.1 7.3 7.4 -0.2 -0.3 -0.1 0.0
(Average including countries with full national accounts and balance of payments data only)c
EMDE South Asia, GDPc 6.7 6.9 6.8 7.1 7.4 7.4 -0.2 -0.4 -0.2 0.1
GDP per capita (U.S. dollars) 5.3 5.5 5.4 5.7 6.0 6.1 -0.2 -0.4 -0.2 0.0
PPP GDP 6.7 6.8 6.8 7.1 7.4 7.4 -0.3 -0.3 -0.1 0.1
Private consumption 6.2 6.4 6.4 6.7 7.2 7.4 0.4 -0.3 -0.1 0.7
Public consumption 8.9 2.2 7.0 7.2 7.5 7.6 -7.4 0.4 0.7 0.9
Fixed investment 2.7 6.2 6.5 7.4 7.4 7.3 -1.0 -0.6 -0.7 -1.4
Exports, GNFSd 5.5 -4.9 2.2 5.6 7.1 7.4 -2.0 -0.5 -0.3 -0.4
Imports, GNFSd 1.0 -1.6 1.6 5.1 6.6 6.9 0.2 0.0 0.1 0.3
Net exports, contribution to growth 1.0 -0.7 0.1 -0.1 -0.2 -0.2 -0.5 0.0 0.0 -0.2
Memo items: GDPb 14/15 15/16 16/17 17/18 18/19 19/20 15/16 16/17 17/18 18/19
South Asia excluding India 5.4 5.3 5.3 5.5 5.7 5.8 0.0 0.0 0.0 0.3
India 7.2 7.6 7.0 7.6 7.8 7.8 0.0 -0.6 -0.1 0.1
Pakistan (factor cost) 4.0 4.7 5.2 5.5 5.8 5.8 0.5 0.7 0.7 0.7
Bangladesh 6.6 7.1 6.8 6.5 6.7 7.0 0.6 0.5 -0.3 0.7
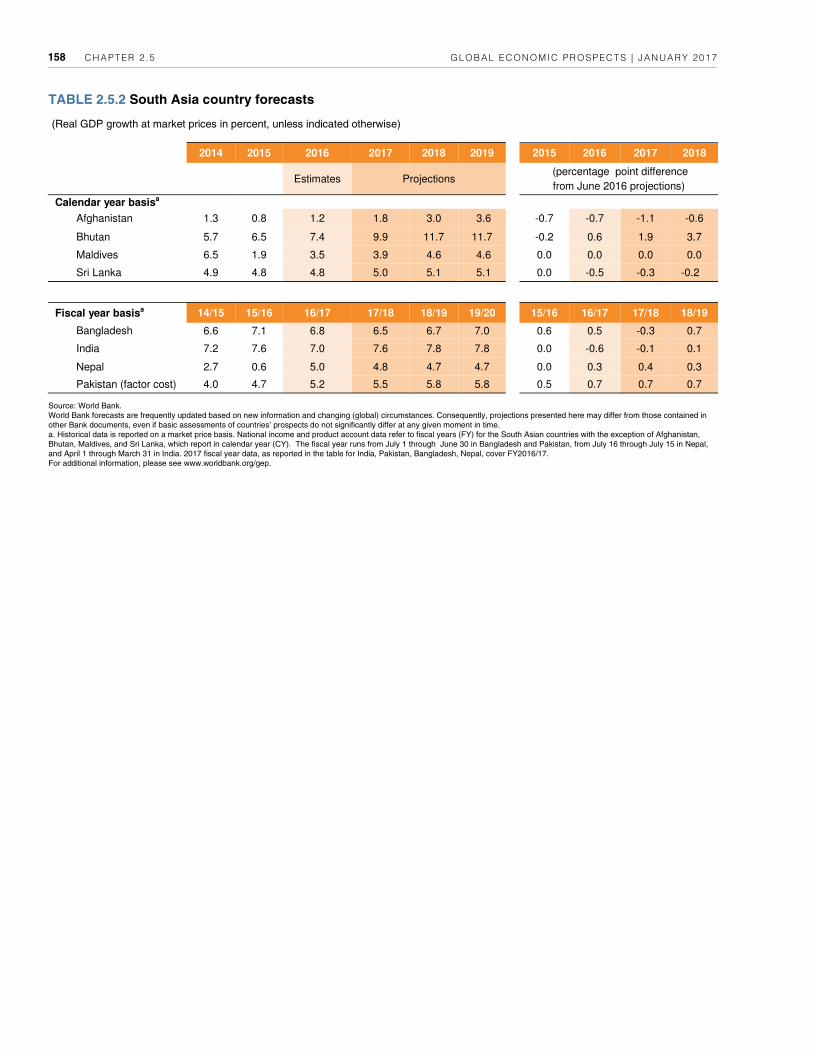
CHAPTER 2 .5 GLOBAL ECONOMIC PROSPECTS | JANUARY 2017 158
(Real GDP growth at market prices in percent, unless indicated otherwise)
2014 2015 2016 2017 2018 2019 2015 2016 2017 2018
Estimates Projections (percentage point difference
from June 2016 projections)
Calendar year basisa
Afghanistan 1.3 0.8 1.2 1.8 3.0 3.6 -0.7 -0.7 -1.1 -0.6
Bhutan 5.7 6.5 7.4 9.9 11.7 11.7 -0.2 0.6 1.9 3.7
Maldives 6.5 1.9 3.5 3.9 4.6 4.6 0.0 0.0 0.0 0.0
Sri Lanka 4.9 4.8 4.8 5.0 5.1 5.1 0.0 -0.5 -0.3 -0.2
Fiscal year basisa 14/15 15/16 16/17 17/18 18/19 19/20 15/16 16/17 17/18 18/19
Bangladesh 6.6 7.1 6.8 6.5 6.7 7.0 0.6 0.5 -0.3 0.7
India 7.2 7.6 7.0 7.6 7.8 7.8 0.0 -0.6 -0.1 0.1
Nepal 2.7 0.6 5.0 4.8 4.7 4.7 0.0 0.3 0.4 0.3
Pakistan (factor cost) 4.0 4.7 5.2 5.5 5.8 5.8 0.5 0.7 0.7 0.7
TABLE 2.5.2 South Asia country forecasts
Source: World Bank. World Bank forecasts are frequently updated based on new information and changing (global) circumstances. Consequently, projections presented here may differ from those contained in other Bank documents, even if basic assessments of countries’ prospects do not significantly differ at any given moment in time. a. Historical data is reported on a market price basis. National income and product account data refer to fiscal years (FY) for the South Asian countries with the exception of Afghanistan, Bhutan, Maldives, and Sri Lanka, which report in calendar year (CY). The fiscal year runs from July 1 through June 30 in Bangladesh and Pakistan, from July 16 through July 15 in Nepal, and April 1 through March 31 in India. 2017 fiscal year data, as reported in the table for India, Pakistan, Bangladesh, Nepal, cover FY2016/17. For additional information, please see www.worldbank.org/gep.

SOUTH AS IA GLOBAL ECONOMIC PROSPECTS | JANUARY 2017 159
BOX 2.5.1 Recent investment slowdown: South Asia
Investment growth slowed from 11 percent in 2011 to 6 percent in 2015, and is expected to weaken further in 2016. While subsiding political tensions and sharply lower oil prices have supported investment, long-standing structural bottlenecks continue to pose an obstacle to investment growth. Sizable investment needs remain in transport and energy, as well as in human resources, especially health and education.
South Asia (SAR) accounted for 4 percent of global investment, on average, over 2010-15. Despite an uptick in public investment spending, a deceleration in the private sector resulted in a substantial decline in overall investment growth, from 11 percent in 2011 to 3 percent in 2014. A rebound, to 6 percent in 2015, still left the growth rate below the long-term (1990-2008) average of 8 percent.
This box discusses the following questions:
• How has investment growth in the region evolved?
• What were the main sources of the investment slowdown?
• What are the remaining investment needs?
• Which policies can help address investment needs?
Recent investment weakness in South Asia reflects the legacy of weak output growth during 2010-13, excess manufacturing capacity in the face of sluggish external demand, and some uncertainty about government policy. These factors have compounded the long-term problems of structural bottlenecks, weak banking systems, and bouts of political tension. Needs for capital formation remain sizable, especially in the energy and transport sectors; the region also lags in the provision of health and education services. Governments can help directly, and by encouraging private sector participation. More broadly, improvements to the general business environment (e.g., through more streamlined regulations and reduced corruption) would enhance incentives for productive investment.
How has investment growth in the region evolved?
Weak investment has been a drag on South Asia’s recent, consumption-driven expansion (World Bank 2016u). Across the region, investment growth slowed sharply from 11 percent in 2011 to 3 percent in 2014, with only a modest rebound to 6 percent in 2015—barely half its 2011 pace and well below the long-term (1990-2008) average of 8 percent (Figure 2.5.1.1). The downward trend
reflects a slackening in India, (which accounts for more than three-quarters of the region’s total investment), offsetting a pickup in Bhutan, Nepal, and Pakistan. Preliminary data suggests continued investment weakness in 2016.
In India, gross fixed capital formation has been on a downward trend since 2011, with a shift in the composition from private to public. While public investment rose by 21 percent in FY2016, private investment (which accounts for two-thirds of the total) contracted by 1.4 percent, reducing overall investment growth to 4 percent. Infrastructure demand is expected to go up to $1 trillion under the 12th Five-Year Plan (2012-2017). Going forward, public and private investment should be supported by higher allocations in the FY2017 federal government budget to build and upgrade infrastructure, and the setup of a $3 billion National Investment and Infrastructure Fund.
In Pakistan, investment surged in 2015, mainly reflecting the China-Pakistan Economic Partnership (CPEC) infrastructure project (worth $45 billion). This has more than compensated for sluggishness in private investment. The project is part of China’s “One Belt, One Road” initiative, and consists of a network of highways, railways, and pipelines to connect Western China to the Arabian Sea through the Gwadar Port in Pakistan. The Islamic Republic of Iran expressed interest in early 2016 to join the CPEC project. Combined with the ongoing gas pipeline project from the Islamic Republic of Iran, Pakistan should be able to maintain robust public investment growth in the near-term, while private investment is expected to pickup in the medium-term.
In Bangladesh, capital formation is estimated to remain weak in 2016, partly as a result of heightened political tensions and security concerns. Sri Lanka’s investment contracted by 2 percent in 2016, following the suspension of the $1.4 billion Colombo Port City real estate project for over one year in 2015. In the near-term, investment growth in Sri Lanka is expected to continue on a downward trend, following the tightening of monetary policy in mid-2016 that raised financing costs. Fiscal consolidation, aimed at reducing the fiscal deficit to 3.5 percent of GDP by 2020 under the IMF’s $1.5 billion Note: This box was prepared by Boaz Nandwa.

CHAPTER 2 .5 GLOBAL ECONOMIC PROSPECTS | JANUARY 2017 160
BOX 2.5.1 Recent investment slowdown: South Asia (continued)
A. Investment growth B. Share of SAR countries with weak
investment growth
C. Contribution to investment growth
D. GDP growth E. Terms of trade change F. Political stability
FIGURE 2.5.1.1 Investment growth slowdown in South Asia
Investment growth has been below the long-term average in more than half of SAR economies since 2012. Its composition has
shifted away from private sector-driven investment growth during 2013-14 towards public sector-driven investment growth in
2015. While lower oil prices and easing political tensions supported investment, weak activity during 2010-12 and long-
standing structural bottlenecks constrained investment.
Sources: Haver Analytics, International Country Risk Guide (ICRG), Ministry of Finance of Sri Lanka, Reserve Bank of India, World Bank. A. Weighted averages. Includes annual data for Afghanistan, Bangladesh, Bhutan, India, Maldives, Nepal, Pakistan, and Sri Lanka. B. Share of SAR economies with investment growth below its long-term average or with negative investment growth. C. Weighted average for Bangladesh, Bhutan, India, Nepal, Pakistan, and Sri Lanka. D. GDP-weighted averages. E. Investment-weighted averages. An increase denotes terms of trade improvements. F. Investment-weighted averages of ICRG index of Political Risk. An increase denotes greater political stability.
Extended Fund Facility program, will weigh on infrastructure spending (IMF 2016q).
What were the main sources of the investment slowdown?
During 2010-13, weak economic activity weighed on investment and business confidence. Since 2014, however, investor sentiment in the region has benefited from sharply lower oil prices, easing political tensions, and revived reform agendas in India, Pakistan, and Sri Lanka, as well as easing vulnerabilities in Bangladesh, India, and Pakistan. This uptick has yet to translate into a robust rebound in private investment. Structural bottlenecks (e.g., power shortages, poor road and rail networks) and administrative
requirements constitute barriers to investment, and weak banking sectors constrain investment finance.
India’s steep private investment slowdown has been attributed to several factors (World Bank 2016u; Anand and Tulin 2014; Tokuoka 2012). First, the need to unwind excess capacity built during the pre-financial crisis growth boom amid weak external demand (e.g., in the manufacturing sector) has discouraged new projects and caused investors to shelve existing projects. Second, policy uncertainty has been a factor. For example, the stalled Land Acquisition Bill has extended project development timelines. Lack of federal and state government coordination, on compensation for land acquisition and environmental clearances, has contributed to cost and time
0
2
4
6
8
10
12
14
201
0
201
2
201
4
201
0
201
2
201
4
201
0
201
2
201
4
SAR SAR ex India EMDE
1990-2008 avg 2003-08 avgPercent
0
25
50
75
100
2010 2011 2012 2013 2014 2015
Below long-term average ContractingPercent
-4-202468
10
20
10
20
11
20
12
20
13
20
14
20
15
20
10
20
11
20
12
20
13
20
14
20
15
SAR Excl. India India
Percentage points Public Private
0
4
8
12
201
0
201
2
201
4
201
0
201
2
201
4
201
0
201
2
201
4
SAR SAR ex India EMDE
1991-2008 avg 2003-08 avgPercent
-4
-2
0
2
4
6
8
2010 2011 2012 2013 2014 2015
Percent
50
54
58
62
66
2010 2011 2012 2013 2014 2015
Index, 0-100 (100=best)
SOUTH AS IA GLOBAL ECONOMIC PROSPECTS | JANUARY 2017 161
overruns. Third, lenders have been less willing to finance overleveraged corporates, especially in infrastructure-related sectors (e.g., power and other utilities, steel, and cement firms). In particular, the Reserve Bank of India’s 2015 corporate governance reforms in state-owned banks (which represent two-thirds of the total banking sector lending) has adversely affected lending to leveraged corporates and conglomerates.
What are the remaining investment needs?
South Asia is the second most densely populated region in the world, behind East Asia and Pacific, with large and pressing investment needs for infrastructure improvement (Bloom and Rosenberg 2011; Figure 2.5.1.2). Metrics of human capital provision (e.g., expenditure on education and healthcare, teacher-pupil ratios, doctor-patient ratios, water and sanitation in rural areas), fall below the EMDEs average (World Bank 2016w). This suggests that sizable additional outlays on human capital could effectively alleviate poverty (Romer 2016; Estache and Garsous 2012). Rapid urbanization and the maintenance of growth momentum, call especially for improvement of energy and transport infrastructure (Ellis and Roberts 2016; Inderst 2016; Battacharya 2012; ADB 2009, 2012; Andres, Biller, and Dappe 2014).
South Asia is one of the least integrated regions in the world (World Bank 2016e). This has been attributed to inadequacies in transport and power infrastructure (ADB 2009). Coverage differs within countries and across the region, with India and Pakistan somewhat better positioned than other countries.
Energy shortages (electricity, diesel) remain a critical constraint to activity in the region. Underdeveloped within-country and cross-border electricity grid network connectivity and, in some cases, geopolitical tensions have contributed to significant energy shortfalls, compounding regular electricity outages. In India, dependence on imported fuels for power generation, and low electricity tariffs have hampered power generation capacity, which now requires significant expansion to meet energy shortfalls (McKinsey 2011).
Bangladesh’s infrastructure quality lags behind other countries in the region: power shortages and poor transport infrastructure have affected investment and productivity (World Bank 2015t). The 7th Five Year Plan estimates that about $410 billion in financing—twice the size of 2015 GDP—is needed for developing Bangladesh’s infrastructure. Investment is also needed in public health care, where expenditure has declined from 1.1 percent of
BOX 2.5.1 Recent investment slowdown: South Asia (continued)
GDP in 2010 to 0.7 percent of GDP in 2014 (World Bank 2015f, 2016t).
In Sri Lanka, fiscal consolidation, coupled with priority spending to rebuild infrastructure after a 25-year civil war, has crowded out expenditure for human capital-building purposes. Government spending on education fell from 2.7 to 1.8 percent of GDP during 2006-2013, while spending on health declined from 2.0 to 1.4 percent of GDP over the same period (World Bank 2016x).
Which policies can help address infrastructure needs?
The alleviation of some longstanding obstacles to growth would help increase the level and productivity of investment of all forms. A more targeted, multi-pronged, policy strategy could also encourage investment by increasing returns to investment, and by expanding the financing envelope (Henckel and Mckibbin, 2010; Nataraj 2007).
Private investment. Under the right conditions, public investment can crowd-in private investment (World Bank 2016u; Chapter 3).1 For example, private firms may be able to reap the benefits of large scale, if public infrastructure facilitates market access (Calderón, Moral-Benitob, and Servéna 2010). However, in the SAR, only India appears to have experienced a positive crowding-in effect (Jesintha and Sathanapriya 2011; World Bank 2006).
Financing. Financing for public and private investment can be expanded in a number of ways to narrow the investment financing gap (Deutsche Bank 2016; Andres, Biller, and Dappe 2014; McKinsey 2013; ADB 2012, 2009). First, public-private partnership may offer efficiency gains and cost-effectiveness (e.g., infrastructure funds), and at the same time alleviate fiscal pressures (Anadon and Surana 2015; Nataraj 2007). This can help reallocate government spending to socially desirable projects that cannot, in practice, be undertaken by the private sector, for instance, because of an unduly low private rate of return (e.g., water supply and sanitation projects). Second, domestic savings can be mobilized by improving access to the financial system (e.g., encouraging pension funds) and by broadening and raising government revenue collection. Third, banks’ lending capacities can be increased by strengthening their balance sheets, and the
1Public investment could also lead to crowding-out of private invest-ment, e.g. Pakistan (World Bank 2016s).

CHAPTER 2 .5 GLOBAL ECONOMIC PROSPECTS | JANUARY 2017 162
BOX 2.5.1 Recent investment slowdown: South Asia (continued)
FIGURE 2.5.1.2 Investment needs in South Asia
Despite improvements since 2010, sizable investment needs remain in public infrastructure (energy, transport) and human
capital development.
Sources: Battacharya (2012), Haver Analytics, Inderst (2016), World Bank. B. This represents investment as a share of GDP required every year during 2010-2012 to meet investment needs. The authors use “bottom-up” approach based on identified pipeline regional infrastructure projects across SAR. C. Latest available data available during 2011-15. Blue bars denote range of unweighted regional averages across EMDE regions. Health expenditure per capita in purchasing power parity terms, unweighted averages of 199 EMDEs, 34 AEs, and 6 SAR economies. Access to improved sanitation facilities (in percent of population), unweighted averages for 150 EMDEs, 33 AEs, and 8 SAR economies. Access to improved water sources (in percent of population), unweighted averages for 148 EMDEs, 34 AEs, and 8 SAR economies. D. Latest available data available during 2011-15. Blue bars denote range of unweighted regional averages across EMDE regions. Government expenditure per primary student (in percent of per capita income), unweighted averages of 87 EMDEs, 32 AEs, and 5 SAR economies. Pupil-teacher ratio in primary education (headcount basis), unweighted averages for 165 EMDEs, 31 AEs, and 8 SAR economies.
A. Quality of infrastructure B. Infrastructure investment needs
C. Selected health indicators D. Selected education indicators
0
1
2
3
India Pakistan Bangladesh Sri Lanka
2010
2014
2010 EMDE average
2014 EMDE average
Index, 1=low to 5=high
0
2
4
6
8
10
12
Energy Transport Telecom Water,Sanitation
Overall
Percent of GDP
0
20
40
60
80
100
120
0
1000
2000
3000
4000
5000
Health expenditure(LHS)
Improvedsanitation (RHS)
Improved watersource (RHS)
Per capita
Range AE EMDE SAR
Percent of population
0
5
10
15
20
25
30
35
40
45
Government expenditure Pupil-teacher ratio
Percent of per capita income, ratio
Range AE EMDEs SAR
efficiency of capital allocation may be improved by increasing the commercial orientation of banks, including through privatization and governance reforms. Fourth, greater commercial orientation (through privatizations or concessions to private investors) of state-owned enterprises
could raise efficiency and increase investment. Fifth, reducing asset-liability mismatches through greater use of funding through capital markets (e.g., infrastructure bonds), can be an alternative to heavy reliance on bank lending for infrastructure-related projects. Finally, foreign
SOUTH AS IA GLOBAL ECONOMIC PROSPECTS | JANUARY 2017 163
direct investment in infrastructure can be encouraged by removing regulatory obstacles to doing business in restricted sectors (Kirkpatrick, Parker, and Zhang 2006; World Bank 2000).
Reforms to foster an enabling environment. South Asia is just ahead of Sub-Saharan Africa, but behind the other regions in terms of a conducive business climate (World Bank 2016p; Lopez‐Acevedo, Medvedev, and Palmade 2016). Entry and administrative barriers in many sectors (construction, finance, retail and wholesale, telecommunication, and health care) in Bangladesh, India, and Pakistan have hampered investment in these sectors. The burden of regulatory compliance, delays in utility connections, difficulties in obtaining permits to start and operate business, higher taxes, and rigid labor markets raise the cost of doing business and discourage investment (Pachouri and Sharma 2016; Shirke and Srija 2014). Compared to an average of 103 days in EMDE, obtaining services from utilities (e.g., electricity) can take four time as long in Bangladesh and almost twice as long in Pakistan (World Bank 2016p). In India, investors point to restrictive labor laws as contributing to lower productivity in the manufacturing sector, restricting employment opportunities for women, and discouraging the adoption of new technologies.
Reforms that promote competitiveness and reduce barriers to trade can encourage investment in the tradable export-oriented sectors (e.g., services and manufacturing). This can also level the playing field and increase profitability of exporting, or of competing with imports in hitherto
BOX 2.5.1 Recent investment slowdown: South Asia (continued)
protected industries (Alfaro and Chari 2014). More generally, reforms to reduce regulatory burdens (e.g., land acquisition, environmental impact assessment) and to strengthen public-private partnerships legislation (e.g., consistent regulations, transparent bidding procedures) can foster investment. Strengthening public investment management processes, integrating infrastructure projects in budget cycles, and curbing corruption in infrastructure projects will not only improve quality of the infrastructure, but also improve the efficiency of government spending (KPMG 2011; Ali 2009).
Stability. Policy and political uncertainty represents a deterrent to investment in parts of the region (Chapter 3). Security challenges (Afghanistan, Pakistan) and geopolitical tensions (India, Pakistan) remain a formidable obstacle to creating a more conducive investment climate (Dash, Nafaraj, and Sahoo 2014) especially for cross-border projects that could increase regional economic integration. Stalled reforms on land (acquisition, compensation, and environmental clearances) remain a drawback on infrastructure-related private investment. Reforms to enhance efficiency of labor market—encouraging greater female labor market participation, facilitating hiring and redundancy procedures, and reducing taxes on low-paid workers—would increase the mobility and flexibility of the work force (Shirke and Srija 2014). In turn, the resulting increase in profitability, as well as the improvement in household incomes, would provide incentives for the expansion of businesses, including small and medium-size enterprises.


Recent developments
After falling to 3.1 percent in 2015, growth in Sub-Saharan Africa is estimated to have slowed further, to 1.5 percent in 2016 (Table 2.6.1), its worst performance since 1994. As a result, regional per capita GDP is estimated to have contracted by 1.1 percent in 2016, following growth of 0.4 percent in 2015. Low commodity prices, weak external demand, drought, and security problems continued to take a toll on activity in the region. Crude oil prices averaged $43 per barrel in 2016, down 15 percent from 2015. Metal prices rose, but were on average 11 percent lower than in 2015. Agricultural prices remained weak. In addition to the terms of trade deterioration, capital inflows fell. Compounding these adverse external developments, several countries were subject to negative domestic shocks. El Niño-related drought caused sharp falls in agricultural production in eastern and southern areas (Ethiopia, Lesotho, Malawi, Mozambique, Rwanda, South Africa, Uganda), and cutbacks in hydro-electricity generation (South Africa,
Zambia). The security situation deteriorated notably in Nigeria, with militants’ attacks on oil pipelines, and in South Sudan.
The weakness in activity was particularly marked in South Africa and oil exporters, which account for two-thirds of regional output (Figure 2.6.1). In South Africa, growth slowed to 0.4 percent in 2016, reflecting the effects of low commodity prices and heightened governance concerns. Growth among oil exporters fell sharply to -0.2 percent in 2016 from 2.9 percent in 2015, with Angola and Nigeria, the region’s two largest oil exporters, continuing to face severe economic and financial strains. In both countries, the low oil price was compounded by a decline in oil production—due to pipeline attacks in Nigeria, and a fall in investment in Angola. Domestic demand weakened as low commodity revenues forced deep cuts in public spending. In Nigeria, salary arrears further constrained household spending. Foreign exchange shortages, coupled with intermittent power outages, weighed heavily on the manufacturing sector. Reflecting the broad weakness in its economy, Nigeria’s GDP contracted by 1.7 percent in 2016. In Angola, growth slowed to 0.4 percent. In Angola, Nigeria, and South Africa, per capita growth was negative
Growth in Sub-Saharan Africa is estimated to have decelerated to 1.5 percent in 2016, the lowest level in over two decades, as commodity exporters adjust to low commodity prices. Regional GDP per capita contracted by 1.1 percent. South Africa and oil exporters account for most of the slowdown, while activity in non-resource intensive countries—agricultural exporters and commodity importers—generally remained robust. Commodity prices are expected to stabilize, but stay well below their levels of 2011, and fiscal adjustment needs remain large. Growth in the region is forecast to rebound to 2.9 percent in 2017, and rise above 3.5 percent by 2018, as policies in oil exporters continue to adjust. Risks to the outlook are tilted to the downside. They include heightened policy uncertainty in the United States and Europe, slower improvements in commodity prices, and tighter global financing conditions. Domestically, policy makers may not enact the reforms needed to rebuild fiscal buffers. Addressing fiscal vulnerabilities, and bolstering per capita growth remain key policy challenges across the region.
Note: This section was prepared by Gerard Kambou, with contributions from Yirbehogre Some. Research assistance was provided by Xinghao Gong.

CHAPTER 2 .6 GLOBAL ECONOMIC PROSPECTS | JANUARY 2017 166
FIGURE 2.6.1 Growth
GDP growth in Sub-Saharan Africa slowed from 3.1 in 2015 to an
estimated 1.5 percent in 2016, driven by low commodity prices and
domestic shocks. The slowdown was particularly marked in South Africa
and oil exporters; in contrast, growth in agricultural exporters and
commodity importers remained solid.
B. GDP growth in Sub-Saharan Africa A. Commodity prices
D. Per capita GDP growth in Angola,
Nigeria, and South Africa
C. GDP growth in commodity
exporters and importers
Sources: Haver Analytics, Nigeria National Bureau of Statistics, Statistics South Africa, World Bank.
B. EMDE = emerging market and developing economies. E.F. PMI = Purchasing Managers’ Index.
SSA = Sub-Saharan Africa.
in 2016. Other oil exporters were also severely affected by low oil prices, with Chad falling into recession. However, growth was robust in Cameroon and the Republic of Congo, as public investment and oil production remained high.
Other commodity exporters—particularly metals exporters—struggled to adjust to low commodity prices. Growth slowed appreciably in the Democratic Republic of Congo and Mozambique. The discovery of undisclosed information on
government debt led to a deterioration in investor sentiment in Mozambique. Post-Ebola recovery in Guinea, Liberia and Sierra Leone was hampered by the low price for iron ore, their main export.
By contrast, many agricultural exporters—Côte d’Ivoire and Senegal in West Africa, Ethiopia and Rwanda in East Africa—continued to grow at a pace of 6 percent or more (Table 2.6.2). Growth in these countries reflected strong public infrastructure investment and buoyant private consumption as they continued to benefit from low oil prices. These trends were at play in the CFA franc zone1, where growth has been resilient. Among other agricultural exporters, growth slowed in Malawi and Uganda partly due to drought, and was weak in politically fragile countries (Burundi, The Gambia).
Growth in commodity importers was steady. A rebound in Cabo Verde and steady growth in Mauritius offset a slowdown in the Seychelles and Swaziland. Growth increased in Cabo Verde on account of tourism, foreign investment, and improved domestic demand. A slowdown in construction weighed on growth in the Seychelles. Persistent electricity shortages and political instability constrained activity in the Comoros. Growth was low in Lesotho and negative in Swaziland, reflecting the effects of drought and spillovers from a slowdown in South Africa.
In countries where growth faltered, credit to the private sector slowed and employment fell. Activity in financial institutions contracted and non-performing loans rose. In South Africa, credit to households contracted in real terms. Credit to the corporate sector was more resilient, but below its recent peaks. Credit to the private sector also contracted in oil exporters such as Angola and Nigeria, as well as among other commodity exporters such as Mozambique. The unemployment rate increased from 25 percent in 2015 to 27 percent in 2016 in South Africa. In Nigeria, the unemployment rate reached 13.9
F. South Africa: Manufacturing PMI
and Production
E. Quarterly GDP growth and Manu-
facturing PMI in Nigeria
-80-60-40-20
0204060
Oil
Na
tura
l ga
s
Iro
n o
re
Cop
pe
r
Gold
Pla
tinu
m
Coffe
e
Co
coa
Te
a
June-Dec. 2014Dec. 2014-Dec. 2015Dec. 2015-Nov. 2016
Cumulative percent change of nominal index, 2010=100
-2
0
2
4
6
8
1020
05
20
06
20
07
20
08
20
09
20
10
20
11
20
12
20
13
20
14
20
15
20
16
SSA ex. Nigeria and South AfricaEMDE ex. ChinaSub-Saharan Africa
Percent
-101234567
Sub
-Sa
ha
ran
Afr
ica
So
uth
Afr
ica
SS
A o
ile
xport
ers
SS
A m
eta
le
xport
ers
excl.
Sou
th A
fric
a
SS
A a
gri
culture
exp
ort
ers
SS
A c
om
mo
dity
imp
ort
ers
201520162017f
Percent
-5
-4
-3
-2
-1
0
1
2
3
4
Angola Nigeria South Africa Sub-SaharanAfrica
2014 2015 2016 2017fPercent
46
48
50
52
54
56
-4
-2
0
2
4
6
Q1 Q2 Q3 Q4 Q1 Q2 Q3 Q4
2015 2016
Real growth (LHS)Real non-oil growth (LHS)PMI (RHS)
Percent Composite PMI, 50+=expansion
100
102
104
106
108
110
40
44
48
52
56
Jan
-14
Ap
r-14
Jul-
14
Oct-
14
Jan
-15
Ap
r-15
Jul-
15
Oct-
15
Jan
-16
Ap
r-16
Jul-
16
Oct-
16
Manufacturing PMI (LHS)Manufacturing production volume (RHS)
PMI, 50+=expansion Index, 2010=100
1The CFA franc zone is an umbrella agreement between France and two monetary unions: the Central African Economic and Monetary Community (CEMAC) and the West African Economic and Monetary Union (WAEMU). Both unions peg their currencies to the euro at the same level.

SUB-SAHARAN AFR ICA GLOBAL ECONOMIC PROSPECTS | JANUARY 2017 167
FIGURE 2.6.2 External developments
Current account deficits remain very high in most commodity exporters.
They are relatively low in commodity importers despite strong capital
goods imports. Sovereign bond spreads fell—in common with other
EMDEs—but rose following the U.S. elections. Capital inflows, particularly
FDI and bond issuances, decreased.
B. Sovereign bond spreads A. Current account balance
D. Capital flows C. Foreign direct investments
Sources: Haver Analytics, JP Morgan, World Bank.
A. Aggregates exclude Liberia and Sierra Leone due to data unavailability. SSA = Sub-Saharan
Africa.
B. Last observation is December 15, 2016.
percent in the third quarter, up from 10.4 percent in the fourth quarter of 2015.
Current account deficits and financing
Current account deficits remained very high across much of the region in 2016 (Figure 2.6.2). In South Africa, the current account deficit stayed wide, at more than 3.5 percent of GDP, on account of a slowdown in export growth and a negative income balance. In oil exporters, the current account deficit edged higher. However, in a number of countries, including Angola, Chad, Equatorial Guinea and Nigeria, the growth slowdown led to a fall in imports that more than offset the decline in oil exports. Among metals exporters, the current account deficit remained high (Mozambique, Namibia) or even widened (Niger, Zambia), despite contractions in imports. In agricultural exporters, the current account deficit was stable as strong demand for capital goods imports was offset by the gains from low oil prices. Nonetheless, several countries (Malawi, Rwanda, and Togo) saw their current account deficits widen, as the trade balance deteriorated sharply. Current account deficits deteriorated markedly among commodity importers, reflecting a surge in capital goods imports in Cabo Verde and the Comoros as investment spending increased.
Capital flows to the region declined. FDI fell sharply, reflecting low commodity prices and, in some cases (Nigeria, Mozambique), weakening investor confidence. Equity inflows also decreased. The United Kingdom’s vote to leave the European Union set off a bout of turbulence in South Africa’s stock market. Cross-border bank lending moderated due to weak trade growth. Sovereign bond issuance slowed markedly, as weak investor demand led potential borrowers (Angola, Nigeria) to delay new issues. Only South Africa and Ghana tapped the international bond market in 2016. After a spike at the start of the year, sovereign bond spreads in the region fell, reflecting reduced financial market volatility. However, following the U.S. elections, sovereign spreads rose notably, suggesting a tightening of financing conditions. Remittance flows, an important source of financing for many countries (Nigeria, Liberia,
The Gambia, and the Comoros), declined as growth in source countries remained subdued.
Exchange rates, foreign reserves and inflation
The high current account deficits and falling capital inflows put pressure on exchange rates and reserves. Currencies in the region continued to exhibit a wide divergence in performance (Figure 2.6.3). The South African rand rebounded in the second quarter of 2016 on the back of an increase in commodity prices, but began to fall again on expectations of tightening U.S. monetary policy, and as political uncertainty increased. The rand strengthened in the fourth quarter, after S&P Global Ratings affirmed South Africa’s investment grade credit rating. The currencies of Angola and Nigeria weakened substantially against the U.S. dollar. The Nigerian naira fell by 40 percent after
-20
-15
-10
-5
0
Su
b-S
ah
ara
nA
fric
a
SS
A o
ile
xpo
rte
rs e
xcl.
Nig
eri
a
SS
A m
eta
le
xpo
rte
rs
SS
A a
gri
cultu
ree
xpo
rte
rs
SS
A c
om
mo
dity
imp
ort
ers
2015 2016 2017fPercent of GDP
100
300
500
700
900
1,100
1,300
1,500
Jan
-14
Jun
-14
No
v-1
4
Ap
r-15
Sep
-15
Feb
-16
Jul-
16
De
c-1
6
Sub-Saharan AfricaEmerging marketsGabonGhanaNigeriaSouth Africa
Basis points
0
10
20
30
40
50
60
70
0
1
2
3
4
5
6
7
2011 2012 2013 2014 2015 2016
FDI volume (LHS)Number of investments (RHS)
US$, billions Count
0
10
20
30
40
50
60
2013 2014 2015 2016Jan-Nov
Equity issueBond issueBank loans
US$, billions

CHAPTER 2 .6 GLOBAL ECONOMIC PROSPECTS | JANUARY 2017 168
the Central Bank of Nigeria abandoned the peg in June 2016; and it continued to face downward pressures, reflected in the large wedge between the official and parallel market rates. In other commodity exporters, the Mozambican metical depreciated by more than 50 percent against the U.S. dollar, on account of falling capital inflows. Currency depreciation in real effective terms has been relatively muted, partly reflecting a recovery in commodity prices and a partial adjustment of the exchange rate in some countries. Among oil exporters in the CEMAC, the depreciation in effective terms has been limited, due to the peg to the euro (IMF 2016r). Pressures on exchange rates were partly met with reserve drawdowns, especially among oil-exporters. International reserves, in months of imports of goods and services, fell by more than 17 percent in Angola and Nigeria. Reserves also declined in metals exporters, including by over 30 percent in
Mozambique and Namibia, compared to 2015. By contrast, the currencies of agricultural exporters and commodity importers were broadly stable.
Deep currency depreciations, coupled with rising food prices due to drought, pushed inflation into double digits (on average) in 2016. Headline inflation accelerated to 41.1 percent (y/y) in Angola, and was above 15 percent in Ghana, Malawi, Mozambique, and Nigeria. Inflation remained above the central bank target range in South Africa, at 6.6 percent (y/y). Higher food costs contributed to inflation in Malawi, Mozambique, and South Africa. The surge in inflation weighed on private consumption, and forced central banks to tighten policy. However, in several commodity exporters (Angola, Nigeria), real interest rates have remained negative, suggesting that further policy tightening may be necessary to anchor inflation expectations, and to relieve pressure on their currencies. Meanwhile, currency stability helped keep inflation within the central bank target range in Kenya, Tanzania, and Uganda. Inflation stayed low in CFA franc zone countries, reflecting the peg to the Euro, and among commodity importers owing to falling oil prices. In these countries, interest rates were cut (Kenya, Mauritius, and Uganda), or kept low (WAEMU).2
Fiscal positions
Government finances remained under pressure across the region in 2016 (Figure 2.6.4). Modest improvements in oil and metals exporters were offset by widening fiscal deficits in agricultural exporters and commodity importers. In South Africa, weaker-than-expected revenues and additional expenditure demands resulted in higher budget deficits than projected. The fiscal deficit rose in Nigeria; deficits in other oil exporters eased but stayed high. In many of these countries, the fiscal consolidation efforts that began in 2015 slowed in 2016. Expenditures rose in Cameroon and remained broadly unchanged in Gabon. Fiscal consolidation did, however, help to reduce the fiscal deficit in commodity exporters, such as
FIGURE 2.6.3 Inflation and exchange rates
Regional inflation rose to double-digit levels in 2016. A common factor was
rising food prices due to drought. Currency depreciations were a factor in
a number of large commodity exporters. While higher inflation often
triggered tighter monetary policy, real interest rates remain negative in
some countries. Although most currencies depreciated in real effective
terms, inflation in commodity importers generally remained low.
B. Nominal exchange rates A. Inflation
D. Real interest rates C. Real effective exchange rates
Sources: Bloomberg, Haver Analytics, World Bank.
A. Last observation is November 2016.
B. Last observation is December 21, 2016.
C. Last observation is November 2016.
D. Real interest rates are calculated as policy interest rates minus year-on-year inflation. Latest
indicates November 2016 data.
-10
0
10
20
30
40
50
Jan
-14
Ap
r-14
Jul-
14
Oct-
14
Jan
-15
Ap
r-15
Jul-
15
Oct-
15
Jan
-16
Ap
r-16
Jul-
16
Oct-
16
Sub-Saharan AfricaAngolaKenyaMozambiqueNigeriaSouth AfricaMauritius
Year-on-year, in percent
-70
-60
-50
-40
-30
-20
-10
0
10Jan
-14
Jun
-14
No
v-1
4
Ap
r-15
Sep
-15
Feb
-16
Jul-
16
De
c-1
6
AngolaKenyaMozambiqueNigeriaSouth AfricaMauritius
LCU/US$, percent change since January 1, 2014
40
60
80
100
120
140
Jan
-14
Ap
r-14
Jul-
14
Oct-
14
Jan
-15
Ap
r-15
Jul-
15
Oct-
15
Jan
-16
Ap
r-16
Jul-
16
Oct-
16
Ghana NigeriaSouth Africa UgandaZambia Sub-Saharan Africa
Index, 2010=100
-30
-20
-10
0
10
Uga
nd
a
Gh
an
a
Ke
nya
Sou
th A
fric
a
Nig
eri
a
Zam
bia
Ang
ola
LatestDec-14
Percent
2WAEMU countries are: Benin, Burkina Faso, Côte d’Ivoire, Guinea Bissau, Mali, Niger, Senegal and Togo.
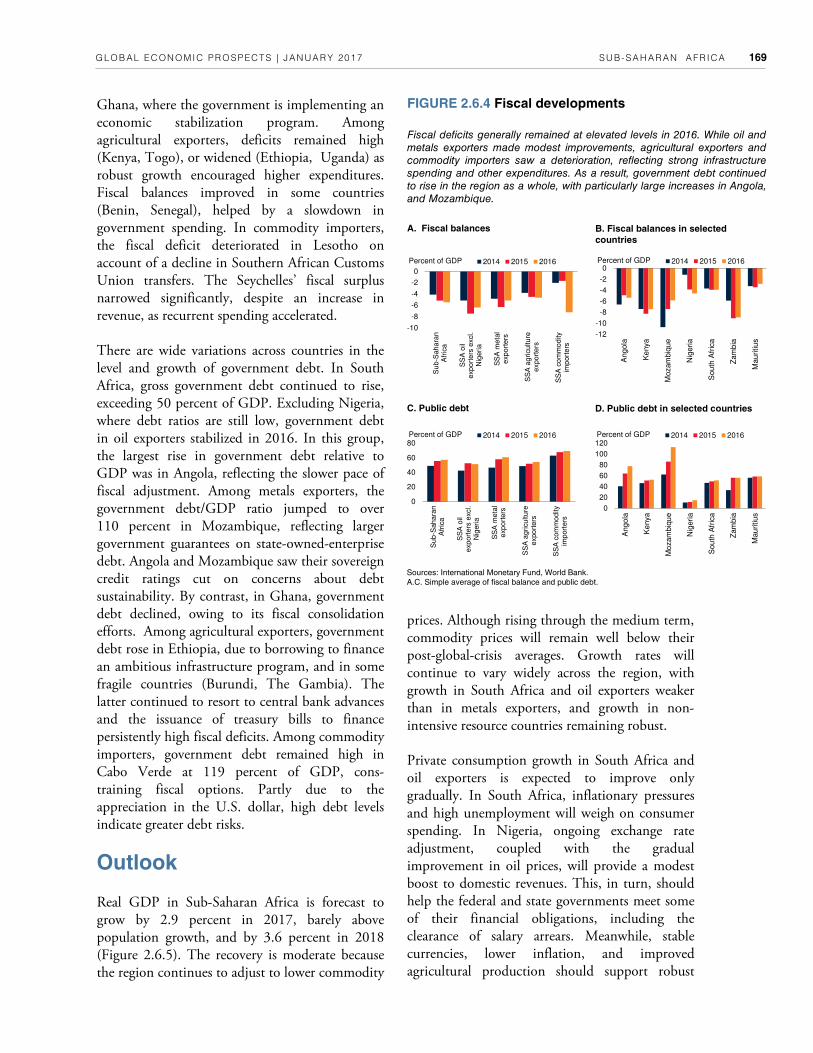
SUB-SAHARAN AFR ICA GLOBAL ECONOMIC PROSPECTS | JANUARY 2017 169
Ghana, where the government is implementing an economic stabilization program. Among agricultural exporters, deficits remained high (Kenya, Togo), or widened (Ethiopia, Uganda) as robust growth encouraged higher expenditures. Fiscal balances improved in some countries (Benin, Senegal), helped by a slowdown in government spending. In commodity importers, the fiscal deficit deteriorated in Lesotho on account of a decline in Southern African Customs Union transfers. The Seychelles’ fiscal surplus narrowed significantly, despite an increase in revenue, as recurrent spending accelerated.
There are wide variations across countries in the level and growth of government debt. In South Africa, gross government debt continued to rise, exceeding 50 percent of GDP. Excluding Nigeria, where debt ratios are still low, government debt in oil exporters stabilized in 2016. In this group, the largest rise in government debt relative to GDP was in Angola, reflecting the slower pace of fiscal adjustment. Among metals exporters, the government debt/GDP ratio jumped to over 110 percent in Mozambique, reflecting larger government guarantees on state-owned-enterprise debt. Angola and Mozambique saw their sovereign credit ratings cut on concerns about debt sustainability. By contrast, in Ghana, government debt declined, owing to its fiscal consolidation efforts. Among agricultural exporters, government debt rose in Ethiopia, due to borrowing to finance an ambitious infrastructure program, and in some fragile countries (Burundi, The Gambia). The latter continued to resort to central bank advances and the issuance of treasury bills to finance persistently high fiscal deficits. Among commodity importers, government debt remained high in Cabo Verde at 119 percent of GDP, cons- training fiscal options. Partly due to the appreciation in the U.S. dollar, high debt levels indicate greater debt risks.
Outlook
Real GDP in Sub-Saharan Africa is forecast to grow by 2.9 percent in 2017, barely above population growth, and by 3.6 percent in 2018 (Figure 2.6.5). The recovery is moderate because the region continues to adjust to lower commodity
prices. Although rising through the medium term, commodity prices will remain well below their post-global-crisis averages. Growth rates will continue to vary widely across the region, with growth in South Africa and oil exporters weaker than in metals exporters, and growth in non-intensive resource countries remaining robust.
Private consumption growth in South Africa and oil exporters is expected to improve only gradually. In South Africa, inflationary pressures and high unemployment will weigh on consumer spending. In Nigeria, ongoing exchange rate adjustment, coupled with the gradual improvement in oil prices, will provide a modest boost to domestic revenues. This, in turn, should help the federal and state governments meet some of their financial obligations, including the clearance of salary arrears. Meanwhile, stable currencies, lower inflation, and improved agricultural production should support robust
FIGURE 2.6.4 Fiscal developments
Fiscal deficits generally remained at elevated levels in 2016. While oil and
metals exporters made modest improvements, agricultural exporters and
commodity importers saw a deterioration, reflecting strong infrastructure
spending and other expenditures. As a result, government debt continued
to rise in the region as a whole, with particularly large increases in Angola,
and Mozambique.
B. Fiscal balances in selected
countries
A. Fiscal balances
D. Public debt in selected countries C. Public debt
Sources: International Monetary Fund, World Bank.
A.C. Simple average of fiscal balance and public debt.
-10
-8
-6
-4
-2
0
Su
b-S
ah
ara
nA
fric
a
SS
A o
ile
xpo
rte
rs e
xcl.
Nig
eri
a
SS
A m
eta
le
xpo
rte
rs
SS
A a
gri
cultu
ree
xpo
rte
rs
SS
A c
om
mo
dity
imp
ort
ers
2014 2015 2016Percent of GDP
0
20
40
60
80
Su
b-S
ah
ara
nA
fric
a
SS
A o
ile
xpo
rte
rs e
xcl.
Nig
eri
a
SS
A m
eta
le
xpo
rte
rs
SS
A a
gri
cultu
ree
xpo
rte
rs
SS
A c
om
mo
dity
imp
ort
ers
2014 2015 2016Percent of GDP
0
20
40
60
80
100
120
Ang
ola
Ke
nya
Mo
zam
biq
ue
Nig
eri
a
Sou
th A
fric
a
Zam
bia
Mau
ritius
2014 2015 2016Percent of GDP
-12
-10
-8
-6
-4
-2
0
Ang
ola
Ke
nya
Mozam
biq
ue
Nig
eria
Sou
th A
fric
a
Zam
bia
Mau
ritiu
s
2014 2015 2016Percent of GDP
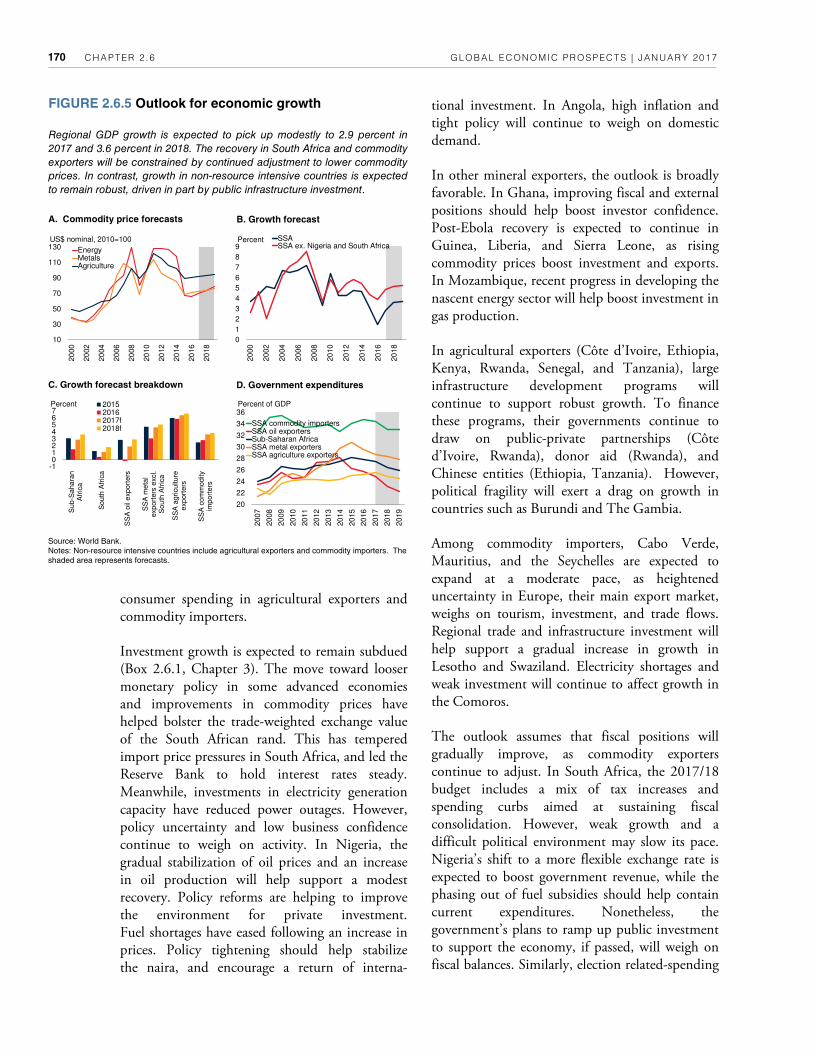
CHAPTER 2 .6 GLOBAL ECONOMIC PROSPECTS | JANUARY 2017 170
consumer spending in agricultural exporters and commodity importers.
Investment growth is expected to remain subdued (Box 2.6.1, Chapter 3). The move toward looser monetary policy in some advanced economies and improvements in commodity prices have helped bolster the trade-weighted exchange value of the South African rand. This has tempered import price pressures in South Africa, and led the Reserve Bank to hold interest rates steady. Meanwhile, investments in electricity generation capacity have reduced power outages. However, policy uncertainty and low business confidence continue to weigh on activity. In Nigeria, the gradual stabilization of oil prices and an increase in oil production will help support a modest recovery. Policy reforms are helping to improve the environment for private investment. Fuel shortages have eased following an increase in prices. Policy tightening should help stabilize the naira, and encourage a return of interna-
tional investment. In Angola, high inflation and tight policy will continue to weigh on domestic demand.
In other mineral exporters, the outlook is broadly favorable. In Ghana, improving fiscal and external positions should help boost investor confidence. Post-Ebola recovery is expected to continue in Guinea, Liberia, and Sierra Leone, as rising commodity prices boost investment and exports. In Mozambique, recent progress in developing the nascent energy sector will help boost investment in gas production.
In agricultural exporters (Côte d’Ivoire, Ethiopia, Kenya, Rwanda, Senegal, and Tanzania), large infrastructure development programs will continue to support robust growth. To finance these programs, their governments continue to draw on public-private partnerships (Côte d’Ivoire, Rwanda), donor aid (Rwanda), and Chinese entities (Ethiopia, Tanzania). However, political fragility will exert a drag on growth in countries such as Burundi and The Gambia.
Among commodity importers, Cabo Verde, Mauritius, and the Seychelles are expected to expand at a moderate pace, as heightened uncertainty in Europe, their main export market, weighs on tourism, investment, and trade flows. Regional trade and infrastructure investment will help support a gradual increase in growth in Lesotho and Swaziland. Electricity shortages and weak investment will continue to affect growth in the Comoros.
The outlook assumes that fiscal positions will gradually improve, as commodity exporters continue to adjust. In South Africa, the 2017/18 budget includes a mix of tax increases and spending curbs aimed at sustaining fiscal consolidation. However, weak growth and a difficult political environment may slow its pace. Nigeria’s shift to a more flexible exchange rate is expected to boost government revenue, while the phasing out of fuel subsidies should help contain current expenditures. Nonetheless, the government’s plans to ramp up public investment to support the economy, if passed, will weigh on fiscal balances. Similarly, election related-spending
FIGURE 2.6.5 Outlook for economic growth
Regional GDP growth is expected to pick up modestly to 2.9 percent in
2017 and 3.6 percent in 2018. The recovery in South Africa and commodity
exporters will be constrained by continued adjustment to lower commodity
prices. In contrast, growth in non-resource intensive countries is expected
to remain robust, driven in part by public infrastructure investment.
B. Growth forecast A. Commodity price forecasts
D. Government expenditures C. Growth forecast breakdown
Source: World Bank.
Notes: Non-resource intensive countries include agricultural exporters and commodity importers. The
shaded area represents forecasts.
10
30
50
70
90
110
130
20
00
20
02
20
04
20
06
20
08
20
10
20
12
20
14
20
16
20
18
EnergyMetalsAgriculture
US$ nominal, 2010=100
0
1
2
3
4
5
6
7
8
920
00
20
02
20
04
20
06
20
08
20
10
20
12
20
14
20
16
20
18
SSASSA ex. Nigeria and South Africa
Percent
-101234567
Sub
-Sa
ha
ran
Afr
ica
So
uth
Afr
ica
SS
A o
il e
xport
ers
SS
A m
eta
lexp
ort
ers
exc
l.S
ou
th A
fric
a
SS
A a
gri
cultu
ree
xport
ers
SS
A c
om
mo
dity
imp
ort
ers
201520162017f2018f
Percent
20
22
24
26
28
30
32
34
36
20
07
20
08
20
09
20
10
20
11
20
12
20
13
20
14
20
15
20
16
20
17
20
18
20
19
SSA commodity importersSSA oil exportersSub-Saharan AfricaSSA metal exportersSSA agriculture exporters
Percent of GDP

SUB-SAHARAN AFR ICA GLOBAL ECONOMIC PROSPECTS | JANUARY 2017 171
FIGURE 2.6.6 Risks of uncertainty in major advanced
economies
Downside risks to the baseline forecasts have increased since June,
reflecting heightened policy uncertainty in the United States and Europe,
two major trading partners for countries in the region. A confidence shock
in major advanced economies could further dent regional investment
growth, which is already below the long-term average.
B. Trade and financial exposures to
major advanced economies, 2010-15
A. Relative size of major world
economies, 2010-15
D. Impact of 10 percent increase in
VIX on EMDE investment growth
C. Largest trade and financial
exposures to major advanced
economies, 2015
Sources: Bank for International Settlements (BIS), Haver Analytics, International Monetary Fund,
World Bank.
A.B. Trade (A) includes both exports and imports. Exports (B) includes goods exports only. Foreign
claims refer to total claims of BIS-reporting banks on foreign banks and nonbanks. Stock market
capitalization is the market value of all publicly-traded shares. “US” stands for United States; “EU”
stands for European Union. FDI data only available up to 2014.
C. Goods exports to the United States/Euro Area, remittances from the United States/Euro Area, and
FDI from the United States/Euro Area (all in percent of GDP). Chart shows only the countries with the
largest exposures to the United States and Euro Area.
D. Cumulative responses of EMDE investment to a 10 percent increase in the VIX. Solid lines
indicate the median response and the dotted lines indicate 16-84 percent confidence intervals. Vector
auto regressions are estimated with sample for 1998Q1-2016Q2. The model includes, in this order,
the VIX, MSCI Emerging Markets Index (MXEM), J.P.Morgan Emerging Markets Bond Index
(EMBIG), aggregate real output and investment growth in 18 EMDEs with G7 real GDP growth, U.S.
10-year bond yields, and MSCI World Index as exogenous regressors and estimated with two lags.
will likely keep fiscal deficits elevated in various countries (Angola, the Democratic Republic of Congo, Kenya).
Weak net exports and terms of trade will continue to exert a drag on the region. Demand from advanced economies is expected to remain subdued, given their moderate prospects for growth. Private consumption and infrastructure investment spending will keep imports high in countries across the region. By 2019, however, the drag on growth should ease gradually as commodity prices rise, and import growth slows on the back of maturing investment projects.
Risks
Risks to the outlook remain heavily tilted to the downside (Figure 2.6.6). On the external front:
• Heightened policy uncertainty in the United States and Europe could lead to volatility in financial markets and higher borrowing costs, or even trigger a cut-off in capital flows to emerging and frontier markets. The environment of low yields in advanced economies has led to a surge of capital flows into Sub-Saharan Africa in recent years. This has created vulnerabilities for the region, in that a cut-off or reversal of such flows would likely hit hard the more heavily traded currencies, such as the South African rand. Many smaller economies are already unable to access international debt markets.
• A sharper-than-expected slowdown in China could weigh on demand for export commodities and undermine their prices. Slower-than-expected improvements in commodity prices would put more strain on fiscal and current account balances, forcing deeper expenditure cuts that could weaken the recovery and infrastructure investment that is vital for long-term growth.
On the domestic front, the main risk is that policy makers might fail to adjust to an environment with low commodity prices and weak global demand. With commodity prices remaining low, sustained measures are needed to contain fiscal
deficits and rebuild buffers. In some countries, however, political pressures may prompt the adoption of haphazard populist policies, or lead to protracted legal and political stress, hampering fiscal adjustment. In others, a further deterioration of security conditions could put additional strains on public finances. In the absence of sound, forward-looking budget management, high growth of borrowing requirements will pose major risks of economic instability, and impair the long-run welfare of the population.
0
20
40
60
80
100
GDP(market
exchangerates)
GDP(PPP)
Trade Foreignclaims
Stockmarket
capitalization
US China EU Japan OtherPercentof total
0
20
40
60
80
100
Exports InwardFDI
Remittanceinflows
Portfolioliabilities
Foreignclaims
US China EU Japan OtherPercent of total
-1.5
-1.0
-0.5
0.0
1 2 3 4 5 6 7 8
Quarter
Percentage points
0
10
20
30
40
Lib
eria
Congo, R
ep.
Chad
Cote
d'Iv
oire
Gabon
Lib
eria
Angola
Cab
o V
erd
e
Gabon
South
Afr
ica
Gam
bia
, T
he
Lib
eria
Cab
o V
erd
e
Senegal
Com
oro
s
Exports FDI Remittances
European Union United StatesPercent of GDP
52
120
41

CHAPTER 2 .6 GLOBAL ECONOMIC PROSPECTS | JANUARY 2017 172
Policy challenges
The sustained decline in commodity prices has dealt a major setback to the region, threatening recent progress on poverty and revealing sizable macroeconomic imbalances in some countries. Regional per capita output contracted in 2016, with growth and employment slowing sharply in the large commodity exporters. A significant number of Sub-Saharan Africa’s poor live in countries where per capita income growth was negative in 2016. Unless growth is restored, poverty rates will rise. This implies a dual challenge: developing new sources of growth while ensuring macroeconomic stability.
Improvements in agricultural sectors. About two-thirds of the poor in the region live in rural households, for which agriculture is the dominant source of income and food security. Expansion of smallholder agricultural output growth is therefore essential for balanced income growth (World Bank 2016y). For many countries in the region, raising productivity growth in smallholder agriculture, and making smallholder farmers competitive, are central to improving the lives of the people (de Janvry and Sadoulet 2012).
Although agricultural output growth in Sub-Saharan Africa has improved over the last two decades, it has largely been the result of expanding the area under cultivation rather than productivity gains, which have remained limited. Unleashing productivity improvements will require significant public investments in rural public goods to strengthen markets, and to develop and disseminate improved technologies. While progress has been made in these areas, investment in agriculture R&D remains insufficient. Governments will need international support to finance these investments. To make smallholder farmers more competitive, governments need to take steps to improve the business environment. Attention is particularly needed on upgrading power and trade logistics infrastructure,
strengthening the skills base, and expanding markets through deeper regional integration (World Bank 2013b).
Countries in the region will also need to attract FDI to help develop agro-businesses with capital and skills that can be integrated into global value chains. Countries that have made the largest strides into global value chains – Ethiopia, Kenya, and South Africa – have benefitted from this integration (Allard et al. 2016).
Macroeconomic stability. Governments need to rebuild their policy buffers. Adjustment to low commodity revenues has started in some countries; however, it has relied on measures such as reserve drawdowns or deep cuts in capital expenditures. More sustainable sources of revenue are needed, including better tax collection. Tax collection has been held back by limited data on potential taxpayers, ineffective tracking tools, gaps in capabilities and resources, and complex tax processes. Appropriate measures to improve tax collection vary across countries. Oil exporters, such as Angola and Nigeria, need to diversify their tax sources, upgrade IT infrastructure, and ensure compliance. For smaller economies, standardizing and simplifying internal processes, and improving collection procedures, will help boost revenues (McKinsey Global Institute 2016).
Fiscal adjustment through reduced and more efficient government expenditure is also critical. This implies rationalizing current expenditures, and improving the quality of public investment through more effective financial management. Within a credible medium-term framework, expenditure should be maintained on health and education, to promote learning and build human capital (Romer 2016), and on investment in strategic infrastructure (Box 2.6.1, Chapter 3). Such a public expenditure program should form part of a broader strategy to make the most of the promising economic potential of the young and growing population in the region (Bloom et al. 2016).

SUB-SAHARAN AFR ICA GLOBAL ECONOMIC PROSPECTS | JANUARY 2017 173
2014 2015 2016 2017 2018 2019 2015 2016 2017 2018
Estimates Projections (percentage point difference
from June 2016 projections)
EMDE SSA, GDPa 4.7 3.1 1.5 2.9 3.6 3.7 0.1 -1.0 -1.0 -0.7
(Average including countries with full national accounts and balance of payments data only)b
EMDE SSA, GDPb 4.7 3.1 1.5 2.9 3.6 3.7 0.1 -1.0 -1.0 -0.7
GDP per capita (U.S. dol-
lars) 1.9 0.4 -1.1 0.2 1.0 1.1 0.1 -1.0 -1.0 -0.7
PPP GDP 5.0 3.3 1.7 3.1 3.9 4.0 0.1 -1.1 -1.1 -0.7
Private consumptionc 2.9 2.4 1.5 2.9 3.4 3.4 -0.4 -1.0 -0.7 -0.5
Public consumption 2.2 1.7 2.1 2.7 3.0 3.0 -1.9 -0.9 -0.5 -0.6
Fixed investment 9.4 5.1 3.3 5.4 7.0 7.1 -0.8 -1.8 -1.4 0.1
Exports, GNFSd 6.3 2.2 1.5 2.0 2.6 2.6 0.7 -0.3 -0.3 -0.2
Imports, GNFSd 3.0 1.4 2.3 3.1 3.7 3.8 -1.9 -1.0 -0.3 0.2
Net exports, contribution
to growth 0.9 0.2 -0.3 -0.4 -0.4 -0.4 0.8 0.2 0.0 -0.1
Memo items: GDP
SSA excluding South Africa 5.8 3.7 1.8 3.5 4.2 4.3 0.1 -1.4 -1.3 -0.9
Oil exporterse 5.6 2.9 -0.2 1.9 2.9 3.0 0.2 -1.9 -1.9 -1.3
CFA countriesf 5.7 4.3 4.3 4.8 5.3 5.5 0.3 -1.0 -0.5 -0.4
South Africa 1.6 1.3 0.4 1.1 1.8 1.8 0.0 -0.2 0.0 -0.2
Nigeria 6.3 2.7 -1.7 1.0 2.5 2.5 0.0 -2.5 -2.5 -1.5
Angola 5.4 3.0 0.4 1.2 0.9 0.9 0.2 -0.5 -1.9 -2.5
TABLE 2.6.1 Sub-Saharan Africa forecast summary
(Real GDP growth at market prices in percent, unless indicated otherwise)
Source: World Bank.
World Bank forecasts are frequently updated based on new information and changing (global) circumstances. Consequently, projections presented here may differ from those contained in
other Bank documents, even if basic assessments of countries’ prospects do not differ at any given moment in time.
a. EMDE refers to emerging market and developing economy. GDP at market prices and expenditure components are measured in constant 2010 U.S. dollars. Excludes Central African
Republic, São Tomé and Príncipe, Somalia, and South Sudan.
b. Sub-region aggregate excludes Central African Republic, São Tomé and Príncipe, Somalia, and South Sudan, for which data limitations prevent the forecasting of GDP components.
c. The sudden surge in private consumption in the region in 2013 is driven by the revised and rebased NIA data of Nigeria in 2014.
d. Exports and imports of goods and non-factor services (GNFS).
e. Includes Angola, Cameroon, Chad, Democratic Republic of Congo, Gabon, Nigeria, Republic of Congo, and Sudan.
f. Includes Benin, Burkina Faso, Cameroon, Central African Republic, Chad, Côte d’Ivoire, Equatorial Guinea, Gabon, Mali, Niger, Republic of Congo, Senegal, and Togo.
For additional information, please see www.worldbank.org/gep.
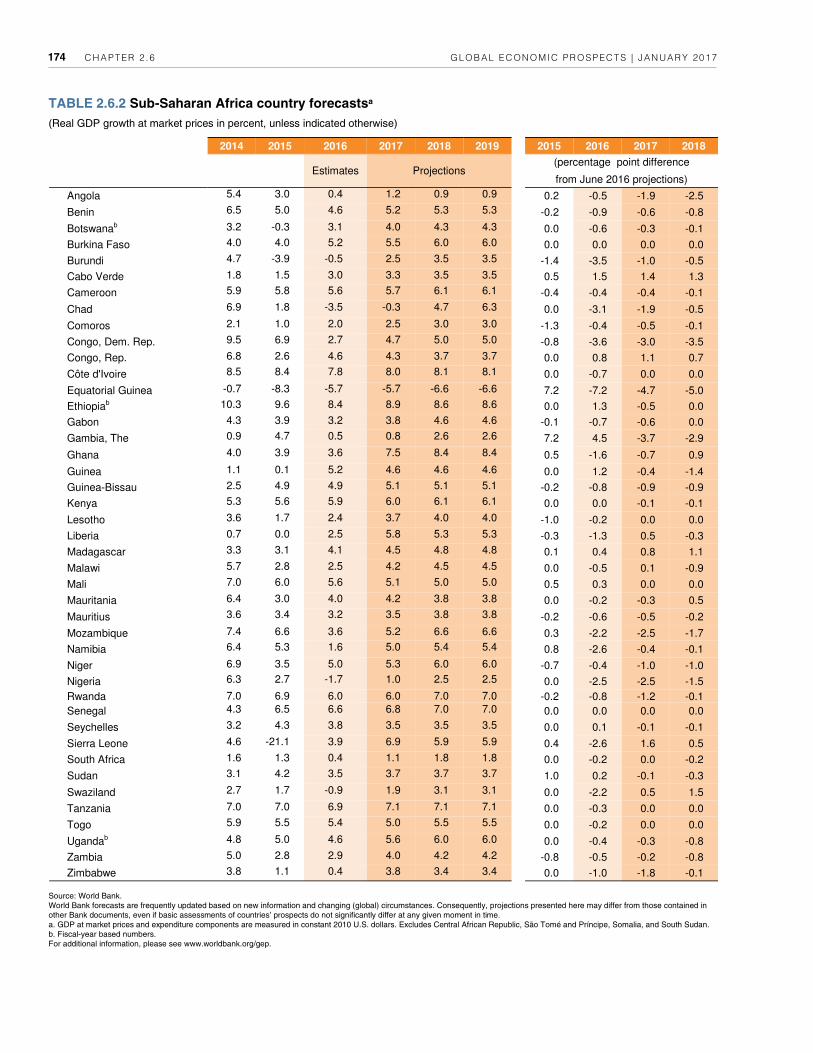
CHAPTER 2 .6 GLOBAL ECONOMIC PROSPECTS | JANUARY 2017 174
2014 2015 2016 2017 2018 2019 2015 2016 2017 2018
Estimates Projections (percentage point difference
from June 2016 projections)
Angola 5.4 3.0 0.4 1.2 0.9 0.9 0.2 -0.5 -1.9 -2.5
Benin 6.5 5.0 4.6 5.2 5.3 5.3 -0.2 -0.9 -0.6 -0.8
Botswanab 3.2 -0.3 3.1 4.0 4.3 4.3 0.0 -0.6 -0.3 -0.1
Burkina Faso 4.0 4.0 5.2 5.5 6.0 6.0 0.0 0.0 0.0 0.0
Burundi 4.7 -3.9 -0.5 2.5 3.5 3.5 -1.4 -3.5 -1.0 -0.5
Cabo Verde 1.8 1.5 3.0 3.3 3.5 3.5 0.5 1.5 1.4 1.3
Cameroon 5.9 5.8 5.6 5.7 6.1 6.1 -0.4 -0.4 -0.4 -0.1
Chad 6.9 1.8 -3.5 -0.3 4.7 6.3 0.0 -3.1 -1.9 -0.5
Comoros 2.1 1.0 2.0 2.5 3.0 3.0 -1.3 -0.4 -0.5 -0.1
Congo, Dem. Rep. 9.5 6.9 2.7 4.7 5.0 5.0 -0.8 -3.6 -3.0 -3.5
Congo, Rep. 6.8 2.6 4.6 4.3 3.7 3.7 0.0 0.8 1.1 0.7
Côte d'Ivoire 8.5 8.4 7.8 8.0 8.1 8.1 0.0 -0.7 0.0 0.0
Equatorial Guinea -0.7 -8.3 -5.7 -5.7 -6.6 -6.6 7.2 -7.2 -4.7 -5.0
Ethiopiab 10.3 9.6 8.4 8.9 8.6 8.6 0.0 1.3 -0.5 0.0
Gabon 4.3 3.9 3.2 3.8 4.6 4.6 -0.1 -0.7 -0.6 0.0
Gambia, The 0.9 4.7 0.5 0.8 2.6 2.6 7.2 4.5 -3.7 -2.9
Ghana 4.0 3.9 3.6 7.5 8.4 8.4 0.5 -1.6 -0.7 0.9
Guinea 1.1 0.1 5.2 4.6 4.6 4.6 0.0 1.2 -0.4 -1.4
Guinea-Bissau 2.5 4.9 4.9 5.1 5.1 5.1 -0.2 -0.8 -0.9 -0.9
Kenya 5.3 5.6 5.9 6.0 6.1 6.1 0.0 0.0 -0.1 -0.1
Lesotho 3.6 1.7 2.4 3.7 4.0 4.0 -1.0 -0.2 0.0 0.0
Liberia 0.7 0.0 2.5 5.8 5.3 5.3 -0.3 -1.3 0.5 -0.3
Madagascar 3.3 3.1 4.1 4.5 4.8 4.8 0.1 0.4 0.8 1.1
Malawi 5.7 2.8 2.5 4.2 4.5 4.5 0.0 -0.5 0.1 -0.9
Mali 7.0 6.0 5.6 5.1 5.0 5.0 0.5 0.3 0.0 0.0
Mauritania 6.4 3.0 4.0 4.2 3.8 3.8 0.0 -0.2 -0.3 0.5
Mauritius 3.6 3.4 3.2 3.5 3.8 3.8 -0.2 -0.6 -0.5 -0.2
Mozambique 7.4 6.6 3.6 5.2 6.6 6.6 0.3 -2.2 -2.5 -1.7
Namibia 6.4 5.3 1.6 5.0 5.4 5.4 0.8 -2.6 -0.4 -0.1
Niger 6.9 3.5 5.0 5.3 6.0 6.0 -0.7 -0.4 -1.0 -1.0
Nigeria 6.3 2.7 -1.7 1.0 2.5 2.5 0.0 -2.5 -2.5 -1.5
Rwanda 7.0 6.9 6.0 6.0 7.0 7.0 -0.2 -0.8 -1.2 -0.1
Senegal 4.3 6.5 6.6 6.8 7.0 7.0 0.0 0.0 0.0 0.0
Seychelles 3.2 4.3 3.8 3.5 3.5 3.5 0.0 0.1 -0.1 -0.1
Sierra Leone 4.6 -21.1 3.9 6.9 5.9 5.9 0.4 -2.6 1.6 0.5
South Africa 1.6 1.3 0.4 1.1 1.8 1.8 0.0 -0.2 0.0 -0.2
Sudan 3.1 4.2 3.5 3.7 3.7 3.7 1.0 0.2 -0.1 -0.3
Swaziland 2.7 1.7 -0.9 1.9 3.1 3.1 0.0 -2.2 0.5 1.5
Tanzania 7.0 7.0 6.9 7.1 7.1 7.1 0.0 -0.3 0.0 0.0
Togo 5.9 5.5 5.4 5.0 5.5 5.5 0.0 -0.2 0.0 0.0
Ugandab 4.8 5.0 4.6 5.6 6.0 6.0 0.0 -0.4 -0.3 -0.8
Zambia 5.0 2.8 2.9 4.0 4.2 4.2 -0.8 -0.5 -0.2 -0.8
Zimbabwe 3.8 1.1 0.4 3.8 3.4 3.4 0.0 -1.0 -1.8 -0.1
Source: World Bank.
World Bank forecasts are frequently updated based on new information and changing (global) circumstances. Consequently, projections presented here may differ from those contained in
other Bank documents, even if basic assessments of countries’ prospects do not significantly differ at any given moment in time.
a. GDP at market prices and expenditure components are measured in constant 2010 U.S. dollars. Excludes Central African Republic, São Tomé and Príncipe, Somalia, and South Sudan.
b. Fiscal-year based numbers.
For additional information, please see www.worldbank.org/gep.
TABLE 2.6.2 Sub-Saharan Africa country forecastsa
(Real GDP growth at market prices in percent, unless indicated otherwise)

SUB-SAHARAN AFR ICA GLOBAL ECONOMIC PROSPECTS | JANUARY 2017 175
BOX 2.6.1 Recent investment slowdown: Sub-Saharan Africa
Investment growth in Sub-Saharan Africa has fallen from nearly 8 percent in 2010 to 0.3 percent in 2015, reflecting a severe terms-of-trade deterioration and long-standing structural impediments, including infrastructure bottlenecks and weak business environments. Investment needs are sizable across a wide range of sectors. Policies to address the region’s investment needs in infrastructure include sustaining public investment, encouraging private sector participation in infrastructure, and strengthening public financial management capacity.
Sub-Saharan Africa (SSA) accounted for a modest 2 percent of global investment, on average, during 2010-15. However, it suffered the sharpest investment growth slowdown among emerging market and developing economies (EMDE) regions despite large-scale public investment efforts until recently. Investment growth slowed from nearly 8 percent in 2010 to 0.3 percent in 2015, on average—well below the long-term (1990-2008) average of about 6 percent.
This box discusses the following questions.
• How has investment growth in the region evolved?
• What were the main sources of the investment growth slowdown?
• What are the remaining investment needs?
• Which policies can help address Sub-Saharan Africa’s infrastructure investments needs?
The investment growth slowdown in Sub-Saharan Africa is concentrated in South Africa and oil exporters. It reflected domestic political tensions, a sharp terms of trade deterioration and, in some economies, domestic policy tightening. Investment needs remain sizable in agriculture, infrastructure, and health and education.
How has investment in the region evolved?
For Sub-Saharan Africa as a whole, investment growth averaged about 5 percent in 2010-2015, less than half the average annual growth of 12 percent recorded prior the global financial crisis, despite rapid public investment growth until 2014. In more than two-thirds of SSA countries, investment growth was below its long-term average in 2015 and, in more than one-third, it was negative (Figure 2.6.1.1).
Investment growth was particularly weak in South Africa and a number of oil exporters, but was robust among metals exporters. Investment growth averaged just 2.5 percent per year in South Africa in 2010-15, compared with over 9 percent in 2000-08, reflecting deep structural
constraints, including inefficiencies in state-owned enterprises.
Among oil exporters, investment growth slowed significantly in Angola, Chad, and Nigeria; and was negative in Equatorial Guinea. The sharp decline in oil prices was compounded by the introduction of foreign exchange controls or weak business environments that weighed on investors’ sentiment. However, in Cameroon and Gabon, large infrastructure programs continued to raise investment growth, despite a decline in investment in the oil industry.
Investment growth in metals-exporting countries averaged 11.3 percent per year over the period 2010-15 (compared with 8.5 percent in 2000-08), with double-digit growth rates in Ghana, Mozambique, and Namibia. Investment growth in Ghana benefited from a more stable economic environment, while Mozambique’s and Namibia’s extractive industries continued to attract foreign investment. Some metals exporters were subject to domestic shocks that held back investment, including power shortages (Botswana, Zambia), deteriorating security conditions (Niger), the Ebola virus (Liberia, Sierra Leone), and political uncertainty (the Democratic Republic of Congo, Zambia).
Investment growth has been solid in the agricultural exporters, such as Côte d’Ivoire, Ethiopia, and Senegal, supported by the implementation of infrastructure development projects. However, investment growth stagnated in commodity importers such as Cabo Verde and Mauritius, reflecting a slowdown in their main trading partners. It was highly volatile in a number of fragile or conflict affected countries.
What were the main sources of the investment slowdown?
External shocks, including the end of the commodity super cycle, a marked slowdown in major trading partners, and rising domestic vulnerabilities contributed to the investment growth slowdown in the region. Prior to the global financial crisis, higher commodity prices, low global risk aversion and favorable domestic growth prospects prompted significant capital inflows in the region. Average Note: This box was prepared by Gerard Kambou.

CHAPTER 2 .6 GLOBAL ECONOMIC PROSPECTS | JANUARY 2017 176
BOX 2.6.1 Recent investment slowdown: Sub-Saharan Africa (continued)
net FDI inflows grew from 0.5 percent of GDP in 1974-1994 to 2.2 percent of GDP in 1995-2008 (Calderon and Boreux 2016). By contrast, over the period 2010-15, which saw a sharp decline in commodity prices, net FDI flows averaged 1.9 percent of GDP.
This period of investment growth slowdown in the region coincided with a weak growth recovery in the European Union, the slowdown of economic activity in China as it embarked on the rebalancing of its economy toward more domestic consumption, and the appreciation of the U.S. dollar. The European Union, the United States, and China are the region’s main sources of foreign investment. The triple blow of weak growth in major export markets, lower commodity prices and a higher U.S. dollar hits the region’s oil exporters particularly hard. During 2010-15, net FDI flows averaged just 0.4 percent of GDP in oil exporters, down from 2.5 percent of GDP in 2004-08. Net
FDI flows were negative in Angola and Equatorial Guinea. In contrast, in oil importers, net FDI flows rose, averaging over 3 percent of GDP, as investors responded to growth opportunities in construction, light manufacturing and renewable energy.
In addition to the unfavorable external environment, the slowdown in investment growth reflected weak macroeconomic fundamentals and policies, and an uncertain institutional and legal framework in some countries. Fiscal and current account balances have deteriorated across the region over the past 5 years (World Bank 2015u). In 2014, 33 countries registered fiscal deficits greater than 5 percent of GDP (up from 25 in 2007), while 15 countries had a current account deficit that exceeded 5 percent of GDP (up from only 5 in 2007) (Calderon and Boreux 2016). This meant that, in some countries, policy makers lacked the ability to conduct
A. Investment growth B. Output growth C. Share of SSA EMDEs with weak
investment growth
D. Contributions to investment growth E. Terms of trade changes F. Political stability
FIGURE 2.6.1.1 Investment growth slowdown
Investment growth has slowed sharply from about 8 percent in 2010 to near-zero in 2015, despite significant public investment
until 2014. The slowdown has reflected a severe terms of trade deterioration in commodity exporters as well as long-standing
structural bottlenecks and political tensions.
-4-202468
101214
20
10
20
12
20
14
20
10
20
12
20
14
20
10
20
12
20
14
20
10
20
12
20
14
Overall Com. exp. Com. imp. EMDE
1990-2008 avg 2003-08 avgPercent
-2
2
6
10
14
20
10
20
12
20
14
20
10
20
12
20
14
20
10
20
12
20
14
20
10
20
12
20
14
Overall Com. exp. Com. imp.
SSA EMDE
1991-2008 avg 2003-08 avgPercent
0
25
50
75
2010 2011 2012 2013 2014 2015
Below long-term averageContracting
Percent
-5
0
5
10
15
20
20
10
20
11
20
12
20
13
20
14
20
15
20
10
20
11
20
12
20
13
20
14
20
15
Commodity exportersexcl. South Africa and
Nigeria
South Africa andNigeria
Percentage points
Public Private
-20
-15
-10
-5
0
5
10
15
2010 2011 2012 2013 2014 2015
PercentEnergy exportersNon-energy commodity exporters
40
45
50
55
60
65
2010 2011 2012 2013 2014 2015
Index, 0-100 (100=best)
Energy exporters
Non-energy commodity exporters
Sources: Haver Analytics; Oxford Economics; World Economic Outlook, International Monetary Fund; World Bank Development Indicators, World Bank; Political Risk
Services International Country Risk Guide (ICRG).
A. Weighted averages.
C. Long-term averages are country-specific and refer to available data over 1990-2008.

SUB-SAHARAN AFR ICA GLOBAL ECONOMIC PROSPECTS | JANUARY 2017 177
countercyclical policies to support economic activity, while rising vulnerabilities weighed on capital inflows. Large current account deficits and falling capital flows put pressures on real exchange rates. Rising inflation, reflecting deep currency depreciations, prompted central banks in a number of commodity exporters to tighten policy, making it costly for firms to invest.
In many countries, basic reforms to improve the business environment—including the rule of law—have been negligible, especially among resource–rich countries. Uncertainty about the enforcement of contracts, property rights and the direction of policy was compounded by weak investment planning and execution capacity. These factors played a significant role in slowing investment growth across the region.
What are Sub-Saharan Africa’s remaining investment needs?
Sub-Saharan Africa’s strategic priorities to reinvigorate growth and reduce poverty call for investments in agriculture, infrastructure, and health and education (World Bank 2016z).
In agriculture, which provides the livelihood for almost two-thirds of Sub-Saharan Africa’s population, investments are needed to raise farm productivity. Increasing investments in agricultural R&D is not only essential for boosting growth in the region but also for accelerating its transformation. Infrastructure investments are needed to support agricultural productivity growth and potential export diversification. These include investments to build or improve irrigation, road, and storage infrastructure, and to develop higher value chains and markets.
Countries in the region have made progress in improving their infrastructure, although results vary. Improved infrastructure was partly responsible for the region’s recent strong growth performance (Calderon and Serven 2008). That contribution reflected mostly advances in information communication technology (ICT). The region has experienced an unprecedented increase in mobile phone subscriptions. By contrast, progress in the power sector has been far more limited. Only a third of households have access to electricity (World Bank 2016z).
• The deterioration in the quantity and quality of power infrastructure has increased the need for investment in renewable energies. These have the potential to improve access to electricity while addressing climate change challenges.
BOX 2.6.1 Recent investment slowdown: Sub-Saharan Africa (continued)
• Transport infrastructure development has also been limited. In many countries, only a small proportion of the road network is paved. Railways development is inadequate.
Across the region, investments are needed to improve the quality of education and skills, the health status of the populations, and the coverage of infrastructure services, notably access to improved sanitation. Despite recent progress, Sub-Saharan Africa lags other regions (Figure 2.6.1.2).
The region’s infrastructure investment needs are large, estimated at 15 percent of GDP, reflecting insufficient and inefficient spending on capital, operation, and maintenance expenditures (Foster and Briceno-Garmendia 2010). Financing to address these investment needs has increased. The external sources of financing for infrastructure have expanded. Official development finance (ODF)—led by the World Bank and the African Development Bank—has increased appreciably. ODF investments are supporting transport and water and sanitation investments in a number of countries. China emerged as a major bilateral source. Chinese investments have increasingly targeted the energy sector and hydropower in particular. Direct private sector involvement surged. Private participation in infrastructure (PPI) now accounts for more than half of total external finance, with a large share of the investments going to the telecom, energy and transport sectors (Gutman, Sy, and Chattopadhyay 2015).
Which policies can help address the region’s remaining infrastructure investment needs?
Financing from multilateral development banks, China, and the private sector tripled between 2004 and 2012 (Gutman, Sy, and Chattopadhyay 2015). External financing for infrastructure grew fastest in the energy sector, with Ethiopia, Ghana, Kenya, Nigeria, and South Africa among the largest recipients. Untapped opportunities remain, including in renewable energy (EBRD 2016) as well as in other investments that can support private sector development. Innovative financing solutions for infrastructure investment that mitigate risk factors for investors have been developed. Tools such as blended finance, co-financing between private investors and development finance institutions, public-private partnerships and climate finance are being deployed in countries across the region (IFC 2016). Nevertheless, financing investment projects remain challenging. Although private investment has become significant and

CHAPTER 2 .6 GLOBAL ECONOMIC PROSPECTS | JANUARY 2017 178
BOX 2.6.1 Recent investment slowdown: Sub-Saharan Africa (continued)
FIGURE 2.6.1.2 Investment needs
Sub-Saharan Africa’s investment needs are high across a wide range of sectors. There has been progress in improving
infrastructure in the region, but progress has been slow, especially in energy and transport.
Source: Haver Analytics; Pierce, and Foster 2008; Regional Economic Outlook, International Monetary Fund; World Bank; Yepes.
A. ICT=information and communication technology; WSS=water supply and sanitation. Estimates by Foster and Briceno-Garmendia (2010).
B. Road density is measured in kilometers per 100 square kilometers of arable land; telephone density in lines per thousand population; generation capacity in
megawatts per million population; electricity, water, and sanitation coverage in percentage of population. SSA stands for Sub-Saharan Africa.
C. Blue bars denote range of unweighted regional averages across EMDE regions. Health expenditure per capita in purchasing power parity terms, unweighted averages
of 199 EMDEs, 34 AEs, and 47 SSA economies. Access to improved sanitation facilities (in percent of population), unweighted averages for 150 EMDEs, 33 AEs,
and 47 SSA economies. Access to improved water sources (in percent of population), unweighted averages for 148 EMDEs, 34 AEs, and 47 SSA economies. AE stands
for advanced economies; and EMDE for emerging market and developing economies. Latest available data available during 2011-15.
D. Blue bars denote range of unweighted regional averages across EMDE regions. Government expenditure per primary student (in percent of per capita income),
unweighted averages of 87 EMDEs, 32 AEs, and 29 SSA economies. Pupil-teacher ratio in primary education (headcount basis), unweighted averages for 165 EMDEs,
31 AEs, and 44 SSA economies. Latest available data available during 2011-15.
A. Total infrastructure spending needs B. International perspective on Africa's Infrastructure deficit
C. Selected health care indicators D. Selected education indicators
0
20
40
60
80
100
120
140
160
180
200
Irrigation ICT Transport WSS Power Total
Capital expenditureOperation and maintenanceTotal spending
US$, billions
0
300
600
900
1,200
1,500
Paved
-ro
ad
de
nsity
Tota
l ro
ad d
en
sity
Ma
in-lin
e d
ensity
Mob
ile d
ensity
Inte
rnet
den
sity
Ge
nera
tio
n c
ap
acity
Ele
ctr
icity c
ove
rag
e
Impro
ve
d w
ate
r
Imp
roved
sa
nita
tio
n
SSA middle-income countriesOther middle-income countriesSSA low-income countriesOther low-income countries
Normalized units
0
20
40
60
80
100
120
0
1,000
2,000
3,000
4,000
5,000
Health expenditure(LHS)
Improved sanitation(RHS)
Improved watersource (RHS)
Per capita
Range
AE
EMDE
SSA
Percent of population
0
5
10
15
20
25
30
35
40
45
Government expenditure Pupil-teacher ratio
Percent of per capita income, ratio
Range
AEEMDEsSSA
covers a broad range of countries, it has focused more on ICT than other sectors.
Despite the rising importance of external finance, public sector budgets remain the primary source of funding for
infrastructure investments in the region. Countries across the region finance about 65 percent of their infrastructure expenditures with domestic resources (IMF 2014b). In some countries, the fiscal space created by the heavily indebted poor countries (HIPC) debt relief facilitated these

SUB-SAHARAN AFR ICA GLOBAL ECONOMIC PROSPECTS | JANUARY 2017 179
expenditures. Others took advantage of low interest rates to issue Eurobonds to finance infrastructure investments. Governments spend most of their resources on transport and energy. Nonetheless, the level of public finance remains insufficient to cover their infrastructure needs. Sub-Saharan African countries need to mobilize more domestic resources to finance infrastructure investment. Tax-to-GDP ratios are far below the EMDE average in a number of countries, reflecting a failure to reform weak tax systems, especially in oil exporters.
The capacity of countries in the region to effectively use resources for infrastructure investment remains a critical issue. The efficiency of public investment in Sub-Saharan Africa lags behind other EMDEs, reflecting poor project selection, weak enforcement of procurement procedures, and failure to complete projects (Dabla-Norris et al. 2012). These weaknesses point to a need to increase absorptive capacity in public infrastructure in the region.
Sub-Saharan Africa’s infrastructure development faces major geographic and physical challenges, reflecting its low population density, low urbanization, and large number of landlocked countries. A sizable number of small countries makes it difficult for firms to exploit economies of scale. As a result, Sub-Saharan Africa’s infrastructure services are more expensive than in other regions, suggesting that greater gains could be achieved through deeper forms of regional integration.
Four key areas of policy priorities to address investment needs and ensure sustainable financing are the following:
• Sustaining public investments. Domestic resources— tax and nontax revenue—are likely to remain the dominant source of financing for infrastructure. Increasing domestic revenue may provide the most sustainable way of financing infrastructure investment. This will require improving tax collection as well as cost recovery. In many countries, debt levels are still
BOX 2.6.1 Recent investment slowdown: Sub-Saharan Africa (continued)
manageable, and borrowing to increase spending on infrastructure remains a viable option. However, debt sustainability should not be compromised.
• Encouraging greater private sector participation in infrastructure. Countries need to strengthen the pipeline of bankable projects that can meet the financial objectives of private investors. Innovative fund and deal structures, such as guarantees and risk sharing, should be developed. Blended finance instruments that can leverage private sector development financing should be promoted. Public-private partnerships (PPPs) are a tested strategy that can be applied to numerous sectors (IFC 2016). However, governments have to establish autonomous regulatory agencies to oversee the private agents. The terms of the partnerships have to be monitored carefully to ensure PPPs deliver a normal return and not a monopoly profit.
• Strengthening public investment management systems. An effective public financial management capacity is critical in scaling up infrastructure investment spending. Countries should seek to strengthen capacity for project selection and appraisal, and enhance monitoring of project execution to minimize leakages. Operation and maintenance expenditures for existing infrastructure should be fully integrated in a medium-term expenditure framework to ensure that they receive adequate budgetary resources.
• Promoting regional integration of infrastructure. A regional approach to the provision of infrastructure services is needed to overcome the region’s geographic and physical challenges. This will require effective regional institutions, setting priorities for regional investments, harmonizing regulatory frameworks and administrative procedures, and facilitating cross-border infrastructure (Kessides and Benjamin 2012).

CHAPTER 2 GLOBAL ECONOMIC PROSPECTS | JANUARY 2017 180
References
Abeberese, A. 2016. “Electricity Cost and Firm Performance: Evidence from India.” Review of Economics and Statistics (forthcoming).
Abino, D. J., R. A. Adrias, J. J. Damot and Z. M. Virtucio. 2014. “Philippine Financial System Macrofinancial Vulnerabilities: Assessing and Forecasting Systemic Risk using LOGIT and VAR.” Research Paper presented at the DLSU Research Congress 2014. `De La Salle University, Manila, Philippines.
ADB (Asia Development Bank). 2009. Infrastructure for a Seamless Asia. Manila, Philippines: Asia Development Bank.
________. 2012. Infrastructure for Supporting Inclusive Growth and Poverty Reduction in Asia. Manila, Philippines: Asia Development Bank.
________. 2016. “Central Asian Countries Identify $94 Billion Energy Investment Needs to 2023.” News Release October 24, 2016. Manila: Asian Development Bank.
Alfaro, L., and A. Chari. 2014. “Deregulation, Misallocation, and Size: Evidence from India.” Journal of Law and Economics 57 (4): 897-936.
Ali, A., 2009. “Effects of Corruption on FDI Inflows.” Cato Journal 29 (2), Spring/Summer.
Allard, C., J. I. C. Kriljenko, W. Chen, J. Gonzalez-Garcia, E. Kitsios, and J. Trevino. 2016. “Trade Integration and Global Value Chains in Sub-Saharan Africa: In Pursuit of the Mission Link.” IMF African Department. International Monetary Fund, Washington, DC.
Anadon, D. L., and K. Surana. 2015. “Public Policy and Financial Resource Mobilization for Wind Energy in Developing Countries: A Comparison of Approaches and Outcomes in China and India.” Global Environmental Change 35: 340–359.
Anand, R., and V. Volodymyr. 2014. “Disentangling India’s Investment Slowdown.”
IMF Working Paper 14/47, International Monetary Fund, Washington, DC.
Anbumozhi, V., and P. S. Intal. 2015. “Can Thinking Green and Sustainability Be an Economic Opportunity for ASEAN?” Economic Research Institute for ASEAN and East Asia (ERIA).
Andres, L., D. Biller, and M. H. Dappe. 2014. “Infrastructure Gap in South Asia.” Policy Research Working Paper Series 7032, World Bank, Washington, DC.
Arslanalp S., and T. Tsuda, 2014, “Tracking Global Demand for Emerging Market Sovereign Debt,” IMF Working Paper No. 14/39, International Monetary Fund, Washington, DC.
Arslanalp S., W. Liao, S. Piao, and D. Seneviratne. 2016. “China’s Growing Influence on Asian Financial Markets.” IMF Working Paper No. 16/173, International Monetary Fund, Washington, DC.
Arteta, C., M. A. Kose, F. Ohnsorge, and M. Strocker. 2015. “The Coming U.S. Interest Rate Tightening Cycle: Smooth Sailing or Stormy Waters?” Policy Research Note 15/02, World Bank, Washington, DC.
Aturupane, H., Y. Savchenko, M. Shojo, and K. Larsen. 2014. “Sri Lanka: Investment in Human Capital. South Asia.” Human Development Sector Discussion Paper Series 69, World Bank, Washington, DC.
Bank for International Settlements. 2016. International Banking and Financial Market Developments. BIS Quarterly Review (September 2016), Bank for International Settlements, Basel, Switzerland.
Baker, S., N. Bloom, and S. Davis. 2015. “Measuring Economic Policy Uncertainty.” NBER Working Paper 21633, National Bureau of Economic Research, Cambridge, MA.
Behar, A., and A. Fouejieu. 2016. “External Adjustment in Oil Exporters: The Role of Fiscal Policy and the Exchange Rate.” IMF Working

CHAPTER 2 GLOBAL ECONOMIC PROSPECTS | JANUARY 2017 181
Paper 16/107, International Monetary Fund, Washington, DC.
Benno, F., and A. Ramayandi. 2015. “Public Debt Sustainability in Developing Asia: An Update.” ADB Economics Working Paper Series 468, Asia Development Bank, Manila, Philippines.
Bhattacharya, A., M. Romani, and N. Stern. 2012. “Infrastructure for Development: Meeting the Challenge.” London, United Kingdom: Centre for Climate Change Economics and Policy.
Bhattacharyay, B. N. 2012, “Estimating demand for infrastructure 2010-2020,” In Infrastructure for Asian Connectivity, edited by B. N. Bhattacharyay, M. Kawai, and R. Nag. Asia Development Bank Institute and Asia Development Bank: Edward Elgar.
Bleaney, M., and Halland, H., 2016. “Do resource-rich countries suffer from a lack of fiscal discipline?” World Bank Policy Research Working Paper 7552, World Bank, Washington, DC.
Bloom, D., M. Kuhn, and K. Prettner. 2016. “Africa’s Prospects for Enjoying a Demographic Dividend.” VOX, CEPR’s Policy Portal. Octo- ber 2016.
Bloom, D. E., and L. Rosenberg. 2011. “The Future of South Asia: Population Dynamics, Economic Prospects and Regional Coherence.” Program on the Global Demography of Aging Working Paper Series 68, Cambridge, Massachusetts.
BMI (Business Monitor International a Fitch Group Company) Research. 2016. “Asia Infrastructure: Reforms Essential to Unlock Growth.” Regional Overview (October issue).
Borin, A., and E. Di Stefano. 2016. “Economic Reforms in China and India: Past and Future Challenges.” Occasional Papers Series 337, Bank of Italy, Milan.
Bryson, J. H., and E. Nelson. 2016. “Does China Face a Japanese-Like “Lost Decade”? Special Commentary. Wells Fargo.
Burke, P. J., and R. C. Paudel. 2015. “Exchange Rate Policy and Export Performance in a Landlocked Developing Country: The Case of Nepal.” Journal of Asian Economics, 38 (June): 55–63.
Cabral, R., F. G. Carneiro, and A. V. Mollick. 2016. “Inflation Targeting and Exchange Rate Volatility in Emerging Markets.” Policy Research Working Paper 7712, World Bank, Washington, DC.
Caggiano, G., and P. Calice. 2016. “Bank Competition, Financial Dependence, and Economic Growth in the Gulf Cooperation Council.” Policy Research Working Paper 7687, World Bank, Washington, DC.
Calderon C., and S. Boreux. 2016. “Ctius, Altius, Fortius: Is Growth in Sub-Saharan Africa More Resilient?” Journal of African Economies 24 (4): 502-528
Calderón, C., and L. Servén. 2003. “The Output Cost of Latin America’s Infrastructure Gap.” In: W. Easterly and L. Servén, editors. The Limits of Stabilization: Infrastructure, Public Deficits and Growth in Latin America. Stanford, United States: Stanford University Press.
________. 2008. “Infrastructure and Economic Development in Sub-Saharan Africa.” Policy Research Working Paper No. 4712. World Bank: Washington, DC.
Calderon, C., E. Moral-Benito, and L. Servén. 2011. “Is Infrastructure Capital Productive? A Dynamic Heterogeneous Approach.” Policy Research Working Paper 5682, World Bank, Washington, DC.
Catao, L., and M. Terrones. 2016. “Financial De-Dollarization: A Global Perspective and the Peruvian Experience.” IMF Working Paper 16/97, International Monetary Fund, Washington, DC.
Cavalcanti, T., K. Mohaddes, and R. Mehdi, 2015. "Commodity Price Volatility and the Sources of Growth." Journal of Applied Econometrics 30 (6): 857-873.

CHAPTER 2 GLOBAL ECONOMIC PROSPECTS | JANUARY 2017 182
Celasun, O., F. Grigoli, K. Honjo, J. Kapsoli, A. Klemm, B. Lissovolik, J. Luksic, et al. 2015. “Fiscal Policy in Latin America: Lessons and Legacies of the Global Financial Crisis.” Staff Discussion Note 15/06, International Monetary Fund, Washington, DC.
Central Asia Regional Economic Cooperation. 2016 “CAREC: Study for Power Sector Financing Road Map Mobilizing Financing for Priority Projects.” http://www.carecprogram.org/uploads/events/2016/19-Energy-Investment-Forum/Summary-Presentations/CAERC_TA8727_RegionalSummary.pdf.
Cerra, V., A. Cuevas, C. Goes, I. Karpowicz, T. Matheson, I. Samake, and S. Vtyurinaet. 2016. “Highways to Heaven: Infrastructure Determinants and Trends in Latin America and the Caribbean.” IMF Working Paper 16/185, International Monetary Fund, Washington, DC.
Cherif, R., F. Hasanov. And M. Zhu. 2016. Breaking the Oil Spell: The Gulf Falcons’ Path to Diversification. Washington, DC: International Monetary Fund.
Chinoy, S., P. Kumar, and P. Mishra. 2016. “What is Responsible for India’s Sharp Disinflation?” IMF Working Paper 16/166, International Monetary Fund, Washington, DC.
Chow, J. T. S. 2015. “Stress Testing Corporate Balance Sheets in Emerging Economies.” IMF Working Paper 15/216, International Monetary Fund, Washington, DC.
Claessens, S. 2015. “An Overview of Macroprudential Policy Tools.” Annual Review of Financial Economics 7.1: 397-422.
Clark, J., N. Converse, B. Coulibaly, and S. Kamin. 2016. “Emerging Market Capital Flows and U.S. Monetary Policy.” Board of Governors of the Federal Reserve System, International Finance Discussion Paper Note, October.
Coppola, A., A. Lagerborg, and Z. Mustafaoglu. 2016 “Estimating an Equilibrium Exchange Rate for the Argentine Peso.” Policy Research Working Paper 7682, World Bank, Washington, DC.
Corral, L., M. Schling, C. Rogers, J. Cumberbatch, F. Hinds, N. Zhou, and M. Lemay. 2016. “The Impact of Coastal Infrastructure Improvements on Economic Growth: Evidence from Barbados.” IDB Working Paper Series No. IDB-WP-729, Inter-American Development Bank, Washington, DC.
Creehan, S. 2015. “Why We Shouldn’t Invoke Japan’s “Lost Decade” as China’s Future.” Pacific Exchange Blog October 8, 2015. Federal Reserve Bank of San Francisco.
Dabla-Norris, E., G. Ho, and A. Kyobe. 2016. “Structural Reforms and Productivity Growth in Emerging Market and Developing Economies.” IMF Working Paper 07/201, International Monetary Fund, Washington, DC.
Dabla-Norris, E., J. Brumby, A. Kyobe, Z. Mills, and C. Papageorgiou. 2012. “Investing in Public Investment: An Index of Public Investment Efficiency.” Journal of Economic Growth 17 (3): 235–66.
Dash, P. K., G. Nafaraj and P. Sahoo. 2014. Foreign Direct Investment in South Asia: Policy, Impact, Determinants and Challenges. New Delhi: Springer.
Davis, J. S. 2015. “External Debt Sheds Light on Drivers of Exchange Rate Fluctuations.” Economic Letter 10 (4), Federal Reserve Bank of Dallas.
De Janvry, A., and E. Sadoulet. 2012. “Why Agriculture Remains the Key to Sub-Saharan African Development.” In The Oxford Companion to the Economics of Africa, edited by E. Aryeetey, S. Devarajan, R. Kanbur, and L. Kasekende. Oxford, U.K.: Oxford University Press.
De la Torre, A., T. Didier, and M. Pinat. 2014. “Can Latin America Tap the Globalization Upside?” Policy Research Working Paper 6837, World Bank, Washington, DC.
De, S., E. Islamaj, M. A. Kose, and S.R. Yousefi. 2016. “Remittances over the Business Cycle: Theory and Evidence?” Working Paper No.

CHAPTER 2 GLOBAL ECONOMIC PROSPECTS | JANUARY 2017 183
Transformation for Prosperity and Livability. Washington, DC: World Bank.
Engel, E., R. Fischer, and A. Galetovic. 2011. “Public-Private Partnerships to Revamp U.S. Infrastructure.” Brookings Institution, Washington, DC. https://www.brookings.edu/research/public-private-partnerships-to-revamp-u-s-infrastructure/.
ESCAP 2015. Economic and Social Survey of Asia and the Pacific 2015. United Nations Economic and Social Commission for Asia and the Pacific.
Estache, A., and G. Garsous. 2012. “The Impact of Infrastructure on Growth in Developing Countries.” IFC Economics Notes Note 1, World Bank, Washington, DC.
Estache, A., E. Ianchovichina, R. Bacon, and I. Salamon. 2013. Infrastructure and Employment Creation in the Middle East and North Africa. Washington, DC: World Bank.
Farole, F., and V. Pathikonda. 2016. “The Capabilities Driving Participation in Global Value Chains.” Policy Research Working Paper Series 7804, World Bank, Washington, DC.
Fay, M., and T. Yepes. 2003. “Investing in Infrastructure: What Is Needed from 2000 to 2010?” Policy Research Working Paper No. 3102. Washington, DC: World Bank.
Fernandez, A., A. Gonzalez, and D. Rodriguez. 2015. “Sharing a Ride on the Commodities Roller Coaster: Common Factors in Business Cycles of Emerging Economies.” Central Bank of Colombia Working Paper 915.
Foreign Affairs. 2013 “Turkey: A Landmark Decade Vision 2023.” Foreign Affairs, September-October 2013.
Foster, V. and C. Briceno-Garmendia. 2010. “Africa’s Infrastructure: A Time for Transformation.” World Bank. Washington, DC.
Frankel, J. 2013. “Exchange Rate and Monetary Policy for Kazakhstan in Light of
13/2016, Centre for Applied Macroeconomic Analysis, Crawford School of Public Policy, Australian National University Australia.
Deutsche Bank. 2016. “Asia Infrastructure Financing.” Current Issues, Emerging Markets, January 8.
Devarajan, S., E. Ianchovichina, and C. Lakatos. 2016. “Lifting Economic Sanctions on Iran: Global Effects and Strategic Responses.” Policy Research Working Paper Series 7549, World Bank, Washington, DC.
Diziolo, A., J. Guajardo, V. Klyuev, R. Mano, and M. Raissi. 2016. “Spillover from China’s Growth Slowdown and Rebalancing to the ASEAN-5.” IMF Working Paper No. 16/170, International Monetary Fund, Washington, DC.
EBRD (European Bank for Reconstruction and Development), EIB (European Investment Bank), and World Bank. 2016. “What’s Holding Back the Private Sector in MENA? Lessons from the Enterprise Survey.” European Bank for Reconstruction and Development, European Investment Bank, and World Bank.
EBRD. 2015a. EBRD Transition Report 2015-16. London: European Bank for Reconstruction and Development.
______. 2015b. Strategy for Turkey. London: European Bank for Reconstruction and Development.
______. 2016. “Responding to Africa’s Energy Needs.” European Investment Bank, Luxembourg.
Eichengreen, B., and P. Gupta. 2013. “The Real Exchange Rate and Export Growth: Are Services Different?” Policy Research Working Paper Series 6629, World Bank, Washington, DC.
EIU (Economist Intelligence Unit). 2016. Latin America: Regional Overview. September. London: Economist Intelligence Unit.
Ellis, P., and M. Roberts. 2016. Leveraging Urbanization in South Asia: Managing Spatial

CHAPTER 2 GLOBAL ECONOMIC PROSPECTS | JANUARY 2017 184
Resource Exports.” Harvard Kennedy School, Cambridge, MA.
Garcia-Escribano, M., C. Gees, and I. Karpowicz. 2015. “Filling the Gap: Infrastructure Investment in Brazil.” IMF Working Paper 15/180, International Monetary Fund, Washington, DC.
Gertler, M., and P. Karadi. 2015. “Monetary Policy Surprises, Credit Costs, and Economic Activity.” American Economic Journal: Macroeconomics 7(1): 44-76.
Gill, I., I. Izvorski, W. van Eeghen, and D. De Rosa. 2014. “Diversified Development: Making the Most of Natural Resources in Eurasia.” World Bank, Washington, DC.
Gobat, J., and K. Kostial. 2016. “Syria’s Conflict Economy.” IMF Working Paper 16/123, International Monetary Fund, Washington, DC.
Gutman J., A. Sy, and S. Chattopadhyay. 2015. “Financing African Infrastructure; Can the World Deliver?” in Global Economy and Development at Brookings. Brookings Institution, Washing- ton, DC.
Hencekl, T., and W. McKibbin. 2010. “The Economics of Infrastructure in a Globalized World: Issues, Lessons and Future Challenges.” The Brookings Institution, Washington, DC.
Horton, M. A., H. Samiei, N. P. Epstein, and K. Ross. 2016. “Exchange Rate Developments and Policies in the Caucasus and Central Asia.” Middle East and Central Asia Departmental Paper No. 16/2. International Monetary Fund, Washington, DC.
IADB (Inter-American Development Bank). 2010. “Urbanization in Latin America and the Caribbean: Trends and Challenges.” Inter-American Development Bank, Washington, DC.
______. 2016. Time to Act: Latin America and the Caribbean Facing Strong Challenges. Washington, DC: Inter-American Development Bank.
Ianchovichina, E., A. Estache, R. Foucart, G. Garsous, and T. Yepes. 2013. “Job Creation
through Infrastructure Investment in the Middle East and North Africa.” World Development 45 (May): 209–22.
IMF (International Monetary Fund). 2014a. “Regional Economic Outlook: Middle East, North Africa, Afghanistan, and Pakistan.” International Monetary Fund, Washington, DC.
______. 2014b. “Regional Economic Outlook: Sub-Saharan Africa, Staying the Course.” October 2014. International Monetary Fund, Washington, DC.
______. 2015a. Global Financial Stability Report: Vulnerabilities, Legacies, and Policy Challenges: Risks Rotating to Emerging Markets. Washington, DC: International Monetary Fund.
______. 2015b. World Economic Outlook: Adjusting to Lower Commodity Prices. October. Washington, DC: International Monetary Fund.
______. 2015c. “Private Sector Deleveraging and Growth Following Busts.” IMF Working Paper 15/35, International Monetary Fund, Washington, DC.
______. 2015d. “Kazakhstan: Staff Concluding Statement of an IMF Staff Visit.” Mission Concluding Statement, November 25.
______. 2015e. “Recent Investment Weakness in Latin America: Is There a Puzzle?” in Western Hemisphere Regional Economic Outlook: Northern Spring, Southern Chills. Washington, DC: International Monetary Fund.
______. 2016a. “Asia: Maintaining Robust Growth amid Heightened Uncertainty.” Regional Economic Outlook Update series, International Monetary Fund, Washington, DC.
______. 2016b. “China’s Growing Influence on Asian Financial Markets.” IMF Working Paper 16/173, International Monetary Fund, Washington, DC.
______. 2016c. China, Staff Report for the 2016 Article IV Consultation. International Monetary Fund, Washington, DC.

CHAPTER 2 GLOBAL ECONOMIC PROSPECTS | JANUARY 2017 185
Manama, Bahrain, International Monetary Fund, Washington, DC.
______. 2016p. “Regional Economic Outlook: Middle East, North Africa, Afghanistan, and Pakistan.” International Monetary Fund, Washington, DC.
______. 2016q. Sri Lanka: Staff Report for the 2016 Article IV Consultation. Washington, DC: International Monetary Fund.
______. 2016r. Regional Economic Outlook: Sub-Saharan Africa – Multispeed Growth. Washington, DC: International Monetary Fund.
Inderst, G. 2016. “Infrastructure Investment, Private Finance, and Institutional Investors: Asia from a Global Perspective.” Asian Development Bank Institute. Working Paper Series No. 555. Tokyo.
International Energy Agency. 2014. Special Report World Energy Investment Outlook. Paris: International Energy Agency.
International Finance Corporation. 2016. “Transforming African Development: Partnerships and Risk Mitigation to Mobilize Private Investment on a New Scale.” IFC, World Bank, Washington, DC.
Jesintha, P., and M. Sathanapriya. 2011. “Public Private Partnership in India.” Journal of Management and Science, 1 (1): 61-68.
Jin, H., and I. Rial. 2016. “Regulating Local Government Financing Vehicles and Public-Private Partnerships in China.” IMF Working Paper 16/187, International Monetary Fund, Washington, DC.
Kessides, I., and N. Benjamin. 2012. “Regionalizing Infrastructure for Deepening Market Integration: the Case of East Africa.” Policy Research Working Paper No. 6113, World Bank; Washington, DC.
Khandelwal, P., K. Miyajima, and A. Santos. 2016. “The Impact of Oil Prices on the Banking System in the GCC.” IMF Working
______. 2016d. ASEAN-5 Cluster Report—Evolution of Monetary Policy Frameworks. International Monetary Fund, Washington, DC.
______. 2016e. Philippines, Staff Report for the 2016 Article IV Consultation. International Monetary Fund, Washington, DC.
______. 2016f. Thailand Selected Issues. International Monetary Fund, Washington, DC.
______. 2016g. Vietnam, Staff Report for the 2016 Article IV Consultation. International Monetary Fund, Washington, DC.
______. 2016h. “Russian Federation: Staff Report for the 2016 Article IV Consultation” Country Report 16/229, International Monetary Fund, Washington, DC.
______. 2016i. AREAER Online, International Monetary Fund, Washington, DC.
______. 2016j. “Ukraine: Second Review Under the Extended Fund Facility and Requests for Waivers of Non-Observance of Performance Criteria, Rephasing of Access and Financing Assurances Review.” Country Report 16/319, International Monetary Fund, Washington, DC.
______. 2016k. “Hungary: Staff Report for the 2016 Article IV Consultation.” Country Report No. 16/107, International Monetary Fund, Washington, DC.
______. 2016l. “Latin America and the Caribbean: Are Chills Here to Stay?” Regional Economic Update. October. International Monetary Fund, Washington, DC.
______. 2016m. “Iran: Concluding Statement of an IMF Staff Visit.” International Monetary Fund, Washington, DC.
______. 2016n. “Jordan: Request for an Extended Arrangement under the Extended Fund Facility—Staff Report.” International Monetary Fund, Washington, DC.
______. 2016o. “Economic Diversification in Oil-Exporting Arab Countries.” Report prepared for Annual Meeting of Arab Ministers of Finance in

CHAPTER 2 GLOBAL ECONOMIC PROSPECTS | JANUARY 2017 186
Economic Development in South Asia. Washington, DC: World Bank.
Lopez-Acevedo, G., D. Medvedev, and V. Palmade. 2016. South Asia’s Turn: Policies to Boost Competitiveness and Create the Next Export Powerhouse. Conference Edition. Washington, DC: World Bank.
Ly, S. 2016. “Improving Macroeconomic and Financial Resilience.” Cambodia Economic Update. World Bank.
Maitra, P., S. Mitra, D. Mookherjee, A. Motta, and S. Visaria .2016. "Financing Smallholder Agriculture: An Experiment With Agent-Intermediated Microloans in India" Center For Economic Research Discussion Paper No. DP11549, London, United Kingdom.
Man, R. 2013. “Bridging the Gap.” HSBC Global Research Macro Economics – Asia.
McKinsey Global Institute. 2011. “Powering India: The Road to 2017.” McKinsey Global Institute.
______. 2013. Infrastructure Productivity: How to Save $1 Trillion a Year. McKinsey Global Institute.
______. 2014. Southeast Asia at the Crossroads: Three Paths to Prosperity. McKinsey Global Institute.
______. 2016. “Lions On the Move II: Realizing the Potential of Africa’s Economies.” McKinsey & Company. September.
Mishra, P., P. Montiel, and R. Sengupta. 2016. “Monetary Transmission in Developing Countries: Evidence from India.” IMF Working Paper 16/167, International Monetary Fund, Washington, DC.
Miyajima, K. 2016. “An Empirical Investigation of Oil-Macro-Financial Linkages in Saudi Arabia.” IMF Working Paper 16/22, International Monetary Fund, Washington, DC.
Mollick, A.V., R. Cabral, and F. G. Carneiro. 2011. “Does Inflation Targeting Matter for
Paper 16/161, International Monetary Fund, Washington, DC.
Kirkpatrick C., D. Parker and Y. Zhang. 2006. “Foreign Investment in Infrastructure in Developing Countries: Does Regulation Make a Difference?” Transnational Corporations 15 (1): 143–172.
Kohli, H. A., and P. Basil. 2010. “Requirements for Infrastructure Investment in Latin America under Alternate Growth Scenarios: 2011–2040.” Global Journal of Emerging Market Economies 3 (1): 59–110.
Kovtun, D., A.M. Cirkel, M. Z. Murgasova, D. Smith, and S. Tambunlertchai. 2014 “Boosting Job Growth in the Western Balkans” In Jobs and Growth, edited by Schindler, M., M. Berger, M. Bakker, and M. Spilimbergo. Washington, DC: International Monetary Fund.
KPMG. 2011. “KPMG’s Bribery and Corruption Survey: Impact on Economy and Business Environment.”
Lardy, N. R., and Z. Huang. 2016. “China Private Investment Softens, But Not as Much as Official Data Suggest.” China Economic Watch. Peterson Institute for International Economics.
Le Borgne, E., and T. Jacobs. 2016. “Lebanon: Promoting Poverty Reduction and Shared Prosperity.” Systematic Country Diagnostic, World Bank, Washington, DC.
Lee, K., and T. Pang. 2015. “Asia and the Pacific: Health Policy Challenges of a Region in Transition.” Asia & the Pacific Policy Studies 2 (2): 211–213.
Leutert, W. 2016. “Challenges Ahead in China’s Reform of State-Owned Enterprises.” Asian Policy 21: 83-99.
Loayza, N. V. 2016. “Informality in the Process of Development and Growth.” Policy Research Working Paper Series 7858, World Bank, Washington, DC.
Lopez-Acevedo, G., and R. Robertson, eds. 2016. Stitches to Riches? Apparel Employment, Trade, and

CHAPTER 2 GLOBAL ECONOMIC PROSPECTS | JANUARY 2017 187
Output Growth? Evidence from Industrial and Emerging Economies.” Journal of Policy Modeling 33(4): 537-551.
Montgomery, H. K. Hariyama, and Y. Takahashi. 2014. “Too Big to Succeed? Banking Sector Consolidation and Efficiency.” Journal of International Financial Markets, Institutions and Money 32: 86-106.
Nataraj, G. 2007. “Infrastructure Challenges in South Asia: The Role of Public-Private Partnerships.” Asia Development Bank Institute Discussion Paper 80, Asia Development Bank Institute, Tokyo.
OECD (Organisation for Economic Co-operation and Development). 2014. Education at a Glance 2014. OECD Publishing.
______. 2016. “Youth in the MENA Region: How to Bring Them in.” Paris, OECD.
Pachouri, A., and S. Sharma. 2016. “Barriers to Innovation in Indian Small and Medium-Sized Enterprises.” ADB Economics Working Paper Series 588, Asia Development Bank, Manila, Philippines.
Papageorgiou, C. and Spatafora, N., 2012. “Economic Diversification in LICs: Stylized Facts and Macroeconomic Implications” International Monetary Fund Working Paper 12/13, International Monetary Fund, Washington, DC.
Patra, M. D., S. Pattanaik, J. John, and H. K. Behera. 2016. “Global Spillovers and Monetary Policy Transmission in India.” WPS (DEPR) 03/2016. Reserve Bank of India.
Perrotti, D., and R. J. Sánchez. 2011. “La brecha de infraestructura en América Latina y el Caribe.” Serie Recursos Naturales e Infraestructura no. 153. Santiago, Chile: Economic Commission for Latin America and the Caribbean (ECLAC).
Republic of Turkey Ministry of Energy and Natural Resources. 2014. National Renewable Energy Action Plan for Turkey.
Romer, P. 2016. “To End Poverty, Give Everyone the Chance to Learn.” Speech at the End Poverty Day Event, Dhaka, Bangladesh, October 17.
Rother, B., G. Pierre, D. Lombardo, R. Herrala, P. Toffano, E. Roos, A. G. Auclair, and K. Manasseh. 2016. “The Economic Impact of Conflicts and the Refugee Crisis in the Middle East and North Africa.” Staff Discussion Note 16/08, International Monetary Fund, Washington, DC.
Russian Investment Agency. 2015. “We Need Investment.” http://investment-in-russia.com/site/en?view=WE-NEED-INVESTMENT.
Samarina, A., M. Terpstra, and J. De Haan. 2014. “Inflation Targeting and Inflation Performance: A Comparative Analysis.” Applied Economics 46(1): 41-56.
Shirke, S.V., and A. Srija. 2014. “An Analysis of the Informal Labor Market in India.” Economy Matters, Confederation of Indian Industry, October.
Siddhartha, S. 2015. “Make In India: How Does ‘Make in India’ Affect the Indian Economy?” https://www.quora.com/Make-In-India-How-does-Make-in-India-affect-the-Indian-Economy.
Sommer, M., A. Auclair, A. Fouejieu, I. Lukonga, S. Quayyum, A. Sadeghi, G. Shbaikat, A. Tiffin, and B. Versailles . 2016. “Learning to Live with Cheaper Oil: Policy Adjustment in Oil-Exporting Countries of the Middle East and Central Asia.” Middle East and Central Asia Departmental Paper Series, International Monetary Fund, Washington, DC.
Sondergaard, L. M., Murthi, M., Abu-Ghaida, C. B. and Rutkowski, J., 2012. “Skills, Not Just Diplomas: Managing for Results in Education Systems in Eastern Europe and Central Asia.” Washington, DC: World Bank.
Sophastienphong, K., Y. Mu, C. Saporito. 2008. “South Asian Bond Markets: Developing Long-Term Finance for Growth.” Policy Research Paper 45497, World Bank, Washington, DC.

CHAPTER 2 GLOBAL ECONOMIC PROSPECTS | JANUARY 2017 188
Svensson, L. E. 2010. “Inflation Targeting.” NBER Working Paper Series 16654. National Bureau of Economic Research, Cambridge, MA.
Tewari, S. 2015. “75 Percent of Rural India Survives on Rs 33 per Day.” India Today. http://indiatoday.intoday.in/story/india-rural-household-650-millions-live-on-rs-33-per-day/1/451076.html.
Tokuoka, K. 2012. “Does the Business Environment Affect Corporate Investment in India?” IMF Working Paper 12/70, International Monetary Fund, Washington, DC.
UNCTAD (United Nations Conference on Trade and Development). 2016. “Investor Nationality: Policy Challenges.” World Investment Report 2016. Geneva, Switzerland.
UNESCO (United Nations Educational, Scientific and Cultural Organization). 2014. Higher Education in Asia: Expanding Out, Expanding Up. Montreal: UNESCO Institute for Statistics.
______. 2015. “Regional Overview: Central and Eastern Europe and Central Asia.” In EFA Global Monitoring Report 2015 Education for All 2000-2015. Paris, France: United Nations Educational, Scientific, and Cultural Organization.
Uttama, N. P. 2016. “Spatial Estimation of the Nexus between the PRC’s Foreign Direct Investment and ASEAN’s Growth.” ADBI Working Paper 597, Asian Development Bank Institute, Tokyo.
Verne, P. 2016. “Subsidy Reforms in the Middle East and North Africa Region: A Review.” Policy Research Working Paper 7754, World Bank, Washington, DC.
Winrow, G. 2015. “Realization of Turkey’s Energy Aspirations. Pipe Dreams or Real Projects?” Policy Paper. The Brookings Institution, Washington, DC.
World Bank. 2000. Attracting Foreign Direct Investment in Infrastructure: Why is it so Difficult? Washington, DC: World Bank.
______. 2006. India: Building Capacity for Public-Private Partnerships. Washington, DC: World Bank.
______. 2008. The Road Not Traveled: Education Reform in the Middle East and Africa. Washington, DC: World Bank.
______. 2010. Global Economic Prospects 2010: Crisis, Finance, and Growth. Washington, DC: World Bank.
______. 2011. Learning for All: Investing in People’s Knowledge and Skills to Promote Development. Washington, DC: World Bank.
______. 2013a. China 2030: Building a Modern, Harmonious, and Creative Society. Washington, DC: World Bank.
______. 2013b. The Africa Competitiveness Report 2013. Washington, DC: World Bank.
______. 2014a. “Enhancing Competitiveness in an Uncertain World.” East Asia and Pacific Economic Update. October issue. World Bank, Washington, DC.
______. 2014b. “Back to Work. Growing with Jobs in Europe and Central Asia.” Europe and Central Asia Report Series, World Bank, Washington, DC.
______. 2015a. “East Asia's Changing Urban Landscape: Measuring a Decade of Spatial Growth.” World Bank, Washington, DC.
______. 2015b. “Adjusting to a Changing World.” East Asia and Pacific Economic Update. April issue. World Bank, Washington, DC.
______. 2015c. Global Monitoring Report 2015/16: Development Goals in an Era of Demographic Change. Washington, DC: World Bank.
______. 2015d. “Low Commodity Prices and Weak Currencies.” ECA Economic Update (October issues). World Bank, Washington, DC.
______. 2015e. “Azerbaijan Systematic Country Diagnostic.” World Bank, Washington, DC.

CHAPTER 2 GLOBAL ECONOMIC PROSPECTS | JANUARY 2017 189
_____. 2015f. “Rebalancing Bosnia and Herzegovina: A Systematic Country Diagnostic.” World Bank, Washington, DC.
_____. 2015g. “Bulgaria’s Potential for Sustainable Growth and Shared Prosperity; Systemic Country Diagnostic.” World Bank, Washington, DC.
_____. 2015h. “Serbia Systematic Country Diagnostic.” World Bank, Washington, DC.
_____. 2015i. “Bolivia Systematic Country Diagnostic: Rebalancing Inclusive Growth to Deepen Gains on Poverty and Inequality Reduction.” World Bank, Washington, DC.
_____. 2015j. “Colombia Systematic Country Diagnostic.” World Bank, Washington, DC.
_____. 2015k. “Costa Rica’s Development: From Good to Better. Systematic Country Diagnostic.” World Bank, Washington, DC.
_____. 2015l.“El Salvador: Building on Strengths for a New Generation; Systematic Country Diagnostic.” World Bank, Washington, DC.
_____. 2015m. “Guatemala: Closing Gaps to Generate More Inclusive Growth; Systematic Country Diagnostic.” World Bank, Washington, DC.
_____. 2015n. “Haiti: Toward a New Narrative; Systematic Country Diagnostic.” World Bank, Washington, DC.
_____. 2015o. “Honduras: Unlocking Economic Potential for Greater Opportunities.” Systematic Country Diagnostic. World Bank, Washington, DC.
_____. 2015p. “Panama: Locking in Success.” Systematic Country Diagnostic, World Bank, Washington, DC.
_____. 2015q. “Uruguay: Systematic Country Diagnostic.” World Bank, Washington, DC.
_____. 2015r. “Egypt: Promoting Poverty Reduction and Shared Prosperity. A Systematic
Country Diagnostic.” World Bank, Washing- ton, DC.
______. 2015s. Global Economic Prospects: Having Fiscal Space and Using It. Washington, DC: World Bank.
______. 2015t. “Bangladesh: More and Better Jobs to Accelerate Shared Growth and End Extreme Poverty; A Systematic Country Diagnostic. World Bank, Washington, DC.
______. 2015u. “Africa’s Pulse.” Volume 12, October 2015. World Bank, Washington, DC.
______. 2016a. Global Economic Prospects: Divergences and Risks. Washington, DC: World Bank.
______. 2016b. “Reducing Vulnerabilities.” East Asia and Pacific Economic Update. (October issue). World Bank, Washington, DC.
______. 2016c. “Resilience through Reforms.” Indonesia Economic Quarterly (June). World Bank, Washington, DC.
______. 2016d. “Leveraging Trade Agreements.” Malaysia Economic Monitor (June). World Bank, Washington, DC.
______. 2016e. Global Economic Prospects: Spillovers amid Weak Growth. Washington, DC: World Bank.
______. 2016f. “Live Long and Prosper: Aging in East Asia and Pacific.” World Bank East Asia and Pacific Regional Report, World Bank, Washington, DC.
______. 2016g. “The Russian Economy Inches Forward: Will that Suffice to Turn the Tide?” Russia Economic Report No. 36, World Bank, Washington, DC.
______. 2016h. “Moldova: Paths to Sustained Prosperity; A Systematic Country Diagnostic.” World Bank, Washington, DC.
______. 2016i. The Big Switch in Latin America: Restoring Growth through Trade. Washington, DC: World Bank.

CHAPTER 2 GLOBAL ECONOMIC PROSPECTS | JANUARY 2017 190
_____. 2016j. Poverty and Shared Prosperity 2016: Taking on Inequality. Washington, DC: World Bank.
_____. 2016k. “Retaking the Path to Inclusion, Growth and Sustainability; Brazil Systematic Country Diagnostic.” World Bank, Washington, DC.
_____. 2016l. The Commodity Cycle in Latin America: Mirages and Dilemmas. Washington, DC: World Bank.
_____. 2016m. “Belize: Systematic Country Diagnostic.” World Bank, Washington, DC.
_____. 2016n. “The Economic Effects of War and Peace.” MENA Quarterly Brief 6, World Bank, Washington, DC.
_____. 2016o. “MENA Economic Monitor: Economic and Social Inclusion to Prevent Violent Extremism.” Working Paper 108525, World Bank, Washington, DC.
_____. 2016p. Doing Business 2016: Measuring Regulatory Quality and Efficiency. Washington, DC: World Bank.
_____. 2016q. “Bangladesh Development Update: Sustainable Development Progress.” World Bank, Washington, DC.
_____. 2016r. “Sri Lanka Development Update.” Fall. World Bank, Washington, DC.
World Bank. 2016s. “Program Document for a Proposed Credit in the Amount of US$100 Million to Democratic Socialist Republic of Sri Lanka for the Competitiveness, Transparency and Fiscal Sustainability Development Policy Financing.” Report No. 106719-LK, World Bank, Washington, DC.
_____. 2016t. “Commodity Markets Outlook: OPEC in Historical Context.” October. World Bank, Washington, DC.
_____. 2016u. South Asia Economic Focus: Investment Reality Check. Washington, DC: World Bank.
_____. 2016v. India Development Update: Financing Double-Digit Growth. Washington, DC: World Bank.
_____. 2016w. World Development Indicators. Washington, DC: World Bank.
_____. 2016x. “Sri Lanka Systematic Country Diagnostic: Ending Poverty and Promoting Shared Prosperity.” World Bank, Washington, DC.
_____. 2016y. “Africa’s Pulse.” Volume 14, World Bank, Washington, DC.
_____. 2016z. “Africa Region: Sustaining Growth and Fighting Poverty amid Rising Global Risks.” Regional Update 2016. World Bank, Washington, DC.
_____. 2017. Doing Business 2017: Equal Opportunity for All. Washington DC: World Bank.
World Bank and Development Research Center of the State Council, the People’s Republic of China. 2014. Urban China: Toward Efficient, Inclusive, and Sustainable Urbanization. Washington, DC: World Bank.
World Bank and Ministry of Planning and Investment of Vietnam. 2016. Vietnam 2035: Toward Prosperity, Creativity, Equity, and Democracy. Washington, DC: World Bank.
World Economic Forum. 2015. The Global Competitiveness Report 2015-16. Geneva: World Economic Forum.
_____. 2016. The Global Competitiveness Report 2016-17. Geneva: World Economic Forum.
Zhai, F., and P. Morgan. 2016. “Impact of the People’s Republic of China’s Growth Slowdown on Emerging Asia: A General Equilibrium Analysis.” ADBI Working Paper 560. Asian Development Bank Institute, Tokyo.
Zhang, L. 2016. “Rebalancing in China—Progress and Prospects.” Working Paper 16/183. International Monetary Fund, Washington, DC.

WEAK INVESTMENT IN UNCERTAIN TIMES:
Causes, Implications, and Policy Responses
CHAPTER 3


CHAPTER 3 GLOBAL ECONOMIC PROSPECTS | JANUARY 2017 193
Recent investment weakness in EMDEs has followed the significant slowdown in investment growth in advanced economies (AEs) in the immediate aftermath of the global financial crisis. However, post-crisis investment weakness has different features in EMDEs than in AEs. In AEs, investment contracted sharply during the global financial crisis and, in the Euro Area, during the subsequent debt crisis. Investment in AEs recovered somewhat in 2014-16, but at a slower pace than in recoveries following earlier global downturns. In contrast, in EMDEs, investment continued growing through the global financial crisis and its immediate aftermath, but this expansion has slowed since 2010. World investment growth has also gradually lost steam over the past six years.
The slowdown in investment growth is occurring despite large unmet investment needs in many EMDEs. EMDEs’ infrastructure, education, and health systems are struggling to keep pace with rapid urbanization, economic activity, and changing demands on workforces. Commodity-exporting EMDEs require investment to shift away from natural resource-based sectors toward other engines of growth. Vigorous private investment could give momentum to slowing productivity growth.
More generally, investment is critical to sustaining long-term growth. Capital accumulation raises
Investment growth in emerging market and developing economies (EMDEs) has slowed sharply since 2010. This deceleration has been most pronounced in the largest emerging markets and commodity-exporting EMDEs, but has now spread to the majority of these economies: investment growth is below its long-term average in the most EMDEs over the past quarter century except during serious global downturns. These economies account for more than one-third of global GDP and about three-quarters of the world’s population and the world’s poor. While slowing investment growth is partly a correction from high pre-crisis growth rates in some EMDEs, it also reflects a range of obstacles holding back investment: terms-of-trade shocks (for oil exporters), slowing foreign direct investment inflows (for commodity importers), as well as private debt burdens and political risk (for all EMDEs). Weak investment is a significant challenge for EMDEs in light of their sizable investment needs to make room for expanding economic activity, to accommodate rapid urbanization, and to achieve sustainable development goals. Sluggish investment also sets back future growth prospects by slowing the accumulation of capital and productivity growth. Although policy priorities depend on country circumstances, including the availability of policy space and economic slack, policymakers should be ready to employ the full range of cyclical and structural policies to accelerate investment growth.
Note: This chapter was prepared by M. Ayhan Kose, Franziska Ohnsorge, Lei Sandy Ye, and Ergys Islamaj, with contributions from Jongrim Ha, Raju Huidrom, Csilla Lakatos, Hideaki Matsuoka, Trang Nguyen, Yoki Okawa, Naotaka Sugawara, Congyan Tan, Ekaterine Vashakmadze, and Shu Yu. Mai Anh Bui, Collette Wheeler, Yirou Li, Liwei Liu, and Cristhian Vera Avellan provided research assistance. 1Throughout this chapter, unless otherwise specified, investment refers to real gross fixed capital formation (public and private combined). For the sake of brevity, “investment” is understood to indicate investment levels. Investment growth is measured as the annual percent change in real investment. The long-term average refers to the average of available data for 1990-2008, the pre-crisis average to the average during 2003-08.
Introduction
Investment growth in emerging market and developing economies (EMDEs) has slowed sharply since 2010, declining from 10 percent, on average, in 2010 to 3.4 percent in 2015.1 It has likely decelerated by more than half a percentage point in 2016. Investment growth is now not only well below its pre-crisis average, but also below its long-term average in the highest share of EMDEs in 25 years with the exception of during serious global downturns. EMDEs with below long-term average investment growth account for 35 percent of global GDP and contain 71 percent of the world’s population and 73 percent of the world’s poor. Moreover, expectations for long-term investment growth in EMDEs have been revised down significantly, partly because the slowdown in investment has been highly synchronous and protracted among these economies.

CHAPTER 3 GLOBAL ECONOMIC PROSPECTS | JANUARY 2017 194
prominently in recent policy and academic debates, slowing investment growth in EMDEs has received less attention.2 Yet, EMDEs constituted about 45 percent of world investment and two-thirds of world investment growth during 2010-2015 (Figure 3.1).
This chapter examines the recent weakness in EMDE investment, its underlying drivers, and possible policy responses to revive investment growth. In particular, it addresses the following questions:
• What are the main features of the investment slowdown?
• What is the macroeconomic backdrop to slowing investment growth in EMDEs?
• What are the factors associated with the investment slowdown, including spillovers from weak activity and investment in major economies?
• What are the implications of weak investment growth for long-term growth prospects?
• Which policies can support investment?
The chapter informs the debate on the recent slowdown in investment by making the following contributions:
• EMDE focus and regional perspectives. The chapter focuses on EMDEs, whereas the bulk of the existing literature has focused on AEs. The few existing studies that analyze EMDE investment are either based on pre-crisis data or confine their analysis narrowly to the 2008-09 crisis or simply focus on specific regions.3 The analysis in this chapter is accompanied by an in-depth discussion of regional perspectives
2Post-crisis investment weakness in advanced economies has been explored in Banerjee, Kearns, and Lombardi (2015); IMF (2015a); Leboeuf and Fay (2016); and Ollivaud, Guillmette, and Turner (2016). 3These include Anand and Tulin (2014); Caselli, Pagano, and Schivardi (2003); Qureshi, Diaz-Sanchez, and Varoudakis (2015); Bahal, Raissi, and Tulin (2015); and Cerra et al. (2016). Firm-level studies include Magud and Sosa (2015) and Li, Magud, and Valencia (2015).
FIGURE 3.1 Investment growth slowdown
Investment growth in EMDEs has slowed sharply since the global financial
crisis. In 2015, the share of EMDEs with investment growth below its long-
term average reached its highest level excepting global downturns. Long-
term forecasts suggest continued weakness in investment growth. The
investment growth differential between EMDEs and AEs has narrowed.
B. Share of EMDEs with investment
growth below its long-term average
A. Investment growth
D. Five-year-ahead forecasts of
investment growth C. Catch-up to U.S. per capita income
Sources: Consensus Economics; Haver Analytics; International Monetary Fund; Oxford Economics; World Development Indicators, World Bank. A. Weighted averages. Long-term average starts in 1991 for EMDEs due to lack of earlier data. B. Long-term averages are country-specific and refer to 1990-2008. Latest year is 2015. C. Number of years needed to catch-up with 2015 real per capita GDP level in the United States, assuming average growth rates over each period denoted for each group. D. Each line shows five-year-ahead Consensus Forecasts as of the latest available month in the year denoted. Unweighted averages of 21 EMDEs and 25 advanced economies. World sample includes 46 countries. Last observation is for October 2016. E. The sample includes 100 EMDEs and 34 AEs. Difference between EMDEs’ and AEs’ weighted average investment growth rates. F. Each column shows the period average of the share of global investment contributed by each respective group denoted. The world sample includes 100 EMDEs and 34 AEs.
F. Share of world investment E. Difference between investment
growth in EMDEs and AEs
0
20
40
60
80
1001
99
0
199
2
199
4
199
6
199
8
200
0
200
2
200
4
200
6
200
8
201
0
201
2
201
4
Percent of EMDEs
0
20
40
60
80
100
120
EMDEs EMDEcommodityexporters
EMDEcommodityimporters
1993-20082003-082013-15
Number of years
-15
-10
-5
0
5
10
15
20
19
91
19
93
19
95
19
97
19
99
20
01
20
03
20
05
20
07
20
09
20
11
20
13
20
15
Percentage points
0
10
20
30
40
50
1993-1999 2000-08 2010-15
EMDEs excluding BRICSOther BRICSChina
Percent
0
2
4
6
8
10
20
10
20
11
20
12
20
13
20
14
20
15
20
16
EMDEs AEs WorldPercent
labor productivity, a key driver of the long-term growth of real wages and household incomes, not only by capital-deepening—equipping workers with more capital—but often also by embodying productivity-enhancing technological advances. While feeble investment in AEs has featured
0
4
8
12
20
10
20
11
20
12
20
13
20
14
20
15
20
10
20
11
20
12
20
13
20
14
20
15
20
10
20
11
20
12
20
13
20
14
20
15
EMDEs AEs World
1990-2008 average
2003-08 average
Percent

CHAPTER 3 GLOBAL ECONOMIC PROSPECTS | JANUARY 2017 195
on investment weakness (see Boxes 2.1.1-2.6.1 in Chapter 2).
• Comprehensive set of factors. It estimates the contributions of a comprehensive set of factors associated with weak investment growth. A number of empirical methods are used to zoom in on specific external and domestic factors.
• Long-term implications. It examines the implications of investment weakness in EMDEs for global trade, long-term prospects for growth and catch-up, and it highlights the potential impact on productivity growth.
• Policy implications. In light of its findings and insights from an extensive literature, the chapter provides a wide range of macro- and microeconomic policy recommendations to revive investment growth.
The chapter’s main findings are as follows.
Investment growth slowdown. While broad-based, the investment slump in EMDEs has been most pronounced in the BRICS countries (Brazil, Russia, India, China, and South Africa), commodity-exporting EMDEs, and in regions with a larger number of commodity exporters. China accounted for about one-third of the investment growth slowdown in EMDEs since 2010, and Brazil and Russia together for one-third. Surveys of long-term forecasts suggest that investment weakness is expected to persist.
Factors associated with the slowdown. Whereas investment weakness in AEs mainly reflected anemic output growth, investment weakness in EMDEs has had a range of sources.
• In commodity importers, slowing FDI inflows and spillovers from soft activity in major advanced economies accounted for much of the slowdown in investment growth since 2011.
• In commodity exporters, a sharp deterioration in their terms of trade (for energy exporters), slowing growth in China, and mounting private debt burdens accounted for much of the slowdown in investment growth.
In several EMDEs, political and policy uncertainty has been a key factor associated with investment contractions or slowdowns.
Spillovers. Over the past five years, AE growth has repeatedly fallen short of expectations partly because of crisis legacies. Sub-par growth and growth prospects in AE trading partners and source countries for FDI into EMDEs have slowed EMDE output growth. For every 1 percentage point lower output growth in the United States or Euro Area, EMDE output growth fell 0.8-1.3 percentage points within a year. Perhaps in recognition of prospects for a weaker external environment, EMDE investment growth responded about twice as strongly as EMDE output to declines in U.S. and Euro Area growth.
Sluggish economic activity in major AEs has coincided with a policy-driven slowdown in investment growth in China (Hong et al. 2016). This has contributed to weakening global commodity prices and has weighed on growth in other EMDEs through inter-sectoral input-output links and, indirectly, via output growth spillovers. A 1 percentage point decline in China’s output growth is associated with a decline in output growth within a year of 0.5 percentage point (in commodity importers) to 1.0 percentage point (in commodity exporters). In addition to the overall output growth slowdown in China, a rebalancing of growth away from trade-intensive investment towards less trade-intensive sources of growth has generated adverse spillovers to other EMDEs, especially for commodity exporters.
“Investment-less” credit booms. Investment weakness has been set against the backdrop of exceptionally benign domestic (and global) financing conditions until late 2016. Policy interest rates of AE central banks are at or near record lows and, in several instances, negative (Arteta et al. 2016; World Bank 2016a). Private credit growth in about 30 EMDEs was near or above levels associated with credit booms at some point during 2010-15. Historically, around 40 percent of credit booms have coincided with investment surges. However, similar credit booms since 2010 have taken place with virtually no such investment surges but, instead, often with rapidly rising consumption.

CHAPTER 3 GLOBAL ECONOMIC PROSPECTS | JANUARY 2017 196
intensified if weakness in investment also sets back total factor productivity growth through a slowdown in embodied technological progress.
Policy responses. Policymakers can boost investment both directly, through public investment, and indirectly, by encouraging private investment, including foreign direct investment (FDI), and by undertaking measures to improve overall growth prospects and the business climate. Doing so directly through expanding public investment in infrastructure and human capital (especially education and health) would help raise demand in the short-run, increase potential output in the long-run and improve the environment for private investment and trade. Public investment would also help close investment gaps targeted by the United Nations Sustainable Development Goals, which have been estimated at up to 3 percent of global GDP per year.
More effective use of counter-cyclical fiscal and monetary policies can also promote private investment indirectly by strengthening output growth, especially in commodity-exporting EMDEs. These policies may be less effective, however, if employed to mitigate the impact of a persistent terms of trade shock. Also, there may be little scope for increased public investment or expansionary fiscal policy, if there is limited fiscal space. In any event, to raise investment growth sustainably, such policies will need to be buttressed by structural reforms to encourage both domestic private and foreign direct investment. Historically, reform waves in EMDEs have been associated with higher investment and output growth. Policy frameworks committed to reform, such as expansion of cross-border trade flows, can help lift investment by boosting confidence in growth prospects—not least via attracting FDI.
Main features of the
investment slowdown
During 2003-08, EMDE investment growth reached historic highs averaging 12 percent a year, more than twice the long-term average growth rate of 5 percent (Figure 3.2). The investment boom was particularly pronounced in commodity
FIGURE 3.2 Investment growth slowdown:
Group-specific and regional dimensions
The slowdown in EMDE investment growth has been pronounced and
persistent among BRICS, commodity exporters, and many commodity
importers. It has been concentrated in EMDE regions with predominantly
commodity-exporting countries, in Europe and Central Asia, Latin America
and Caribbean, and Middle East and North Africa.
B. Investment growth (cont.) A. Investment growth
D. Contributions to EMDE investment
growth
C. Quarterly investment growth:
EMDEs
Sources: Haver Analytics; International Monetary Fund; Oxford Economics; World Development Indicators, World Bank. A.B. Weighted averages. Long-term average starts in 1991 for EMDEs due to lack of earlier data. The EMDE sample includes 126 economies. “ex BRICS” excludes BRICS economies within each group. Large importers refer to the seven EMDE commodity importers ranked in the top 20 EMDEs (ex BRICS) in nominal GDP terms. Other importers include 42 economies. C. Weighted averages. Includes 28 EMDEs with available quarterly data. Long-term averages start in 1991 for EMDEs and are based on annual data. Last observation is for Q2 2016. D. Percentage point contribution by each country group to EMDE investment growth. E.F. Medians across EMDEs of each region to ensure broad-based representation. Long-term averages are period averages of annual medians. East Asia and Pacific, Europe and Central Asia, Latin America and Caribbean, Middle East and North Africa, South Asia, and Sub-Saharan Africa include 8, 12, 18, 10, 5, and 26 economies, respectively.
F. Regional dimensions (cont.) E. Regional dimensions
-2
0
2
4
6
8
10
12
2010 2011 2012 2013 2014 2015
Other EMDEs
Brazil, Russia, S. Africa
India
China
Percentage points
Long-term implications of weak investment growth. By slowing capital accumulation and technological progress embedded in investment, weak post-crisis investment growth has reduced potential output growth relative to pre-crisis rates. This slowdown in potential growth could be
0
2
4
6
8
10
12
14
201
0201
1201
2201
3201
4201
5
201
0201
1201
2201
3201
4201
5
201
0201
1201
2201
3201
4201
5
201
0201
1201
2201
3201
4201
5
EMDE com.exp. ex BRICS
EMDE com.imp. ex BRICS
Large importersex BRICS
Otherimporters ex
BRICS
1990-2008 average
2003-2008 averagePercent
0
5
10
15
20
10
Q1
20
11
Q1
20
12
Q1
20
13
Q1
20
14
Q1
20
15
Q1
20
16
Q1
EMDEs1990-2008 average2003-08 average
Year-on-year, percent
0
2
4
6
8
10
12
14
20
10
20
11
20
12
20
13
20
14
20
15
20
10
20
11
20
12
20
13
20
14
20
15
20
10
20
11
20
12
20
13
20
14
20
15
20
10
20
11
20
12
20
13
20
14
20
15
EMDEs BRICS AEs World
1990-2008 average
2003-2008 average
Percent
0
5
10
15
20
10
20
11
20
12
20
13
20
14
20
15
20
10
20
11
20
12
20
13
20
14
20
15
20
10
20
11
20
12
20
13
20
14
20
15
East Asia andPacific
Europe andCentral Asia
Latin Americaand
Caribbean
1990-2008 average2003-08 average
Percent
0
4
8
12
20
10
20
11
20
12
20
13
20
14
20
15
20
10
20
11
20
12
20
13
20
14
20
15
20
10
20
11
20
12
20
13
20
14
20
15
Middle Eastand North
Africa
South Asia Sub-SaharanAfrica
1990-2008 average2003-08 average
Percent

CHAPTER 3 GLOBAL ECONOMIC PROSPECTS | JANUARY 2017 197
exporters, where soaring commodity prices encouraged investment in resource exploration and development and, in anticipation of higher future incomes, in non-resource projects (World Bank 2016a). Some of this elevated pre-crisis investment fueled activity in nontradables sectors (e.g., real estate) or in sectors whose growth prospects have dimmed considerably (e.g., mining). Since 2010, however, EMDE investment growth has slowed steadily from 10 percent in 2010 to 3.4 percent in 2015. By 2014, it was not only well below its double-digit pre-crisis average rates but also below its long-term average over 1990-2008.
The investment slowdown has been broad-based. It has been more sustained in EMDEs than in AEs and more pronounced than in periods following earlier global downturns. The slowdown has been visible in both private and public components of investment. Repeated downgrades to consensus forecasts for investment growth suggest a gradual recognition of its likely persistence.
Unusually weak. Investment growth remains more anemic—and its weakness has been more persistent—than in the aftermath of previous global recessions and slowdowns (Figure 3.3). From an unusually strong rebound in 2010, investment growth in EMDE commodity exporters has now slowed well below growth rates observed after previous global recessions and slowdowns.
Broad-based. In 2015, investment growth was below its long-term average in more than 60 percent of EMDEs, the largest share over the past quarter-century outside serious global downturns (Figure 3.4). In the majority of EMDEs, investment growth has slowed in at least two out of three years during 2013-15.
Different between commodity exporters and importers. The slowdown in EMDE investment growth has been most pronounced among the BRICS and commodity-exporting economies. By 2015, investment growth had dropped to 3.7 percent in the BRICS and to 1.6 percent in non-BRICS commodity-exporting EMDEs from about 13 percent and 7 percent, respectively, in 2010.
FIGURE 3.3 Investment growth after global downturns
After an unusually strong rebound in 2010, investment growth in EMDE
commodity exporters in 2014-15 slowed well below the average growth
rates after previous global downturns. In EMDE commodity importers,
investment growth has been consistently more anemic than after previous
global downturns.
B. EMDE commodity exporters A. Advanced economies
D. World C. EMDE commodity importers
Sources: Haver Analytics, International Monetary Fund, Oxford Economics, World Bank. Notes: Unweighted average investment growth. The horizontal axis denotes years. Zero refers to the year of the start of global downturns, which include global recessions and slowdowns. Average refers to unweighted average investment growth during global recessions and slowdowns of 1975, 1982, 1991, 1998, and 2001.
FIGURE 3.4 Economies with investment growing below
its long-term average
The share of EMDEs with investment growth below its long-term average
has risen since 2012. The increase has been especially pronounced for
commodity exporters.
B. All economies and advanced
economies with investment growth
below long-term average
A. EMDEs with investment growth
below long-term average
Sources: Haver Analytics; International Monetary Fund; Oxford Economics; World Development Indicators, World Bank. A.B. Long-term averages are country-specific and refer to the period 1990-2008. The world sample includes 157 economies. The AE sample includes 35 economies, and the EMDE sample includes 78 commodity exporters and 44 commodity importers.
-8
-4
0
4
8
12
16
-2 -1 0 1 2 3 4 5 6
Average 2009Percent
Year
0
20
40
60
80
100
201
0
201
1
201
2
201
3
201
4
201
5
Commodity exporters
Commodity importers
Share = 50
Percent of countries
0
20
40
60
80
100
201
0
201
1
201
2
201
3
201
4
201
5
AEs World Share = 50
Percent of countries
-15
-10
-5
0
5
10
-2 -1 0 1 2 3 4 5 6
Year
Average 2009Percent
0
2
4
6
8
10
12
14
16
-2 -1 0 1 2 3 4 5 6
Year
Average 2009Percent
-8
-4
0
4
8
12
16
-2 -1 0 1 2 3 4 5 6
Year
Average 2009Percent

CHAPTER 3 GLOBAL ECONOMIC PROSPECTS | JANUARY 2017 198
regions with a large number of commodity-exporting economies (Boxes 2.1.1-2.6.1 in Chapter 2). This includes Europe and Central Asia (ECA), where investment growth has been anemic from 2012-2015, Middle East and North Africa (MNA), and Latin America and the Caribbean (LAC), where investment has contracted in several large countries.
Although investment growth in commodity-importing EMDEs (excluding China and India) has been resilient as a group, this resilience has been mainly driven by a few large commodity importers. Among smaller commodity importers (those not part of the largest twenty EMDEs in nominal GDP terms), investment growth has stagnated over the post-crisis period.
Different from advanced economies. The sustained investment growth slowdown in EMDEs contrasts with the partial recovery in AE investment growth since the global financial crisis. Investment growth in AEs averaged 2.1 percent over 2010-15. By 2014, it had reattained its long-term average growth rate, with investment growth not far below pre-crisis rates. The share of AEs investing below their long-term average rates declined from more than 80 percent in 2013 to about 60 percent in 2015.
Weak public and private investment. During 2010-15, private investment accounted for roughly 70 percent of total EMDE investment on average. The coordinated fiscal stimulus of 2008-09 lifted public investment growth above long-term averages in both AEs and EMDEs. In AEs, this boost was subsequently reversed. In EMDEs, public investment growth has remained positive but weaker during 2010-13 and, from 2014-15, dropped to below its long-term average, as discussed in detail later in the chapter. Since the post-crisis rebound of 2010, private investment growth slowed in synch with public investment growth. In more than half of all EMDEs, private investment growth remained below the long-term average during 2010-15.
Expected to persist. EMDE investment growth has consistently fallen short of expectations (Figure 3.5). While 2010 consensus forecasts
FIGURE 3.6 Global financial conditions and activity
Global financing conditions have been exceptionally benign from 2010
until late 2016, with policy rates in EMDEs and AEs at historic lows.
Since 2010, output growth has slowed sharply in EMDEs and has been
mediocre in AEs.
B. Output growth A. Monetary policy rates
Sources: Haver Analytics, World Bank. A. Medians for available data for 69 EMDEs and 26 AEs. Last observation is for November 2016. B. Weighted averages.
FIGURE 3.5 Investment growth forecasts
Short-term and long-term forecasts for investment growth in EMDEs have
declined steadily since 2010.
B. Forecasts: Five-year ahead
expectations
A. Next-year forecasts in EMDEs
Source: Consensus Economics. A. Next-year monthly Consensus Forecasts of investment and output growth. Unweighted averages
across 18 EMDEs. Latest observation is October 2016.
B. Each column shows five-year-ahead Consensus Forecasts as of the latest available month in the year denoted. Unweighted averages among 11 EMDE commodity importers and 10 EMDE commodity exporters. Diamond denotes average actual investment growth in 2015 for 21 EMDEs. Last observation is for October 2016.
China accounted for about one-third of the investment growth slowdown in EMDEs between 2010 and 2015, and Brazil and Russia for another one-third.
In commodity exporters, investment weakness affected all types of investment (machinery and equipment as well as construction) and all sources of investment (public and private). Reflecting the divergence between commodity exporters and importers, the EMDE investment growth slowdown has been concentrated in EMDE
0
2
4
6
8
20
10
20
11
20
12
20
13
20
14
20
15
20
16
EMDEs
EMDE commodity importers
EMDE commodity exporters
EMDEs: 2015 actual
Percent
0
4
8
12
20
08
20
09
20
10
20
11
20
12
20
13
20
14
20
15
20
16
GDP Investment
Percent
0
2
4
6
8
20
10
20
12
20
14
20
16
20
10
20
12
20
14
20
16
20
10
20
12
20
14
20
16
EMDEs AEs World
1990-2008 average
2003-08 average
Percent
0
10
20
30
40
1980 1986 1992 1998 2004 2010 2016
EMDE commodity exporters
EMDE commodity importers
Advanced economies
Percent

CHAPTER 3 GLOBAL ECONOMIC PROSPECTS | JANUARY 2017 199
expected investment growth for EMDEs to reach 7 percent in 2015, the outturn was 0.9 percent. Both short-term forecasts and long-term expectations for investment growth in EMDEs have declined since 2010. This may partly reflect a recognition that the investment slowdown is returning growth to long-term average rates from record-high pre-crisis rates. However, the depth and reach of the weakness in investment suggest that the recent slowdown could be more than a simple reversion to the long-term trends. The downward revisions have been considerably more pronounced than those for real GDP growth. In AEs, long-term expectations about investment growth have been more steady, with a decline of just 1 percentage point over 2010-15.
Macroeconomic backdrop
Before delving into the main obstacles associated with the slowdown in investment in EMDEs, it is useful to consider the macroeconomic backdrop, shaped by a wide range of competing factors. Globally, borrowing costs have been at record lows and financial market liquidity has been ample since the financial crisis (Figure 3.6). In several EMDEs, domestic private credit to the nonfinancial private sector surged. However, multiple headwinds have offset the tailwinds to investment from historically low financing cost until late 2016. The headwinds have included disappointing activity and weak growth prospects, severe adverse terms of trade shocks for commodity exporters, easing and volatile capital flows, bouts of policy uncertainty in major economies, and rapid accumulation of private debt.
Weak activity. EMDE output growth has slowed sharply post-crisis, from 6.4 percent in 2011 to 3.5 percent in 2015, well below its pre-crisis average of 7 percent (Figure 3.6). To the extent that growth weakness is structural, investment weakness may be expected to persist (Didier et al. 2015). About one-third of the growth slowdown in EMDEs has been estimated to reflect structural causes. While the sources of the growth slowdown have varied across EMDEs, these have included a new era of lower commodity prices, spillovers from soft activity in major economies, weakening
productivity growth, and a maturing of supply chains that has slowed global trade growth.
In major economies, activity has been soft post-crisis despite unprecedented monetary policy action. The Euro Area crisis was accompanied by a recession in 2012-13 that hurt trading partners, especially in Eastern Europe and North Africa. Euro Area growth prospects have continued to be subdued as crisis legacies have unwound. A series of one-off events, such as the debt ceiling debate in the U.S., caused disappointing growth outcomes. A secular decline in productivity growth has also reduced growth prospects in the United States. Growth in Japan has fluctuated around zero as a result of one-off events (e.g., major earthquakes in 2011 and 2016), earlier than expected policy tightening (VAT hike in 2014), long-term population pressures, and a slow pace of structural reforms. Weak growth prospects across advanced economies have raised the possibility of secular stagnation and a protracted period of extremely low long-run equilibrium interest rates that restrict monetary policy options (Summers 2014; Teulings and Baldwin 2014). In China, growth has slowed gradually towards more sustainable levels, with a rebalancing from manufacturing to services. This healthy transition has reduced commodity demand, with adverse spillovers to commodity-exporting EMDEs (World Bank 2016a).
Adverse terms of trade shocks. About two-thirds of EMDEs are reliant on exports of energy, metals, or agricultural commodities. Most commodity prices have fallen sharply from their early-2011 peaks—with metals and energy prices plunging by more than 40 percent (Figure 3.7). As a result, the terms of trade of commodity exporters have deteriorated by 4 percent since 2011, and those of oil exporters by 21 percent.
Subdued and volatile capital flows. FDI has been an important source of investment in EMDEs. FDI inflows to EMDEs have more than tripled since 2000 and accounted for about one-third of global FDI inflows in 2015. On average among EMDEs, gross FDI inflows amounted to 3 percent of GDP and 20 percent of domestic investment in 2015. Since 2010, however, growth

CHAPTER 3 GLOBAL ECONOMIC PROSPECTS | JANUARY 2017 200
FIGURE 3.8 FDI flows and investment growth
Since 2010, weak investment growth has partly reflected shrinking FDI
inflows among both EMDE commodity importers and exporters.
B. Investment growth in EMDEs with
high and low FDI inflows, 2010-15 A. FDI inflows to GDP in EMDEs
Sources: International Monetary Fund, World Bank.
A. Gross FDI inflows as ratios to GDP. Weighted averages. Includes 75 EMDEs.
B. “Low” and “High” indicate annual change in the FDI to GDP ratio in the bottom and top one-thirds of the distribution, respectively. Difference in medians between “high” and “low” subsamples is significant at the five percent level. Group medians for 120 EMDEs during 2010-15.
Heightened uncertainty. Political uncertainty has increased in many EMDEs since the 2008-09 global financial crisis (Figure 3.9). This has reflected geopolitical tensions in Eastern Europe, security challenges and conflicts in the Middle East, and acute domestic political tensions in several large EMDEs. Even in major AEs and EMDEs without significant political tensions, major policy shifts have often been accompanied by policy uncertainty. For example, bouts of policy uncertainty—e.g., government shutdowns and political stalemates in the United States, the Taper tantrum episode associated with the U.S. Federal Reserve Bank’s policy plans, concerns around the future of the Euro Area during the Euro Area crisis, the U.K. referendum vote to leave the European Union (EU), and reforms related to financial markets and currency regime in China—have been a source of global financial market volatility further weighing on investor sentiment.
Rapid credit growth and debt overhang. On average, private credit in both commodity exporters and importers has increased by near 20 percentage points of GDP from 2000 to 2015 (Figure 3.10). The share of EMDEs with private credit-to-GDP ratios exceeding 60 percent had reached about one-fifth by 2015, the highest share since 1990. Historically, during the three decades prior to the 2008-09 crisis, about 40 percent of all credit booms have overlapped with investment surges within one or two years. Credit booms since 2010, however, have been unusually “investment-less”: virtually none of the post-crisis credit booms in EMDEs have been accompanied by investment surges. In several countries, rapid credit growth instead fueled above-average consumption growth. In the past, when such investment-less credit booms unwound, output contracted more than when the credit boom had been accompanied by an investment surge.
Factors associated with the
investment slowdown
A series of econometric exercises is conducted to estimate the relative importance of these external and domestic factors to investment growth. First,
in FDI inflows to EMDEs has slowed, partly as a result of weak activity in AEs (Figure 3.8). Non-FDI inflows have been more resilient—but notably volatile—reflecting investors’ search for yield amid low AE interest rates, with a shift away from bank flows to non-bank flows (McQuade and Schmitz 2016).
0
1
2
3
4
5
6
7
Low High
Percent
FIGURE 3.7 Terms of trade and investment growth
The terms of trade of commodity exporters have deteriorated since 2011,
reflecting the 30-60 percent declines in global energy, metals, and
agricultural commodity prices from their early-2011 peaks. EMDEs with
larger declines in their terms of trade experienced lower investment growth
over 2010-15.
B. Investment growth in EMDEs with
high and low changes in terms of
trade, 2010-15
A. Cumulative change in commodity
prices
Source: World Bank. A. Energy index includes crude oil (85 percent weight), coal, and natural gas. Agriculture index
includes 21 agricultural commodities. Metals and minerals index includes 6 metals traded on the Land
& Metal Exchange, plus iron ore.
B. “Low” and “High” indicates annual terms of trade growth in the bottom and top one-thirds of the
distribution, respectively. Difference in medians between “high” and “low” subsamples is significant at
the five percent level. Group medians for 108 EMDEs during 2010-15.
-80
-60
-40
-20
0
20
Energy Agriculture Metals &minerals
2011Q1-2014Q2
2014Q2-2016Q3
Percent
0
2
4
6
200
1
200
2
200
3
200
4
200
5
200
6
200
7
200
8
200
9
201
0
201
1
201
2
201
3
201
4
201
5
Commodity importers
Commodity exporters
Percent of GDP
0
2
4
6
8
Low High
Percent

CHAPTER 3 GLOBAL ECONOMIC PROSPECTS | JANUARY 2017 201
in a panel regression, investment in 73 EMDEs and 26 AEs for 1998-2015 is modelled following the standard framework implying that the level of investment is chosen such that the marginal return on capital matches the risk-adjusted cost of capital. Specifically, the regression model includes as explanatory variables the proxies for the drivers of investment, including the marginal return to capital (e.g., output growth and terms of trade growth) and the risk-adjusted cost of capital (e.g., measures of uncertainty, FDI inflows, and the private credit-to-GDP ratio).4 These also are the factors that have shaped the macroeconomic backdrop as previously discussed.
Second, the analysis drills down into the short-term effects of uncertainty and weak activity in major advanced economies on EMDE investment growth using time-series methods. This is done in two sets of vector autoregressions tailored to examine each factor in detail. The need for quarterly data restricts the cross-country dimension of the sample (to 18 EMDEs) used in these exercises.
Medium-term correlates of EMDE investment growth
Figure 3.11 summarizes the estimated effects of these variables on investment growth. Details of the panel regression model used to derive these results are presented in Annex 3.1 (Annex Tables 3.1.1 and 3.1.2).
Whereas investment weakness in AEs has mainly reflected sluggish output, investment weakness in EMDEs has been associated with a wider number of factors.5 While slowing output growth can account for three-quarters, on average, for
FIGURE 3.9 Political stability and investment growth
Weak investment growth compared to pre-crisis rates partly reflects
reduced political stability since the global financial crisis.
B. Investment growth in EMDEs with
strong and weak improvement in
political stability, 2010-15
A. Political stability in EMDEs
Sources: Political Risk Services International Country Risk Guide (ICRG). A. Lines show unweighted annual average, as measured by the ICRG index, for each group. A decrease in the index denotes deteriorating political stability. Includes 95 EMDEs. B. “Strong improvement” and “Weak improvement” indicate improvement in political stability from 2010-15 in the top and bottom one third of the distribution, respectively. Difference in medians between “strong improvement” and “weak improvement” subsamples is significant at the ten percent level. Group medians for 61 EMDEs during 2010-15.
FIGURE 3.10 Private debt and investment growth
Domestic private debt has risen sharply in EMDEs since the global
financial crisis. EMDEs with larger private debt experienced slower
investment growth during 2010-15.
B. Investment growth in EMDEs with
high and low private debt-to-GDP
ratios, 2010-15
A. Private debt in EMDEs
Source: World Bank. Notes: Private debt refers to domestic credit to private sector by banks as percent of GDP. A. Unweighted averages. Includes 115 EMDEs. B. “Low” and “High” indicate median credit-to-GDP ratios over 2010-15 in the bottom and top one-thirds of the distribution, respectively. Difference in medians between “high” and “low” subsamples is significant at the five percent level. Group medians for 107 EMDEs during 2010-15.
4A large cross-country dataset for investment growth is only available for aggregate gross fixed capital formation, which includes both private and public investment. The correlates of investment modelled here are mainly those relating to private investment whereas public investment is assumed to be mostly subject to discretionary policy decisions. In EMDEs, private investment on average constitutes about 70 percent of total investment. To mitigate concerns about endogeneity, output growth prospects are proxied by lagged output growth, in line with other studies (see Annex 3.1). 5The predominant role of output weakness for AEs was also noted by G20 (2016a) and IMF (2015a).
0
2
4
6
Weak improvement Strong improvement
Percent
0
20
40
60
200
0
200
1
200
22
00
3
200
4
200
52
00
6
200
7
200
82
00
9
201
0
201
12
01
2
201
3
201
42
01
5
Commodity importers
Commodity exporters
Percent of GDP
0
1
2
3
4
5
6
7
Low High
Percent
56
60
64
68
200
02
00
1
200
22
00
3
200
42
00
52
00
6
200
72
00
8
200
92
01
0
201
12
01
2
201
32
01
4
201
5
Commodity importers
Commodity exporters
Index
slowdowns in investment growth among AEs during 2011-15, it accounted for a small share of the investment growth slowdown in the average EMDE. More important were terms-of-trade shocks (for oil exporters), and slowing FDI inflows (for commodity importers) as well as private debt burdens and political risk (for all groups of EMDEs).

CHAPTER 3 GLOBAL ECONOMIC PROSPECTS | JANUARY 2017 202
FIGURE 3.11 Correlates of investment growth
Slowing output growth, declining FDI inflows, and worsening terms of
trade (for commodity exporters) are associated with lower investment
growth in EMDEs. Rising private debt and deteriorating political stability
are additional headwinds for many EMDEs.
Source: World Bank. Notes: Estimated impact of explanatory variables on investment growth in 73 EMDEs during 1998-2015, based on a panel regression with country fixed effects. The explanatory variables denoted with plus/minus signs are significant at the five percent level. Details are discussed in Annex 3.1.
• In oil exporters, on average, the terms-of-trade shock caused by the oil price decline from 2014 onwards accounted for about one-half of the investment growth slowdown.
• In commodity importers, on average, slowing FDI inflows accounted for more than half of the slowdown in investment growth.
• Private sector debt-to-GDP ratios have had nonlinear effects on investment: with mounting private debt burdens, the beneficial effects of financial deepening on investment are increasingly outweighed by adverse effects of debt overhang (Box 3.1).6 The post-crisis deleveraging in some commodity-importing EMDEs has relieved some of the headwinds to investment growth. In contrast, in several non-energy commodity exporters, elevated private debt has weighed on investment. In some energy exporters with initially moderate post-crisis private debt stocks, a rapid buildup
of private sector debt has increasingly held back investment growth.
• Rising political uncertainty may have accounted for about one-tenth of the slowdown in investment growth in commodity-importing and exporting EMDEs since 2011.
The actual investment growth slowdowns were considerably steeper than predicted by this econometric analysis. This suggests that there may be other, unobserved factors at work or that important nonlinearities have been present that have amplified the investment growth slowdown over time. The next two exercises consider some additional factors that could have been responsible for the slowdown in investment.
Short-term impact of uncertainty on investment growth
The annual measure of political risk used in the panel regression above is available for a large group of countries over an extended time period. For a considerably smaller group of countries and a shorter time window, two more granular quarterly measures of uncertainty are examined: uncertainty related to policies, as measured by the Economic Policy Uncertainty (EPU) index by Baker, Bloom, and Davis (2016), and uncertainty about financial market prospects (as proxied by stock market volatility).
The impact of these two variables on EMDE investment growth is estimated separately in a series of vector autoregression models for 18 EMDEs during 1998Q1-2016Q2 (Box 3.2). Details of the estimation are presented in Annex 3.2B. The results emphasize the importance of uncertainty in driving investment growth:
• Global financial market uncertainty. The VIX index, which tracks the implied volatility of the U.S. S&P 500 stock market price index, captures global financial market uncertainty as well as U.S. policy uncertainty. It is a key explanatory variable in driving EMDE investment, especially when there has been a sustained increase in the index. For example, a 10 percent increase in the VIX would
Variable Effect
Real GDP growth +
Increase in FDI inflows +
Political stability +
Private debt …
Private debt squared —
Terms of trade improvement +
Reform spurt +
6Credit to the private sector is used as a proxy for private sector debt. At 80 percent of GDP, an increase in private debt was associated with a one-third sharper decline in investment growth than a similarly sized increase in private debt from a starting point of 40 percent of GDP (See Box 3.1 and Annex 3.2A for details on the methodology).

CHAPTER 3 GLOBAL ECONOMIC PROSPECTS | JANUARY 2017 203
Since the global Lnancial crisis, credit to the nonLnancial private sector has risen rapidly in several EMDEs while investment growth has slowed. In the past, credit booms have often Lnanced rapid investment growth, with investment subsequently stalling. Against this background, this box addresses the following questions:
• How has total investment, including both private and public investment, evolved during credit booms and deleveraging episodes in EMDEs?
• How often have credit booms been accompanied by investment booms?
• How has output growth evolved during credit booms and deleveraging episodes in EMDEs?
Me results indicate that while investment often rose sharply during previous credit booms, this has not been so for credit booms since 2010. Mis pattern is cause for concern since, when credit booms unwind, GDP growth tends to contract more if the credit boom was not accompanied by an investment surge.
Data and methodology. Credit to the nonLnancial private sector consists of claims—including loans and debt securities—on households and nonLnancial corporations by the domestic Lnancial system as well as external creditors. Details of the dataset can be found in Annex 3.1A.
A credit boom is deLned as an episode during which the private sector credit-to-GDP ratio is more than 1.65 standard deviations above its Hodrick-Prescott (HP) Lltered trend in at least one year (World Bank 2016b; Ohnsorge and Yu 2016). An episode starts when the deviation Lrst exceeds one standard deviation and ends when the credit-to-GDP ratio begins to fall. Conversely, a deleveraging episode is deLned as an episode during which the private sector credit-to-GDP ratio is more than 1.65 standard deviations below trend in at least one year. Me deleveraging episode starts when the ratio falls more than one standard deviation below trend and ends when the credit-to-GDP ratio begins to climb.
Credit booms and deleveraging episodes are studied within a 7-year event window that covers their peak or trough years (t=0), the three prior years, and the three following years. In the sample used here, there have been 59 credit booms and 28 deleveraging episodes in EMDEs. A typical credit boom lasted about 1.7 years, while an average deleveraging episode lasted about 1.4 years.
Investment behavior during credit booms and
deleveraging episodes
Credit booms have typically been associated with rising investment. During the median credit boom over the past two to three decades, real investment grew by 1 percentage point of GDP above its long-term (HP-Lltered) trend until the peak of the credit boom (Figure 3.1.1). In a quarter of previous credit booms, the real investment-to-GDP ratio dropped about 2 percentage points below its long-term (HP-Lltered) trend over the two years after the peak. Investment swung sharply in the most severe credit boom and bust episodes. For example, during the Asian Lnancial crisis of the late 1990s, in the median aOected EMDE, investment contracted by 3 percentage points of GDP in 1998 and by 5.6 percentage points of GDP in 1999.1
Similarly, investment growth slowed during deleveraging episodes. Real investment dropped below its long-term trend by about 2 percentage points of GDP during the last three years of the median deleveraging episode (Figure 3.1.1). After the trough of a typical deleveraging episode, real investment growth bounced back and, within three years, rose near or slightly above its long-term trend.
Credit and investment booms together
Although investment growth tended to rise during credit booms, not all credit booms were associated with investment booms. For instance, Mendoza and Terrones (2012) document that the coincidence between investment booms and credit booms in EMDEs was about 34 percent (26 percentage points lower than the coincidence in AEs). Me moderate coincidence of credit booms and investment booms may rePect credit booms that mainly fueled consumption (Mendoza and Terrones 2012; Elekdag and
BOX 3.1 Investment-less credit booms
Since the global 2nancial crisis, private credit has risen sharply in several emerging market and developing economies (EMDEs) and advanced economies (AEs). During this period, credit booms have been unusually “investment-less.” Virtually none of the post-crisis credit booms have been accompanied by the investment surges that were common in earlier episodes. 6e absence of investment surges during credit booms is accompanied by lower growth once the credit boom unwinds.
1Me directly aOected EMDEs include China, Indonesia, Malaysia, Mongolia, the Philippines, and Mailand. Note: This box was prepared by Shu Yu.

CHAPTER 3 GLOBAL ECONOMIC PROSPECTS | JANUARY 2017 204
BOX 3.1 Investment-less credit booms (continued)
FIGURE 3.1.1 Investment growth during credit booms and deleveraging episodes
In EMDEs, in the median credit boom, investment grew by about 1 percentage point of GDP above its long-term trend until
the credit boom peaked. It dropped below its long-term trend by 1-2 percentage points of GDP before deleveraging
episodes reached their troughs.
Sources: Bank for International Settlements; Haver Analytics; International Financial Statistics, International Monetary Fund; World Development Indicators, World Bank. Notes. The red lines show sample medians while the blue lines show the corresponding upper and lower quartiles. A credit boom is defined as an episode during which the cyclical component of the nonfinancial private sector credit-to-GDP ratio (using a Hodrick-Prescott filter) is larger than 1.65 times its standard deviation in at least one year. The episode starts when the cyclical component first exceeds one standard deviation and ends in a peak year (“0”) when the nonfinancial private sector credit-to-GDP ratio declines in the following year. A deleveraging episode is defined correspondingly. To address the end-point problem of a Hodrick-Prescott filter, the dataset is expanded by setting the data for 2016-18 to be equal to the data in 2015. Sample is for available data over 1980-2015 for 55 EMDEs. 2015 data are not available for Gabon, Nigeria, Senegal, and Venezuela, RB. Data are not available for Argentina until 1994, Brazil until 1993, China until 1984, Hungary until 1989, Poland until 1992, Russia until 1995, Saudi Arabia until 1993, and Turkey until 1986. Please see the main text of World Bank (2016b) for a detailed description of the sample. A.B. The cyclical component of investment in percent of GDP (derived by Hodrick-Prescott filter). The yellow dashed line is the median annual investment growth rate of the six EMDEs (China, Indonesia, Malaysia, Mongolia, the Philippines, and Thailand) that were affected by the 1997 Asian Financial Crisis (year 1997 is set to be t=0). The light blue dashed line for 2012-15 shows the sample median for the corresponding period. C.D. The cyclical component of private consumption in percent of GDP (derived by Hodrick-Prescott filter). The light blue dashed line for 2012-15 shows the sample median for the corresponding period. 2015 data are not available for Bahrain, Bolivia, Costa Rica, Hungary, India, Jamaica (also for 2000-01), Kazakhstan, Kuwait, Oman, Panama, Thailand, Tunisia, and data are not available for Zambia and Venezuela, RB (in 2014).
A. Investment during credit booms B. Investment during deleveraging episodes
C. Consumption during credit booms D. Consumption during deleveraging episodes
-8
-6
-4
-2
0
2
4
6
8
-3 -2 -1 0 1 2 3
Median
Upper and lower quartiles
Asian financial crisis
2012-2015
Percent of GDP
-8
-6
-4
-2
0
2
4
6
8
-3 -2 -1 0 1 2 3
Median Upper and lower quartilesPercent of GDP
-6
-4
-2
0
2
4
6
-3 -2 -1 0 1 2 3
Median
Upper and lower quartiles
2012-2015
Percent of GDP
-6
-4
-2
0
2
4
6
-3 -2 -1 0 1 2 3
Median Upper and lower quartiles
Percent of GDP

CHAPTER 3 GLOBAL ECONOMIC PROSPECTS | JANUARY 2017 205
Wu 2013). In a quarter of past credit booms, consumption rose above its Hodrick-Prescott Lltered trend by 3 percentage points of GDP during the peak of the credit boom. Consumption on average fell below trend by about 1 percentage point of GDP during deleveraging episodes (Figure 3.1.1).
Following former studies and in parallel to credit booms, investment surges are deLned as years when the investment-to-GDP ratio is at least one (1.65 for investment booms) standard deviation higher than its long-term Hodrick-Prescott Lltered trend. Similarly, episodes of investment slowdown are deLned as years in which the investment-to-GDP ratio is at least one standard deviation below its Hodrick-Prescott Lltered trend.2
Investment surges in AEs occurred with credit booms more often than in EMDEs, with a more rapid rise in investment. In EMDEs, about 40 percent of credit booms were accompanied by investment surges around the peak year of a credit boom (Figure 3.1.2). More than 65 percent of investment surges that coincided with credit booms during the peak year qualiLed as investment booms in advanced economies, but only 56 percent of such investment surges turned out to be investment booms in EMDEs.
After the global Lnancial crisis, the coincidence between credit booms and investment surges during the peak year of a credit boom dropped signiLcantly (Figure 3.1.2). By 2007, about half of the EMDEs in a credit boom were also in an investment surge. However, from 2010 onwards, there is virtually no EMDE that was both in a credit boom and in an investment surge. Me number of EMDEs in a credit boom increased from two in 2010 to ten in 2015 (Azerbaijan, Bolivia, China, Cote d’Ivoire, Kenya, Kuwait, Oman, the Philippines, Qatar, and Turkey) while the number of EMDEs in investment surges dropped from eight to four.3 In AEs, both the number of countries in a credit boom and the number of countries in an investment surge fell from around Lve to almost zero.
In several countries, rapid credit growth fueled above-average consumption growth (Bangladesh, Bolivia, India, and Ghana) but no investment surge. During the period
BOX 3.1 Investment-less credit booms (continued)
FIGURE 3.1.2 Coincidence between
investment surges and credit booms
Before the global financial crisis, about 40 percent of all
credit booms in EMDEs were accompanied by
investment surges around the boom’s peak. Only one
quarter of credit booms since 2010 have been
accompanied by investment surges (and virtually none
by investment booms).
Sources: Haver Analytics; International Financial Statistics, International Monetary Fund; Bank for International Settlements; World Development Indicators, World Bank. Notes. Credit booms are defined as in Figure 3.1.1. Investment surge is defined as years when the cyclical component of the investment-to-GDP ratio is at least one standard deviation (1.65 for investment booms) above the HP-filtered trend, while investment slowdown is a year when the cyclical component of the investment-to-GDP ratio is at least one standard deviation below the HP-filtered trend. Data availability as in Figure 3.1.1. A. Investment surges during the peak year (t=0) or the following year (t=1).
A. Investment surges during past booms in EMDEs
B. Investment surges during recent credit booms in EMDEs
0
10
20
30
40
50
until 2007 2010 onwards 1980-2015
Investment surge Investment boom
Percent of credit booms
0
5
10
15
20
25
30
20
00
20
01
20
02
20
03
20
04
20
05
20
06
20
07
20
08
20
09
20
10
20
11
20
12
20
13
20
14
20
15
Credit boom with investment surge
Credit boom without investment surge
Investment surge
Number of countries
2The results are similar when investment growth, instead of the investment-to-GDP ratio, is used. 3The four countries are Colombia, Namibia, the Philippines, and Saudi Arabia. The identification of Saudi Arabia is not supported by investment growth data.

CHAPTER 3 GLOBAL ECONOMIC PROSPECTS | JANUARY 2017 206
FIGURE 3.1.3 Output growth during credit
booms and deleveraging episodes
In EMDEs, output on average grew above its trend by
2 percent during credit booms and fell below trend by 2
percent during deleveraging episodes. Output growth
during credit booms tended to be stronger when
accompanied by investment surges. During deleveraging
episodes, declines were deeper when accompanied by
investment slowdowns.
Sources: Bank for International Settlements; Haver Analytics; International Financial Statistics, International Monetary Fund; World Development Indicators, World Bank. Notes. Credit booms and deleveraging episodes are defined as in Figure 3.1.1 Investment surges and slowdowns are defined as in Figure 3.1.2. Data availability as in Figure 3.1.1. A. Group medians for the cyclical components of GDP in percent of its trend (derived using a Hodrick-Prescott filter) for all credit booms (in blue), credit booms with investment surge (occurred in 1 year around t=0, in red), and credit booms without investment surge (in yellow). The mean cyclical components of GDP in percent of its HP-filtered trend for the ten countries (including Azerbaijan, Bolivia, China, Cote d’Ivoire, Kenya, Kuwait, Oman, the Philippines, Qatar, and Turkey) in credit booms in 2015 during 2012-2015 are in light blue dashed line. B. Group medians for the cyclical components of GDP in percent of its trend (derived using a Hodrick-Prescott filter) for all deleveraging episodes (in blue), deleveraging episodes with investment slowdown (occurred in 1 year around t=0, in red), and deleveraging episodes without investment slowdown (in orange).
A. GDP during credit booms
B. GDP during deleveraging episodes
BOX 3.1 Investment-less credit booms (continued)
between 2012 and 2015, consumption in EMDEs was about 0.5 percentage point of GDP above trend, near or above its median expansion during past credit boom episodes (Figure 3.1.1).
Output during credit booms and deleveraging episodes
In general, output has expanded during credit booms, but by less than investment (Mendoza and Terrones 2012). Before the median credit boom peaked, output increased, on average, by about 3 percent above trend in cases where there was an investment surge and by about 1 percent above trend before the peak years of credit booms in cases when there was no investment surge (Figure 3.1.3). As credit booms unwound from their peaks, output dropped below trend by more than 2 percent over two years in the absence of investment surges, but by less than half as much when there were investment surges. The more disruptive unwinding of credit booms without investment surges may reflect the lack of a boost to potential output from capital accumulation that could be provided by an investment surge. In the recent wave of credit surges since 2012, EMDE output has evolved similarly to that of past credit booms without investment surges.
During the median deleveraging episode, output fell by almost 2 percent below trend (Figure 3.1.3). If accompanied by an investment slowdown, the decline in output was sharper as output fell from about 1 percent below trend in the run-up to the deleveraging to about 3 percent below trend around its trough. It took about three years for output to move back to its trend after a deleveraging episode.
Conclusion
Since 2010, several EMDEs have experienced rapid private sector credit growth. In contrast to many pre-crisis episodes, however, these credit surges have typically not been accompanied by investment surges. Output growth during the most recent credit surges has also been lower than in previous episodes. While output has contracted as credit booms have unwound, it has contracted more when credit booms have occurred without investments surges.
-4
-3
-2
-1
0
1
2
-3 -2 -1 0 1 2 3
Percent deviation from trendAll
With investment slowdown
Without investment slowdown
-4
-3
-2
-1
0
1
2
3
-3 -2 -1 0 1 2 3
All
With investment surge
Without investment surge
2012-2015 (countries in credit booms)
Percent deviation from trend

CHAPTER 3 GLOBAL ECONOMIC PROSPECTS | JANUARY 2017 207
considerably reduce EMDE investment growth (by about 0.6 percentage points within one year). This type of increase in uncertainty corresponds to about half of the five-day jump that was observed during heightened uncertainty about the health of the Chinese equity markets and capital outflows in August 2015, or the two-month rise at the height of the Euro Area crisis in September 2011.
• Policy uncertainty in the European Union. Bouts of policy uncertainty in the EU, especially during the Euro Area crisis, had spillovers to close economic partners. For example, the Economic Policy Uncertainty Index for Europe doubled in June 2016 following the United Kingdom’s vote to exit the EU or during the four months ending September 2011 (at the height of the Euro Area crisis). These uncertainties have reduced investment, especially in EMDEs in the ECA region.
• Domestic policy uncertainty. A 10 percent increase in the EPU Index of domestic policy uncertainty in Brazil may have reduced investment growth by about 1 percentage point.
Adverse spillovers from major economies
Disappointing U.S. and Euro Area activity. U.S. and Euro Area growth has repeatedly disappointed expectations in recent years. Long-term consensus growth forecasts for the United States and the Euro Area have been revised downwards from 2.9 and 1.7 percent a year in 2010 to 2.3 and 1.4 percent a year in 2015, respectively—below pre-crisis estimates of potential growth. Weaker growth prospects in these two major economies, in turn, worsened EMDE growth prospects and reduced incentives for investment in their EMDE trading partners.
In 2015, the United States and the Euro Area accounted for 22 and 16 percent of global output, respectively, and for 11 percent and 25 percent, respectively, of global trade. Given the sheer size of these economies and their degree of trade and financial integration with the rest of the
world, a slowdown in their growth significantly worsens growth prospects for EMDEs (World Bank 2016a).
To quantify growth spillovers from the United States and the Euro Area (which complements the previously described panel regression using annual data), Bayesian structural vector autoregressions were estimated for 1998Q1–2016Q2 for 18 EMDEs (excluding China, details of the model are presented in Annex 3.2C). The main results are as follows:
• Spillovers from the United States. A 1 percentage point decline in U.S. output growth reduces average EMDE output growth over the following year by about 0.8 percentage point (Figure 3.12). Perhaps in recognition of the possibility that U.S. adverse growth shocks are persistent, EMDE investment growth responded considerably more sharply to U.S. growth slowdowns than EMDE output growth.
• Spillovers from the Euro Area. A 1 percentage point decline in Euro Area output growth lowered EMDE output growth by about 1.3 percentage points within a year. Again, EMDE investment growth responded almost twice as strongly (2.1 percentage points) than EMDE output growth. The somewhat larger estimated magnitude of spillovers from the Euro Area than from U.S. growth shocks may reflect the greater trade-intensity of Euro Area activity (Figure 3.12).
Policy-driven slowdown in China. Sluggish economic activity in major AEs has coincided with a policy-driven slowdown in output growth in China. This has been accompanied by a rebalancing from investment growth towards other, less trade-intensive sources of growth. As a result, China’s investment growth has slowed gradually from record-high levels in the wake of the crisis (Box 3.3).
China is now the largest single trading partner for many EMDEs, especially in Sub-Saharan Africa. It accounted for virtually all of the increase in global metals demand and about half of the increase in

CHAPTER 3 GLOBAL ECONOMIC PROSPECTS | JANUARY 2017 208
FIGURE 3.12 Spillovers from the United States and the
Euro Area
Weak growth in the United States and the Euro Area has had adverse
spillovers on output and investment in EMDEs.
B. Import intensity of demand
components, 2014
A. Five-year ahead growth forecasts
for the United States and Euro Area
D. Spillovers to EMDE output growth
from decline in Euro Area output
growth
C. Spillovers to EMDE output growth
from decline in U.S. output growth
Sources: Consensus Economics, World Bank estimates, World Input-Output Database. A. Five-year ahead Consensus Forecasts as of the latest available month in the year denoted. C.-F. Cumulative impulse response of weighted average EMDE output growth (C.D.) or investment growth (E.F.) at 1-8 quarters to a 1 percentage point decline in growth in real GDP in the United States (C.E.) and Euro Area (D.F.). Growth spillovers based on a Bayesian vector autoregression of world GDP growth (excluding the source country of spillovers), output growth in the source country of the shock, the U.S. 10-year sovereign bond yield, JP Morgan’s EMBI index, investment (E.F.) or output (C.D.) in EMDEs excluding China. The oil price is exogenous. Blue dotted lines denote 16th-84th percentile confidence intervals, and blue solid lines denote median responses. Sample includes 18 EMDEs (Brazil, Bulgaria, Chile, Costa Rica, Hungary, India, Indonesia, Malaysia, Mexico, Paraguay, Peru, the Philippines, Poland, Romania, Russia, South Africa, Thailand, and Turkey) from 1998Q1-2016Q2.
F. Spillovers to EMDE investment
growth from decline in Euro Area
output growth
E. Spillovers to EMDE investment
growth from decline in U.S. output
growth
1.0
1.5
2.0
2.5
3.0
2010 2011 2012 2013 2014 2015
United States Euro Area
Percent
0
10
20
30
40
China US Euro Area
Private ConsumptionInvestmentExport
Percent
-2.0
-1.5
-1.0
-0.5
0.0
1 2 3 4 5 6 7 8
Percentage points
Quarter
-5.0
-4.0
-3.0
-2.0
-1.0
0.0
1.0
1 2 3 4 5 6 7 8
Percentage points
Quarter
-6.0
-5.0
-4.0
-3.0
-2.0
-1.0
0.0
1.0
1 2 3 4 5 6 7 8
Percentage points
Quarter
To estimate the magnitude of the impact of China’s output and investment slowdown on EMDE activity, a Bayesian vector autoregression is estimated for 1998Q1–2016Q2 for 18 EMDEs. A 1 percentage point decline in China’s output growth is accompanied by about 0.5 percentage point slower output growth in other commodity-importing EMDEs and 1 percentage point slower output growth in commodity-exporting EMDEs within a year. Since much of China’s investment is resource-intensive, China’s rebalancing away from investment has had an additional adverse impact on commodity-exporting EMDEs.
Implications of weak
investment for global
trade, long-term growth
and catch-up
The post-crisis investment growth slowdown from record-high pre-crisis rates has lasting implications for global trade and long-term growth prospects. In many countries, investment is more import-intensive than other components of output. A slowdown in investment growth, therefore, weighs heavily on global trade growth. Moreover, by slowing the rate of capital accumulation and technological progress embedded in investment, a prolonged period of weak investment growth can set back potential output growth in EMDEs for years to come, with adverse implications for their ability to catch up with AE income levels.
Slower global trade. Since investment tends to be more import-intensive than other components of demand, investment weakness has been an important source of the post-crisis global trade slowdown (World Bank 2015b; IMF 2016; Constantinescu et al. 2016). This was reflected in weak import growth in capital goods (typically machinery and equipment), which accounted for about 14 percent of EMDE imports during 2015 (Figure 3.13). Capital goods imports tend to embody efficiency-enhancing technology transfers across borders (Alfaro and Hammel 2007). Hence, their slowdown may also be reflected in slowing EMDE productivity growth. Post-crisis global investment weakness was accompanied by a
global primary energy demand from 2010-14 (World Bank 2016a; Huidrom, Kose, and Ohnsorge forthcoming). As a result, China’s output and investment slowdown has weighed on growth in other EMDEs.
-3.0
-2.5
-2.0
-1.5
-1.0
-0.5
0.0
0.5
1 2 3 4 5 6 7 8
Percentage points
Quarter

CHAPTER 3 GLOBAL ECONOMIC PROSPECTS | JANUARY 2017 209
BOX 3.2 Implications of rising uncertainty for investment in EMDEs
Political and policy-related uncertainty has increased since the global 2nancial crisis for most EMDEs. EU policy uncertainty has reduced investment in the EU’s EMDE trading partners, and domestic policy uncertainty has weighed signi2cantly on investment in Brazil. Global 2nancial market uncertainty (as measured by the VIX) signi2cantly a:ects EMDE investment.
Elevated macroeconomic and policy uncertainty after the crisis has contributed to weak investment growth in AEs (Kose and Terrones 2015). However, less is known about the implications of uncertainty for EMDEs. Mis box examines the eOects of uncertainty on investment growth by addressing the following questions:
• What are the basic sources of uncertainty?
• How has uncertainty evolved in EMDEs since the 2008-09 crisis?
• How has uncertainty affected investment in EMDEs?
Me results suggest a post-crisis rise in political and policy uncertainty in EMDEs and bouts of Lnancial market uncertainty amidst ample global liquidity. Policy uncertainty in the European Union (EU)—including that associated with the Euro Area crisis—has weighed on investment in the EU’s EMDE trading partners in Europe and Central Asia. Domestic policy uncertainty has sharply curtailed investment in Brazil.
Basic sources of uncertainty
Although uncertainty is often discussed in policy debates, there is no universally agreed measure of it. Mis box uses three measures for EMDEs, the United States, as well as the EU.
• Financial market uncertainty. Financial market uncertainty is measured by a quarterly financial market volatility measure, which is constructed using the realized standard deviation of daily changes in stock price indexes (Bloom, Bond, and Van Reenen 2007; Bloom 2009; Gilchrist, Sim, and Zakrajsek 2014). The VIX index of implied volatility of the S&P 500 stock market index in the United States is used as an indicator of global financial market volatility.
• Economic Policy Uncertainty. The Economic Policy Uncertainty (EPU) Index is a news-based measure to capture policy-related uncertainty developed by Bloom, Baker, and Davis (2016). The EPU index is constructed from counts of terms related to policy
Note: This box was prepared by Jongrim Ha, Raju Huidrom, and Congyan Tan.
FIGURE 3.2.1 Evolution of uncertainty in
EMDEs
While financial market uncertainty, defined in terms of
stock market volatility, has declined in most EMDEs,
policy and political uncertainty increased from the pre-
crisis to the post-crisis period for most EMDEs.
Generally low post-crisis financial market volatility was
interrupted by several bouts of global financial market
volatility.
Sources: Baker, Bloom, and Davis (2016); Bloomberg; Haver Analytics; International Country Risk Guide; World Bank estimates. Notes: 33 countries for measure based on standard deviation of daily stock market changes; 102 countries for ICRG political risk score; and 4 countries (Brazil, China, India, and Russia) for the EPU measure. Financial market uncertainty refers to realized standard deviation of daily changes in stock price changes. Political risk refers to the ICRG political risk index (adjusted such that higher index denotes higher risk). A. Pre-crisis and post-crisis refer to 2003-08 and 2010-15, respectively. To exclude data for the spike in global financial market uncertainty in the wake of the bankruptcy of Lehman Brothers, pre-crisis average for financial market uncertainty excludes 2008. Last observation is for Q1 2016. B. All series are normalized to standard deviation of 1.
A. Share of EMDEs with higher uncertainty in post-crisis
than pre-crisis.
B. Evolution of uncertainty
0
20
40
60
80
100
Financial marketuncertainty
Political risk EPU
Percent
-3
0
3
6
2002
2004
2006
2008
2010
2012
2014
2016
Financial market uncertainty
Political Risk
EPU
VIX
Index, 2002Q1=0

CHAPTER 3 GLOBAL ECONOMIC PROSPECTS | JANUARY 2017 210
FIGURE 3.2.2 Financial market uncertainty
and investment in EMDEs
Rising global financial market uncertainty, as captured
by the VIX, reduces EMDE investment. Accommodative
monetary policy by major central banks has reduced
financial market uncertainty.
Sources: Bloomberg, Haver Analytics, World Bank estimates. Note: Vector autoregressions are estimated with sample for 1998Q1-2016Q2. The model includes, in this order, the VIX, MSCI Emerging Markets Index (MXEM), J.P.Morgan Emerging Markets Bond Index (EMBIG), aggregate real output and investment growth in 18 EMDEs with G7 real GDP growth, U.S. 10-year bond yields, and MSCI World Index as exogenous regressors and estimated with two lags. Estimates for 2016 are based on the first half in 2016 (annualized). A. Shows cumulative responses of EMDE investment to a 10 percent increase in the VIX. Solid lines indicate the median responses and the dotted lines indicate 16-84 percent confidence intervals. B. Indicates historical decomposition to EMDE investment. “Others” indicates other EMDE and global factors, including stock and bond price index.
A. Investment response to a 10 percent increase in the VIX
B. Contribution of the VIX to EMDE investment growth
BOX 3.2 Implications of rising uncertainty for investment in EMDEs (continued)
uncertainty appearing in newspapers in each country. This measure is available for four EMDEs: Brazil, China, India, and Russia.
• Political uncertainty. Political uncertainty is measured by the political risk rating developed by the Political Risk Services Group’s (PRS) International Country Risk Guide (ICRG). The rating simply summarizes expert judgment on each economy’s political environment. As used here, a higher value of the index reflects greater political risk. For the four EMDEs with available data, the ICRG risk scores are positively correlated with the EPU Index, suggesting overlap between political risk and policy uncertainty.
Evolution of uncertainty in EMDEs since the 2008-
09 crisis
In most EMDEs, political and policy uncertainty were higher post-crisis (2010-2015) than pre-crisis (2003-2008), as indicated by the ICRG-based political uncertainty and EPU-based policy uncertainty measures (Figure 3.2.1). Political risk increased in more than four-Lfths of EMDEs and policy uncertainty increased in all four major EMDEs for which data are available. In contrast, Lnancial market volatility, as measured by the standard deviation of domestic stock market indexes, declined in most EMDEs, rePecting exceptionally accommodative monetary policies and record-low interest rates globally. Me generally low post-crisis Lnancial market volatility was disrupted by several bouts of global Lnancial market uncertainty. Me VIX, which in normal circumstances tends to Puctuate in the 10-30 range, surged to above 40 basis points during periods of intense market concerns about the future of the Euro Area (March-June 2010 and May-September 2011) and about the stability of Chinese equity markets and growth prospects (July-August 2015).
Impact of uncertainty on investment in EMDEs
To assess the eOects of uncertainty on investment during 1998Q1-2016Q2, a series of vector autoregressive models were estimated for 18 EMDEs. Two sources of uncertainty were distinguished: domestic and global. Global Lnancial market uncertainty was captured by the VIX. Global policy uncertainty was captured by the EPU for the United States and the EU. Domestic policy uncertainty was captured by the EPU for Brazil. Details of the estimation are presented in Annex 3.1B.
• Global financial market uncertainty. Global financial market uncertainty shocks, as measured by spikes in
-2.0
-1.5
-1.0
-0.5
0.0
1 2 3 4 5 6 7 8
Quarter
Percentage points
-8
-4
0
4
8
12
16
200
8
200
9
201
0
201
1
201
2
201
3
201
4
201
5
201
6
VIX Others Actual
Percent

CHAPTER 3 GLOBAL ECONOMIC PROSPECTS | JANUARY 2017 211
BOX 3.2 Implications of rising uncertainty for investment in EMDEs (continued)
the VIX, significantly reduced EMDE investment, in line with findings of earlier studies (Carrière-Swallow and Céspedes 2013). Specifically, a 10 percent increase in the VIX reduced average EMDE investment growth by about 0.6 percentage point within a year (Figure 3.2.2). Financial market
uncertainty was the key source of the slowdown in EMDE investment growth in 2008-09. Bouts of global financial market uncertainty (such as during the Euro Area crisis, the 2013 Taper Tantrum, and the 2016 Brexit) also weighed on EMDE investment.
FIGURE 3.2.3 Policy uncertainty and investment in EMDEs
Elevated policy uncertainty in Europe set back investment in ECA. Policy uncertainty has been a significant cause of the
investment slump in Brazil since 2013.
Sources: Bloomberg, Haver Analytics, World Bank estimates. A.C. Vector autoregressions are used for estimation on a sample of aggregate EMDE variables for 1998Q1-2016Q2. The model includes the EPU for the Euro Area, emerging market stock price (Euro Area) index, emerging market bond index, aggregate real output and investment growth in 6 ECA countries, with G7 real GDP growth, U.S. 10-year bond yields, and MSCI World Index as exogenous regressors and estimated with two lags. B.D. Country-specific autoregressions are estimated for Brazil for 1998Q1-2016Q2. The model includes the domestic EPU, domestic stock market index, domestic short-term interest rates, and real output and investment growth, with G7 real GDP growth and VIX as exogenous controls and estimated with two lags. A.B. Show cumulative responses of investment to a 10 percent policy uncertainty shock in the Euro Area and Brazil. Solid lines indicate median responses. Dotted lines indicate the 16-84 percent confidence intervals. Figures C. and D. indicate historical decomposition to investment growths in ECA and Brazil, respectively. Estimates for 2016 are based on the first half in 2016 (annualized).
A. ECA investment response to 10 percent increase in EU policy
uncertainty B. Investment response to 10 percent increase in policy
uncertainty in Brazil
C. Contribution of EU policy uncertainty to ECA investment
growth
D. Contribution of domestic policy uncertainty to Brazil’s
investment growth
-2.5
-1.5
-0.5
0.5
1 2 3 4 5 6 7 8
Quarter
Percentage points
-2.0
-1.0
0.0
1 2 3 4 5 6 7 8
Quarter
Percentage points
-20
-15
-10
-5
0
5
10
15
20
08
20
09
20
10
20
11
20
12
20
13
20
14
20
15
20
16
EPU Others Actual
Percent
-20
-10
0
10
20
20
08
20
09
20
10
20
11
20
12
20
13
20
14
20
15
20
16
EPU Others Actual
Percent

CHAPTER 3 GLOBAL ECONOMIC PROSPECTS | JANUARY 2017 212
Turner 2016; Hall 2016). Similarly, slowing capital accumulation weighs on potential growth in EMDEs.7
Weaker productivity growth. In addition to slowing capital accumulation, weak investment growth is associated with slower total factor productivity growth, as investment is often critical to the adoption of new, productivity-enhancing technologies.8 Among AEs, a steady productivity growth slowdown was underway even before the global financial crisis. Possible drivers include structural change towards lower-productivity services, caused partly by demand shifts related to population ageing, a lack of transformative innovations, and slower technology diffusion.9 Weaker investment growth may partly account for the slowdown in total factor productivity growth in EMDEs, from 2.2 percent in 2010 to -0.2 percent in 2015.10 The productivity slowdown was most pronounced in commodity-exporting EMDEs and those EMDEs with the slowest investment growth (Figure 3.14). Weaker total factor productivity growth would also be reflected in slower labor productivity growth—the key driver of long-term real wage growth and household income growth (Blanchard and Katz 1999; Feldstein 2008).
Slower income catch-up. Weak investment growth in EMDEs is both a symptom and a source of slowing pace of catch-up to AE income levels. Specifically, by reducing potential growth in EMDEs relative to AEs, it slows the pace of catch-up in per-capita incomes. In 2015, the difference in investment growth between EMDEs and AEs reached its lowest level since the early 2000s. If weakness in investment growth persists
7If investment growth is assumed to remain as low as in 2015 (3.3 percent), 2020 potential growth would be about two-thirds of potential growth in the pre-crisis investment growth scenario. 8Gollop, Fraumeni, and Jorgenson (1987); Griliches (1988); Jorgenson (1991); Colecchia and Schreyer (2002); Bourreau, Cambini, and Dogan (2012); and OECD (2016a). 9Brynjolfsson and McAfee (2011); Cowen (2011); Gordon (2012); Bailey, Manyika, and Gupta (2013); McGowan and Andrews (2015); Andrews, Criscuolo, and Gal (2015); and OECD (2016a). 10TFP is calculated as residual from the growth-accounting framework in Didier et al. (2015). The slowdown happened despite some evidence of somewhat faster cross-country technology absorption from countries at the productivity frontier (Comin and Ferrer 2013; IFC 2016a).
• Global policy uncertainty. Policy uncertainty in major AEs could also generate significant spillovers to EMDE investment. Policy uncertainty in the EU had an especially sizable impact on investment in EMDEs in Europe and Central Asia: a 10 percent increase in EU policy uncertainty reduces their investment growth by 0.6 percentage point within a year (Figure 3.2.3). During the Euro Area crisis in 2010-12, EU policy uncertainty may have reduced investment growth in EMDEs in Europe and Central Asia by 0.6-1.3 percentage points with a certain time lag.
• Domestic policy uncertainty. For those EMDEs for which the EPU is available, domestic policy uncertainty also appears to have been accompanied by significantly lower investment: a 10 percent increase in Brazil’s EPU may have reduced investment growth by around 0.8 percentage point within a year.
Conclusion
Me post-crisis rise in political and policy uncertainty in most EMDEs has contrasted with a decline in Lnancial market uncertainty amidst benign global Lnancing conditions until late 2016. Low global Lnancial market uncertainty has supported EMDE investment. In contrast, increased policy uncertainty in the EU has signiLcantly reduced investment in EMDEs in Europe and Central Asia.
BOX 3.2 Implications of rising uncertainty for
investment in EMDEs (continued)
pullback in productive investment of multinational companies, which account for one-third of global trade. Capital expenditures (excluding mergers and acquisitions) by the 5,000 largest multinationals shrank in both 2014 and 2015 (UNCTAD 2016).
The global trade slowdown is not only a symptom, but also a transmission mechanism that propagates the slowdown in investment across countries (Freund 2016). Trade can facilitate more efficient allocation of capital goods and, thus, improve aggregate productivity which, in turn, would encourage investment (Mutreja, Ravikumar, and Sposi 2014).
Slower capital accumulation. Among OECD countries, the post-crisis slowdown in potential growth to a large extent reflects the slowing pace of capital deepening (Ollivaud, Guillemette, and

CHAPTER 3 GLOBAL ECONOMIC PROSPECTS | JANUARY 2017 213
in EMDEs, per capita income catch-up to U.S. levels would require several generations.11 Since growth remains one of the most powerful drivers of poverty reduction, any setbacks to growth also imperil the achievement of global goals for poverty reduction (World Bank 2015d).
Policies to promote
investment growth
The analysis in this chapter suggests that both external and domestic factors are holding back investment in EMDEs. External factors include weak FDI inflows, low commodity prices, and bouts of global policy or political uncertainty. Domestic factors are overall weakness in economic activity and heightened domestic policy uncertainty. In the near-term, some of these drivers of investment growth are expected to turn more benign, but only very gradually. Investment growth is therefore expected to remain weak.
Yet many EMDEs have large unmet investment needs. First, a number of EMDEs are poorly equipped to keep pace with rapid urbanization, growing economic activity, and changing demands on workforce. Second, investment is also needed to smooth the transition away from growth driven by natural resources (in commodity exporters) or nontradables sectors (in some commodity importers) towards more sustainable sources of growth. Finally, a boost to private investment, especially, would help revive slowing productivity growth. The specific investment priorities differ across countries and regions (Boxes 2.1.1-2.6.1). Robust policy action—even in countries with limited room to mobilize domestic resources—is needed to accelerate investment growth prospects.
Although specific policy needs depend on country circumstances, in order to have a sustained improvement in investment growth prospects, it is
FIGURE 3.13 Slowdown in investment and global trade
The investment growth slowdown across the world has been accompanied
by a downturn in the growth of exports as well as capital goods trade.
A. World investment and exports
Sources: Haver Analytics; Thomson ONE; UNCTAD (2016); World Integrated Trade Solution, World Bank; World Bank. A. Denotes levels of real gross fixed investment as well as exports. B. Weighted averages. Long-term average for investment starts in 1991 due to data availability. C. Capital goods trade and gross fixed capital formation expressed in current U.S. dollars. Trend line shows the pre-crisis (2003-08) trend of the average of capital goods trade. D. Top 5,000 MNEs capital expenditures and acquisition outlays based on data from Thomson ONE.
C. Global capital goods trade and
investment
B. Investment and exports growth:
EMDEs
D. Investment by 5,000 largest
multinational companies
0
4
8
12
20
10
20
11
20
12
20
13
20
14
20
15
20
10
20
11
20
12
20
13
20
14
20
15
Investment Exports
1990-2008 average
2003-08 average
Percent
50
100
150
200
250
300
350
200
0
200
1
200
2
200
3
200
4
200
5
200
6
200
7
200
8
200
9
201
0
201
1
201
2
201
3
201
4
201
5
Capital goods trade
Investment
Pre-crisis trend
Index, 2000=100
0
100
200
300
400
500
600
700
800
0
500
1000
1500
2000
2500
200
7
200
8
200
9
201
0
201
1
201
2
201
3
201
4
201
5
Capital expendituresAcquisition outlays (RHS)
US$, billions US$, billions
0.0
0.2
0.4
0.6
0.8
1.0
1.2
1.4
199
5
199
7
199
9
200
1
200
3
200
5
200
7
200
9
201
1
201
3
201
5
Investment Exports
Log index, 1995=0
1995-2008 Trend
1995-2008 Trend
necessary to employ a full range of available policies—counter-cyclical fiscal and monetary stimulus, as well as structural reforms. A two-pronged approach would simultaneously boost public and private investment. Fiscal policy measures could help by directly expanding public investment, while monetary policy could boost activity mainly through lowering the cost of financing for investment. Structural reforms could support investment by addressing the factors holding back private investment, including measures to improve aggregate growth and the business climate, as well as to reduce uncertainty.
Fiscal policy
Public investment accounted for 31 percent of total investment in EMDEs and 15 percent of total investment in AEs, on average, over the period 2010-15. In AEs, public investment growth has moved broadly counter-cyclically to
11To the extent that weak investment growth is associated with weak TFP growth, slowing income catch-up can be further compounded, as TFP differences are a major source of differences in cross-country income per capita (Klenow and Rodriguez-Clare 1997; Hall and Jones 1999; Caselli 2005; and Hsieh and Klenow 2010). An ageing population in many EMDEs, however, may be a force in supporting a higher capital level per person (Bussolo, Koettl, and Sinnott 2015).

CHAPTER 3 GLOBAL ECONOMIC PROSPECTS | JANUARY 2017 214
BOX 3.3 Investment slowdown in China
Investment growth in China has halved since 2012, in a rebalancing towards more sustainable growth. Private investment growth slowed sharply amidst a policy-driven decline in investment in state-owned enterprises.1 Most recently, stimulus-driven infrastructure investment through share-holding enterprises has partly o:set a decline in private and SOE investment. Private investment weakness has re=ected deteriorating business con2dence and weak return prospects. 6e investment slowdown in China has weighed on output growth in other countries, especially commodity-exporting EMDEs.
China is deeply integrated into the global economy. Its imports account for one-tenth of global imports, its output for more than one-tenth of global output, its investment for one-Lfth of global investment, and its investment growth for 42 percent of post-crisis global investment growth (during 2010-15).
A policy-driven rebalancing away from investment- and export-driven growth towards a more sustainable growth model has been underway for several years (Hong et al. 2016). In the process, investment growth in China slowed sharply from a stimulus-driven 21 percent in 2012 to 10 percent in 2015—with global repercussions.2 China’s investment slowdown accounted for one-third of the slowdown in global as well as EMDE investment growth from 2010 to 2015. Given the role of China in the global economy, it generated sizable adverse spillovers to other EMDEs.
Monthly data available for nominal Lxed asset investment (FAI) suggests a further slowdown in 2016: growth in this measure fell to 8 percent (year-on-year) in October 2016 from 21 percent in the year to December 2012, with a sharp shift in composition from the private sector to the publicly controlled sector. FAI by state-owned enterprises or enterprises with majority state participation grew by 20.5 percent (year-on-year) while private investment growth slowed to 2.9 percent (Figure 3.3.1).3 Weak private sector investment adds to concerns about growth prospects as the private sector generates about 65 percent of total investment, around 50 percent of GDP, and 80 percent of employment.
Against this backdrop, this Box addresses the following questions:
1. How has investment in China evolved since 2010?
2. What has driven the slowdown in China’s investment growth?
3. How large are the spillovers from China’s investment slowdown?
4. Which policies can support an orderly rebalancing of investment in China?
Mis box documents the slowdown in China’s investment growth as well as its shifting composition, with pronounced private sector investment weakness. Me slowdown in China’s investment growth may have reduced commodity-exporting EMDEs’ growth by about 0.8 percentage point a year, on average, during 2012-15. Policy options to reinvigorate private investment include eOorts to facilitate private Lrm entry and reduce administrative burdens.
Evolution of fixed asset investment since 2010
Sharp slowdown in investment, shift away from private and SOE investment. Overall investment growth has slowed sharply to 9 percent (year-on-year) in October 2016, from 10 percent at end-2015 and 24 percent in 2010 (Figure 3.3.1). Me slowdown was most pronounced in the private sector. In October 2016, private investment growth slowed to 2.9 percent year-on-year—a steep slowdown from 10.2 percent growth a year earlier and 30 percent in 2012.4 Meanwhile, state-owned enterprise (SOE) investment growth also continued to slow to -6 percent (year-on-year) in October 2016 from 12 percent in the previous year. 5 Me slowdowns in SOE and private investment were partly oOset by state-supported investment by state-owned enterprises or enterprises with majority state participation.
State-supported investment by state-owned enterprises or enterprises with majority state participation. To stem
Note: This box was prepared by Ekaterine Vashakmadze, Hideaki Matsuoka, and Trang Nguyen, with contributions from Raju Huidrom. 1Private investment (“minjian” investment) is deLned by the Chinese National Bureau of Statistics as the sum of Fixed Asset Investment (FAI) made by enterprises that are registered as collectively-owned, cooperative, private sole proprietorship, private partnership, private limited liability company, business individual, or partnership of business individuals. Private (“minjian”) investment also includes FAI by those enterprises in which the above-mentioned entities hold a controlling ownership stake. 2Major stimulus was initiated in 2009. 3In the remainder of this box, investment is measured as FAI (in nominal terms), for which monthly data are available. Unlike gross Lxed capital formation (in real terms) in the national accounts, it includes purchases of land and other already-owned assets. Real gross Lxed capital formation from the national accounts is only available on an annual basis.
4Narrowly deLned private investment growth that refers to private
enterprises also slowed from 30 percent in 2012 to 9.7 percent in
October 2016.
5SOE refers to state-controlled or non-corporatized SOEs.

CHAPTER 3 GLOBAL ECONOMIC PROSPECTS | JANUARY 2017 215
stock market volatility in August 2015, state-owned companies and government units purchased private company shares on the order of 2 percent of stock market capitalization at end-2015.6 As a result, the state became the major or controlling shareholder in companies that previously were not state-controlled. Mis reclassiLcation of Lrms in the oUcial data has exaggerated the divergence between SOE, mixed-ownership enterprise, and private investment in 2016 (Lardy and Huang 2016; Kuijs 2016; CoPan 2016).7
Broad-based slowdown in private investment growth. Me slowdown in private FAI growth since 2010 has been broad-based across all sectors. Private FAI has actually contracted sharply in overcapacity sectors, especially mining and construction. FAI growth has also slowed in the manufacturing sector, as weak export growth and eroding proLt margins have discouraged investment spending by private companies. Even in the services sector, after 9.4 percent growth in 2015, private investment growth declined to 2.1 percent (year-on-year) in 2016H1 and came to a virtual standstill in July 2016 as investment in the transport sector stalled.
Drivers of the investment slowdown
State-controlled enterprises: Policy-driven cuts in overcapacity. Me slowdown in SOE investment growth has partly rePected policy-driven capacity cuts or deleveraging in overcapacity sectors where SOEs predominate (Xing, Sun, and Zheng 2016). Micro-economic policy interventions, especially since 2013, have sharply reduced activity in oUcially designated “excess capacity” or polluting industries, such as coal and steel production. Mese cuts are likely to continue in the medium-term. In February 2016, additional capacity reduction targets were announced for coal and steel and a
fund was established to re-employ or compensate aOected workers. Capacity cuts were accompanied by other measures to strengthen SOE eUciency, including ten pilot programs for SOEs introduced in September 2015 and February 2016. Some provinces began in June 2016 to restructure unviable SOEs.
Private enterprises: Falling returns. Just over a third of the deceleration in private investment growth thus far in 2016 can be attributed to the slowing manufacturing sector (Qu and Wang 2016). Weakness in manufacturing investment rePects deteriorating business conLdence and rising funding costs amid weak return prospects. Slowing export and domestic demand growth and persistent producer price dePation have weighed on return prospects. Between 2011 and 2015, the annual return on investment of private industrial enterprises has been estimated to have fallen by 3 percentage points to 8.5 percent, according to oUcial data. Despite recent eOorts to cut red tape, private enterprises still face high entry barriers, sales taxes, and surcharges by comparison with other countries in the region (Ernst and Young 2016).
Spillovers from China’s investment growth
slowdown
While the investment growth slowdown is an integral part of ensuring sustainable growth in China in the medium to longer term, it has had signiLcant negative repercussions on activity both domestically, given investment’s large share in China’s GDP (about 43 percent in 2015), and globally because of China’s large role in the global economy. A slowdown in investment spills over to other sectors of the domestic economy through industry and Lnancial linkages.8 Since investment is more import-intensive than other components of demand, adverse external spillovers from China’s investment slowdown have been particularly pronounced. For example, China imports large volumes of minerals and metals from countries in Latin America and Sub-Saharan Africa (World Bank 2015a, c). Mus, about 40-50 percent of China’s import growth slowdown from 2014-15 has been attributed to weak investment (Kang and Liao 2016).
Me GDP growth slowdown triggered by an investment slowdown can generate sizable cross-border spillovers (World Bank 2016a; Huidrom, Kose, and Ohnsorge forthcoming). A structural vector autoregression model was
BOX 3.3 Investment slowdown in China (continued)
8For example, real estate investment in China, which accounts for 25
percent of FAI, has extensive industrial and Lnancial linkages with other
sectors of the domestic economy (Ahuja and Nabar 2012a).
6Me purchase happened in August 2015, but the reclassiLcation
started from 2016. Me SOE assets reported by SOE jumped in August
2015 (Lardy and Huang 2016).
7State investment includes three components: state enterprises,
government administrative units, and public institutions. State
enterprises include 1) traditional state-owned companies; 2) state-owned
companies that have been converted to a corporate form of ownership,
typically a limited liability or joint stock company, in which the state is
the sole, majority, or dominant owner; 3) companies, including joint
ventures, in which the state and a non-state Lrm or individual each
contribute 50 percent of a Lrm’s capital; and 4) consultatively state-
controlled companies in which the state capital contribution is less than
that of one or more other shareholders but in which the state exercises
control by virtue of agreement with the other shareholders or capital
contributors. State investment also includes investment by government
administrative units and public institutions (Lardy and Huang 2016).

CHAPTER 3 GLOBAL ECONOMIC PROSPECTS | JANUARY 2017 216
estimated for 1998Q1–2016Q2 for 18 EMDEs to assess the magnitude of these spillovers. Details of the estimation are described in Annex 3.2C.
Since much of investment is resource-intensive, the impact of an investment slowdown on commodity-exporting EMDEs is measured to be twice that on commodity-
importing EMDEs. A 1 percentage point decline in Chinese annual investment growth reduces output growth in commodity-exporting EMDEs, on average, by 0.3 percentage point over the following year, about one-third the impact of a similarly-sized slowdown in overall output growth in China. In 2012-15, slowing investment growth in China may have reduced commodity-exporting
FIGURE 3.3.1 Investment growth in China
Investment growth has slowed sharply since 2012, especially private investment (or “minjian” investment) growth. The
slowdown in private investment growth has been broad-based, with only a modest part explained by data reclassifications.
The private investment slowdown reflects deteriorating business confidence and weakening returns prospects, partly as a
result of weaker demand prospects but also because of rising impediments to firms’ startup and exit, contract enforcement,
and tax payments.
Sources: China Economic and Industry Data Database, China’s National Statistical Office, Haver Analytics, The Conference Board, World Bank. A.B. “Enterprises with state participation“ includes enterprises that are state-owned or those with state participation. Investment is defined as fixed assets investment, which differs from gross fixed capital formation in the national accounts by including land sales. Six-month moving averages (6mma) of year-on-year growth rates. Latest observation is October 2016. See Footnote 1 for the definition of private (“minjian”) investment. C. China industrial enterprise survey of 5000 leading enterprises to rate their perception on selected topics. Index higher than 50 indicates improvement. Latest observation is 2016Q3. D. Distance of China to the “frontier”-best performers whose score is 100. An increase in scores indicates improvement; a decrease deterioration.
A. Fixed asset investment (FAI) growth B. Sectoral contribution to private (“minjian”) investment growth
C. Business confidence D. Change in doing business’ distance to frontier rankings from
2010 to 2016
BOX 3.3 Investment slowdown in China (continued)
0
10
20
30
40
50
2006 2008 2010 2012 2014 2016
Enterprises with state participation
Private ("minjian")
Total
Percent, year-on-year,6mma
-5
0
5
10
15
20
25
2013 2014 2015 2016YTD
ServiceConstructionElectricity/ Gas/ Water productionManufacturingMiningAgriculture
Percentage points, year-on-year
40
50
60
70
80
90
20
08
20
09
20
10
20
11
20
12
20
13
20
14
20
15
20
16
Entrepreneurs Confidence
General Business Confidence
Profitability
Index
-10
-5
0
5
10
15
20
Pro
tection
of
Min
ori
ty I
nve
sto
rs
Ge
ttin
g C
red
it
Re
gis
terin
gP
rop
ert
y
Tra
din
g a
cro
ss
Bo
rde
r
Ge
ttin
g E
lectr
icity
En
forc
ing
Co
ntr
act
s
Sta
rtin
g a
Bu
sin
ess
Re
so
lvin
gIn
so
lve
ncy
Pa
yin
g T
axe
s
Overall change in score
Index

CHAPTER 3 GLOBAL ECONOMIC PROSPECTS | JANUARY 2017 217
FIGURE 3.3.2 Spillovers from China
Since investment in China accounts for a large share of domestic output and is import-intensive, its investment growth
slowdown has weighed on output growth, both domestically and in other EMDEs.
Sources: Haver Analytics, International Monetary Fund, Oxford Economics, World Input Output Database, World Bank estimates. C. Cumulative impulse response of weighted average EMDE output growth after 1 year to a 1 percentage point decline in growth in real investment, real exports, and real GDP in China. Investment spillovers based on a Bayesian vector autoregression of world GDP growth (excluding China), the U.S. 10-year sovereign bond yield, JP Morgan’s EMBI index, growth in the non-investment component of China’s real GDP, China’s real investment growth, and real GDP growth in the spillover destination group. Oil price is exogenous. Exports and real GDP replace real investment in models that estimate spillovers from exports and output. Sample includes 18 EMDEs from 1998Q1-2016Q2. Blue bars denote 16th-84th percentile confidence interval, red dots denote median of posterior distribution. D. Historical contribution of China’s investment and non-investment growth based on model used for Figure C. Line denotes unweighted average demeaned GDP growth.
A. Import intensity of China’s investment, exports and
consumption, 2014
B. Share of investment in China’s GDP
C. Response of EMDE output growth to a decline in China’s
investment, export and output growth
D. Contribution of China’s investment and non-investment
movements to commodity-exporting EMDE growth
EMDEs’ annual output growth by as much as 0.8 percentage point on average (Figure 3.3.2).
Policies to support an orderly rebalancing
of investment
A slowdown in China’s investment growth has been necessary to ensure sustainable growth. However, the
concentration of the slowdown thus far in private investment raises concerns about growth prospects. Weak private investment lowers prospects for potential output growth, which is already under pressure from a shrinking working-age population and slowing total factor productivity growth. Potential growth is expected to slow from 10.6 percent in 2010 to 6 percent in 2020.
BOX 3.3 Investment slowdown in China (continued)
0
5
10
15
20
Private Consumption Investment Export
Percent
0
10
20
30
40
50
60
2010 2015
Percent of GDP
-5
-4
-3
-2
-1
0
1
2
3
2010 2011 2012 2013 2014 2015
Percentage point
Other
China's growth excluding investment
China's investment
Actual
-1.8
-1.4
-1.0
-0.6
-0.2
0.2
Invest-ment
Export GDP Invest-ment
Export GDP
Commodity exporters Commodity importers
Percentage point
16-84 percent confidence bands Median

CHAPTER 3 GLOBAL ECONOMIC PROSPECTS | JANUARY 2017 218
In rebalancing the economy from investment-led towards more sustainable growth, the authorities face two challenges: to sustain private investment growth and to limit adverse spillovers from slowing private investment growth to other parts of the economy. Following an in-depth study in seven provinces, the government announced a range of measures over the past two years. Mese include eOorts to facilitate entry by private Lrms in a broader range of sectors; and to promote public-private partnerships in activities accounting for 14 percent of 2016 GDP. To ease concerns about the ineUciency of public-private partnerships and limited access for private Lrms to such projects, the government is drafting regulations to protect private investors in the partnerships. In the short term, this may be complemented by monetary stimulus and tax reductions to encourage private investment.
Conclusion
A policy-driven slowdown in investment growth has been underway in China since 2012. Mis has weighed on global output growth, especially in commodity-exporting EMDEs. China’s investment slowdown has been accompanied by a particularly sharp decline in investment growth in private enterprises, rePecting deteriorating business conLdence and weakening return prospects. Me slowdown in private investment raises concerns about potential growth prospects, against the backdrop of an aging population and slowing productivity growth. Policies to rekindle private investment include, in particular, measures to facilitate market access by private Lrms.
BOX 3.3 Investment slowdown in China
(continued)
Alternatively, revenues can be raised—preferably in ways that do not discourage investment—to finance public investment while containing fiscal deficits. Third, even within an existing envelope of public investment spending, spending efficiency can be improved to increase the benefits to growth from public investment.
Counter-cyclical fiscal stimulus. Growth prospects play a major role in investment decisions. To the extent that the EMDE growth slowdown since 2010 is cyclical, fiscal stimulus can help raise growth and investment where there is policy space (Didier et al. 2015). The current low-interest rate environment offers a rare opportunity to implement fiscal stimulus with limited impairment of long-term fiscal sustainability (Kose et al. forthcoming; OECD 2016c). Provided there is sufficient fiscal space and economic slack, and that measures are integrated into a credible medium-term fiscal framework, fiscal stimulus can support output growth (Huidrom, Kose, and Ohnsorge 2016).
In order to analyze the implications of expansion in public investment for activity and private investment, a vector autoregression model is estimated for eight EMDEs with available data, for 1998Q1-2016Q2. Details of the estimation are presented in Annex 3.2D. A 1 percent increase in public investment raises private investment about 0.26 percent above the baseline after just over a year (a temporary “crowding-in” effect). Thereafter, however, this positive effect dissipates and private investment returns toward the baseline (Figure 3.16).
Although the availability of cheap financing from global markets makes it relatively easier to undertake fiscal stimulus programs, most EMDEs have limited fiscal space for expansionary policy, given debt burdens and sizable deficits (Chapter 1; Figure 3.17). In addition, cyclical policies for commodity exporters may be ineffective if they face persistent terms of trade shocks.
Expenditure reallocation or revenue increases. Absent room for fiscal stimulus, spending on public investment can also be boosted by reallocating expenditures towards growth-
private investment growth since 2008 (Figure 3.15). In EMDEs, the broad-based counter-cyclical surge in public investment in 2008-09 offset a significant slowdown in private investment growth. Post-crisis, this was followed by a period of easing public as well as private investment growth. In the majority of EMDEs, public and private investment growth have both been below their long-run averages since 2010 (Box 3.4).
Policymakers can use public investment in three ways to lift overall investment and output. First, public investment can raise domestic demand as part of fiscal stimulus. Second, a shift in government expenditures toward investment away from less efficient expenditures can make government operations more growth-friendly.

CHAPTER 3 GLOBAL ECONOMIC PROSPECTS | JANUARY 2017 219
enhancing investment at the expense of expenditures that are less clearly aligned with policy priorities. Such offsetting expenditure cuts could be identified in periodic Public Expenditure Reviews that assess all government expenditures against policy priorities (for example, World Bank 2015e; 2016c-d). Alternatively, domestic resources could be mobilized through increased revenue collection, whether by strengthening tax administrations, broadening tax bases, or raising tax rates. Revenue-to-GDP ratios are particularly low in South Asia and Sub-Saharan Africa (Box 2.6; World Bank 2015b, 2016e). Even absent hikes in tax rates, efforts to remove exemptions, tighten tax administration, and broaden tax bases could yield revenue gains that could increase resources to finance public investment projects.
Expenditure efficiency. Even if the resource envelope for public investment cannot be increased, public investment can be turned more effective in reaching policy priorities by strengthening expenditure efficiency (Buffie et al. 2012). EMDEs in Sub-Saharan Africa and South Asia consistently score lowest among EMDE regions in indicators of efficiency of education and health care systems (Herrera and Pang 2005). Measures can be taken both on the revenue and the expenditure side to raise public spending efficiency. On the revenue side, output-based funding rules can strengthen incentives for ensuring greater efficiency. On the expenditure side, medium-term budget frameworks can improve spending predictability; greater transparency of expenditures and independent spending evaluations can improve incentives to tighten efficiency; and better coordination between different levels of government can reduce duplication and inconsistencies (Mandl, Dierx, and Ilzkovitz 2008; St. Aubyn et al. 2009).12
Expenditure efficiency has also been prioritized by G20 policymakers (G20 2015). Policy commitments among G20 countries include efforts to strengthen cost-benefit analyses and needs assessments, improve prioritization, increase
12The disconnect between spending and asset accumulation of infrastructure services is particularly acute when governance and fiscal institutions are weak (Keefer and Knack 2007).
FIGURE 3.14 Labor productivity, TFP, and investment
Slowing capital accumulation and total factor productivity growth have
lowered EMDE income catch-up and labor productivity growth. Labor
productivity growth has slowed in EMDEs since the crisis, most markedly
in economies with relatively low investment growth.
B. Average TFP growth A. Catch-up to U.S. per capita income
D. Differential between EMDEs and
AEs in per capita investment and GDP
growth
C. Changes in TFP and investment
growth, 2010-15
Sources: Haver Analytics, International Labor Organization, International Monetary Fund, Penn World Table, World Bank. A. Number of years needed to catch-up with 2015 real per capita GDP level in the United States, assuming average growth rates over each period denoted for each group. B. Unweighted averages. TFP calculated as residual from the growth-accounting framework in Didier et al. (2015). Dashed lines indicate long-term average for 1990-2008 for each respective group. C. Correlation of change in investment growth from 2010-15 with change in TFP growth over the same period. Red dotted line denotes the linear regression line. Includes 40 EMDEs. D. Weighted averages. Difference between EMDEs and AEs. The shaded areas are global recessions and downturns. E. Weighted averages. Labor productivity is defined as real output per person engaged. F. “Low” and “High” indicate annual growth rates in real investment in the bottom and top one-third of the distribution, respectively. Difference in medians between “high” and “low” subsamples is significant at the five percent level. Group medians for 123 EMDEs during 2010-15.
F. Labor productivity growth in
EMDEs with high and low investment
growth, 2010-15
E. Labor productivity growth in
EMDEs
-3
-2
-1
0
1
2
3
4
20
03
20
04
20
05
20
06
20
07
20
08
20
09
20
10
20
11
20
12
20
13
20
14
20
15
Commodity importers
Commodity exportersPercent
Dashed lines: Long-term average
-10
-5
0
5
10
15
20
19
91
19
94
19
97
20
00
20
03
20
06
20
09
20
12
20
15
Investment per capita GDP per capitaPercentage point
0
1
2
3
4
Low investmentgrowth
High investmentgrowth
Percent
0
20
40
60
80
100
120
EMDEs EMDEcommodityexporters
EMDEcommodityimporters
1993-20082003-082013-15
Number of years
-40
-30
-20
-10
0
10
20
30
-15 -10 -5 0 5 10Cha
ng
e in in
vestm
en
t gro
wth
Change in TFP growth
Percentage points
0
1
2
3
4
5
6
0
2
4
6
8
10
12
2010 2011 2012 2013 2014 2015
Investment growth
Labor productivity growth (RHS)
Percent Percent

CHAPTER 3 GLOBAL ECONOMIC PROSPECTS | JANUARY 2017 220
and above the average EMDE investment of 24 percent of GDP during 2010-15 (UNCTAD 2014).13 While specific investment priorities vary widely across regions (Boxes 2.1.1-2.6.1), investments in infrastructure as well as in human capital, in particular health and education, foster long-term prospects for inclusive growth.14
• Infrastructure investment. Infrastructure investment gaps are sizable (World Bank 2016b, Figure 3.18).15 Investment in infrastructure not only raises investment directly, but can also crowd in private investment, under the right conditions. Crowding-in of private investment is more likely if public investment occurs amidst economic slack and accommodative financial conditions, if there are sizable infrastructure gaps impeding private investment, and if it is implemented in a strong institutional environment with sufficient trade and financial openness (Kessides 2004; Box 3.4).
Investment in public infrastructure can spark large benefits. In particular, it can encourage urbanization in EMDEs by expanding market access, improving the delivery of services, fostering innovation, or reducing trans- portation costs (Sokoloff 1988; Citigroup 2016). Urbanization, in turn, has been associated with higher growth of output as well as labor productivity (Glaeser 2008; World Bank 2009; Dasgupta, Lall, and Lozano-Gracia 2014). Infrastructure capital appears to be inversely correlated with income inequality among EMDEs, although the
FIGURE 3.16 Public investment and growth
Public investment boosts output growth and crowds-in private investment,
but the effects dissipate after about two years.
B. Cumulative impact on private
investment of a 1 percent increase in
public investment
A. Cumulative impact on output of a 1
percent increase in public investment
Sources: International Monetary Fund, World Bank estimates. Notes: The graphs show the cumulative impulse responses (percentage points) of output and private investment due to a positive shock to government investment, based on a sample of 8 EMDEs for 1998Q1-2016Q2.Variables included are, in this ordering, real government investment, real GDP¸ real private investment, current account balance, and the real effective exchange rate. The shock size is such that government investment increases by 1 percent from the baseline on impact. Solid lines represent the median, and dotted bands are the 16-84 percent confidence bands.
-0.2
-0.1
0.0
0.1
0.2
0.3
1 3 5 7 9 11 13 15 17 19
Percent deviation from the baseline
Quarter
-0.6
-0.4
-0.2
0.0
0.2
0.4
0.6
0.8
1 3 5 7 9 11 13 15 17 19
Percent deviation from the baseline
Quarter
FIGURE 3.15 Public and private investment
In EMDEs, both public and private investment have declined from 2009-10
peaks. In AEs, post-crisis public investment contracted as private
investment growth stabilized and picked up.
B. Private investment growth A. Public investment growth
Sources: Eurostat, General Statistics Office of Vietnam, Haver Analytics, International Monetary Fund, Ministry of National Economy of the Republic of Kazakhstan, OECD, Reserve Bank of India, Sri Lanka Ministry of Finance, World Bank. A.B. Public and private investment growth rates are weighted averages of gross fixed capital formation growth rates in the public and private sectors, respectively, in constant 2005 U.S. dollars. The sample includes 20 advanced economies and 99 EMDEs from 1990 to 2015.
-10
-5
0
5
10
15
20
20
08
20
09
20
10
20
11
20
12
20
13
20
14
20
15
20
08
20
09
20
10
20
11
20
12
20
13
20
14
20
15
AEs EMDEs
1990-2008 average
2003-08 average
Percent
13Aschauer (1989); Fernald (1999); Czernich et al. (2011). 14Where investment needs are large relative to public financial resources and institutions are robust, public investment can leverage private investment in public-private partnerships (PPP). Currently, the share of the private sector in infrastructure investment is 30-80 percent, depending on the industry, in developing countries (UNCTAD 2014). However, the share of the private sector in education and health investment in developing countries is modest at 15 and 20 percent, respectively. The challenges to designing effective PPPs are summarized in Bloomfield (2006) and Pongsiri (2002). The beneficial effects of public investment projects can be especially large when the economy’s stock of infrastructure capital is relatively low (Calderon, Moral-Benito, and Serven 2015). 15Even in OECD countries, sizable infrastructure gaps remain to maintain, improve, and expand energy, water, and transportation infrastructure (IEA 2014; OECD 2015a,b).
-15
-10
-5
0
5
10
15
20
20
08
20
09
20
10
20
11
20
12
20
13
20
14
20
15
20
08
20
09
20
10
20
11
20
12
20
13
20
14
20
15
AEs EMDEs
1990-2008 average
2003-08 average
Percent
the focus on investment quality, improve coordination of investment plans and reduce duplication, and increase transparency.
Addressing substantial investment needs. Regardless of the sources of financing, considerable investment is needed in all EMDE regions to meet the demands of rapid urbanization and growing activity, as well as to achieve the UNDP’s Sustainable Development Goals. In total, such investment needs amount to about 1.9-3.1 percent of GDP per year during 2015-30, over

CHAPTER 3 GLOBAL ECONOMIC PROSPECTS | JANUARY 2017 221
BOX 3.4 Interactions between public and private investment
Both public and private investment have decelerated in EMDEs since the global crisis. Although the effect of public investment on private investment has been mixed, the impact is more likely to be positive in the presence of economic slack, accommodative financial conditions, sizable investment needs, sound institutions, and available skilled labor. The effect on private investment is uneven, but public investment generally does not “crowd out” private investment.
Public investment accounted for 31 percent of total investment in EMDEs and 15 percent of total investment in AEs, on average, over the period 2010-15. Initiatives to boost public investment, including as part of a fiscal stimulus, could therefore directly lift GDP considerably. In addition to this direct effect on activity, public investment has at times proven a catalyst for private investment.
This Box analyzes recent trends in public and private investment and the effects of public investment on private investment and growth. In particular, it addresses the following questions:
• How have public and private investment evolved since the 2008-09 crisis?
• What are the macroeconomic implications of public investment?
• Which policies can increase the benefits of public investment?
The box documents the weakening public and private investment growth in EMDEs. An extensive literature suggests that public investment can significantly raise output and trade and help support better infrastructure. In addition, it is associated with lower income inequality. The evidence on the impact of public investment on private investment, in contrast, is mixed. Policy measures can be implemented to increase the benefits from public investment and mitigate fiscal pressures.
Evolution of public and private investment
since the 2008-09 crisis
Post-crisis public investment slowdown. The fiscal stimulus implemented in many countries in 2008-09 to counter the economic impact of the financial crisis lifted public investment growth above long-term averages in both AEs and EMDEs. In AEs, this boost has subsequently reversed: public investment contracted sharply in 2011, while the cumulative growth rate after 2011 has remained negative (Figure 3.4.1). In EMDEs, public investment growth also has been weak and has remained below its long-term average, with the exception of 2012. From 2014-15, it began to ease further. This pattern largely reflected
sizable initial fiscal stimulus and subsequent policy tightening in large EMDEs, especially China, which accounts for more than half of EMDE public investment.
However, in the majority of EMDEs, public investment growth was below its long-term average throughout 2010-15 (Figure 3.4.2). In most regions, public investment growth slowed from pre-crisis averages but remained robust above long-term averages in 2008-09. Thereafter, investment growth slowed steadily in all regions, except Sub-Saharan Africa (SSA), to below long-term averages. This slowdown may partly reflect increasing financing constraints as fiscal space eroded following fiscal stimulus during the crisis.
Private investment growth slowdown. In AEs, public investment moved broadly counter-cyclically with private investment: surging during the private investment collapse of 2008-09 and contracting in the wake of the crisis as private investment stabilized and began to recover from its deep 2008-09 contraction. A similar pattern occurred in EMDEs during the recession of 2008-09, when surging public investment offset a halving in private investment growth to 7 percent (from 16 percent in 2006-07). After the 2010 rebound, however, private investment growth slowed in synchronization with public investment growth. In more than half of all EMDEs, private investment growth during 2010-15 remained below the long-term average. It was weakest in ECA, mainly as a result of spillovers from the Euro Area crisis, and MENA, where political uncertainty in the wake of the Arab Spring weighed on sentiment.
Macroeconomic implications of public investment
An extensive literature, summarized in several recent survey papers (Straub 2011; Estache and Garsous 2012; Pereira and Andraz 2013; Bom and Ligthart 2014), has discussed the macroeconomic benefits of public investment. These benefits have included higher growth, more trade, and less income inequality. The effects of public investment on private investment and public finances appear to be more mixed.
• Growth. Investment to build public capital lifts growth in AEs, although estimates vary widely. Estimates of the output elasticity of public capital averages 0.14 but ranges from −1.7 for New Zealand Note: Mis box was prepared by Yoki Okawa.

CHAPTER 3 GLOBAL ECONOMIC PROSPECTS | JANUARY 2017 222
to 2.0 for Australia. Estimates of the long-run effect are about three times estimates of the short-run impact. Local government capital generates somewhat higher output gains than central government capital, with considerable cross-regional spillovers (Pereira 2000; Bom and Ligthart 2014). Estimates of the output elasticity of public investment are typically smaller for EMDE than for AEs, possibly reflecting the heterogeneity within the former group (Straub 2011; Kraay 2014). Estimates of the output elasticity
of infrastructure capital are somewhat higher than those for general public capital. In EMDEs, the level of infrastructure capital can have a sizable effect on labor productivity. The higher infrastructure capital of upper-middle income EMDEs (relative to lower-income EMDEs) increases output per worker by 5.2 percent in the long run (Calderon et al. 2015).
• Links between public and private investment. The impact of public investment on private investment
BOX 3.4 Interactions between public and private investment (continued)
FIGURE 3.4.1 Public and private investment growth
In AEs, public investment growth has moved broadly counter-cyclically to private investment growth since 2008. In EMDEs,
the counter-cyclical public investment boost of 2008-09 offset a sharp slowdown in private investment growth, but was
followed by a period of slowing public and private investment growth. Private investment weakness was most pronounced
in BRICS and commodity-exporting EMDEs.
Sources: Eurostat, General Statistics Office of Vietnam, Haver Analytics, International Monetary Fund, Ministry of National Economy of the Republic of Kazakhstan, OECD, Reserve Bank of India, Sri Lanka Ministry of Finance, World Bank. Note: Public and private investment growth rates are weighted average of gross fixed capital formation growth rates in the public and private sectors, respectively, in constant 2005 U.S. dollars. The sample includes 20 advanced economies and 99 EMDEs for 1990 to 2015.
A. Public investment growth B. Private investment growth
C. Contributions to investment growth D. Contributions to investment growth
-10
-5
0
5
10
15
20
200
8
200
9
201
0
201
1
201
2
201
3
201
4
201
5
200
8
200
9
201
0
201
1
201
2
201
3
201
4
201
5
AEs EMDEs
1990-2008 average
2003-08 average
Percent
-15
-10
-5
0
5
10
15
20
200
8
200
9
201
0
201
1
201
2
201
3
201
4
201
5
200
8
200
9
201
0
201
1
201
2
201
3
201
4
201
5
AEs EMDEs
1990-2008 average
2003-08 average
Percent
-2
0
2
4
6
8
10
12
201
0
201
1
201
2
201
3
201
4
201
5
201
0
201
1
201
2
201
3
201
4
201
5
201
0
201
1
201
2
201
3
201
4
201
5
World AEs EMDEs
Percentage points
Public Private
-4
0
4
8
12
16
20
10
20
11
20
12
20
13
20
14
20
15
20
10
20
11
20
12
20
13
20
14
20
15
20
10
20
11
20
12
20
13
20
14
20
15
Commodity exportersexcl. BRICS
Commodity importersexcl. BRICS
BRICS
Percentage points
Public Private

CHAPTER 3 GLOBAL ECONOMIC PROSPECTS | JANUARY 2017 223
BOX 3.4 Interactions between public and private investment (continued)
FIGURE 3.4.2 Comparison of public and
private investment growth with long-term
average
In the majority of EMDEs, both public and private
investment growth since 2010 have been below their
long-run averages.
Sources: Eurostat, General Statistics Office of Vietnam, Haver Analytics, International Monetary Fund, Ministry of National Economy of the Republic of Kazakhstan, OECD, Reserve Bank of India, Sri Lanka Ministry of Finance, World Bank. Note: Public and private investment growth rates are weighted average of gross fixed capital formation growth rates in the public and private sectors, respectively, in constant 2005 U.S. dollars. The sample includes 20 advanced economies and 99 EMDEs for 1990 to 2015. Figures show the share of EMDE and AEs (in percent) in which public and private investment growth was below the 1990-2008 average during the periods specified. Line indicates half of the sample.
A. Countries with public investment growth below 1990-2008
average
B. Countries with private investment growth below 1990-
2008 average
depends on the presence of economic slack, the stances of fiscal and monetary policy, possible financial market reactions, the magnitude of investment needs as well as the institutional and physical environment. Public investment that increases the fiscal deficit in an environment of tight monetary policy, large government debt, and limited economic slack can “crowd out” private investment (Mankiw 2012). Such crowding out has been demonstrated in AEs (Erden and Holcombe 2005) as well as in EMDEs that are not open to trade and financial flows, have weak institutions, or small skilled labor forces (Cavallo and Daude 2011; Warner 2014; Presbitero 2016). In contrast, public investment has been found to “crowd-in” private investment (through positive effects on prospective demand and activity, and increased investor confidence) in some EMDEs, including the lowest-income countries and those with stronger institutional safeguards but sizable infrastructure needs (Cavallo and Daude 2011; Dreger and Reimers 2014; Eden and Kraay 2014; Bahal et al. 2015; Cerra et al. 2016).
• Trade. Better public infrastructure, especially trade-facilitating infrastructure, can increase international trade. Improved port and airport facilities and telecommunication quality raise export and import volumes significantly (Nordas and Piermartini 2004; Ismail and Mahyideen 2015). By one estimate, bringing the trade-facilitating infrastructure of below-average member countries of the Asia Pacific Economic Cooperation Forum (APEC) to half the APEC average increased intra-APEC trade by about 10 percent (Wilson et al. 2002).
• Income inequality. Infrastructure capital and income inequality are negatively correlated in both AEs and EMDEs (Calderon and Serven 2014), although the presence of a causal relationship is still debated. Enhanced public infrastructure may reduce income inequality as well as promote growth if it benefits the poor more than proportionally (Ferreira 1995; Getachew 2010; Fournier and Johansson 2016).
• Fiscal space. Increased public expenditure can put pressure on government finances, at least in the short-run and especially if the government already has a sizable deficit or debt. In the long-run, well-executed high-yielding public investment programs, including in low-income countries, can generate tax revenues that exceed their initial cost, especially if the financing cost is low (Buffie et al. 2012). For AEs with
0
25
50
75
100
AEs EMDEs
Percent
2006-07 2010-13 2014-15
0
10
20
30
40
50
60
70
80
AEs EMDEs
Percent
2006-07 2010-13 2014-15

CHAPTER 3 GLOBAL ECONOMIC PROSPECTS | JANUARY 2017 224
economic slack and accommodative monetary policy, infrastructure investment can also be self-financing over the long-run (Abiad et al. 2015; Holtz-Eakin and Mandel 2015). However, if the productivity of public investment is low, for example because of an already-high stock of public capital, it is likely to leave a long-term legacy of higher debt (Holtz-Eakin and Mandel 2015; ECB 2016).
Policies to increase the benefits of public
investment
• Improve efficiency of public investment. The difference between the output and revenue gains associated with public investment and its fiscal cost can be made more favorable by strengthening the efficiency of public investment. Public investment is generally less efficient in EMDEs than in AEs (Albino-War et al. 2014; Dabla-Norris et al. 2012). Its efficiency can be increased in EMDEs through a strategically planned, well-prioritized, rigorous and transparent project selection process and through strengthened institutions to fund, manage, execute, and monitor project implementation (Albino-War et al. 2014; IMF 2015; Rajaram et al. 2010).
• Mitigate short-term fiscal pressure. Public investment and public infrastructure investment, in particular, is characterized by large initial expenses that need to be
BOX 3.4 Interactions between public and private investment (continued)
weighed against long-term returns. Even efficient and, over the long-term, self-financing public investment projects may pose short-term fiscal challenges. External financing, especially through concessional loans, can mitigate short-term domestic financing constraints (Buffie et al. 2012). Well-designed public private partnerships, particularly with foreign private sectors, can help reduce fiscal pressure as well. Developing and strengthening a pipeline of infrastructure investment projects can attract investors with lower costs (McKinsey Global Institute 2016).
Conclusion
Post-crisis, slowing public investment growth in EMDEs has accompanied a steady decline in private investment growth. Public investment can raise output in the short run as well as in the long run, and stimulate trade. Public infrastructure is negatively related to income inequality, although the presence of a causal relationship remains debated. Evidence on the effects of public investment on private investment is mixed. However, public investment is more likely to crowd in private investment in the presence of economic slack, accommodative financial conditions, sizable investment needs, well-developed institutions, and a sufficiently skilled labor force. Improved project selection and monitoring, as well as better governance, may enhance the benefits from public investment.
direction of causality remains a matter of debate (Ferreira 1995; Getachew 2010; Calderon and Serven 2014).
• Health investment. Gaps in health investment relative to the levels needed to reach sustainable development goals remain substantial (UNCTAD 2014; Wagstaff, Bredenkamp, and Buisman 2014). Investment in health yields both microeconomic and macroeconomic benefits that are associated with aggregate gains in human welfare. Healthier individuals are more productive, better at creating and adapting to new technologies, and inclined to invest more in education (Aghion, Howitt, and Murtin 2011). They also have a longer life expectancy and are likely to save more, which feeds back into investment (Zhang et al. 2003). This
relationship holds across and within countries and for numerous measures of health outcomes (Weil 2014). At the macroeconomic level, better health outcomes are associated with higher growth.16 By one estimate, a 1-year improvement in a population’s life expectancy is associated with 4 percent higher output (Bloom, Canning, and Sevilla 2004).
• Educational investment. Education investment gaps relative to the Sustainable Development Goals also remain sizable (UNCTAD 2014). Yet education investment that improves worker skills or reduces skill mismatches can raise worker incomes and productivity, as well as benefit firms. For individual workers, the
16World Bank (2007); Barro (2013); Baker et al. (2014); Barro and Lee (2015).

CHAPTER 3 GLOBAL ECONOMIC PROSPECTS | JANUARY 2017 225
susceptibility to rapid reversals in capital flows and the risks of contagion and full-blown financial crises; a limited influence on global markets combined with time-varying external credit constraints; generally limited ability to borrow internationally in domestic currency; the management of generally large international reserves; and higher degree of pass-through from exchange rate fluctuations to domestic prices (Chinn 2014; Mishra et al. 2014).
average rate of return to another year of schooling is estimated to be a 10 percent increase in their lifetime labor market earnings (Montenegro and Patrinos 2014). For firms, a better match of worker skills to technological needs accelerates firms’ pace of technology absorption and expansion (Winthrop et al. 2013). This is also reflected in the positive impact of education investment on growth in macro-level regressions.17
• Clean energy investment. Progress in achieving the United Nation’s Sustainable Energy for All Initiative objective remains slow (World Bank 2015f). Annual investment in clean energy is estimated to be about one-third of that required to achieve the initiative’s goals. Yet clean energy technologies can generate more employment than traditional energy sources and energy-saving technologies can be productivity-enhancing (Wei, Patadia, and Kammen 2010; Adhvaryu, Kala, and Nyshadham 2016).
Monetary policy
Like fiscal stimulus, monetary policy can boost growth and investment in a cyclical slowdown. The room to employ monetary policy in the short run varies significantly across emerging economies. Most commodity-exporting EMDEs have limited monetary policy space as inflation is already above target (Figure 3.17). A number of commodity-importing EMDEs (especially in Central and Southeastern Europe, and in South and East Asia) have below-target inflation and thus have some room to counteract shocks with further interest rate cuts. However, this room may narrow once monetary policy tightens in major advanced economies.
EMDEs typically have less developed financial systems than AEs, which limits the transmission of monetary policy. EMDE policymakers face a variety of challenges that differ significantly from those facing their counterparts in AEs: a
FIGURE 3.17 Fiscal and monetary policy space
Elevated debt and wide fiscal deficits restrict the use of counter-cyclical
fiscal stimulus in a number of EMDEs. Above-target inflation, especially in
many commodity-exporting EMDEs, constrains the use of monetary
stimulus.
B. Gap between inflation and inflation
target
A. Government debt and fiscal
balance
Sources: Central Banking News, Haver Analytics, International Monetary Fund. A. “Balance” stands for fiscal balance and reflects the unweighted average of 89 commodity-exporting and 62 commodity-importing EMDEs. “Debt” stands for general government debt and reflects unweighted average gross government debt of 86 commodity-exporting and 61 commodity-importing EMDEs. B. Figure includes 22 commodity-exporting and 18 commodity-importing countries with a stated inflation target and for which current inflation data is available. Latest observation is for Nov 2016.
-10
-5
0
5
10
15
20
25
Apr-16 Jul-16 Latest Apr-16 Jul-16 Latest
Commodity exporters Commodity importers
Range Median MeanPercentage points
-8
-6
-4
-2
0
2
4
6
2007 2010 2016
Balance (LHS)
Commodityexporters
Commodityimporters
Percent of GDP
0
10
20
30
40
50
60
2007 2010 2016
Debt (RHS)
Percent of GDP
17By one estimate, 1 additional year of male upper-level schooling can raise growth by 1.2 percentage points per year (Barro 2013). Jones (2003) theoretically shows how educational attainment can be interpreted as an investment rate.
FIGURE 3.18 Infrastructure, education, and health
investment needs
Substantial gaps in infrastructure, education, and health investment needs
remain across the world.
B. Investment gaps in reaching SDG A. Global infrastructure investment
gap
Sources: UNCTAD (2014), World Bank (2016b), World Bank estimates. A. The figure shows global investment in infrastructure (as percent of GDP) required over 2015-30, as projected by McKinsey Global Institute. B. Investment refers to capital expenditure. Upper bounds for the estimated investment needs are reported. Red column denotes 2014 or latest available year. SDG refers to the United Nation’s Sustainable Development Goals.
0
400
800
1,200
1,600
Po
we
r
Tra
nsp
ort
Te
leco
ms
Wate
r an
dS
anita
tion
Fo
od
se
curity
Clim
ate
chan
ge
He
alth
Ed
uca
tion
Investment gap, average 2015-30
Investment, 2014
US$, billions
1.010.27 0.04 0.12
0.75
0.71
0.58 3.5
Ro
ad
s
Rail
Port
s
Air
po
rts
Po
we
r
Wa
ter
Tele
com
Tota
l
Percent of global GDP

CHAPTER 3 GLOBAL ECONOMIC PROSPECTS | JANUARY 2017 226
Structural reforms
The environment for EMDE investment growth is likely to remain challenging. AE growth is expected to remain subdued (Chapter 1). Commodity prices are forecasted to rise only very gradually as excess supply, accumulated with strong pre-crisis investment in natural resources, is unwound slowly (World Bank 2016a). As monetary policy in AEs is expected to gradually normalize over the next few years, financing conditions could tighten and capital flows to EMDEs may ease. To offset these challenges, sustained improvements in the business climate and labor and product markets are needed to stimulate private investment.
Efforts to increase public investment are most effective in stimulating private investment and growth when implemented in a conducive business environment. Improvements in the business climate can both stimulate investment
(domestic and FDI) and amplify the crowding-in effects of public and foreign direct investment—in addition to indirect benefits through higher growth, less informality, and more dynamic job creation (Didier et al. 2015).18 Business climate improvements include:
• Lower startup costs are associated with higher profitability of incumbent firms, greater investment in information and communications technology, and more beneficial effects of FDI for domestic investment.
• Reforms to reduce trade barriers can encourage FDI and aggregate investment.
• Corporate governance and financial sector reforms can improve the allocation of resources, including capital, across firms and sectors.
• Labor and product market reforms that increase firm profitability can encourage investment.
• Stronger property rights can encourage corporate and real estate investment.
• Improved access to power supplies can increase firm investment and productivity.
The panel regression aforementioned suggests that past major reform spurts in EMDEs have been associated with higher investment growth. This is also apparent in an event study of large spurts and setbacks in reforms among 97 EMDEs during 1996-2015 (Figure 3.19).19 Details of the approach are discussed in Annex 3.2E. Reform spurts were associated with significantly higher (by more than 4 percentage points) investment growth, on average, in the period of the reform.
Progress in improving business climates has slowed in EMDEs since 2011. During the
18For the linkages between these reform measures and investment growth, see Reinikka and Svensson (2002); Field (2005); Wacziarg and Welch (2008); Schivardi and Viviano (2011); Munemo (2014); Corcoran and Gillanders (2015); Calcagnini, Ferrando, Giombini (2015); and Andrews, Criscuolo and Gal (2015). 19In the period of the Great Moderation, about half of governance spurts occurred in commodity importers.
FIGURE 3.19 Investment and governance reform
Reform spurts are significantly associated with higher investment growth.
Since 2011, improvements in the business climate have continued, but at a
slower pace.
B. Distance to frontier of Ease of
Doing Business A. Growth differentials during reform
spurts and setbacks
Sources: Doing Business Report, World Bank; Worldwide Governance Indicators, World Bank; Haver Analytics; World Economic Outlook, International Monetary Fund. A. The columns show the cumulative investment growth differential of economies during an reform spurt or setback episode, relative to those that experienced neither spurts nor setbacks. Spurt (setback) is defined by a two year increase (decrease) by two standard deviations in one or more of indexes of regulatory quality, government effectivness, rule of law, and control of corruption. Differentials are based on estimates from a panel data regression with time and country fixed effects. The sample includes 75 reform spurt episodes and 71 reform setback episodes among 97 EMDEs over 1996-2015. The growth differential during reform spurt episodes is significant at the ten percent level. See Annex 3.2E for more details. B. Indicates proximity in score to country with the highest-ranking (best) scores for Ease of Doing Business across all time periods with available data. A higher distance to frontier score (DTF) indicates an easier business environment. Unweighted averages of 117 EMDEs. “Time” refers to the average DTF of the time to start a business, obtain construction permits, connect electricity, registering property, paying taxes, and enforcing contracts. “Cost” refers to the average DTF of the costs to starting a business, connect electricity, registering property, and enforcing contracts. “Procedure” refers to the average DTF of the number of procedures to starting a business, obtain construction permits, connecting electricity, and registering property. Blue column denotes the DTF level in 2004. The red and orange columns denote the change in DTF over the respective periods. Each year denoted refers to June of previous year to June of current year.
0
20
40
60
80
Time Cost Procedure
2004 2005-2010 2011-2016
Distance to frontier score
-6
-3
0
3
6
Reform spurt Reform setback
Growth differential, in percentage points

CHAPTER 3 GLOBAL ECONOMIC PROSPECTS | JANUARY 2017 227
preceding six years, the cost of doing business, compliance times to meet regulations, and the number of regulatory procedures were cut considerably. On average, EMDEs move 6-10 percent closer to best practices in these dimensions. Since 2011, however, improvements have continued in EMDEs but, on average, at a slower pace (Figure 3.19). (That said, some EMDEs, including China and a number of EMDEs in Europe and Central Asia, and Sub-Saharan Africa, have accelerated their improvements in business climates.)
Policymakers in G20 countries have identified nine structural reform priorities. These include promoting trade and investment openness; advancing labor market reform, educational attainment, and skills; encouraging innovation; improving infrastructure; promoting fiscal reform; promoting competition and an enabling environment; improving and strengthening the financial system; enhancing environmental sustainability; and promoting inclusive growth (G20 2016b). Measures that particularly benefit investment include, for example, harmonizing cross-border regulations; easing or simplifying product market regulations; and leveling the playing field between private and state-owned enterprises (G20 2015). In addition, public investment is to be complemented by measures to strengthen private investment (e.g., promotion of participation of private investors in public-private partnerships).
Trade and integration agreements can demonstrate a binding commitment to reforms that will have the collateral benefit of improving the investment climate (Kose et al. 2009; Mody and Murshid 2005). Under an enhanced investment climate, stronger investment would also improve trade flows, as investment weakness has been a major driver of the recent slowdown in global trade. Regional trade agreements can help lower nontariff barriers and, thus, encourage FDI and deepen supply chain integration (World Bank 2016a; Petri and Plummer 2016). To be sustainable, these agreements need to be supported by measures to compensate vulnerable groups of society that could be adversely affected.
Conclusions
Relative to double-digit highs before the global financial crisis, investment growth in EMDEs has slowed considerably and steadily, from 10 percent in 2010 to 3.4 percent in 2015. The most pronounced slowdowns have taken place in BRICS and in commodity-exporting EMDEs. Investment growth is now below its long-term average in the largest number of EMDEs over the past quarter century, except during periods of serious global downturns. Long-term investment growth expectations have repeatedly been scaled back, possibly in recognition of considerably slower post-crisis output growth prospects, with knock-on effects on investment.
Slowing domestic activity, deteriorating terms of trade (for commodity exporters), rising private sector debt burdens, growing uncertainty, and slowing FDI inflows (for commodity importers) have contributed to the slowdown in investment growth. This contrasts with investment growth in AEs, which has been anemic largely on account of weak activity and softening growth prospects.
Policies to address the EMDE investment weakness include both direct and indirect measures. Public investment directly lifts overall investment, and improvements in its delivery increase its benefits to growth. It can also foster private investment, at least in the presence of economic slack, sizable infrastructure needs, and sound governance. Finally, public investment may have the collateral benefit of reducing income inequality. More indirectly, cyclical and structural policies to strengthen growth prospects—a key driver of investment—stimulate investment. These may include cyclical stimulus in countries where activity is weak for cyclical reasons and which have the available policy space. Most importantly, structural reforms to improve governance could encourage investment, foreign direct investment, and trade, and thereby improve longer-term growth prospects.

CHAPTER 3 GLOBAL ECONOMIC PROSPECTS | JANUARY 2017 228
ANNEX 3.1 Determinants of investment:
Empirical framework
Framework. As in Hall and Jorgenson’s (1967) seminal work, private investment is modelled as the level of private investment Ip chosen such that the marginal return on capital (MPK) equals the cost of capital, which consists of the real interest rate r and the rate of depreciation of capital (δ):
MPK = r + δ
As a result, private investment Ip also depends on the determinants of the marginal product of capital—especially total factor productivity TFP, the existing stock of private capital Kp, and the availability of complementary public capital Kg. In the presence of uncertainty, the cost of capital include a risk premium π :
Ip = I
p(TFP, K
g, K
p, r, π , δ)
Higher cost of capital—whether due to higher risk premia or higher risk-free real interest rates—would reduce investment, whereas higher productivity and complementary public capital would raise it. In the data used in this study, the distinction between private and public capital is not available for a broad set of countries. Hence, the analysis is based on aggregate investment I, including both private and public investment.
I = I(TFP, K, r, π , δ)
The investment growth regression employed in the chapter includes explanatory variables as proxies for elements of this equation. The returns to capital (MPK) are proxied by output growth and terms of trade growth. The risk premium is proxied by measures of political uncertainty and financial market uncertainty. The cost of financing investment is proxied by FDI inflows, private credit, and the business climate.
These explanatory variables are also used in an extensive literature that has examined the determinants of investment growth. These include weak output growth, the terms-of-trade shocks caused by the slide in commodity prices since
2011, slow FDI flows, and intermittent bouts of political and policy uncertainty.
Weak output growth. The weakness in investment growth has coincided with weakness in output growth and a deteriorating growth outlook for EMDEs (Didier et al. 2015). The growth slowdown in EMDEs has reflected both structural factors and cyclical components. Weak growth prospects signal reduced opportunities for firms selling their goods and services and thus lead to lower investment. This is captured in the “accelerator model,” which assumes that firms aim to maintain a constant capital-to-output ratio, in line with their expectations of future output growth (Jorgenson 1963; Jorgenson and Siebert 1968). Recent work on advanced economies has shown that output growth captures broad trends in investment, but actual investment often falls short of the model predictions.1 In the regression, weak growth prospects are proxied by lagged output growth to reduce concerns about endogeneity.2
Terms of trade movements. Sharp decreases in commodity prices have caused large post-crisis swings in terms of trade (Baffes et al. 2015). Terms of trade developments shape growth prospects for both commodity exporters and importers. In commodity-exporting economies, the terms of trade movements are dominated by commodity price fluctuations. Weaker terms of trade decreases return to investment, especially in commodity-related projects, and, by reducing firms’ net worth, tighten their financial constraints.
1Lewis et al. (2014); Barkbu et al. (2015); Banerjee, Kearns, and Lombardi (2015); and Leboeuf and Fay (2016). 2Ideally, growth prospects would be captured by forecasts for several years ahead. However, these are highly endogenous to investment and highly correlated with FDI inflows. Alternatively, a truly exogenous source of output growth would be used, such as changes in public investment. However, the available panel data on public and private investment are sparse to conduct a panel regression. Some authors include measures of foreign demand into similar types of panel regressions. However, when included here, export growth is insignificant as its effect is captured by domestic output growth.

CHAPTER 3 GLOBAL ECONOMIC PROSPECTS | JANUARY 2017 229
Debt overhang. Elevated private debt may have an adverse impact on firms’ investment for two reasons. First, since the benefits from investment are shared between the owner and the creditors of leveraged firms, high debt can discourage investment; and, second, high debt may reflect misallocation of capital to less innovative firms. This adverse effect is particularly pronounced for investment in an environment of weak growth prospects and in investment in long-lived assets, including real estate.3 The regression includes the lagged private sector credit-to-GDP ratio to proxy for household and firm debt burdens and the square of the lagged private sector credit-to-GDP ratio to capture the balance between beneficial effects of financial deepening and the adverse effects of debt overhang.
Reduced FDI inflows. FDI inflows can lift growth both by financing investment and by acting as catalyst for additional, domestically-financed investment. FDI may also have indirect, productivity-enhancing “collateral” benefits (Kose et al. 2009). These include pressures for better institutions, financial development, and more stabilizing macroeconomic policies. The absorption by domestic firms of the new technology, or managerial practices, introduced by FDI can stimulate domestic investment, provided financing is available. Forays into new export markets by domestic firms, encouraged by FDI, may require up-front investment. To fully harness the benefits of FDI for investment, however, a set of conducive initial conditions are necessary. These include a sufficiently skilled labor force that can readily adopt new technologies, a developed financial system that can readily finance productive new investment, sound institutions that facilitate firm startup and market entry and exit, and open trade regimes that encourage investment in industries with a comparative advantage.4 The regression includes the change in
FDI inflows into the reporting economy (in percentage points of GDP) as a proxy for external financing sources of investment.5
Business climate and reforms. A number of studies have highlighted the importance of the institutional environment for investment. Post-crisis, private investment recovered faster in countries with more developed financial market infrastructure, and higher institutional quality (e.g., governance quality) has been associated with higher investment.6 To capture the business climate, a dummy variable is included for large reforms (two standard deviation improvements) captured in one of four governance indicators (regulatory quality, government effectiveness, rule of law, and control of corruption). The World Governance Indicators are typically highly persistent over time. Hence, much of their cross-country variability is captured by the country fixed effects. Therefore, the regression analysis here focuses on periods in which there are large, statistically significant improvements (two standard deviations) in any two-year period.7
Policy uncertainty. When firms are uncertain about future demand and future policies, their expected risk-adjusted returns may not exceed the costs of capital or the returns on liquid financial assets. This may make firms unwilling to commit to irreversible physical investment, a result found in a number of firm-level studies on advanced economies. In macroeconomic studies, the uncertainty generated by political risk has been shown to weigh on investment (Box 3.2).8 The regression includes, as proxy for political stability, the International Country Risk Guide (ICRG) political stability rating. A higher index indicates greater political stability. The ICRG political risk index is a weighted average of ratings of
3For arguments based on shared benefits from investment, see Myers (1977); Whited (1992); Occhino and Pescatori (2010); and Kalemli-Ozcan, Laeven and Moreno (2015). For misallocation arguments, see Lamont (2002); Hennessy (2004); Borio et al. (2015); Ollivaud, Guillemette and Turner (2016); and Melzer (forthcoming). 4Borensztein, Gregorio and Lee (1998); Bengoa and Sanchez-Robles (2003); Kohpaiboon (2003); Alfaro et al. (2004); Busse and Groizard (2008); Kose, et al. (2009); Azman-Saini, Law, and Ahmad (2010); and Azzimonti (2016).
5Ideally, non-FDI capital inflows would be included. However, this would reduce the sample size by one-third because of poor data availability pre-crisis. 6Mauro (1995); World Bank (2005); Everhart, Martinez-Vazquez and McNab (2009); Morrissey and Udomkerdmongkol (2012); Lim (2014); and Qureshi, Diaz-Sanchez, and Varoudakis (2015). 7A similar variable can be constructed for major reform setbacks. However, when a dummy variable for such setbacks is included in the regression the estimated coefficient is insignificant. 8Alesina and Perotti (1996); Bloom, Bond, and Van Reenen (2007); Gilchrist, Sim, and Zakrajsek (2014); Julio and Yook (2012); IFC (2016b).

CHAPTER 3 GLOBAL ECONOMIC PROSPECTS | JANUARY 2017 230
government stability, socioeconomic conditions, investment profile, corruption, the role of military in politics, law and order, external and internal conflict, religious and ethnic tensions, democratic accountability, and bureaucratic quality.
Data. Data sources are drawn from Haver Analytics, World Bank’s World Development Indicators, Oxford Economics, as well as the International Monetary Fund. Investment growth denotes the annual growth rate of real gross fixed capital formation. In instances where data on gross fixed capital formation are not available, gross capital formation is used as a proxy.
Methodology. A fixed effects panel regression is used to estimate the correlates of investment growth in 73 EMDEs with populations above 3 million for the period 1998-2015. The econometric framework is similar to that of Nabar and Joyce (2009). However, the focus in this chapter is on investment growth, as a critical component of overall output growth (ultimately, the source of rising living standards), rather than changes in the investment-to-GDP ratio that would only capture changes in investment growth relative to output growth. This is in line with recent studies on advanced economies (Banerjee,
Kearns and Lombardi 2015; Bussiere, Ferrara, and Milovic 2016; Barkbu et al. 2015; Kothari, Lewellen, and Warner 2015) or for individual EMDEs (Anand and Tulin 2014). The results are shown in Annex Table 3.1.1. The regressions control for sudden stops in capital inflows and for country-fixed effects. Since several sudden stops occurred during global recessions and slowdowns, they also capture the impact of these episodes.
Robustness. The choice of these explanatory variables is confirmed by a Bayesian Model Averaging approach (Annex Table 3.1.2). The results are broadly robust across subsamples, to the inclusion of event dummies such as for periods of large political risk events, and to the inclusion of five-year-ahead growth forecasts as additional explanatory variables. An alternative estimation technique, generalized method of moments, yields similar estimates. The results are also robust to the use of private investment growth (for a subset of countries and years) as the dependent variable. The analysis here employs a parsimonious specification to reduce collinearity between explanatory variables. However, the results are broadly robust to controlling for lagged public debt, squared lagged public debt, subcomponents of the ICRG index, and terms of trade volatility.

CHAPTER 3 GLOBAL ECONOMIC PROSPECTS | JANUARY 2017 231
(1) (2) (3) (4) (5) (6)
VARIABLES EMDE EMDE:
including political risk events
GMM 5-year-ahead
forecasts AE
Private investment
Lagged real GDP growth (percent)
0.429** [0.163]
0.415** [0.164]
0.441*** [0.168]
1.717 [1.219]
0.829*** [0.157]
0.381** [0.186]
Change in FDI inflows (percentage points of GDP)
0.605** [0.269]
0.602** [0.271]
0.468** [0.232]
0.179 [0.158]
0.145*** [0.049]
0.997*** [0.342]
Political stability 0.473*** [0.138]
0.405*** [0.140]
0.297** [0.145]
0.602*** [0.172]
0.017 [0.116]
0.509*** [0.181]
Lagged credit to GDP ratio (percent of GDP)
-0.095 [0.072]
-0.126* [0.074]
-0.217** [0.098]
-0.092 [0.096]
-0.029 [0.053]
0.018 0.079]
Lagged credit to GDP ratio, squared -0.001** [0.000]
-0.001* [0.001]
0.001 [0.001]
-0.002*** [0.000]
-10e-5 [0.000]
-0.002*** [0.000]
Terms of trade growth (percent)
0.131*** [0.037]
0.132*** [0.035]
0.133*** [0.032]
0.277*** [0.069]
0.026 [0.119]
-0.093 [0.061]
Large reform spurt 4.503** [2.223]
4.266* [2.232]
2.862* [1.727]
3.607 [3.232]
-0.149 [1.028]
6.831* [3.744]
Large deterioration in political stability
-3.854** [1.526]
Sudden stop dummy -4.094*** [1.544]
-4.059** [1.544]
-5.381*** [1.220]
-7.495** [2.664]
-4.543*** [0.901]
-7.151*** [1.703]
Constant -19.315** [9.450]
-13.811 [9.585]
-7.974 [8.822]
-33.95*** [9.765]
3.162 [9.781]
-22.974* [11.804]
Observations 1,098 1,092 1,098 327 411 809
R-squared 0.126 0.136 0.270 0.272 0.128
Number of countries 73 73 73 20 26 59
ANNEX TABLE 3.1.1 Correlates of investment growth
Note: Results of a panel regression with country fixed effects for 73 EMDEs during 1998-2015. Column (1) denotes the baseline regression. All coefficient estimates (except that for the squared credit-to-GDP ratio) are expected to be positive; the coefficient estimate for the squared credit-to-GDP ratio is expected to be negative. Column 2 controls for episodes of large deterioration in political stability, as defined by two standard deviation below the historical mean. GMM stands for generalized methods of moments. Column 4 replaces five-year ahead forecasts for lagged growth. AE stands for advanced economies. For the GMM regression in Column (3), the Wald chi square statistic is 84.25. Column (6) replaces dependent variable with private investment growth. Robust standard errors in brackets. *** p<0.01, ** p<0.05, * p<0.1.
ANNEX TABLE 3.1.2 Robustness: Bayesian Model averaging
Dependent variable: Investment growth (1) (2)
Lagged real GDP growth (percent) 0.558 [1.00]
Change in FDI inflows (percentage points of GDP) 0.703 [1.00]
Political stability 0.126 [0.83]
Lagged credit to GDP ratio (percent of GDP) -0.067 [0.81]
Terms of trade growth (percent) 0.154 [0.99]
Large reform spurt 3.017 [0.53]
Sudden stop dummy -3.777 [0.84]
Constant -1.116 [1.00]
Observations 1,098
Note: Estimation results are based on Bayesian Model Averaging. The sample is the same as in Annex Table 3.1.1. Column 1 denotes coefficients. Column 2 denotes probability of inclusion in brackets.

CHAPTER 3 GLOBAL ECONOMIC PROSPECTS | JANUARY 2017 232
ANNEX 3.2 Definitions and methodology
A. Investment-less credit booms
Data for the broadest definition of credit are provided by the Bank for International Settlements for 14 EMDEs from 1980 to 2015(Argentina, Brazil, China, Hungary, India, Indonesia, Malaysia, Mexico, Poland, Russia, Saudi Arabia, South Africa, Thailand, and Turkey).
For other EMDEs, where credit from the domestic banking system remains the main source of credit (Ohnsorge and Yu 2016), annual data on claims by banks on the private sector, provided by the IMF’s International Financial Statistics, are used as proxies for credit to the nonfinancial private sector. This broadens the sample by another 41 countries, mainly from 2000 onwards. These include Azerbaijan, Bahrain, Bangladesh, Bulgaria, Bolivia, Botswana, Colombia, Chile, Costa Rica, Cote d’Ivoire, Croatia, Egypt, Gabon, Georgia, Ghana, Guatemala, Honduras, Jamaica, Jordan, Kazakhstan, Kenya, Kuwait, Mauritius, Mongolia, Namibia, Nigeria, Oman, Pakistan, Philippines, Panama, Paraguay, Peru, Qatar, Senegal, Serbia, Tunisia, Sri Lanka, Ukraine, Uruguay, República Bolivariana de Venezuela, and Zambia.
Advanced economies (AEs) included in the sample are Australia; Austria; Belgium; Canada; Denmark; Finland; France; Germany; Greece; Hong Kong SAR, China; Ireland; Israel; Italy; Japan; Republic of Korea; Luxembourg; Netherlands; New Zealand; Norway; Portugal; Singapore; Spain; Sweden; Switzerland; United Kingdom; and United States.
B. Implications of rising uncertainty on investment in EMDEs
To assess the role of uncertainty for EMDE investment during 1998Q1-2016Q2, aggregate vector autoregressive models for 18 EMDEs are applied. Given limited data availability, the sample varies for each indicator of uncertainty. Therefore, a series of separate vector autoregressive models are
estimated. The results are statistically significant within the usual 16-84 percent confidence bands.
The sample includes 18 EMDEs with available data for key quarterly macroeconomic indicators and stock market indexes: Brazil, Bulgaria, Chile, Costa Rica, Hungary, India, Indonesia, Malaysia, Mexico, Paraguay, Peru, Philippines, Poland, Romania, Russia, South Africa, Thailand, and Turkey. The literature on uncertainty often uses the option-induced volatility measure VXO (e.g., Bloom 2009) or rich monthly macro-data (279 macro and financial series in the case of Jurado, Ludvigson, and Ng 2015) to construct uncertainty measures. However, for many EMDEs, such measures cannot be constructed.
There are two sources of uncertainty: domestic and global.
• Global uncertainty is captured by financial market and policy uncertainty in the United States and the European Union (EU). Financial market uncertainty is proxied by the VIX for the United States and by the standard deviation of daily stock price changes for the Euro Area. Policy uncertainty is captured by the Economy Policy Uncertainty Index for the United States and the EU.
• Domestic financial market uncertainty is proxied by the standard deviation of daily stock market changes; domestic policy uncertainty is proxied by the ICRG index of political risk or, for Brazil, the Economic Policy Uncertainty Index.
Global uncertainty
Vector autoregressions are used to estimate the impact of global uncertainty on EMDE investment. The data consist of investment-weighted averages for 18 EMDEs for 1998Q1-2016Q2. Endogenous variables follow this Cholesky ordering: global financial market or policy uncertainty, EMDE stock price index; EMDE bond price index, and aggregate real

CHAPTER 3 GLOBAL ECONOMIC PROSPECTS | JANUARY 2017 233
output and investment in EMDEs. Exogenous regressors, included with two lags, are: G7 real GDP growth, world stock price index, and U.S. 10-year bond yields. For the estimation of the impact of EU uncertainty (as measured by the EPU), the sample includes EMDEs in Europe and Central Asia (Bulgaria, Hungary, Poland, Romania, Russia, Turkey).1 The results are statistically significant within the usual 16-84 percent confidence bands.
Domestic uncertainty
Country-specific vector autoregressions are used to estimate the impact of domestic uncertainty on EMDE investment growth. The sample includes data for the same 18 EMDEs as listed above for 1998Q1-2016Q2. The variables include, in this Cholesky ordering: global financial market uncertainty, domestic financial market or political uncertainty, domestic stock prices, short-term interest rates, and domestic real investment. G7 real GDP growth is included as an exogenous regressor to preserve degrees of freedom. The regression is estimated with two lags. The model is adapted from the Bloom (2009) U.S. model, with these changes: employment is dropped due to data constraints, global uncertainty measures are added, and quarterly data replaces monthly data.
For the full sample of emerging market and developing economies, on average, the impact of domestic uncertainty—whether financial or political in nature—is insignificant throughout the forecast horizon. These results are not reported in the text. Data for the International Country Risk Guide variables are quite smooth; a short-term quarterly vector autoregression model therefore struggles to identify any significant correlations. Economic Policy Uncertainty data show more variance for the Brazilian economy; in these cases, the estimated impact of domestic uncertainty (as measured by the EPU) on domestic investment is highly significant.
C. Spillovers from the United States, the Euro Area, and China
In order to quantify spillovers from an output slowdown in the United States and the Euro Area, a Bayesian structural vector autoregression is estimated for 1998Q1–2016Q2, using weighted average data for 18 EMDEs. The sample includes Brazil, Bulgaria, Chile, Costa Rica, Hungary, India, Indonesia, Malaysia, Mexico, Paraguay, Peru, Philippines, Poland, Romania, Russia, South Africa, Thailand and Turkey. The regression includes, in this Cholesky ordering: weighted average output growth in major advanced economies and China (excluding either the United States or the Euro Area), U.S. or Euro Area output growth, proxies for global financial conditions (U.S. 10-year sovereign bond yield and JP Morgan’s EMBI index), and aggregate output growth or investment growth in EMDEs (excluding China). To conserve degrees of freedom, oil price growth is included as an exogenous regressor in the model.
A similar estimation is applied to estimate the impact of a slowdown in China’s output or investment growth on EMDE output growth. The regression includes, in this Cholesky ordering: weighted average output growth in major advanced economies, proxies for global financial conditions (U.S. 10-year sovereign bond yield and JP Morgan’s EMBI index), China’s output growth or China’s non-investment growth and China’s investment growth, and output growth in EMDEs (excluding China). The oil price is again included as exogenous regressor.
D. Crowding-in of private investment by public investment
A vector autoregression is conducted to estimate crowding-in of private investment by public investment for eight EMDEs with available data for 1998Q1-2016Q2. A decomposition of investment into private and public investment is only available for a restricted sample of EMDEs. The sample includes Bulgaria, Czech Republic, Hungary, Mexico, Poland, Romania, Slovak Republic, and Turkey. These countries are highly open and rank above the EMDE average in the
1A similar estimation for other EMDEs yielded insignificant results, likely reflecting weaker trade and financial links with the EU.

CHAPTER 3 GLOBAL ECONOMIC PROSPECTS | JANUARY 2017 234
World Bank Doing Business indicators. Variables included are, in this ordering: real government investment, real GDP, real private investment, current account balance, and the real effective exchange rate. The results are statistically significant within the usual 16-84 percent confidence bands.
E. Investment growth and reforms
Values in columns of Figure 3.19 are based on a panel data regression in which the dependent variable is real investment growth. A spurt (setback) is defined as a two-year increase (decrease) by two standard deviations in one or more of the following four measures of the Worldwide Governance Index (WGI): regulatory quality, government effectiveness, rule of law, and control of corruption. The WGI indicators are principal components of a wide range of survey-based and other indicators. For each index, the standard deviation is measured as the average of the standard errors of the WGI Index in the beginning and at the end of each two-year interval. Episodes in which there were improvements in one measure and simultaneous setbacks in another are excluded. The sample spans 97 EMDEs over 1996‐2015, and excludes EMDEs with populations less than 3 million.
Let t denote the end of a two-year spurt or setback. The coefficients are dummy variables for spurts and setbacks over the [t-3, t+2] window around these episodes. In Figure 3.19, “Reform” denotes the t=[-1,0] window (i.e., around the two years of improvement/deterioration). All coefficients show the investment growth differential of economies during an episode compared to those that experienced neither improvements nor setbacks. All estimates include time-fixed effects to control for global common shocks and country-fixed effects to control for time‐invariant heterogeneity at the country‐level. Robust standard error estimates during the reform spurt window are jointly significant at the ten percent level (Annex Table 3.2.1).
Dependent variable: investment growth
t-3 -1.52
(2.74)
t-2 -2.67
(2.37)
t-1 0.84
(2.69)
Period t of reform spurt 4.58**
(2.01)
t+1 2.32
(2.37)
t+2 -0.46
(2.96)
s-3 -2.33
(3.58)
s-2 -1.05
(2.18)
s-1 -1.81
(2.86)
Period s of reform setback -2.17
(2.56)
s+1 -2.02
(2.83)
-0.78
(2.97)
Observations 1,582
R-squared 0.127
s+2
ANNEX Table 3.2.1 Investment growth around
governance reform spurts and setbacks
Note: The regression includes time and country fixed effects. t indicates the period of the significant reform spurt, s the period of the significant reform setback as defined in Annex E. Robust standard errors in parentheses. *** p<0.01, ** p<0.05, * p<0.1.

CHAPTER 3 GLOBAL ECONOMIC PROSPECTS | JANUARY 2017 235
References
Abiad, A., D. Furceri, and P. Topalova. 2015. “The Macroeconomic Effects of Public Investment: Evidence from Advanced Economies.” Working Paper 15/95. International Monetary Fund, Washington, DC.
Adhvaryu, A., N. Kala, and A. Nyshadham. 2016. “The Light and the Heat: Productivity Co-benefits of Energy-Saving Technology.” Private Enterprise Development in Low-Income Countries (PEDL) Research Note 1775, Department for International Development, London.
Aghion, P., P. Howitt, and F. Murtin. 2011. “The Relationship between Health and Growth: When Lucas Meets Nelson-Phelps.” Review of Economics and Institutions 2 (1): 1-24.
Ahuja, A., and M. Nabar. 2012a. “The Spillover Effects of a Downturn in China’s Real Estate Investment.” Working Paper 12/266, International Monetary Fund, Washington, DC.
Ahuja, A., and M. Nabar. 2012b. “Investment-Led Growth in China: Global Spillovers.” Working Paper 12/267, International Monetary Fund, Washington, DC.
Albino-War, M., S. Cerovic, J. C. Flores, K. Javier, H. Qu, Y. Said, and B. Shukurov. 2014. “Making the Most of Public Investment in MENA and CCA Oil-Exporting Countries.” IMF Staff Discussion Note. International Monetary Fund, Washington, DC.
Alesina, A., and R. Perotti. 1996. “Income Distribution, Political Instability, and Investment.” European Economic Review 40 (6): 1203-1228.
Alfaro, L., A. Chanda, S. Kalemli-Ozcan, and S. Sayek. 2004. “FDI and Economic Growth: The Role of Local Financial Markets.” Journal of International Economics 64(1): 89–112.
Alfaro, L. and E. Hammel. 2007. “Capital Flows and Capital Goods.” Journal of International Economics 72 (1): 128–150.
Anand, R. and V. Tulin. 2014. “Disentangling India’s Investment Slowdown.” Working Paper 14/47, International Monetary Fund, Washington, DC.
Andrews, D., C. Criscuolo, and P. N. Gal. 2015. “Frontier Firms, Technology Diffusion and Public Policy: Micro Evidence from OECD Countries.” Productivity Working Paper 2015-02, Organisation for Economic Co-operation and Development, Paris.
Arena, M., S. Bouza, E. Dabla-Norris, K. Gerling, and L. Njie. 2015. “Credit Booms and Macroeconomic Dynamics: Stylized Facts and Lessons for Low-Income Countries.” Working Paper 15/11, International Monetary Fund, Washington, DC.
Aschauer, D. 1989. “Is Public Expenditure Productive?” Journal of Monetary Economics 23 (2): 177-200.
Azman-Saini, W., S. Law, and A. Ahmad. 2010. “FDI and Economic Growth: New Evidence on the Role of Financial Markets.” Economics Letters 107(2): 211-213.
Azzimonti, M. 2016. “The Politics of FDI Expropriation.” Working Paper 22705, National Bureau of Economic Research, Cambridge, MA.
Baffes, J., M. A. Kose, F. Ohnsorge, and M. Stocker. 2015. “The Great Plunge in Oil Prices: Causes, Consequences, and Policy Responses.” Policy Research Note 1, World Bank, Washington DC.
Bahal, G., M. Raissi, and V. Tulin. 2015. “Crowding-Out or Crowding-In? Public and Private Investment in India.” Working Paper 15/264. International Monetary Fund, Washington, DC.
Bailey, M., J. Manyika, and S. Gupta. 2013. U.S. Productivity Growth: An Optimistic Perspective. Washington, DC: Brookings Institution.
Baker, S., N. Bloom, and S. J. Davis. 2016. “Measuring Economic Policy Uncertainty.” Quarterly Journal of Economics 131(4): 1593-1636.

CHAPTER 3 GLOBAL ECONOMIC PROSPECTS | JANUARY 2017 236
Baker, S., N. Bloom, B. Canes-Wrone, S. J. Davis, and J. Rodden. 2014. “Why Has U.S. Policy Uncertainty Risen Since 1960?” American Economic Review, Papers & Proceedings 104 (5): 56-60.
Banerjee, R., J. Kearns, and M. Lombardi. 2015. “(Why) Is Investment Weak?” BIS Quarterly Review, March. Bank for International Settlements, Geneva.
Barkbu, B., S. P. Berkmen, P. Lukyantsau, S. Saksonovs, and H. Schoelermann. 2015. “Investment in the Euro Area: Why Has It Been Weak?” Working Paper 15/32, International Monetary Fund, Washington, DC.
Barro, R. J. 2013. “Health and Economic Growth.” Annals of Economics and Finance 14 (2): 329-366.
Barro, R., and J.-W. Lee. 2015. Education Matters Global Schooling Gains from the 19th to the 21st Century. Oxford: Oxford University Press.
Bengoa, M., and B. Sanchez-Robles. 2003. “Foreign Direct Investment, Economic Freedom and Growth: New Evidence from Latin America.” European Journal of Political Economy 19: 529-545.
Blanchard, O. J., and L. Katz. 1999. “Wage Dynamics: Reconciling Theory and Evidence”. NBER Working Paper 6924, National Bureau of Economic Research, Boston.
Bloom, D., D. Canning, and J. Sevilla. 2004. “The Effect of Health on Economic Growth: A Production Function Approach.” World Development 32 (1): 1–13.
Bloom, N. 2009. “The Impact of Uncertainty Shocks.” Econometrica 77 (3): 623-685.
Bloom, N., S. Bond, and J. van Reenen. 2007. “Uncertainty and Investment Dynamics” Review of Economic Studies 74: 391-415.
Bloomfield, P. 2006. “The Challenging Business of Long-Term Public–Private Partnerships: Reflections on Local Experience.” Public Administration Review 66 (3): 400-411.
Bom, P. R. D., and J. E. Ligthart. 2014. “What Have We Learned From Three Decades of Research on the Productivity of Public Capital?” Journal of Economic Surveys 28 (5): 889–916.
Borensztein, E., J. D. Gregorio, and J.-W. Lee. 1998. ‘‘How Does Foreign Direct Investment Affect Growth?’’ Journal of International Economics 45 (1): 115–135.
Borio, C., E. Karroubi, C. Upper, and F. Zampolli. 2015. “Labour Reallocation and Productivity Dynamics: Financial Causes, Real Consequences.” BIS Working Papers 534. Bank for International Settlements, Basel.
Bourreaua, M., C. Cambinib, and P. Doğanc. 2012. “Access Pricing, Competition, and Incentives to Migrate from ‘Old’ to ‘New’ Technology.” International Journal of Industrial Organization 30 (6): 713-723.
Brynjolfsson, E., and A. McAfee. 2011. Race Against the Machine: How the Digital Revolution is Accelerating Innovation, Driving Productivity, and Irreversibly Transforming Employment and the Economy. Lexington: Digital Frontier Press.
Buffie, E. F., A. Berg, C. Pattillo, R. Portillo, and L-F. Zanna. 2012. “Public Investment, Growth, and Debt Sustainability: Putting Together the Pieces.” Working Paper 12/144. International Monetary Fund, Washington, DC.
Busse, M., and J. L. Groizard. 2008. “Foreign Direct Investment, Regulations and Growth.” The World Economy 31: 861–886.
Bussiere, M., L. Ferrara, and J. Milovich. 2016. “Explaining the Recent Slump in Investment: The Role of Expected Demand and Uncertainty.” IMF Research Bulletin 17 (1): 1-3.
Bussolo, M., J. Koettl, and E. Sinnott. 2015. Golden Aging : Prospects for Healthy, Active, and Prosperous Aging in Europe and Central Asia. Washington, DC: World Bank.
Calcagnini, G., A. Ferrando, and G. Giombini. 2015. “Multiple Market Imperfections, Firm Profitability and Investment.” European Journal of Law and Economics 40 (1): 95-120.

CHAPTER 3 GLOBAL ECONOMIC PROSPECTS | JANUARY 2017 237
Calderón, C., and L. Servén. 2014. “Infrastructure, Growth, and Inequality: An Overview.” Policy Research Working Paper 7034. World Bank, Washington, DC.
Calderón, C., E. Moral-Benito, and L. Servén. 2015. “Is Infrastructure Capital Productive? A Dynamic Heterogeneous Approach.” Journal of Applied Econometrics 30 (2): 177–98.
Carrière-Swallow, Y., and L. F. Céspedes. 2013. “The Impact of Uncertainty Shocks in Emerging Economies.” Journal of International Economics 90 (2): 316-325.
Caselli, F. 2005. “Chapter 9 Accounting for Cross-Country Income Differences.” Handbook of Economic Growth, Vol 1(A): 679-741.
Caselli, F., P. Pagano, and F. Schivardi. 2003. “Uncertainty and the Slowdown in Capital Accumulation in Europe.” Applied Economics 35: 79-89.
Cavallo, E., and C. Daude. 2011. “Public Investment in Developing Countries: A Blessing or a Curse?” Journal of Comparative Economics 39 (1): 65–81.
Cerra, V., A. Cuevas, C. Goes, I. Karpowicz, T. Matheson, I. Samake, and S. Vtyurina. 2016. “Highways to Heaven: Infrastructure Determinants and Trends in Latin America and the Caribbean.” Working Paper 16/185, International Monetary Fund, Washington, DC.
Chinn, M. D. 2014. “Central Banking: Perspectives from Emerging Economies.” La Follette School of Public Affairs Working Paper Series, No. 2014-006.
Citigroup. 2016. “Urbanization: A Major Driver of Infrastructure Spending.” Citigroup, New York.
Coflan, A. 2016. “China’s State Investment Surge: Stimulus or Statistics?” Rhodium Group Research. http://rhg.com/notes/chinas-state-investment-surge-stimulus-or-statistics.
Colecchia, A., and P. Schreyer. 2002. “ICT Investment and Economic Growth in the 1990s: Is the United States a Unique Case? A
Comparative Study of Nine OECD Countries.” Review of Economics Dynamics 5 (2): 408-442.
Comin, D., and M. M. Ferrer. 2013. “If Technology Has Arrived Everywhere, Why Has Income Diverged?” Working Paper 19010, National Bureau of Economic Research, Cambridge, MA.
Constantinescu, C., A. Mattoo, and M. Ruta. 2015. “The Global Trade Slowdown: Cyclical or Structural?” Working Paper 15/6, International Monetary Fund, Washington, DC.
Constantinescu, C., A. Mattoo, and M. Ruta. 2016. “Does the Global Trade Slowdown Matter?” Policy Research Working Paper 7673, World Bank, Washington, DC.
Corcoran, A., and R. Gillanders. 2015. “Foreign Direct Investment and the Ease of Doing Business.” Review of World Economics 151 (1): 103-26.
Cowen, T. 2011. The Great Stagnation: How America Ate All the Low-Hanging Fruit of Modern History, Got Sick, and Will (Eventually) Feel Better. New York: Dutton.
Czernich, N., O. Falck, T. Kretschmer, and L. Woessmann. 2011. “Broadband Infrastructure and Economic Growth.” The Economic Journal 121: 505–532.
Dabla-Norris, E., J. Brumby, A. Kyobe, Z. Mills, and C. Papageorgiou. 2012. “Investing in Public Investment: An Index of Public Investment Efficiency.” Journal of Economic Growth 17 (3): 235–66.
Dasgupta, B., L. Somik, and N. Lozano-Gracia. 2014. “Urbanization and Housing Investment.” World Bank Policy Research Paper 7110, World Bank, Washington, DC.
Didier, T., M. A. Kose, F. Ohnsorge, and L. S. Ye. 2015. “Slowdown in Emerging Markets: Rough Patch or Prolonged Weakness?” Policy Research Note 4, World Bank, Washington, DC.
Dreger, C., and H. Reimers. 2014. “On the Relationship between Public and Private

CHAPTER 3 GLOBAL ECONOMIC PROSPECTS | JANUARY 2017 238
Investment in the Euro Area.” DIW Berlin Discussion Papers 1365. Berlin, Germany.
ECB (European Central Bank). 2016. “Public Investment in Europe.” ECB Economic Bulletin (2): 1–14. European Central Bank, Frankfurt.
Eden, M., and A. Kraay. 2014. “Crowding in and the Returns to Government Investment in Low Income Countries.” Development Research Group Working Paper 6781. World Bank, Washington, DC.
Elekdag, S., and Y. Wu. 2013. “Rapid Credit Growth in Emerging Markets: Boon or Boom-Bust?” Emerging Markets Finance and Trade 49 (5): 45-62.
Erden, L., and R. G. Holcombe. 2005. “The Effects of Public Investment on Private Investment in Developing Economies.” Public Finance Review 33 (5): 575–602.
Ernst & Young. 2016. Worldwide Corporate Tax Guide. London: Ernst & Young.
Estache, A., and G. Garsous. 2012. “The Impact of Infrastructure on Growth in Developing Countries.” IFC Economics Notes. 1. International Finance Corporation, Washington, DC.
Everhart S., J. Martinez-Vazquez, and R. M. McNab. 2009. “Corruption, Governance, Investment and Growth in Emerging Markets.” Applied Economics 41 (13): 1579-1594.
Feldstein, M. 2008. “Did Wages Reflect Growth in Productivity?” NBER Working Paper 13953, National Bureau of Economic Research, Cambridge, MA.
Fernald, J. G. 1999. “Roads to Prosperity? Assessing the Link between Public Capital and Productivity.” American Economic Review 89 (3): 619‐638.
Ferreira, F. H. G. 1995. “Wealth Distribution Dynamics with Public-Private Capital Complimentarity.” Discussion Paper TE/95/286. London School of Economics and Political Science, London.
Field, E. 2005. “Property Rights and Investment in Urban Slums.” Journal of the European Economic Association 3 (2‐3): 279-290.
Fournier, J.-M., and A. Johansson. 2016. “The Effect of the Size and the Mix of Public Spending on Growth and Inequality.” Economics Department Working Paper 1344. Organisation for Economic Co-operation and Development, Paris.
Freund, C. 2016. “The Global Trade Slowdown and Secular Stagnation.” Peterson Institute of International Economics blog. https://piie.com/blogs/trade-investment-policy-watch/global-trade-slowdown-and-secular-stagnation.
G20. 2015. G20/OECD Report on G20 Investment Strategies. Vol 2. Organisation for Economic Co-operation and Development, Paris.
______. 2016a. “Developments in Investment and Policy Challenges.” Paper for G-20, June. Organisation for Economic Co-operation and Development, Paris.
______. 2016b. G20 Leaders’ Communique, Hangzhou Summit, Sept 4-5.
Getachew, Y. Y. 2010. “Public Capital and Distributional Dynamics in a Two-Sector Growth Model.” Journal of Macroeconomics 32 (2): 606–16.
Gilchrist, S., J. Sim, and E. Zakrajsek. 2014. “Uncertainty, Financial Frictions, and Investment Dynamics.” Working Paper 20038, National Bureau of Economic Research, Cambridge, MA.
Glaeser, E. L. 2008. Cities, Agglomeration and Spatial Equilibrium. Oxford: Oxford University Press.
Gollop, F. M., B. M. Fraumeni, and D. W. Jorgenson. 1987. Productivity and U.S. Economic Growth. Cambridge: Harvard University Press.
Gordon, R. J. 2012. “Is U.S. Economic Growth Over? Faltering Innovation Confronts the Six Headwinds.” Working Paper 18315. National Bureau of Economic Research, Cambridge, MA.
Griliches, Z. 1988. “Productivity Puzzles and R &

CHAPTER 3 GLOBAL ECONOMIC PROSPECTS | JANUARY 2017 239
D: Another Nonexplanation.” Journal of Economic Perspectives 2 (4): 9-21.
Hall, R.E., and C. Jones. 1999. “Economic Growth: A Review Essay.” The Quarterly Journal of Economics 114 (1): 83-116.
Hall, R.E., and D.W. Jorgenson. 1967. “Tax Policy and Investment Behavior.” American Economic Review 57 (3): 391-414.
Hall, R.E. 2016. “Macroeconomics of Persistent Slumps.” NBER Working Paper 22230. National Bureau of Economic Research, Cambridge, MA.
Hennessy, C. 2004. “Tobin's Q, Debt Overhang, and Investment.” Journal of Finance 59 (4): 1717–1742.
Herrera, S., and G. Pang. 2005. Efficiency of Public Spending In Developing Countries: An Efficiency Frontier Approach. Washington, DC: World Bank.
Holtz-Eakin, D., and M. Mandel. 2015. “Dynamic Scoring and Infrastructure Spending.” McGraw Hill Financial Global Institute, New York.
Hong, G.H., J. Lee, W. Liao, and D. Seneviratne. 2016. “China and Asian Global Trade Slowdown.” Working Paper 16/105, International Monetary Fund, Washington, DC.
Hsieh, C.‐T. and P. Klenow. 2010. “Development Accounting.” American Economic Journal: Macroeconomics 2: 207-223.
Huidrom, R., M. A. Kose, and F. Ohnsorge. Forthcoming. “Spillovers from Major Emerging Markets.” Mimeo, World Bank, Washington, DC.
IFC (International Finance Corporation). 2016a. “Global Productivity Slowdown and the Role of Technology Adoption in Emerging Markets.” Note 6, EMCompass. International Finance Corporation, Washington, DC.
IFC (International Financial Corporation). 2016b. “A New Look at the Determinants of Investment in Emerging Markets.” Mimeo, Sept.
30. International Finance Corporation, Washington, DC.
IMF (International Monetary Fund). 2015a. “Private Investment: What’s the Holdup?” Chapter 4, World Economic Outlook, April. Washington, DC: International Monetary Fund.
______. 2015b. People’s Republic of China: Staff Report for the 2015 Article IV Consultation. Washington, DC: International Monetary Fund.
______. 2016. “Global Trade: What’s Behind the Slowdown?” Chapter 2, World Economic Outlook, October. Washington, DC: International Monetary Fund.
Inderst, G. 2016 “Infrastructure Investment, Private Finance, and Institutional Investors: Asia from a Global Perspective.” ADBI Working Paper 555. Asian Development Bank, Manila.
International Energy Agency. 2014. World Energy Investment Outlook – Special Report, Paris: International Energy Agency.
Ismail, N. W., and J. M. Mahyideen. 2015. “The Impact of Infrastructure on Trade and Economic Growth in Selected Economies in Asia.” Working Paper Series 553, Asian Development Bank Institute, Manila.
Jones, C. 2003. “Human Capital, Ideas, and Economic Growth.” In Finance, Research, Education, and Growth, edited by L. Paganetto, and E. Phelps. London: Palgrave McMillian.
Jorgenson, D. 1963. “Capital Theory and Investment Behavior.” American Economic Review 53 (2): 247-259.
______. 1991. “Productivity and Economic Growth,” In Fifty Years of Economic Measurement: The Jubilee of the Conference on Research in Income and Wealth. National Bureau of Economic Research, Cambridge, MA.
Jorgenson, D., and C. D. Siebert. 1968. “Optimal Capital Accumulation and Corporate Investment Behavior.” Journal of Political Economy 76 (6): 1123-1151.

CHAPTER 3 GLOBAL ECONOMIC PROSPECTS | JANUARY 2017 240
Julio, B., and Y. Yook. 2012. “Political Uncertainty and Corporate Investment Cycles.” Journal of Finance 67 (1): 45‐83.
Jurado, K., S. Ludvigson, and S. Ng. 2015. “Measuring Uncertainty.” American Economic Review 105 (3): 1177-1216.
Kalemli-Ozcan, S., L. Laeven, and D. Moreno. 2015. “Debt Overhang in Europe: Evidence from Firm-Bank-Sovereign Linkages.” Unpublished paper, University of Maryland.
Kang, J.S., and W. Liao. 2016. “Chinese Imports: What’s Behind the Slowdown?” Working Paper 16/106, International Monetary Fund, Washington, DC.
Keefer, P. and S. Knack. 2007. “Boondoggles, Rent-Seeking, and Political Checks and Balances: Public Investment under Unaccountable Governments.” The Review of Economics and Statistics 89 (3): 566-572.
Kessides, I. 2004. “Reforming Infrastructure: Privatization, Regulation, and Competition.” Policy Research Report, World Bank, Washington, DC.
Klenow, P., and A. Rodríguez-Clare. 1997. “Economic Growth: A Review Essay.” Journal of Monetary Economics 40: 597-618.
Kohpaiboon, A. 2003. “Foreign Trade Regimes and the FDI-Growth Nexus: A Case Study of Thailand.” Journal of Development Studies 40 (2): 55-69.
Kothari, S. P., J. Lewellen, and J. B. Warner. 2015. “The Behavior of Aggregate Corporate Investment.” MIT Sloan Research Paper 5112-14, MIT, Cambridge.
Kose, M. A., and M. Terrones. 2015. Collapse and Revival: Understanding Global Recessions and Recoveries. Washington, DC: International Monetary Fund.
Kose, M. A., E. Prasad, K. Rogoff, and S. Wei. 2009. “Financial Globalization: A Reappraisal.” IMF Staff Papers 56 (1): 8-62.
Kose, M. A., S. Kurlat, F. Ohnsorge, and N. Sugawara. Forthcoming. “A Cross-Country Database of Fiscal Space.” World Bank Policy Research Working Paper. World Bank, Washington, DC.
Kraay, A. 2014. “Government Spending Multipliers in Developing Countries: Evidence from Lending by Official Creditors.” American Economic Journal: Macroeconomics 6 (4): 170–208.
Kuijs, L. 2016. “Credit and Investment – Problems and Misunderstandings.” Research Briefing-China, Oxford Economics.
Lamont, O. 2002. “Macroeconomic Forecasts and Microeconomic Forecasters.” Journal of Economic Behavior & Organization 48(3): 265-280.
Lardy, N. R., and Z. Huang. 2016. “China Private Investment Softens, But Not as Much as Official Data Suggest.” Peterson Institute for International Economics, Washington, DC. https://piie.com/blogs/china-economic-watch/china-private-investment-softens-not-much-official-data-suggest.
Leboeuf, M., and B. Fay. 2016. “What Is Behind the Weakness in Global Investment?” Staff Discussion Paper 5, Bank of Canada, Ottawa.
Lewis, C., N. Pain, J. Strasky, and F. Menkyna. 2014. “Investment Gaps after the Crisis.” Economics Department Working Paper 1168, Organisation for Economic Co-operation and Development, Paris.
Li, D., N. Magud, and F. Valencia. 2015. “Corporate Investment in Emerging Markets: Financing vs. Real Options Channel.” Working Paper 15/285, International Monetary Fund, Washington, DC.
Lim, J. 2014. “Institutional and Structural Determinants of Investment Worldwide.” Journal of Macroeconomics 41 (C): 160-177.
Magud, N., and S. Sosa. 2015. “Investment in Emerging Markets. We Are Not in Kansas Anymore...Or Are We?” Working Paper 15/77, International Monetary Fund, Washington DC.

CHAPTER 3 GLOBAL ECONOMIC PROSPECTS | JANUARY 2017 241
Mandl, U., A. Dierx, and F. Ilzkovitz. 2008. “The Effectiveness and Efficiency of Public Spending.” European Economy Economic Papers 301. European Commission, Brussels.
Mankiw, N. G. 2012. Macroeconomics. New York: Worth Publishers.
Mauro, P. 1995. “Corruption and Growth.” The Quarterly Journal of Economics 110 (3): 681‐712.
McGowan, M. A., and D. Andrews. 2015. “Labour Market Mismatch and Labour Productivity: Evidence from PIAAC Data.” Economics Department Working Paper 1209, Organisation for Economic Co-operation and Development, Paris.
McKinsey & Company. 2016. “Bridging Global Infrastructure Gaps.” McKinsey & Company, Brussels.
McQuade, P., and M. Schmitz. 2016. “The Great Moderation in International Capital Flows: a Global Phenomenon?” ECB Working Paper 1952, European Central Bank, Frankfurt.
Melzer, Brian. Forthcoming. “Mortgage Debt Overhang: Reduced Investment by Homeowners at Risk of Default.” Journal of Finance.
Mendoza, E., and M. E. Terrones. 2012. “An Anatomy of Credits Booms and their Demise.” Journal Economia Chilena 15 (2): 04-32.
Mishra, P., P. Montiel, P. Pedroni, and A. Spilimbergo. 2014. “Monetary Policy and Bank Lending Rates in Low-income Countries: Heterogeneous Panel Estimates.” Journal of Development Economics 111: 117-131.
Mody, A., and A. P. Murshid. 2005. “Growing Up with Capital Flows.” Journal of International Economics 65 (1): 249-266.
Montenegro, C. E., and H. A. Patrinos. 2014. “Comparable Estimates of Returns to Schooling Around the World.” Policy Research Working Paper 7020, World Bank, Washington, DC.
Morrissey, O., and M. Udomkerdmongkol. 2012. “Governance, Private Investment and Foreign Direct Investment in Developing Countries.”
World Development 40 (3): 437-445.
Munemo, J. 2014. “Business Start-Up Regulations and the Complementarity Between Foreign and Domestic Investment.” Review of World Economics 150 (4): 745-61.
Myers, S. 1977. “Determinants of Corporate Borrowing.” Journal of Financial Economics 5: 147-175.
Mutreja, P., B. Ravikumar, and M. J. Sposi. 2014. “Capital Goods Trade and Economic Development.” Working Paper 2014-012B, Federal Reserve Bank of St. Louis.
Nabar, N., and J. Joyce. 2009. “Sudden Stops, Banking Crises, and Investment Collapses.” Journal of Development Economies 90 (2): 163-189.
Naumov, A. 2016. “Global Investment – The Role of Emerging Markets.” Bank Underground, Bank of England, September 23. https://bankunderground.co.uk/2016/09/23/global-investment-the-role-of-emerging-markets/.
Nordås, H. K., and R. Piermartini. 2004. “Infrastructure and Trade.” WTO Staff Working Paper ERSD-2004-04, World Trade Organization, Geneva.
Occhino, F. and A. Pescatori. 2010. “Debt Overhang and Credit Risk in a Business Cycle Model.” Working Paper 1003, Federal Reserve Bank of Cleveland, Cleveland.
OECD (Organisation for Economic Co-operation and Development). 2015a. “Lifting Investment for Higher Sustainable Growth.” OECD Economic Outlook, 1: 205-279.
______. 2015b. Mapping Channels to Mobilise Institutional Investment in Sustainable Energy. Green Finance and Investment Series. Paris: Organisation for Economic Co-operation and Development.
______. 2016a. Compendium of Productivity Indicators 2016. Paris: Organisation for Economic Co-operation and Development.
______. 2016b. “Global Growth Warning: Weak Trade, Financial Distortions.” Interim Economic

CHAPTER 3 GLOBAL ECONOMIC PROSPECTS | JANUARY 2017 242
Outlook, September. Organisation for Economic Co-operation and Development, Paris.
______. 2016c. “Using the Fiscal Levers to Escape the Low-Growth Trap.” Chapter 2, OECD Economic Outlook, Organisation for Economic Co-operation and Development, Paris.
Ohnsorge, F., and S. Yu. 2016. “Recent Credit Surge in Historical Context.” Policy Research Working Paper 7704, World Bank, Washington, DC.
Ollivaud, P., Y. Guillemette, and D. Turner. 2016. “Links Between Weak Investment and the Slowdown in Productivity and Potential Output Growth Across the OECD.” Working Paper 1304. Organisation for Economic Co-operation and Development, Paris.
Pang, G., and S. Herrera. 2005. “Efficiency of Public Spending in Developing Countries: An Efficiency Frontier Approach.” Policy Research Working Paper 3645. World Bank, Washington, DC.
Pereira, A. M. 2000. “Is All Public Capital Created Equal?” Review of Economics and Statistics 82 (3): 513–18.
Pereira, A. M., and J. M. Andraz. 2013. “On the Economic Effects of Public Infrastructure Investment: A Survey of the International Evidence.” College of William and Mary Department of Economics Working Paper 108. Williamsburg, VA.
Petri, P., and M. Plummer. 2016. “The Economic Effects of the Trans-Pacific Partnership: New Estimates.” Working Paper 16-2, Peterson Institute for International Economics, Washington, DC.
Pongsiri, N. 2002. “Regulation and Public‐Private Partnerships.” International Journal of Public Sector Management 15 (6): 487 – 495.
Presbitero, A. F. 2016. “Too Much and Too Fast? Public Investment Scaling-up and Absorptive Capacity.” Journal of Development Economics (120) 17–31.
Qu, H., and J. Wang. 2016. “China: Why is Private Investment Still Slowing?” In Asian Economics Quarterly Report 19-24. HSBC Global Research, Hong Kong SAR, China.
Qureshi, Z., J. L. Diaz‐Sanchez, and A. Varoudakis. 2015. “The Post‐Crisis Growth Slowdown in Emerging Economies and the Role of Structural Reforms.” Global Journal of Emerging Market Economies 7 (2): 179-200.
Rajaram, A., T. M. Le, N. Biletska, and J. Brumby. 2010. “A Diagnostic Framework for Assessing Public Investment Management.” Policy Research Working Paper 5397, World Bank, Washington, DC.
Reinikka, R., and J. Svensson. 2002. “Coping with Poor Public Capital.” Journal of Development Economics 69: 51-69.
Schivardi, F., and E. Viviano. 2011. “Entry Barriers in Retail Trade.” The Economic Journal 121 (551): 145-170.
Sokoloff, K. L. 1988. “Inventive Activity in Early Industrial America: Evidence from Patent Records, 1790–1846.” The Journal of Economic History 48 (04): 813–850.
St. Aubyn, M., A. Pina, F. Garcia, and J. Pais. 2009. “Study on the Efficiency and Effectiveness of Public Spending on Tertiary Education.” European Economy Economic Papers 390. European Commission, Brussels.
Straub, S. 2011. “Infrastructure and Development: A Critical Appraisal of the Macro-Level Literature.” Journal of Development Studies 47 (5): 683–708.
Summers, L. H. 2014. “Reflections on the ‘New Secular Stagnation Hypothesis’.” In Secular Stagnation: Facts, Causes, and Cures, 27-40. Center for Economic Policy Research. London: UK.
Teulings, C., and R. Baldwin, eds. 2014. Secular Stagnation: Facts, Causes, and Cures. Center for Economic Policy Research. London: UK.
UNCTAD (United Nations Conference on Trade and Development). 2014. “Investment in SDGs:

CHAPTER 3 GLOBAL ECONOMIC PROSPECTS | JANUARY 2017 243
an Action Plan.” World Investment Report. New York: United Nations.
______. 2016. “Investor Nationality: Policy Challenges.” World Investment Report. New York: United Nations.
Wacziarg, R., and K. H. Welch, 2008. “Trade Liberalization and Growth: New Evidence.” The World Bank Economic Review 22 (2): 187-231.
Wagstaff, A., C. Bredenkamp, and L. Buisman. 2014. “Progress Toward the Health MDGs.” Policy Research Working Paper 6894, World Bank, Washington, DC.
Warner, M. A. 2014. “Public Investment as an Engine of Growth.” Working Paper 14/148. International Monetary Fund, Washington, DC.
Wei, M., S. Patadia, and D. Kammen. 2010. “Putting Renewables and Energy Efficiency to Work: How Many Jobs Can the Clean Energy Industry Generate in the U.S.?” Energy Policy 38 (2): 919-931
Weil, D. 2014. “Health and Economic Growth.” Handbook of Economic Growth 2: 623–682.
Whited, T. 1992. “Debt, Liquidity Constraints, and Corporate Investment: Evidence from Panel Data.” Journal of Financial Economics 47 (4): 1425-1460.
Wilson, J. S., C. Mann, and Y. Pau. 2002. “Trade Facilitation: A Development Perspective in the Asia Pacific Region.” Asia Pacific Economic Cooperation, Singapore.
Winthrop, R., G. Bulloch, P. Bhatt, and A. Wood. 2013. Investment in Global Education: a Strategic Imperative for Business. Washington, DC: Brookings Institution.
World Bank. 2005. World Development Report 2005: Better Investment Climate for Everyone. Washington, DC: World Bank.
______. 2007. World Development Report 2007:
Development and the Next Generation. Washington
DC: World Bank.
______. 2009. World Development Report 2009: Reshaping Economic Geography. Washington DC: World Bank.
______. 2015a. Commodities Markets Outlook. World Bank, Washington, DC.
______. 2015b. Having Fiscal Space and Using It. Global Economic Prospects January 2015. Washington, DC: World Bank.
______. 2015c. The Global Economy in Transition. Global Economic Prospects June 2015. Washington, DC: World Bank.
______. 2015d. Development Goals in an Era of Demographic Change. Global Monitoring Report 2015/2016. Washington, DC: World Bank.
______. 2015e. Bangladesh—Public Expenditure Review Update: An Update of Fiscal Trends Based on the 2010 Public Expenditure Review. Washington, DC: World Bank.
______. 2015f. Progress Towards Sustainable Energy 2015. Global Tracking Framework Report. Washington, DC: World Bank.
______. 2016a. Spillovers amid Weak Growth. Global Economic Prospects January 2016. Washington, DC: World Bank.
______. 2016b. Divergences and Risks: Global Economic Prospects June 2016. Washington, DC: World Bank.
______. 2016c. Ethiopia—Public Expenditure Review. Washington, DC: World Bank.
______. 2016d. Mexico—Public Expenditure Review. Washington, DC: World Bank.
______. 2016e. South Asia Economic Focus: Investment Reality Check. World Bank, Washington, DC.
Xing, R., J. Sun, and J. Zheng. 2016. “Five Debates about the Private Investment Slump.” Morgan Stanley Research.
Zhang J., J. Zhang, and R. Lee. 2003. “Rising Longevity, Education, Savings, and Growth.” Journal of Development Economics 70: 83–101.


StatiSticalappendix


STAT IST ICAL APPENDIX GLOBAL ECONOMIC PROSPECTS | JANUARY 2017 247
TABLE 1 Real GDP Growth
Annual estimates and forecastsa Quarterly growthb
2014 2015 2016e 2017f 2018f 2019f 15Q2 15Q3 15Q4 16Q1 16Q2 16Q3e
World 2.7 2.7 2.3 2.7 2.9 2.9 2.8 2.6 2.5 2.2 2.4 2.3
Advanced Economies 1.9 2.1 1.6 1.8 1.8 1.7 2.3 2.1 1.9 1.5 1.7 1.6
United States 2.4 2.6 1.6 2.2 2.1 1.9 3.0 2.2 1.9 1.6 1.3 1.7
Euro Area 1.2 2.0 1.6 1.5 1.4 1.4 2.0 2.0 2.3 1.7 2.3 1.5
Japan 0.3 1.2 1.0 0.9 0.8 0.4 1.8 2.1 1.1 0.4 0.9 1.1
United Kingdom 3.1 2.2 2.0 1.2 1.3 1.3 2.4 1.9 1.7 1.9 2.1 2.3
Emerging Market and Developing Economies
4.3 3.5 3.4 4.2 4.6 4.7 3.9 3.7 3.6 3.6 3.8 3.6
East Asia and the Pacific 6.7 6.5 6.3 6.2 6.1 6.1 6.5 6.5 6.4 6.3 6.4 6.4
Cambodia 7.1 7.0 7.0 6.9 6.9 6.8 .. .. .. .. .. ..
China 7.3 6.9 6.7 6.5 6.3 6.3 7.0 6.9 6.8 6.7 6.7 6.7
Fiji 5.3 4.1 2.4 3.9 3.7 3.5 .. .. .. .. .. ..
Indonesia 5.0 4.8 5.1 5.3 5.5 5.5 4.7 4.7 5.0 4.9 5.2 5.0
Lao, PDR 7.5 7.4 7.0 7.0 6.8 7.2 .. .. .. .. .. ..
Malaysia 6.0 5.0 4.2 4.3 4.5 4.5 4.9 4.7 4.5 4.2 4.0 4.3
Mongolia 8.0 2.3 0.1 2.0 3.5 3.7 0.7 8.0 -2.2 3.0 -0.3 -6.3
Myanmar 8.0 7.3 6.5 6.9 7.2 7.3 .. .. .. .. .. ..
Papua New Guinea 7.4 6.8 2.4 3.0 3.2 3.0 .. .. .. .. .. ..
Philippines 6.2 5.9 6.8 6.9 7.0 6.7 5.9 6.2 6.5 6.8 7.0 7.1
Solomon Islands 2.0 3.3 3.0 3.3 3.0 3.0 .. .. .. .. .. ..
Thailand 0.8 2.8 3.1 3.2 3.3 3.4 2.7 2.9 2.8 3.2 3.5 3.2
Timor-Leste 5.9 4.3 5.0 5.5 6.0 5.5 .. .. .. .. .. ..
Vietnam 6.0 6.7 6.0 6.3 6.3 6.2 6.5 6.9 7.0 5.5 5.6 6.6
Europe and Central Asia 2.3 0.5 1.2 2.4 2.8 2.9 0.2 0.5 1.0 1.3 1.8 0.0
Albania 1.8 2.6 3.2 3.5 3.5 3.7 2.8 3.6 2.1 3.1 3.2 ..
Armenia 3.6 3.0 2.4 2.7 3.0 3.2 .. .. .. .. .. ..
Azerbaijan 2.0 1.1 -3.0 1.2 2.3 2.3 5.5 1.2 -6.5 -0.2 -1.0 ..
Belarus 1.7 -3.9 -2.5 -0.5 1.3 1.4 -4.5 -4.4 -4.2 -3.7 -3.2 ..
Bosnia and Herzegovina 1.1 3.0 2.8 3.2 3.7 3.9 .. .. .. .. .. ..
Bulgaria 1.3 3.6 3.5 3.2 3.1 3.1 3.1 3.8 3.6 3.6 3.5 3.2
Georgia 4.6 2.8 3.4 5.2 5.3 5.0 2.5 2.9 3.0 2.7 2.9 2.3
Hungary 4.0 3.1 2.1 2.6 2.8 2.7 2.9 2.6 3.4 1.1 2.8 2.2
Kazakhstan 4.2 1.2 0.9 2.2 3.7 4.0 0.8 0.2 1.0 -0.3 -0.3 ..
Kosovo 1.2 4.1 3.6 3.9 3.7 3.6 .. .. .. .. .. ..
Kyrgyz Republic 4.0 3.5 2.2 3.0 3.7 4.9 .. .. .. .. .. ..
Macedonia, FYR 3.6 3.8 2.0 3.3 3.7 4.0 3.7 2.1 6.4 2.6 3.1 2.4
Moldova 4.8 -0.5 2.2 2.8 3.3 3.7 .. .. .. .. .. ..
Montenegro 1.8 3.4 3.2 3.6 3.0 3.0 .. .. .. .. .. ..
Romania 3.1 3.7 4.7 3.7 3.4 3.2 3.4 3.6 3.8 4.3 6.0 4.4
Serbia -1.8 0.8 2.5 2.8 3.5 3.5 1.2 2.3 1.1 3.8 1.9 2.6
Tajikistan 6.7 6.0 6.0 4.5 5.2 4.5 .. .. .. .. .. ..
Turkey 5.2 6.1 2.5 3.0 3.5 3.7 7.1 5.9 7.4 4.5 4.5 -1.8
Turkmenistan 10.3 6.5 6.2 6.5 6.8 7.0 .. .. .. .. .. ..
Ukraine -6.6 -9.9 1.0 2.0 3.0 3.0 -14.7 -7.2 -1.4 0.1 1.4 2.0
Uzbekistan 8.1 8.0 7.3 7.4 7.4 7.4 .. .. .. .. .. ..
Poland 3.3 3.9 2.5 3.1 3.3 3.4 3.3 3.5 4.6 2.7 3.1 2.0
Russia 0.7 -3.7 -0.6 1.5 1.7 1.8 -4.5 -3.7 -3.8 -1.2 -0.6 -0.4
Croatia -0.4 1.6 2.7 2.5 2.5 2.6 1.2 2.8 1.8 2.7 2.8 2.9

STAT IST ICAL APPENDIX GLOBAL ECONOMIC PROSPECTS | JANUARY 2017 248
TABLE 1 Real GDP Growth (continued)
Annual estimates and forecastsa Quarterly growthb
2014 2015 2016e 2017f 2018f 2019f 15Q2 15Q3 15Q4 16Q1 16Q2 16Q3e
Latin America and the Caribbean 0.9 -0.6 -1.4 1.2 2.3 2.6 -0.8 -1.7 -2.5 -2.4 -1.4 -1.1
Argentina -2.6 2.5 -2.3 2.7 3.2 3.2 3.8 3.5 2.3 0.4 -3.4 ..
Belize 4.1 2.9 -1.0 1.5 2.0 2.5 .. .. .. .. .. ..
Bolivia 5.5 4.8 3.7 3.5 3.4 3.4 5.1 3.6 5.9 4.9 3.2 ..
Brazil 0.5 -3.8 -3.4 0.5 1.8 2.2 -3.0 -4.5 -5.8 -5.4 -3.6 -2.9
Chile 1.9 2.3 1.6 2.0 2.3 2.5 2.3 2.5 1.7 2.3 1.6 1.6
Colombia 4.4 3.1 1.7 2.5 3.0 3.3 3.0 3.2 3.4 2.3 1.9 1.2
Costa Rica 3.0 3.7 4.3 3.9 3.7 3.7 4.6 4.8 3.0 4.5 4.2 ..
Dominica 3.7 -2.5 1.3 2.8 2.7 2.7 .. .. .. .. .. ..
Dominican Republic 7.6 7.0 6.8 4.5 4.2 4.0 .. .. .. .. .. ..
Ecuador 4.0 0.2 -2.3 -2.9 -0.6 1.0 0.2 -0.8 -2.0 -4.0 -2.2 ..
El Salvador 1.4 2.5 2.2 1.9 2.0 2.0 2.3 2.7 2.6 2.4 2.5 ..
Guatemala 4.2 4.1 2.9 3.2 3.4 3.4 3.5 4.0 4.1 2.9 3.4 ..
Guyana 3.8 3.2 2.6 3.8 3.9 4.1 .. .. .. .. .. ..
Haitic 2.8 1.2 1.2 -0.6 1.5 2.0 .. .. .. .. .. ..
Honduras 3.1 3.6 3.7 3.5 3.4 3.2 2.8 3.5 4.2 3.9 4.4 3.4
Jamaica 0.7 1.0 1.6 2.0 2.3 2.5 .. .. .. .. .. ..
Mexico 2.3 2.6 2.0 1.8 2.5 2.8 2.5 2.8 2.4 2.3 2.6 2.0
Nicaragua 4.6 4.9 4.5 4.0 3.9 3.8 3.1 5.5 6.5 4.2 5.5 ..
Panama 6.1 5.8 5.4 5.4 5.5 5.5 .. .. .. .. .. ..
Paraguay 4.7 3.1 3.8 3.6 3.3 3.3 2.6 2.4 1.1 1.5 6.2 5.0
Peru 2.4 3.3 4.0 4.2 3.8 3.6 3.2 3.3 4.7 4.5 3.7 4.4
St. Lucia -0.7 1.3 1.0 1.8 2.2 2.5 .. .. .. .. .. ..
St. Vincent and the Grenadines 0.2 0.6 2.0 2.2 2.4 2.4 .. .. .. .. .. ..
Trinidad and Tobago 0.8 -1.8 -2.8 2.3 3.6 3.2 .. .. .. .. .. ..
Uruguay 3.2 1.0 0.7 1.6 2.5 3.7 -0.5 0.5 -0.1 0.1 1.5 2.0
Venezuela, RB -3.9 -5.7 -11.6 -4.3 0.5 1.0 .. .. .. .. .. ..
Middle East and North Africa 3.3 3.2 2.7 3.1 3.3 3.4 4.3 4.0 2.6 2.1 2.2 ..
Algeria 3.8 3.9 3.6 2.9 2.6 2.8 .. .. .. .. .. ..
Bahrain 4.4 2.9 2.0 1.8 2.1 2.4 3.6 2.3 2.8 4.5 2.5 ..
Djibouti 6.0 6.5 6.5 7.0 7.0 7.0 .. .. .. .. .. ..
Egypt, Arab Rep.c 2.9 4.4 4.3 4.0 4.7 5.4 3.3 5.1 4.0 3.6 4.5 ..
Iran, Islamic Rep. 4.3 1.7 4.6 5.2 4.8 4.5 .. .. .. .. .. ..
Iraq 0.1 2.9 10.2 1.1 0.7 1.1 .. .. .. .. .. ..
Jordan 3.1 2.4 2.3 2.6 3.1 3.4 2.4 2.6 2.6 2.3 1.9 ..
Kuwait 0.5 1.8 2.0 2.4 2.6 2.8 .. .. .. .. .. ..
Lebanon 1.8 1.3 1.8 2.2 2.3 2.5 .. .. .. .. .. ..
Morocco 2.6 4.5 1.5 4.0 3.5 3.6 .. .. .. .. .. ..
Oman 2.5 5.7 2.5 2.9 3.4 3.6 .. .. .. .. .. ..
Qatar 4.0 3.6 1.8 3.6 2.1 1.3 4.8 3.6 3.9 1.4 2.0 ..
Saudi Arabia 3.6 3.5 1.0 1.6 2.5 2.6 4.9 4.0 1.8 1.5 1.4 ..
Tunisia 2.3 0.8 2.0 3.0 3.7 4.0 1.2 0.4 0.4 1.0 1.4 ..
United Arab Emirates 3.1 3.8 2.3 2.5 3.0 3.3 .. .. .. .. .. ..
West Bank and Gaza -0.2 3.5 3.3 3.5 3.5 3.6 .. .. .. .. .. ..
Suriname 0.4 -2.7 -7.0 0.5 1.1 1.3 .. .. .. .. .. ..

STAT IST ICAL APPENDIX GLOBAL ECONOMIC PROSPECTS | JANUARY 2017 249
Annual estimates and forecastsa Quarterly growthb
2014 2015 2016e 2017f 2018f 2019f 15Q2 15Q3 15Q4 16Q1 16Q2 16Q3e
South Asia 6.7 6.8 6.8 7.1 7.3 7.4 7.4 7.5 7.1 7.9 6.9 7.1
Afghanistan 1.3 0.8 1.2 1.8 3.0 3.6 .. .. .. .. .. ..
Bangladeshc d 6.1 6.6 7.1 6.8 6.5 6.7 .. .. .. .. .. ..
Bhutan 5.7 6.5 7.4 9.9 11.7 11.7 .. .. .. .. .. ..
Indiac d 7.2 7.6 7.0 7.6 7.8 7.8 7.5 7.6 7.2 7.9 7.1 7.3
Maldives 6.5 1.9 3.5 3.9 4.6 4.6 .. .. .. .. .. ..
Nepalc d 6.0 2.7 0.6 5.0 4.8 4.7 .. .. .. .. .. ..
Pakistanc d 4.0 4.0 4.7 5.2 5.5 5.8 .. .. .. .. .. ..
Sri Lanka 4.9 4.8 4.8 5.0 5.1 5.1 7.0 5.6 2.5 5.2 2.7 4.1
Sub-Saharan Africa 4.7 3.1 1.5 2.9 3.6 3.7 2.0 2.1 1.4 0.2 -0.4 0.1
Angola 5.4 3.0 0.4 1.2 0.9 0.9 .. .. .. .. .. ..
Benin 6.5 5.0 4.6 5.2 5.3 5.3 .. .. .. .. .. ..
Botswanac 3.2 -0.3 3.1 4.0 4.3 4.3 1.6 -3.3 -1.9 2.7 1.6 ..
Burkina Faso 4.0 4.0 5.2 5.5 6.0 6.0 .. .. .. .. .. ..
Burundi 4.7 -3.9 -0.5 2.5 3.5 3.5 .. .. .. .. .. ..
Cabo Verde 1.8 1.5 3.0 3.3 3.5 3.5 .. .. .. .. .. ..
Cameroon 5.9 5.8 5.6 5.7 6.1 6.1 .. .. .. .. .. ..
Chad 6.9 1.8 -3.5 -0.3 4.7 6.3 .. .. .. .. .. ..
Comoros 2.1 1.0 2.0 2.5 3.0 3.0 .. .. .. .. .. ..
Congo, Dem. Rep. 9.5 6.9 2.7 4.7 5.0 5.0 .. .. .. .. .. ..
Congo, Rep. 6.8 2.6 4.6 4.3 3.7 3.7 .. .. .. .. .. ..
Côte d'Ivoire 8.5 8.4 7.8 8.0 8.1 8.1 .. .. .. .. .. ..
Equatorial Guinea -0.7 -8.3 -5.7 -5.7 -6.6 -6.6 .. .. .. .. .. ..
Ethiopiac 10.3 9.6 8.4 8.9 8.6 8.6 .. .. .. .. .. ..
Gabon 4.3 3.9 3.2 3.8 4.6 4.6 .. .. .. .. .. ..
Gambia, The 0.9 4.7 0.5 0.8 2.6 2.6 .. .. .. .. .. ..
Ghana 4.0 3.9 3.6 7.5 8.4 8.4 .. .. .. .. .. ..
Guinea 1.1 0.1 5.2 4.6 4.6 4.6 .. .. .. .. .. ..
Guinea-Bissau 2.5 4.9 4.9 5.1 5.1 5.1 .. .. .. .. .. ..
Kenya 5.3 5.6 5.9 6.0 6.1 6.1 5.9 6.0 5.7 5.9 6.2 ..
Lesotho 3.6 1.7 2.4 3.7 4.0 4.0 .. .. .. .. .. ..
Liberia 0.7 0.0 2.5 5.8 5.3 5.3 .. .. .. .. .. ..
Madagascar 3.3 3.1 4.1 4.5 4.8 4.8 .. .. .. .. .. ..
Malawi 5.7 2.8 2.5 4.2 4.5 4.5 .. .. .. .. .. ..
Mali 7.0 6.0 5.6 5.1 5.0 5.0 .. .. .. .. .. ..
Mauritania 6.4 3.0 4.0 4.2 3.8 3.8 .. .. .. .. .. ..
Mauritius 3.6 3.4 3.2 3.5 3.8 3.8 .. .. .. .. .. ..
Mozambique 7.4 6.6 3.6 5.2 6.6 6.6 .. .. .. .. .. ..
Namibia 6.4 5.3 1.6 5.0 5.4 5.4 .. .. .. .. .. ..
Niger 6.9 3.5 5.0 5.3 6.0 6.0 .. .. .. .. .. ..
Nigeria 6.3 2.7 -1.7 1.0 2.5 2.5 2.3 2.8 1.7 -0.4 -2.2 -2.3
Rwanda 7.0 6.9 6.0 6.0 7.0 7.0 .. .. .. .. .. ..
TABLE 1 Real GDP Growth (continued)

STAT IST ICAL APPENDIX GLOBAL ECONOMIC PROSPECTS | JANUARY 2017 250
TABLE 1 Real GDP Growth (continued)
Annual estimates and forecastsa Quarterly growthb
2014 2015 2016e 2017f 2018f 2019f 15Q2 15Q3 15Q4 16Q1 16Q2 16Q3e
Sub-Saharan Africa (continued)
Senegal 4.3 6.5 6.6 6.8 7.0 7.0 .. .. .. .. .. ..
Seychelles 3.2 4.3 3.8 3.5 3.5 3.5 .. .. .. .. .. ..
Sierra Leone 4.6 -21.1 3.9 6.9 5.9 5.9 .. .. .. .. .. ..
South Africa 1.6 1.3 0.4 1.1 1.8 1.8 1.2 0.8 0.5 -0.1 0.7 0.7
Sudan 3.1 4.2 3.5 3.7 3.7 3.7 .. .. .. .. .. ..
Swaziland 2.7 1.7 -0.9 1.9 3.1 3.1 .. .. .. .. .. ..
Tanzania 7.0 7.0 6.9 7.1 7.1 7.1 .. .. .. .. .. ..
Togo 5.9 5.5 5.4 5.0 5.5 5.5 .. .. .. .. .. ..
Ugandac 4.8 5.0 4.6 5.6 6.0 6.0 .. .. .. .. .. ..
Zambia 5.0 2.8 2.9 4.0 4.2 4.2 .. .. .. .. .. ..
Zimbabwe 3.8 1.1 0.4 3.8 3.4 3.4 .. .. .. .. .. ..
Source: World Bank and Haver Analytics.
a. Aggregate growth rates calculated using constant 2010 U.S. dollars GDP weights.
b. Year-over-year quarterly growth of not-seasonally-adjusted real GDP, except for the United States, Ecuador, and Tunisia,
where only seasonally-adjusted data are available. Year-over-year quarterly growth in the United Kingdom is calculated using seasonally-adjusted real GDP.
Regional averages are calculated based on data from following countries.
East Asia and the Pacific: China, Indonesia, Malaysia, Mongolia, Philippines, Thailand, and Vietnam.
Europe and Central Asia: Albania, Azerbaijan, Belarus, Bulgaria, Croatia, Georgia, Hungary, Kazakhstan, FYR Macedonia, Poland,
Romania, Russia, Serbia, Turkey, and Ukraine.
Latin America and the Caribbean: Argentina, Bolivia, Brazil, Chile, Colombia, Costa Rica, Ecuador, El Salvador, Guatemala, Honduras,
Mexico, Nicaragua, Paraguay, Peru, and Uruguay .
Middle East and North Africa: Bahrain, Egypt, Jordan, Qatar, Saudi Arabia, and Tunisia.
South Asia: India and Sri Lanka.
Sub-Saharan Africa: Botswana, Kenya, Nigeria, and South Africa.
c. Annual GDP is on fiscal year basis, as per reporting practice in the country.
d. GDP data for Pakistan are based on factor cost. For Bangladesh, Nepal, and Pakistan, the column labeled 2017 refers to FY2016/17. For India, the column
labeled 2016 refers to FY2016/17.
For additional information, please see www.worldbank.org/gep.

SELECTED TOPICS GLOBAL ECONOMIC PROSPECTS | JANUARY 2017 251
Growth and Business Cycles
Low-income countries: Recent developments and outlook January 2017 Box 1.1
Regional perspectives: Recent developments and outlook January 2017 Box 1.2
Investment developments and outlook: East Asia and Pacific January 2017, Box 2.1.1
Recent investment slowdown: Europe and Central Asia January 2017 Box 2.2.1
Recent investment slowdown: Latin America and the Caribbean January 2017 Box 2.3.1
Recent investment slowdown: Middle East and North Africa January 2017 Box 2.4.1
Recent investment slowdown: South Asia January 2017 Box 2.5.1
Recent investment slowdown: Sub-Saharan Africa January 2017 Box 2.6.1
Weak investment in uncertain times: Causes, implications and policy responses January 2017, Chapter 3
Implications of rising uncertainty for investment in EMDEs January 2017, Box 3.2
Implications of the investment slowdown in China January 2017, Box 3.3
Interactions between public and private investment January 2017, Box 3.4
Low-income countries: Recent developments and outlook June 2016 Box 1.1
Quantifying uncertainties in global growth forecasts June 2016, SF 2
Regional perspectives: Recent developments and outlook June, 2016, Box 1.2
Regional integration and spillovers: East Asia and Pacific January 2016, Box 2.1.1
Regional integration and spillovers: Europe and Central Asia January 2016, Box 2.2.1
Regional integration and spillovers: Latin America and the Caribbean January 2016, Box 2.3.1
Regional integration and spillovers: Middle East and North Africa January 2016, Box 2.4.1
Regional integration and spillovers: South Asia January 2016, Box 2.5.1
Regional integration and spillovers: Sub-Saharan Africa January 2016, Box 2.6.1
Who catches a cold when emerging markets sneeze? January 2016, Chapter 3
Sources of the growth slowdown in BRICS January 2016, Box 3.1
Understanding cross-border growth spillovers January 2016, Box 3.2
Within-region spillovers January 2016, Box 3.3
Recent developments in emerging and developing country labor markets June 2015, Box 1.3
Low-income countries: Graduation, recent developments, and prospects January 2015, Chapter 1
What does weak growth mean for poverty in the future? January 2015, Box 1.1
What does a slowdown in China mean for Latin America and the Caribbean? January 2015, Box 2.2
Commodity Markets
From commodity discovery to production: Vulnerabilities and policies in LICs January 2016, Chapter 1
After the commodities boom: What next for low-income countries? June 2015, Chapter 1, SF
Low oil prices in perspective June 2015, Box 1.2
Understanding the plunge in oil prices: Sources and implications January 2015, Chapter 4
What do we know about the impact of oil prices on output and inflation? A brief survey January 2015, Box 4.1
How resilient is Sub-Saharan Africa? January 2015, Box 2.4
Global Economic Prospects: Selected Topics, 2015-17

SELECTED TOPICS GLOBAL ECONOMIC PROSPECTS | JANUARY 2017 252
Globalization of Trade and Financial Flows
The U.S. economy and the world January 2017, Special Focus
Regulatory convergence in mega-regional trade agreements January 2016, Box 4.1.1
Can remittances help promote consumption stability? January 2016, Chapter 4
Potential macroeconomic implications of the Trans-Pacific Partnership Agreement January 2016, Chapter 4
Regulatory convergence in mega-regional trade agreements January 2016, Box 4.1.1
China’s integration in global supply chains: Review and implications January 2015, Box 2.1
What lies behind the global trade slowdown? January 2015, Chapter 4
Monetary and Exchange Rate Policies
Investment-less credit booms January 2017, Box 3.1
Recent credit surge in historical context June 2016, SF1
Peg and control? The links between exchange rate regimes and capital account policies January 2016, Chapter 4
Negative interest rates in Europe: A glance at their causes and implications June 2015, Box 1.1
Hoping for the best, preparing for the worst: Risks around U.S. rate liftoff and policy options June 2015, SF1.1
Countercyclical monetary policy in emerging markets: Review and evidence January 2015, Box 1.2
Fiscal Policy
Having fiscal space and using it: Fiscal challenges in developing economies January 2015, Chapter 3
Revenue mobilization in South Asia: Policy challenges and recommendations January 2015, Box 2.3
Fiscal policy in low-income countries January 2015, Box 3.1
What affects the size of fiscal multipliers? January 2015, Box 3.2
Chile’s fiscal rule—An example of success January 2015, Box 3.3
Narrow fiscal space and the risk of a debt crisis January 2015, Box 3.4
Global Economic Prospects: Selected Topics, 2015-17

SELECTED TOPICS GLOBAL ECONOMIC PROSPECTS | JANUARY 2017 253
Commodity Markets Outlook
OPEC in historical context: Commodity agreements and market fundamentals October 2016, SF
Resource development in an era of cheap commodities April 2016, SF
Weak growth in emerging market economies: What does it imply for commodity markets? January 2016, SF
Understanding El Niño: What does it mean for commodity markets? October 2015, SF
How important are China and India in global commodity consumption July 2015, SF
Anatomy of the last four oil price crashes April 2015, SF
Putting the recent plunge in oil prices in perspective January 2015, SF
Global Daily
Energy and food prices: Moving in tandem? July 2016, SF
Global Weekly
Global Monthly
High-Frequency Monitoring
Development Economics Prospects Group (DECPG):
Selected Other Publications on the Global Economy, 2015-17

ECO-AUDIT
Environmental Bene�ts Statement
�e World Bank Group is committed to reducing its environmental
footprint. In support of this commitment, we leverage electronic
publishing options and print-on-demand technology, which is
located in regional hubs worldwide. Together, these initiatives enable
print runs to be lowered and shipping distances decreased, resulting
in reduced paper consumption, chemical use, greenhouse gas
emissions, and waste.
We follow the recommended standards for paper use set by the Green
Press Initiative. �e majority of our books are printed on Forest
Stewardship Council (FSC)–certi)ed paper, with nearly all containing
50–100 percent recycled content. �e recycled )ber in our book paper
is either unbleached or bleached using totally chlorine-free (TCF),
processed chlorine–free (PCF), or enhanced elemental chlorine–free
(EECF) processes.
More information about the Bank’s environmental philosophy can be
found at http://www.worldbank.org/corporateresponsibility.


Stagnant global trade, subdued investment, and heightened
policy uncertainty marked another difficult year for the
world economy. A moderate recovery is expected for 2017,
with receding obstacles to activity in commodity-exporting
emerging market and developing economies. Weak investment
is weighing on medium-term prospects across many emerging
market and developing economies. Although fiscal stimulus
in major economies, if implemented, may boost global growth
above expectations, risks to growth forecasts remain tilted to
the downside. Important downside risks stem from heightened
policy uncertainty in major economies.
In addition to discussing global and regional economic
developments and prospects, this edition of Global
Economic Prospects includes a chapter on the causes,
consequences and policy implications of weak investment in
emerging markets and developing economies, and a special
focus on the role of the U.S. economy in the world.
Global Economic Prospects is a World Bank Group Flagship
Report that examines global economic developments and
prospects, with a special focus on emerging market and
developing countries, on a semiannual basis (in January and
June). The January edition includes in-depth analyses of
topical policy challenges faced by these economies, while the
June edition contains shorter analytical pieces.