Embed Size (px)
Citation preview

Transforming Tanzania’s Charcoal Sector
Life Cycle Assessment Component
Prepared for: SDC
Prepared by: Quantis
Simon Gmünder
Rainer Zah
Jürgen Rainhard
François Charron-Doucet
February 10, 2014
LAUSANNE – ZURICH - PARIS – MONTREAL - BOSTON | ww.quantis-intl.com

Quantis i
Quantis is a leading life cycle assessment (LCA) consulting firm specialized in supporting
companies to measure, understand and manage the environmental impacts of their products,
services and operations. Quantis is a global company with offices in the United States, Canada,
Switzerland and France and employs close to 70 people, amongst which several are
internationally renowned experts in the LCA field.
Quantis offers cutting-edge services in environmental footprinting (multiple indicators including
carbon and water), eco design, sustainable supply chains and environmental communication.
Quantis also provides innovative LCA software, Quantis SUITE 2.0, which enables organizations
to evaluate, analyze and manage their environmental footprint with ease. Fuelled by its close ties
with the scientific community and its strategic research collaborations, Quantis has a strong
track record in applying its knowledge and expertise to accompany clients in transforming LCA
results into decisions and action plans. More information can be found at www.quantis-intl.com.
This report has been prepared by the Zurich office of Quantis. Please direct all questions
regarding this report to Quantis Zurich.
Quantis Switzerland/Germany
glaTec Technology Center
Überlandstrasse 129
8600 Dübendorf (Switzerland)
+41 445 52 08 39
www.quantis-intl.com

Quantis ii
PROJECT INFORMATION
Project title Transforming Tanzania’s Charcoal Sector - Life Cycle Assessment
Component
Contracting
organization
SDC
Liability statement Information contained in this report has been compiled from and/or
computed from sources believed to be credible. Application of the data
is strictly at the discretion and the responsibility of the reader. Quantis is
not liable for any loss or damage arising from the use of the information
in this document.
Version [Preliminary/Draft/Final] report
Project team Simon Gmünder, Quantis ([email protected])
Rainer Zah, Quantis ([email protected])
Jürgen Reinhard, Quantis ([email protected])
François Charron-Doucet, Quantis ([email protected])
Client contacts Ueli Mauderli, SDC ([email protected])
Joel Aram Kalagho, SDC ([email protected])
External reviewer Not reviewed externally

Quantis iii
Executive Summary

Quantis iv
TABLE OF CONTENT
PART I – INTRODUCTION ............................................................................................................. 9
1 Introduction ..................................................................................................................................................... 9
1.1 Background and problem statement ................................................................................................ 9
1.2 SDC project: Transforming Tanzania’s Charcoal Sector .......................................................... 10
1.3 Goal of this study .................................................................................................................................. 11
PART II- METHODOLOGY ........................................................................................................... 12
2 Life Cycle Assessment ............................................................................................................................... 12
3 Scope of the study ..................................................................................................................................... 13
3.1 Study site description .......................................................................................................................... 13
3.2 Compared systems ............................................................................................................................... 17
3.3 Functional unit and reference flows ............................................................................................... 18
3.4 System boundaries ............................................................................................................................... 19
4 Inventory data collection ......................................................................................................................... 20
4.1 Data types and sources ....................................................................................................................... 20
4.2 Inventory modelling principles ........................................................................................................ 21
4.3 Biogenic carbon emissions ................................................................................................................ 21
4.4 Time horizon ........................................................................................................................................... 23
5 Impact assessment ..................................................................................................................................... 23
6 Limitations of the study ........................................................................................................................... 27
PART III – CHARCOAL VALUE CHAIN ........................................................................................ 29
7 Overview about the charcoal value chain ......................................................................................... 29
8 Forest management .................................................................................................................................. 29
8.1 Forest types in Kilosa area ................................................................................................................. 30
8.2 Forest use scenarios ............................................................................................................................. 30
8.3 Carbon stock model ............................................................................................................................. 33
8.4 Dynamic carbon stock change ......................................................................................................... 39

Quantis v
9 Charcoal production .................................................................................................................................. 41
9.1 Introduction ............................................................................................................................................. 41
9.2 Charcoal kiln technologies................................................................................................................. 42
9.3 Inventory data used.............................................................................................................................. 44
9.4 Charcoal packaging .............................................................................................................................. 52
10 Transportation ............................................................................................................................................. 53
10.1 Introduction ............................................................................................................................................. 53
10.2 Transportation distances .................................................................................................................... 53
10.3 Transportation vehicles ....................................................................................................................... 55
11 Retail and distribution .............................................................................................................................. 55
12 Charcoal use ................................................................................................................................................. 57
12.1 Introduction ............................................................................................................................................. 57
12.2 Overview about the compared stoves .......................................................................................... 57
12.3 Production of stoves ............................................................................................................................ 59
12.4 Transport of Stoves .............................................................................................................................. 62
12.5 Use of Stoves .......................................................................................................................................... 62
12.6 Disposal of ash and stoves ................................................................................................................ 67
12.7 Inventory data ........................................................................................................................................ 67
PART III - RESULTS AND DISCUSSION ...................................................................................... 70
13 Compared charcoal value chains .......................................................................................................... 70
14 Material and energy balance ................................................................................................................. 70
15 Climate change impacts........................................................................................................................... 71
15.1 Forest management and land use change .................................................................................. 72
15.2 Charcoal production ............................................................................................................................ 75
15.3 Transport and distribution ................................................................................................................. 76
15.4 Consumption .......................................................................................................................................... 77
15.5 Sensitivity analysis –500 year time horizon ................................................................................. 78
15.6 Comparison with alternative fuel types and literature values .............................................. 79

Quantis vi
PART V – CONCLUSION AND RECOMMENDATION ................................................................ 82
16 Conclusions and recommendations .................................................................................................... 82
REFERENCES ................................................................................................................................. 84
ANNEX .......................................................................................................................................... 89
17 Annex .............................................................................................................................................................. 89
17.1 Interviews: Transportation vehicles - Bicycles ............................................................................ 89
17.2 Interviews: Transportation vehicles - Motorbikes ..................................................................... 90
17.3 Interviews: Transportation vehicles - Small trucks .................................................................... 91
17.4 Interviews: Transportation vehicles - Big trucks ........................................................................ 92
17.5 Interviews: Charcoal wholesaler and retailer .............................................................................. 93

Quantis vii
Abbreviations and Acronyms (DRAFT)
AGB Above Ground Biomass
AF Allocation Factor
BGB Below Ground Biomass
BEST Biomass Energy Strategy Tanzania
CO2 Carbon Dioxide
CDE Centre for Development and Environment
CF Characterization Factor
CDM Clean development mechanism
DSM Dar es Salaam
DOM Dead Organic Matter
DFHC District Forest Harvesting Committee
DFO District Forest Office
DNRO District Natural Resource Office
DoE Division of Environment
eq Equivalents
GWP Global Warming Potential
GOT Government Organization of Tanzania
GHG Greenhouse gas
IPCC Intergovernmental Panel on Climate Change
ISO International Organization for Standardization
LCA Life Cycle Assessment
LCIA Life Cycle Impact Assessment
LCI Life Cycle Inventory
LAFR Local Authority Forest Reserves
MEM Ministry of Energy and Mining
MFEA Ministry of Finance and Economic Affairs
MLHSD Ministry of Lands and Human Settlements Development (MLHSD)
MNRT Ministry of Natural Resources and Tourism
MJUMITA Mtandao wa Jamii wa Usimamizi wa Misitu Tanzania
NFR National Forest Reserves
NLUPC National Land Use Planning Commission
Pt Point
PMO-RALG Prime Minister’s Office – Regional Administration and Local Government
REDD Reducing Emissions from Deforestation and Degradation
RES Renewable Energy Section (of MEM)
SOC Soil Organic Carbon
SOM Soil Organic Matter
SCP Sustainable Charcoal Project
SDC Swiss Agency for Development and Cooperation
TFCG Tanzania Forest Conservation Group

Quantis viii
TRA Tanzania Revenue Authority
TaTEDO Tanzania Traditional Energy Development Organization
TFF Tanzanian Forest Fund
TFS Tanzanian Forest Service
TTCS Transforming Tanzania’s Charcoal Sector
UNFCCC United Nations Framework Convention on Climate Change
VPO-DoE Vice President’s Office, Division of Environment
VA Village Assembly
VC Village Council
VEO Village Executive Officer
VLFR Village land forest reserves
VLUMC Village Land Use Planning Committee
VNRC Village Natural Resource Committee
y Year

Quantis 9
PART I – INTRODUCTION
1 Introduction
1.1 Background and problem statement
Charcoal is the main energy source for the urban population in Tanzania. In 2009 about 1 million
ton of charcoal is consumed every year (World Bank 2009). The energy source is perceived as
reliable, inexpensive and accessible compared to alternative energy sources. Given the lack of
affordability of other fuel types and the convenience of using charcoal, domestic consumers are
increasingly switching to charcoal, especially in urban areas. Given the high urbanization rates in
Tanzania, the consumption of charcoal will even increase in near future.
The charcoal business is characterized by low capital costs, little knowledge and experience
requirements to enter business and by relatively high financial returns compared to other rural
economic activities. The charcoal market works efficiently and the value of the entire Tanzania
charcoal sector is valued at US$650 million. Consequently, the charcoal sector contributes
significantly to rural employment and income generation.
The production of charcoal dominated by the “informal sector” in which small scale producers
use traditional technologies to produce charcoal. In Tanzania mainly traditional earth kilns are
used to produce charcoal from wood. The wood itself is extracted from natural forests, rather
than from plantations, and the wood is very often illegally harvested. Even though wood is a
renewable resource, the unregulated utilization of natural forest causes at least a temporal
deforestation. If the land is used for agriculture after the clear-cutting, the land use is
permanently changed, which causes severe environmental impacts.
Charcoal and commercial wood have become major sources of rural income and livelihoods,
however, on the cost of the environment. Almost all stakeholders along the charcoal value chain
agree that the current depletion of natural resources and environmental degradation is not
sustainable and cannot be maintained forever. There are various approaches available to
improve the sustainability of charcoal value chains, ranging from the sustainable forest
management, improved charcoal kilns to efficient stoves. Currently, a wide range of measures
towards a sustainable energy supply are tested as pilot projects. However, the socio-economic
and environmental impacts of a more sustainable charcoal value chain are currently not fully
understood.

Quantis 10
1.2 SDC project: Transforming Tanzania’s Charcoal Sector
The “Transforming Tanzania’s Charcoal Sector (TTCS)” project - initiated and funded by the Swiss
Agency for Development and Cooperation (SDC) – aims to "deliver improved climate change
adaptation and mitigation, enhanced environmental sustainability and leveraged returns on
biomass resources, delivering sustainable development to Tanzania and its people. This will be
achieved by supporting improvements in raising the efficiency and environmental sustainability of
the charcoal industry and by launching a research-based knowledge management,
communications and advocacy strategy to develop credible new policy and governance measures
designed to enhance the role of biomass energy enterprise in poverty reduction and national
development.
The proposed project lifetime is six years with a budget of USD 7,101,782, comprising a two year
inception and design phase and a four year period of expanded implementation.”
The sustainable charcoal initiative is managed by Tanzania Forest Conservation Group (TFCG), in
conjunction with Tanzania Community Forest Conservation Network (MJUMITA).
TFCG is a national non-governmental organization whose mission is to conserve and restore the
biodiversity of globally important forests in Tanzania. Through TFCG’s five programs: advocacy,
participatory forest management, environmental education, community development and
research, TFCG has succeeded in rolling out innovative and high-impact solutions to the
challenges facing Tanzania’s forests and the people that depend on them. www.tfcg.org
MJUMITA1 is a national network of community groups involved in Participatory Forest
Management (PFM) in Tanzania. The network provides a forum for capacity building, advocacy
and communication for these groups. MJUMITA has operated since 2000 with support from
TFCG but was officially registered as an independent NGO in 2007. www.mjumita.org
TFCG will co-opt expertise from Tanzania Traditional Energy Development Organization
(TaTEDO) for the introduction of more efficient charcoal production. TaTEDO has more than
twenty years of experience in sustainable energy development projects and programs in rural
areas. www.tatedo.org
1 Swahili ‘Mtandao wa Jamii wa Usimamizi wa Misitu Tanzania’.

Quantis 11
1.3 Goal of this study
The overall aim of the study is to assess different sustainability aspects of the improved charcoal
value chain which is developed within the SDC project compared to the traditional value chain.
The focus of this study is put on the assessment of the global warming potential, while the social
and environmental impact assessment (SEIA) is conducted by the Center of Development and
Environment (CDE)2 in parallel.
The goal of this study is to prospectively assess the global warming potential of different
charcoal value chains based on the life cycle assessment (LCA) methodology. Thereby, all
processing steps of the current charcoal value chain (traditional) and various alternatives are
analyzed, including the harvesting of the raw materials, processing, transport to the final use. The
specific objectives are:
To define in a participatory approach the charcoal systems to be compared, including
forest management, charcoal kiln technologies, trading systems, transport systems,
wholesale, retailing and the final use in specific stoves.
To evaluate and compare the global warming potential (GWP) of different charcoal
production systems and uses.
To identify effective measures to mitigate the greenhouse gas (GHG) emissions of the
traditional charcoal value chain.
The gained knowledge will help to further improve project structure and implementation – thus,
to optimize the “sustainable charcoal value” chain before it is established. The progress and
results will be reported to and discussed with the project partners and relevant stakeholders
along the value chain. The knowledge gained from the comparison of different charcoal value
chains (traditional versus different improvement options) can further be used for marketing
purposes, as well as a knowledge basis for the formulation of national energy strategy and for
policy decisions within the energy sector.
It has to be kept in mind that the assessment is prospective, meaning that not all expected
impacts will be measurable during the period of the mandate.
2 CDE is the University of Bern’s centre for sustainable development research with the aim of fostering
sustainable development-oriented research. www.cde.unibe.ch

Quantis 12
PART II- METHODOLOGY
2 Life Cycle Assessment
A leading tool for assessing environmental performance is life cycle assessment (LCA), a method
defined by the International Organization for Standardization (ISO) 14040-14044 standards (ISO
2006a; ISO 2006b). LCA is an internationally-recognized approach that evaluates the relative
potential environmental and human health impacts of products and services throughout their
life cycle, beginning with raw material extraction and including all aspects of transportation,
production, use, and end-of-life treatment. Among other uses, LCA can identify opportunities to
improve the environmental performance of products, inform decision-making, and support
marketing, communication, and educational efforts.
A LCA generally contains four main phases which are displayed in Figure 1:
Figure 1: Four main phases of an LCA according to ISO 14040.
The definition of goals and scope is the first step of an LCA. In this step the outline of the study
must be clearly defined. The final results of the study are only valid for the defined scope (see
chapter 3) and goals (see chapter 1.3). The scope definition is done in line with the goal
definition, meaning that the scope should be sufficiently well defined to ensure that the breadth,
depth and detail of the study are compatible and sufficient to address the stated goal.
In the life cycle inventory (LCI) analysis the material and energy flows of the system processes
are quantified (see chapter 4). By assessing all the inputs and outputs of the system, the

Quantis 13
exchanges - and thus the impacts – of the compared systems with the environment can be
assessed.
Life cycle impact assessment (LCIA) methodologies aim to connect the flows of materials,
energy, and emissions into and out of each product system (LCI results) to the corresponding
environmental impacts (see chapter 5). According to ISO 14040, the LCIA proceeds through two
mandatory (classification & characterization) and two optional steps (normalization & weighting)
which are not applied within this study.
Classification: all substances are assigned to the selected impact categories according to the
ability to contribute to different environmental problems.
Characterization: the impact from each emission is modelled quantitatively according to the
underlying mechanism. The cause and effect mechanism is based on fate, exposure and effect
models. The impact is expressed as an impact score in a unit which is common to all
contributions within the impact category (e.g. kg CO2-equivalents for greenhouse gases
contributing to the impact category climate change) by applying characterization factors (CF).
Normalization: the quantified impact related to a common reference in order to facilitate
comparisons across impact categories (e.g. the impacts caused of a European citizen during
one year)
Weighting: different value choices are given to the different environmental impact categories
to generate a single score.
In life cycle interpretation, the results of the found during a life cycle assessment are appraised
in order to answer questions posed in the goal definition. The interpretation relates to the
intended applications of the LCI/LCA study and is used to develop recommendations.
3 Scope of the study
3.1 Study site description
The study site of the sustainable charcoal project is located in Kilosa District, which is part of the
Morogoro region. Kilosa is located approximately 300 km inland from the coast, along one of the
old East African caravan routes stretching from Bagamoyo to the eastern part of Democratic
Republic of Congo. The district has a size of 14,245 km2 and counts almost 500,000 inhabitants
according to the 2002 census.

Quantis 14
Figure 2: Map of study site. Location of the Kilosa district (left, soruce: (Paavola 2008)) and the villages under
study (right, source: TFCG).
Kilosa district comprises mostly flat lowland that covers the whole of the eastern part called
Mkata Plains. The vegetation in Kilosa District is characterised by Miombo woodland, with grass
and shrub covering the soils. Most of the forests are found in the western part of the district
along the Eastern Arc mountain range, more specifically around the Rubeho Mountains. The
Eastern Arc mountain range has several unique ecosystems with a large variety of species.
(Kajembe et al. 2013)
The rainfall starts in October and lasts for about eight months, with the highest levels between
March and April (see Figure 3). The rainfall distribution is bimodal in good years, with short rains
(October–January), followed by long rains (March –May). The mean annual rainfall ranges
between 800 and 1,400 mm. The mean annual temperature in Kilosa is about 25°C.
What is the precipitation in the study site? (Precipitation data specific for the study site are not
available; the annual rainfall ranges from 600mm in low lands to 1200mm in the highland
plateau. However, there are areas which experience exceptional droughts (with less than 600mm
of rainfall and these areas are in Gairo and Mamboya divisions in the North of Kilosa District and

Quantis 15
Ngerengere Division in the East of Morogoro Rural District) Source; Morogoro Social Economic
Profile.
The main economic activity in the surveyed villages is agriculture, whereby majority of the
population in the area depend on agriculture for their livelihood. Farming is noticeably more
significant to people’s livelihood in the project villages than any other livelihood activity followed
by animal husbandry. Major crops grown in the area include maize, banana, cassava, sesame and
rice. Majority of the farmers are not harvesting enough to feed their families all year round, in
that situation they have to look for alternative source of income of which charcoal is the most
common in the area. Apart from agriculture and livestock keeping, other economic activities in
the area include casual employment and business (shops, transport, charcoal, etc).
More than 80 per cent of the people in Kilosa depend on agriculture. More than 90 per cent of
the agriculture is small scale subsistence farming, while only a few large-scale plantations exist.
The agricultural season generally starts before the short rain in September/October with the field
preparation and subsequently with planting, weeding and finally with harvesting of crops. Just
before the heavy rain in March, crops are planted for a second harvesting between June and
August. A variety of crops are grown, including maize, rice, millet, cassava, beans, bananas and
cowpeas3.
Charcoal production was the second economic activity after agriculture. Mainly small scale
farmers are involved in charcoal production to generate additional income. Charcoal is produced
all year round, but the main production season is after the harvesting of the crops in the dry
season. Depending on the financial situation of the farmer, also in the rainy season some
charcoal is produced.
3 A more complete list is provided in (Kajembe et al. 2013; Norrlund & Brus 2004).

Quantis 16
Figure 3: Typical agricultural calendar of a village in Kilosa district (based on field study in Nyali, 2012). The
workload for agriculture and charcoal production is indicated by different colors.
The sustainable charcoal project operates in Kilosa district, where TFCG has been supporting a
community oriented REDD+4 project since 2009. The sustainable charcoal project works with 4
villages within the REDD project area and 4 villages in the leakage belt to integrate sustainable
charcoal production into the community based forest management process. The sustainability
assessment is conducted for 6 villages, including three REDD villages (Msimba, Dodoma Isanga
and Nyali) and three adjacent villages in the ‘REDD leakage belt’ (Ihombwe, Kigunga and Ulaya-
mbuyuni). An overview about the main characteristics of the villages under study is provided in
Table 1 and the locations are indicated in the map of Figure 2. The data on forest management,
charcoal production and transportation is based on field data from the selected villages (TFCG,
2103).
Table 1: Overview about some key characteristics of the selected villages. REDD+ villages are market with an
asterisk.
Village name Area
[ha] Population
Estimated amount
of charcoal
producers
Estimated forest
size
[ha] (Pulsar 2010)
Msimba* 36448 2792 >150 29571
Dodoma Isanga* 4503 1308 >45 2590
4 Reducing Emissions from Deforestation and Forest Degradation (REDD) is an effort to create a financial
value for the carbon stored in forests, offering incentives for developing countries to reduce emissions
from forested lands and invest in low-carbon paths to sustainable development. "REDD+" goes beyond
deforestation and forest degradation, and includes the role of conservation, sustainable management of
forests and enhancement of forest carbon stocks. http://www.un-redd.org
Quantis 17
Nyali* 9286 2106 >40 5720
Ihombwe 19017 3324 >100 18320
Kigunga 2673 2090 >45 2086
Ulaya-mbuyuni 4468 3198 >40 3800
3.2 Compared systems
Within this study we compare different traditional charcoal production and use systems, as well
as different improved charcoal value chains. Since currently no sustainable charcoal value chains
exist (technologies are existing, but not at the study site), the “sustainable” value chains likely to
be implemented are selected (prospective character of the assessment).
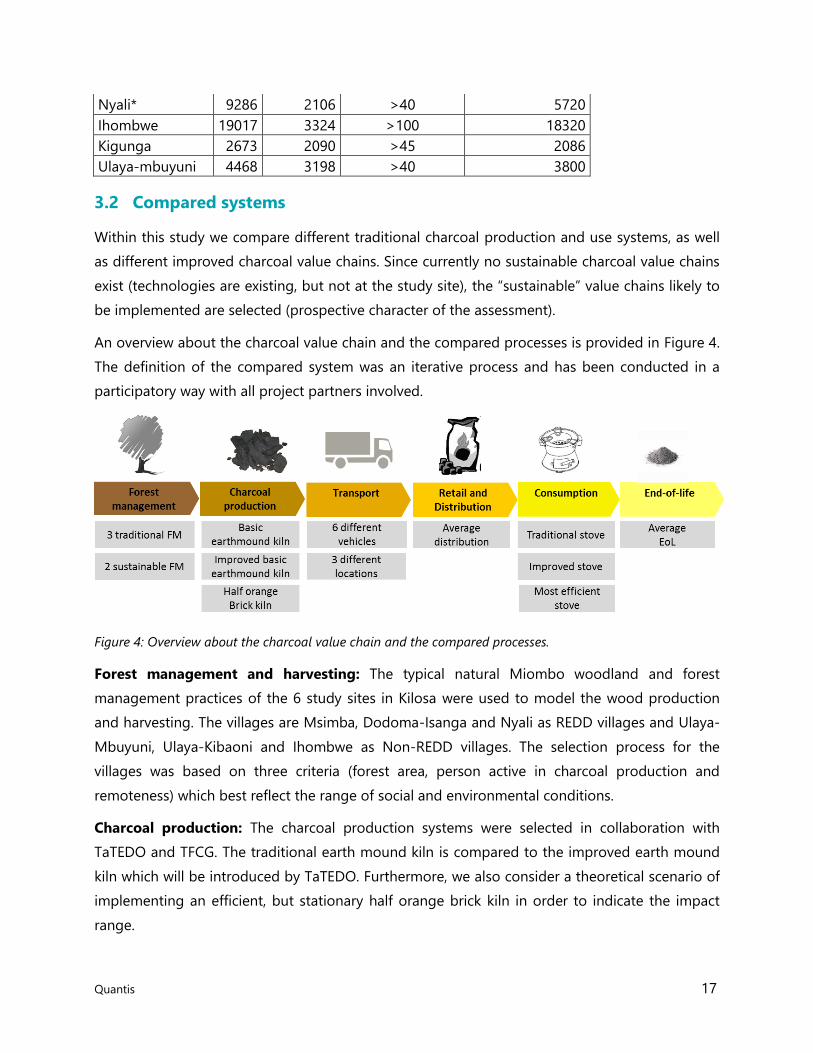
An overview about the charcoal value chain and the compared processes is provided in Figure 4.
The definition of the compared system was an iterative process and has been conducted in a
participatory way with all project partners involved.
Figure 4: Overview about the charcoal value chain and the compared processes.
Forest management and harvesting: The typical natural Miombo woodland and forest
management practices of the 6 study sites in Kilosa were used to model the wood production
and harvesting. The villages are Msimba, Dodoma-Isanga and Nyali as REDD villages and Ulaya-
Mbuyuni, Ulaya-Kibaoni and Ihombwe as Non-REDD villages. The selection process for the
villages was based on three criteria (forest area, person active in charcoal production and
remoteness) which best reflect the range of social and environmental conditions.
Charcoal production: The charcoal production systems were selected in collaboration with
TaTEDO and TFCG. The traditional earth mound kiln is compared to the improved earth mound
kiln which will be introduced by TaTEDO. Furthermore, we also consider a theoretical scenario of
implementing an efficient, but stationary half orange brick kiln in order to indicate the impact
range.

Quantis 18
Transport: Since currently the transportation and marketing of sustainable charcoal are not yet
defined, traditional transportation means (6 different vehicles) and three different markets
(Kilosa, Morogoro and Dar es Salaam) are considered.
Retail and distribution: A typical retail and distribution system for traditional and sustainable
charcoal is considered.
Consumption: Three different cooking stoves are compared. The stoves cover the whole
bandwidth in terms of efficiency and include i) traditional stove, ii) most common improved
stove (Jiko Bora) and iii) most efficient stove (Sazawa).
End-of-Life treatment: The end-of-life treatment of cooking stoves is considered within this
study.
3.3 Functional unit and reference flows
LCA relies on a “functional unit” as a reference for evaluating the components within a single
system or among multiple systems on a common basis. It is therefore critical that this parameter
is clearly defined and measurable. To fulfil the functional unit, different quantities and types of
material are required for each product. These are known as reference flows.
Figure 5: Reference flow unit of main life cycle stages.
Within this study, the functional unit of 1 MJ delivered at cooking pot is used. Thereby the
energy efficiency of the stove is accounted for, since the heat received by the pot and not only
the heat produced by the stove is considered. However, in order to achieve the function of
cooking, different processing steps are required, each with its own reference flow units (see
Figure 5).

Quantis 19
3.4 System boundaries
The system boundaries identify the life cycle stages, processes, and flows considered in the LCA
and should include all activities relevant to attaining the above-mentioned study objectives.
In the following section, the general life cycle stages are described, while the detailed description
of each stage is provided in the respective chapters of part III.
Forest management and harvesting: This stage includes the management of the forest and the
harvesting of forest products. Since the forest management and the harvesting is done manually
and no inputs in terms of fertilizer, irrigation and machinery are used, only the change in carbon
stock of living biomass and soil is considered.
Charcoal production: The impact related to the production and disposal of the materials used
to establish the charcoal kiln, the emissions of the carbonization process and the packaging of
charcoal is considered within this stage.
Transport and trade: The emissions and losses of charcoal related to the transport of charcoal
bags from the kiln site to the wholesaler in town are considered within this life cycle stage.
Retail and distribution: The distribution stage includes the transport from the wholesaler to the
retailer, as well as the storage and the operation of the distribution shop (thereby only the
charcoal losses are considered). Further, also the impact of the charcoal carrying bag from the
retailer to home is considered (charcoal packaging).
Consumption: The combustion emissions of typical charcoal stoves used by small households in
urban areas are considered. Furthermore, the manufacturing and disposal of the compared
cooking stoves is also considered. The shopping trip of the consumer is assumed to have a
marginal impact and thus are neglected. It has to be noted that the impact associated to the
meals (e.g. production of food) can have higher environmental impacts than the cooking fuel
used to prepare the meals. However, the impact strongly depends on the consumer behaviour
(e.g. type and amount of food prepared) and is not subject of this study.
End-of-life treatment: The stove disposal is considered in the end-of-life (EoL) stage, while the
ash disposal is assumed to have no significant impacts on the carbon balance and is therefore
neglected.
Quantis 20
4 Inventory data collection
4.1 Data types and sources
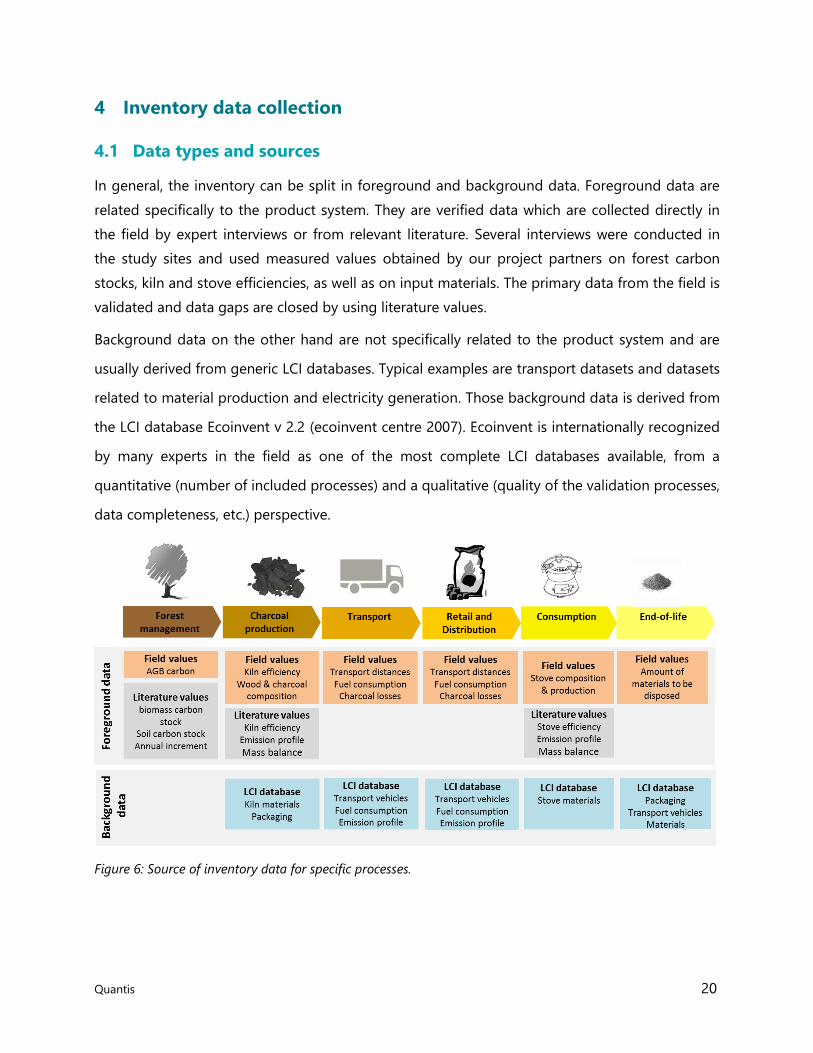
In general, the inventory can be split in foreground and background data. Foreground data are
related specifically to the product system. They are verified data which are collected directly in
the field by expert interviews or from relevant literature. Several interviews were conducted in
the study sites and used measured values obtained by our project partners on forest carbon
stocks, kiln and stove efficiencies, as well as on input materials. The primary data from the field is
validated and data gaps are closed by using literature values.
Background data on the other hand are not specifically related to the product system and are
usually derived from generic LCI databases. Typical examples are transport datasets and datasets
related to material production and electricity generation. Those background data is derived from
the LCI database Ecoinvent v 2.2 (ecoinvent centre 2007). Ecoinvent is internationally recognized
by many experts in the field as one of the most complete LCI databases available, from a
quantitative (number of included processes) and a qualitative (quality of the validation processes,
data completeness, etc.) perspective.
Figure 6: Source of inventory data for specific processes.
Quantis 21
The data sources and assumptions are documented in respective chapters. Inventory modelling
and LCIA calculations are conducted in Simapro 7.35.
4.2 Inventory modelling principles
We apply the attributional inventory modelling and true value allocation6 as applied in ecoinvent
v2.2 (ecoinvent centre 2007). For the EoL treatment the cut-off approach is used to treat
recycling of waste products (Frischknecht et al. 2007). Thereby the impacts associated with the
collection of materials being recycled and with the recycling process of these materials are
attributed to the products using the recycled materials. It is therefore oriented towards extended
producer responsibility and is used as a default approach in all ecoinvent v2.2 processes. The
choice of the EoL approach used is assumed to not significantly influence the results.
4.3 Biogenic carbon emissions
Biogenic CO2 are usually not considered in the LCA to assess the global warming potential (i.e.
both uptake by plants and release during degradation/consumption). This assumption is based
on the concept of “carbon neutrality”, where the atmospheric carbon fixation and end-of-life
carbon emissions occur in such a short period of time that they can be regarded as offsetting
each other.
However, different studies showed significant carbon emissions related to land use change
(Searchinger 2008; Fargione et al. 2008). Also wood extraction and use leads to at least a
temporal change in the CO2 concentration of the atmosphere. If forest is converted to
agricultural land, the change in carbon stocks is more permanent (see Figure 7). Consequently,
an accounting error is caused if biogenic carbon emissions related to land use change are
ignored.
5 http://www.pre-sustainability.com/
6 In the ecoinvent default allocation, the allocation property is identical to the price, unless the property
“true value relation” is specifically provided in the original dataset (e.g. use of exergy to allocate between
electricity and useful heat). In ecoinvent an allocation correction for carbon is implemented to ensure
carbon balance.

Quantis 22
Figure 7: Schematic developments of carbon stock of native vegetation (left), a harvesting scenario (middle)
and a land use change (e.g. from forest to agriculture, right).
In this study we analyse the forest carbon pools and the corresponding net carbon flux between
the stand and the atmosphere for each of the compared land use schemes. The carbon stocks
and fluxes are quantified over a time period of 100 years. In this study we consider carbon
contained in aboveground biomass (AGB), belowground biomass (BGB) and also soil organic
carbon (SOC) stocks (see Figure 8). The carbon contained in the dead organic matter (DOM) is
neglected.
Figure 8: Overview about carbon pools considered.
For each compared scenario the total carbon stock ( ) at any time (t) is modeled as the sum of
the carbon contained in AGB, BGB and SOC.
( ) ( ) ( ) ( )
The average carbon stock ( ) over a time period of 100 years is used to assess the land
occupation impact and is calculated as

Quantis 23
∑ ( )
For each scenario the dynamic carbon stock over a 100 year period is presented graphically
(example in figure below).
Figure 9: Example: Carbon stock of afforestation or forest regeneration.
4.4 Time horizon
Two different time aspects have to be considered in the modelling of the emissions and impacts
related to climate change: the time period of the analysis and the time period used for the
impact assessment. First, the time period of assessing the emissions and removal of GHGs has to
be defined. We consider the land use scheme of 100 years. Further, we assume that the charcoal
is used in the same year as the trees are cut to produce the charcoal.
Second, the time horizon of the impact assessment (choosing a time beyond which radiative
forcing is neglected). In an infinite time perspective temporal release of carbon emissions
becomes insignificant. Most widely the time horizon of 100 years is used.
Consequently for both, the assessment period of modelling the emissions and the impact is set
at 100 years. This time horizon is widely accepted and recommended by PAS 2050 and the ILCD
guidelines (BSI 2011; European Commission 2010). However, we also assess the sensitivity of the
LCA results by calculating the GWP for a 500 year time horizon (see chapter 15.5).
5 Impact assessment
In this study we calculate the impact in terms of the global warming potential (GWP), which
accounts for radiative forcing caused by greenhouse gas emissions. The capacity of a
greenhouse gas to influence radiative forcing is expressed in terms of a reference substance (e.g.

Quantis 24
CO2-equivalent units). In other words, the concept of GWP is a relative measure of how much
heat a GHG traps in the atmosphere compared to the heat trapped by a similar mass of CO2.
Consequently the GWP of CO2 is 1.
The fraction of an initial CO2 pulse that remains in the atmosphere at time t is based on the
decay function of the Bern 2.5CC carbon cycle model (see black line in Figure 10). Since the
decay and radiative efficiency of other GHG differs from CO2, the characterization factors are
dependent on the time horizon. The GWP of other GHG is commonly calculated over time
horizon of 20, 100 and 500 years (see Table 2 for GWP of the top 3 GHGs).
Table 2: Global warming potential of carbon dioxide, methane and nitrous oxide for a 20, 100 and 500 year
time horizon (IPCC, 2007).
Each CO2 emission contributes to global warming, no matter whether it is from biogenic or from
a fossil fuel. However, as soon as the biomass starts to regrow, there is an uptake of CO2. Taking
the time profile of the regrowth into account, the calculated lifetime of a CO2 pulse from
biomass (red line in Figure 10) was found to be shorter than a pulse of CO2 from fossil fuels
(black line in Figure 10). Consequently it seems reasonable that the GWP of CO2 from bioenergy
in systems with regrowth is smaller than the potential warming impact of “fossil” CO2.
20 - yr 100-yr 500-yr
Carbon dioxide CO2 see Fig 10 1.4*10^-5 1 1 1
Methane CH4 12 3.7*10^-4 72 25 7.6
Nitrous oxide N2O 114 3.03*10^-3 289 298 153
Name Formula
Lifetime
(years)
Radiative Efficiency
(W m–2 ppb–1)
Global warming potential for given
time Horizon

Quantis 25
Figure 10: Example of carbon stock and emissions of forest regrowth after clear-cut. The carbon dioxide
emissions released in year 0 and the subsequent uptake of carbon dioxide due to regrowth is indicated by the
red line. The carbon stock as a function of time is indicated in grey. The carbon dioxide decay curve for fossil
CO2, which is based on the Bern carbon cycle model, is indicated in black. At a 100 year time horizon the
mean carbon stay in air is 18, respectively 48 years.
Different studies provided an approach on how to adapt the GWP in order to take the time
profile of the regrowth and thus the actual CO2 concentration in the atmosphere into account
(Müller-Wenk & Brandão 2010; Holtsmark 2013; Cherubini et al. 2011).
Müller-Wenk & Brandão (2010) proposed to calculate the mean carbon stay in air for a given
time horizon. Based on the mean carbon stay in air, the duration factor is calculated as the ratio
between the average carbon stay in air due to the land use and 48 years7. The mean carbon stay
is calculated as the integral of the CO2 decay curve over 100 years. In our case a duration factor
7 Müller-Wenk & Brandão (2010) recommend to use a time horizon of 500 years. For 500 year time
horizon the mean carbon stay is 157 years and consequently a different duration factor results.

Quantis 26
of 0.38 (18/48) results, which means that 1 kg CO2 emitted due to clear-cutting and using the
wood is equal to 0.38 kg of fossil CO2 emission.
The impact factor calculated above is related to land transformation (CO2 pulse emission).
However, if a series of land occupation follows land conversion, the relaxation is postponed (see
Figure 11). According to Müller-Wenk and Brandão (2010) the impact of avoided regeneration
can be calculated as the difference between the carbon stock of the natural vegetation
( ) and the average carbon stock ( ) of the new land use system. The
impact of occupation depends on the change in average carbon stock ( ), the duration of
occupation and the duration factor (df). The df for a 100 year time horizon is calculated as 1/48
and a default occupation duration of 100 years is assumed.
Figure 11: Concept of calculating the land transformation and land occupation impact in terms of global
warming potential.
Quantis 27
Within this study the approach proposed by Müller-Wenk and Brandão (2010) is used and the
transformation and occupation impacts are calculated using a 100 year time horizon. As a
sensitivity analysis, the results are compared to using a 500 year time horizon and to the carbon
neutrality concept of biogenic CO2 emissions (see section 15.5).
6 Limitations of the study
The LCA study provides a comprehensive overview about the main environmental impacts along
the charcoal value chain. However, while interpreting the results following limitations have to be
considered:
Scope: Conclusions should be considered applicable only within the scope of the study. Thereby
the temporal, the geographic scope, as well as the system boundaries and modelling principles
have to be kept in mind.
Charcoal is produced, transported and used in many different ways. Within this study we have
captured many different aspects of current and future charcoal systems by assessing different
scenario for each processing step along the value chain. Even though a broad range of scenarios
is presented, not all possible options might have been considered. Furthermore, the sustainable
charcoal value chain is not yet fully established and thus a prospective impact assessment is
conducted. Depending on the future development of the improved value chain, the results of
this study require an update.
The LCA results are geographically dependent. It should be noted that most, though not all, of
the data within ecoinvent is of European origin and produced to represent European industrial
conditions and processes.
Inventory data: The assessment of environmental impacts in the life cycle usually requires a
large set of data and model assumptions. These assumptions have to be considered while
interpreting the results.
The uncertainties related to the inventory data were not quantified. However, the sensitivity of
results on different inventory assumptions was treated by the evaluation of different scenarios
(e.g. different traditional charcoal kilns).
The carbon stock model is mainly based on literature values, since the data availability on
regeneration curves, soil carbon stocks and below ground biomass is limited. Detailed inventory
data which are specifically collected in the study area will improve the data accuracy.

Quantis 28
Both the emissions from the charcoal kiln and charcoal stoves are sensitive to the local
conditions and might vary substantially. We based our study on average emission based on an
extensive literature review. However, direct measurements of emissions, but also of conversion
efficiencies, would increase the accuracy.
Impact Assessment: It is important to note that, rather than direct measurements of real
impacts, LCA estimates relative, potential impacts.
Uncertainties in impact assessment modeling were treated by conducting a sensitivity analysis
using different impact factors. For this study we compared the GWP 100 and GWP 500 results as
a sensitivity analysis.
Changing land use schemes might also cause a change in surface albedo. Thus not only the
changes in carbon pools, but also changes of the physical properties of the land surface can
perturb the climate, both by exerting a radiative forcing (RF) and by modifying other processes
such as the fluxes of latent and sensible heat and the transfer of momentum from the
atmosphere (IPCC 2007). Given the little data availability, this effect was not considered within
this study.
The focus of the study is put on the assessment of the global warming potential. Other
environmental impacts associated by charcoal production and use are not addressed within this
study. For instance impacts on the hydrology, biodiversity and ecosystem services related to
different forest management and land use schemes are not included in the study. Further, also
impacts on soil quality at the kiln site and human health impacts of charcoal combustion
emission are not considered in this study.
Overall sustainability: Although the LCA methodology is adequate to assess key aspects of
environmental sustainability, it is not to assess the social context in which these products are
produced or the socio-economic impacts they generate. In order to obtain a complete view of
sustainability, the results of the LCA study should be interpreted together with other
assessments of the study.

Quantis 29
PART III – CHARCOAL VALUE CHAIN
7 Overview about the charcoal value chain
In the following chapter the charcoal value chain is described in detail and the inventory data
generated is provided. Figure 12 provides an overview about the structure of part III and about
selected key aspects relevant for conducting a charcoal LCA.
Figure 12: Overview about the charcoal value chain and selected key aspects relevant for conducting a
charcoal LCA.
8 Forest management
Tanzania shows a significantly high annual deforestation of approximately 403 000 ha (FAO,
2010), which equals an annual forest decrease of more than 1 % for Tanzania with its total forest
area of 31 million ha. Chidumayo et al. calculated the country specific land requirements to fulfill
the charcoal national charcoal production and compared the area to the total deforested area
(Chidumayo & Gumbo 2013). In Tanzania the charcoal consumption is about 1 million ton for
which an area of about 100 000 ha forest needs to be clear-cut. This is roughly one quarter of
the total deforested area in Tanzania. However, charcoal production just leads to temporal
deforestation and not to a permanent land use change.
In the following chapter, the natural forest system and different forest use schemes are described
and data on the carbon stock dynamics is provided.

Quantis 30
8.1 Forest types in Kilosa area
There exists two type of forest in the study area: i) Montane Forest and ii) Miombo woodland.
The forests differ in terms of tree height, canopy cover, diversity, carbon stock and elevation.
Montane forest: Out of the 6 villages only Msimba and Kisanga have montane forest as part of
their village forest reserves. However, such closed forest types are located at high altitudes.
Consequently, they are typically far away from villages and due to the poor accessibility they are
generally not used for charcoal production. Therefore, we exclude this forest type from our
study.
Miombo woodland: Closed or Miombo (broadleaved) woodlands are found throughout
Tanzania at altitudes ranging from 300 m to 1300 m depending on the climatic conditions. There
is no continuous canopy although crowns can be in close proximity to each other. Most trees are
single stemmed and evergreen, semi-evergreen or deciduous. The major species are
Brachystegia spp and Jubernardia spp. The majority of Miombo woodland species have deep
taproots with access to deep soil moisture and nutrients and shed leaves during the dry season
(Dallu 2002).
The dry Miombo woodland is the dominant forest type in the study site and available in all
villages.
Figure 13: Dry Miombo woodland (left) and montane forest (right, source: TFCG).
8.2 Forest use scenarios
In the context of charcoal production we differentiate between two drivers for clear-cutting
forest. Either the forest is cut to use the biomass for charcoal production or the main driver for
deforestation is the expansion of agricultural land. In the following the drivers are described and
also the sustainable forest management approach is introduced.

Quantis 31
Figure 14: Forest clear-cut for expansion of extensive agricultural area (left) and for charcoal production
(right).
8.2.1 Scenario 1: Temporary deforestation - driver charcoal
There are two different ways to clear the forest, either by using an axe or saw to cut the tree
about 40cm above ground or by controlled fire. Before the fire is set the bark is peeled off so
that the tree dries. The wood is either used (firewood, charcoal or timber) or left aside. There
exist preferred tree species for charcoal production and if sufficient trees are available, selective
cutting of well suited species for charcoal making is conducted. However, in most cases the
forest is clear-cut and all the biomass is used for charcoal production.
After clear-cutting, the woodland is left for regeneration. According to Malimbwi & Zahabu
(2004) it takes 10-15 years until the trees can be harvested again for charcoal production.
8.2.2 Scenario 2: Permanent deforestation - driver agriculture
The main driver for deforestation in this scenario is the expansion of agriculture. Within this
study we distinguish between long-term agriculture and shifting cultivation. While long-term
agriculture is the permanent cultivation of land, shifting cultivation is only a temporary
cultivation system and includes following steps:
1. Clear-cut: All trees are cut and the wood is either used (firewood, charcoal or timber) or left
aside (decomposing process).
2. Agriculture. After clear-cutting the field is prepared. Thereby the stumps are usually left on
the field, since they will decompose within a few years. Maize is the dominant crop grown in the
study site and for its cultivation tillage is applied, but in general no fertilizers are used. After 7 to
10 years the soil nutrient level decreases to a level that yields fall and farming is not feasible
anymore.

Quantis 32
3. Regrowth: During a period of 3 to 4 years the field is left aside and the soil recovers. The
fertility of the land is indicated by the type of vegetation.
4. Clear-cutting: The regeneration time of a few years is too short for substantial biomass
production and the diameter of the wood logs is too low to use the accumulated biomass for
charcoal production. Thus, the cut wood is either used as firewood or left aside.
The shifting cultivation practice of one study site, Ihombwe, is further described in (Norrlund &
Brus 2004).
Figure 15: Schematic overview about the biomass stock of Miombo woodland clear-cut for agricultural
purposes.
8.2.3 Scenario 3: Sustainable forest management
The sustainable forest management guidelines are currently under development and will be
defined and implemented on a village level within the next year. We’ve used the draft harvesting
guidelines developed by TFCG to define the sustainable forest management scenario. However,
it has to be noted that the described practice might slightly change in future.
Clear-cutting versus selective cutting: Clear-cutting removes the entire canopy and this is seen
as the best way of promoting regeneration of tropical forests regenerating from stump sprouts.
Selective cutting might give competitive advantage to uncut trees. That might supress regrowth
of cut trees and suppressed saplings, which can cause more permanent forest degradation.
The harvesting guidelines advise clear-cutting and only trees of high value in diversity or
monetary terms are exempt (e.g. threatened or endangered species, rare species, valuable timber

Quantis 33
species or big trees which are habitat for wildlife). However, for the analysis we do not consider
such special trees.
However, clear-cutting on the other hand might cause soil erosion. To reduce the impact of
harvesting on soil erosion clear cutting is though unsuitable for large areas, steep slopes, or in
riverine vegetation.
Cutting period: Most of the trees in the Miombo woodland are deciduous and produce their
new growth at or before the start of the rains. The best period to cut is after the long rain
season, when trees will be dormant and cutting may not significantly affect resources stored
belowground.
Tree cutting height: Coppice shoots can be produced anywhere along the stem and branches,
not just around the root collar. Coppice production and growth is affected by the height above
the ground at which the stem is broken. If B. spiciformis and J. globiflora, and other species often
found in Miombo woodland are cut close to the ground (<5 cm) they produce less coppice
growth than plants cut higher up at 1.3 m (Grundy 1990). In the FMU allocated for charcoal
production it is recommended to cut the trees a knee height to maximize the available wood for
charcoal production and at the same time ensure fast regrowth.
Coppice cycle: Stem height increments in regrowth Miombo woodland are highest in the first or
second year and decline thereafter. Mean stem height may reach 4-5 m by 15-18 years in
regrowth dry Miombo woodland. The village natural resource council (VNRC) will prevent over-
utilization by developing a scheme for rotation between the ‘charcoal’ coupes based on the
biomass production. The regrowth woodland is expected to peak between 20 and 25 years (2
scenarios are used in our analysis).
Post harvesting practices: Regrowth can be thinned at 10-20 years by selective harvesting of
small poles, while reserving other stems for the production of large wood products. Further, the
recovery period is prolonged by by grazing and uncontrolled burning. Consequently, post
harvesting practices preventing the disturbance of the forest by animals and fires should be
implemented. However, in practice effective measures are difficult to implement (e.g. conflicts
with cattle-grazing or prevention of wild fires) and we’re not considering such measures in our
analysis.
8.3 Carbon stock model
The carbon stock depends on the carbon stored in the natural Miombo woodland (initial carbon
stock), the harvesting technique and the post-harvest use of the land. For all scenarios the same
natural Miombo woodland and harvesting techniques are assumed. However, the post-

Quantis 34
harvesting management differs (see Figure 16). In the following chapters the data used and the
assumptions made to determine the carbon stocks and fluxes of each scenario are further
described.
Figure 16: Overview about the compared scenarios.
8.3.1 Above ground biomass carbon stocks
Average aboveground biomass in old growth Miombo woodland varies mostly from around 30
to about 140 Mg ha-1, depending on the amount of annual rainfall and edaphic properties
(Malimbwi & Zahabu 2009). Thereby the harvestable tree volume in East Tanzania from dry
Miombo woodland is indicated with 35 m3 ha-1 (Malimbwi & Zahabu 2009). Given the greater
basal area of wet Miombo stands, it can be assumed that stand volume will be correspondingly
greater than this value.
The reported biomass stocks of Miombo woodland ranges from 4 Mg ha-1 (Ryan et al. 2011) to
230 Mg ha-1 (Kutsch et al. 2011) and is in average 53 Mg ha-1 (see Table 3) based on a literature
review (Ryan et al. 2011; Kutsch et al. 2011; Malimbwi & Zahabu 2009; Hunter 2012; Shirima et al.
2011; Williams et al. 2008; Hammarstrand & Särnberger 2013). Values specific for dry Miombo
woodland in Tanzania are reported to be 20 Mg ha-1 (Malimbwi & Zahabu 2009).
Based on the biomass stock, the carbon stock can be calculated based on the carbon content,
the wood density and the moisture content. The carbon content diverges among species,

Quantis 35
substrate and location. An average carbon content of Miombo woodland of 47% is used for this
study. No differences between trunk, branch and root carbon content were observed (Ryan et al.
2011). The wood density for individual species ranged from 0.40 to 0.71 t m-3 (average 0.56 t m-
3), depending on the tree species (Williams et al. 2008). Within this study an average wood
density of 0.56 t m-3 is used. The dry matter fraction (DMF) of Miombo wood was in average
0.65 for the trunk, 0.59 for the branches and 0.59 for roots (Ryan et al. 2011). We’ve used a DMF
of 0.65 throughout the study.
Preliminary results from four SCP projects villages indicate biomass stock (above ground
biomass) to be within 51-94 Mg wet mass ha-1 (16 – 28 Mg C ha-1). In each village, 50 plots were
analysed and the average carbon stock of 24 Mg C ha-1 is used for this study. The average
carbon stock is close to the average value from literature. The aboveground woody biomass (B in
Mg ha -1) of old- growth, mixed-age stands of Miombo woodland increases with mean annual
rainfall (P in mm) (Campbell 1996) according to following linear equation:
Using an average annual rainfall of 800mm for Kilosa area, an average biomass stock of 55.8 Mg
ha-1 results. Overall, the slightly lower carbon stock in the study site may also be explained since
the sampling in the study site includes only woody biomass of a diameter at breast height of
more than 5cm.
Table 3: Above ground biomass and carbon stock of Miombo woodland, based on different sources.
Forest type Country min average max min average max Source Comment
Miombo woodland -
natural Zambia 107.6 150.0 228.2 50.5 70.5 107.2 Kutsch et al. (2011)
Miombo woodland -
disturbed Zambia 24.0 11.3 Kutsch et al. (2011)
Dry miombo woodland Tanzania 19.6 9.2
Malimbwi & Zahabu
(2009)
Based on a wood density of 560
kg/m3.
wet miombo woodland Tanzania 23.0 56.0 10.8 26.3 Endean 1968
Based on a wood density of 560
kg/m3.
Old growth miombo
woodland Tanzania 30.0 140.0 14.1 65.8
Malimbwi & Zahabu
(2009)
old-growth, mixed-age
stands Miombo
Zambia /
Zimbabwe 55.0 25.9
Malimbwi & Zahabu
(2009)
old-growth stands in wet
miombo woodland
Zambia /
Zimbabwe 90.0 42.3
Malimbwi & Zahabu
(2009)
Miombo woodland Africa 31.7 14.90 Hunter (2012) Mix of literature review
Miombo woodland Eastern Arc, TZ 30.2 51.49 65.3 14.2 24.2 30.7 Shirima et al. (2011)
Miombo woodland Mozambique 4.0 45.11 129.6 1.9 21.2 60.9 Ryan et al. (2011)
Miombo woodland Mozambique 25.5 40.43 51.1 12.0 19.0 24.0 Williams et al. (2008) Only stem carbon considered.
Miombo woodland Mbozi, TZ 40.68 19.1 Munishi et al. (2010)
Miombo woodland -
natural Kilosa, TZ 51.0 94.0 24.0 44.2 TFCG (2013)
Preliminary results from the SCP
projects villages indicate biomass
stock (AGB)
Miombo woodland -
natural Ulaya Mbuyuni, TZ 19.9 9.37 TFCG (2013)
Based on a wood density of 560
kg/m3 and a dry matter fraction of
0.59.
Average 38.76 51.63 109.16 18.22 24.27 51.31
Value used 51.63 24.27
AGB [t d.m. / ha] AGB -C [t C / ha]

Quantis 36
The carbon stock of trunks remaining after clear-cutting is estimated based on harvesting
practice (cut 30 cm above ground), the stocking density (600 trees ha-1) and the estimated
diameter of the tree stumps (30cm). Based on the carbon content, the wood density and the
moisture content (values see above), an above ground carbon stock of 2 Mg C ha-1 remains after
clear-cutting.
The aboveground stock of annual crop cultivation is assumed to be zero according to the IPCC
guidelines (IPCC 2006).
8.3.2 Above ground biomass regrowth
The post harvesting regrowth of the forest can either take place by seed germination (sexual) or
by vegetative means (sprouts from existing trees that are cut or damage, often referred to as
coppice). In tropical dry forested the regeneration from saplings is more important.
The regrowth in biomass, also referred to as the mean annual increment (MAI), for dry Miombo
woodlands range from 1.2-2.0 Mg ha-1 (Chidumayo 1991). Slightly higher rates of 2.2 to 3.4 Mg
ha-1 are recorded in wet Miombo woodland (Chidumayo 1990).
Malimbwi and Zahabu (2009) reported that the MAI in mature Miombo woodland ranges from
0.58 to 3 m3 ha-1 (2-3% of the standing stock). Using a wood density of 0.7 t m-3, a MAI of 0.4 to
2.1 Mg ha-1 is calculated (Malimbwi & Zahabu 2009). The mean annual C stock accumulation of
stem wood is 0.75 Mg C ha-1during regeneration according to (Williams et al. 2008). The carbon
stored in stem wood is about 40% of the carbon stored in all the AGB (Muishi et al. 2010). Using
the carbon content of 47%, this results in a MAI of 4 Mg ha-1.
We use the regression model by Campbell (1996) in order to calculate the annual increment as a
function of tree age. The stand biomass (Mg ha-1) as a function of the age of regrowth (years) is
provided in Figure 17. The average MAI of the first 10 years is 1.4 Mg ha-1, for the first 20 years
2.6 Mg ha-1 and for the first 30 years 2.5 Mg ha-1.

Quantis 37
Figure 17: the stand biomass as a function of the age of regrowth (left) based on (Campbell 1996) and the
stem wood carbon stock (tC ha-1) per year (right) based on (Williams et al. 2008)
The MAI and the relative biomass increment (Mg/Mg-1ha-1) used in the study (based on the
regression curve in Figure 17) for the first 50 years are illustrated in Figure 18.
Figure 18: Mean annual increment (Mg ha-1) and biomass increment (Mg/Mg-1ha-1) relative to the biomass
stock of Miombo woodland regeneration of the first 50 years.
Overall there was no significant difference in stem C stocks on woodlands and on abandoned
farmland 30 years old (Williams et al. 2008). Also Ryan et al. (2011) indicated that within 30 years
of abandonment of agricultural activities, the woodland recovers to pre-disturbance level.
However, the recovery period is prolonged by grazing and uncontrolled burning.
The regrowing plots did not contain the defining miombo species, and total stem numbers were
significantly greater than in woodland plots, but species richness and diversity were similar in
older abandonments and miombo woodlands (Williams et al. 2008).
8.3.3 Below ground biomass
Miombo species have horizontally and vertically extensive root systems, but less is known about
the amount of woody biomass belowground. For Zambian dry miombo sites, the root biomass
averaged 35% of total biomass(Campbell 1996). In Mozambique the root biomass averaged at

Quantis 38
28% of the total biomass (Ryan et al. 2011). In contrast, in disturbed dry miombo woodland in
central Tanzania, root biomass apparently accounted for only 20% of a total biomass of 33 Mg
ha-1 (Malimbwi et al. 1994).
The belowground carbon stock of annual crop cultivation is assumed to be zero according to the
IPCC guidelines (IPCC 2006).
The value of 20% was used, even though the value seems low. The root system dies after the
conversion of forest land to agricultural land. The decomposition rate of the initial belowground
biomass is assumed to be 0.2 year-1.
8.3.4 Soil carbon stock
The carbon stock in Miombo woodland landscape in Mozambique is almost uniformly
distributed and ranges from 32 to 133 Mg C ha-1 (average 76.3 Mg C ha-1) of the first 50cm (Ryan
et al. 2011). In the first 30 cm of soil, the carbon stock in Zambia was reported to range between
13.7 and 14.6 Mg C ha-1 (Kutsch et al. 2011). Clay content was significantly positively correlated
with soil carbon in the top 40 cm and therefore areas of higher clay content contained elevated
carbon levels (Walker & Desanker 2004).
The soil carbon stock for natural Miombo woodland in Kilosa is assumed to be 76.3 Mg C ha-1 of
the first 50cm of soil.
In Savanna woodland, the soil carbon stock typically exceed the biomass carbon stock and when
forests are cleared significant amount of carbon might be emitted (Ryan et al. 2011). According
to IPCC guidelines, the amount of soil carbon emitted can be estimated based on the land use
factor, the tillage practice and the fertilization rate. In tropical dry climate region a default
emission value of 42% is provided for long term cultivated crops and for shifting cultivation a
value of 36% is indicated. Williams et al. (2008) indicated that there are no clear trends in soil
carbon stocks in the top 30cm along the abandoned machambas. Nevertheless, Williams et al.
(2008) calculated that abandoned agricultural land had a median C stock 23% lower than the
surrounding woodlands.
We use a carbon loss due to agricultural activities of 47%, based on the field measurements
presented in Figure 19 (Walker & Desanker 2004). For shifting cultivation agriculture, a lower
value of 23% is used (Williams 2008). Carbon did not appear to decline slowly as the age of the
field increased and we assume that the SOC reaches a new equilibrium point after 20 years (time
horizon of IPCC).

Quantis 39
Besides a loss in Carbon stock, also a mineralization of N is associated with the loss of soil C
(IPCC 2006). However, the impact is generally low and thus not considered within this study.
Figure 19: Correlation between age of land use and surface soil carbon density (Walker & Desanker 2004).
We assume that harvesting and straight regrowth does not affect the soil organic carbon
content.
8.3.5 Wood harvesting
Ninety percent of the aboveground biomass in Miombo woodland is suitable for charcoal
making by the earth kiln method (Chidumayo 1991). We have used a slightly more conservative
value of 85% of the biomass (above 5cm diameter at breast height) used for charcoal
production.
The decomposition rate of above ground biomass is assumed to be 0.2 year-1 and all carbon
contained in the biomass is considered to be emitted as CO2 to the atmosphere.
8.4 Dynamic carbon stock change
The carbon stock over a 100 year period for six different land management schemes is provided
in Figure 20. Each scheme starts with an identical stand of native Miombo woodland and the
stand is cleared for charcoal production in year 0. Depending on the post-harvest management
of the land, the carbon stock recovers (scenario 1), shows a new equilibrium (scenario 2) or
remains dynamic (scenario 3).

Quantis 40
Figure 20: Dynamic carbon stock model for 6 scenarios. The total carbon stock includes the carbon contained
in the living biomass and the soil organic carbon.
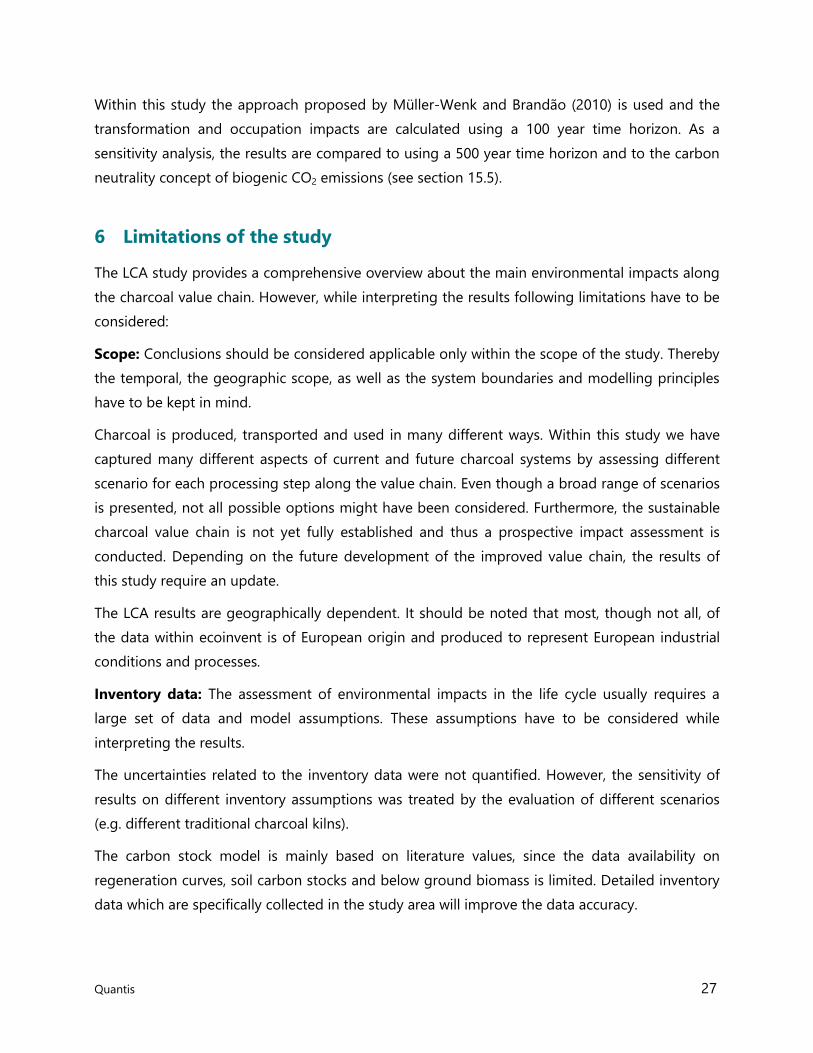
In Table 4 the average carbon stock over 100 years and the amount of harvested wood is
indicated. The amount of harvested wood is calculated based on the respective biomass stock,
the extraction efficiency and the harvesting schedule.
Quantis 41
Table 4: Cumulated CO2 uptake and emissions over 100 years, the adapted GWP characterization factor, the
harvestable wood (in ton d.m.) and the resulting GHG emissions (kg CO2 eq / kg wood) for each scenario
considered.
No Scenario
Average C stock
[Mg C ha-1]
Wood harvest (d.m.)
[Mg ha-1]
0 Natural forest 58.8 0.0
1 Cut and regrowth 55.1 37.0
2a Agriculture - permanent 18.1 37.0
2b
Agriculture - shifting
cultivation 26.1 37.0
3a Coppice cycle 20 years 42.8 145.9
3b Coppice cycle 25 years 44.8 155.0
9 Charcoal production
9.1 Introduction
Charcoal is the solid residue remaining, when biomass is carbonized or pyrolysed under
controlled conditions in a closed space such as a charcoal kiln (FAO 1987). During the
carbonization process the air entry is controlled so that the biomass does not burn as in
conventional fire, but decomposes chemically to form charcoal.
Even though wood is the most widely used raw material for charcoal making, theoretically all dry
organic material is suitable. Some materials (e.g. crop residues) return very fine grained charcoal
pieces and thus the additional process of briquetting is required.
The charcoal making process involves wood cutting (or biomass collection), kiln preparation,
carbonization and finally unloading charcoal from the kiln. The carbonization process itself can
be split into four stages of combustion, dehydration, exothermic reaction, and cooling (Boutette
& Karch 1984):
Combustion stage: The kiln is ignited by burning some of the wood and the temperature
increase from ambient temperature to 600°C. At this state, water and carbon dioxide are
driven off as heavy smoke. After the fire establishes the ignition point of the kiln is closed.
Dehydration stage: The wood is dried at a temperature scheme of 100°C to 300°C and the
mainly water being driven off as vapour.
Exothermic reaction stage: The wood breaks down and heat is produced (temperature
scheme of 300°C to 600°C). During this stage, water, methanol, ethanol, acetic acid, carbon
monoxide, carbon dioxide, hydrogen, nitrogen, methane, pitch and tars are distillated out of

Quantis 42
the wood in thick yellowish smoke. The end of carbonization is indicated by light blue
smoking of the Kiln, during which the temperature falls from 600°C to 300°C.
Cooling stage of the glowing carbon (charcoal) to ambient temperature.
9.2 Charcoal kiln technologies
In developing countries traditional earth mound or pit kilns are the most frequently used types.
Wood is cut and stacked before being covered by a controlling and damping layer and
carbonized. Where the soil is rocky, hard and shallow or has a high groundwater table, mounds
are preferred over pits. The efficiency rates of these kilns are typically low. Nonetheless, these
kilns represent practical, low-investment options for poor producers, especially when the
charcoal sector is informal (FAO 1987).
In Kilosa about four types of traditional charcoal production kilns are used. These include the box
type kiln, the rocket kiln, the mdomo wa chupa kiln and the msonge kiln, which are further
described in (Sago 2013). The kilns differ in shape and size but all can be classified as basic earth
mound kilns, the most commonly used traditional charcoal kiln throughout East Africa.
Besides the charcoal kilns already used in Kilosa, several other traditional (e.g. earth pit kiln),
improved (e.g. improved earth mound kiln) and stationary (e.g. brick kilns or retort kilns)
charcoal kiln types exist (Sago 2013).
Within this study, we compare the most used traditional kiln (basic earth mound kiln, BEK) to a
slightly modified version (improved basic earth mound kiln, IBEK). Even though brick kilns are not
considered as practicable for the remote areas, we nevertheless include the half orange brick kiln
for a theoretic comparison in order to illustrate the effect of different kiln efficiencies and to
cover the whole impact range.
Figure 21: Charcoal kilns compared in this study: basic earth mound kiln (BEK), improved earth mound kiln
(IBEK) and half-orange brick kiln (BK) (source: TaTEDO)

Quantis 43
9.2.1 Basic earth mound kiln (BEK)
The basic earth mound kiln is one of the oldest and most commonly used kilns all over East
Africa. The size of the kiln varies from a few cubic meters capacity to over 100 cubic meters. The
log pieces are stacked vertically or horizontally and the kiln shape varies from circular to
rectangular, depending on the method of stacking. To seal the pile, first straw, leaves, coarse
grass, etc., are spread over the pile and then earth or sand spread over this layer. The coating
should seal all cracks and the air holes at the base of the mound remain open (FAO 1987).
Large kilns are built and operated by a team of three to four people, while small is normally
operated by one person. The yield from these kilns varies depending on the construction,
weather condition, wood species and the experience of the operator. Carbonization time is
between 10- 14 days and cooling time is 24-48 hour on the average (Sago 2013).
9.2.2 Improved basic earth mound kiln (IBEK)
The improved basic earth mound kiln (IBEK) technology is based on a range of several low cost
improvements of the traditional earth mound kiln aiming to increase the efficiency. The
improvement includes the introduction of a chimney, an air circulation apron (arrangement of
logs), as well as ensuring that wood used is adequately dried and cut into approximately similar
sizes. During loading, plenty of small wood and branches is needed to fill the interspaces
between logs so that oxygen supply becomes limited during carbonization (Sago 2013).
TaTEDO has developed and promoted this technology for more than ten years. Even though the
IBEK shows an increased efficiency and the carbonization process is shorter, the adoption of the
IBEK faces challenges. Especially the time consuming preparation and the added costs for the
iron sheet used to form a chimney are mayor drawbacks.
9.2.3 Brick kilns (BK)
A typical brick kiln used in Tanzania is the half orange kiln (HOK), which was introduced in
Tanzania by the Ministry of Energy and Minerals in the 1980s. The kiln is made up of fired bricks
and has at least ten ventilation holes at the bottom of the kiln. The kiln is a hemisphere of about
6 meters in diameter, with a capacity of about 50 cubic meters. It needs about 6,500 bricks to
construct. A mixture of charcoal fines and mud or mud alone is used to join the bricks. The cost
of construction and training on the use of HOK is around Tsh 4million. The life of the kiln is 5-10
years.
Like with all other kilns, when unloading charcoal from HOK fire might break out as soon as the
door is opened and oxygen is supplied in the kiln. This fire has to be extinguished immediately
with water and therefore a reliable water source must be available. The carbonization process

Quantis 44
takes 14-25 days. BK are stationary kilns with a relatively high efficiency and hence it is advised
that this kiln type should be constructed in the areas with many trees or at the sawmill industries
so as to reduce cost for transporting raw material needed to produce charcoal (Sago 2013).
9.3 Inventory data used
9.3.1 System description
Carbonization is the process of burning wood or biomass in the absence of air, where wood is
converted into charcoal, liquids, gases and solid residues. In Figure 22, the main inputs and
outputs of a charcoal kiln are illustrated.
Figure 22: Schematic overview about the main input materials and outputs (charcoal, emissions and wastes)
of a charcoal kiln.
The type and amount of input materials (i.e. wood and kiln construction materials), as well as
the land required to construct the kiln, differ depending on the kiln technology used. The
amount of charcoal products from a certain amount of wood is determined by the kiln efficiency.
During the combustion and pyrolysis process various gases are emitted. Some of the air
emissions (CO2, CH4 and N2O) are greenhouse gases, while others are toxic (CO) or are
responsible for acid rains (SO2). Further, particulate matter (PM) emissions are potentially causing
cancerogenic effects on the respiratory system.
Brands are partially carbonized wood products. They are either used as a cooking fuel or remain
in the kiln chamber, along with wood ashes. According to Pennise et al. (2001) about 3.6% of the
wood is emitted as condensable liquids (tars and oils).
We use a charcoal carbon content of 73.3% and an energy content of 28 MJ/kg for this study
(Müller et al. 2011).

Quantis 45
9.3.2 Kiln efficiency and wood demand
The kiln efficiency and the charcoal quality depend on several factors, including the kiln type, the
arrangement of the wood logs, the wood species, the moisture content of wood and the
management of the carbonization process. In the following the most important ones are
described and an overview about the values used is provided.
Wood species: The U.S. Forest Products Laboratory indicates that all investigated wood species
can be used to produce charcoal with comparatively high fixed carbon (U.S. Forest Products
Labratory 1961). Nevertheless, the charcoal yield and charcoal density vary depending on the
wood type and are positively correlated with the basic density of the wood (Ishengoma & Klem
1979).
Wood moisture content: Wood moisture is expected to have a negative effect on the charcoal
yield, as the carbonization process only starts once the biomass is completely dry. The fact that
seasoned, air dried wood still has a moisture content of 12-18% (depending on the climate)
implies, that the remaining moisture has to be evaporated during the charcoal making process.
This is done by burning parts of the wood in the kiln to supply the needed energy for
evaporation.
Kiln type and management: The air circulation and carbonization temperature depend on the
kiln type used and the management (control). An increased air circulation might cause the
combustion of the wood to ash. Further, the charcoal quality depends also on the amount of
volatiles contained in charcoal. Maintaining higher carbonization temperatures will drive out and
favourable in maintaining volatiles.
The kiln efficiency values used for this study are based on measured values from the study sites
in Kilosa and are validated based on literature values.
Efficiency BEK: In Table 5 the main characteristics of BEK are listed. The charcoal yield measured
as kg charcoal per kg wood (d.m.) reported in literature and measured at the study site range
from 13.1% to more than 37% (Pennise et al. 2001; ESMAP 1991; Smith & Pennise 1999;
Mundhenk et al. 2010; Nturanabo et al. 2010; Kimaryo & Ngerza 1989; Sago 2013; Bailis 2005).
The large variations can be explained by the amount of different parameters influencing the kiln
efficiency (see above) and might also be caused by different reporting and measurement
proceedings. A review study indicated a conversion rate of most commonly used kilns ranged
between 11.8% an 25.7% and was in average of 18.8% (Chidumayo & Gumbo 2013). Given the
large variations, we model two traditional charcoal kilns, one with the measured efficiency in

Quantis 46
Kilosa of 13.1% (BEK1 scenario) and one with the mean efficiency value of 26.3% from 10 Kenyan
earth mound kilns (BEK2 scenario) based on Bailis (2013).
Efficiency IBEK: In Table 6 the main characteristics of IBEK are listed. There are not many
reported efficiency values for IBEK kilns available. The efficiency is estimated to range between
15% and 25% (Beukering et al. 2007). We’ve used the values reported from Kilosa of 19.6%
efficiency (Sago 2013).
Efficiency BK: In Table 7 the main characteristics of BEK are listed. We’ve used the average
efficiency values of 29.6% (Mohod & Panwar 2011; Smith et al. 1999; Pennise et al. 2001).

Quantis 47
Table 5: Basic earth mound kiln: literature values of the charcoal yield under different settings.
Kiln type Size Stack Density Firing Time Wood input wood moisture Wood Type Charcoal Yield Carbon Yield Energy Yield
No Country [m3] [kg/m3] [h] [kg d.m.] [on a dry basis]]
[kg charcoal (d.m.) /
kg wood (d.m.)]
[kg C charcoal/kg C
wood]
[MJ charcoal/MJ
wood] Source
1 Kenya BEK 170 782 0.667 Croton megalopolis 0.226 0.384 0.459 Pennise et al. (2001)
2 Kenya BEK 121 350 0.618 Eucalyptus 0.216 0.367 0.339 Pennise et al. (2001)
3 Kenya BEK 237 25250 0.217 Acacia mearnsii 0.280 0.477 0.470 Pennise et al. (2001)
4 Kenya BEK 233 16080 0.217 Acacia mearnsii 0.311 0.529 0.522 Pennise et al. (2001)
5 Kenya BEK 232 14600 0.217 Acacia mearnsii 0.342 0.582 0.574 Pennise et al. (2001)
6 Jamaica BEK 10 572 5719 0.34 Mix 0.290 ESMAP (1991)
7 Jamaica BEK 15 433 6501 0.34 Mix 0.260 ESMAP (1991)
8 Jamaica BEK 10 594 5943 0.16 Mix 0.300 ESMAP (1991)
9 Jamaica BEK 15 426 6389 0.19 Mix 0.260 ESMAP (1991)
10 Thailand BEK 177 0.205 Eucalyptus 0.282 Smith et al. (1999)
11 Thailand BEK 170.6 0.215 Eucalyptus 0.284 Smith et al. (1999)
12 Thailand BEK 171.3 0.21 Eucalyptus 0.327 Smith et al. (1999)
13 Thailand BEK 175 0.194 Eucalyptus 0.303 Smith et al. (1999)
14 Senegal BEK 6568 0.28 Acacia Seyal 0.300 Mundhenk et al. (2010)
15 Senegal BEK 6846 0.18 Acacia Seyal 0.220 Mundhenk et al. (2010)
16 Uganda BEK 2756 0.31 Mix 0.156 Nturanabo et al. (2010)
17 Uganda BEK 3555 0.284 Mix 0.152 Nturanabo et al. (2010)
18 Uganda BEK 3835 0.272 Mix 0.162 Nturanabo et al. (2010)
19 Uganda BEK 4709 0.243 Mix 0.157 Nturanabo et al. (2010)
20 Uganda BEK 5813 0.185 Mix 0.153 Nturanabo et al. (2010)
21 Kenya BEK 11.5 321.7 3700 0.288 T.camphoratus 0.263 Bailis (2005). average of 10 kilns
22 Tanzania BEK 7 544 3808 0.28 Acacia xanthophloea 0.280 Kimaryo & Ngereza (1989)
23 Tanzania BEK 16 532 8512 0.18 Acacia xanthophloea 0.180 Kimaryo & Ngereza (1989)
24 Tanzania BEK 4 611 2444 0.25 Acacia xanthophloea 0.310 Kimaryo & Ngereza (1989)
25 Tanzania BEK 3 353 1059 0.61 Acacia xanthophloea 0.240 Kimaryo & Ngereza (1989)
26 Tanzania BEK 6 306 1836 0.64 Acacia xanthophloea 0.260 Kimaryo & Ngereza (1989)
27 Tanzania BEK 6 247 1482 0.25 Acacia xanthophloea 0.250 Kimaryo & Ngereza (1989)
28 Tanzania BEK 3 270 810 0.33 Acacia xanthophloea 0.370 Kimaryo & Ngereza (1989)
29 Tanzania BEK 6 608 3648 0.31 Acacia xanthophloea 0.200 Kimaryo & Ngereza (1989)
30 Tanzania BEK 20 1219 24380 0.40 Acacia xanthophloea 0.170 Kimaryo & Ngereza (1989)
31 TZ, Kilosa BEK 5 800 312 4000 0.42 0.131 Sago (2013) Data from Kilosa
Average BEK 9 522 217.57 5551 0.31 0.246 0.468 0.473
Median BEK 7 532 232.68 3808 0.27 0.260 0.477 0.470
Min BEK 3 247 121.20 171 0.16 0.131 0.367 0.339
Max BEK 20 1219 312.00 25250 0.67 0.370 0.582 0.574
Values used BEK 1 5 800 312 4000 0.42 0.13 Sago (2013) Data from Kilosa.
BEK 2 5 800 312 4000 0 0.263 Bailis (2005). average of 10 kilns
Wood input YieldKiln specifications

Quantis 48
Table 6: Improved basic earth mound kiln: literature values of the charcoal yield under different settings.
Table 7: Brick kiln: literature values of the charcoal yield under different settings.
Kiln type Size Stack Density Firing Time Wood input wood moisture Wood Type Charcoal Yield Carbon Yield Energy Yield
No Country [m3] [kg/m3] [h] [kg d.m.] [on a dry basis]]
[kg charcoal (d.m.) /
kg wood (d.m.)]
[kg C charcoal/kg C
wood]
[MJ charcoal/MJ
wood] Source
1 Tanzania IBEK 14.4 0.7 7100 mix 0.250
Kempf (2007) yield according to
expert guesses
2 TZ, Kilosa IBEK 5 800 144 4000 0.4196 Acacia xanthophloea 0.196 Sago (2013) Data from Kilosa
3 TZ, Kilosa IBEK 5 800 312 4000 0.4196 Acacia xanthophloea 0.196 Sago (2013) Data from Kilosa
Average IBEK 8 534 228.00 5033 0.42 0.214
Median IBEK 5 800 228.00 4000 0.42 0.196
Min IBEK 5 1 144.00 4000 0.42 0.196
Max IBEK 14 800 312.00 7100 0.42 0.250
Values used IBEK 5 800 312 4000 0.42 0.20
Kiln specifications Wood input Yield
Kiln type Size Stack Density Firing Time Wood input wood moisture Wood Type Charcoal Yield Carbon Yield Energy Yield
No Country [m3] [kg/m3] [h] [kg d.m.] [on a dry basis]]
[kg charcoal (d.m.) /
kg wood (d.m.)]
[kg C charcoal/kg C
wood]
[MJ charcoal/MJ
wood] Source
1 India HOK 19 370 7035 0.285 mix 0.283 Mohod (2011)
2 India HOK 19 371 7055 0.283 mix 0.278 Mohod (2011)
3 India HOK 19 382 7250 0.293 mix 0.274 Mohod (2011)
4 India HOK 19 372 7070 0.3 mix 0.277 Mohod (2011)
5 India HOK 19 376 7150 0.286 mix 0.283 Mohod (2011)
6 Thailand Brick beehive 0.330 Smith et al. (1999)
7 Brasil Brick beehive 78.96 3430 0.161 0.341 0.521 0.461 Penisse et al. (2001)
Average BK 19 374 78.96 6498 0.27 0.295
Median BK 19 372 78.96 7063 0.29 0.283
Min BK 19 370 78.96 3430 0.16 0.274
Max BK 19 382 78.96 7250 0.30 0.341
Values used BK 19 374 78.96 6498 0.27 0.295 average
Kiln specifications Wood input Yield

Quantis 49
9.3.3 Land occupation and transformation
The earth mound kiln is only used for one cycle, and for the inventory it was assumed that the
carbonization and cooling takes about 14 days. The land occupation and land transformation of
BEK is based on the lifespan of the kiln and the kiln area.
9.3.4 Wood input
Particular tree species are favoured for charcoal production because of high calorific value due
to dense and hard charcoal they produce. In Kilosa the charcoal producers preferred tree species
for charcoal production in order of priority are: Mkambala (Acacia nigrescents boechmeli),
Mnhondolo (Jurbernadia globiflora), Myombo (Brachystegia bochmii) and Mhungilo (Lanmea
schmimperi) (Sago 2013).
The amount of wood demanded per kg charcoal depends on the kiln efficiency (see chapter
9.3.2) and the amount of fresh wood is calculated based on the moisture content. The wood
logs used for charcoal production in Kilosa were harvested one week before charcoal
production. Results of the moisture sampling showed average moisture content of 41.96 %
(Sago 2013). The carbon content was measured as 44%, the ash content as 0.5% and the calorific
value is 18MJ/kg dry mass.
9.3.5 Materials
Following material inputs are considered within this study. The kilns were built without the use
of machinery and the tools used are not considered within this study (production and disposal
of tools is regarded as neglectable).
Earth mound kilns: The materials used to construct earth mound kilns differs from amongst
charcoal producers and depends on the available material at the site. For this study we assume
that the covering layer is 20 cm thick and is made out of soil. To calculate the amount of soil
needed, a rectangular earth mound (6m x 2.7mx2m) was assumed, with sand covering the top
area and the side walls. A wet sand density of 1905 kg/m3 was used. Each kiln is only used once.
The improved kiln also requires a chimney. A 2.3m long chimney with a diameter of 10cm is
assumed. The chimney is made out of low-alloyed steel with a wall thickness of 2mm and a
density of 7850 kg/m3. The chimney is typically used 5 times before it is disposed.
Half orange kiln: The HOK is brick kiln which is stationary and for recurring usage. The material
used is bricks and mortar. The FAO report states the number of bricks (0.24x0.12x0.06) needed
for a kiln with 6m diameter to be 6000. For the inventory we assumed a 7m- diameter kiln as

Quantis 50
standard kiln and extrapolated linearly the number of needed bricks to 7000. A mortar layer of
30cm was assumed to cover four of the six sidewalls of the brick.
The HOK is exposed to mechanical impacts during loading and unloading and to temperature
changes during carbonization. To keep the kiln functioning for a long period of time, continuous
maintenance and replacement of damaged bricks is needed. For the inventory a cycle duration
of 14 days and an overall lifetime of 5 years was assumed.
9.3.6 Emission to air
The air emissions are provided per kg of charcoal produced and include CO2, CO, CH4, NO, N2O,
NOx, NMVOC and PM emissions. For the BEK and BK the emission values are based on Pennise
et al. (2001) and Smith et al. (1999).
Table 8: Emission profile of different charcoal kilns.
The emission specific for traditional kilns (BEK1) and improved kilns (IBEK) in Kilosa are
approximated, based on the carbon balance (see chapter 9.3.8).
9.3.7 Emission to soil and water
The brands are partially carbonized wood products and are considered to remain at the site.
According to Pennise et al. (2001) per kg of charcoal 230 g of brands are produced for BEK,
while the amount of brands for BK is significantly lower (38g). The ash is assumed to remain in
the soil (0.64g C / kg charcoal) (Pennise et al. 2001).
Even though not having a direct influence on the carbon balance, it has to be noted that the
heat release over several days during carbonization (500-600°C) destroys all plants at the kiln
site (incl. root stock, seedlings and seeds in the seedbed). Herbaceous vegetation from seed
dispersal may establish within few years, while Miombo trees will not be colonized for long
terms (slow growth and short distance dispersion of seeds). Farmers interviewed indicated that
they perceive the soil as more fertile as compared to the surrounding land and thus suitable for
agriculture.
Kiln type Country Wood species CO2 CO CH4 TNMHCNO Nox N2O TSP PIC gases+TSP Source / Comment
BEK KE Croton megalopolis 1992 207 35.2 90.3 0.058 0.087 0.12 41.2 374 2366 Penisse et al. (2001)
BEK KE eucalyptus 3027 333 46.2 94.9 0.055 0.13 0.3 34.1 508 3535 Penisse et al. (2001)
BEK KE Acacia mearnsii 1787 240 47.9 93.8 0.035 0.16 25 407 2194 Penisse et al. (2001)
BEK KE Acacia mearnsii 1147 195 61.7 124 0.045 0.084 38.7 419 1566 Penisse et al. (2001)
BEK KE Acacia mearnsii 1058 143 32.2 60.1 0.021 0.068 12.8 248 1306 Penisse et al. (2001)
BEK Thai 1140 302.3 40.7 215.6 0.003 1.5 560 1700 Smith et al. (1999)
BEK Average KE 1802 224 45 93 0.06 0.06 0.15 30 391 2193 Average of Kenyan emissions were used
BK Thai 966 162 31.8 29.7 0.017 1.9 225 1191 Smith et al. (1999)
BK Brazil 1382 324 47.6 80.9 0.028 0.045 453 1835 Penisse et al. (2001)
BK Average 1174 243 39.7 55.3 0.06 0.03 0.03 1.9 339 1512.95 Same NO emissions as from the BEK kiln are assumed.
Air emissions [g/kg charcoal]

Quantis 51
9.3.8 Carbon balance
In Table 9, the carbon balance per kg of charcoal produced is provided for the compared kiln
technologies. The carbon input is determined by the carbon content of wood (44%) and the kiln
efficiency. The carbon contained in charcoal shows large variations. We’ve used an average value
from an extensive literature review of 73.3% (Müller et al. 2011). The carbon contained in brands,
condensables, ashes and total suspended particles is based on (Pennise et al. 2001).
For the BEK2 and BK the emission values as provided in chapter 9.3.6 were used. For the BEK1
and IBEK no emission profile is available. We’ve calculated subtracted the carbon emitted as
solids from the carbon input from wood. The balance is assumed to be emitted as airborne
emissions by the same emission shares as for BEK2.
Table 9: Carbon balance for the different kiln per kg charcoal produced.
9.3.9 Inventory data
The life cycle inventory data for the compared kilns is provided in Table 10.
Exchange Unit BEK 1 BEK 2 IBEK 1 BK
Input
Carbon in wood g 3'360 1'600 2'240 1'290
Output
C-Charcoal g 733 733 733 733
C-Brands g 120 120 120 20
C-Condensables g 101 47 67 42
C-Ash g 0.6 0.6 0.6 0.6
C-CO2 g 1'692 492 928 320
C-CO g 330 96 181 104
C-CH4 g 115 33 63 30
C-TNMHC g 227 66 125 39
C-TSP g 41 12 23 1

Quantis 52
Table 10: Life cycle inventory data of the compared kilns.
9.4 Charcoal packaging
Charcoal packaging is important in terms of marketing and also to trace the production chain of
charcoal. However, the sustainable charcoal packaging is not yet designed. Charcoal is typically
bagged in traditional “gunias” (sisal bags) or in plastic bags (Bess 2013). For this study we’ve
used a bag out of polypropylene weighing 100g.
Exchange Unit BEK 1 BEK 2 IBEK 1 BK Comment Ecoinvent name
Efficiency % 13.1% 27.5% 19.6% 34.1% Average values from field survey and literature. -
Kiln size t wood [d.m.] 4 4 4 42 Average values from field survey and literature. -
Firing time h 312 312 228 79 Average values from field survey and literature. -
Wood input
wood (dry) kg 7.64 3.64 5.09 2.93 Calculated based on the efficiency
wood (moist) kg 13.64 6.49 9.09 5.24 Based on a moisture content of 44%
Materials
Sand kg 55.65 26.50 37.10
Sand and grass leaves / branches directly from the site are used to
construct the kilns. The amount of sand has been calculated based on
the kiln surface (6m x 2.7m x 2m) and thickness of the layer (30cm). sand, extracted for use
Cast iron, at plant/RER
Sheet rolling, steel/RER
Mortar g 1.8
Calculated based on total weight of mortar (3387 kg) and the lifespan
production of the kiln (14305 kg charcoal per cycle and 130 cycles).
Since now Tanzanian mortar inventory is available, the process is
approximated with Swiss lime mortar production (conservative Lime mortar, at plant/CH
Bricks g 13.9
Calculated based on total weight of mortar (26188 kg) and the lifespan
production of the kiln (14305 kg charcoal per cycle and 130 cycles). Since
now Tanzanian brick inventory is available, the process is approximated
with European brick production (conservative assumption). Brick, at plant/RER
Land use
Land occupation m2a 1.1E-03 5.2E-04 5.4E-04 1.8E-05
Calculated based on the firing time, the kiln area and the amount of
charcoal produced. Occupation, mineral extraction site
Transformation, from shrub land
Transformation, to mineral extraction
site
Emissions
CO2 g 6204 1802 3402 1174 Carbon dioxide
CO g 770 224 422 243 Carbon monoxide
CH4 g 154 45 84 40 Methane
NO g 0.19 0.06 0.11 0.06 Nitrogen monoxide
NOx g 0.22 0.06 0.12 0.03 Nitrogen oxide
N2O g 0.50 0.15 0.28 0.03 Dinitrogene oxide
TSP g 105 30 57 2 Particulates, < 10 um
TNMHC g 319 93 175 55
NMVOC, non-methane volatile organic
compounds, unspecified origin
Wastes
Brands g 230 230 230 38
Assumed to be remained on ground. No impacts or benefits are
considered.
Condensables g 139 65 92 58 Modelled as emissions to soil Oils, unspecified
Ash g 64 64 64 64 Modelled as emissions to soil
Disposal, wood ash mixture, pure, 0%
water, to land farming/CH
Steel g 0.3 Assumed to be recycled or reused. -
Mortar g 1.8
Disposal, building, cement (in concrete)
and mortar, to sorting plant/CH U
Bricks g 1.8
Disposal, building, brick, to final
disposal/CH
Charcoal kg 1 1 1 1
Steel g 0.28878
Calculated based on the total weight of steel used (1.1kg), the lifespan of
the chimney (5 times) and the amount of charcoal produced. Both, the
Land
transformation m2 9.65 4.59 4.70 0.16
Calculated based on the firing time, the kiln area and the amount of
charcoal produced.

Quantis 53
10 Transportation
10.1 Introduction
Transportation and trade is an important component of the charcoal value chain and the choice
of transportation vehicles does not only influence the economic, but also the environmental cost
of charcoal. The transport and trading set-up of charcoal from the production site to the end
consumer can differ significantly and in the following an overview about typical transport and
trade forms is provided.
Charcoal traders, transporters and middlemen at the supply side: In general charcoal
producer sell their charcoal to charcoal traders at the production site, where it is transported by
hand or bicycle to a location where the charcoal bags can be loaded on larger transport vehicles.
However, about 36 percent of charcoal producers use bicycles and transport the charcoal bags
manually to nearby main roads or nearby retailer market (Sago 2013). Between Msimba and
Mikumi, approximaly 100 middlemen along the highway to Dar es Salaam buy constantly
charcoal from the producers and sell it directly to transporters/traders (Wymann von Dach et al.
2013).
Middlemen at the demand side, wholesalers & retailers: While middlemen function as
information brokers establishing links between traders and wholesalers, especially in times of
high or low supply, there are also wholesalers who directly purchase charcoal from the producer
and act as trader, transporters, and wholesalers (Wymann von Dach et al. 2013). The charcoal
bags are typically transported to retailer shops, selling a few bags per months, where charcoal is
sold in buckets or tin sizes to the end consumer.
In the following an overview about i) the transportation distances ii) the different transportation
vehicles and iii) the data relevant for the LCA study is provided.
10.2 Transportation distances
10.2.1 From village to nearby city
The transportation distances and the road quality from the study sites to the nearby urban
centers are provided in Table 11. An average transport distance of 20km on earth road is
assumed to transport charcoal from the village to the nearby city (Kilosa or Mikumi).

Quantis 54
Table 11: Transportation distances and road quality from the charcoal villages under study area to the
nearby city.
Village Distance (km) Road
quality8
Comment
Dodoma-Isanga to
Kilosa
17km Earth road The road to the village is accessible all year round.
In Dodoma Isanga village there is no single charcoal
transporter who uses motorbike, also charcoal
producers /dealers prefer selling their charcoal in Kilosa,
no charcoal is sold along the roadside.
Nyali to Kilosa 23km (long)
19km (short)
Earth road The road to the village is not well accessible, to get to
the village by car a longer route has to be used (the
bridge is broken).
Kigunga to Kilosa 20km Earth road The road is accessible all year round
Ulaya Mbuyuni to
Kilosa
27km Earth road The road is accessible throughout the year
Ihombwe to Mikumi 25km
Earth road Charcoal from Ihombwe is transported to Mikumi,
rather than to Kilosa. The road to the village is
accessible all year round
Msimba to Mikumi 10km Tamarc road In Msimba village charcoal producers/dealers prefer
selling their charcoal on the road side than bringing the
charcoal to Mikumi town.
Total 20km (average) Earth road
10.2.2 From small cities to Morogoro and Dar es Salaam
The transportation distances from Kilosa and Mikumi to Morogoro and Dar es Salaam were measured via
google earth and the distances are verified by the driver.
8 Indicate the road quality: Tarmac or earth roads

Quantis 55
Table 12: Transportation distances from Kilosa and Mikumi to Morogoro and Dar es Salaam.
Road type Unit
Kilosa –
Morogoro
Mikumi –
Morogoro
Morogoro –
Dar es Salaam
Tarmac road km 83 122 194
Earth road km 29 0 0
Total km 112 122 194
10.3 Transportation vehicles
In Table 13 an overview about the main transportation vehicles and their characteristics is
provided. The values contained in the table are based on interviews, which are provided in the
annex. Even though charcoal transportation by train is currently no alternative, we included a
freight transport as a theoretical comparison. Train not considered as an option.
Table 13: Overview about the carrying capacity, the fuel consumption and charcoal losses associated to
typical transportation vehicles in the charcoal sector.
11 Retail and distribution
We have interviewed two wholesalers, five retailers and two acting as both, wholesaler and
retailer (see annex 17.5). Depending on the consumer, the charcoal is bought directly from the
charcoal producer, from the wholesaler or retailer and thus, the impacts associated to this life
cycle stage are highly variable. However, it is assumed that the impacts are low compared to the
charcoal production, the long distance transport and the use of charcoal. Thus, we do not focus
on assessing the impact of different retail systems, but assume default values for transportation
and charcoal losses.
Vehicle Capacity Fuel (tarmac) Fuel (earth road) Returns Bursts Losses Dataset used / Comment
[kg charcoal] [kg/100km] [kg/100km] [% empty] [% bursts] [% lost]
Bicycle 53 - - N.A. 21.6% 7.4%
Ecoinvent DS "Transport, bicycle" is used. The unit is
personkm.
The losses are based on average values from Kilosa
(N=10).
Motorcycle 92 2.0 5.3 58.9% 5.3% 3.5%
Ecoinvent DS "Transport, scooter" is used, while the
fuel use is adapted according to the average values
from Kilosa (N=6).
Truck, small 3.5 - 7.5 tons 15.1 26.9 20.0% N.A. 0.6%
Ecoinvent DS "Transport, lorry 3.5-7.5t, EURO3" is
used, while the fuel use is adapted according to the
average values from Kilosa (N=5).
Truck, big
16 - 32 tons 32.8 -
20% N.A. 0.6%
Ecoinvent DS "Transport, lorry >32t, EURO3/RER" is
used as an approximation, while the fuel use is
adapted according to the average values from
Kilosa (N=4).
Pick up N.A. 9.1 N.A. 0% N.A. 0.1%
Ecoinvent DS "Transport, passenger car, diesel,
EURO3" is used, while the fuel use is adapted
according to the average values from Kilosa (N=2).
RailN.A. 0% N.A. N.A.
Ecoinvent DS "Transport, freight, rail, diesel" is used
as an approximation. 0.0107 [kg diesel per ton.km]

Quantis 56
Transportation of charcoal to the retail store: Charcoal is transported from and to
wholesalers and retailers by using different vehicles, ranging from wheelbarrows, bicycles,
motorcycles to small trucks. In this study we assume that the distribution within an urban area is
conducted by a small truck, driving 10km.
Charcoal packaging: Charcoal is usually bought by different tin sizes (2kg to 10kg) and the
charcoal is typically transported in small plastic bags from the retail shop to home (10g/kg
charcoal). In some cases consumers also buy whole charcoal bags (28kg to 70kg). We assume
that a medium size HDPE carrier bag (10g) is used to transport five kg of charcoal (used once).
5kg is on a higher side, the commonly used plastic bags could have average weight of 1kg to
1.5kg
Charcoal losses: Each time the charcoal bag is moved some charcoal is lost and also the
charcoal quality is reduced to some extent, since charcoal pieces might be broken into smaller
parts and ultimately into charcoal dust. In average at a retail shop between 2% and 14.5%
(average of 5.4%) of the charcoal cannot be sold given the small size. While some pieces can still
be used by the shop owner for cooking, the fine particles are lost. We assume that most of the
losses (5%) are very fine dust, which is generally not used anymore.
Table 14: Life Cycle inventory of charcoal retail (per kg charcoal).
Parameter Charcoal trade Unit Comment Ecoinvent Name
Charcoal losses 5% %
Based on average losses from
Kilosa/DSM (N=9) -
Material
Charcoal 1.05 kg -
Plastic bag 2.00 g Plastic bag for charcoal transport
Polyethylene, LLDPE, granulate
Extrusion, plastic film
Transport
Truck, small 1.1E-02 tkm
Estimate: 10km with a small lorry from
the wholesaler (stop of long distance
transport) to the retailer. Transport, lorry 3.5-7.5t, EURO3
Emissions to soil
Charcoal dust 50 g Not used. And disposed on the floor Disposal, wood ash mixture
Output
Charcoal, at retailer
shop 1 kg -

Quantis 57
12 Charcoal use
12.1 Introduction
Wood and charcoal are by far the main energy source for cooking. Traditionally cooking stoves
are built out of metal and are characterized by their poor combustion efficiency resulting in
excessive biomass use. Alternatives to traditional cook stoves, so called improved cook stoves
(ICS), have been studied, promoted and commercialized in East African countries since the
1980’s. However, despite many efforts by a wide variety of stakeholders, the actual use of ICS
remains limited. According to UNDP only 1% of the Tanzanian household have access to ICS
(UNDP 2009). Riedijk estimated that the market size that can be reached in Tanzania is still more
than 4,000,000 households (out of 8,750,000 households in total) mainly located in rural areas,
who are not aware of the energy and money saving potential that awaits them when using
improved cook stoves (Riedijk 2011).
We compare 3 different cooking stoves used by housholds: traditional metal stove, the most
common improved stove (Jiko Bora) and most efficient stove (Sazawa). Both improved stoves
are built by SECCO, a spin-off company of TaTEDO. The data is based on primary data from
stove producers and is completed with data from literature.
12.2 Overview about the compared stoves
In Tanzania most currently stoves currently used are the “traditional stoves” built out of metal.
As indicated above, traditional stoves have low energy efficiencies and release a broad range of
pollutants strongly affecting human health (indoor pollution). Thus, increasing efficiency does
not only reduce charcoal demands, but also the indoor air pollution.
There exist quite a range of different improved stoves9 types tailored for different needs in terms
of shape, size and materials. The Sazawa and Jiko bora stoves are improved charcoal stove
models frequently used by urban households developed by TaTEDO and produced by SEECO.
The main improvement is one or two lime ceramic liners which increases the heat storage
9There is no international standard or definition of an „improved stove“. However, in practice an improved
stove should generally save more than 50% of the biomass compared to the traditional stove and/or
decreases the incomplete combustion of biomass and thus decreases the air pollution.

Quantis 58
capacity compared to metal stoves. Thus, the heat losses can be reduced and the energy
efficiency increases.
The stove most sold by SEECO is the straight Jiko bora stove being developed in 1988 and
promoted since 1992.10 The Sazawa stove was established and promoted in 1994. The most
popular stove size used in urban households is 10 inch (254mm) in diameter, which is also used
as the stove size in this study.
Figure 23: Traditional stove (left), Single lime ceramic liner stove Jiko Bora (middle) and the double lime
ceramic liner stove Sazawa (right).
On overview about the main characteristics of each stove technology is provided in Table 15.
Table 15: Summary of the main characteristics of traditional and improved charcoal stoves.
Traditional stove Jiko Bora Sazawa
Weight (kg) 1 kg -2 kg 5 kg 7 kg
Materials Iron Iron, clay, cement,
vermiculite
Iron, clay, cement,
vermiculite
Capacity (g Charcoal) 500g 300g 300g
Efficiency (%) 18-22% 31% (average, WBT) About 44% (estimate)
Lifespan (days) 1 year 3 years (replace liner)
6 years (dispose)
3 years (replace liner)
6 years (dispose)
10 http://www.tatedo.org/files/publications/Brochures/charcoalstovebro.pdf
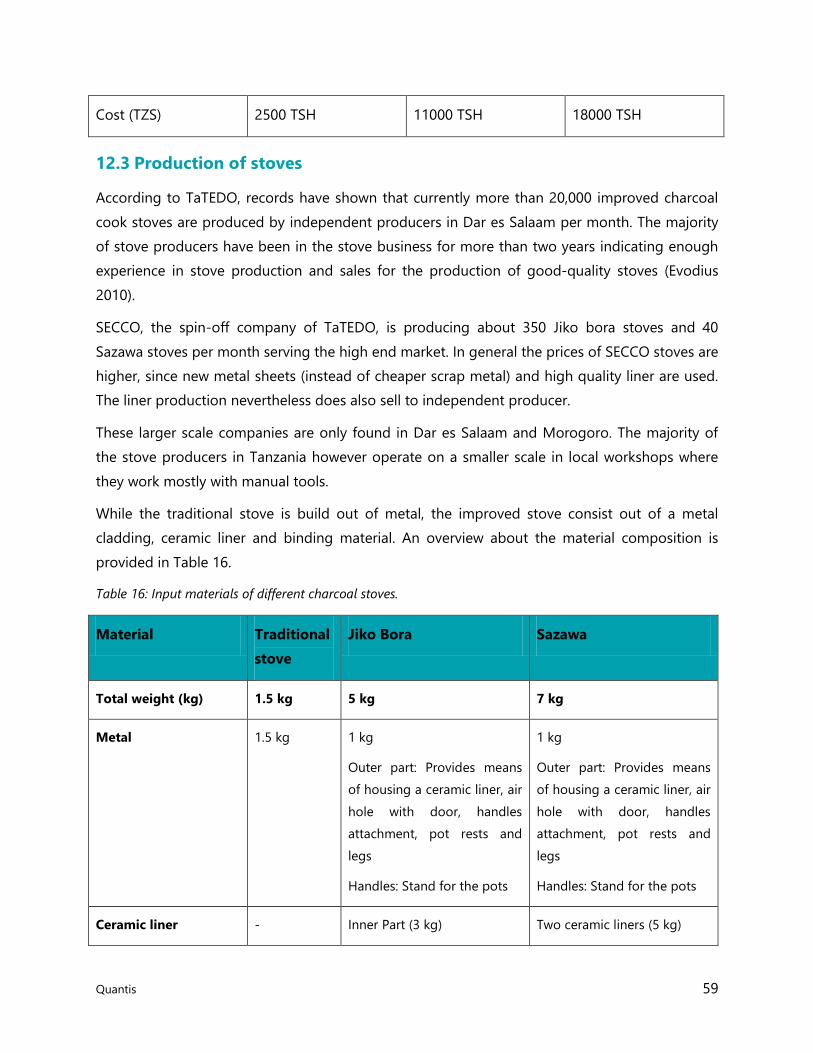
Quantis 59
Cost (TZS) 2500 TSH 11000 TSH 18000 TSH
12.3 Production of stoves
According to TaTEDO, records have shown that currently more than 20,000 improved charcoal
cook stoves are produced by independent producers in Dar es Salaam per month. The majority
of stove producers have been in the stove business for more than two years indicating enough
experience in stove production and sales for the production of good‐quality stoves (Evodius
2010).
SECCO, the spin-off company of TaTEDO, is producing about 350 Jiko bora stoves and 40
Sazawa stoves per month serving the high end market. In general the prices of SECCO stoves are
higher, since new metal sheets (instead of cheaper scrap metal) and high quality liner are used.
The liner production nevertheless does also sell to independent producer.
These larger scale companies are only found in Dar es Salaam and Morogoro. The majority of
the stove producers in Tanzania however operate on a smaller scale in local workshops where
they work mostly with manual tools.
While the traditional stove is build out of metal, the improved stove consist out of a metal
cladding, ceramic liner and binding material. An overview about the material composition is
provided in Table 16.
Table 16: Input materials of different charcoal stoves.
Material Traditional
stove
Jiko Bora Sazawa
Total weight (kg) 1.5 kg 5 kg 7 kg
Metal 1.5 kg 1 kg
Outer part: Provides means
of housing a ceramic liner, air
hole with door, handles
attachment, pot rests and
legs
Handles: Stand for the pots
1 kg
Outer part: Provides means
of housing a ceramic liner, air
hole with door, handles
attachment, pot rests and
legs
Handles: Stand for the pots
Ceramic liner - Inner Part (3 kg) Two ceramic liners (5 kg)

Quantis 60
Binder - Cement - Insulation zone (0.3 kg) Insulation zone (0.3 kg)
Binder - Vermiculite - Insulation zone (0.7 kg) Insulation zone (0.7 kg)
Binder - Water - Insulation zone 0.5 litre water Insulation zone 0.5 litre water
12.3.1 Metal processing
New Iron sheets are used to produce the improved stoves. Metal bending is done manually and
for cutting the metal sheets, scissors are used. Metal is expensive for the small scale
entrepreneurs, therefore most stove producers often choose to buy scrap metal of less quality.
However, high quality stoves from SEECO are constructed out of new metal sheets.
Depending on the stove size and type there are some metal pieces which cannot be reused to
shape other parts of the stove. In average about 100g of metal ends up as waste and is sold for
200TSH/kg to a scrap dealer.
Figure 24: Metal workshop (left) and metal scrap (right).
12.3.2 Ceramic liner production
The ceramic liner production is conducted locally and includes following processing steps.
1. The clay is bought from a nearby production site and transported to the SEECO liner
production site.
2. The clay is mixed with water and modelled according to the desired shape and size. On the
same day, also the characteristic holes are punched out.
3. The liner is sun dried for 3 days.
4. The dried clay is burnt in a kiln for 5 days.

Quantis 61
Figure 25: Clay pile and modelling (left), sundried clay liner (middle) and cracked liner (right).
The SEECO kiln has a capacity of 500 liners out of which about 30 do crack or are not burned
properly, depending on the quality of firewood. The process endures 5 days during which the
fire is maintained continuously. In total about 2 tons of firewood is used for the process.
The ecoinvent inventory data “clay, at mine” has been used to approximate the clay production.
12.3.3 Binder production
A mixture out of cement, water and vermiculite is used to bind the liner to the cladding.
12.3.4 Inventory data of stove production
The life cycle inventory to produce one traditional, the jiko bora and the sazawa stove are
provided in Table 17.

Quantis 62
Table 17: Life cycle inventory data of stove production. The inputs and outputs are provided per stove
produced.
12.4 Transport of Stoves
The vehicle used to transport the stove from the production site to the end consumer is chosen
according to the amount and transportation distance of ordered stoves. It can range from a
motorbike transport to the use of heavy trucks. For this study a typical transportation vehicle of
a small scale lorry (Transport, lorry 3.5-7.5t, EURO3) and an average transportation distance of
50km to the end consumer are assumed.
12.5 Use of Stoves
12.5.1 Efficiencies and input Material
The performance of a cooking stove depends on a number of factors such as type and quality of
fuel, construction material, quality of construction, stove handling, wind conditions and water
spoilage. The efficiency of stoves can be measured in different ways. In this study we define
efficiency as the ratio of the energy entering the pot to the energy content of the fuel
consumed. The standard water boiling test (WBT) is used for testing the efficiency of the stoves.
Input
Traditional
stove Jiko Bora Sazawa Unit Comment Ecoinvent Name
Material
Metal 1.6 1.1 1.1 kg
Estimate: Weight in final product and
considering a scrap rate.
Steel, low-alloyed, at plant
Sheet rolling, steel
Liner 3.18 5.3 kg
Estimate: Mass balance and
considering a scrap rate of 6% Lime mortar, at plant
Cement 0.3 0.3 kg Estimate: Mass balance Cement, unspecified, at plant
Vermiculite 0.7 0.7 kg Estimate: Mass balance Expanded vermiculite, at plant
Water 0.5 0.5 kg Estimate. Tap water, at user
Energy
Wood burned (liner
production) 60.0 100.0 MJ
Calculated based on 2tons of wood
per 530 clay liner (3kg) and a wood
heating value of 15MJ/kg.
Logs, hardwood, burned in wood
heater 6kW
Infrastructure
Building hall 3.33E-04 3.33E-04 3.33E-04 m2
Estimate based on size (100m2),
lifespan 50 yrs and annual production
500 stoves per month Building, hall, steel construction
Transport
Truck 0.08 0.26 0.37 tkm
Estimate: 50km with a small lorry
(metal, cement, clay and vermiculite).
For the liner no transport is assumed,
since the production site is just next
door. Transport, lorry 3.5-7.5t, EURO3/RER
Waste
Scrap metal 0.1 0.1 0.1 kg Recycling process (cut-off).
Output
Traditional stove 1 Piece
Straight wall Jiko Bora 1 Piece
Sazawa (double liner) 1 Piece

Quantis 63
In the WBT, a known quantity of water is heated on the stove under the conditions of heating up
and simmering. Water is brought to boil during the heating up phase and is maintained within
5°C of boiling for 30 minutes. The overall thermal efficiency is defined as the ratio of useful
energy (delivered to the cooking pot) to total net energy (in the fuel).
The thermal efficiencies of different stove types are listed in Table 18 and are based on literature
(Bhattacharya et al. 2002; Boafo-Mensah et al. 2013; Jetter et al. 2012). The efficiencies of
charcoal-fired cooking stoves were varied rather widely from 13% to 36%. The estimated
efficiency of traditional charcoal stoves is about 15%. However, Jetter et al. (2012) compared the
metal jiko stove from Kenya with the ceramic jiko and indicated that the thermal efficiency (24%
to 25%) and fuel consumption were nearly the same for both stoves. Also the stove testing in
Ghana indicated a relatively high efficiency of traditional metal stoves of 23%. In order to cover
the whole range of potential efficiencies we model 2 traditional stoves, one with 15% efficiency
and another one with 24%. For the improved cooking stove “Jiko Bora” we use the WBT
measurements from the University of Dar es Salaam, which indicated a cold start thermal
efficiency of 29%. Based on the literature values we conclude that the estimated efficiency of
44% of the Sazawa stove11 is too high and calculate with a more accurate efficiency of 35%.
11 http://www.tatedo.org/files/publications/Brochures/sazawabro.pdf

Quantis 64
Table 18: Thermal efficiencies of different stove types.
12.5.2 Transport
The charcoal is usually transported by hand or bicycle from the retailer to home. The
environmental impact of charcoal transport to the end consumer (from retailer) is considered as
not relevant compared to the environmental impacts related to charcoal production, long
distance transport and use.
Stove typeThermal
efficiencyMethod Source
Cambodian traditional 15% WBT (N=3) Bhattacharya et al. (2002)
Thai-bucket cookstove 16% WBT (N=3) Bhattacharya et al. (2002)
Chinese traditional 13% WBT (N=3) Bhattacharya et al. (2002)
QB Phil. charcoal/firewood 27% WBT (N=3) Bhattacharya et al. (2002)
Phil. charcoal/wood 22% WBT (N=3) Bhattacharya et al. (2002)
Lao improved 17% WBT (N=3) Bhattacharya et al. (2002)
Vietnamese improved 25% WBT (N=3) Bhattacharya et al. (2002)
Malaysian improved 18% WBT (N=3) Bhattacharya et al. (2002)
Bang Sue stove 18% WBT (N=3) Bhattacharya et al. (2002)
Tanzania Sahara 29% WBT (cold start) UDSM
Tanzania TaTEDO 29% WBT (cold start) UDSM
Tanzania KUUTE 35% WBT (cold start) UDSM
Ghana Ahinbenso 31% WBT (cold start) Boafo-Mensah et al. (2013)
Ghana traditional 23% WBT (cold start) Boafo-Mensah et al. (2013)
Ghana improved (Gyapa) 23% WBT (cold start) Boafo-Mensah et al. (2013)
GERES, charcoal fuel 25% WBT (cold start) Jetter et al. (2012)
Gyapa, charcoal fuel 27% WBT (cold start) Jetter et al. (2012)
Jiko Ceramic, charcoal fuel 25% WBT (cold start) Jetter et al. (2012)
Jiko Metal, charcoal fuel 24% WBT (cold start) Jetter et al. (2012)
KCJ Standard, charcoal fuel 32% WBT (cold start) Jetter et al. (2012)
Kenya Uhai, charcoal fuel 30% WBT (cold start) Jetter et al. (2012)
StoveTec Charcoal, charcoal fuel 36% WBT (cold start) Jetter et al. (2012)
Tanzania traditional 1 15% Estimated TaTEDO
Tanzania traditional 2 24% WBT (cold start) Jetter et al. (2012)
Tanzania Jiko Bora 29% WBT UDSM
Tanzania Sazawa 35% Estimated TaTEDO

Quantis 65
12.5.3 Air emissions
The airborne emissions are calculated based on several emission profiles of different cooking
stoves, as indicated in Table 19 (Bhattacharya et al. 2002; Jetter et al. 2012; Brocard et al. 1998;
Bailis et al. 2003; Smith & Pennise 1999). The air emissions depend on many variables, including
the fuel quality, the stove types, the environmental conditions and the operation of the stoves.
Given the large variations amongst the laboratory and field tests, no stove specific emission
ratios could be established. Instead, the average emissions per kg charcoal burned was used to
model the emission. Thereby, the emissions per kg charcoal burned was multiplied with the
amount of charcoal used to establish the stove specific emission profiles (g/MJ delivered).

Quantis 66
Table 19: Emission profile of several charcoal cooking stoves measured in g per MJ delivered (green) and g per kg fuel (purple).
Stove typeThermal
efficiencyCO CO2 CH4 TNMOC NOx THC PM CO CO2 CH4 TNMOC NOx THC PM Source
Cambodian traditional 15% 8.4 579.3 1.9 1.6 0.02 34.2 2352.0 7.7 6.5 0.07 Bhattacharya et al. (2002)
Thai-bucket cookstove 16% 7.9 475.1 1.5 1.3 0.01 35.7 2155.0 6.8 5.8 0.03 Bhattacharya et al. (2002)
Chinese traditional 13% 50.0 696.0 2.2 2.4 0.09 175.0 2436.0 7.8 8.5 0.30 Bhattacharya et al. (2002)
QB Phil. charcoal/firewood 27% 26.2 301.1 1.1 1.3 0.03 198.0 2276.0 8.0 9.7 0.22 Bhattacharya et al. (2002)
Phil. charcoal/wood 22% 25.7 426.4 1.3 1.4 0.02 155.0 2567.0 7.8 8.5 0.14 Bhattacharya et al. (2002)
Lao improved 17% 29.0 530.5 2.1 1.4 0.04 134.0 2451.0 9.8 6.3 0.19 Bhattacharya et al. (2002)
Vietnamese improved 25% 12.5 319.0 1.5 0.7 0.04 87.2 2233.0 10.8 4.8 0.30 Bhattacharya et al. (2002)
Malaysian improved 18% 30.8 511.1 1.6 1.2 0.09 155.0 2576.0 8.2 6.2 0.43 Bhattacharya et al. (2002)
Bang Sue stove 18% 34.9 501.4 1.7 1.5 0.08 178.0 2555.0 8.7 7.8 0.42 Bhattacharya et al. (2002)
GERES, charcoal fuel 25% 43.7 402 2.8 4.4 0.9 303.5 2791.5 19.4 30.6 6.2 Jetter et al. (2012)
Gyapa, charcoal fuel 27% 38.1 333 1.6 3.2 1.06 282.7 2470.9 11.9 23.7 7.9 Jetter et al. (2012)
Jiko Ceramic, charcoal fuel 25% 41.6 539 3.3 5.6 1.02 294.7 3818.3 23.4 39.7 7.2 Jetter et al. (2012)
Jiko Metal, charcoal fuel 24% 30.9 464 4.2 7.5 1.05 210.2 3157.1 28.6 51.0 7.1 Jetter et al. (2012)
KCJ Standard, charcoal fuel 32% 40.4 320 1.6 2.5 0.84 365.4 2894.1 14.5 22.6 7.6 Jetter et al. (2012)
Kenya Uhai, charcoal fuel 30% 16.9 367 1.5 2.2 0.39 142.4 3093.1 12.6 18.5 3.3 Jetter et al. (2012)
StoveTec Charcoal, charcoal fuel 36% 301 0.7 5.4 0.43 3042.5 7.1 54.6 4.3 Jetter et al. (2012)
Kenya - charcoal stove 260.0 2280.0 18.0 3.2 0.4 Bailis et al. (2003)
India - charcoal cooking stove 275.0 2410.0 7.9 10.5 2.4 Smith et al. (1999)
West Africa - charcoal fuel 211.0 2260.0 2.4 0.4 Brocard et al. (1998)
IPCC default factor 200.0 2400.0 6.0 3.0 2.4 IPCC
Average 23% 29.1 441.6 1.9 1.4 0.05 4.4 0.8 194.6 2'610.9 11.4 6.2 0.23 34.4 4.9
Min 13% 7.9 301.0 0.7 0.7 0.01 2.2 0.4 34.2 2'155.0 2.4 0.4 0.03 18.5 0.4
Max 36% 50.0 696.0 4.2 2.4 0.09 7.5 1.1 365.4 3'818.3 28.6 10.5 0.43 54.6 7.9
Tanzania traditional 1 15% 46.3 621.6 2.7 1.5 0.056 8.2 1.2 194.6 2610.9 11.4 6.2 0.2 34.4 4.9
Tanzania traditional 2 24% 28.6 383.7 1.7 0.9 0.0 5.1 0.7 194.6 2610.9 11.4 6.2 0.2 34.4 4.9
Tanzania Jiko Bora 29% 24.0 321.5 1.4 0.8 0.029 4.2 0.6 194.6 2610.9 11.4 6.2 0.2 34.4 4.9
Tanzania Sazawa 35% 19.9 266.4 1.2 0.6 0.024 3.5 0.5 194.6 2610.9 11.4 6.2 0.2 34.4 4.9
Air emissions [g / MJ delivered to pot] Air emissions [g / kg fuel]

Quantis 67
12.6 Disposal of ash and stoves
The lifespan of the traditional stove is according to experts about 1-2 years, while the improve
stove lasts up to 3 years. After 3 years the liner is usually broken and as to be replaced. After
replacing the liner, the stove lasts another 3 years until it has to be disposed. The liner is usually
landfilled and the metal parts are collected and recycled. The disposal of the ash is assumed to
be carbon neutral.
Figure 26: Picture of a waste stove
12.7 Inventory data
In Table 20 the life cycle inventory data of the compared charcoal stoves is provided.

Quantis 68
Table 20: Life cycle inventory data of compared charcoal stoves per MJ heat delivered to pot.
The carbon balance for the different cooking stoves is conducted, taking the carbon input
(carbon content of charcoal of 71%) and the carbon output contained in the air emissions and
any unconsumed carbon in char and ash.
Traditional
stove 1
Traditional
stove 2 Jiko Bora Sazawa Unit Comment
Efficiency 15.0% 24.3% 29.0% 35.0% % MJ delivered to pot / MJ fuel
Lifespan 1460 1460 8760 8760 hours
Material
Charcoal 0.28 0.17 0.14 0.12 kg Calorific value of charcoal (23.9MJ/kg)
Stove 5.3E-04 3.3E-04 4.6E-05 3.8E-05 piece
Based on the lifespan, a burning rate of
6g/min and the efficiency of the stove
Transport
Truck 4.2E-05 8.6E-05 1.2E-05 1.4E-05 tkm
Estimate: 50km with a small lorry from the
stove production site to the end consumer.
Ecoinvent name: Transport, lorry 3.5-7.5t,
EURO3/RER
Emissions to air
CO 46.3 28.6 24.0 19.9 g Carbon monoxide
CO2 621.6 383.7 321.5 266.4 g Carbon dioxide
CH4 2.7 1.7 1.4 1.2 g Methane
TNMOC 1.5 0.9 0.8 0.6 g
NMVOC, non-methane volatile organic
compounds, unspecified origin
NOx 0.056 0.034 0.029 0.024 g Nitrogen oxides
PM 1.164 0.719 0.602 0.499 g Particulates, < 10 um
Waste
Ash 19.247 11.881 9.955 8.249 g
Calculated based on the ash content of the
charcoal of 6.9%.
Stove (used) 5.3E-04 3.3E-04 4.6E-05 3.8E-05 piece Recycling process (cut-off).
Output
Heat, cooking 1 1 1 1
MJ
delivere
d at pot

Quantis 69
Table 21: Carbon balance of cooking stove.
Traditional
stove 1
Traditional
stove 2 Jiko Bora Sazawa Unit Comment
Input
Charcoal 278.94 172.19 144.28 119.55 g
C-Charcoal 204.46 126.21 105.76 87.63 g
Calculated based on the carbon content of
charcoal of 73.3%
Output
C-CO 19.86 12.26 10.27 8.51 g
Calculated based on emissions and the
molar masses
C-CO2 169.54 104.65 87.69 72.66 g
Calculated based on emissions and the
molar masses
C-CH4 2.03 1.25 1.05 0.87 g
Calculated based on emissions and the
molar masses
C-TNMHC 0.73 0.45 0.38 0.31 g
Calculated based on the molar mass ratio of
12/24.5
C-TSP 0.57 0.35 0.30 0.24 g
Calculated based on the IPCC value of 2.4g
C per kg charcoal burnt.
C-ash / C-char 11.74 7.25 6.07 5.03 g
Assumed that 5.7% of the carbon is
contained in the ash
Total 204.46 126.21 105.76 87.63 g

Quantis 70
PART III - RESULTS AND DISCUSSION
13 Compared charcoal value chains
As illustrated in the previous section, there exists a wide range of different options to extract
wood, as well as to produce, transport and use charcoal. Instead of providing results for all
possible combinations, we establish “typical” charcoal value chains. Thereby we analyse the
traditional value chain and show the improvement potential based on the settings identified for
sustainable value chain. In addition we also integrate a best case and a worst case to show the
extremes.
Table 22: Compared charcoal value chains. For each scenario an overview about the specifications regarding
the forest management, kiln technology, transport, retail and consumptions is provided.
14 Material and energy balance
In Figure 27 the material requirements to deliver 1 MJ heat to the cooking pot is provided for
each charcoal value chain. Depending on the conversion efficiencies and transportation losses,
the wood requirements range from 290g to 2300 g to deliver 1 MJ heat to the cooking pot
(almost a factor 8 of difference). Compared to the traditional charcoal value chain, the wood
saving potential of improved systems is 66% and can even range up to 85% in a best case. Main
savings can be achieved if efficient stoves are used (up to 57% improvement) and also if more
efficient kilns are in place (about 20% improvement). The transportation is already efficiently
organized and losses are minimized. Consequently the optimization potential of the
transportation and retail is limited compared to other measures.
Stage
Traditional charcoal
value chain
Improved charcoal
value chain Best case Worst case
Forest management Cut - regrowth Coppice 25 years Coppice 25 years Forest to agriculture
Charcoal kiln
Traditional EBK
13% efficiency
Improved EBK
19.6% efficiency
Half orange BK
35% efficiency
Traditional EBK
13% efficiency
Transport
To DAR
4.7% loss
To DAR
4.7% loss
To DAR
1% loss
To DAR
8.6% loss
Retail 5% loss 5% loss 2% loss 14% loss
Consumption
Traditional charcoal
stove
15% efficiency
Improved stove
charcoal (Jioko bora)
29% efficiency
Improved charcoal
stove (Sazawa)
35% efficiency
Traditional charcoal
stove
15% efficiency

Quantis 71
Figure 27: Material requirements of the compared charcoal production and use systems per MJ heat
delivered to pot. For each life cycle stage the mass flow, as well as the potential savings relative to the
traditional charcoal value chain are indicated. The left column indicates the potential saving / increase in
wood demand.
In general cooking with charcoal is not very efficient from an energetic perspective as compared
to the direct use of wood for cooking. In order to deliver 1 MJ heat to the cooking pot with
charcoal, 34 MJ wood are required12 (traditional value chain). This amount is significantly higher
as if fuel wood is directly used, even if a low energy efficiency of wood stoves (e.g. 10%) is
assumed. In the optimized systems, the energy requirements from wood are reduced to 5 -12
MJ. In this case, the energy demand is similar to cooking with a wood stove.
Besides the energy contained in wood, also the energy demand linked to the production of
materials used for stoves and kilns and the energy used to transport charcoal to the end
consumer have to be considered. The non-renewable energy demand ranges from 0.3 up to 0.7
MJ, depending on the scenario. The non-renewable energy demand is mainly related to
transport and packaging of the charcoal.
15 Climate change impacts
In Figure 28 the global warming potential of different improved charcoal value chains are
compared to the traditional charcoal production system. Overall, the impact is dominated by
12 Using a wood energy content of 18MJ/kg
Traditional charcoal value
chain100%
0.6 m2
@ forest
1944 g wood
@ forest
253 g charcoal
@ kiln site
241 g charcoal
@ wholesaler
230 g charcoal
@ retailer
6.7 MJ in charcoal
@ consumer
0.2 m2
@ forest
667 g wood
@ forest
131 g charcoal
@ kiln site
125 g charcoal
@ wholesaler
119 g charcoal
@ retailer
3.4 MJ in charcoal
@ consumer
- - 17.4% of savings 0% of savings 0% of savings 48.3% of savings
0.1 m2
@ forest
290 g wood
@ forest
101 g charcoal
@ kiln site
100 g charcoal
@ wholesaler
99 g charcoal
@ retailer
2.9 MJ in charcoal
@ consumer
- - 25.2% of savings 1.5% of savings 1.2% of savings 57.1% of savings
0.8 m2
@ forest
2278 g wood
@ forest
296 g charcoal
@ kiln site
262 g charcoal
@ wholesaler
230 g charcoal
@ retailer
6.7 MJ in charcoal
@ consumer
- - 0% of savings -8.6% of savings -8.6% of savings 0% of savings
34%
15%
117% 1 M
J h
eat
deli
vere
d t
o p
ot
Best case
Worst case
Improved charcoal value
chain
Forest management Charcoal production
Retail and Distribution
ConsumptionTransport

Quantis 72
carbon emissions caused due to the temporal reduction of forest carbon pools and by methane
emissions during the carbonization of wood. Even though the impacts of using charcoal in
stoves does not show significant impacts, the improvement potential in terms of stove efficiency
is nevertheless substantial (reduced upstream impacts).
The overall GHG emissions can be significantly reduced by 63% to 84% by implementing
efficiency measures. However, it is also shown that the impacts can be severe if land is
permanently converted from forest to cropland (worst case scenario).
In the following the impact of each life cycle stage is further described and mitigation measures
are discussed.
Figure 28: Global warming potential of different charcoal value chains relative to the traditional value chain.
The impacts are indicated per life cycle stage.
15.1 Forest management and land use change
In Figure 29 the global warming potential of different forest management and land use
scenarios are compared (in kg CO2 eq per hectare). The impact associated to forest
transformation is indicated in green and is for all the scenarios the same, except for natural
forest which does not show an impact, but also has no wood output.
The impact associated to postharvest use of the land is indicated in orange and is caused by the
avoided regeneration due to occupying land. We have assumed an occupation of 100 years for
the agricultural scenarios and the coppice system. Converting a forest to agricultural land
significantly reduces the carbon stock compared to natural vegetation – not only in terms of
carbon contained in biomass, but also in terms of soil carbon. Overall the shifting cultivation
shows a slightly higher carbon stock as compared to permanent agriculture and thus is
associated with lower impacts.

Quantis 73
Figure 29: GWP over a 100 year time horizon for different forest management and land use scenarios. The
impact related to forest transformation (green) and to land occupation (orange) is indicated as Mg CO2 eq
ha-1. Further, the amount of harvested wood is indicated by the rhombus (Mg CO2 eq ha-1).
Also the continuous use of forest in coppice cycles delays full regrowth and leading to a reduced
average carbon stock compared to natural vegetation. However, during the 100 year of
occupation, wood is continuously extracted and per kg wood harvested the impacts are similar
as compared to scenario 1 “cut and regrowth”. The GWP 100a per kg harvestable wood for all
scenarios is listed in Table 23 (last column).
The initial CO2 emissions due to land transformation (2 kg CO2 / kg harvested wood13) are
slightly higher compared to the carbon contained in wood (1.7 kg CO2 / kg harvested wood14)
since not all the clear-cut wood is used for charcoal production.
Table 23: GWP 100a - calculated based on transformation and occupation impacts.
13 75.1 tons of CO2 per 37 tons of harvested wood
14 Based on a carbon fraction of 0.47 and the CO2/C ratio of 44/12.
No Scenario
Initial CO2
emissions
Duration
factor
GWP 100a
[Mg CO2 eq
ha-1]
Reduced average
carbon stock
[Mg C ha-1]
Duration
factor
GWP 100a over
100 years
[Mg CO2 eq ha-1]
Wood harvest
(d.m.)
[Mg ha-1]
GHG emission
[kg CO2 eq / kg
wood (d.m.)
0 Natural forest 0.0 0.0 0.0 - - - 0.0 -
1 Cut and regrowth 75.1 0.4 31.6 - - - 37.0 0.9
2a Agriculture - permanent 75.1 0.4 31.6 40.6 0.02 313.5 37.0 9.3
2b Agriculture - shifting cultivation 75.1 0.4 31.6 32.7 0.02 252.2 37.0 7.7
3a Croppice cycle 20 years 75.1 0.4 31.6 16.1 0.02 124.3 142.2 1.1
3b Croppice cycle 25 years 75.1 0.4 31.6 14.1 0.02 109.0 151.0 0.9
Transformation Occupation Total

Quantis 74
The forest transformation impact can be fully allocated to charcoal production and the GWP
impact is calculated based on the carbon stock dynamics and the amount of harvested wood
(Table 23, green).
For the agricultural scenarios, the impacts are much higher as compared to the forest
management systems. However, it is not reasonable to allocate the carbon emissions of
occupying land only to the wood extraction (case i and ii in Figure 30). Instead, the impacts
caused land occupation is clearly caused by crop cultivation and thus should be allocated to the
agricultural products and not to charcoal (case iii in Figure 30). In this case the GWP of wood
extraction are similar to scenario 1 “cut and regrowth”.
Further it could be argued that the main driver of deforestation is the expansion of agricultural
land. Consequently the wood is clear-cut solely because of land expansion and thus is freely
available for charcoal production (case iv in Figure 30). This perspective is similar to the carbon
neutrality perspective, since no impacts from temporal carbon stock changes are allocated to
wood.
In addition the transformation impact could also be allocated to wood extraction and
agricultural products by using an economic approach (revenue based allocation). The impacts
would be in between scenario iii) and iv).
For this study we apply case iii) for the traditional charcoal production scenario and assume case
i) as a worst case (results see Figure 28). The worst case is considered even though it is not
justified to allocated agricultural occupation impacts to wood extraction. However, deforestation
can also be followed by desertification (e.g. due to soil erosion and harsh climatic conditions).
This would cause severe impacts which might be even higher as scenario i), since regeneration is
permanently avoided.
Figure 30: Comparison of different allocation perspectives of the GWP of the agricultural scenarios.

Quantis 75
15.2 Charcoal production
In Figure 31 the global warming potential of charcoal production using different kilns is
indicated per kg charcoal produced. The impacts related to wood extraction are excluded. A
significant difference amongst the compared kiln can be observed, which is mainly explained by
the different kiln efficiencies. We have modelled two traditional kilns in order to illustrate the
bandwidth of impacts caused by different reported efficiencies and emission profiles. Even
though the assumptions of the traditional kiln 2 are very optimistic, it shows that the improved
kilns might not necessarily be better performing than traditional kilns. Consequently, the
performance of the kilns at the study site should be carefully evaluated in order to point out
effective benefits.
Generally, the main GHG is carbon dioxide, flowed by methane. However, it has to be noted that
the carbon emitted is from a renewable resource and will be sequestered again by plants within
some decades (except for agriculture scenarios). Consequently, the impact of CO2 emissions
cannot be directly compared with methane emissions and do not directly contribute to the
climate change score (see previous chapter on biogenic CO2 emissions).
There exist different (stationary) kilns (e.g. a different retort kilns), where methane contained in
the residual gas is captured in abatement units and destroyed through combustion (UNFCCC
2012).
Figure 31: Global warming potential of charcoal production using different kiln technologies. The impacts
are indicated per kg charcoal (excluding wood extraction and the contribution from each GHG is indicated.

Quantis 76
15.3 Transport and distribution
In Figure 32 the global warming potential of charcoal transportation to Kilosa, Morogoro and
Dar es Salaam (DSM) are indicated. The impacts exclude the impact caused by wood extraction
and charcoal production (see previous chapters). In addition also the charcoal losses due to
transportation are indicated. The values are based on primary data and are dependent on the
vehicle type and transportation distance.
The charcoal transport from villages to the nearby cities is either conducted by motor cycles or
bicycles. The motor cycle transport is causing about 5 times the impact of a bicycle transport.
However, transporting charcoal by bicycle is also related to higher losses compared to
motorcycle transport according to field interviews. Higher losses lead to an increased wood
demand and consequently to higher upstream impacts.
For longer distances trucks are used. We assume that the charcoal is transported by motor cycle
from the village to the nearby city and loaded to small or big trucks for long distance transport
(to Morogoro or DSM). Larger and full loaded trucks thereby show slightly lower emissions per
kg charcoal transported.
Charcoal is also directly bought on the road side by end-consumers and is transported by a
private cars (here referred to as pick up). Depending on the transportation distance, the
emissions are significantly higher compared to all other transportation means. However, most
private buyers are not primarily driving to buy charcoal, but they are on the way anyway.
Consequently not all the impact of the journey can be allocated to charcoal.
The railway from Kilosa to Dar es Salaam would be the most environmental option. However, the
transportation is not reliable and not legal according to the Tanzanian Railway Cooperation
transportation policy.
Overall the different transportation modes show substantial differences in terms of losses and
GWP. However, compared to the other processes along the charcoal value chain, the impact of
transport is marginal.

Quantis 77
Figure 32: Global warming potential of charcoal transportation to Kilosa (green), Morogoro (orange, red) and
Dar es Salaam (DSM, blue). The impacts are indicated per kg charcoal transported (excluding wood
extraction and charcoal production). The losses of charcoal depend on the transportation vehicle and
distance and are indicated by the black bars (in %).
15.4 Consumption
In Figure 33 the global warming potential of cooking with charcoal stoves is indicated. The
impacts are calculated per MJ heat delivered to the cooking pot and exclude the impact caused
by charcoal production and transport (see previous chapters).
The GWP of charcoal consumption strongly depends on the stoves type. The most efficient
stove is emitting more than two times less GHGs as compared to the traditional metal stove.
However, the reported efficiencies of the same stove type can vary substantially. For instance the
performance of the traditional stove ranges between 0.4 and 0.7 kg CO2 eq15 per MJ heat
delivered to the pot. Consequently a good performance of a traditional stove is just slightly
higher as compared to the improved stoves.
Even though the direct impact from fuel combustion shows a significant impact, the main
environmental burden or benefit is caused indirectly, since the stove efficiency strongly
influences the upstream impacts.
15 Note: The biogenic CO2 emissions are not directly contributing to the global warming impact (see
previous chapter on biogenic CO2 emissions)

Quantis 78
Figure 33: Global warming potential of cooking with different charcoal stoves. The impacts are indicated per
MJ delivered to the cooking pot (excluding charcoal production and transport).
15.5 Sensitivity analysis –500 year time horizon
The time horizon of the impact assessment does significantly influence the results. In an infinite
time perspective temporal releases of carbon emissions become insignificant. If the time horizon
is in contrary just a few years biogenic CO2 emissions are treated as CO2 emissions from fossil
fuels (regrowth is neglected).
Most widely the time horizon of 100 years is used. However, Müller-Wenk and Brandao (2010)
indicated that a cut-off at 100 years is favouring carbon from fossil combustion and suggests to
use a 500 year perspective. Choosing a 500 year time horizon is not only changing the impacts
of biogenic carbon emissions (a factor 157 is used instead of 48, see chapter 5), but also the
characterization factors of other GHG change (see Table 2 and (IPCC 2006)).
The GWP of wood extraction for a 500 year time horizon are provided in Table 24. Compared to
the values based on a 100 year (see Table 23), the duration factor is significantly reduced and
thus also the impact of temporarily releasing biogenic CO2 emissions is reduced.
Table 24: GWP 500a - calculated based on transformation and occupation impacts.
No Scenario
Initial CO2
emissions
Duration
factor
GWP 500a
[Mg CO2 eq
ha-1]
Reduced average
carbon stock
[Mg C ha-1]
Duration
factor
GWP 500a
100 year occupation
[Mg CO2 eq ha-1]
Wood harvest (d.m.)
[Mg ha-1]
GWP 500a
[Mg CO2 eq ha-1]
0 Natural forest 0.0 0.0 0.0 - 0.00 - 0.0 -
1 Cut and regrowth 75.1 0.1 8.4 - 0.00 - 37.0 0.2
2a Agriculture - permanent 75.1 0.1 8.4 40.6 0.01 94.9 37.0 2.8
2b Agriculture - shifting cultivation 75.1 0.1 8.4 32.7 0.01 76.3 37.0 2.3
3a Croppice cycle 20 years 75.1 0.1 8.4 16.0 0.01 37.3 145.9 0.3
3b Croppice cycle 25 years 75.1 0.1 8.4 13.9 0.01 32.5 155.0 0.3
TotalTransformation Occupation

Quantis 79
The charcoal value chain results for a 100 year and 500 year time horizon are indicated in Table
25. In addition, also the results of assuming that the temporal change in carbon stocks in forest
has no impact are provided (concept of “carbon neutrality” as described in chapter 4.3).
Table 25: Comparison of different GWP assessment methods (in kg CO2 eq per MJ heat deliver to the pot).
Unit
Traditional
charcoal
value chain
Improved
charcoal
value chain Best case Worst case
GWP 100a kg CO2eq/MJ at pot 2.44 0.90 0.39 22.09
GWP 100a
CO2 biogenic = 0 kg CO2eq/MJ at pot 1.00 0.32 0.14 1.12
GWP 500a kg CO2eq/MJ at pot 0.71 0.24 0.12 6.66
Changing the time horizon from 100 to 500 years leads to a reduction of the impact by more
than a factor of 3. The GWP calculated based on the carbon neutrality perspective of biogenic
CO2 emission is slightly higher than the GWP 500. However, the relative ranking of the different
value chains does not change if different time horizons are used.
15.6 Comparison with alternative fuel types and literature values
The GWP of charcoal production calculated in this study is generally higher as compared to
literature values. The difference is mainly caused by higher kiln and stove efficiency values used
in literature and by differences in the approaches used to model the GWP of biogenic CO2
emissions. In the following the results from literature are described and discussed in more
details.
Bailis (2005) compared different charcoal production and use systems in Kenya. The impact
ranges from -300 g to 1300 g of CO2 eq per MJ heat delivered to the cooking pot (Bailis 2005).
Negative values (carbon benefits) are linked to the scenario where natural forest was displaced
by eucalyptus plantation, storing more carbon. Rousset (2011) also indicated that charcoal
production and use leads to carbon emission savings of up to 4kg per kg of charcoal. However,
the allocated benefits due to carbon sequestration are questionable, since the carbon stocks of
natural vegetation was not used as a reference (Rousset et al. 2011).
According to Bailis (2005), the GWP of coppice systems is assessed with an impact of 110 g CO2
eq per MJ heat delivered to the cooking pot. Thereby, a stove efficiency of 25% and a kiln
efficiency of 20% was assumed, which is comparable to the improved value chain scenario of
this study. However, the calculated impacts of Bailis (2005) are twice as low as compared to this
study, which is explained by different assessment methods for biogenic carbon emissions.

Quantis 80
Highest CO2 emissions are caused if forest is converted to agricultural land and all emissions are
allocated on charcoal production. Also Bailis (2005) indicates that as soon as regeneration is
postponed, as it is the case in agricultural systems, the GWP of charcoal is dominated by the
emissions from land use change.
If biogenic carbon emissions are not accounted for, the GWP 100 of charcoal in literature is
indicated with 293g (Benoist et al. 2011), 203 g (Bailis 2005) and 49 g16 (Norgate et al. 2011) CO2
eq per MJ heat delivered to the pot. The GWP results of this study range from 140 g to 1100 g
CO2 and is 320g CO2 in the improved system. The slightly higher emissions as compared to the
literature value can be explained by slightly different kiln and stove efficiency assumptions, by
slightly different energy contents of the produced charcoal and by the consideration of
transport losses, which is excluded in all other studies.
Figure 34: Global warming potential of different charcoal value chains compared to alternative cooking
options. The GWP impact based on 100 year time horizon is indicated in green. The values of GWP 500 are
indicated by orange triangles and GWP 100 impacts, but not accounting for biogenic CO2 emissions, are
indicated by the grey rhombus. Values higher as 3 kg CO2 eq per MJ heat delivered to the cooking pot are
cut-off, but the values are indicated on the top of the figure.
16 Calculated based on the figure of 220kg CO2 eq per ton charcoal, a charcoal energy content of 30MJ
per kg and a stove efficiency of 15%.

Quantis 81
In Figure 34, the GWP results of this study are illustrated and compared to the different
alternative cooking options. It has to be noted that the values of alternative cooking systems are
taken from literature and the impacts are not consistently modeled by using the same
approaches. Even though the results should not be over interpreted, indications and general
conclusions can be drawn.
The direct use of firewood for cooking generates lower impacts as converting wood to charcoal
before using it as a cooking fuel. This result is achieved since no conversion losses are caused
and are valid even though the energy efficiency of wood stoves is generally low. Consequently
from a resource and climate perspective it makes sense to use wood directly for cooking in rural
areas. However, the conclusion might change if also other aspects are considered (e.g. impact
on human health).
Modern energy carriers such as LPG or kerosene used for cooking show relatively low impacts
compared to charcoal (Bailis 2005). Also other studies indicated that LP grilling is about three
times lower carbon footprint as compared to charcoal grilling (Johnson 2009) and that LPG has a
lower GWP than biogas and charcoal (Afrane & Ntiamoah 2011). The impact of using brown coal
is however relatively higher as compared to other modern fuels. These effects are mainly
explained by the high conversion efficiency of gaseous and liquid fuels as compared to solid
fuels used for cooking.
However, the comparison of fossil energy carrier to charcoal strongly depends on the
perspective of assessing biogenic carbon emissions and on the chosen time horizon. While the
GWP of fossil fuels is only marginally sensitive17 to these modelling characteristics, the GWP of
charcoal system can change significantly in absolute terms. Depending on the perspective, the
ranking of the cooking options changes. In a GWP 100 year perspective, charcoal systems
perform generally worse compared to most other cooking alternatives. Using the GWP over a
500 year time horizon or using a carbon neutral perspective, the impacts of (improved) charcoal
systems are similar to fossil fuels and much lower as heat from coal.
17 Minor effects due to the lower impact factor of methane is caused by using a 500 year time horizon
instead of 100 years.

Quantis 82
PART V – CONCLUSION AND RECOMMENDATION
16 Conclusions and recommendations
Overall, the charcoal value chain shows high variations and a huge optimization potential in
terms of resource efficiency and climate change. The GWP of charcoal is highly dependent on
the conversion efficiencies, the land management regime that is in place and on the
assumptions related to the impact modeling.
Land use planning and sustainable forest management are key: Using biomass for charcoal
production does not lead to permanent deforestation, even though the carbon stocks are
temporarily decreased. However, if forests are converted to agricultural areas, the regeneration
of the forest is postponed and also a share of the soil carbon is emitted to air. Consequently
measures reducing agricultural expansion are an integral part of reducing deforestation.
The project partners are currently establishing land use plans and provide training in
conservation agriculture, which are important measures to reduce the pressure on forests. In
addition also sustainable forest management is important in order to enhance the optimal
regeneration of the forest. Thereby, measures targeted towards the prevention of hot fires and
cattle grazing support forest regrowth.
Eco-efficient stoves and improved kilns are a prerequisite for sustainable charcoal
production: By implementing different efficiency measures, the wood demand can be reduced
by 66% up to 85%. The main increase in efficiency can be achieved if traditional stoves are
replaced with improved stoves. Consequently, changing the charcoal sector should also involve
measures to enhance the market penetration of efficient stoves. Also improvements in the
conversion of biomass to charcoal show a tremendous potential for reductions in the associated
GHG emissions. Thereby incentives to efficiently use wood resources efficiently are enabling the
adoption of efficient technology. Currently the producers from the informal sector do not have
an incentive to save wood as it is typically sourced for free. Economic incentives or barriers (e.g.
payments for natural resources) could be considered as a measure to enhance the adoption of
efficient kilns.
Transport and retail show marginal impact on climate: In any case, transportation plays a
small role in charcoal’s climate impact. The transportation is already efficient and transportation
losses are minimal. Consequently the optimization potential of the transportation and retail is
limited compared to other measures. However, it has to be noted that successfully establishing a
sustainable charcoal value chain is not possible without the involvement of transporters.

Quantis 83
Baseline remains unclear – further research is needed: The traditional charcoal value chain
shows large variations and the impacts strongly depend on the local context. Also in literature
different values in terms of efficiency and emission are listed. Some indicate that the traditional
system can be as efficient as with implementing the proposed improvements. Consequently,
measurements from the study sites are required to properly assess the conversion efficiencies
and the charcoal quality of both, the improved and the traditional system. Further, methane
emissions are strongly influencing the LCA results and direct measurement from the study area
will improve the accuracy of results.
Comparison with alternative fuels - expansion of study: The direct use of fuel wood for
cooking shows less resource demand and carbon emission as compared to charcoal. However,
cooking with fire wood is only feasible in rural areas and other impacts might be higher as
compared to using charcoal. From a global warming perspective, LPG and Kerosene seem to
have slight advantage over charcoal fuels and it most likely also is more favorable at the cooking
stage, in terms of its effect on the human health. Nevertheless, the availability and affordability
of alternative fuels is limited and thus a shift to modern fuels in near future seems unlikely. Since
the shift to modern fuels is perceived by many stakeholders as the way forward, a consistent
assessment of the sustainability aspects of different cooking options is highly valuable to
support knowledge based decision making.
Overall sustainability: This study showed that there is substantial potential to optimize the
current charcoal value chain. However, the conclusions are drawn from a resource and climate
perspective. In order to obtain a complete view of sustainability, the results of the LCA study
should be interpreted together with other assessments focusing on the social and economic
dimensions.

Quantis 84
REFERENCES
Afrane, G. & Ntiamoah, A., 2011. Comparative Life Cycle Assessment of Charcoal, Biogas, and
Liquefied Petroleum Gas as Cooking Fuels in Ghana. Journal of Industrial Ecology, 15(4),
pp.539–549. Available at: http://dx.doi.org/10.1111/j.1530-9290.2011.00350.x.
Bailis, R., 2005. Fuel from the Savanna: the Social and Environmental Implications of the Charcoal
Trade in Sub-Saharan Africa,
Bailis, R., Ezzati, M. & Kammen, D.M., 2003. Greenhouse Gas Implications of Household Energy
Technology in Kenya. Environmental Science & Technology, 37(10), pp.2051–2059. Available
at: http://pubs.acs.org/doi/abs/10.1021/es026058q.
Benoist, A. et al., 2011. Life Cycle Assessment (LCA) of traditional charcoal production in
Madagascar. In Montpellier, France: CIRAD.
Bess, M., 2013. Market Research for Sustainably-Produced Charcoal,
Beukering, P. van et al., 2007. Optimization of the charcoal chain in Tanzania, Amsterdam, The
Netherlands.
Bhattacharya, S.C., Albina, D.O. & Salam, P.A., 2002. Emission factors of wood and charcoal-fired
cookstoves. Biomass and Bioenergy, 23(6), pp.453–469. Available at:
http://www.sciencedirect.com/science/article/pii/S0961953402000727.
Boafo-Mensah, G. et al., 2013. Thermal efficiency of charcoal fired cookstoves in Ghana. Global
Advanced Research Journal of Engineering, Technology and Innovation (GARJETI), 2(3), p.pp
102–110.
Boutette, M. & Karch, E., 1984. Charcoal : small scale production and use D. G. für T.
Zusammenarbeit, ed., Braunschweig: F. Vieweg.
Brocard, D., Lacaux, J.-P. & Eva, H., 1998. Domestic biomass combustion and associated
atmospheric emissions in West Africa. Global Biogeochemical Cycles, 12(1), pp.127–139.
Available at: http://dx.doi.org/10.1029/97GB02269.
BSI, 2011. PAS 2050:2011 - Specification for the assessment of the life cycle greenhouse gas
emissions of goods and services,
Campbell, B., 1996. The Miombo in Transition: Woodlands and Welfare in Africa, Bogor,
Indonesia: Center for International Forestry Research.

Quantis 85
Cherubini, F. et al., 2011. CO2 emissions from biomass combustion for bioenergy: atmospheric
decay and contribution to global warming. GCB Bioenergy, 3(5), pp.413–426. Available at:
http://dx.doi.org/10.1111/j.1757-1707.2011.01102.x.
Chidumayo, E.N., 1990. Above-ground woody biomass structure and productivity in a
Zambezian woodland. Forest Ecology and Management, 36(1), pp.33–46. Available at:
http://www.sciencedirect.com/science/article/pii/037811279090062G.
Chidumayo, E.N., 1991. Woody biomass structure and utilisation for charcoal production in a
Zambian Miombo woodland. Bioresource Technology, 37(1), pp.43–52. Available at:
http://www.sciencedirect.com/science/article/pii/0960852491901106.
Chidumayo, E.N. & Gumbo, D.J., 2013. The environmental impacts of charcoal production in
tropical ecosystems of the world: A synthesis. Energy for Sustainable Development, 17(2),
pp.86–94. Available at:
http://www.sciencedirect.com/science/article/pii/S0973082612000476.
Dallu, 2002. TROPICAL SECONDARY FOREST MANAGEMENT IN AFRICA - Coutnry paper:
tanzania,
ecoinvent centre, 2007. ecoinvent data v2.2, Dübendorf, CH: Swiss Centre for Life Cycle
Inventories. Available at: www.ecoinvent.ch.
ESMAP, 1991. Rwanda: Commercialization of Improved Charcoal Stoves and Carbonization
Techniques - Mid-Term Progress Report.,
European Commission, 2010. International Reference Life Cycle Data System (ILCD) Handbook -
General guide for Life Cycle Assessment - Detailed guidance.
FAO, 1987. Simple technologies for charcoal making - Forestry paper 41, Rome, Italy. Available at:
http://www.fao.org/docrep/x5328e/x5328e00.htm.
Fargione, J. et al., 2008. Land Clearing and the Biofuel Carbon Debt. Science, 319(5867), pp.1235–
1238. Available at: DOI: 10.1126/science.1152747.
Frischknecht, R. et al., 2007. Implementation of Life Cycle Impact Assessment Methods - ecoinvent
report no. 3 - Data v2.2, Dübendorf.
Grundy, I., 1990. The potential for management of the indigenous woodland in communal farming
areas of Zimbabwe with reference to the regeneration of Brachystegia spiciformis and
Julbernardia globiflora., Harare, Zimbabwe.
Quantis 86
Hammarstrand, L. & Särnberger, A., 2013. Comparative evaluation of two forest systems under
different management regimes in Miombo woodlands - A case study in Kitulangalo area,
Tanzania. CHALMERS UNIVERSITY OF TECHNOLOGY.
Holtsmark, B., 2013. Quantifying the global warming potential of CO2 emissions from wood
fuels. GCB Bioenergy, p.n/a–n/a. Available at: http://dx.doi.org/10.1111/gcbb.12110.
Hunter, R., 2012. Improved Cooking Stove Programme (Zambia),
IPCC, 2007. Climate Change 2007-the physical science basis S. Solomon D et al., eds., The
Edinburgh Building Shaftesbury Road, Cambridge, UK: Cambridge University Press.
Available at: www.grida.no/climate/ipcc_tar/wg1/.
IPCC, 2006. Guidelines for National Greenhouse Gas Inventories, Volume 4
Agriculture Forestry and Other Land Uses. Available from http://www.ipcc-
nggip.iges.or.jp/public/2006gl/vol4.html,
Ishengoma, R.C. & Klem, G.S., 1979. Yield, quality, cost and market acceptability of charcoal from
softwood slabs Record, Di.,
ISO, 2006a. 14040 - Environmental management - Life cycle assessment - Principles and
framework, Geneve, Switzerland: International Standard Organisation.
ISO, 2006b. 14044 - Environmental management - Life cycle assessment - Requirements and
guidelines 2nd ed., Geneva, CH: International Organization for Standardization.
Jetter, J. et al., 2012. Pollutant Emissions and Energy Efficiency under Controlled Conditions for
Household Biomass Cookstoves and Implications for Metrics Useful in Setting International
Test Standards. Environmental Science & Technology, 46(19), pp.10827–10834. Available at:
http://dx.doi.org/10.1021/es301693f.
Johnson, E., 2009. Charcoal versus {LPG} grilling: A carbon-footprint comparison. Environmental
Impact Assessment Review, 29(6), pp.370–378. Available at:
http://www.sciencedirect.com/science/article/pii/S0195925509000420.
Kajembe, G.C. et al., 2013. The Kilosa District REDD+ pilot project, Tanzania. A socioeconomic
baseline study IIED, London.
Kimaryo, B. & Ngerza, K., 1989. Charcoal production in Tanzania using improved traditional earth
kilns, Moshi, Tanzania.
Kutsch, W. et al., 2011. The charcoal trap: Miombo forests and the energy needs of people.
Carbon Balance and Management, 6(1), p.5. Available at:
http://www.cbmjournal.com/content/6/1/5.

Quantis 87
Malimbwi, R.E., Solberg, B. & Luoga, E., 1994. Estimation of biomass and volume in Miombo
woodland at Kitulangalo forest reserve, Tanzania. Journal of Tropical Forest Science, 7(2),
pp.230–242.
Malimbwi, R.E. & Zahabu, E., 2009. The analysis of sustainable charcoal production systems in
Tanzania. In Criteria and indicators for sustainable woodfuels. FAO.
Mohod, A.G. & Panwar, N.L., 2011. Evaluation of traditional half orange type charcoal kiln for
carbonisation: a case study. World Review of Science, Technology and Sustainable
Development, 8(2), pp.196–202. Available at:
http://dx.doi.org/10.1504/WRSTSD.2011.044216.
Muishi, P.K.T. et al., 2010. The role of the Miombo Woodlands of the Southern Highlands of
Tanzania as carbon sinks. Journal of Ecology and the Natural Environment, 2(12).
Müller, N., Michaelowa, A. & Eschman, M., 2011. PROPOSAL FOR A NEW STANDARDISED
BASELINE FOR CHARCOAL PROJECTS IN THE CLEAN DEVELOPMENT MECHANISM,
Müller-Wenk, R. & Brandão, M., 2010. Climatic impact of land use in LCA—carbon transfers
between vegetation/soil and air. The International Journal of Life Cycle Assessment, 15(2),
pp.172–182. Available at: http://dx.doi.org/10.1007/s11367-009-0144-y.
Mundhenk, P., Gomis, O. & Coumba, M., 2010. Comparaison des rendements de production de
charbon de bois entre la meule traditionnel le et la meule Casamance dans la forêt
communautaire de Sambandé, Programme pour la promotion de l’électrification rurale et de
l’approvisionnement durable en combusti, Dakar, Senegal.
Norgate, T. et al., 2011. The greenhouse gas footprint of charcoal production and of some
applications in steelmaking. In 7th Australian Conference on Life Cycle Assessment.
Melbourne.
Norrlund, L. & Brus, L., 2004. Agricultural Practices in Relation to Soil Properties and Water Supply
in a Miombo Forest Village. Uppsala University, Sweden.
Nturanabo, F., Byamuisha, G. & Colonna Preti, G., 2010. Performance appraisal of the casamance
kiln as replacement to the traditional charcoal kilns in Uganda, Kampala, Uganda.
Paavola, J., 2008. Livelihoods, vulnerability and adaptation to climate change in Morogoro,
Tanzania. Environmental Science & Policy, 11(7), pp.642–654. Available at:
http://www.sciencedirect.com/science/article/pii/S1462901108000695.
Pennise, D.M. et al., 2001. Emissions of greenhouse gases and other airborne pollutants from
charcoal making in Kenya and Brazil. Journal of geophysical research, 196.

Quantis 88
Rousset, P. et al., 2011. {LCA} of eucalyptus wood charcoal briquettes. Journal of Cleaner
Production, 19(14), pp.1647–1653. Available at:
http://www.sciencedirect.com/science/article/pii/S0959652611001855.
Ryan, C.M., Williams, M. & Grace, J., 2011. Above- and Belowground Carbon Stocks in a Miombo
Woodland Landscape of Mozambique. Biotropica, 43(4), pp.423–432. Available at:
http://dx.doi.org/10.1111/j.1744-7429.2010.00713.x.
Sago, S., 2013. BASELINE ASSESSMENT OF EXISTING CHARCOAL MAKING METHODS AND
EFFICIENCIES, Dar Es Salaam.
Searchinger, T.D., 2008. Biofuels: Effects on land and fire - Response. Science, 321(5886), pp.200–
201. Available at: <Go to ISI>://000257512900013.
Shirima, D.D. et al., 2011. Carbon storage, structure and composition of miombo woodlands in
Tanzania’s Eastern Arc Mountains. African Journal of Ecology, 49(3), pp.332–342. Available
at: http://dx.doi.org/10.1111/j.1365-2028.2011.01269.x.
Smith, J.P., Lawn, R.J. & Nable, R.O., 1999. Investigations into the root:shoot relationship of
sugarcane, and some implications for crop productivity in the presence of sub-optimal soil
conditions. Proc. Aust. Soc. Sugar Cane Technol. 21 (1999), pp. 108–113.
Smith, K.R. & Pennise, D.M., 1999. Greenhouse Gases from Small-scale Combustion in Developing
Countries: charcoal making kilns in Thailand., Research Triangle Park, NC.
U.S. Forest Products Labratory, 1961. Charcoal production, marketing and use,
UNFCCC, 2012. Reduction of emissions from charcoal production by improved kiln design and/or
abatement of methane - ACM0021,
Walker, S.M. & Desanker, P. V., 2004. The impact of land use on soil carbon in Miombo
Woodlands of Malawi. Forest Ecology and Management, 203, pp.345–360.
Williams, M. et al., 2008. Carbon sequestration and biodiversity of re-growing miombo
woodlands in Mozambique. Forest Ecology and Management, 254, pp.145–155.
World Bank, 2009. Environmental crisis or sustainable development opportunity? Transforming the
charcoal sector in Tanzania : a policy note,
Wymann von Dach, S., Basil, S. & Höggel, U., 2013. Adoption of innovations in the charcoal sector
of Kilosa, Tanzania,

Quantis 89
ANNEX
17 Annex
17.1 Interviews: Transportation vehicles - Bicycles
Parameter 1 2 3 4 5 6 7 8 9 10 Average
Name Mr. Athuman Waziri Mr. Mohamed Masumbuko Joseph Luka Juma Damian Jackson Meshack Baraka Yona Mohamed Masumbuko N/A N/A Venance Makanda -
LocationKigunga village Dodoma Isanga village Msimba village Ulaya Mbuyuni village Nyali village Nyali village N.A.
Changalawe village in
Miyombo Zombo village Ihombwe -
Bycicle Model Avon Phoenix Phoenix Bambucha Phoenix Phoenix Phoenix Phoenix Phoenix Phoenix Dominantly Phoenix
Weight, unloaded [kg] 5-10 kg5-10 kg 15 to 20kg 15-20kg 15-20kg 15-20kg 15-20Kg 15-20Kg 15-20Kg 15-20Kg 20kg
Material (predominant) Steel Steel Steel Steel Steel Steel Steel Steel Steel SteelSteel
He normally carries 1 bag
(50-60 kg)
1bag (50-55kg)
2 bags, each bag is filled
with 6tins of charcoal
(volume of each tin is 20
litres) 1bag (35-40kg)
1bag (9-10 tins), in dry
season 1bag is about 50kg
but in rain season it ranges
between 60-70kg (according
to him, in rain season
charcoal is a bit wet)
1 bag (8-9 tins) about 50-
60kg
1 bag (9-10 tins) about 60-
65kg 8 to 9 tins, 40Kg to 50Kg
1 bag (8-9 tins) about 50-
60kg
1 bag (8-9 tins) about 50-
60kg
55 52.5 37.5 60 55 62.5 45 55 55
LifespanHe has used the bicycle for 3
years
He has used the bike for 10
years The bike is 5yrs old The bike is 3 years old N.A. N.A. N.A. N.A. Assumption: 10 years
End-of-live-treatment
He will dispose it he has no
intention to use it for any
purpose (Landfill )
He is expecting to sell it as a
scraper (Remelted)
He will dispose it he has no
intention to use it for any
purpose (Landfill )
He is expecting to sell it as a
scraper (remelted)
He will sell it as a scraper
(remelted)
He is intending to sell it to
people who are buying for
recycling (Remelted) Landfill Landfill Remelted Remelted Assumption: Remelted
He sells 1 bag for TSH
13,000/14,000 when the bag
bursts he sells it for TSH
11,000/12,000
he sells 1 bag for TSH
14,000/15,000 when the bag
bursts he sells for TSH
10,000/11,000/12,000 it
depends on the customer
and season of the year
He sells the charcoal for
TSH12,000/13,000 when a
bag bursts he sells for TSH
10,000/11,000
he sells a bag for TSH
5000/6000, if the bag burst
he sells it for TSH 4000/5000
he sells 1bag for TSH
12,000/13,000 when the bag
bursts he sells for TSH
10,000/9000/8000
depending on the season
he sells a bag of charcoal
for TSH 12000/13000, when
a bag bursts he sells it for
about TSH 10,000/9,000 N.A. N.A. N.A. N.A.
13000 14000 12500 5500 12500 12500
Frequency
Loss of charcoal during
transportation
He carries charcoal to to
Kilosa 2-3 times/month, He
is doing the business
5months out 12 months in a
year, He gets 3-4 bursts in 5
months
He works for around 16-18
days/month, each day he
transport 1 bag, he gets
around 5 bursts each month
He transports around 45
bags/month, about 4 bags
burst in each month,
He is transporting charcoal
4months in a year,
2trips/day*6days/week*4w
eeks*4months= 192 bags ( I
doubt, but he insisted that is
how he transport charcoal)),
8-12bursts in 4 months
He transport charcoal 7-8
trips a month, in each
month he gets around 2
bursts
He transport charcoal 7-9
trips each month, on
average he gets 1 burst each
month,
He transports 14-20
bags/month,
he gets 5-7 bursts/month
2.5-3 Kg (1-2 sados) which is
4.4%
He transports charcoal
3times a week X 4weeks (in
a month), he does the
business 2months a year
He gets 2-3 bursts/month, in
each burst he losses 0.5-
0.75 of a tin (7.35%)
He transports charcoal
20times/month, he works
6months/year
He gets 3-5bursts/month, he
looses 3-5kg on each burst
(7.27%)
He transports charcoal 10
trips/month, 2-3
bursts/month, he looses 0.5-
1.0 tin (8.82%)
Bursts (%) 28%29% 9% 5% 31% 13% 35% 21% 20% 25%
5.2 - 35.3 %
(Average 21.6%)
Loss of charcoal (%)4% 8% 7% 10%
4.4 - 9.5 %
(Average 7.4%)
Maintenance
He replaces about 10 spokes
after every month , He
changes 1 tyre after every
6months, changes 2 tubes
after every 2 months,
changes freewheel once per
month
He changes around 10
spokes/month, 2tubes after
every 6 months, Quarter
pins-2 pieces/month, 2
pedals after every 3 months
In each month he changes
the following things; 1 tyre
(rear tyre), 1tube, about 5
spokes, 20 bearings, front
hub bolt, 1 bearings cover
(vikombe vya beringi)
He changes about 20
spokes/month, 1
tire/month, he also do
occasional services
depending on the condition
of the bicycle-greasing,
changes 42 bearings, 1
bearing cover
He repairs his bicycle 3-
5times/month, in each time
he replaces 7-8 spokes, he
changes bearings cover
once per month, changes
tires after every 5-6 months,
tire tubes after every 4-5
months,
He changes tyres after every
6-7 months, 2 tyre tubes
after 5-6 months, 5-6
spokes each month, 1 rear
hub bolt each month
He changes tyres after every
5-6 months, 7-
10spokes/month, pedals
every 2months, Freewheel
after every 1.5 to 2 months,
bearings 22/month, he
changes brake quarter pins
twice per month
He changes 2tubes/month,
22 bearings, 2 tyres after
every two month, he
changes spokes 3
times/month each time 2-5
spokes
He changes spokes 10-15
spokes/month, 2 tubes
every two month, 2 tires
after every 3 months, 22
bearings/month, 3 hub bolts
(front, centre and rear)
every two months
2 tires after every 4-5
months, 2 tubes after every
2 to 3 months likewise for
pedals,
Capacity [kg charcoal]37.5-62.5 kg
(Average 53kg)
5500-14000 TSH
(Average 11667TSH)Charcoal price

Quantis 90
17.2 Interviews: Transportation vehicles - Motorbikes
Parameter 1 2 3 4 5 6 Average
Name Felician Lengamka Mr Rajabu Maulid Peter Simon Hussein Said N.A. N.A. -
Location N.A. Msimba village Dodoma Isanga village Ulaya Mbuyuni village N.A. N.A. -
Motorbike Model T-better Sanlag N.A. T-Better Sunny Sanlag T-better
Weight, unloaded [kg] 50kg to 55kg About 65kg 40-50kg 40-50kg 90 kg 70 kg
Material (predominant) Iron Iron Iron Iron Iron Iron
H e normally carries 10 tins
of charcoal, each tin is
about 15kg
He normally transport 2
bags, each bag is about 50kg
normally carries 1 bag of
charcoal/ trip, 50-60kg
He normally carries two
bags, each bag is 35-40kgCarries 28kg everyday
One bag of charcoal of
about 40-50kg
150 200 55 75 28 4528-200 kg
(Average 92kg)
LifespanHe has used the bike for 5
years
Estimation from bicycle
shop ownerN.A. N.A. N.A. Does not know
End-of-live-treatmentHe will sell the bike before
end of life Will sell it before end of life He is going to dispose it
He will sell before it is
completely unusable
Sell it to another person
before end of life
Sell it to another person
before end of life
Loss of charcoal during
transportation
He transport 2bags/day
(two trips) for 23-26 days in
a month, 1-2 incidences of
burst/month, he transport
charcoal 10months out of
12 months in a year
He has never had any burst,
he is in business for about 6
months now, He transports
about 200bags/month to
Mikumi which is 10km from
the village
He transports 3bags/day, for
18-20days in a month, he
normally gets about 10
bursts/month,
He operates/transport
charcoal all year round (12
months), he has had two
bursts in the past two years,
on average he transports 12-
15bags/month
Loss approximately 5%Around 2% per trip
(estimated)
Bursts (%) 3% 0% 18% 1%0-17.5 %
(Average 5.3%)
Loss of charcoal (%) 5% 2%2-5 %
(Average 3.5%)
N.A. N.A.
he sells a bag of charcoal
for TSH 14,000/15000 when
a bag bursts he sells it for
TSH 10,000/12,000
He sells a bag of charcoal
for TSH 5000/6000 when
the bag bursts he sells it for
TSH 4000/5000
N.A. N.A.
14500 5500
Maintenance
Engine oil 1litre/month , 1
Sprocket after every 4
months, 2tyres after every 8
months, 1 clutch cable after
every 3months
Engine oil 1litre/month,
Rear bearing after every 3
months
2 tyres once per year, 1litre
engine oil every month, 1
clutch carpet/month
1litre of engine oil/month,
he changes rear tube after
every 2-3 months, 1 gear
liver after every 2-4months,
welding the seat
occasionally,
Engine oil 1litre per 15days,
change of sprocket after
every 3months.
Plug 1 every two months, 2
tyres every six months,
brakes, engine oil (1litre),
Fuel consumption Petrol; 1litre to 20km Petrol; 1litre to 40kmPetrol; he uses 1.5litres to
drive to Kilosa and back
Petrol; He uses 2 litres to
drive to Kilosa and back
(Kilosa-Ulaya Mbuyuni)
Petrol; 20km per 1litre and
sometimes 10km per litre
bad road
Petrol; 1 litre to 15 km
Petrol (l/100km) 5.0 2.5 4.4 3.7 5.0 6.72.5-6.7 l
(Average 5l)
Return transport
About 0.5 of the days he
operates (23-26days) he
gets passengers when
driving back
On average 6trips out 10
trips he drives back with a
passenger
Out of 18-20 days he
operates in a month he gets
around 7passengers
Travelling empty
Carrying two passengers
per trip about
15days/month
Sometimes carry passengers
on returning trip (around
50% per month travel with
passengers)
Empty rides (%) 50% 40% 63% 100% 50% 50%40-100 %
(Average 58.9%)
Charcoal price
Capacity [kg charcoal]

Quantis 91
17.3 Interviews: Transportation vehicles - Small trucks
Parameter 1 2 3 4 5 Average
Location of interview N.A. Kilosa Uhindini Kilosa Uhindini Kilosa Uhindini Mikumi -
Truck Model N.A. Fuso Mistubishi Fuso Forward Fuso Hino Mistubishi Canter
Weight, unloaded [ton] 2.8 5.5 5 5.5 3.5
Material (predominant) Iron Iron Iron Iron Iron
80 bags, 9-10 tins
(80-100 )kg each
bag
4 tons but it can
load up to 10 tons
(it was modified
locally to carry
more load)
4tons but it can
load up to 10 tons
(the truck has been
modified to carry
more load)
4tons but it can
load up to 10tons
(the vehicle has
been modified)
40 bags (about
1120kgs of
charcoal)
7200 11201120-7200 kg
(Average 4160kg)
Lifespan N.A. N.A. N.A. N.A.
End-of-live-treatment
He will sale to
another person (
the assumption is
that it might end up
as landfill or
remelted)
Assumption:
Remelted or Landfill
Assumption:
Remelted or Landfill
Does not know
(assumption:
Remelted or
Landfill)
Loss of charcoal during
transportation
3-4 tins (each tin
has 12-15kg)1 to 2 tins (7-9 kg)
0.5 to 1bucket
(1bucket is
equivalent to
approximately 7-9
kg)
Around 1bucket/tin
Half a tin of
charcoal per trip
from the forest to
the market in Ruaha
Loss of charcoal (%) 0.7% 0.6%0.580357142857143-
0.7 %
Maintenance
Engine service after
every 10000km, he
changes Oil filter,
Diesel filter, Engine
oil (13litres), Greese
(3Kg)
Change engine oil
(12litres), oil filter,
use 4kg of grease
Change engine oil
(10 litres), oil filter,
grease 1 kg
Change oil filter,
diesel filter, engine
oil (12 litres),
occasional
maintenance eg
welding, acid water
(for battery),
Welding springs,
change oil filter
every month, diesel
filter, engine oil
(5litres)
Diesel tarmac road
(l/100km)12.5 12.5
12.5-12.5 l
(Average 13l)
Diesel earth road
(l/100km)14.3 25 25 25
14.3-25 l
(Average 22l)
Return transport
The truck drives
back with shop
goods
The truck drives
back with shop
goods
The truck drives
back with shop
goods
The truck drives
back with shop
goods
Returns empty
Empty rides (%) 0% 0% 0% 0% 100%0-100 %
(Average 20%)
Capacity [kg charcoal]

Quantis 92
17.4 Interviews: Transportation vehicles - Big trucks
Parameter 1 2 3 4 Average
Location of interview Mikumi Mikumi Mikumi Mikumi -
Truck Model Scania R.420 Freight liner DAF CF
Weight, unloaded [ton] 17 15.24 13.5 20
Material (predominant) Iron
49100 30480 26000 3250026000-49100 kg
(Average 34520kg)
Lifespan N.A.
End-of-live-treatment
He will sale to
another person (
the assumption is
that it might end up
as landfill or
remelted)
Loss of charcoal during
transportation
Average 70 to
90kg/per tripAverage 3%
1 to 2% of the
charcoal carried on
the truck
No losses
Loss of charcoal (%) 0.2% 3.0% 1.5% 0.0%0-3 %
(Average 1.2%)
Maintenance
Brakes, changing
tyres, changing
engine oil,
Changing engine oil,
oil filter, brake pads,
grease, changing
tyre tubes,
Grease, Engine oil,
oil filter, changing
tyre tubes, welding,
Oil filter, grease,
engine oil, changing
tyres and tubes,
Diesel tarmac road
(l/100km)28.6 28.6 25.0 26.7
25-28.6 l
(Average 27l)
Return transport
Most of the time
return with load
including charcoal
(7-9 out of 10 trips)
3-5 out of 10 return
trips (carry goods
including charcoal)
Empty
Sometimes returns
empty ( 3-5 out of
10 trips)
Empty rides (%) 20% 25% 100% 25%20-100 %
(Average 42.5%)
Capacity [kg charcoal]

Quantis 93
17.5 Interviews: Charcoal wholesaler and retailer
Parameter 1 2 3 4 5 6 7 8 9 Average
Interview location Kilosa Mjini Kilosa Behewa Kilosa Magomeni Kilosa Magomeni Kilosa Mtendeni Kilosa MtendeniKimara, Dar es
Salaam
Kimara, Dar es
Salaam
Kimara Mwisho, Dar
es Salaam
Date of interview 20.05.2013 21.05.2013 20.05.2013 20.05.2013 20.05.2013 20.05.2013
Wholesaler or
retailerRetailer Wholesaler Retailer Retailer Retailer Retailer
Wholesaler and
retailer
Wholesaler and
retailerWholesaler
Amount of charcoal
sold [tons/month]
Approximately 2 bags
(each bag is around
50-60kg)
30 bags (each 50-
60kg)
50 bags (each bag is
about 7 tins, each tin
is 7-9kg)
12 bags (8 tins per
bag)
4 bags (each bag is
about 8 tins)
12 bags (of about
7tins each)
Dry season (Around
30-40 bags/per
month)
Rain season (Around
40-50 bags/month)
Dry season: 20-
30bags/month
Rain season: 50-
60bags/month
Dry season: around
50bags
Rain season: around
150 bags
Charcoal sold
comes from [region]Kilosa (Morogoro) Kilosa Kilosa (Morogoro) Kilosa Morogoro Kilosa Morogoro Kilosa Morogoro Tanga Tanga and Kisarawe
Tanga, Singida,
Morogoro,
How is charcoal
transported to the
store?
[vehicle type]
Charcoal sold in
bags or tins?
Small tins (about
1.5kg) and medium
size bucket (about 4-
5kg)
Bags Small tins (1.5 kg)
Small tins (1.5 kg)
and medium size
buckets (4-5kg)
Small tins (about
1.5kg)
Medium size tins (4-
5kg) and small tins
(about 1.5kg)
Both in Bags and tins Both In Bags and Tins In Bags
How is charcoal
transported home?By bicycle or by hand
Bicycle or
motorcycleBy hand or bicycles By hand or bicycle By hand or bicycle By hand or bicycle
Wheelbarrows, small
vehicles, by hand,
motorcycles
By hand,
wheelbarrow and
small vehicles
Small vehicles,
wheelbarrows,
motorbikes, by hand
1 small tin per bag
Less than a small tin
per bag (1 small tin is
about 1.5kg)
3 small tins/bag
1to 2tins (of about
1.5kg each per bag of
8tins)
1 tin (7-9 kg) per bag
1 to 2 small tins of
(about 1.5kg each)
per bag of 7 tins
Around two
bags/month
Size of a bag is 50-80
kg (bags are not of
the same size)
1 to 2 bags/month
Size of bag 60-70kg
Could not give
estimate of losses,
however he normally
see people coming to
collect the charcoal
dust
2.7% 1.8% 8.0% 3.5% 14.5% 2.7% 5.0% 5.0%2-14.5 %
(Average 5.4%)
How are the losses
used?
Use for cooking or
thrown(very fine
particles)
For cooking (if the
size of the particles is
a bit larger) or
thrown (fine
particles)
Some are used for
cooking and the rest
(very fine particles)
are thrown
Thrown Not used
Some are used for
cooking and some
are not used
Not used Losses are not used
he does not know
where the dust is
taken and for what
purpose/use
Trucks ( eg. Fuso)
Trucks e.g Mitsubish
canter 2.5 tons and
Fuso
Canter (for charcoal
which is coming from
Morogoro and Pwani
regions)
Big trucks eg Fuso
Losses of charcoal
per bag at the store
site [tins/bag]
BicycleBicycleBicycleBicycleBicycleBicycle

Quantis 94

Quantis 95