Embed Size (px)
Citation preview
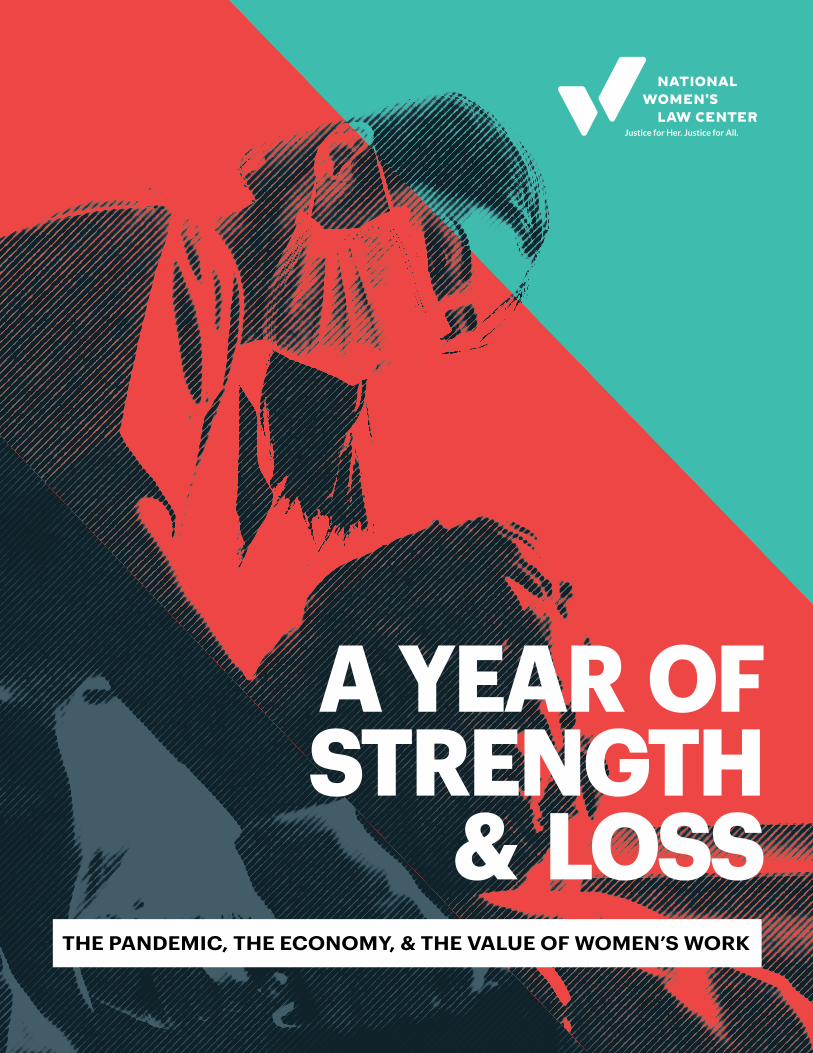
A YEAR OF STRENGTH
& LOSS THE PANDEMIC, THE ECONOMY, & THE VALUE OF WOMEN’S WORK
MARCH 2021
“After a year of living under the debilitating effects of the coronavirus pandemic, we are only just beginning to understand its true cost to our society and our economy. We entered this crisis a divided and unequal country, one rife with gender and racial disparities that continue to shape who is impacted and how. The pandemic accelerated trends women have long fought to reverse, pushing hundreds of thousands out of the labor force even as we all relied on the unpaid and underpaid labor of women as essential workers, as caregivers, and as parents. Black, Latina, Native, and Asian-American women continue to bear the brunt of this pain with minimal recognition, despite serving as the backbone for our economy, our democracy, and our society.
Women’s History Month traditionally celebrates all that women have done, but this year we are celebrating all that women continue to do. We’ve seen how women fuel our country and yet, we’ve also witnessed that when their collective well-being is an afterthought, we are all harmed. No one prospers when states escalate attacks on reproductive freedom, or when institutions from our schools to the media continue to fail survivors of sexual violence. Our entire nation suffers deeply when women are forced out of work and not paid equally, and when our care infrastructure collapses. The last year has been a case study of what happens to the country when women are constantly forced to prove our individual resilience and our perseverance in the face of adversity. We say enough is enough--and we need future-forward laws and policies that say the same.
“Statistics like those in this report can only tell part of the story of the past year. We know the true impact of this pandemic is felt not in a bar graph or pie chart but in the daily tears shed, the futures long-deferred, and the more than half a million lives lost. So let me say this clearly and directly to the women of this country: You’ve earned far more than you’ve been given. You have fought for the world even when the world never seems to fight for you. Though it may not always feel like it, I want you to know the Law Center hears you. We hear your stress, your fear, and your rage. And every day it is our great privilege to fight for the safety, equity, and justice you deserve.”
A message from Fatima Goss Graves, president and CEO of the National Women’s Law Center:
PAGE 1
MARCH 2021
Women were struggling to make ends meet before the COVID-19 pandemic ever started. Women made up nearly two-thirds of the low-paid workforce in 2018.
• Women of every race and ethnicity were overrepresented in the low-paid jobs.
• 15 percent of women in low-paid jobs lived in poverty and 39 percent lived below 200 percent of the poverty line.
• 53 percent of Black women, 53 percent of Native American women, and 49 percent of Latinas working in low-paid jobs lived below 200 percent of the federal poverty line.
• 73 percent of Black mothers, 67 percent of Native American mothers, and 63 percent of Latina mothers working in low-paid jobs lived below 200 percent of the federal poverty line.1
Women made up nearly seven in 10 of workers in tipped jobs in 2019.
• 15.8 percent of women and 17.6 percent of women of color working in tipped occupations was in poverty.2
Women made up about two-thirds of workers making minimum wage in 2019.3
In 2019, women made 82 cents for every dollar men made and compared to white, non-Hispanic men:
• Black women made 63 cents;
• Latinas made 55 cents; and
• Native American women made 60 cents.4
Millions of women have left the labor force. Over 2.3 million women completely dropped out of the labor force between February 2020 and February 2021, meaning they are not working or looking for work. By comparison, over 1.8 million men have left the labor force since February 2020.5
863,000 women left the labor force in September 2020 alone. Outside of March and April 2020, this is the single largest one-month exit of women from the labor force since this data has been collected. The next largest exit was of 550,000 women in January 1968.6
The impact of COVID-19 on women
PAGE 2
Women have lost a generation of labor force participation gains. Women’s labor force participation was 57.0 percent in February 2021. Before the pandemic, the last time women’s labor force participation had been this low was in 1988.7
• By comparison, men’s labor force participation rate was 69.6 percent in February 2021.
Black women’s labor force participation rate was 59.7 percent in February 2021. Before the pandemic, the last time their rate was this low was in 1993.8
Latinas’ labor force participation rate was 57.8 percent in February 2021. Before the pandemic, the last time their rate was this low was in 2015.9
Since February 2020, women’s labor force participation rate dropped by 2.2 percentage points. Meanwhile, participation rates for Black women and Latinas dropped by 4.2 percentage points and 4.1 percentage points, respectively.10
• By comparison, white men’s labor force participation rate was 69.7 percent in February 2021.11
Women are bearing the brunt of pandemic-related job loss. Women lost more than 12.2 million jobs from February 2020 through April 2020, 11.3 million of which were in April alone, which means one month of the pandemic’s losses wiped out nearly an entire decade of women’s job gains since the Great Recession.12
In February 2021, women were still short nearly 5.1 million jobs compared to February 2020.13
• By comparison, men were still short 4.4 million jobs in February 2021.14
Nearly eight in 10 of the nearly 5.1 million net jobs women have lost in the past year were in the following four industries: leisure and hospitality (36.4 percent), education and health (20.2 percent), government (15.9 percent), and retail (7.0 percent).15
In February 2021, women held 71.2 million jobs, or about the levels last seen in 2016, five years ago.16
Women account for 53.5 percent of the net job loss since the start of this crisis.17
More than two in five (41.5 percent) of women’s jobs that were originally lost have yet to return.18
Nearly one in six child care jobs lost since the start of the pandemic have not returned.19
Black women’s and Latinas’ unemployment rates are more than 1.6 times higher than white men’s. In 2020, women had four months (April, May, June, July) where their unemployment rate was in the double digits. This marks the first time ever that women’s unemployment rate hit double digits since data has been collected.20
• By comparison, men had three months of double-digit unemployment (April, May, June), but while their unemployment rate peaked at 13.1 percent in April, women’s was more than two percentage points higher—15.5 percent.21
Latinas’ unemployment rate peaked at 20.1 percent in April 2020. Data on Latinas has only been collected since 2003, but while they experienced double-digit unemployment during and after the Great Recession, they had never seen an unemployment rate this high before the pandemic. Latinas’ unemployment was still 8.5 percent in February 2021, more than 1.7 times their pre-pandemic unemployment rate of 4.9 percent in February 2020.22
Black women’s unemployment rate peaked at 16.6 percent in May 2020; the last time Black women saw unemployment rates this high (before the pandemic) was in 1983. Black women’s unemployment was still 8.9 percent in February 2021, more than 1.8 times their pre-pandemic unemployment rate of 4.9 percent in February 2020.23
• By comparison, white men’s unemployment rate peaked at 12.3 percent in April 2020 and was 5.3 percent in February 2021.24
PAGE 3
If the more than 2.3 million women who have left the labor force over the past year rejoined in February 2021 and were counted among the unemployed, women’s unemployment rate would have been 8.8 percent instead of 5.9 percent. Similarly, if the over 1.8 million men who have left the labor force since February 2020 rejoined and were counted among the unemployed in February 2021, men’s unemployment rate would have been 8.0 percent.25
Over the past year, 606,000 Black women have left the labor force, along with 618,000 Latinas. If these women rejoined the labor force in February 2021 and were counted among the unemployed, the unemployment rate for Black women would have been 14.1 percent instead of 8.9 percent and Latinas’ would have been 13.1 percent instead of 8.5 percent.26
Women’s lost household employment incomeIn mid-January More than 61.2 million women—about half (48.4 percent) of women overall—reported that their household has lost employment income since March 2020.
• Six in 10 Latinas (60.1 percent) and over half of Black, non-Hispanic women (54.5 percent) report that someone in their household had lost employment income since March.
• This compares to 43.6 percent of white, non-Hispanic men.
In mid-January, more than one in four women (26.1 percent) expected their household to lose employment income in the next four weeks.
• Over four in 10 Latinas (40.8 percent) and over three in 10 Asian, non-Hispanic women (30.4 percent) and Black, non-Hispanic women (31.7 percent) reported expecting someone in their household to lose employment income over the next month.27
Many women are going hungry. In mid-January, one in nine women (11.1 percent) report sometimes or often not having enough to eat in the past seven days.
More than one in five Latinas (21.5 percent) and nearly one in five Black, non-Hispanic women (18.1 percent) report sometimes or often not having enough to eat in the past seven days.28
Millions of women are behind on their rent and mortgage payments. Among renters, about one in five women (20.3 percent) reported being behind on their rent payment in mid-January
• Among renters, nearly one in three Black, non-Hispanic women (32.2 percent) and nearly three in 10 Latinas (29.4 percent) were behind on their rent in mid-January.
Among those with a mortgage, about one in 10 women (10.2 percent) were behind on their mortgage payment in mid-January
• Among those with a mortgage, 15.0 percent of Latinas, 16.0 percent of Asian, non-Hispanic women, and 18.9 percent of Black, non-Hispanic women were behind on their mortgage payment.29
Women are more likely than men to report feeling anxiety or depression.
In mid-January, nearly two in five women (39.3 percent) reported being anxious more than half of the past seven days, compared to 30.2 percent of men.
In mid-January, about one in four women (25.3 percent) reported feeling depressed more than half of the past seven days, compared to 21.1 percent of men.30
PAGE 4
PAGE 5
1 Jasmine Tucker and Julie Vogtman, National Women’s Law Center (NWLC), When Hard Work is Not Enough: Women in Low-Paid Jobs (Apr. 2020), available at https://nwlc.org/resources/when-hard-work-is-not-enough-women-in-low-paid-jobs/.
2 Amanda Fins, NWLC, One Fair Wage: Women Fare Better in States with Equal Treatment for Tipped Workers (Feb. 2021), available at https://nwlc.org/resources/one-fair-wage/.
3 NWLC, Women and the Minimum Wage, State by State (Jan. 2021), available at https://nwlc.org/resources/women-and-minimum-wage-state-state/.
4 NWLC, The Wage Gap: The Who, How, Why, and What to Do (Oct. 2020), available at https://nwlc.org/resources/the-wage-gap-the-who-how-why-and-what-to-do/.
5 Claire Ewing-Nelson and Jasmine Tucker, NWLC, A Year Into the Pandemic, Women Are Still Short Nearly 5.1 Million Jobs (Mar. 2021), available at https://nwlc.org/resources/feb-jobs-2021/.
6 NWLC calculations based on Bureau of Labor Statistics (BLS), historical data for Household Data Table A-1, available at https://www.bls.gov/webapps/legacy/cpsatab1.htm. Figures are for people ages 20 and over.
7 Claire Ewing-Nelson and Jasmine Tucker, NWLC, A Year Into the Pandemic, Women Are Still Short Nearly 5.1 Million Jobs (Mar. 2021), available at https://nwlc.org/resources/feb-jobs-2021/.
8 BLS, historical data for Household Data Table A-2, available at https://www.bls.gov/webapps/legacy/cpsatab2.htm. Figures are for people ages 20 and over.
9 BLS, historical data for Household Data Table A-3, available at https://www.bls.gov/webapps/legacy/cpsatab3.htm. Figures are for people ages 20 and over.
10 BLS, historical data for Household Data Tables A-1, A-2, and A-3, available at https://www.bls.gov/cps/cpsatabs.htm. Figures are for people 20 ages 20 and over.
11 BLS, historical data for Household Data Table A-2, available at https://www.bls.gov/webapps/legacy/cpsatab2.htm. Figures are for people ages 20 and over.
12 NWLC calculations based on BLS, historical data for Establishment Data Table B-5, available at https://www.bls.gov/webapps/legacy/cesbtab5.htm.
13 Claire Ewing-Nelson and Jasmine Tucker, NWLC, A Year Into the Pandemic, Women Are Still Short Nearly 5.1 Million Jobs (Mar. 2021), available at https://nwlc.org/resources/feb-jobs-2021/.
14
15 Claire Ewing-Nelson and Jasmine Tucker, NWLC, A Year Into the Pandemic, Women Are Still Short Nearly 5.1 Million Jobs (Mar. 2021), available at https://nwlc.org/resources/feb-jobs-2021/.
16 NWLC calculations based on BLS, historical data for Establishment Data Table B-5, available at https://www.bls.gov/webapps/legacy/cesbtab5.htm.
17 Claire Ewing-Nelson and Jasmine Tucker, NWLC, A Year Into the Pandemic, Women Are Still Short Nearly 5.1 Million Jobs (Mar. 2021), available at https://nwlc.org/resources/feb-jobs-2021/.
18 Claire Ewing-Nelson and Jasmine Tucker, NWLC, A Year Into the Pandemic, Women Are Still Short Nearly 5.1 Million Jobs (Mar. 2021), available at https://nwlc.org/resources/feb-jobs-2021/.
19 Claire Ewing-Nelson and Jasmine Tucker, NWLC, A Year Into the Pandemic, Women Are Still Short Nearly 5.1 Million Jobs (Mar. 2021), available at https://nwlc.org/resources/feb-jobs-2021/.
20 BLS, historical data for Household Data Table A-1, available at https://www.bls.gov/webapps/legacy/cpsatab1.htm. Figures are for people ages 20 and over.
21 BLS, historical data for Household Data Table A-1, available at https://www.bls.gov/webapps/legacy/cpsatab1.htm. Figures are for people ages 20 and over.
22 BLS, historical data for Household Data Table A-3, available at https://www.bls.gov/webapps/legacy/cpsatab3.htm. Figures are for people ages 20 and over.
23 BLS, historical data for Household Data Table A-2, available at https://www.bls.gov/webapps/legacy/cpsatab2.htm. Figures are for people ages 20 and over.
24 BLS, historical data for Household Data Table A-2, available at https://www.bls.gov/webapps/legacy/cpsatab2.htm. Figures are for people ages 20 and over.
25 Claire Ewing-Nelson and Jasmine Tucker, NWLC, A Year Into the Pandemic, Women Are Still Short Nearly 5.1 Million Jobs (Mar. 2021), available at https://nwlc.org/resources/feb-jobs-2021/.
26 Claire Ewing-Nelson and Jasmine Tucker, NWLC, A Year Into the Pandemic, Women Are Still Short Nearly 5.1 Million Jobs (Mar. 2021), available at https://nwlc.org/resources/feb-jobs-2021/.
27 Jasmine Tucker and Claire Ewing-Nelson, NWLC, Over 61.2 Million Women Live in a Household That Has Lost Work Income Since March 2020 (Feb. 2021), available at https://nwlc.org/resources/over-61-2-million-women-live-in-a-household-that-has-lost-work-income-since-march-2020/.
28 Jasmine Tucker and Claire Ewing-Nelson, NWLC, Over 61.2 Million Women Live in a Household That Has Lost Work Income Since March 2020 (Feb. 2021), available at https://nwlc.org/resources/over-61-2-million-women-live-in-a-household-that-has-lost-work-income-since-march-2020/.
29 Jasmine Tucker and Claire Ewing-Nelson, NWLC, Over 61.2 Million Women Live in a Household That Has Lost Work Income Since March 2020 (Feb. 2021), available at https://nwlc.org/resources/over-61-2-million-women-live-in-a-household-that-has-lost-work-income-since-march-2020/.
30 NWLC calculations based on U.S. Census Bureau, Measuring Household Experiences During the Coronavirus (COVID-19) Pandemic, 2020-2021 Household Pulse Survey, available at https://www.census.gov/data/experimental-data-products/household-pulse-survey.html using data from week 22.