Embed Size (px)
Citation preview
F5F4F3F1 F2
E1 E5E4E3E2
B5 B6 B7
C4 C5 C6 C7 C8 C9
D1 D2 D3 D4 D5 D6
H1
B1
C2
H2
B4B2
C3C1
B3
A1
G1 G2 G3 G4
1:50,000Projection:Datum:Map Produced:
New Zealand Transverse MercatorGeodetic Datum of New Zealand 20000.5 0 0.5 1 1.5 2 Km
@A3
DISCLAIMER: This product is for informational purposesand should not be relied upon for legal, engineering or surveying purposes.
Aurecon cannot accept any responsibility for any errors, omissions or positional accuracy of the data.Aerial imagery sourced from Orthophoto V21 Napier. Crown Copyright Reserved.
° Rockfall Risk Map D To Accompany GNS Science Report CR2012-214 18/09/2012
Notes:These maps should be read inconjunction with supportingtechnical reports.Uncoloured areas are those notconsidered in the risk assessment. Itis not implied that in uncoloured areasno risk exists.File resolution reduced for easierweb download.
Annual Risk Yr710-1 to 10-2
10-2 to 10-3
10-3 to 10-4
10-4 to 10-5
Less than 10-5
DISCLAIMER: These data and accompanying reports have been prepared by the Institute of Geological and Nuclear Sciences Limited (GNS Science) exclusively for and under contract to the Canterbury Earthquake Recovery Authority and Christchurch City Council.These data and reports consider the risk associated with geological hazards. As there is always uncertainty inherent within the nature of natural events GNS Science gives no warranties of any kind concerning its assessment and estimates, including accuracy,completeness, timeliness or fitness for purpose and accepts no responsibility for any actions taken based on, or reliance placed on them by any person or organisation other than the Canterbury Earthquake Recovery Authority and Christchurch City Council. GNSScience excludes to the full extent permitted by law any liability to any person or organisation other than the Canterbury Earthquake Recovery Authority and Christchurch City Council for any loss, damage or expense, direct or indirect, and however caused,whether through negligence or otherwise, resulting from any person or organisation's use of, or reliance on this report."
Increa
sing R
iskFro
m Ro
ckfal
l
Data Supplied By:
Maps Produced For:
Maps Produced By:

1:5,000Projection:Datum:Map Produced:
New Zealand Transverse MercatorGeodetic Datum of New Zealand 200050 0 50 100 150 20025 m
@A3
DISCLAIMER: This product is for informational purposesand should not be relied upon for legal, engineering or surveying purposes.
Aurecon cannot accept any responsibility for any errors, omissions or positional accuracy of the data.Aerial imagery sourced from Orthophoto V21 Napier. Crown Copyright Reserved.
° Rockfall Risk Map D To Accompany GNS Science Report CR2012-214 12/09/2012
F5F4F3F1 F2
E1 E5E4E3E2
B5 B6 B7
C4 C5 C6 C7 C8 C9
D1 D2 D3 D4 D5 D6
H1
B1
C2
H2
B4B2
C3C1
B3
A1
G1 G2 G3 G4
MAP: A1See Map:
See M
ap:
See Map: B3
See Map:
Sourced from NZTopo Database. Crown Copyright Reserved
Annual Risk Yr710-1 to 10-2
10-2 to 10-3
10-3 to 10-4
10-4 to 10-5
Less than 10-5
10-6 Risk
Notes:These maps should be read inconjunction with supportingtechnical reports.Uncoloured areas are those notconsidered in the risk assessment. Itis not implied that in uncoloured areasno risk exists.File resolution reduced for easierweb download.
DISCLAIMER: These data and accompanying reports have been prepared by the Institute of Geological and Nuclear Sciences Limited (GNS Science) exclusively for and under contract to the Canterbury Earthquake Recovery Authority and Christchurch City Council.These data and reports consider the risk associated with geological hazards. As there is always uncertainty inherent within the nature of natural events GNS Science gives no warranties of any kind concerning its assessment and estimates, including accuracy,completeness, timeliness or fitness for purpose and accepts no responsibility for any actions taken based on, or reliance placed on them by any person or organisation other than the Canterbury Earthquake Recovery Authority and Christchurch City Council. GNSScience excludes to the full extent permitted by law any liability to any person or organisation other than the Canterbury Earthquake Recovery Authority and Christchurch City Council for any loss, damage or expense, direct or indirect, and however caused,whether through negligence or otherwise, resulting from any person or organisation's use of, or reliance on this report."
Increa
sing R
iskFro
m Ro
ckfal
l
Data Supplied By:
Maps Produced For:
Maps Produced By:
1:5,000Projection:Datum:Map Produced:
New Zealand Transverse MercatorGeodetic Datum of New Zealand 200050 0 50 100 150 20025 m
@A3
DISCLAIMER: This product is for informational purposesand should not be relied upon for legal, engineering or surveying purposes.
Aurecon cannot accept any responsibility for any errors, omissions or positional accuracy of the data.Aerial imagery sourced from Orthophoto V21 Napier. Crown Copyright Reserved.
° Rockfall Risk Map D To Accompany GNS Science Report CR2012-214 12/09/2012
F5F4F3F1 F2
E1 E5E4E3E2
B5 B6 B7
C4 C5 C6 C7 C8 C9
D1 D2 D3 D4 D5 D6
H1
B1
C2
H2
B4B2
C3C1
B3
A1
G1 G2 G3 G4
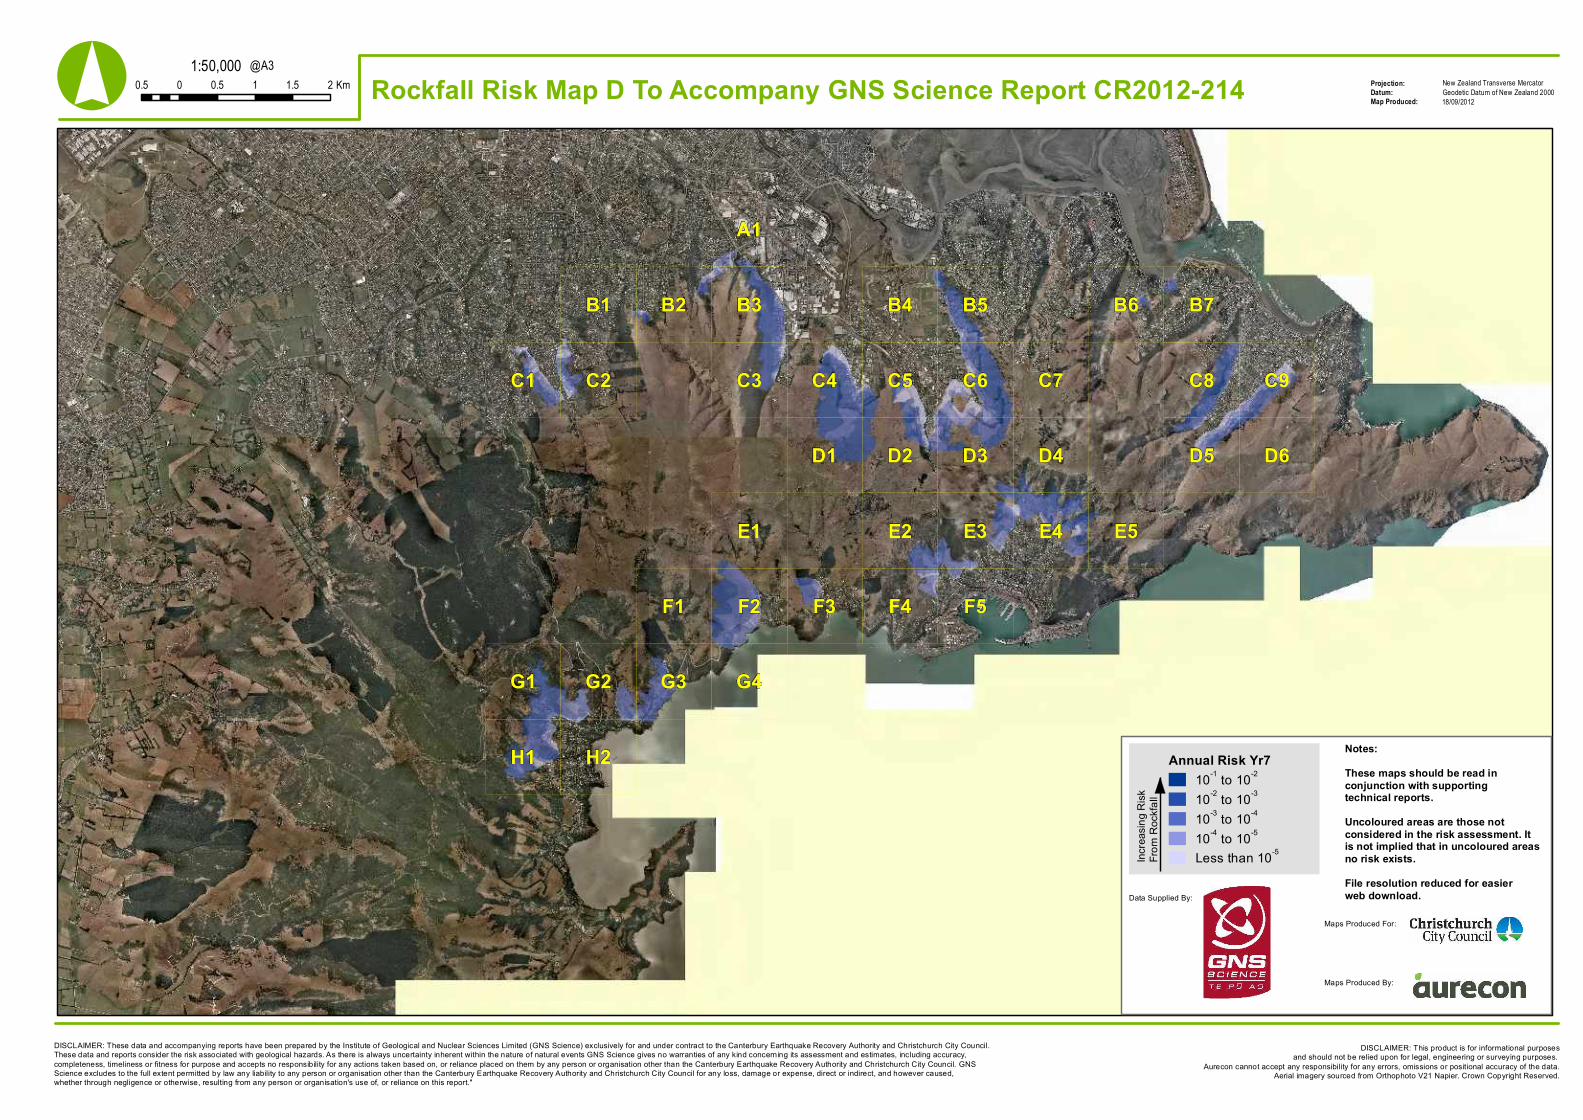
MAP: B1See Map:
See M
ap: B
2
See Map: C2
See Map:
Sourced from NZTopo Database. Crown Copyright Reserved
Annual Risk Yr710-1 to 10-2
10-2 to 10-3
10-3 to 10-4
10-4 to 10-5
Less than 10-5
10-6 Risk
Notes:These maps should be read inconjunction with supportingtechnical reports.Uncoloured areas are those notconsidered in the risk assessment. Itis not implied that in uncoloured areasno risk exists.File resolution reduced for easierweb download.
DISCLAIMER: These data and accompanying reports have been prepared by the Institute of Geological and Nuclear Sciences Limited (GNS Science) exclusively for and under contract to the Canterbury Earthquake Recovery Authority and Christchurch City Council.These data and reports consider the risk associated with geological hazards. As there is always uncertainty inherent within the nature of natural events GNS Science gives no warranties of any kind concerning its assessment and estimates, including accuracy,completeness, timeliness or fitness for purpose and accepts no responsibility for any actions taken based on, or reliance placed on them by any person or organisation other than the Canterbury Earthquake Recovery Authority and Christchurch City Council. GNSScience excludes to the full extent permitted by law any liability to any person or organisation other than the Canterbury Earthquake Recovery Authority and Christchurch City Council for any loss, damage or expense, direct or indirect, and however caused,whether through negligence or otherwise, resulting from any person or organisation's use of, or reliance on this report."
Increa
sing R
iskFro
m Ro
ckfal
l
Data Supplied By:
Maps Produced For:
Maps Produced By:

1:5,000Projection:Datum:Map Produced:
New Zealand Transverse MercatorGeodetic Datum of New Zealand 200050 0 50 100 150 20025 m
@A3
DISCLAIMER: This product is for informational purposesand should not be relied upon for legal, engineering or surveying purposes.
Aurecon cannot accept any responsibility for any errors, omissions or positional accuracy of the data.Aerial imagery sourced from Orthophoto V21 Napier. Crown Copyright Reserved.
° Rockfall Risk Map D To Accompany GNS Science Report CR2012-214 12/09/2012
F5F4F3F1 F2
E1 E5E4E3E2
B5 B6 B7
C4 C5 C6 C7 C8 C9
D1 D2 D3 D4 D5 D6
H1
B1
C2
H2
B4B2
C3C1
B3
A1
G1 G2 G3 G4
MAP: B2See Map:
See M
ap: B
3
See Map:
See Map: B1
Sourced from NZTopo Database. Crown Copyright Reserved
Annual Risk Yr710-1 to 10-2
10-2 to 10-3
10-3 to 10-4
10-4 to 10-5
Less than 10-5
10-6 Risk
Notes:These maps should be read inconjunction with supportingtechnical reports.Uncoloured areas are those notconsidered in the risk assessment. Itis not implied that in uncoloured areasno risk exists.File resolution reduced for easierweb download.
DISCLAIMER: These data and accompanying reports have been prepared by the Institute of Geological and Nuclear Sciences Limited (GNS Science) exclusively for and under contract to the Canterbury Earthquake Recovery Authority and Christchurch City Council.These data and reports consider the risk associated with geological hazards. As there is always uncertainty inherent within the nature of natural events GNS Science gives no warranties of any kind concerning its assessment and estimates, including accuracy,completeness, timeliness or fitness for purpose and accepts no responsibility for any actions taken based on, or reliance placed on them by any person or organisation other than the Canterbury Earthquake Recovery Authority and Christchurch City Council. GNSScience excludes to the full extent permitted by law any liability to any person or organisation other than the Canterbury Earthquake Recovery Authority and Christchurch City Council for any loss, damage or expense, direct or indirect, and however caused,whether through negligence or otherwise, resulting from any person or organisation's use of, or reliance on this report."
Increa
sing R
iskFro
m Ro
ckfal
l
Data Supplied By:
Maps Produced For:
Maps Produced By:
1:5,000Projection:Datum:Map Produced:
New Zealand Transverse MercatorGeodetic Datum of New Zealand 200050 0 50 100 150 20025 m
@A3
DISCLAIMER: This product is for informational purposesand should not be relied upon for legal, engineering or surveying purposes.
Aurecon cannot accept any responsibility for any errors, omissions or positional accuracy of the data.Aerial imagery sourced from Orthophoto V21 Napier. Crown Copyright Reserved.
° Rockfall Risk Map D To Accompany GNS Science Report CR2012-214 12/09/2012
F5F4F3F1 F2
E1 E5E4E3E2
B5 B6 B7
C4 C5 C6 C7 C8 C9
D1 D2 D3 D4 D5 D6
H1
B1
C2
H2
B4B2
C3C1
B3
A1
G1 G2 G3 G4
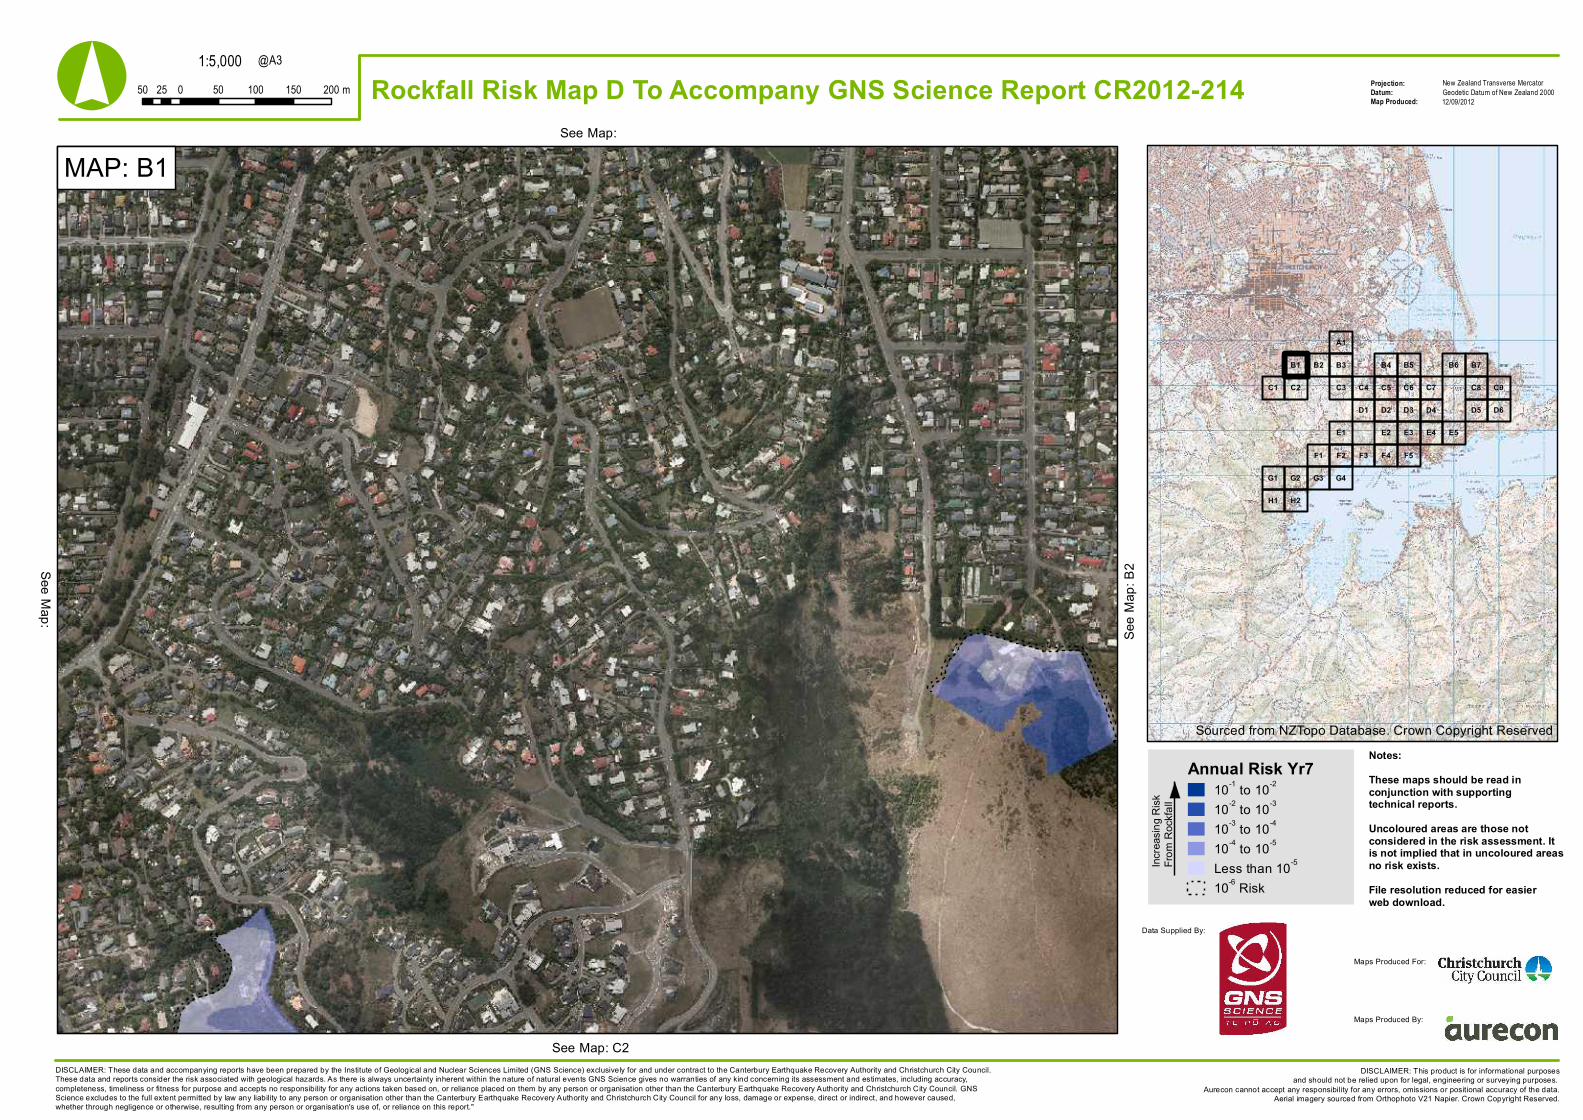
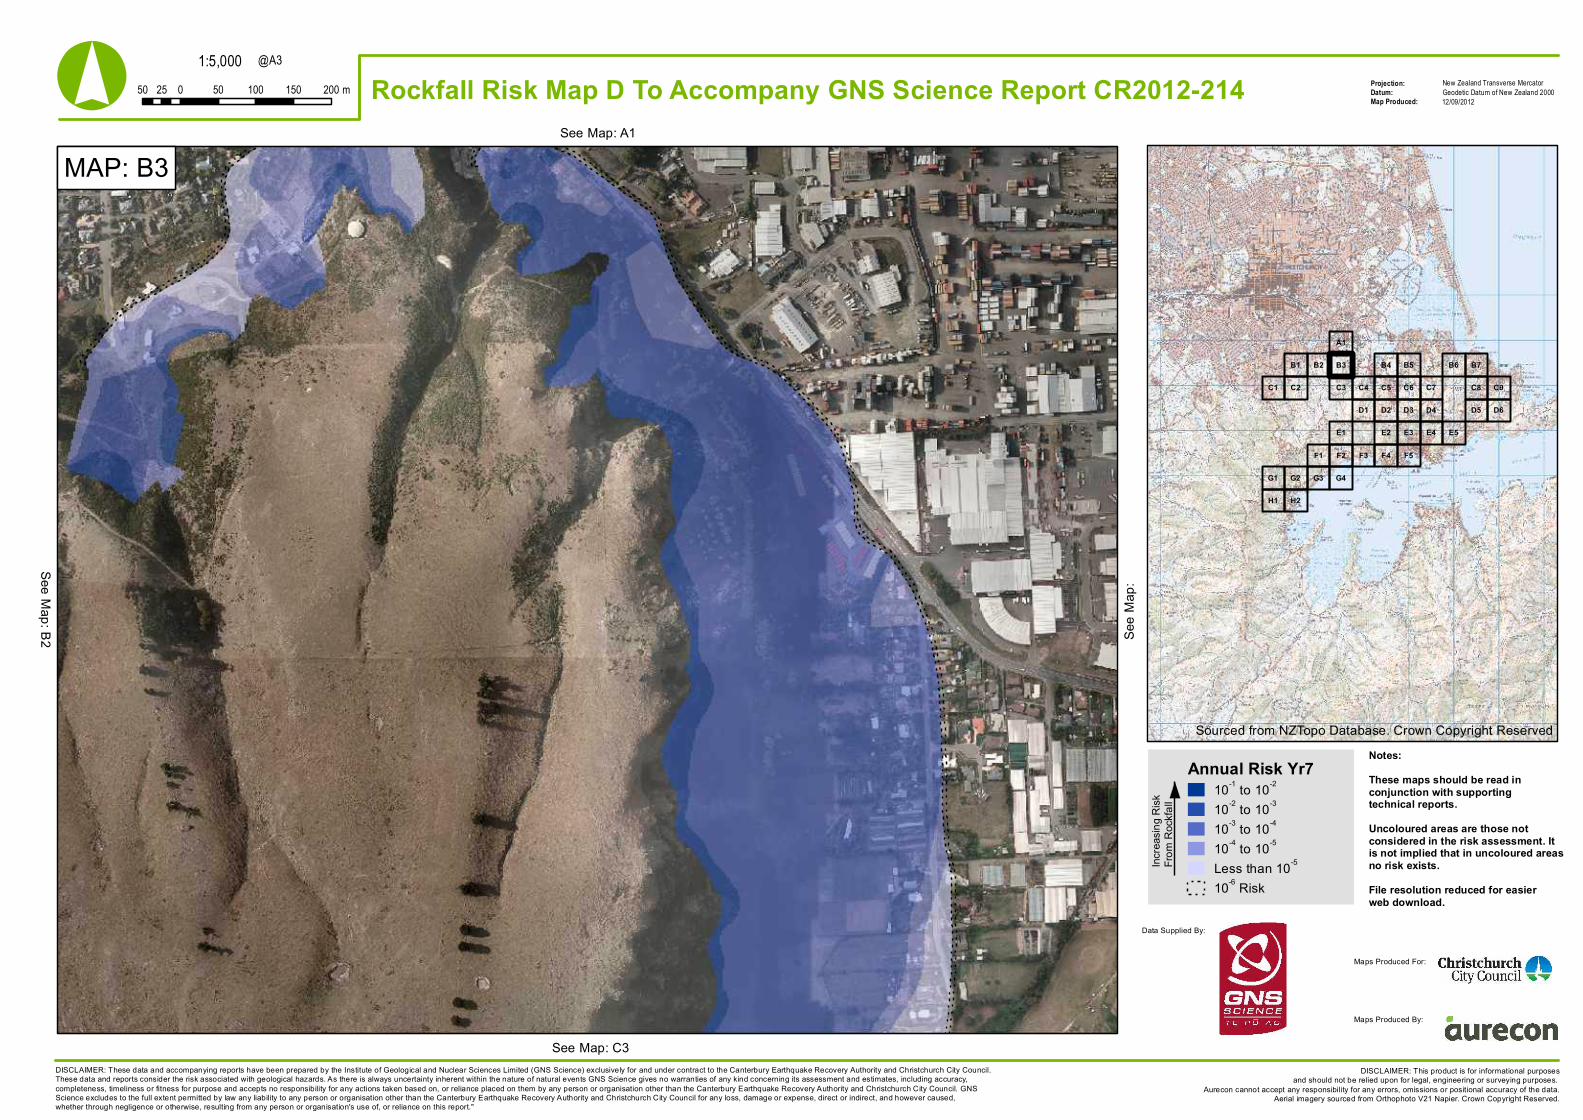
MAP: B3See Map: A1
See M
ap:
See Map: C3
See Map: B2
Sourced from NZTopo Database. Crown Copyright Reserved
Annual Risk Yr710-1 to 10-2
10-2 to 10-3
10-3 to 10-4
10-4 to 10-5
Less than 10-5
10-6 Risk
Notes:These maps should be read inconjunction with supportingtechnical reports.Uncoloured areas are those notconsidered in the risk assessment. Itis not implied that in uncoloured areasno risk exists.File resolution reduced for easierweb download.
DISCLAIMER: These data and accompanying reports have been prepared by the Institute of Geological and Nuclear Sciences Limited (GNS Science) exclusively for and under contract to the Canterbury Earthquake Recovery Authority and Christchurch City Council.These data and reports consider the risk associated with geological hazards. As there is always uncertainty inherent within the nature of natural events GNS Science gives no warranties of any kind concerning its assessment and estimates, including accuracy,completeness, timeliness or fitness for purpose and accepts no responsibility for any actions taken based on, or reliance placed on them by any person or organisation other than the Canterbury Earthquake Recovery Authority and Christchurch City Council. GNSScience excludes to the full extent permitted by law any liability to any person or organisation other than the Canterbury Earthquake Recovery Authority and Christchurch City Council for any loss, damage or expense, direct or indirect, and however caused,whether through negligence or otherwise, resulting from any person or organisation's use of, or reliance on this report."
Increa
sing R
iskFro
m Ro
ckfal
l
Data Supplied By:
Maps Produced For:
Maps Produced By:
1:5,000Projection:Datum:Map Produced:
New Zealand Transverse MercatorGeodetic Datum of New Zealand 200050 0 50 100 150 20025 m
@A3
DISCLAIMER: This product is for informational purposesand should not be relied upon for legal, engineering or surveying purposes.
Aurecon cannot accept any responsibility for any errors, omissions or positional accuracy of the data.Aerial imagery sourced from Orthophoto V21 Napier. Crown Copyright Reserved.
° Rockfall Risk Map D To Accompany GNS Science Report CR2012-214 12/09/2012
F5F4F3F1 F2
E1 E5E4E3E2
B5 B6 B7
C4 C5 C6 C7 C8 C9
D1 D2 D3 D4 D5 D6
H1
B1
C2
H2
B4B2
C3C1
B3
A1
G1 G2 G3 G4
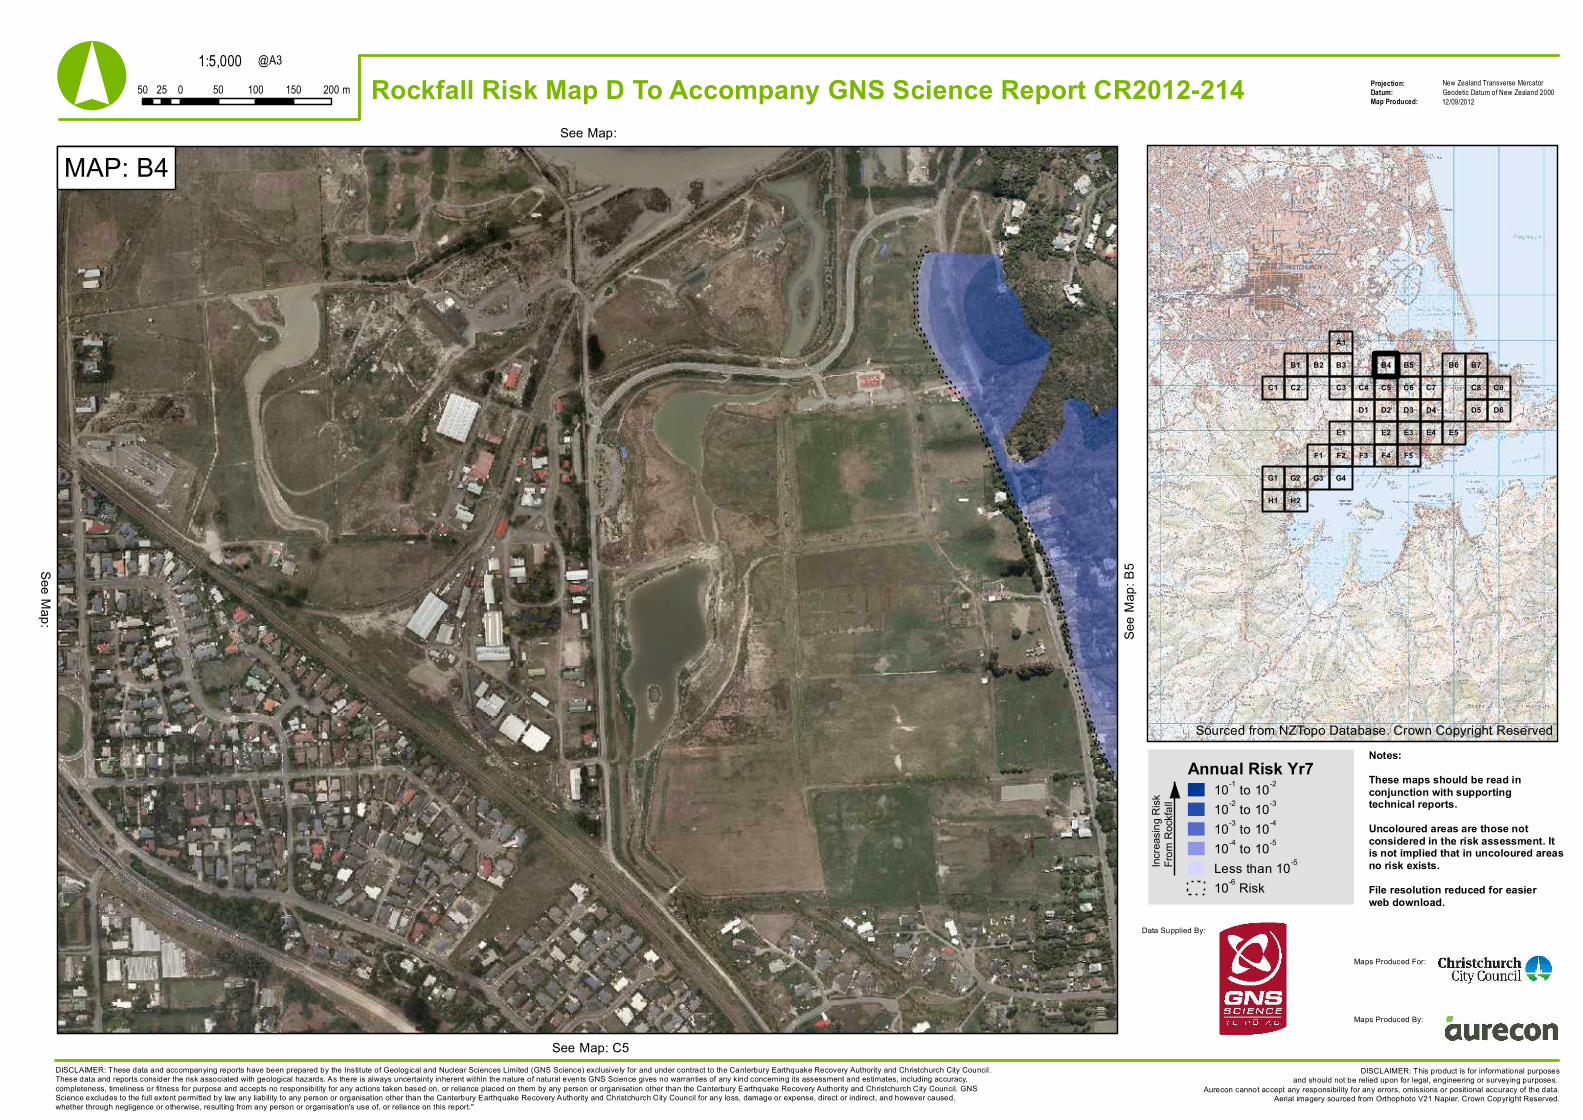
MAP: B4See Map:
See M
ap: B
5
See Map: C5
See Map:
Sourced from NZTopo Database. Crown Copyright Reserved
Annual Risk Yr710-1 to 10-2
10-2 to 10-3
10-3 to 10-4
10-4 to 10-5
Less than 10-5
10-6 Risk
Notes:These maps should be read inconjunction with supportingtechnical reports.Uncoloured areas are those notconsidered in the risk assessment. Itis not implied that in uncoloured areasno risk exists.File resolution reduced for easierweb download.
DISCLAIMER: These data and accompanying reports have been prepared by the Institute of Geological and Nuclear Sciences Limited (GNS Science) exclusively for and under contract to the Canterbury Earthquake Recovery Authority and Christchurch City Council.These data and reports consider the risk associated with geological hazards. As there is always uncertainty inherent within the nature of natural events GNS Science gives no warranties of any kind concerning its assessment and estimates, including accuracy,completeness, timeliness or fitness for purpose and accepts no responsibility for any actions taken based on, or reliance placed on them by any person or organisation other than the Canterbury Earthquake Recovery Authority and Christchurch City Council. GNSScience excludes to the full extent permitted by law any liability to any person or organisation other than the Canterbury Earthquake Recovery Authority and Christchurch City Council for any loss, damage or expense, direct or indirect, and however caused,whether through negligence or otherwise, resulting from any person or organisation's use of, or reliance on this report."
Increa
sing R
iskFro
m Ro
ckfal
l
Data Supplied By:
Maps Produced For:
Maps Produced By:
1:5,000Projection:Datum:Map Produced:
New Zealand Transverse MercatorGeodetic Datum of New Zealand 200050 0 50 100 150 20025 m
@A3
DISCLAIMER: This product is for informational purposesand should not be relied upon for legal, engineering or surveying purposes.
Aurecon cannot accept any responsibility for any errors, omissions or positional accuracy of the data.Aerial imagery sourced from Orthophoto V21 Napier. Crown Copyright Reserved.
° Rockfall Risk Map D To Accompany GNS Science Report CR2012-214 12/09/2012
F5F4F3F1 F2
E1 E5E4E3E2
B5 B6 B7
C4 C5 C6 C7 C8 C9
D1 D2 D3 D4 D5 D6
H1
B1
C2
H2
B4B2
C3C1
B3
A1
G1 G2 G3 G4
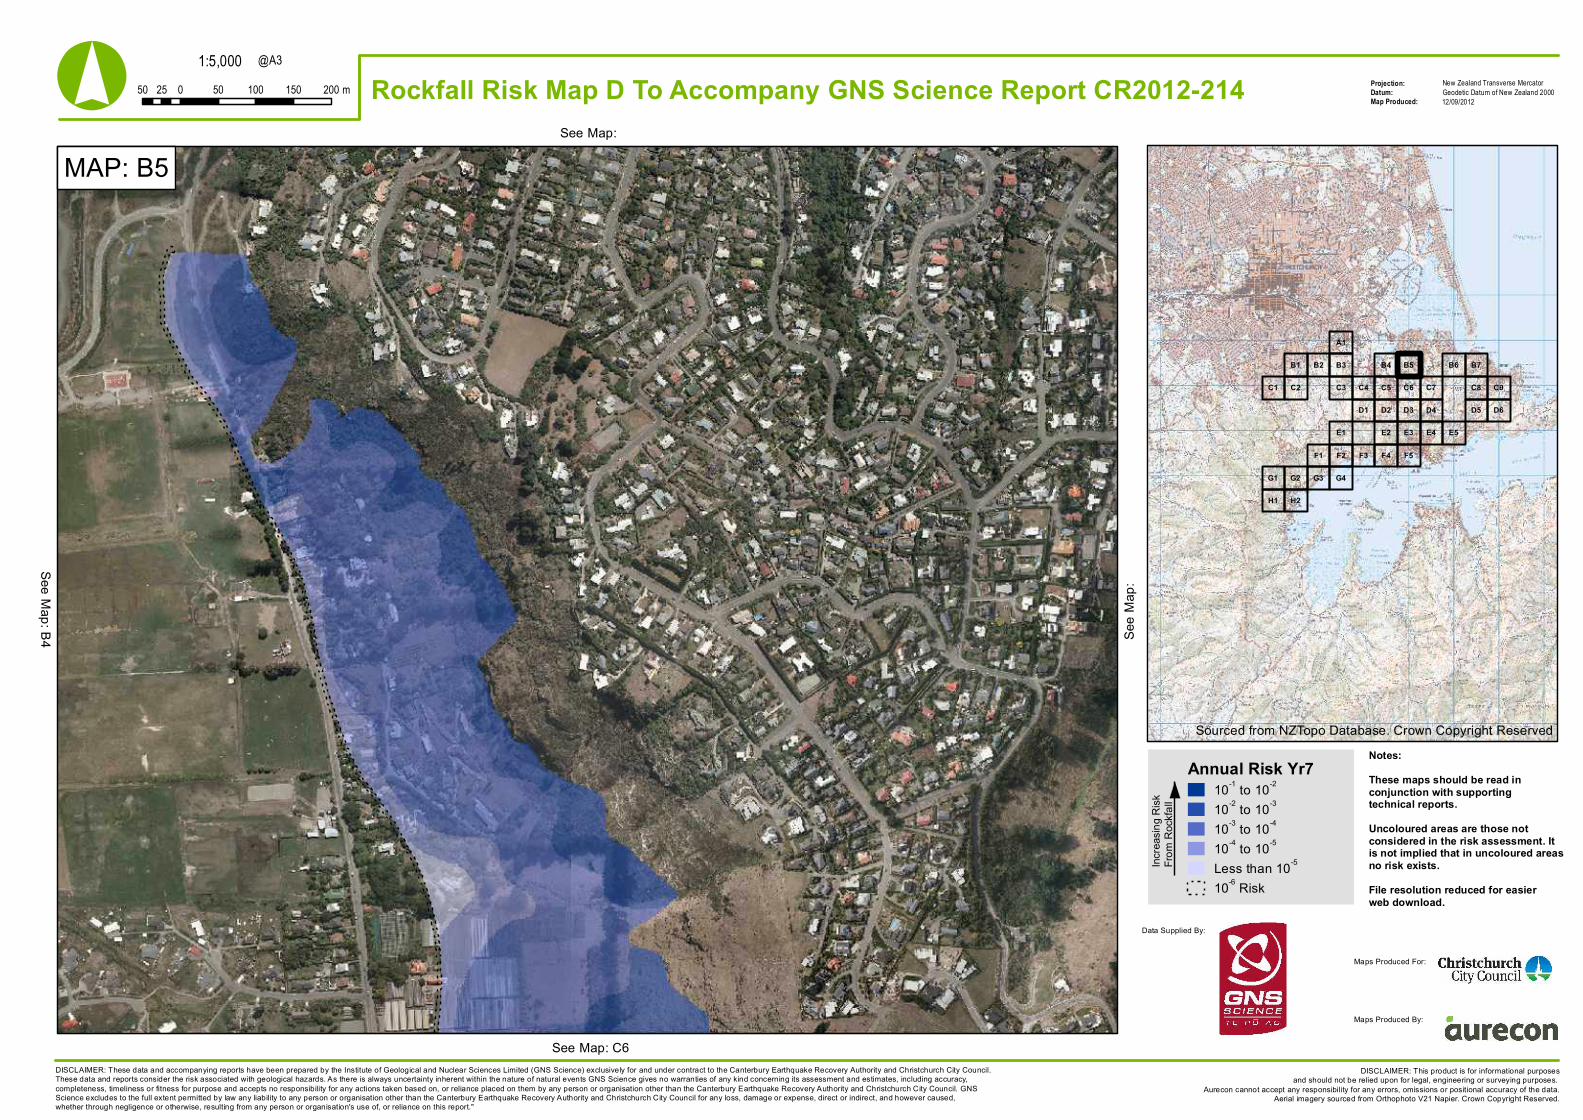
MAP: B5See Map:
See M
ap:
See Map: C6
See Map: B4
Sourced from NZTopo Database. Crown Copyright Reserved
Annual Risk Yr710-1 to 10-2
10-2 to 10-3
10-3 to 10-4
10-4 to 10-5
Less than 10-5
10-6 Risk
Notes:These maps should be read inconjunction with supportingtechnical reports.Uncoloured areas are those notconsidered in the risk assessment. Itis not implied that in uncoloured areasno risk exists.File resolution reduced for easierweb download.
DISCLAIMER: These data and accompanying reports have been prepared by the Institute of Geological and Nuclear Sciences Limited (GNS Science) exclusively for and under contract to the Canterbury Earthquake Recovery Authority and Christchurch City Council.These data and reports consider the risk associated with geological hazards. As there is always uncertainty inherent within the nature of natural events GNS Science gives no warranties of any kind concerning its assessment and estimates, including accuracy,completeness, timeliness or fitness for purpose and accepts no responsibility for any actions taken based on, or reliance placed on them by any person or organisation other than the Canterbury Earthquake Recovery Authority and Christchurch City Council. GNSScience excludes to the full extent permitted by law any liability to any person or organisation other than the Canterbury Earthquake Recovery Authority and Christchurch City Council for any loss, damage or expense, direct or indirect, and however caused,whether through negligence or otherwise, resulting from any person or organisation's use of, or reliance on this report."
Increa
sing R
iskFro
m Ro
ckfal
l
Data Supplied By:
Maps Produced For:
Maps Produced By:
1:5,000Projection:Datum:Map Produced:
New Zealand Transverse MercatorGeodetic Datum of New Zealand 200050 0 50 100 150 20025 m
@A3
DISCLAIMER: This product is for informational purposesand should not be relied upon for legal, engineering or surveying purposes.
Aurecon cannot accept any responsibility for any errors, omissions or positional accuracy of the data.Aerial imagery sourced from Orthophoto V21 Napier. Crown Copyright Reserved.
° Rockfall Risk Map D To Accompany GNS Science Report CR2012-214 12/09/2012
F5F4F3F1 F2
E1 E5E4E3E2
B5 B6 B7
C4 C5 C6 C7 C8 C9
D1 D2 D3 D4 D5 D6
H1
B1
C2
H2
B4B2
C3C1
B3
A1
G1 G2 G3 G4
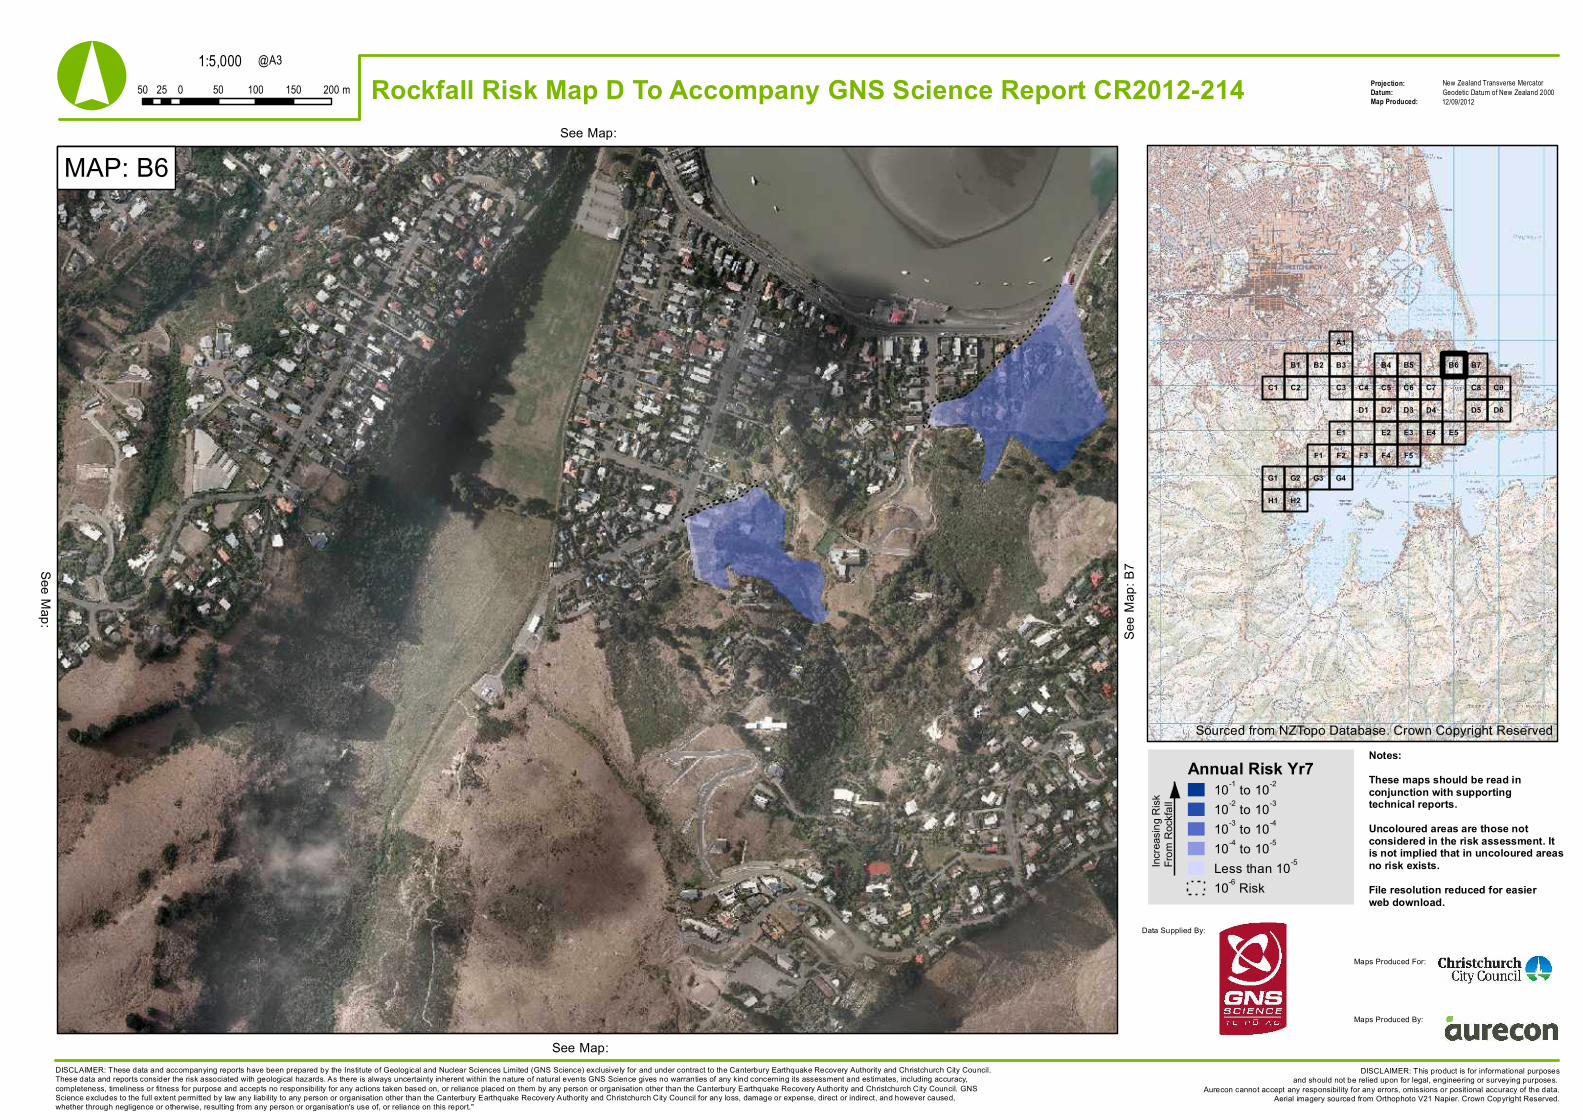
MAP: B6See Map:
See M
ap: B
7
See Map:
See Map:
Sourced from NZTopo Database. Crown Copyright Reserved
Annual Risk Yr710-1 to 10-2
10-2 to 10-3
10-3 to 10-4
10-4 to 10-5
Less than 10-5
10-6 Risk
Notes:These maps should be read inconjunction with supportingtechnical reports.Uncoloured areas are those notconsidered in the risk assessment. Itis not implied that in uncoloured areasno risk exists.File resolution reduced for easierweb download.
DISCLAIMER: These data and accompanying reports have been prepared by the Institute of Geological and Nuclear Sciences Limited (GNS Science) exclusively for and under contract to the Canterbury Earthquake Recovery Authority and Christchurch City Council.These data and reports consider the risk associated with geological hazards. As there is always uncertainty inherent within the nature of natural events GNS Science gives no warranties of any kind concerning its assessment and estimates, including accuracy,completeness, timeliness or fitness for purpose and accepts no responsibility for any actions taken based on, or reliance placed on them by any person or organisation other than the Canterbury Earthquake Recovery Authority and Christchurch City Council. GNSScience excludes to the full extent permitted by law any liability to any person or organisation other than the Canterbury Earthquake Recovery Authority and Christchurch City Council for any loss, damage or expense, direct or indirect, and however caused,whether through negligence or otherwise, resulting from any person or organisation's use of, or reliance on this report."
Increa
sing R
iskFro
m Ro
ckfal
l
Data Supplied By:
Maps Produced For:
Maps Produced By:
1:5,000Projection:Datum:Map Produced:
New Zealand Transverse MercatorGeodetic Datum of New Zealand 200050 0 50 100 150 20025 m
@A3
DISCLAIMER: This product is for informational purposesand should not be relied upon for legal, engineering or surveying purposes.
Aurecon cannot accept any responsibility for any errors, omissions or positional accuracy of the data.Aerial imagery sourced from Orthophoto V21 Napier. Crown Copyright Reserved.
° Rockfall Risk Map D To Accompany GNS Science Report CR2012-214 12/09/2012
F5F4F3F1 F2
E1 E5E4E3E2
B5 B6 B7
C4 C5 C6 C7 C8 C9
D1 D2 D3 D4 D5 D6
H1
B1
C2
H2
B4B2
C3C1
B3
A1
G1 G2 G3 G4
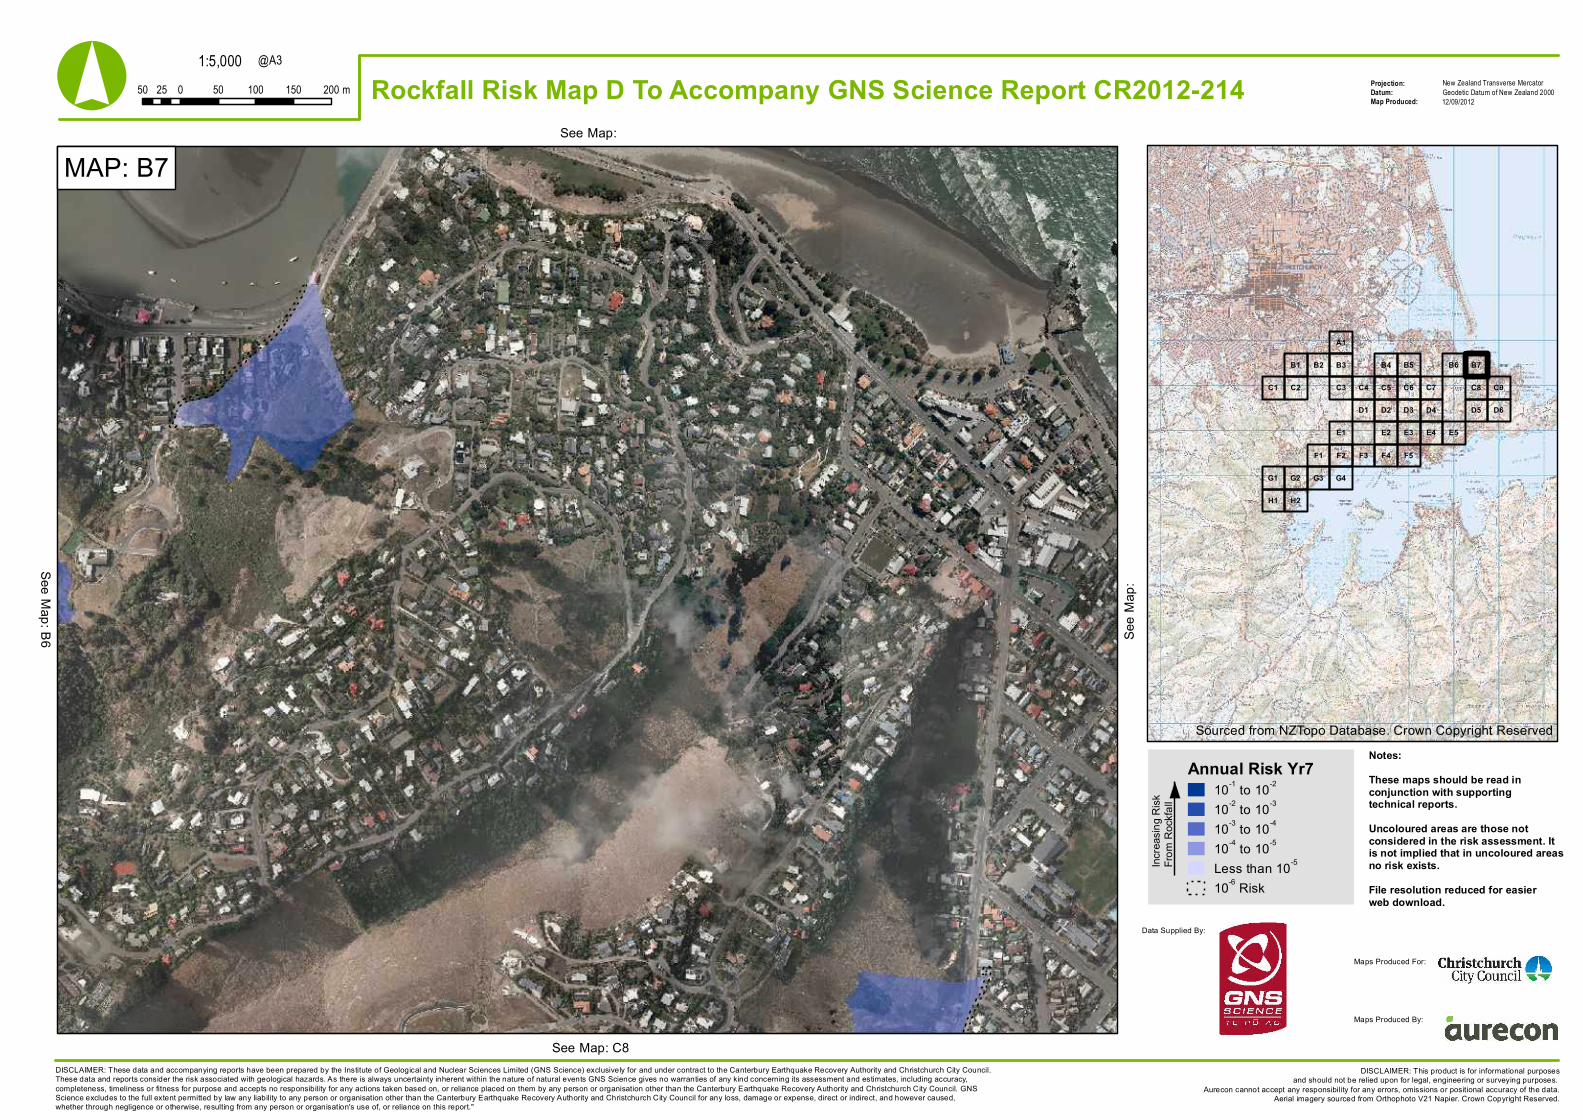
MAP: B7See Map:
See M
ap:
See Map: C8
See Map: B6
Sourced from NZTopo Database. Crown Copyright Reserved
Annual Risk Yr710-1 to 10-2
10-2 to 10-3
10-3 to 10-4
10-4 to 10-5
Less than 10-5
10-6 Risk
Notes:These maps should be read inconjunction with supportingtechnical reports.Uncoloured areas are those notconsidered in the risk assessment. Itis not implied that in uncoloured areasno risk exists.File resolution reduced for easierweb download.
DISCLAIMER: These data and accompanying reports have been prepared by the Institute of Geological and Nuclear Sciences Limited (GNS Science) exclusively for and under contract to the Canterbury Earthquake Recovery Authority and Christchurch City Council.These data and reports consider the risk associated with geological hazards. As there is always uncertainty inherent within the nature of natural events GNS Science gives no warranties of any kind concerning its assessment and estimates, including accuracy,completeness, timeliness or fitness for purpose and accepts no responsibility for any actions taken based on, or reliance placed on them by any person or organisation other than the Canterbury Earthquake Recovery Authority and Christchurch City Council. GNSScience excludes to the full extent permitted by law any liability to any person or organisation other than the Canterbury Earthquake Recovery Authority and Christchurch City Council for any loss, damage or expense, direct or indirect, and however caused,whether through negligence or otherwise, resulting from any person or organisation's use of, or reliance on this report."
Increa
sing R
iskFro
m Ro
ckfal
l
Data Supplied By:
Maps Produced For:
Maps Produced By:
1:5,000Projection:Datum:Map Produced:
New Zealand Transverse MercatorGeodetic Datum of New Zealand 200050 0 50 100 150 20025 m
@A3
DISCLAIMER: This product is for informational purposesand should not be relied upon for legal, engineering or surveying purposes.
Aurecon cannot accept any responsibility for any errors, omissions or positional accuracy of the data.Aerial imagery sourced from Orthophoto V21 Napier. Crown Copyright Reserved.
° Rockfall Risk Map D To Accompany GNS Science Report CR2012-214 12/09/2012
F5F4F3F1 F2
E1 E5E4E3E2
B5 B6 B7
C4 C5 C6 C7 C8 C9
D1 D2 D3 D4 D5 D6
H1
B1
C2
H2
B4B2
C3C1
B3
A1
G1 G2 G3 G4
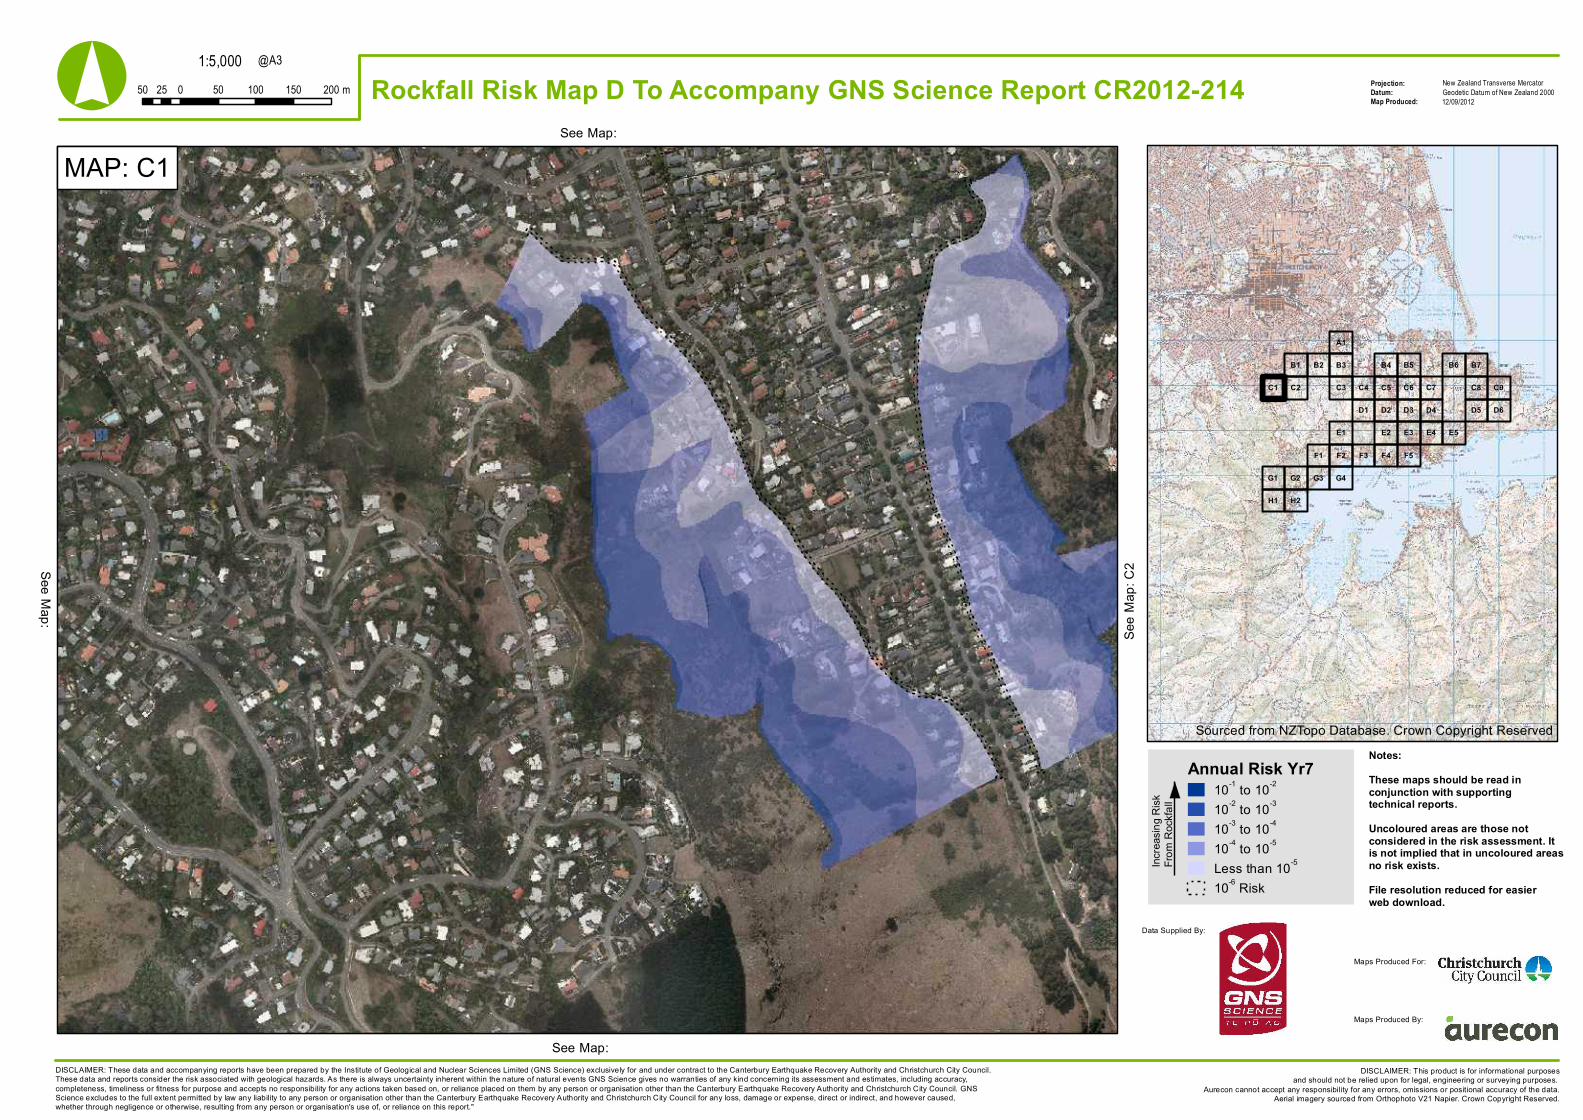
MAP: C1See Map:
See M
ap: C
2
See Map:
See Map:
Sourced from NZTopo Database. Crown Copyright Reserved
Annual Risk Yr710-1 to 10-2
10-2 to 10-3
10-3 to 10-4
10-4 to 10-5
Less than 10-5
10-6 Risk
Notes:These maps should be read inconjunction with supportingtechnical reports.Uncoloured areas are those notconsidered in the risk assessment. Itis not implied that in uncoloured areasno risk exists.File resolution reduced for easierweb download.
DISCLAIMER: These data and accompanying reports have been prepared by the Institute of Geological and Nuclear Sciences Limited (GNS Science) exclusively for and under contract to the Canterbury Earthquake Recovery Authority and Christchurch City Council.These data and reports consider the risk associated with geological hazards. As there is always uncertainty inherent within the nature of natural events GNS Science gives no warranties of any kind concerning its assessment and estimates, including accuracy,completeness, timeliness or fitness for purpose and accepts no responsibility for any actions taken based on, or reliance placed on them by any person or organisation other than the Canterbury Earthquake Recovery Authority and Christchurch City Council. GNSScience excludes to the full extent permitted by law any liability to any person or organisation other than the Canterbury Earthquake Recovery Authority and Christchurch City Council for any loss, damage or expense, direct or indirect, and however caused,whether through negligence or otherwise, resulting from any person or organisation's use of, or reliance on this report."
Increa
sing R
iskFro
m Ro
ckfal
l
Data Supplied By:
Maps Produced For:
Maps Produced By:
1:5,000Projection:Datum:Map Produced:
New Zealand Transverse MercatorGeodetic Datum of New Zealand 200050 0 50 100 150 20025 m
@A3
DISCLAIMER: This product is for informational purposesand should not be relied upon for legal, engineering or surveying purposes.
Aurecon cannot accept any responsibility for any errors, omissions or positional accuracy of the data.Aerial imagery sourced from Orthophoto V21 Napier. Crown Copyright Reserved.
° Rockfall Risk Map D To Accompany GNS Science Report CR2012-214 12/09/2012
F5F4F3F1 F2
E1 E5E4E3E2
B5 B6 B7
C4 C5 C6 C7 C8 C9
D1 D2 D3 D4 D5 D6
H1
B1
C2
H2
B4B2
C3C1
B3
A1
G1 G2 G3 G4
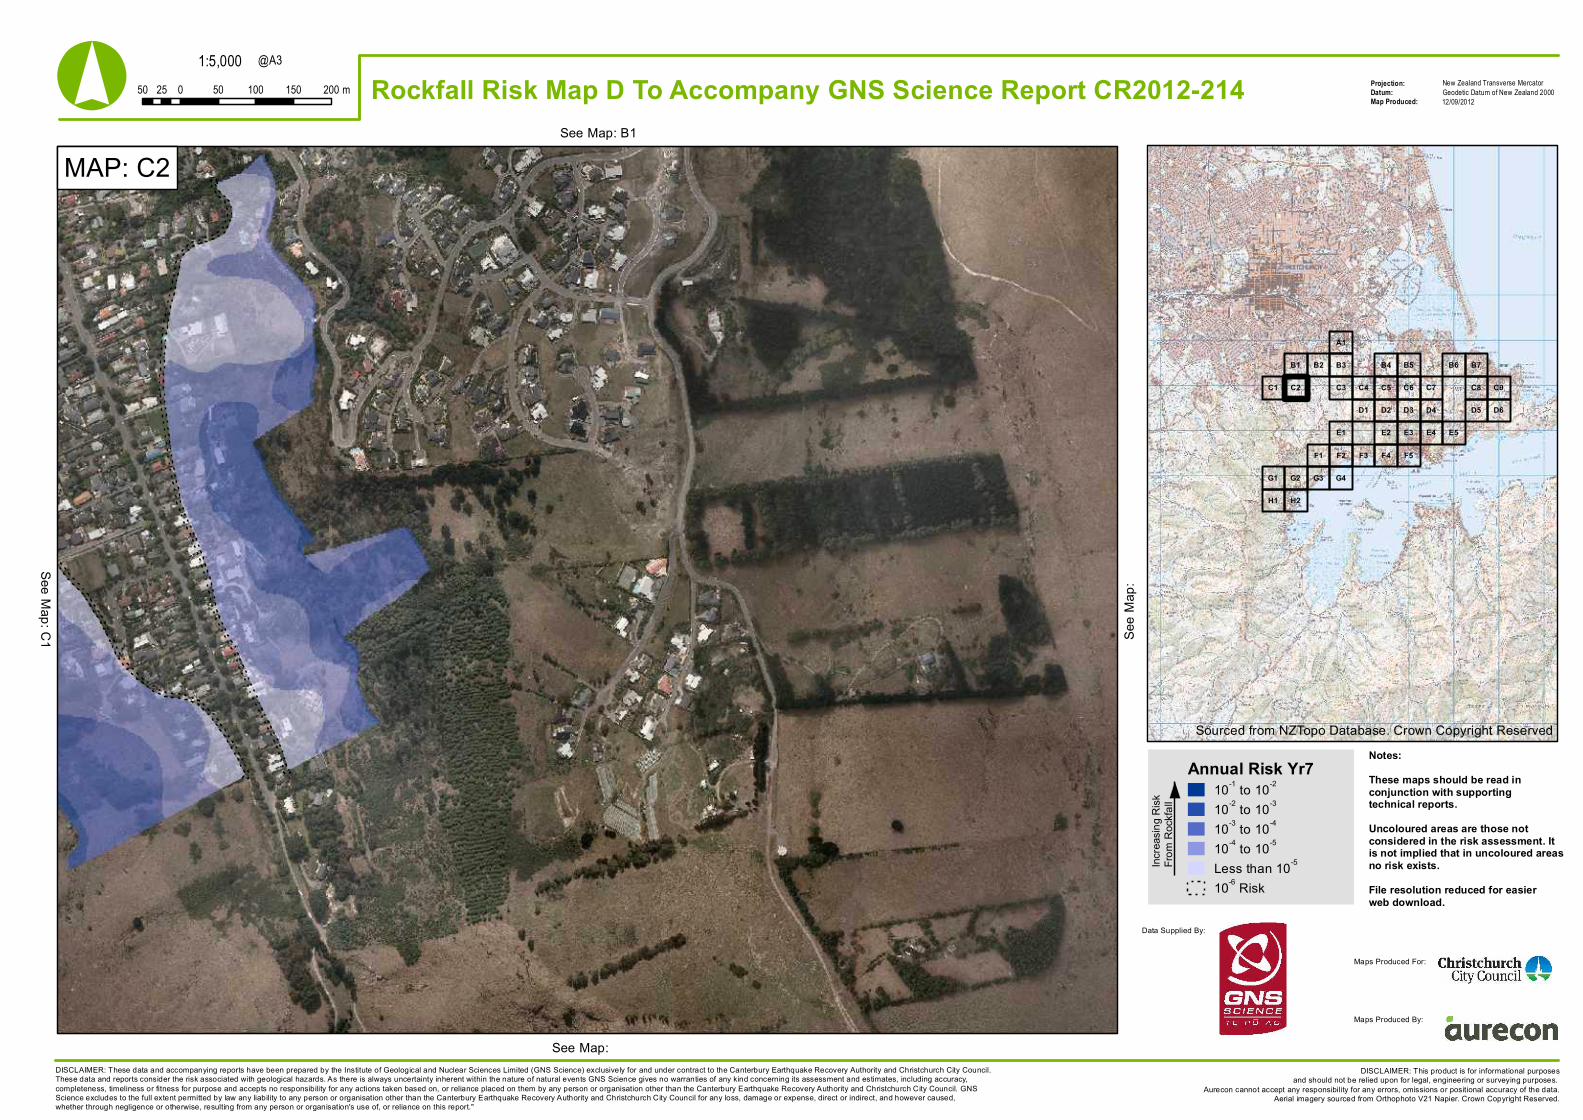
MAP: C2See Map: B1
See M
ap:
See Map:
See Map: C1
Sourced from NZTopo Database. Crown Copyright Reserved
Annual Risk Yr710-1 to 10-2
10-2 to 10-3
10-3 to 10-4
10-4 to 10-5
Less than 10-5
10-6 Risk
Notes:These maps should be read inconjunction with supportingtechnical reports.Uncoloured areas are those notconsidered in the risk assessment. Itis not implied that in uncoloured areasno risk exists.File resolution reduced for easierweb download.
DISCLAIMER: These data and accompanying reports have been prepared by the Institute of Geological and Nuclear Sciences Limited (GNS Science) exclusively for and under contract to the Canterbury Earthquake Recovery Authority and Christchurch City Council.These data and reports consider the risk associated with geological hazards. As there is always uncertainty inherent within the nature of natural events GNS Science gives no warranties of any kind concerning its assessment and estimates, including accuracy,completeness, timeliness or fitness for purpose and accepts no responsibility for any actions taken based on, or reliance placed on them by any person or organisation other than the Canterbury Earthquake Recovery Authority and Christchurch City Council. GNSScience excludes to the full extent permitted by law any liability to any person or organisation other than the Canterbury Earthquake Recovery Authority and Christchurch City Council for any loss, damage or expense, direct or indirect, and however caused,whether through negligence or otherwise, resulting from any person or organisation's use of, or reliance on this report."
Increa
sing R
iskFro
m Ro
ckfal
l
Data Supplied By:
Maps Produced For:
Maps Produced By:
1:5,000Projection:Datum:Map Produced:
New Zealand Transverse MercatorGeodetic Datum of New Zealand 200050 0 50 100 150 20025 m
@A3
DISCLAIMER: This product is for informational purposesand should not be relied upon for legal, engineering or surveying purposes.
Aurecon cannot accept any responsibility for any errors, omissions or positional accuracy of the data.Aerial imagery sourced from Orthophoto V21 Napier. Crown Copyright Reserved.
° Rockfall Risk Map D To Accompany GNS Science Report CR2012-214 12/09/2012
F5F4F3F1 F2
E1 E5E4E3E2
B5 B6 B7
C4 C5 C6 C7 C8 C9
D1 D2 D3 D4 D5 D6
H1
B1
C2
H2
B4B2
C3C1
B3
A1
G1 G2 G3 G4
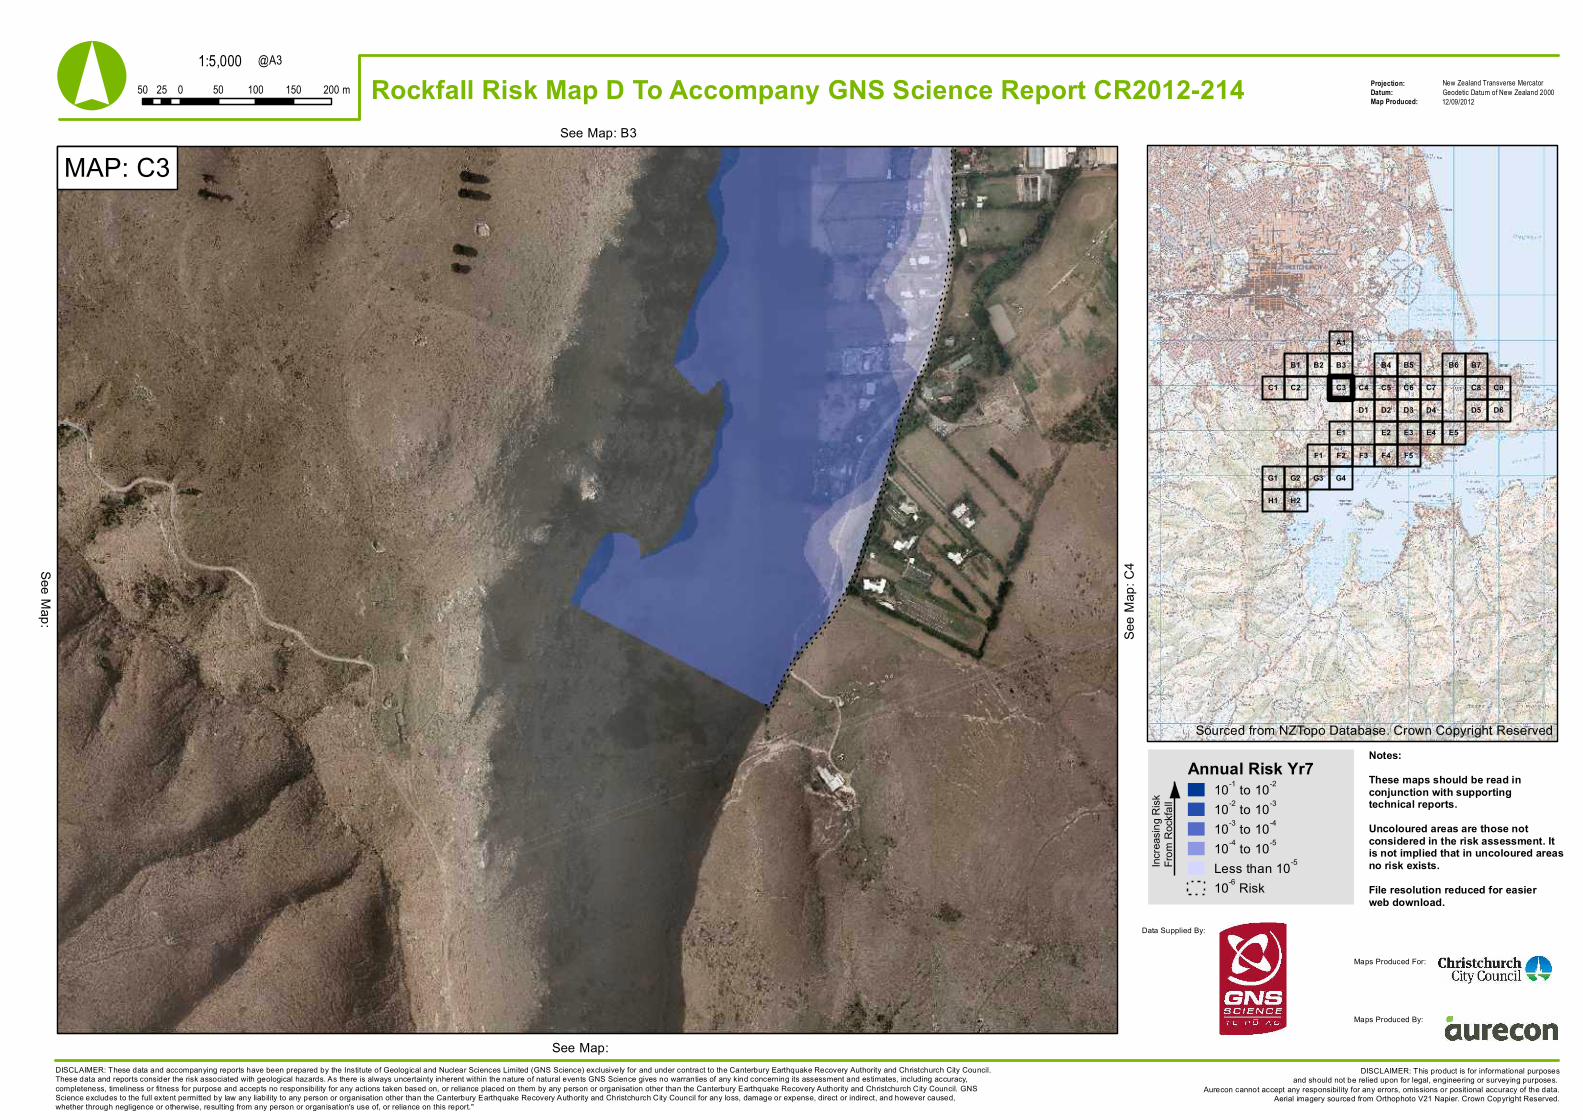
MAP: C3See Map: B3
See M
ap: C
4
See Map:
See Map:
Sourced from NZTopo Database. Crown Copyright Reserved
Annual Risk Yr710-1 to 10-2
10-2 to 10-3
10-3 to 10-4
10-4 to 10-5
Less than 10-5
10-6 Risk
Notes:These maps should be read inconjunction with supportingtechnical reports.Uncoloured areas are those notconsidered in the risk assessment. Itis not implied that in uncoloured areasno risk exists.File resolution reduced for easierweb download.
DISCLAIMER: These data and accompanying reports have been prepared by the Institute of Geological and Nuclear Sciences Limited (GNS Science) exclusively for and under contract to the Canterbury Earthquake Recovery Authority and Christchurch City Council.These data and reports consider the risk associated with geological hazards. As there is always uncertainty inherent within the nature of natural events GNS Science gives no warranties of any kind concerning its assessment and estimates, including accuracy,completeness, timeliness or fitness for purpose and accepts no responsibility for any actions taken based on, or reliance placed on them by any person or organisation other than the Canterbury Earthquake Recovery Authority and Christchurch City Council. GNSScience excludes to the full extent permitted by law any liability to any person or organisation other than the Canterbury Earthquake Recovery Authority and Christchurch City Council for any loss, damage or expense, direct or indirect, and however caused,whether through negligence or otherwise, resulting from any person or organisation's use of, or reliance on this report."
Increa
sing R
iskFro
m Ro
ckfal
l
Data Supplied By:
Maps Produced For:
Maps Produced By:
1:5,000Projection:Datum:Map Produced:
New Zealand Transverse MercatorGeodetic Datum of New Zealand 200050 0 50 100 150 20025 m
@A3
DISCLAIMER: This product is for informational purposesand should not be relied upon for legal, engineering or surveying purposes.
Aurecon cannot accept any responsibility for any errors, omissions or positional accuracy of the data.Aerial imagery sourced from Orthophoto V21 Napier. Crown Copyright Reserved.
° Rockfall Risk Map D To Accompany GNS Science Report CR2012-214 12/09/2012
F5F4F3F1 F2
E1 E5E4E3E2
B5 B6 B7
C4 C5 C6 C7 C8 C9
D1 D2 D3 D4 D5 D6
H1
B1
C2
H2
B4B2
C3C1
B3
A1
G1 G2 G3 G4
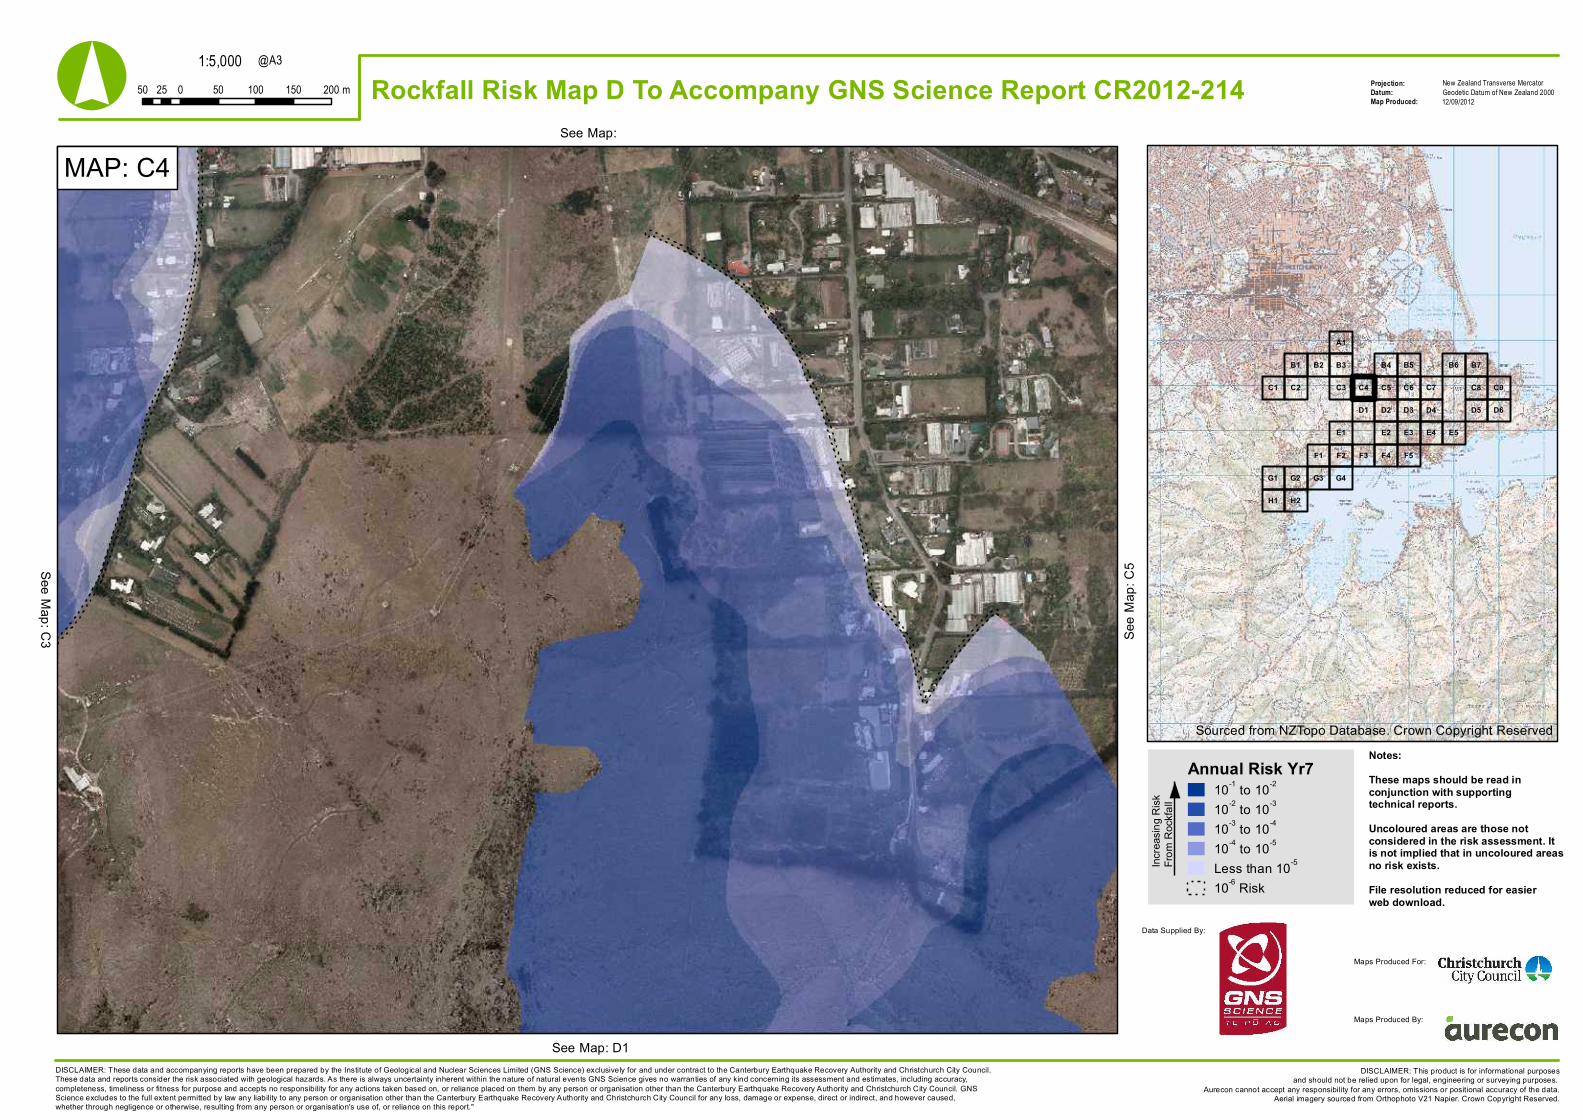
MAP: C4See Map:
See M
ap: C
5
See Map: D1
See Map: C3
Sourced from NZTopo Database. Crown Copyright Reserved
Annual Risk Yr710-1 to 10-2
10-2 to 10-3
10-3 to 10-4
10-4 to 10-5
Less than 10-5
10-6 Risk
Notes:These maps should be read inconjunction with supportingtechnical reports.Uncoloured areas are those notconsidered in the risk assessment. Itis not implied that in uncoloured areasno risk exists.File resolution reduced for easierweb download.
DISCLAIMER: These data and accompanying reports have been prepared by the Institute of Geological and Nuclear Sciences Limited (GNS Science) exclusively for and under contract to the Canterbury Earthquake Recovery Authority and Christchurch City Council.These data and reports consider the risk associated with geological hazards. As there is always uncertainty inherent within the nature of natural events GNS Science gives no warranties of any kind concerning its assessment and estimates, including accuracy,completeness, timeliness or fitness for purpose and accepts no responsibility for any actions taken based on, or reliance placed on them by any person or organisation other than the Canterbury Earthquake Recovery Authority and Christchurch City Council. GNSScience excludes to the full extent permitted by law any liability to any person or organisation other than the Canterbury Earthquake Recovery Authority and Christchurch City Council for any loss, damage or expense, direct or indirect, and however caused,whether through negligence or otherwise, resulting from any person or organisation's use of, or reliance on this report."
Increa
sing R
iskFro
m Ro
ckfal
l
Data Supplied By:
Maps Produced For:
Maps Produced By:
1:5,000Projection:Datum:Map Produced:
New Zealand Transverse MercatorGeodetic Datum of New Zealand 200050 0 50 100 150 20025 m
@A3
DISCLAIMER: This product is for informational purposesand should not be relied upon for legal, engineering or surveying purposes.
Aurecon cannot accept any responsibility for any errors, omissions or positional accuracy of the data.Aerial imagery sourced from Orthophoto V21 Napier. Crown Copyright Reserved.
° Rockfall Risk Map D To Accompany GNS Science Report CR2012-214 12/09/2012
F5F4F3F1 F2
E1 E5E4E3E2
B5 B6 B7
C4 C5 C6 C7 C8 C9
D1 D2 D3 D4 D5 D6
H1
B1
C2
H2
B4B2
C3C1
B3
A1
G1 G2 G3 G4
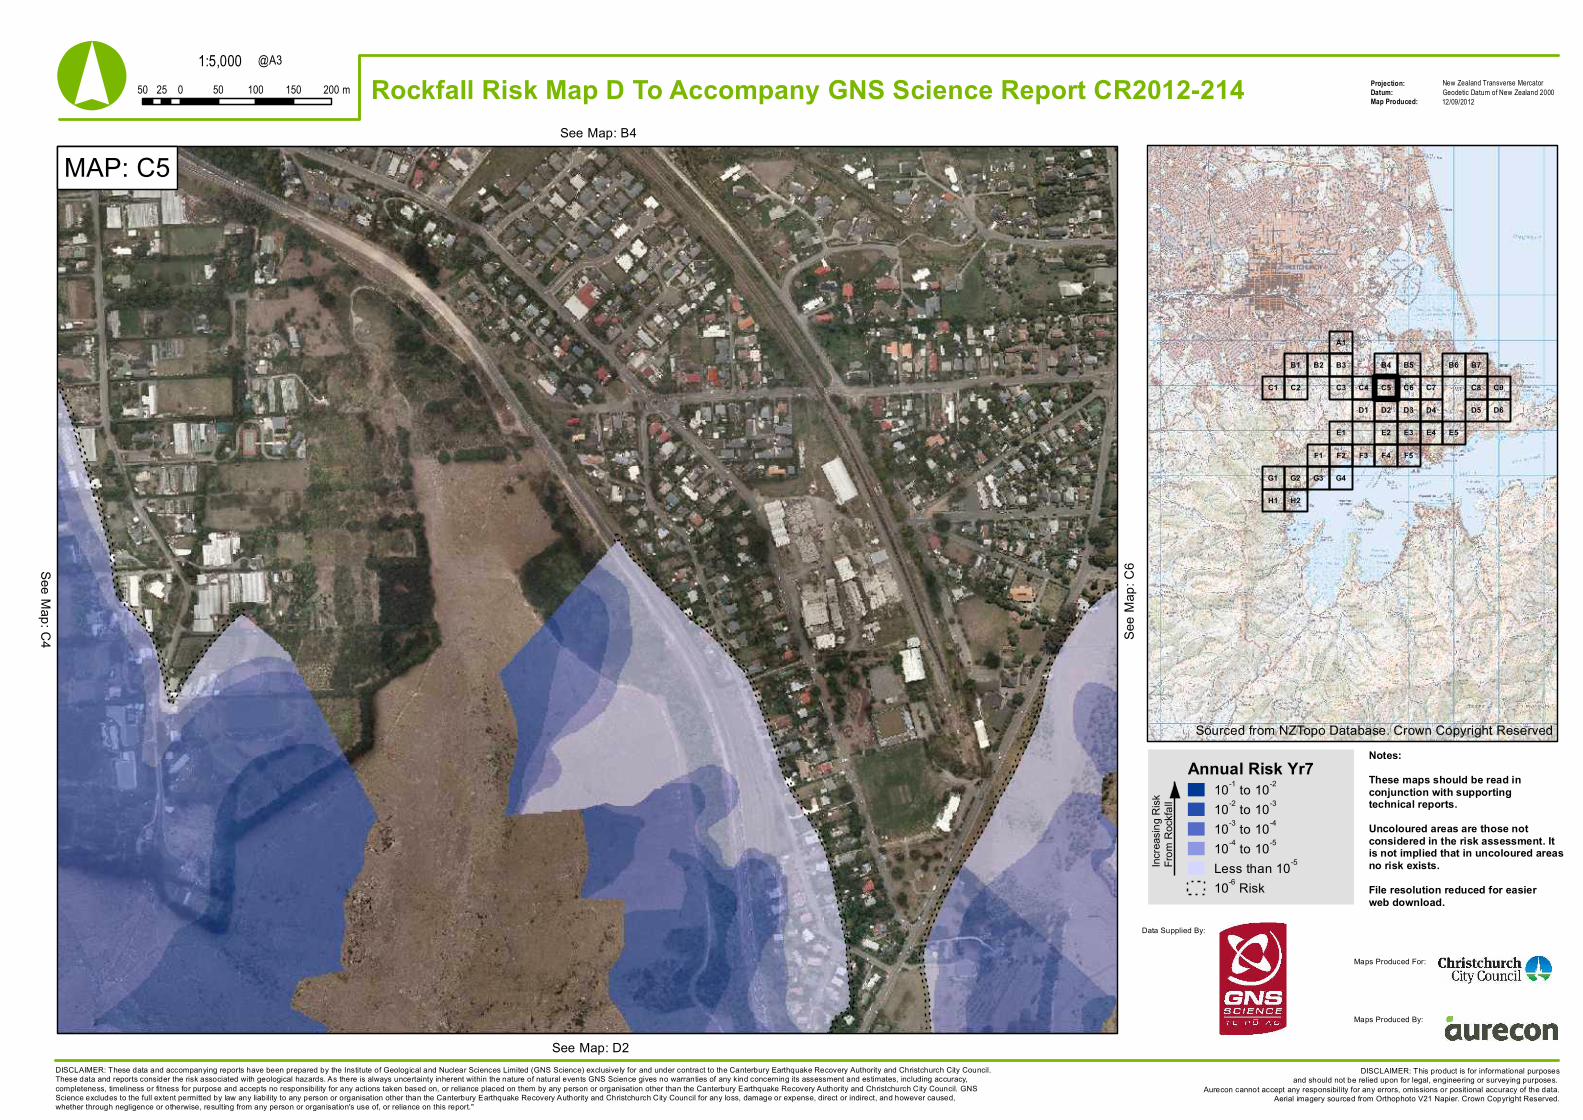
MAP: C5See Map: B4
See M
ap: C
6
See Map: D2
See Map: C4
Sourced from NZTopo Database. Crown Copyright Reserved
Annual Risk Yr710-1 to 10-2
10-2 to 10-3
10-3 to 10-4
10-4 to 10-5
Less than 10-5
10-6 Risk
Notes:These maps should be read inconjunction with supportingtechnical reports.Uncoloured areas are those notconsidered in the risk assessment. Itis not implied that in uncoloured areasno risk exists.File resolution reduced for easierweb download.
DISCLAIMER: These data and accompanying reports have been prepared by the Institute of Geological and Nuclear Sciences Limited (GNS Science) exclusively for and under contract to the Canterbury Earthquake Recovery Authority and Christchurch City Council.These data and reports consider the risk associated with geological hazards. As there is always uncertainty inherent within the nature of natural events GNS Science gives no warranties of any kind concerning its assessment and estimates, including accuracy,completeness, timeliness or fitness for purpose and accepts no responsibility for any actions taken based on, or reliance placed on them by any person or organisation other than the Canterbury Earthquake Recovery Authority and Christchurch City Council. GNSScience excludes to the full extent permitted by law any liability to any person or organisation other than the Canterbury Earthquake Recovery Authority and Christchurch City Council for any loss, damage or expense, direct or indirect, and however caused,whether through negligence or otherwise, resulting from any person or organisation's use of, or reliance on this report."
Increa
sing R
iskFro
m Ro
ckfal
l
Data Supplied By:
Maps Produced For:
Maps Produced By:
1:5,000Projection:Datum:Map Produced:
New Zealand Transverse MercatorGeodetic Datum of New Zealand 200050 0 50 100 150 20025 m
@A3
DISCLAIMER: This product is for informational purposesand should not be relied upon for legal, engineering or surveying purposes.
Aurecon cannot accept any responsibility for any errors, omissions or positional accuracy of the data.Aerial imagery sourced from Orthophoto V21 Napier. Crown Copyright Reserved.
° Rockfall Risk Map D To Accompany GNS Science Report CR2012-214 12/09/2012
F5F4F3F1 F2
E1 E5E4E3E2
B5 B6 B7
C4 C5 C6 C7 C8 C9
D1 D2 D3 D4 D5 D6
H1
B1
C2
H2
B4B2
C3C1
B3
A1
G1 G2 G3 G4
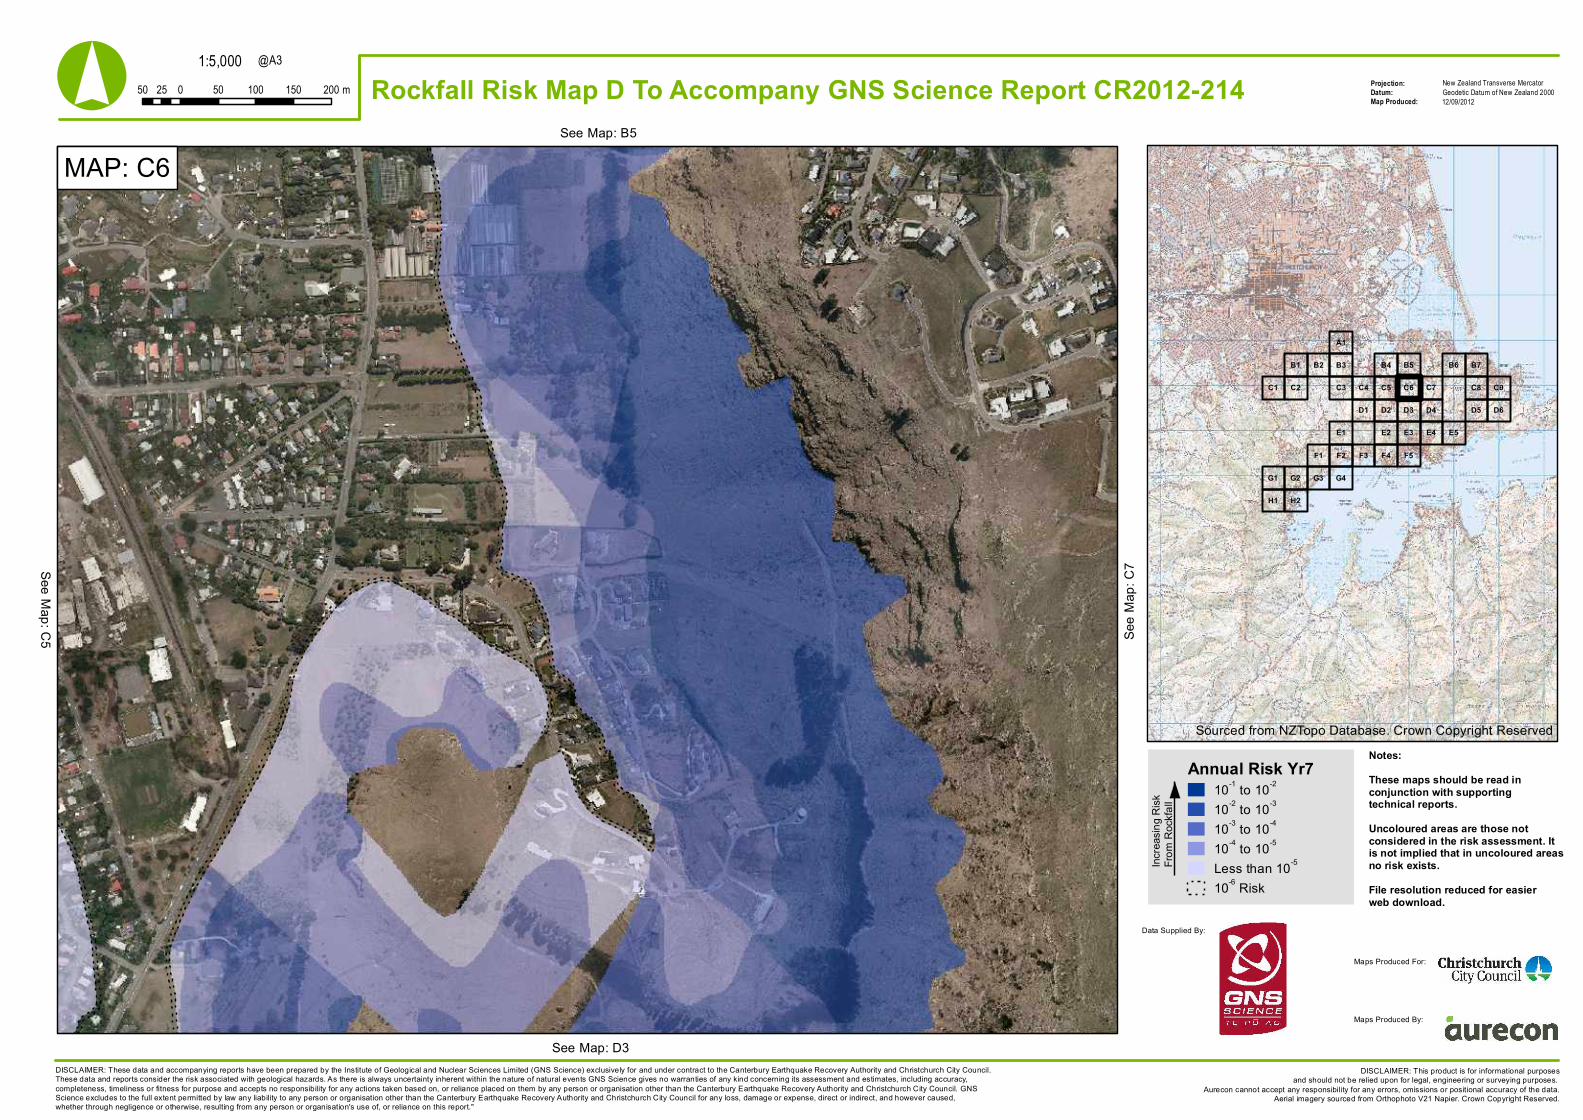
MAP: C6See Map: B5
See M
ap: C
7
See Map: D3
See Map: C5
Sourced from NZTopo Database. Crown Copyright Reserved
Annual Risk Yr710-1 to 10-2
10-2 to 10-3
10-3 to 10-4
10-4 to 10-5
Less than 10-5
10-6 Risk
Notes:These maps should be read inconjunction with supportingtechnical reports.Uncoloured areas are those notconsidered in the risk assessment. Itis not implied that in uncoloured areasno risk exists.File resolution reduced for easierweb download.
DISCLAIMER: These data and accompanying reports have been prepared by the Institute of Geological and Nuclear Sciences Limited (GNS Science) exclusively for and under contract to the Canterbury Earthquake Recovery Authority and Christchurch City Council.These data and reports consider the risk associated with geological hazards. As there is always uncertainty inherent within the nature of natural events GNS Science gives no warranties of any kind concerning its assessment and estimates, including accuracy,completeness, timeliness or fitness for purpose and accepts no responsibility for any actions taken based on, or reliance placed on them by any person or organisation other than the Canterbury Earthquake Recovery Authority and Christchurch City Council. GNSScience excludes to the full extent permitted by law any liability to any person or organisation other than the Canterbury Earthquake Recovery Authority and Christchurch City Council for any loss, damage or expense, direct or indirect, and however caused,whether through negligence or otherwise, resulting from any person or organisation's use of, or reliance on this report."
Increa
sing R
iskFro
m Ro
ckfal
l
Data Supplied By:
Maps Produced For:
Maps Produced By:
1:5,000Projection:Datum:Map Produced:
New Zealand Transverse MercatorGeodetic Datum of New Zealand 200050 0 50 100 150 20025 m
@A3
DISCLAIMER: This product is for informational purposesand should not be relied upon for legal, engineering or surveying purposes.
Aurecon cannot accept any responsibility for any errors, omissions or positional accuracy of the data.Aerial imagery sourced from Orthophoto V21 Napier. Crown Copyright Reserved.
° Rockfall Risk Map D To Accompany GNS Science Report CR2012-214 12/09/2012
F5F4F3F1 F2
E1 E5E4E3E2
B5 B6 B7
C4 C5 C6 C7 C8 C9
D1 D2 D3 D4 D5 D6
H1
B1
C2
H2
B4B2
C3C1
B3
A1
G1 G2 G3 G4
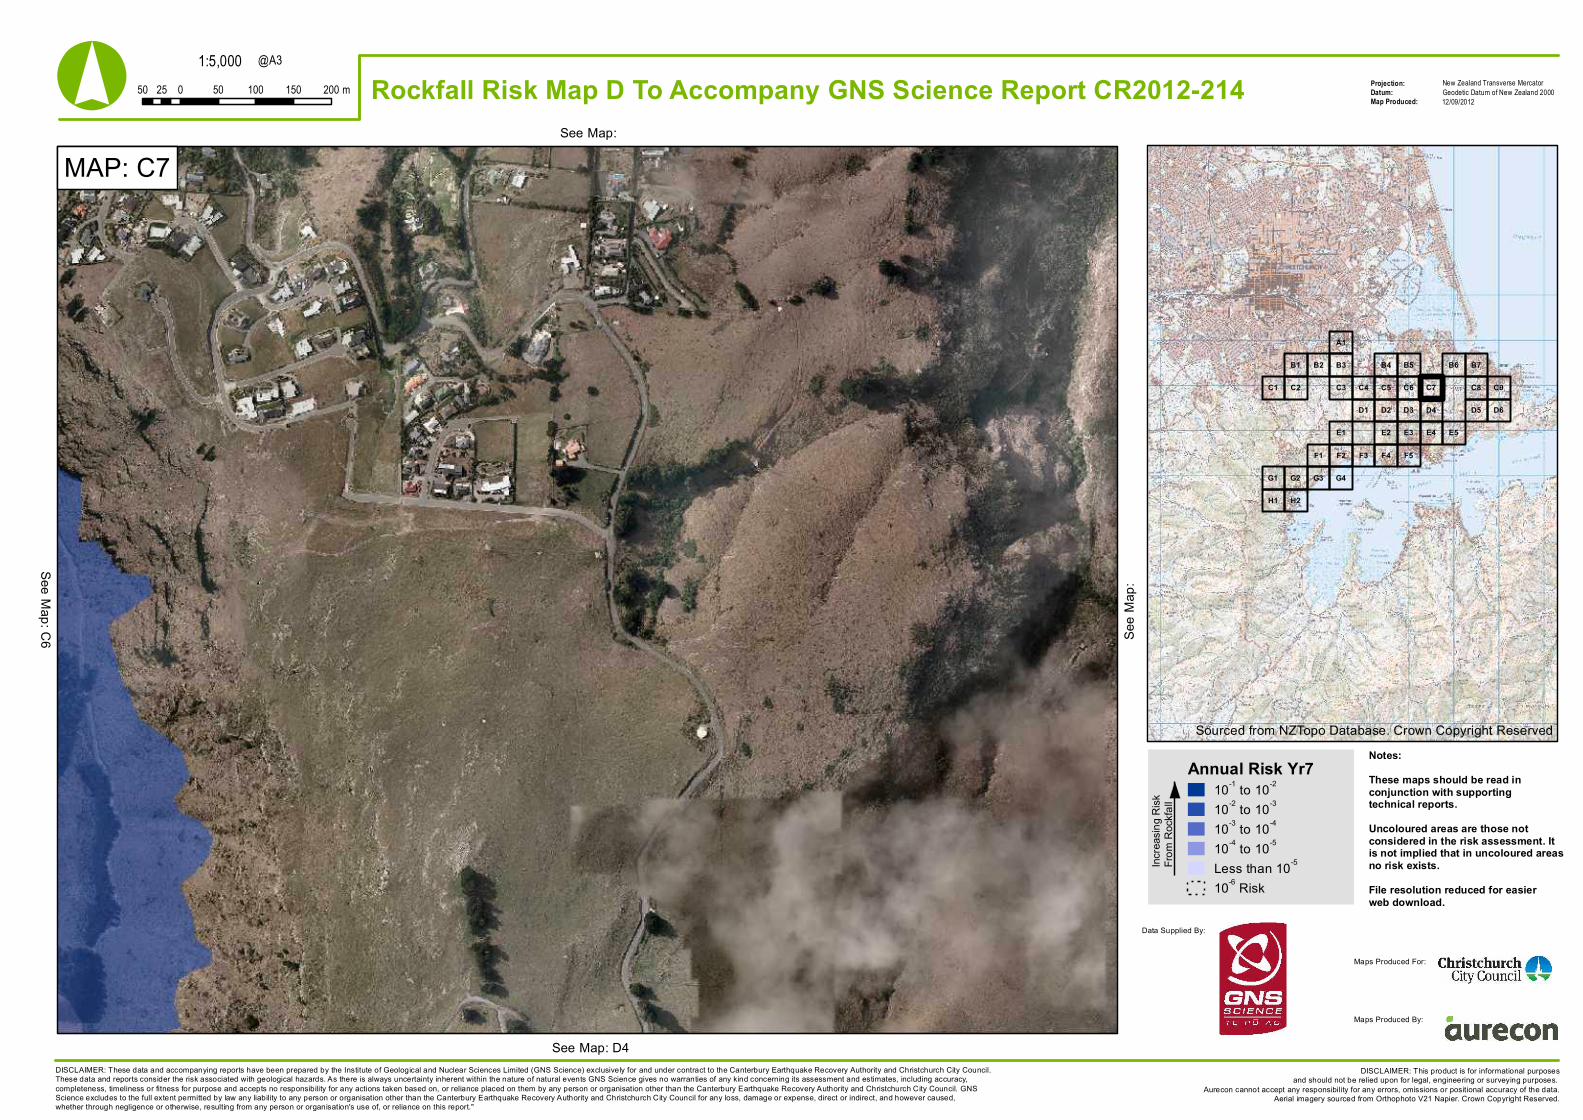
MAP: C7See Map:
See M
ap:
See Map: D4
See Map: C6
Sourced from NZTopo Database. Crown Copyright Reserved
Annual Risk Yr710-1 to 10-2
10-2 to 10-3
10-3 to 10-4
10-4 to 10-5
Less than 10-5
10-6 Risk
Notes:These maps should be read inconjunction with supportingtechnical reports.Uncoloured areas are those notconsidered in the risk assessment. Itis not implied that in uncoloured areasno risk exists.File resolution reduced for easierweb download.
DISCLAIMER: These data and accompanying reports have been prepared by the Institute of Geological and Nuclear Sciences Limited (GNS Science) exclusively for and under contract to the Canterbury Earthquake Recovery Authority and Christchurch City Council.These data and reports consider the risk associated with geological hazards. As there is always uncertainty inherent within the nature of natural events GNS Science gives no warranties of any kind concerning its assessment and estimates, including accuracy,completeness, timeliness or fitness for purpose and accepts no responsibility for any actions taken based on, or reliance placed on them by any person or organisation other than the Canterbury Earthquake Recovery Authority and Christchurch City Council. GNSScience excludes to the full extent permitted by law any liability to any person or organisation other than the Canterbury Earthquake Recovery Authority and Christchurch City Council for any loss, damage or expense, direct or indirect, and however caused,whether through negligence or otherwise, resulting from any person or organisation's use of, or reliance on this report."
Increa
sing R
iskFro
m Ro
ckfal
l
Data Supplied By:
Maps Produced For:
Maps Produced By:
1:5,000Projection:Datum:Map Produced:
New Zealand Transverse MercatorGeodetic Datum of New Zealand 200050 0 50 100 150 20025 m
@A3
DISCLAIMER: This product is for informational purposesand should not be relied upon for legal, engineering or surveying purposes.
Aurecon cannot accept any responsibility for any errors, omissions or positional accuracy of the data.Aerial imagery sourced from Orthophoto V21 Napier. Crown Copyright Reserved.
° Rockfall Risk Map D To Accompany GNS Science Report CR2012-214 12/09/2012
F5F4F3F1 F2
E1 E5E4E3E2
B5 B6 B7
C4 C5 C6 C7 C8 C9
D1 D2 D3 D4 D5 D6
H1
B1
C2
H2
B4B2
C3C1
B3
A1
G1 G2 G3 G4
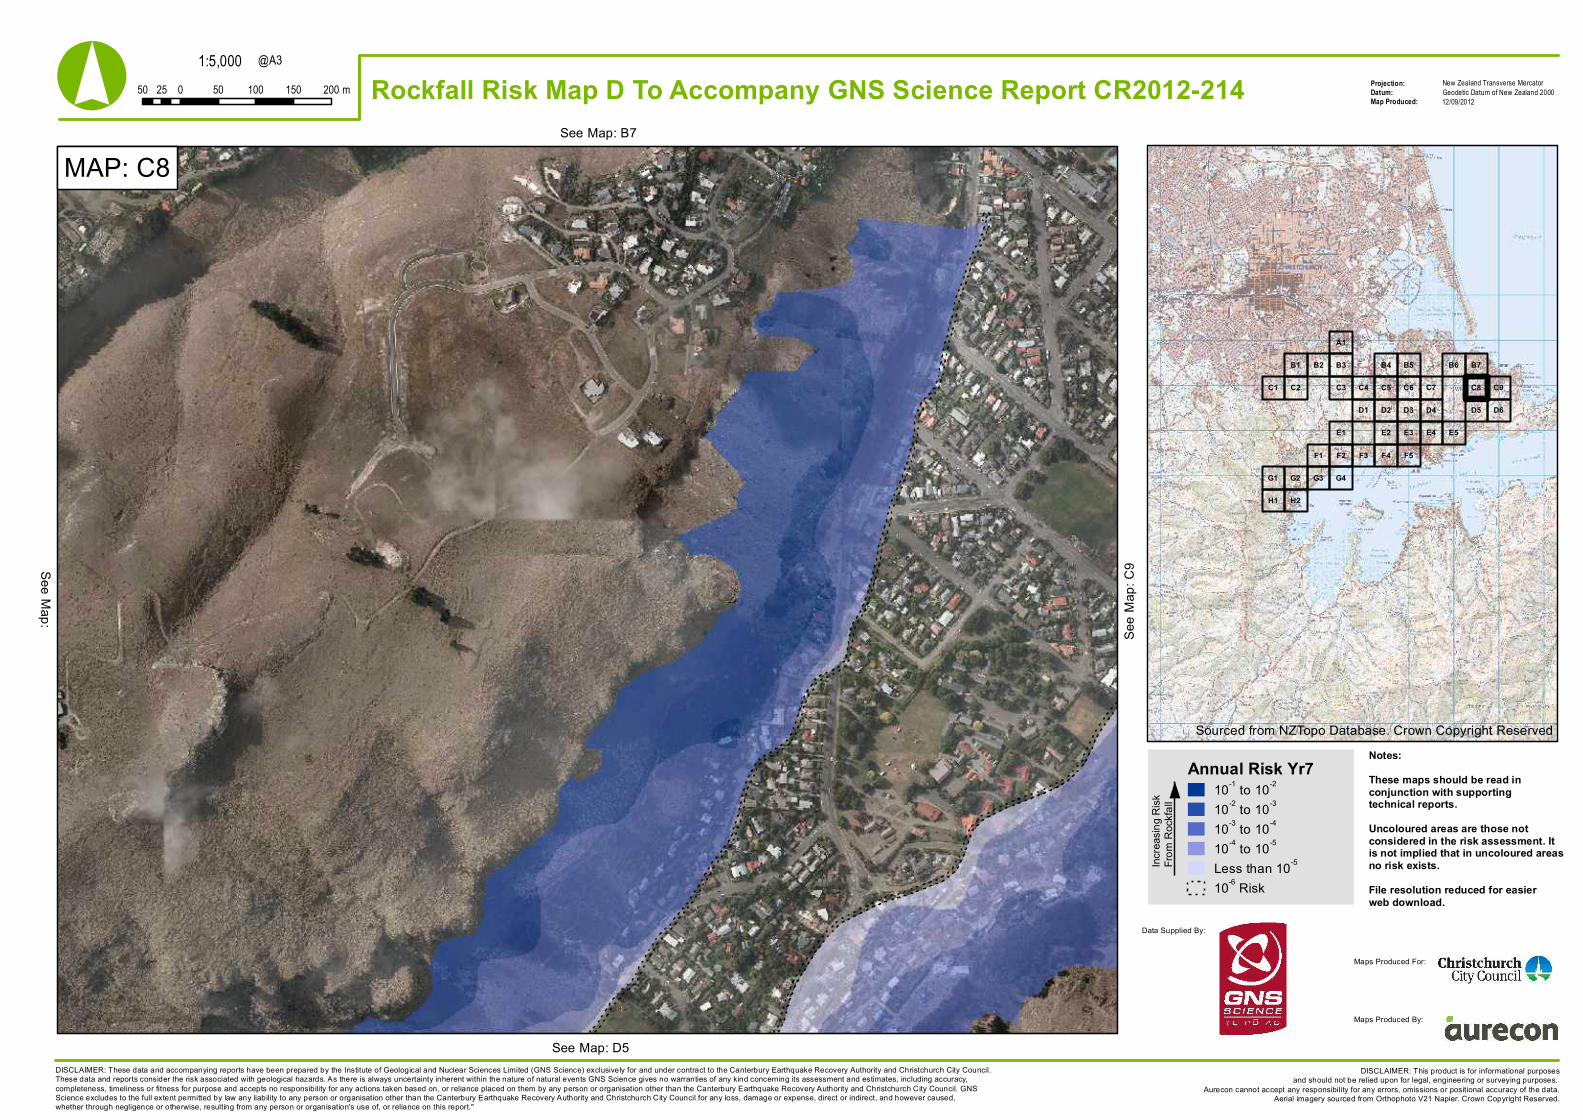
MAP: C8See Map: B7
See M
ap: C
9
See Map: D5
See Map:
Sourced from NZTopo Database. Crown Copyright Reserved
Annual Risk Yr710-1 to 10-2
10-2 to 10-3
10-3 to 10-4
10-4 to 10-5
Less than 10-5
10-6 Risk
Notes:These maps should be read inconjunction with supportingtechnical reports.Uncoloured areas are those notconsidered in the risk assessment. Itis not implied that in uncoloured areasno risk exists.File resolution reduced for easierweb download.
DISCLAIMER: These data and accompanying reports have been prepared by the Institute of Geological and Nuclear Sciences Limited (GNS Science) exclusively for and under contract to the Canterbury Earthquake Recovery Authority and Christchurch City Council.These data and reports consider the risk associated with geological hazards. As there is always uncertainty inherent within the nature of natural events GNS Science gives no warranties of any kind concerning its assessment and estimates, including accuracy,completeness, timeliness or fitness for purpose and accepts no responsibility for any actions taken based on, or reliance placed on them by any person or organisation other than the Canterbury Earthquake Recovery Authority and Christchurch City Council. GNSScience excludes to the full extent permitted by law any liability to any person or organisation other than the Canterbury Earthquake Recovery Authority and Christchurch City Council for any loss, damage or expense, direct or indirect, and however caused,whether through negligence or otherwise, resulting from any person or organisation's use of, or reliance on this report."
Increa
sing R
iskFro
m Ro
ckfal
l
Data Supplied By:
Maps Produced For:
Maps Produced By:
1:5,000Projection:Datum:Map Produced:
New Zealand Transverse MercatorGeodetic Datum of New Zealand 200050 0 50 100 150 20025 m
@A3
DISCLAIMER: This product is for informational purposesand should not be relied upon for legal, engineering or surveying purposes.
Aurecon cannot accept any responsibility for any errors, omissions or positional accuracy of the data.Aerial imagery sourced from Orthophoto V21 Napier. Crown Copyright Reserved.
° Rockfall Risk Map D To Accompany GNS Science Report CR2012-214 12/09/2012
F5F4F3F1 F2
E1 E5E4E3E2
B5 B6 B7
C4 C5 C6 C7 C8 C9
D1 D2 D3 D4 D5 D6
H1
B1
C2
H2
B4B2
C3C1
B3
A1
G1 G2 G3 G4
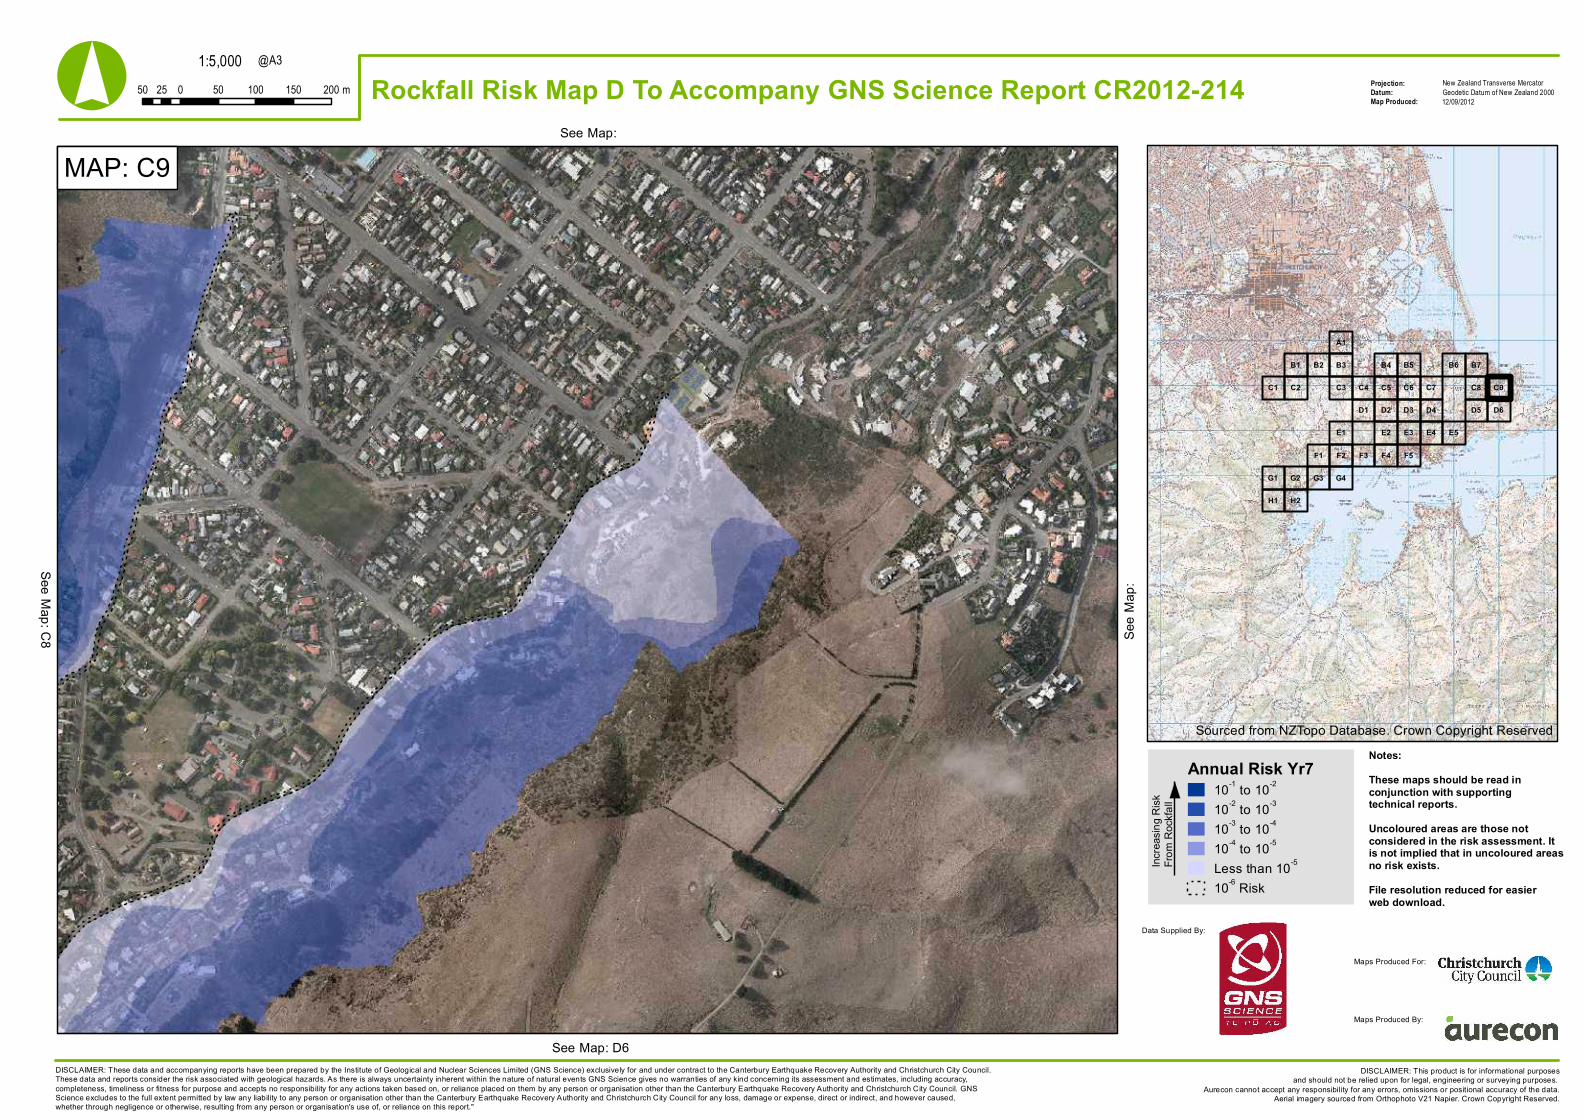
MAP: C9See Map:
See M
ap:
See Map: D6
See Map: C8
Sourced from NZTopo Database. Crown Copyright Reserved
Annual Risk Yr710-1 to 10-2
10-2 to 10-3
10-3 to 10-4
10-4 to 10-5
Less than 10-5
10-6 Risk
Notes:These maps should be read inconjunction with supportingtechnical reports.Uncoloured areas are those notconsidered in the risk assessment. Itis not implied that in uncoloured areasno risk exists.File resolution reduced for easierweb download.
DISCLAIMER: These data and accompanying reports have been prepared by the Institute of Geological and Nuclear Sciences Limited (GNS Science) exclusively for and under contract to the Canterbury Earthquake Recovery Authority and Christchurch City Council.These data and reports consider the risk associated with geological hazards. As there is always uncertainty inherent within the nature of natural events GNS Science gives no warranties of any kind concerning its assessment and estimates, including accuracy,completeness, timeliness or fitness for purpose and accepts no responsibility for any actions taken based on, or reliance placed on them by any person or organisation other than the Canterbury Earthquake Recovery Authority and Christchurch City Council. GNSScience excludes to the full extent permitted by law any liability to any person or organisation other than the Canterbury Earthquake Recovery Authority and Christchurch City Council for any loss, damage or expense, direct or indirect, and however caused,whether through negligence or otherwise, resulting from any person or organisation's use of, or reliance on this report."
Increa
sing R
iskFro
m Ro
ckfal
l
Data Supplied By:
Maps Produced For:
Maps Produced By:
1:5,000Projection:Datum:Map Produced:
New Zealand Transverse MercatorGeodetic Datum of New Zealand 200050 0 50 100 150 20025 m
@A3
DISCLAIMER: This product is for informational purposesand should not be relied upon for legal, engineering or surveying purposes.
Aurecon cannot accept any responsibility for any errors, omissions or positional accuracy of the data.Aerial imagery sourced from Orthophoto V21 Napier. Crown Copyright Reserved.
° Rockfall Risk Map D To Accompany GNS Science Report CR2012-214 12/09/2012
F5F4F3F1 F2
E1 E5E4E3E2
B5 B6 B7
C4 C5 C6 C7 C8 C9
D1 D2 D3 D4 D5 D6
H1
B1
C2
H2
B4B2
C3C1
B3
A1
G1 G2 G3 G4
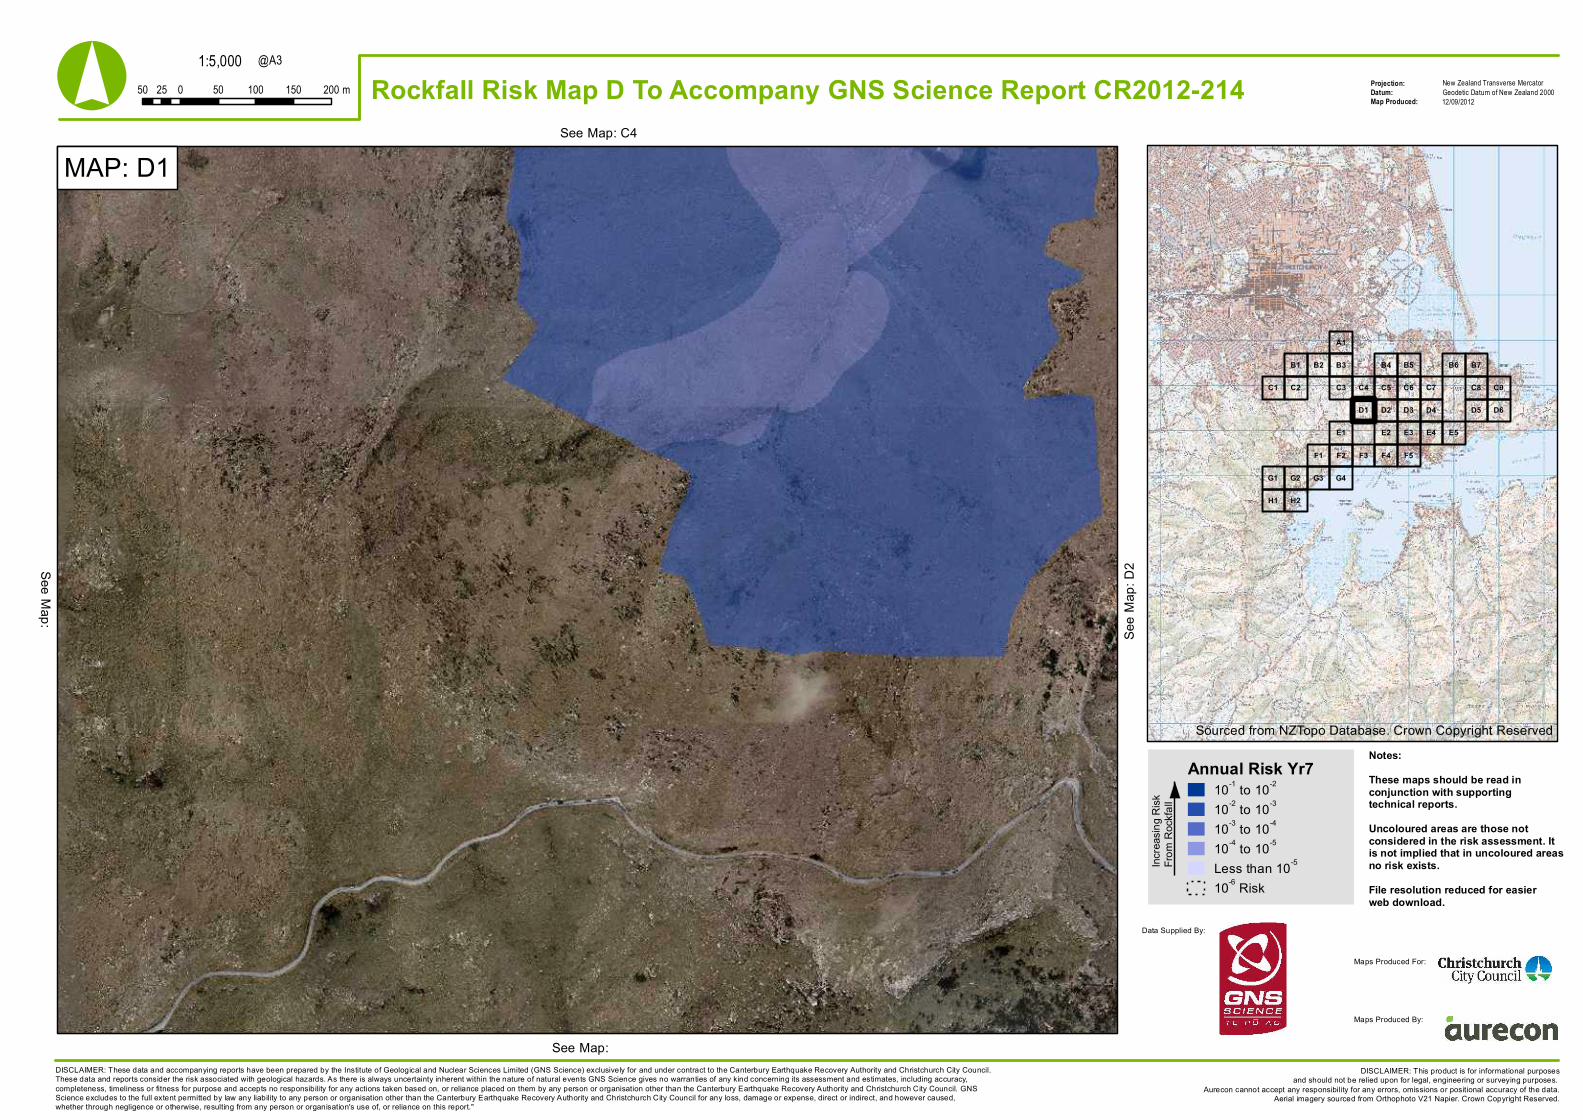
MAP: D1See Map: C4
See M
ap: D
2
See Map:
See Map:
Sourced from NZTopo Database. Crown Copyright Reserved
Annual Risk Yr710-1 to 10-2
10-2 to 10-3
10-3 to 10-4
10-4 to 10-5
Less than 10-5
10-6 Risk
Notes:These maps should be read inconjunction with supportingtechnical reports.Uncoloured areas are those notconsidered in the risk assessment. Itis not implied that in uncoloured areasno risk exists.File resolution reduced for easierweb download.
DISCLAIMER: These data and accompanying reports have been prepared by the Institute of Geological and Nuclear Sciences Limited (GNS Science) exclusively for and under contract to the Canterbury Earthquake Recovery Authority and Christchurch City Council.These data and reports consider the risk associated with geological hazards. As there is always uncertainty inherent within the nature of natural events GNS Science gives no warranties of any kind concerning its assessment and estimates, including accuracy,completeness, timeliness or fitness for purpose and accepts no responsibility for any actions taken based on, or reliance placed on them by any person or organisation other than the Canterbury Earthquake Recovery Authority and Christchurch City Council. GNSScience excludes to the full extent permitted by law any liability to any person or organisation other than the Canterbury Earthquake Recovery Authority and Christchurch City Council for any loss, damage or expense, direct or indirect, and however caused,whether through negligence or otherwise, resulting from any person or organisation's use of, or reliance on this report."
Increa
sing R
iskFro
m Ro
ckfal
l
Data Supplied By:
Maps Produced For:
Maps Produced By:
1:5,000Projection:Datum:Map Produced:
New Zealand Transverse MercatorGeodetic Datum of New Zealand 200050 0 50 100 150 20025 m
@A3
DISCLAIMER: This product is for informational purposesand should not be relied upon for legal, engineering or surveying purposes.
Aurecon cannot accept any responsibility for any errors, omissions or positional accuracy of the data.Aerial imagery sourced from Orthophoto V21 Napier. Crown Copyright Reserved.
° Rockfall Risk Map D To Accompany GNS Science Report CR2012-214 12/09/2012
F5F4F3F1 F2
E1 E5E4E3E2
B5 B6 B7
C4 C5 C6 C7 C8 C9
D1 D2 D3 D4 D5 D6
H1
B1
C2
H2
B4B2
C3C1
B3
A1
G1 G2 G3 G4
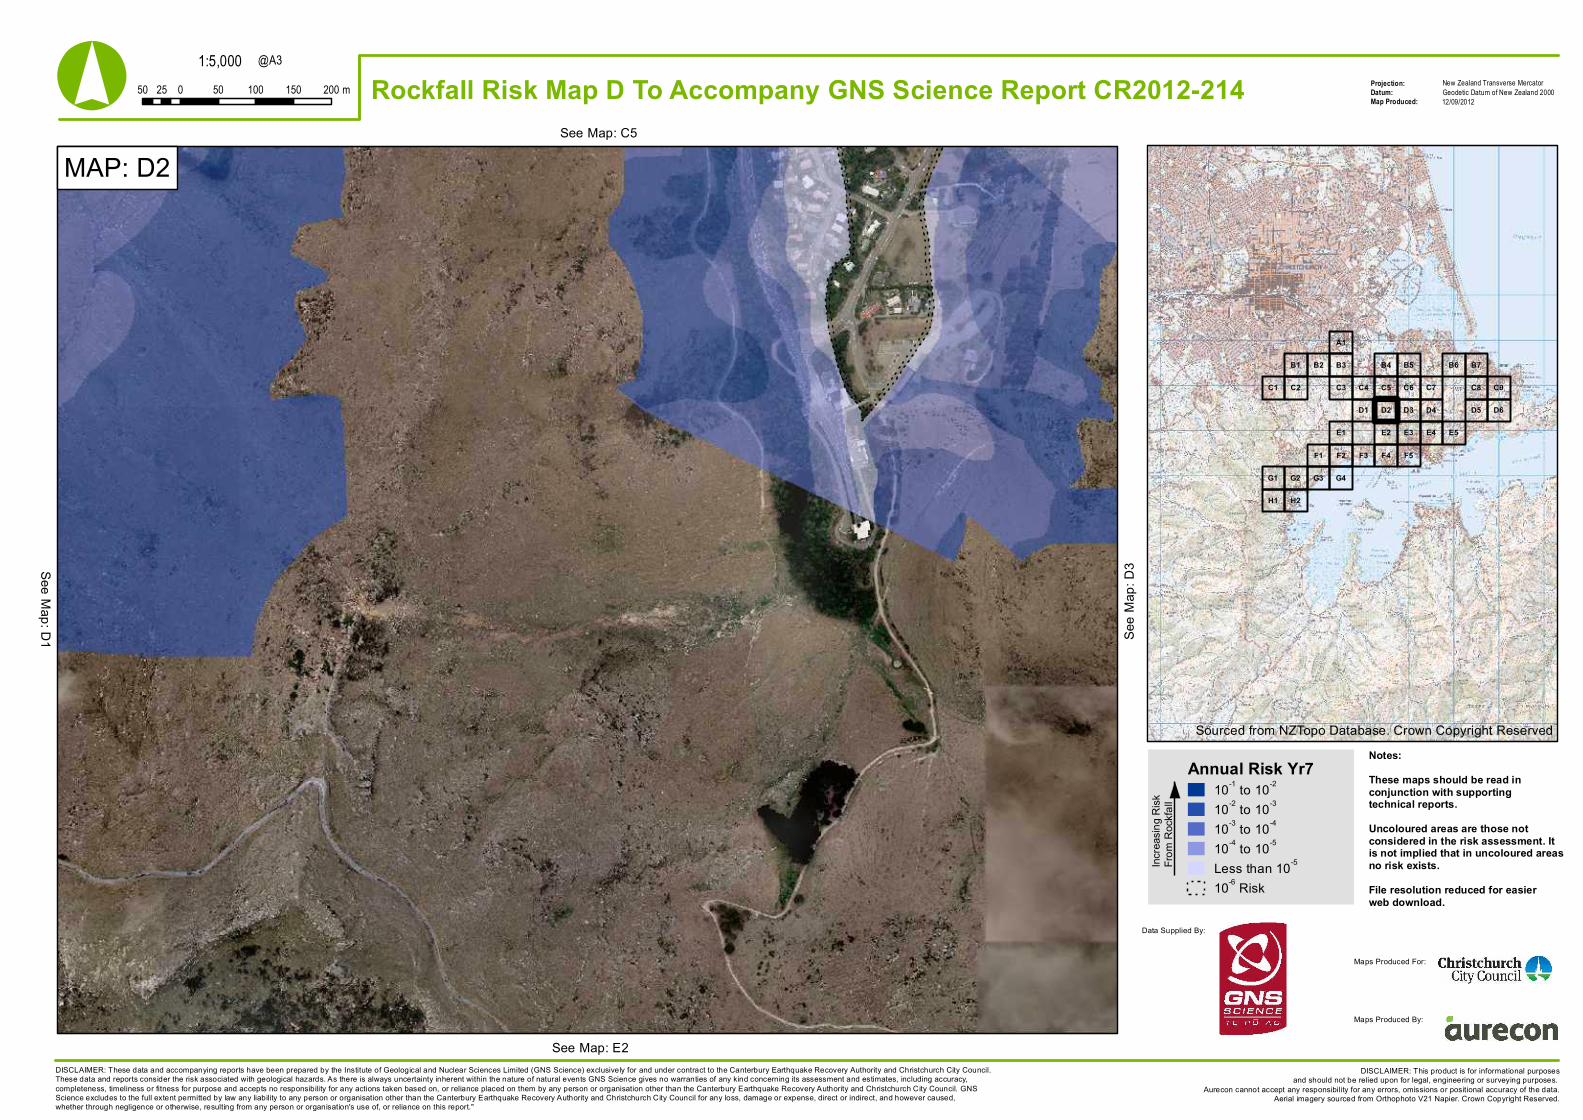
MAP: D2See Map: C5
See M
ap: D
3
See Map: E2
See Map: D1
Sourced from NZTopo Database. Crown Copyright Reserved
Annual Risk Yr710-1 to 10-2
10-2 to 10-3
10-3 to 10-4
10-4 to 10-5
Less than 10-5
10-6 Risk
Notes:These maps should be read inconjunction with supportingtechnical reports.Uncoloured areas are those notconsidered in the risk assessment. Itis not implied that in uncoloured areasno risk exists.File resolution reduced for easierweb download.
DISCLAIMER: These data and accompanying reports have been prepared by the Institute of Geological and Nuclear Sciences Limited (GNS Science) exclusively for and under contract to the Canterbury Earthquake Recovery Authority and Christchurch City Council.These data and reports consider the risk associated with geological hazards. As there is always uncertainty inherent within the nature of natural events GNS Science gives no warranties of any kind concerning its assessment and estimates, including accuracy,completeness, timeliness or fitness for purpose and accepts no responsibility for any actions taken based on, or reliance placed on them by any person or organisation other than the Canterbury Earthquake Recovery Authority and Christchurch City Council. GNSScience excludes to the full extent permitted by law any liability to any person or organisation other than the Canterbury Earthquake Recovery Authority and Christchurch City Council for any loss, damage or expense, direct or indirect, and however caused,whether through negligence or otherwise, resulting from any person or organisation's use of, or reliance on this report."
Increa
sing R
iskFro
m Ro
ckfal
l
Data Supplied By:
Maps Produced For:
Maps Produced By:
1:5,000Projection:Datum:Map Produced:
New Zealand Transverse MercatorGeodetic Datum of New Zealand 200050 0 50 100 150 20025 m
@A3
DISCLAIMER: This product is for informational purposesand should not be relied upon for legal, engineering or surveying purposes.
Aurecon cannot accept any responsibility for any errors, omissions or positional accuracy of the data.Aerial imagery sourced from Orthophoto V21 Napier. Crown Copyright Reserved.
° Rockfall Risk Map D To Accompany GNS Science Report CR2012-214 12/09/2012
F5F4F3F1 F2
E1 E5E4E3E2
B5 B6 B7
C4 C5 C6 C7 C8 C9
D1 D2 D3 D4 D5 D6
H1
B1
C2
H2
B4B2
C3C1
B3
A1
G1 G2 G3 G4
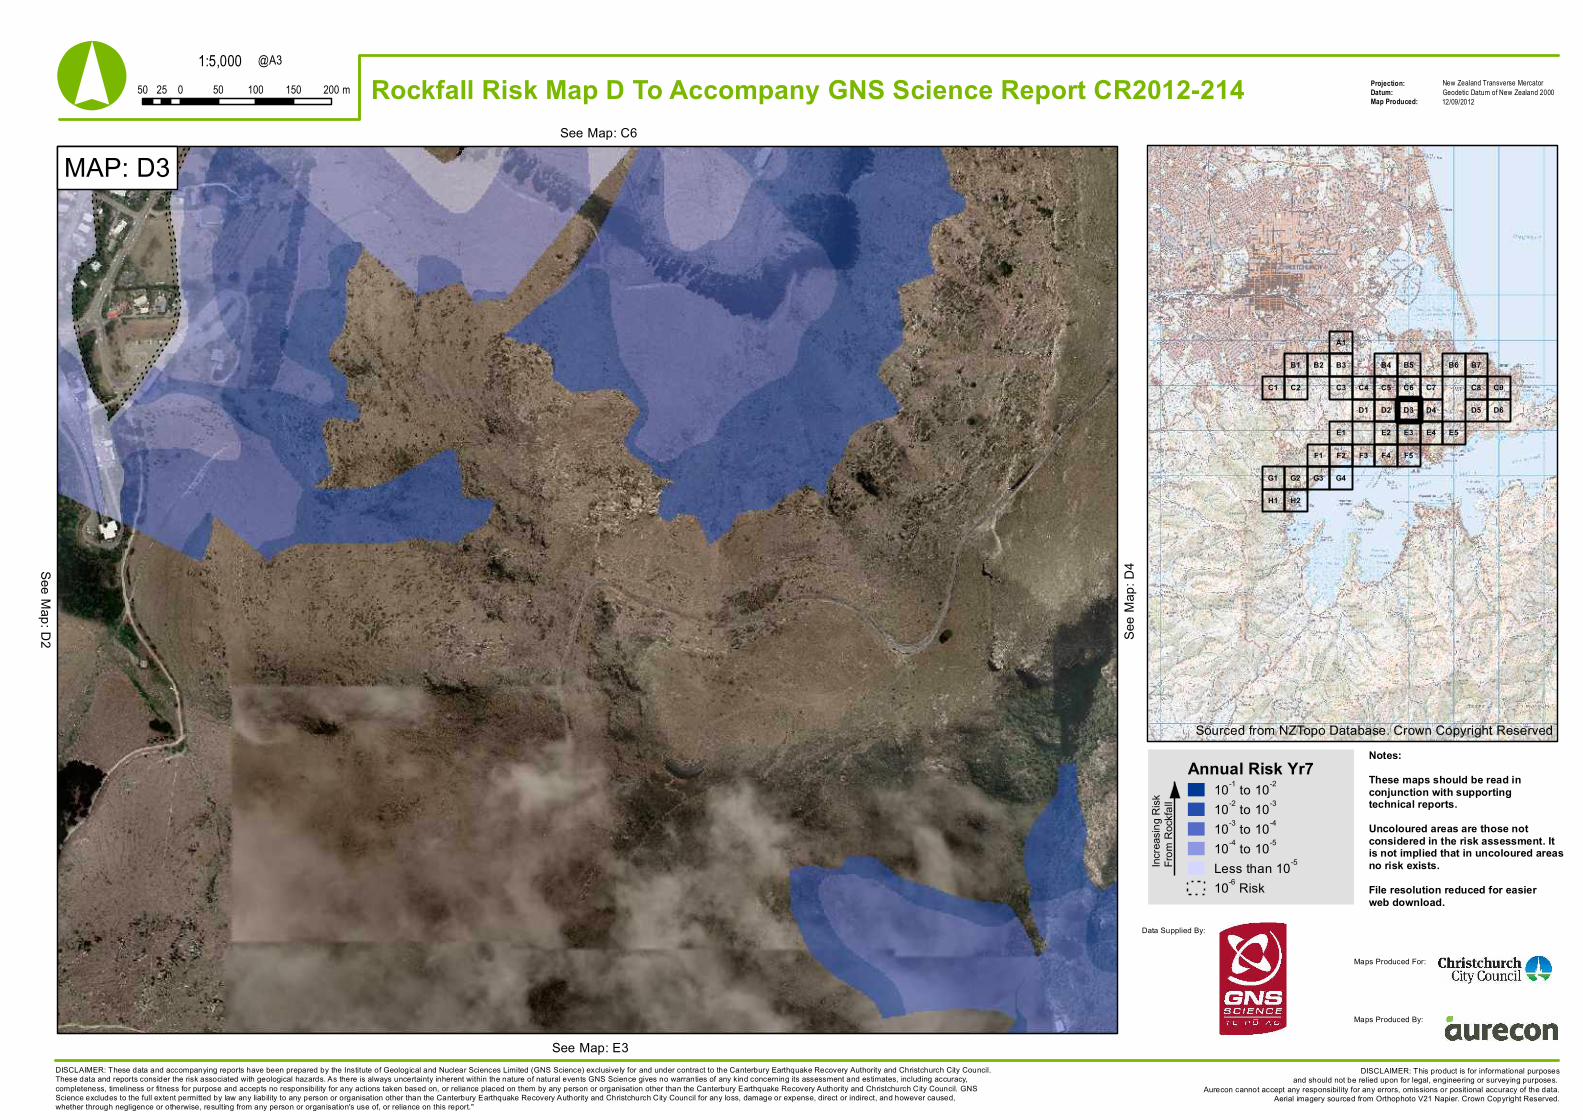
MAP: D3See Map: C6
See M
ap: D
4
See Map: E3
See Map: D2
Sourced from NZTopo Database. Crown Copyright Reserved
Annual Risk Yr710-1 to 10-2
10-2 to 10-3
10-3 to 10-4
10-4 to 10-5
Less than 10-5
10-6 Risk
Notes:These maps should be read inconjunction with supportingtechnical reports.Uncoloured areas are those notconsidered in the risk assessment. Itis not implied that in uncoloured areasno risk exists.File resolution reduced for easierweb download.
DISCLAIMER: These data and accompanying reports have been prepared by the Institute of Geological and Nuclear Sciences Limited (GNS Science) exclusively for and under contract to the Canterbury Earthquake Recovery Authority and Christchurch City Council.These data and reports consider the risk associated with geological hazards. As there is always uncertainty inherent within the nature of natural events GNS Science gives no warranties of any kind concerning its assessment and estimates, including accuracy,completeness, timeliness or fitness for purpose and accepts no responsibility for any actions taken based on, or reliance placed on them by any person or organisation other than the Canterbury Earthquake Recovery Authority and Christchurch City Council. GNSScience excludes to the full extent permitted by law any liability to any person or organisation other than the Canterbury Earthquake Recovery Authority and Christchurch City Council for any loss, damage or expense, direct or indirect, and however caused,whether through negligence or otherwise, resulting from any person or organisation's use of, or reliance on this report."
Increa
sing R
iskFro
m Ro
ckfal
l
Data Supplied By:
Maps Produced For:
Maps Produced By:
1:5,000Projection:Datum:Map Produced:
New Zealand Transverse MercatorGeodetic Datum of New Zealand 200050 0 50 100 150 20025 m
@A3
DISCLAIMER: This product is for informational purposesand should not be relied upon for legal, engineering or surveying purposes.
Aurecon cannot accept any responsibility for any errors, omissions or positional accuracy of the data.Aerial imagery sourced from Orthophoto V21 Napier. Crown Copyright Reserved.
° Rockfall Risk Map D To Accompany GNS Science Report CR2012-214 12/09/2012
F5F4F3F1 F2
E1 E5E4E3E2
B5 B6 B7
C4 C5 C6 C7 C8 C9
D1 D2 D3 D4 D5 D6
H1
B1
C2
H2
B4B2
C3C1
B3
A1
G1 G2 G3 G4
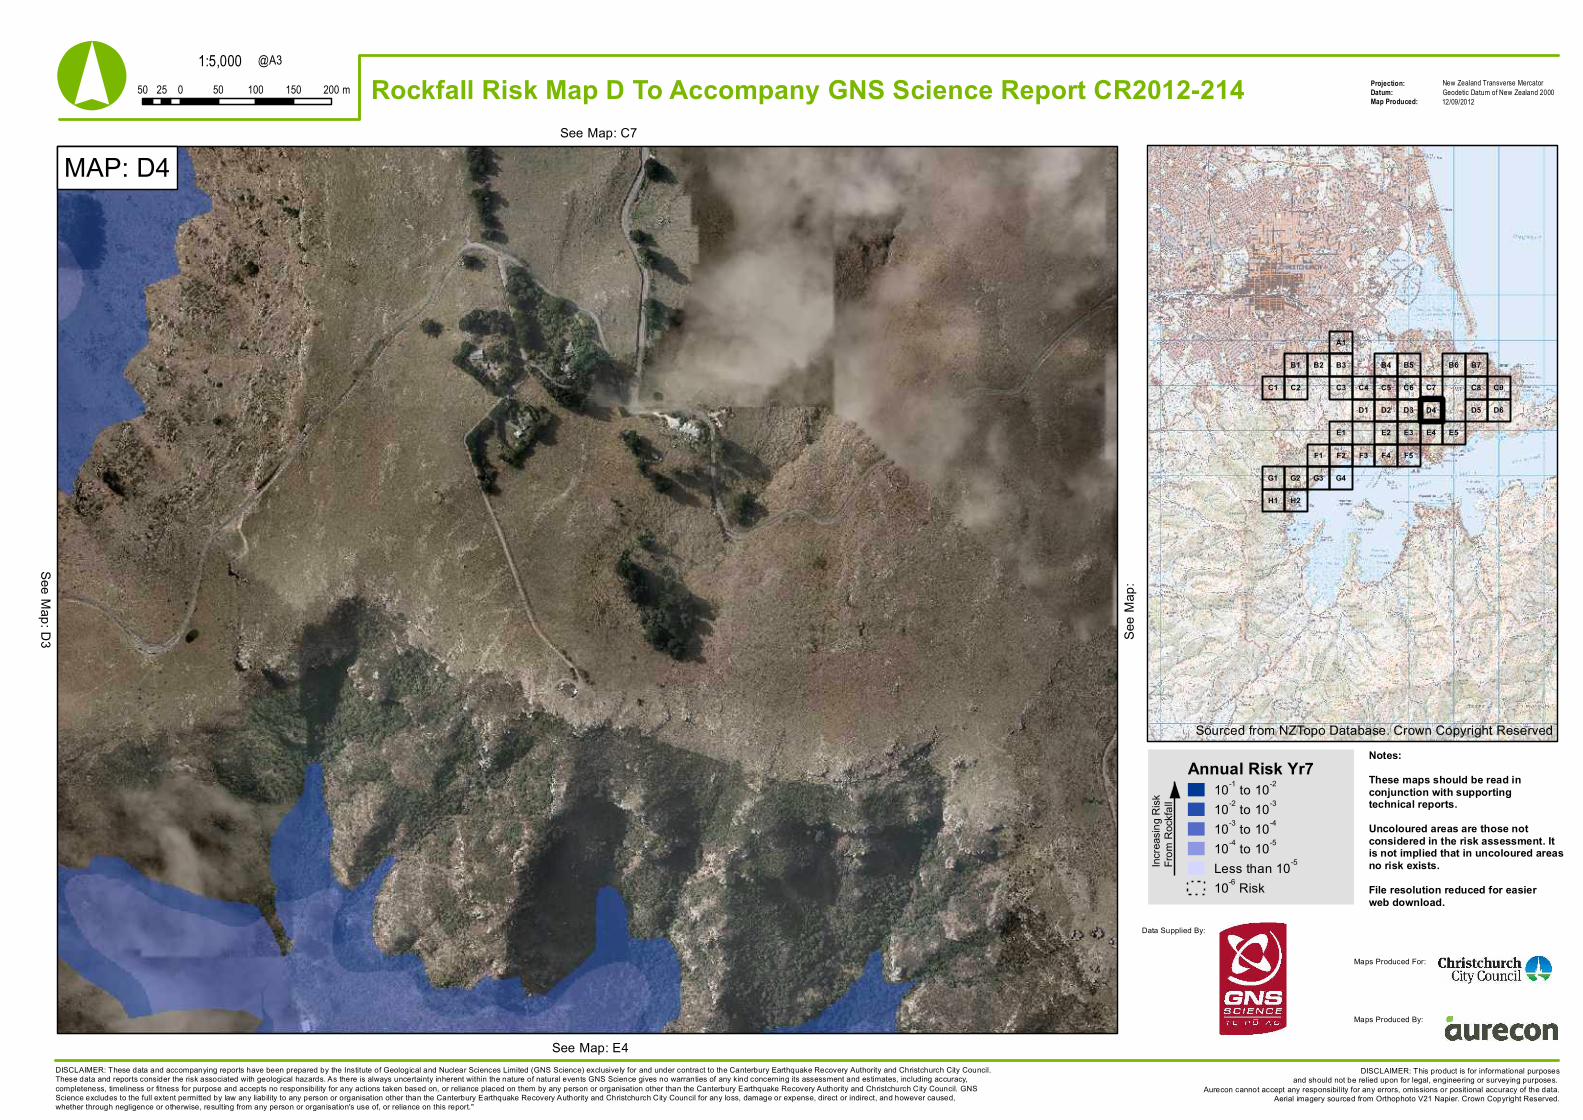
MAP: D4See Map: C7
See M
ap:
See Map: E4
See Map: D3
Sourced from NZTopo Database. Crown Copyright Reserved
Annual Risk Yr710-1 to 10-2
10-2 to 10-3
10-3 to 10-4
10-4 to 10-5
Less than 10-5
10-6 Risk
Notes:These maps should be read inconjunction with supportingtechnical reports.Uncoloured areas are those notconsidered in the risk assessment. Itis not implied that in uncoloured areasno risk exists.File resolution reduced for easierweb download.
DISCLAIMER: These data and accompanying reports have been prepared by the Institute of Geological and Nuclear Sciences Limited (GNS Science) exclusively for and under contract to the Canterbury Earthquake Recovery Authority and Christchurch City Council.These data and reports consider the risk associated with geological hazards. As there is always uncertainty inherent within the nature of natural events GNS Science gives no warranties of any kind concerning its assessment and estimates, including accuracy,completeness, timeliness or fitness for purpose and accepts no responsibility for any actions taken based on, or reliance placed on them by any person or organisation other than the Canterbury Earthquake Recovery Authority and Christchurch City Council. GNSScience excludes to the full extent permitted by law any liability to any person or organisation other than the Canterbury Earthquake Recovery Authority and Christchurch City Council for any loss, damage or expense, direct or indirect, and however caused,whether through negligence or otherwise, resulting from any person or organisation's use of, or reliance on this report."
Increa
sing R
iskFro
m Ro
ckfal
l
Data Supplied By:
Maps Produced For:
Maps Produced By:
1:5,000Projection:Datum:Map Produced:
New Zealand Transverse MercatorGeodetic Datum of New Zealand 200050 0 50 100 150 20025 m
@A3
DISCLAIMER: This product is for informational purposesand should not be relied upon for legal, engineering or surveying purposes.
Aurecon cannot accept any responsibility for any errors, omissions or positional accuracy of the data.Aerial imagery sourced from Orthophoto V21 Napier. Crown Copyright Reserved.
° Rockfall Risk Map D To Accompany GNS Science Report CR2012-214 12/09/2012
F5F4F3F1 F2
E1 E5E4E3E2
B5 B6 B7
C4 C5 C6 C7 C8 C9
D1 D2 D3 D4 D5 D6
H1
B1
C2
H2
B4B2
C3C1
B3
A1
G1 G2 G3 G4
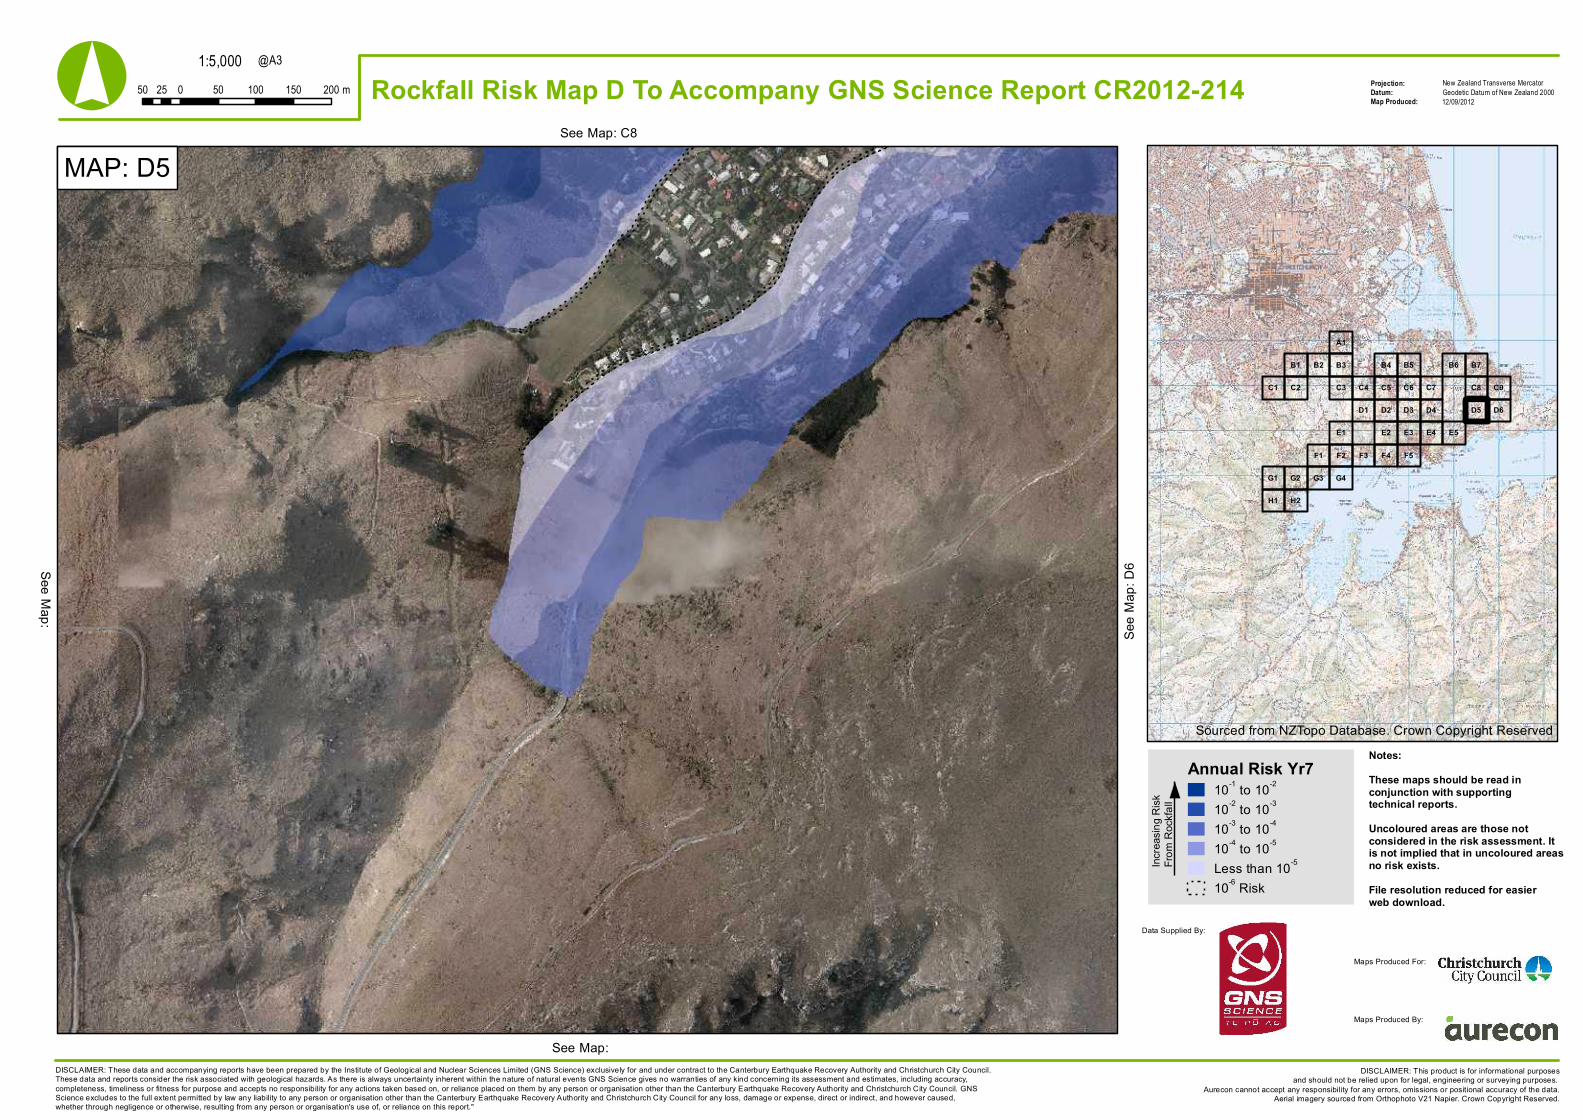
MAP: D5See Map: C8
See M
ap: D
6
See Map:
See Map:
Sourced from NZTopo Database. Crown Copyright Reserved
Annual Risk Yr710-1 to 10-2
10-2 to 10-3
10-3 to 10-4
10-4 to 10-5
Less than 10-5
10-6 Risk
Notes:These maps should be read inconjunction with supportingtechnical reports.Uncoloured areas are those notconsidered in the risk assessment. Itis not implied that in uncoloured areasno risk exists.File resolution reduced for easierweb download.
DISCLAIMER: These data and accompanying reports have been prepared by the Institute of Geological and Nuclear Sciences Limited (GNS Science) exclusively for and under contract to the Canterbury Earthquake Recovery Authority and Christchurch City Council.These data and reports consider the risk associated with geological hazards. As there is always uncertainty inherent within the nature of natural events GNS Science gives no warranties of any kind concerning its assessment and estimates, including accuracy,completeness, timeliness or fitness for purpose and accepts no responsibility for any actions taken based on, or reliance placed on them by any person or organisation other than the Canterbury Earthquake Recovery Authority and Christchurch City Council. GNSScience excludes to the full extent permitted by law any liability to any person or organisation other than the Canterbury Earthquake Recovery Authority and Christchurch City Council for any loss, damage or expense, direct or indirect, and however caused,whether through negligence or otherwise, resulting from any person or organisation's use of, or reliance on this report."
Increa
sing R
iskFro
m Ro
ckfal
l
Data Supplied By:
Maps Produced For:
Maps Produced By:
1:5,000Projection:Datum:Map Produced:
New Zealand Transverse MercatorGeodetic Datum of New Zealand 200050 0 50 100 150 20025 m
@A3
DISCLAIMER: This product is for informational purposesand should not be relied upon for legal, engineering or surveying purposes.
Aurecon cannot accept any responsibility for any errors, omissions or positional accuracy of the data.Aerial imagery sourced from Orthophoto V21 Napier. Crown Copyright Reserved.
° Rockfall Risk Map D To Accompany GNS Science Report CR2012-214 12/09/2012
F5F4F3F1 F2
E1 E5E4E3E2
B5 B6 B7
C4 C5 C6 C7 C8 C9
D1 D2 D3 D4 D5 D6
H1
B1
C2
H2
B4B2
C3C1
B3
A1
G1 G2 G3 G4
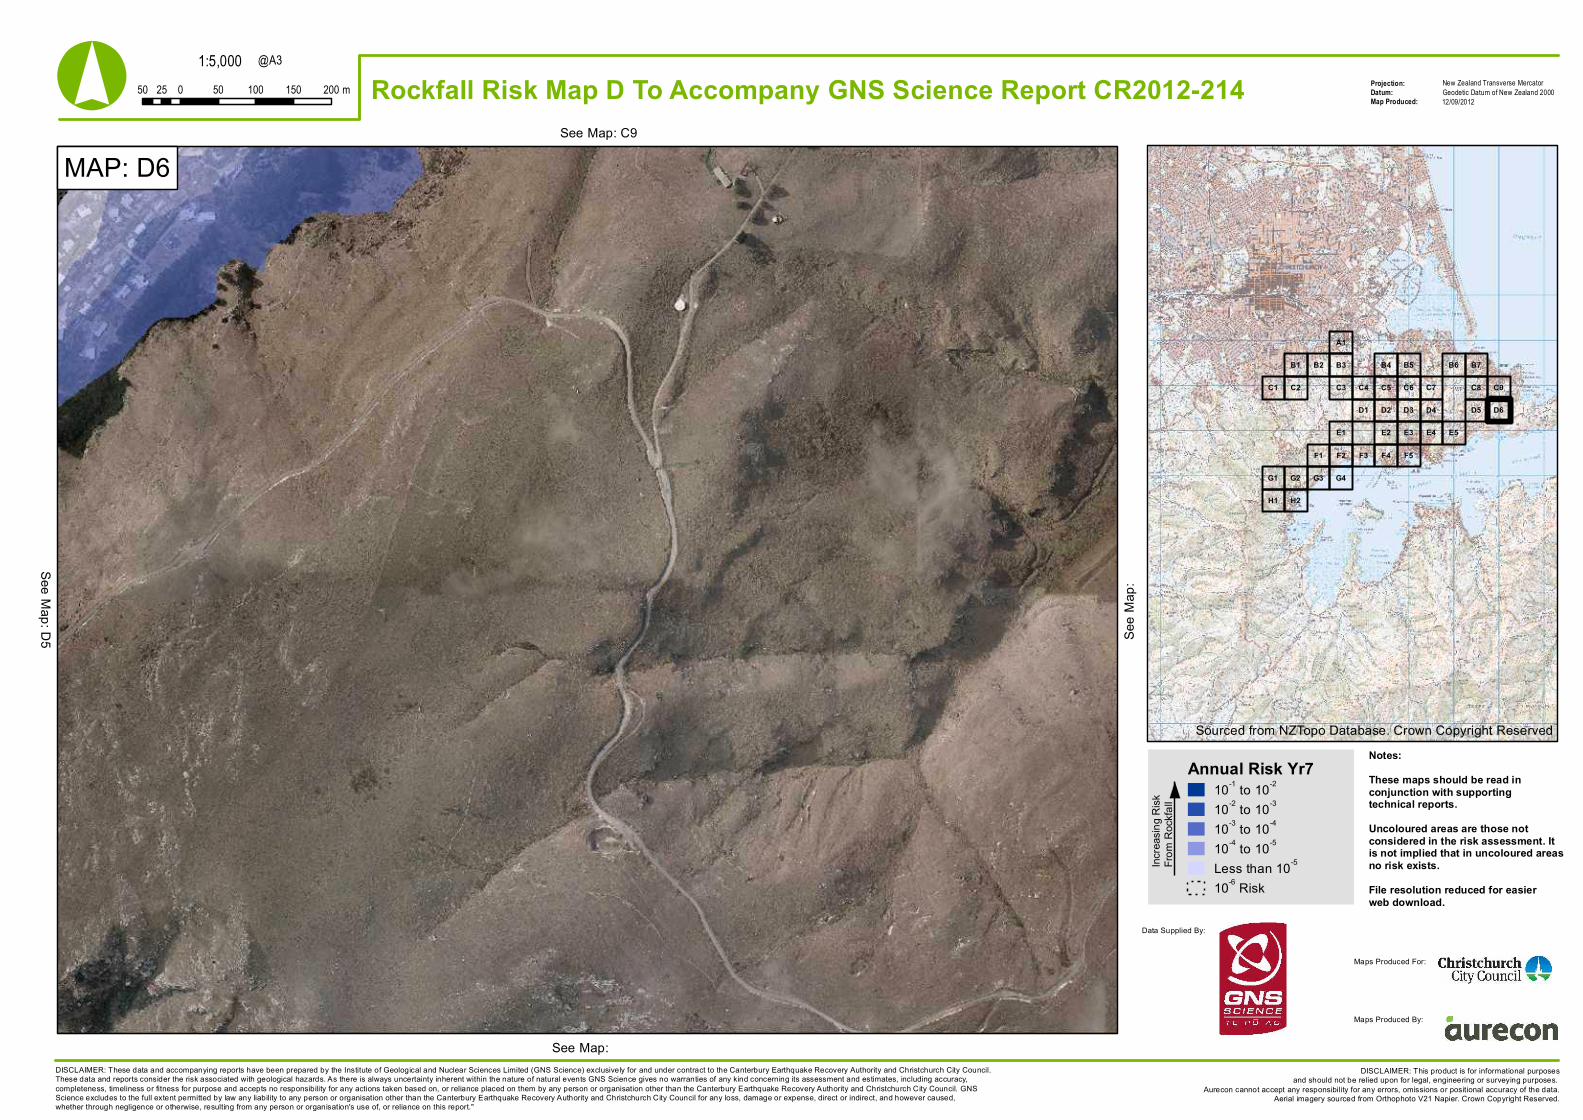
MAP: D6See Map: C9
See M
ap:
See Map:
See Map: D5
Sourced from NZTopo Database. Crown Copyright Reserved
Annual Risk Yr710-1 to 10-2
10-2 to 10-3
10-3 to 10-4
10-4 to 10-5
Less than 10-5
10-6 Risk
Notes:These maps should be read inconjunction with supportingtechnical reports.Uncoloured areas are those notconsidered in the risk assessment. Itis not implied that in uncoloured areasno risk exists.File resolution reduced for easierweb download.
DISCLAIMER: These data and accompanying reports have been prepared by the Institute of Geological and Nuclear Sciences Limited (GNS Science) exclusively for and under contract to the Canterbury Earthquake Recovery Authority and Christchurch City Council.These data and reports consider the risk associated with geological hazards. As there is always uncertainty inherent within the nature of natural events GNS Science gives no warranties of any kind concerning its assessment and estimates, including accuracy,completeness, timeliness or fitness for purpose and accepts no responsibility for any actions taken based on, or reliance placed on them by any person or organisation other than the Canterbury Earthquake Recovery Authority and Christchurch City Council. GNSScience excludes to the full extent permitted by law any liability to any person or organisation other than the Canterbury Earthquake Recovery Authority and Christchurch City Council for any loss, damage or expense, direct or indirect, and however caused,whether through negligence or otherwise, resulting from any person or organisation's use of, or reliance on this report."
Increa
sing R
iskFro
m Ro
ckfal
l
Data Supplied By:
Maps Produced For:
Maps Produced By:
1:5,000Projection:Datum:Map Produced:
New Zealand Transverse MercatorGeodetic Datum of New Zealand 200050 0 50 100 150 20025 m
@A3
DISCLAIMER: This product is for informational purposesand should not be relied upon for legal, engineering or surveying purposes.
Aurecon cannot accept any responsibility for any errors, omissions or positional accuracy of the data.Aerial imagery sourced from Orthophoto V21 Napier. Crown Copyright Reserved.
° Rockfall Risk Map D To Accompany GNS Science Report CR2012-214 12/09/2012
F5F4F3F1 F2
E1 E5E4E3E2
B5 B6 B7
C4 C5 C6 C7 C8 C9
D1 D2 D3 D4 D5 D6
H1
B1
C2
H2
B4B2
C3C1
B3
A1
G1 G2 G3 G4
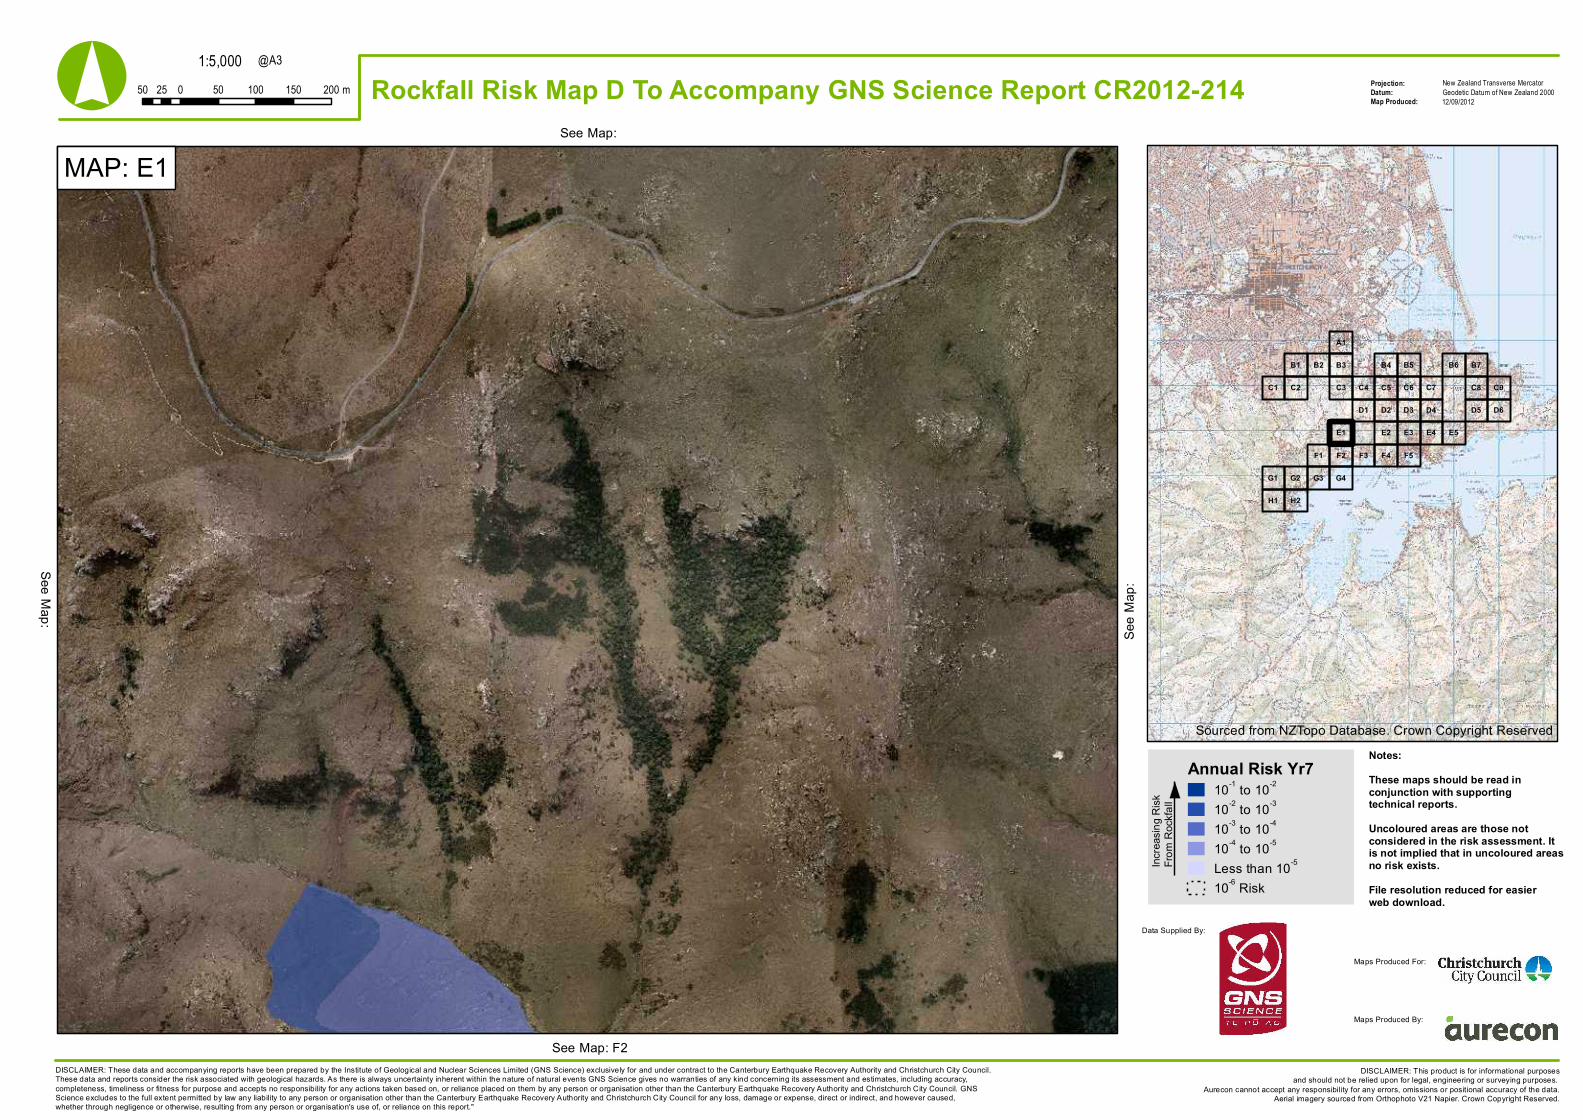
MAP: E1See Map:
See M
ap:
See Map: F2
See Map:
Sourced from NZTopo Database. Crown Copyright Reserved
Annual Risk Yr710-1 to 10-2
10-2 to 10-3
10-3 to 10-4
10-4 to 10-5
Less than 10-5
10-6 Risk
Notes:These maps should be read inconjunction with supportingtechnical reports.Uncoloured areas are those notconsidered in the risk assessment. Itis not implied that in uncoloured areasno risk exists.File resolution reduced for easierweb download.
DISCLAIMER: These data and accompanying reports have been prepared by the Institute of Geological and Nuclear Sciences Limited (GNS Science) exclusively for and under contract to the Canterbury Earthquake Recovery Authority and Christchurch City Council.These data and reports consider the risk associated with geological hazards. As there is always uncertainty inherent within the nature of natural events GNS Science gives no warranties of any kind concerning its assessment and estimates, including accuracy,completeness, timeliness or fitness for purpose and accepts no responsibility for any actions taken based on, or reliance placed on them by any person or organisation other than the Canterbury Earthquake Recovery Authority and Christchurch City Council. GNSScience excludes to the full extent permitted by law any liability to any person or organisation other than the Canterbury Earthquake Recovery Authority and Christchurch City Council for any loss, damage or expense, direct or indirect, and however caused,whether through negligence or otherwise, resulting from any person or organisation's use of, or reliance on this report."
Increa
sing R
iskFro
m Ro
ckfal
l
Data Supplied By:
Maps Produced For:
Maps Produced By:
1:5,000Projection:Datum:Map Produced:
New Zealand Transverse MercatorGeodetic Datum of New Zealand 200050 0 50 100 150 20025 m
@A3
DISCLAIMER: This product is for informational purposesand should not be relied upon for legal, engineering or surveying purposes.
Aurecon cannot accept any responsibility for any errors, omissions or positional accuracy of the data.Aerial imagery sourced from Orthophoto V21 Napier. Crown Copyright Reserved.
° Rockfall Risk Map D To Accompany GNS Science Report CR2012-214 12/09/2012
F5F4F3F1 F2
E1 E5E4E3E2
B5 B6 B7
C4 C5 C6 C7 C8 C9
D1 D2 D3 D4 D5 D6
H1
B1
C2
H2
B4B2
C3C1
B3
A1
G1 G2 G3 G4
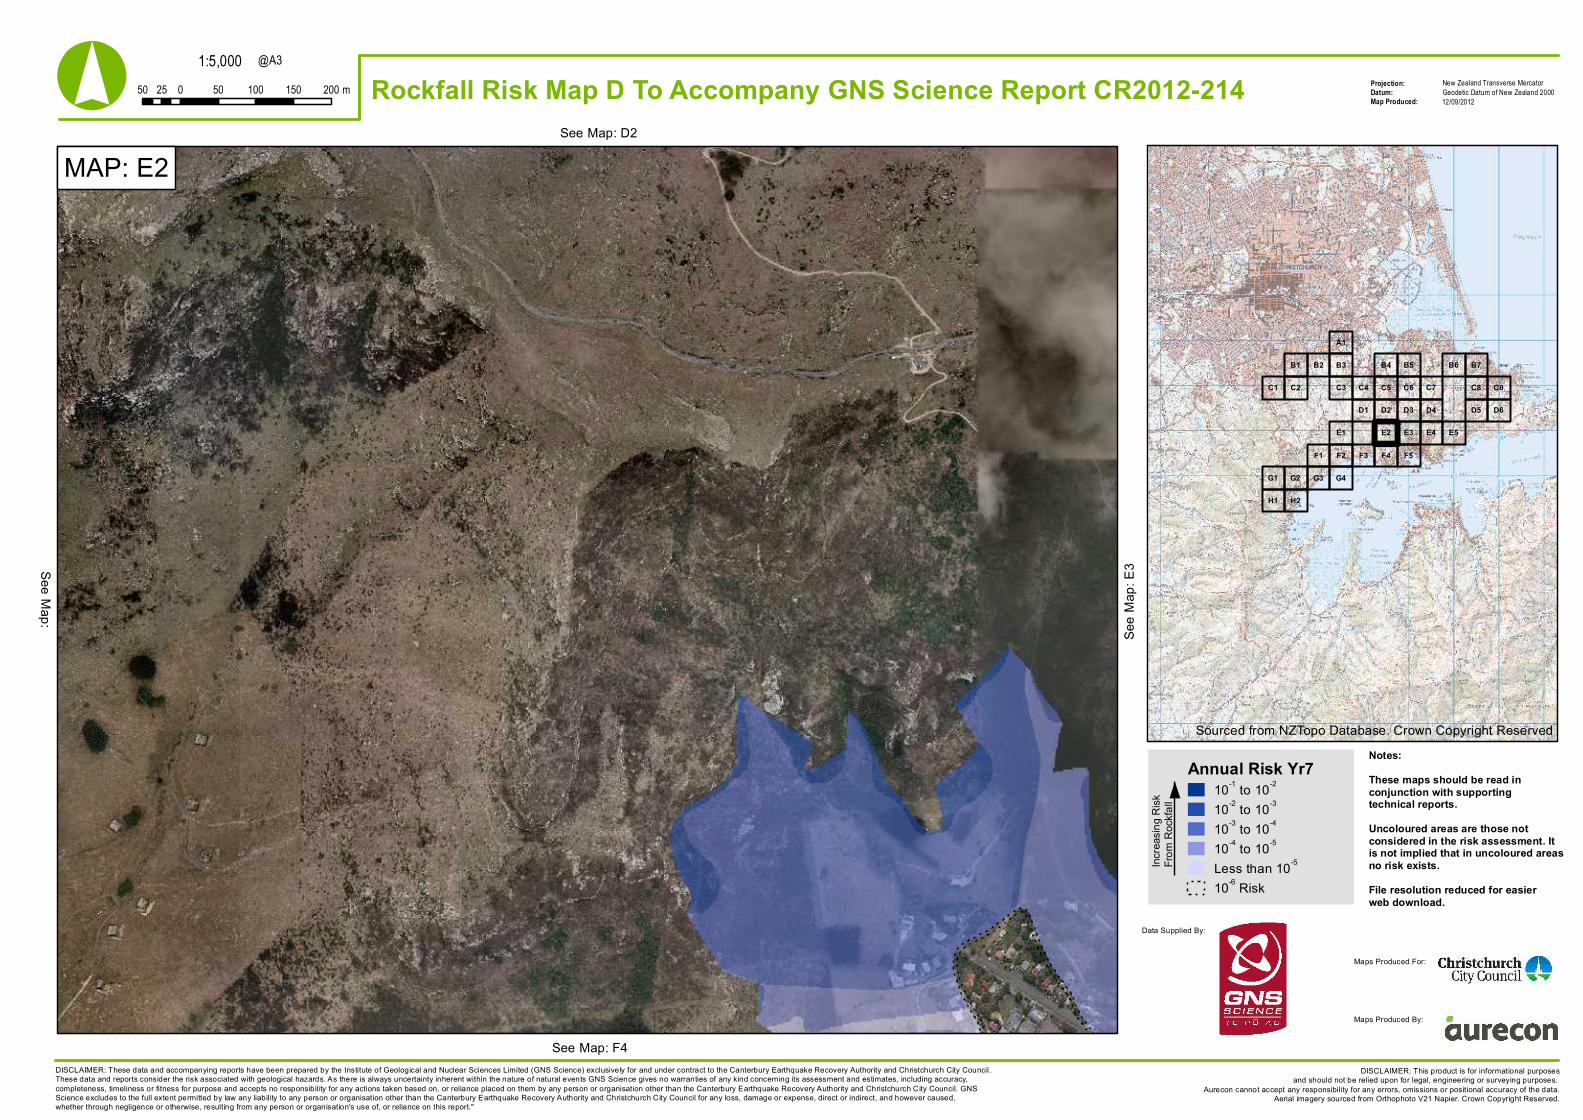
MAP: E2See Map: D2
See M
ap: E
3
See Map: F4
See Map:
Sourced from NZTopo Database. Crown Copyright Reserved
Annual Risk Yr710-1 to 10-2
10-2 to 10-3
10-3 to 10-4
10-4 to 10-5
Less than 10-5
10-6 Risk
Notes:These maps should be read inconjunction with supportingtechnical reports.Uncoloured areas are those notconsidered in the risk assessment. Itis not implied that in uncoloured areasno risk exists.File resolution reduced for easierweb download.
DISCLAIMER: These data and accompanying reports have been prepared by the Institute of Geological and Nuclear Sciences Limited (GNS Science) exclusively for and under contract to the Canterbury Earthquake Recovery Authority and Christchurch City Council.These data and reports consider the risk associated with geological hazards. As there is always uncertainty inherent within the nature of natural events GNS Science gives no warranties of any kind concerning its assessment and estimates, including accuracy,completeness, timeliness or fitness for purpose and accepts no responsibility for any actions taken based on, or reliance placed on them by any person or organisation other than the Canterbury Earthquake Recovery Authority and Christchurch City Council. GNSScience excludes to the full extent permitted by law any liability to any person or organisation other than the Canterbury Earthquake Recovery Authority and Christchurch City Council for any loss, damage or expense, direct or indirect, and however caused,whether through negligence or otherwise, resulting from any person or organisation's use of, or reliance on this report."
Increa
sing R
iskFro
m Ro
ckfal
l
Data Supplied By:
Maps Produced For:
Maps Produced By:
1:5,000Projection:Datum:Map Produced:
New Zealand Transverse MercatorGeodetic Datum of New Zealand 200050 0 50 100 150 20025 m
@A3
DISCLAIMER: This product is for informational purposesand should not be relied upon for legal, engineering or surveying purposes.
Aurecon cannot accept any responsibility for any errors, omissions or positional accuracy of the data.Aerial imagery sourced from Orthophoto V21 Napier. Crown Copyright Reserved.
° Rockfall Risk Map D To Accompany GNS Science Report CR2012-214 12/09/2012
F5F4F3F1 F2
E1 E5E4E3E2
B5 B6 B7
C4 C5 C6 C7 C8 C9
D1 D2 D3 D4 D5 D6
H1
B1
C2
H2
B4B2
C3C1
B3
A1
G1 G2 G3 G4
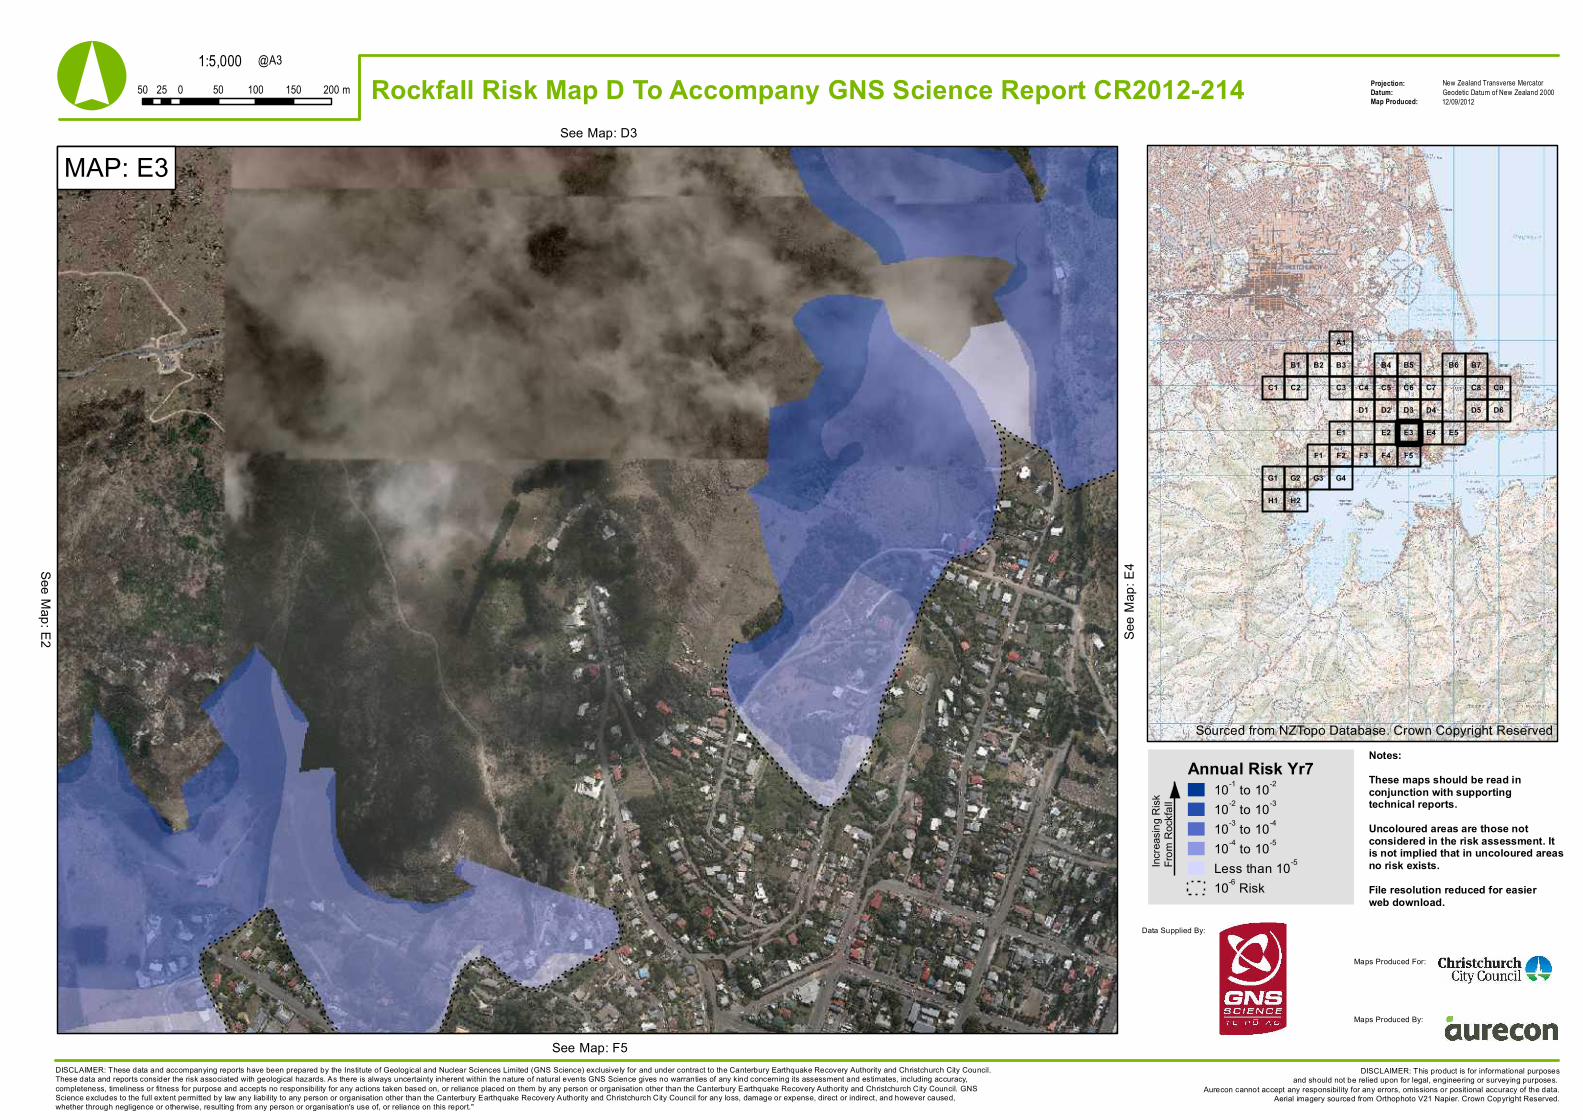
MAP: E3See Map: D3
See M
ap: E
4
See Map: F5
See Map: E2
Sourced from NZTopo Database. Crown Copyright Reserved
Annual Risk Yr710-1 to 10-2
10-2 to 10-3
10-3 to 10-4
10-4 to 10-5
Less than 10-5
10-6 Risk
Notes:These maps should be read inconjunction with supportingtechnical reports.Uncoloured areas are those notconsidered in the risk assessment. Itis not implied that in uncoloured areasno risk exists.File resolution reduced for easierweb download.
DISCLAIMER: These data and accompanying reports have been prepared by the Institute of Geological and Nuclear Sciences Limited (GNS Science) exclusively for and under contract to the Canterbury Earthquake Recovery Authority and Christchurch City Council.These data and reports consider the risk associated with geological hazards. As there is always uncertainty inherent within the nature of natural events GNS Science gives no warranties of any kind concerning its assessment and estimates, including accuracy,completeness, timeliness or fitness for purpose and accepts no responsibility for any actions taken based on, or reliance placed on them by any person or organisation other than the Canterbury Earthquake Recovery Authority and Christchurch City Council. GNSScience excludes to the full extent permitted by law any liability to any person or organisation other than the Canterbury Earthquake Recovery Authority and Christchurch City Council for any loss, damage or expense, direct or indirect, and however caused,whether through negligence or otherwise, resulting from any person or organisation's use of, or reliance on this report."
Increa
sing R
iskFro
m Ro
ckfal
l
Data Supplied By:
Maps Produced For:
Maps Produced By:
1:5,000Projection:Datum:Map Produced:
New Zealand Transverse MercatorGeodetic Datum of New Zealand 200050 0 50 100 150 20025 m
@A3
DISCLAIMER: This product is for informational purposesand should not be relied upon for legal, engineering or surveying purposes.
Aurecon cannot accept any responsibility for any errors, omissions or positional accuracy of the data.Aerial imagery sourced from Orthophoto V21 Napier. Crown Copyright Reserved.
° Rockfall Risk Map D To Accompany GNS Science Report CR2012-214 12/09/2012
F5F4F3F1 F2
E1 E5E4E3E2
B5 B6 B7
C4 C5 C6 C7 C8 C9
D1 D2 D3 D4 D5 D6
H1
B1
C2
H2
B4B2
C3C1
B3
A1
G1 G2 G3 G4
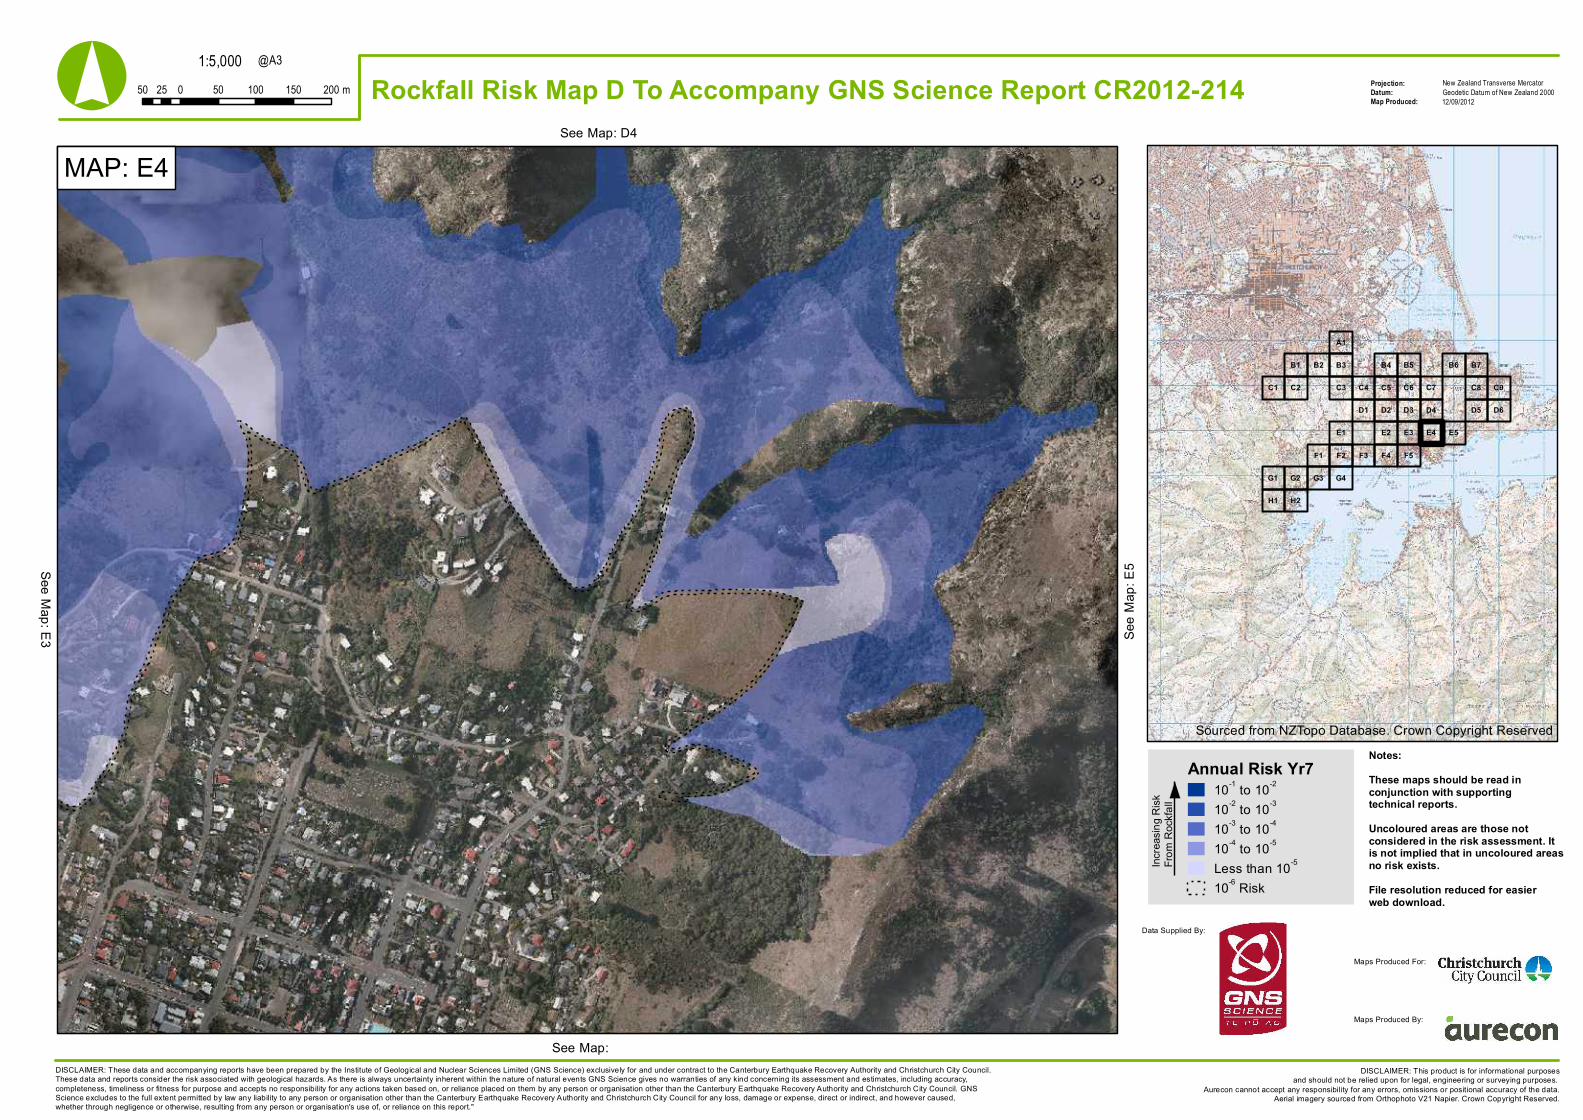
MAP: E4See Map: D4
See M
ap: E
5
See Map:
See Map: E3
Sourced from NZTopo Database. Crown Copyright Reserved
Annual Risk Yr710-1 to 10-2
10-2 to 10-3
10-3 to 10-4
10-4 to 10-5
Less than 10-5
10-6 Risk
Notes:These maps should be read inconjunction with supportingtechnical reports.Uncoloured areas are those notconsidered in the risk assessment. Itis not implied that in uncoloured areasno risk exists.File resolution reduced for easierweb download.
DISCLAIMER: These data and accompanying reports have been prepared by the Institute of Geological and Nuclear Sciences Limited (GNS Science) exclusively for and under contract to the Canterbury Earthquake Recovery Authority and Christchurch City Council.These data and reports consider the risk associated with geological hazards. As there is always uncertainty inherent within the nature of natural events GNS Science gives no warranties of any kind concerning its assessment and estimates, including accuracy,completeness, timeliness or fitness for purpose and accepts no responsibility for any actions taken based on, or reliance placed on them by any person or organisation other than the Canterbury Earthquake Recovery Authority and Christchurch City Council. GNSScience excludes to the full extent permitted by law any liability to any person or organisation other than the Canterbury Earthquake Recovery Authority and Christchurch City Council for any loss, damage or expense, direct or indirect, and however caused,whether through negligence or otherwise, resulting from any person or organisation's use of, or reliance on this report."
Increa
sing R
iskFro
m Ro
ckfal
l
Data Supplied By:
Maps Produced For:
Maps Produced By:

1:5,000Projection:Datum:Map Produced:
New Zealand Transverse MercatorGeodetic Datum of New Zealand 200050 0 50 100 150 20025 m
@A3
DISCLAIMER: This product is for informational purposesand should not be relied upon for legal, engineering or surveying purposes.
Aurecon cannot accept any responsibility for any errors, omissions or positional accuracy of the data.Aerial imagery sourced from Orthophoto V21 Napier. Crown Copyright Reserved.
° Rockfall Risk Map D To Accompany GNS Science Report CR2012-214 12/09/2012
F5F4F3F1 F2
E1 E5E4E3E2
B5 B6 B7
C4 C5 C6 C7 C8 C9
D1 D2 D3 D4 D5 D6
H1
B1
C2
H2
B4B2
C3C1
B3
A1
G1 G2 G3 G4
MAP: E5See Map:
See M
ap:
See Map:
See Map: E4
Sourced from NZTopo Database. Crown Copyright Reserved
Annual Risk Yr710-1 to 10-2
10-2 to 10-3
10-3 to 10-4
10-4 to 10-5
Less than 10-5
10-6 Risk
Notes:These maps should be read inconjunction with supportingtechnical reports.Uncoloured areas are those notconsidered in the risk assessment. Itis not implied that in uncoloured areasno risk exists.File resolution reduced for easierweb download.
DISCLAIMER: These data and accompanying reports have been prepared by the Institute of Geological and Nuclear Sciences Limited (GNS Science) exclusively for and under contract to the Canterbury Earthquake Recovery Authority and Christchurch City Council.These data and reports consider the risk associated with geological hazards. As there is always uncertainty inherent within the nature of natural events GNS Science gives no warranties of any kind concerning its assessment and estimates, including accuracy,completeness, timeliness or fitness for purpose and accepts no responsibility for any actions taken based on, or reliance placed on them by any person or organisation other than the Canterbury Earthquake Recovery Authority and Christchurch City Council. GNSScience excludes to the full extent permitted by law any liability to any person or organisation other than the Canterbury Earthquake Recovery Authority and Christchurch City Council for any loss, damage or expense, direct or indirect, and however caused,whether through negligence or otherwise, resulting from any person or organisation's use of, or reliance on this report."
Increa
sing R
iskFro
m Ro
ckfal
l
Data Supplied By:
Maps Produced For:
Maps Produced By:
1:5,000Projection:Datum:Map Produced:
New Zealand Transverse MercatorGeodetic Datum of New Zealand 200050 0 50 100 150 20025 m
@A3
DISCLAIMER: This product is for informational purposesand should not be relied upon for legal, engineering or surveying purposes.
Aurecon cannot accept any responsibility for any errors, omissions or positional accuracy of the data.Aerial imagery sourced from Orthophoto V21 Napier. Crown Copyright Reserved.
° Rockfall Risk Map D To Accompany GNS Science Report CR2012-214 12/09/2012
F5F4F3F1 F2
E1 E5E4E3E2
B5 B6 B7
C4 C5 C6 C7 C8 C9
D1 D2 D3 D4 D5 D6
H1
B1
C2
H2
B4B2
C3C1
B3
A1
G1 G2 G3 G4
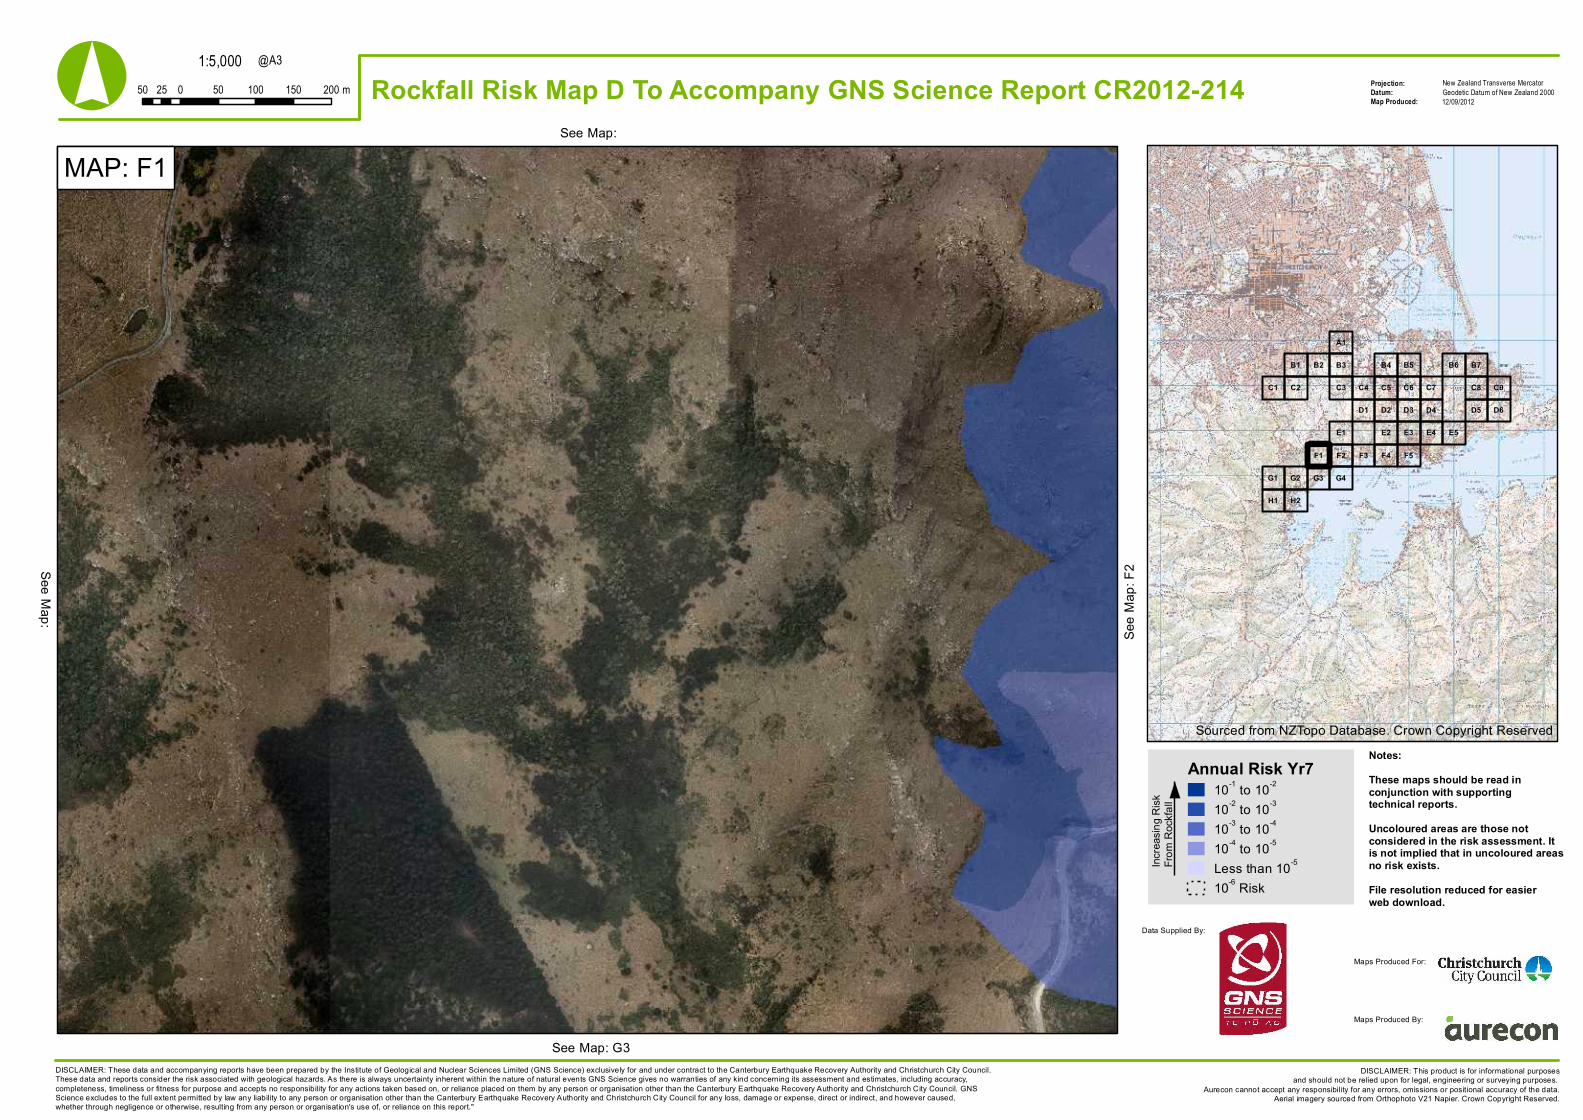
MAP: F1See Map:
See M
ap: F
2
See Map: G3
See Map:
Sourced from NZTopo Database. Crown Copyright Reserved
Annual Risk Yr710-1 to 10-2
10-2 to 10-3
10-3 to 10-4
10-4 to 10-5
Less than 10-5
10-6 Risk
Notes:These maps should be read inconjunction with supportingtechnical reports.Uncoloured areas are those notconsidered in the risk assessment. Itis not implied that in uncoloured areasno risk exists.File resolution reduced for easierweb download.
DISCLAIMER: These data and accompanying reports have been prepared by the Institute of Geological and Nuclear Sciences Limited (GNS Science) exclusively for and under contract to the Canterbury Earthquake Recovery Authority and Christchurch City Council.These data and reports consider the risk associated with geological hazards. As there is always uncertainty inherent within the nature of natural events GNS Science gives no warranties of any kind concerning its assessment and estimates, including accuracy,completeness, timeliness or fitness for purpose and accepts no responsibility for any actions taken based on, or reliance placed on them by any person or organisation other than the Canterbury Earthquake Recovery Authority and Christchurch City Council. GNSScience excludes to the full extent permitted by law any liability to any person or organisation other than the Canterbury Earthquake Recovery Authority and Christchurch City Council for any loss, damage or expense, direct or indirect, and however caused,whether through negligence or otherwise, resulting from any person or organisation's use of, or reliance on this report."
Increa
sing R
iskFro
m Ro
ckfal
l
Data Supplied By:
Maps Produced For:
Maps Produced By:
1:5,000Projection:Datum:Map Produced:
New Zealand Transverse MercatorGeodetic Datum of New Zealand 200050 0 50 100 150 20025 m
@A3
DISCLAIMER: This product is for informational purposesand should not be relied upon for legal, engineering or surveying purposes.
Aurecon cannot accept any responsibility for any errors, omissions or positional accuracy of the data.Aerial imagery sourced from Orthophoto V21 Napier. Crown Copyright Reserved.
° Rockfall Risk Map D To Accompany GNS Science Report CR2012-214 12/09/2012
F5F4F3F1 F2
E1 E5E4E3E2
B5 B6 B7
C4 C5 C6 C7 C8 C9
D1 D2 D3 D4 D5 D6
H1
B1
C2
H2
B4B2
C3C1
B3
A1
G1 G2 G3 G4
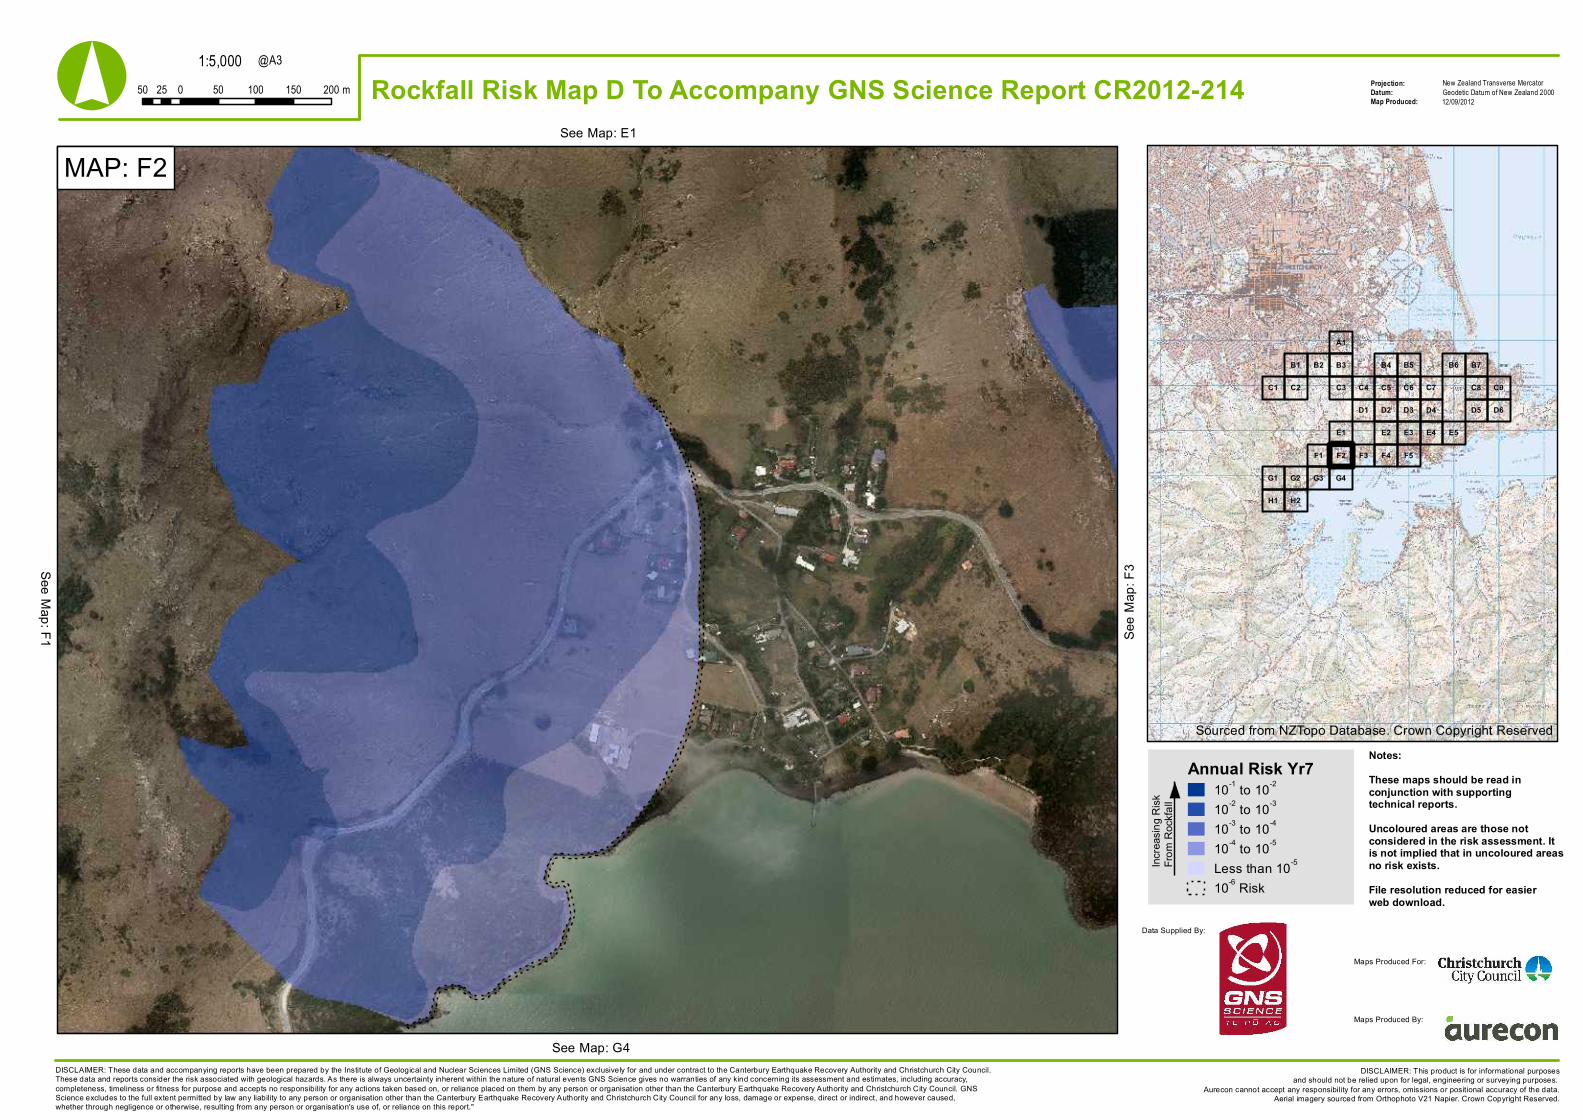
MAP: F2See Map: E1
See M
ap: F
3
See Map: G4
See Map: F1
Sourced from NZTopo Database. Crown Copyright Reserved
Annual Risk Yr710-1 to 10-2
10-2 to 10-3
10-3 to 10-4
10-4 to 10-5
Less than 10-5
10-6 Risk
Notes:These maps should be read inconjunction with supportingtechnical reports.Uncoloured areas are those notconsidered in the risk assessment. Itis not implied that in uncoloured areasno risk exists.File resolution reduced for easierweb download.
DISCLAIMER: These data and accompanying reports have been prepared by the Institute of Geological and Nuclear Sciences Limited (GNS Science) exclusively for and under contract to the Canterbury Earthquake Recovery Authority and Christchurch City Council.These data and reports consider the risk associated with geological hazards. As there is always uncertainty inherent within the nature of natural events GNS Science gives no warranties of any kind concerning its assessment and estimates, including accuracy,completeness, timeliness or fitness for purpose and accepts no responsibility for any actions taken based on, or reliance placed on them by any person or organisation other than the Canterbury Earthquake Recovery Authority and Christchurch City Council. GNSScience excludes to the full extent permitted by law any liability to any person or organisation other than the Canterbury Earthquake Recovery Authority and Christchurch City Council for any loss, damage or expense, direct or indirect, and however caused,whether through negligence or otherwise, resulting from any person or organisation's use of, or reliance on this report."
Increa
sing R
iskFro
m Ro
ckfal
l
Data Supplied By:
Maps Produced For:
Maps Produced By:
1:5,000Projection:Datum:Map Produced:
New Zealand Transverse MercatorGeodetic Datum of New Zealand 200050 0 50 100 150 20025 m
@A3
DISCLAIMER: This product is for informational purposesand should not be relied upon for legal, engineering or surveying purposes.
Aurecon cannot accept any responsibility for any errors, omissions or positional accuracy of the data.Aerial imagery sourced from Orthophoto V21 Napier. Crown Copyright Reserved.
° Rockfall Risk Map D To Accompany GNS Science Report CR2012-214 12/09/2012
F5F4F3F1 F2
E1 E5E4E3E2
B5 B6 B7
C4 C5 C6 C7 C8 C9
D1 D2 D3 D4 D5 D6
H1
B1
C2
H2
B4B2
C3C1
B3
A1
G1 G2 G3 G4
MAP: F3See Map:
See M
ap: F
4
See Map:
See Map: F2
Sourced from NZTopo Database. Crown Copyright Reserved
Annual Risk Yr710-1 to 10-2
10-2 to 10-3
10-3 to 10-4
10-4 to 10-5
Less than 10-5
10-6 Risk
Notes:These maps should be read inconjunction with supportingtechnical reports.Uncoloured areas are those notconsidered in the risk assessment. Itis not implied that in uncoloured areasno risk exists.File resolution reduced for easierweb download.
DISCLAIMER: These data and accompanying reports have been prepared by the Institute of Geological and Nuclear Sciences Limited (GNS Science) exclusively for and under contract to the Canterbury Earthquake Recovery Authority and Christchurch City Council.These data and reports consider the risk associated with geological hazards. As there is always uncertainty inherent within the nature of natural events GNS Science gives no warranties of any kind concerning its assessment and estimates, including accuracy,completeness, timeliness or fitness for purpose and accepts no responsibility for any actions taken based on, or reliance placed on them by any person or organisation other than the Canterbury Earthquake Recovery Authority and Christchurch City Council. GNSScience excludes to the full extent permitted by law any liability to any person or organisation other than the Canterbury Earthquake Recovery Authority and Christchurch City Council for any loss, damage or expense, direct or indirect, and however caused,whether through negligence or otherwise, resulting from any person or organisation's use of, or reliance on this report."
Increa
sing R
iskFro
m Ro
ckfal
l
Data Supplied By:
Maps Produced For:
Maps Produced By:

1:5,000Projection:Datum:Map Produced:
New Zealand Transverse MercatorGeodetic Datum of New Zealand 200050 0 50 100 150 20025 m
@A3
DISCLAIMER: This product is for informational purposesand should not be relied upon for legal, engineering or surveying purposes.
Aurecon cannot accept any responsibility for any errors, omissions or positional accuracy of the data.Aerial imagery sourced from Orthophoto V21 Napier. Crown Copyright Reserved.
° Rockfall Risk Map D To Accompany GNS Science Report CR2012-214 12/09/2012
F5F4F3F1 F2
E1 E5E4E3E2
B5 B6 B7
C4 C5 C6 C7 C8 C9
D1 D2 D3 D4 D5 D6
H1
B1
C2
H2
B4B2
C3C1
B3
A1
G1 G2 G3 G4
MAP: F4See Map: E2
See M
ap: F
5
See Map:
See Map: F3
Sourced from NZTopo Database. Crown Copyright Reserved
Annual Risk Yr710-1 to 10-2
10-2 to 10-3
10-3 to 10-4
10-4 to 10-5
Less than 10-5
10-6 Risk
Notes:These maps should be read inconjunction with supportingtechnical reports.Uncoloured areas are those notconsidered in the risk assessment. Itis not implied that in uncoloured areasno risk exists.File resolution reduced for easierweb download.
DISCLAIMER: These data and accompanying reports have been prepared by the Institute of Geological and Nuclear Sciences Limited (GNS Science) exclusively for and under contract to the Canterbury Earthquake Recovery Authority and Christchurch City Council.These data and reports consider the risk associated with geological hazards. As there is always uncertainty inherent within the nature of natural events GNS Science gives no warranties of any kind concerning its assessment and estimates, including accuracy,completeness, timeliness or fitness for purpose and accepts no responsibility for any actions taken based on, or reliance placed on them by any person or organisation other than the Canterbury Earthquake Recovery Authority and Christchurch City Council. GNSScience excludes to the full extent permitted by law any liability to any person or organisation other than the Canterbury Earthquake Recovery Authority and Christchurch City Council for any loss, damage or expense, direct or indirect, and however caused,whether through negligence or otherwise, resulting from any person or organisation's use of, or reliance on this report."
Increa
sing R
iskFro
m Ro
ckfal
l
Data Supplied By:
Maps Produced For:
Maps Produced By:
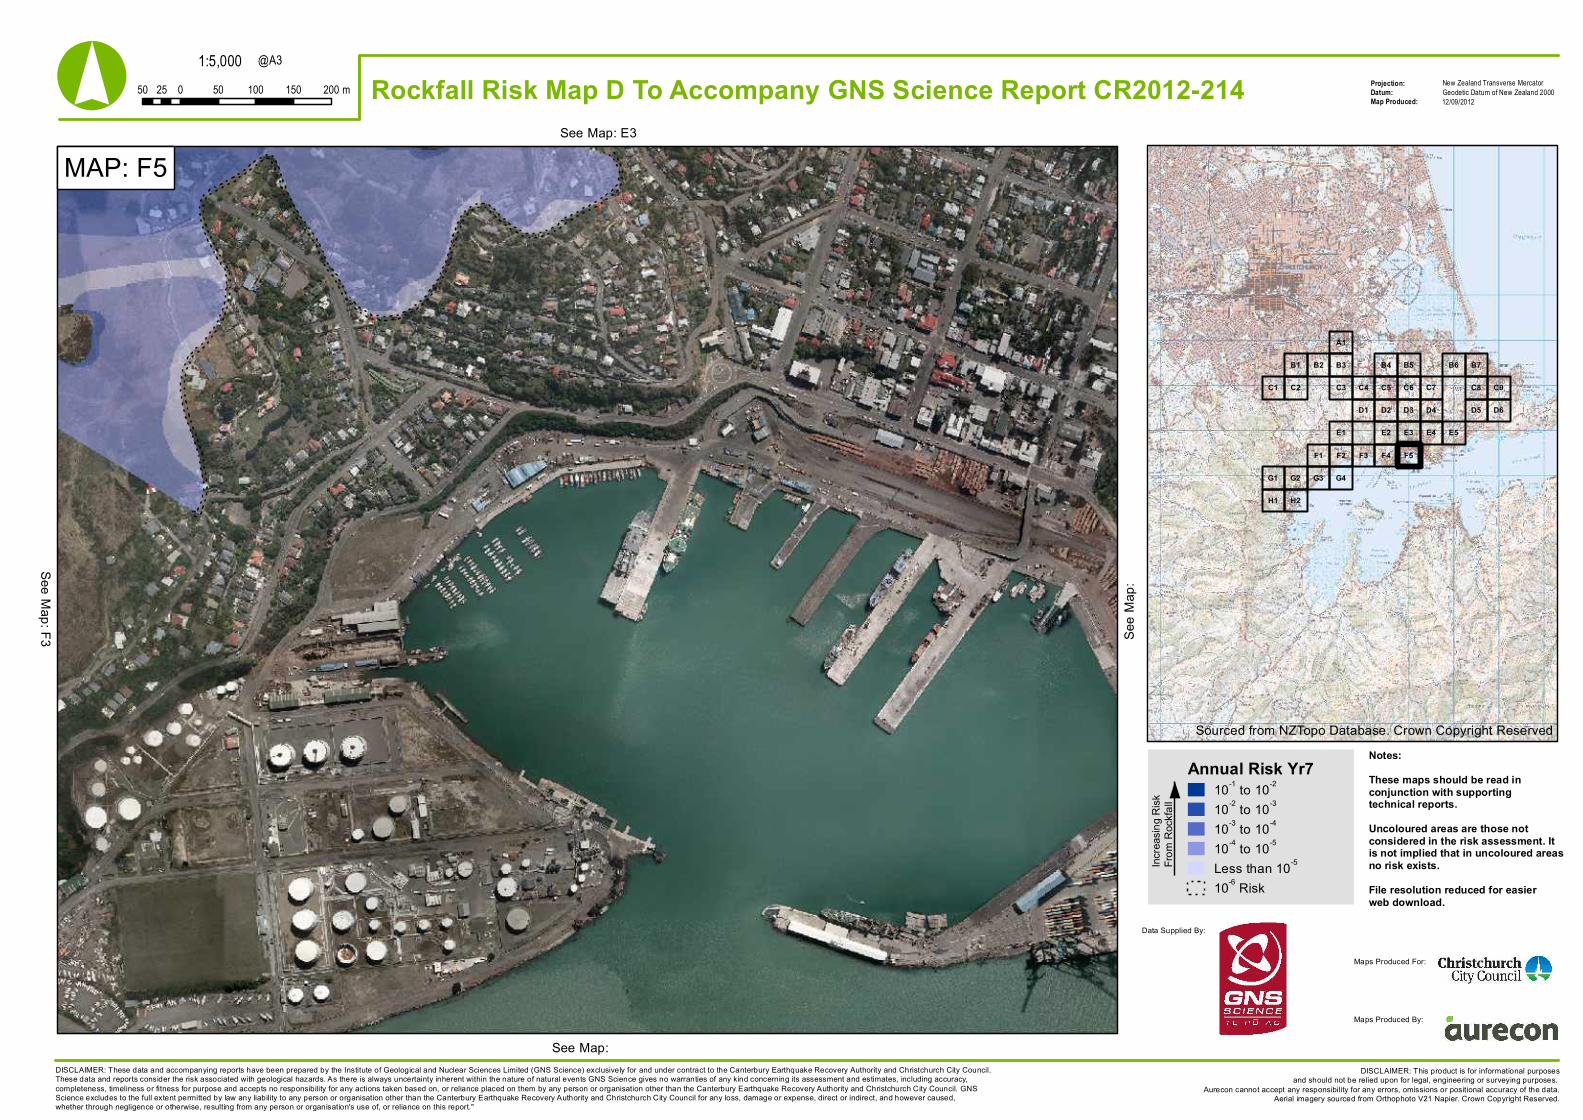
1:5,000Projection:Datum:Map Produced:
New Zealand Transverse MercatorGeodetic Datum of New Zealand 200050 0 50 100 150 20025 m
@A3
DISCLAIMER: This product is for informational purposesand should not be relied upon for legal, engineering or surveying purposes.
Aurecon cannot accept any responsibility for any errors, omissions or positional accuracy of the data.Aerial imagery sourced from Orthophoto V21 Napier. Crown Copyright Reserved.
° Rockfall Risk Map D To Accompany GNS Science Report CR2012-214 12/09/2012
F5F4F3F1 F2
E1 E5E4E3E2
B5 B6 B7
C4 C5 C6 C7 C8 C9
D1 D2 D3 D4 D5 D6
H1
B1
C2
H2
B4B2
C3C1
B3
A1
G1 G2 G3 G4
MAP: F5See Map: E3
See M
ap:
See Map:
See Map: F3
Sourced from NZTopo Database. Crown Copyright Reserved
Annual Risk Yr710-1 to 10-2
10-2 to 10-3
10-3 to 10-4
10-4 to 10-5
Less than 10-5
10-6 Risk
Notes:These maps should be read inconjunction with supportingtechnical reports.Uncoloured areas are those notconsidered in the risk assessment. Itis not implied that in uncoloured areasno risk exists.File resolution reduced for easierweb download.
DISCLAIMER: These data and accompanying reports have been prepared by the Institute of Geological and Nuclear Sciences Limited (GNS Science) exclusively for and under contract to the Canterbury Earthquake Recovery Authority and Christchurch City Council.These data and reports consider the risk associated with geological hazards. As there is always uncertainty inherent within the nature of natural events GNS Science gives no warranties of any kind concerning its assessment and estimates, including accuracy,completeness, timeliness or fitness for purpose and accepts no responsibility for any actions taken based on, or reliance placed on them by any person or organisation other than the Canterbury Earthquake Recovery Authority and Christchurch City Council. GNSScience excludes to the full extent permitted by law any liability to any person or organisation other than the Canterbury Earthquake Recovery Authority and Christchurch City Council for any loss, damage or expense, direct or indirect, and however caused,whether through negligence or otherwise, resulting from any person or organisation's use of, or reliance on this report."
Increa
sing R
iskFro
m Ro
ckfal
l
Data Supplied By:
Maps Produced For:
Maps Produced By:

1:5,000Projection:Datum:Map Produced:
New Zealand Transverse MercatorGeodetic Datum of New Zealand 200050 0 50 100 150 20025 m
@A3
DISCLAIMER: This product is for informational purposesand should not be relied upon for legal, engineering or surveying purposes.
Aurecon cannot accept any responsibility for any errors, omissions or positional accuracy of the data.Aerial imagery sourced from Orthophoto V21 Napier. Crown Copyright Reserved.
° Rockfall Risk Map D To Accompany GNS Science Report CR2012-214 12/09/2012
F5F4F3F1 F2
E1 E5E4E3E2
B5 B6 B7
C4 C5 C6 C7 C8 C9
D1 D2 D3 D4 D5 D6
H1
B1
C2
H2
B4B2
C3C1
B3
A1
G1 G2 G3 G4
MAP: G1See Map:
See M
ap: G
2
See Map: H1
See Map:
Sourced from NZTopo Database. Crown Copyright Reserved
Annual Risk Yr710-1 to 10-2
10-2 to 10-3
10-3 to 10-4
10-4 to 10-5
Less than 10-5
10-6 Risk
Notes:These maps should be read inconjunction with supportingtechnical reports.Uncoloured areas are those notconsidered in the risk assessment. Itis not implied that in uncoloured areasno risk exists.File resolution reduced for easierweb download.
DISCLAIMER: These data and accompanying reports have been prepared by the Institute of Geological and Nuclear Sciences Limited (GNS Science) exclusively for and under contract to the Canterbury Earthquake Recovery Authority and Christchurch City Council.These data and reports consider the risk associated with geological hazards. As there is always uncertainty inherent within the nature of natural events GNS Science gives no warranties of any kind concerning its assessment and estimates, including accuracy,completeness, timeliness or fitness for purpose and accepts no responsibility for any actions taken based on, or reliance placed on them by any person or organisation other than the Canterbury Earthquake Recovery Authority and Christchurch City Council. GNSScience excludes to the full extent permitted by law any liability to any person or organisation other than the Canterbury Earthquake Recovery Authority and Christchurch City Council for any loss, damage or expense, direct or indirect, and however caused,whether through negligence or otherwise, resulting from any person or organisation's use of, or reliance on this report."
Increa
sing R
iskFro
m Ro
ckfal
l
Data Supplied By:
Maps Produced For:
Maps Produced By:
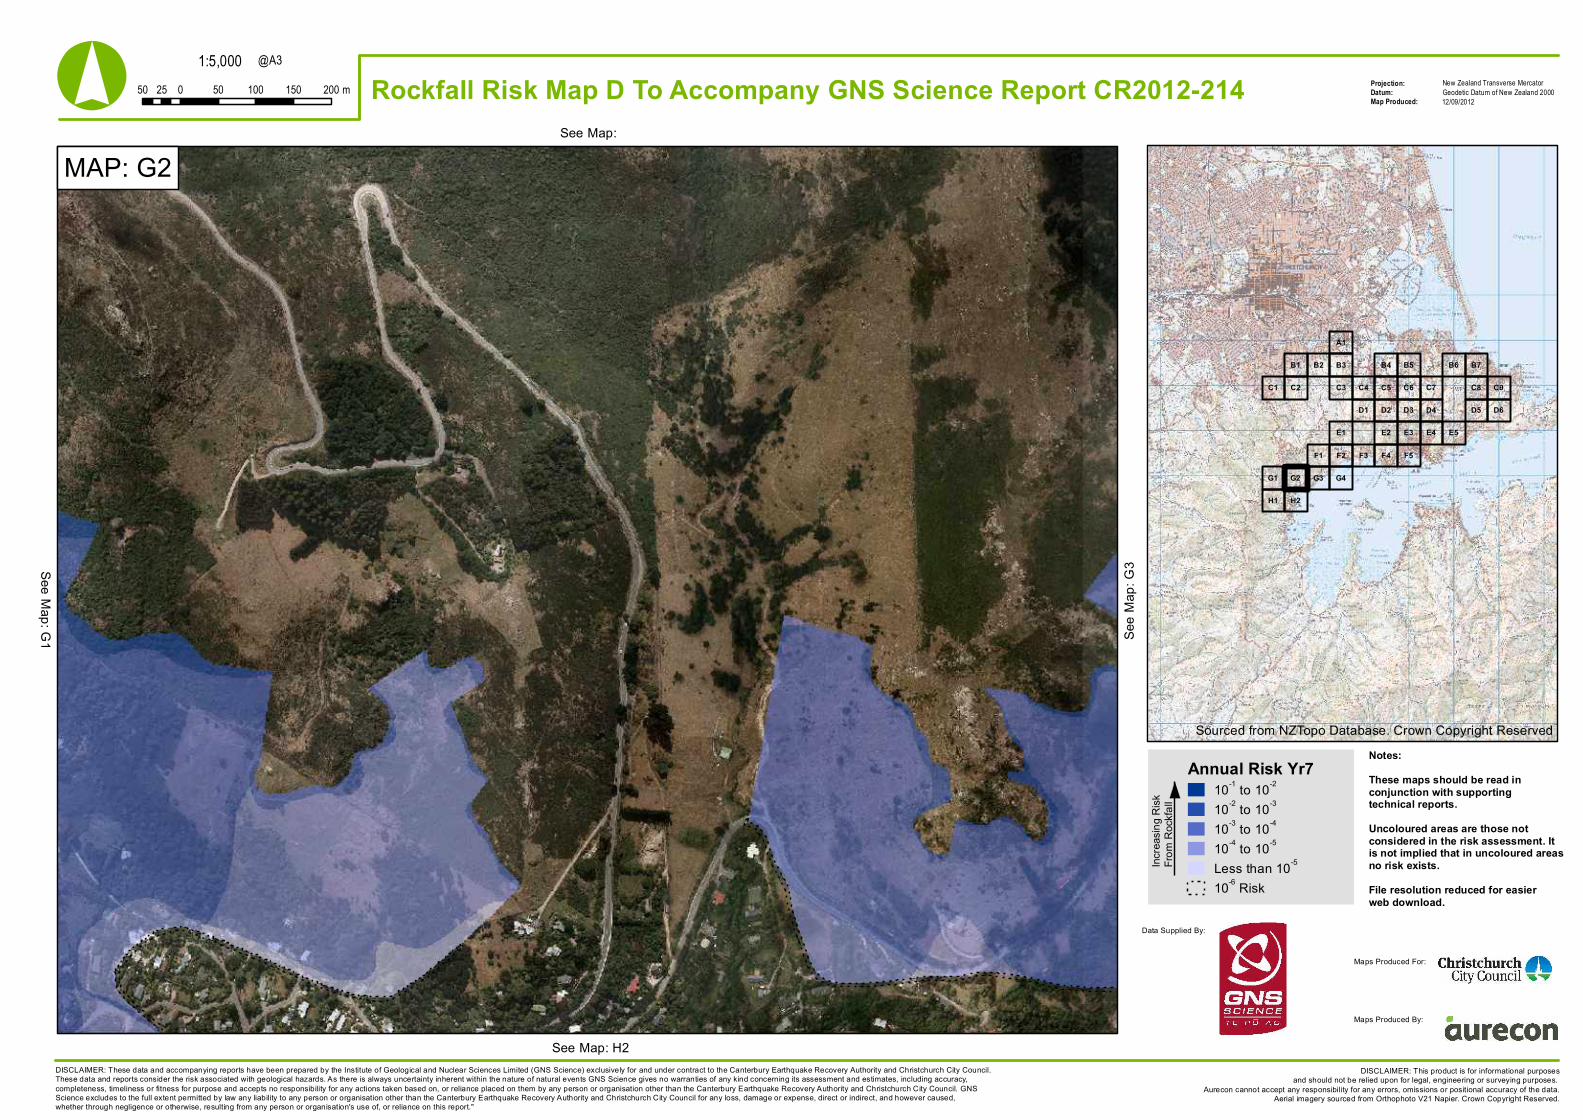
1:5,000Projection:Datum:Map Produced:
New Zealand Transverse MercatorGeodetic Datum of New Zealand 200050 0 50 100 150 20025 m
@A3
DISCLAIMER: This product is for informational purposesand should not be relied upon for legal, engineering or surveying purposes.
Aurecon cannot accept any responsibility for any errors, omissions or positional accuracy of the data.Aerial imagery sourced from Orthophoto V21 Napier. Crown Copyright Reserved.
° Rockfall Risk Map D To Accompany GNS Science Report CR2012-214 12/09/2012
F5F4F3F1 F2
E1 E5E4E3E2
B5 B6 B7
C4 C5 C6 C7 C8 C9
D1 D2 D3 D4 D5 D6
H1
B1
C2
H2
B4B2
C3C1
B3
A1
G1 G2 G3 G4
MAP: G2See Map:
See M
ap: G
3
See Map: H2
See Map: G1
Sourced from NZTopo Database. Crown Copyright Reserved
Annual Risk Yr710-1 to 10-2
10-2 to 10-3
10-3 to 10-4
10-4 to 10-5
Less than 10-5
10-6 Risk
Notes:These maps should be read inconjunction with supportingtechnical reports.Uncoloured areas are those notconsidered in the risk assessment. Itis not implied that in uncoloured areasno risk exists.File resolution reduced for easierweb download.
DISCLAIMER: These data and accompanying reports have been prepared by the Institute of Geological and Nuclear Sciences Limited (GNS Science) exclusively for and under contract to the Canterbury Earthquake Recovery Authority and Christchurch City Council.These data and reports consider the risk associated with geological hazards. As there is always uncertainty inherent within the nature of natural events GNS Science gives no warranties of any kind concerning its assessment and estimates, including accuracy,completeness, timeliness or fitness for purpose and accepts no responsibility for any actions taken based on, or reliance placed on them by any person or organisation other than the Canterbury Earthquake Recovery Authority and Christchurch City Council. GNSScience excludes to the full extent permitted by law any liability to any person or organisation other than the Canterbury Earthquake Recovery Authority and Christchurch City Council for any loss, damage or expense, direct or indirect, and however caused,whether through negligence or otherwise, resulting from any person or organisation's use of, or reliance on this report."
Increa
sing R
iskFro
m Ro
ckfal
l
Data Supplied By:
Maps Produced For:
Maps Produced By:
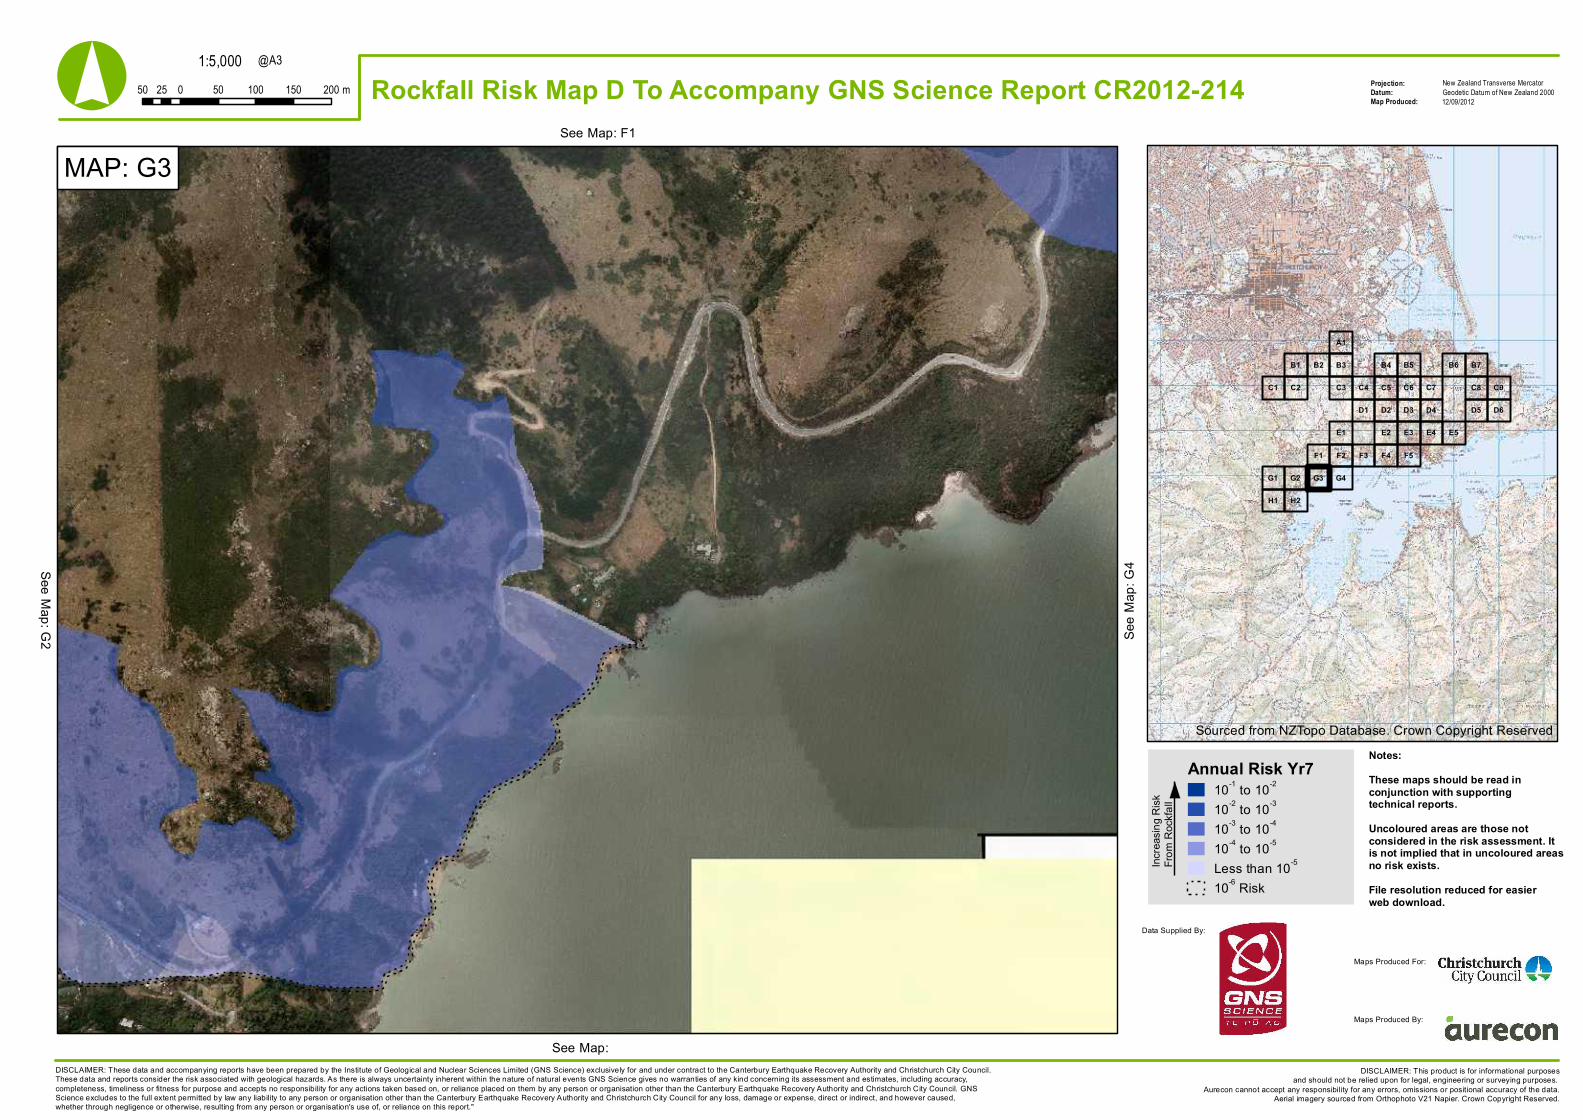
1:5,000Projection:Datum:Map Produced:
New Zealand Transverse MercatorGeodetic Datum of New Zealand 200050 0 50 100 150 20025 m
@A3
DISCLAIMER: This product is for informational purposesand should not be relied upon for legal, engineering or surveying purposes.
Aurecon cannot accept any responsibility for any errors, omissions or positional accuracy of the data.Aerial imagery sourced from Orthophoto V21 Napier. Crown Copyright Reserved.
° Rockfall Risk Map D To Accompany GNS Science Report CR2012-214 12/09/2012
F5F4F3F1 F2
E1 E5E4E3E2
B5 B6 B7
C4 C5 C6 C7 C8 C9
D1 D2 D3 D4 D5 D6
H1
B1
C2
H2
B4B2
C3C1
B3
A1
G1 G2 G3 G4
MAP: G3See Map: F1
See M
ap: G
4
See Map:
See Map: G2
Sourced from NZTopo Database. Crown Copyright Reserved
Annual Risk Yr710-1 to 10-2
10-2 to 10-3
10-3 to 10-4
10-4 to 10-5
Less than 10-5
10-6 Risk
Notes:These maps should be read inconjunction with supportingtechnical reports.Uncoloured areas are those notconsidered in the risk assessment. Itis not implied that in uncoloured areasno risk exists.File resolution reduced for easierweb download.
DISCLAIMER: These data and accompanying reports have been prepared by the Institute of Geological and Nuclear Sciences Limited (GNS Science) exclusively for and under contract to the Canterbury Earthquake Recovery Authority and Christchurch City Council.These data and reports consider the risk associated with geological hazards. As there is always uncertainty inherent within the nature of natural events GNS Science gives no warranties of any kind concerning its assessment and estimates, including accuracy,completeness, timeliness or fitness for purpose and accepts no responsibility for any actions taken based on, or reliance placed on them by any person or organisation other than the Canterbury Earthquake Recovery Authority and Christchurch City Council. GNSScience excludes to the full extent permitted by law any liability to any person or organisation other than the Canterbury Earthquake Recovery Authority and Christchurch City Council for any loss, damage or expense, direct or indirect, and however caused,whether through negligence or otherwise, resulting from any person or organisation's use of, or reliance on this report."
Increa
sing R
iskFro
m Ro
ckfal
l
Data Supplied By:
Maps Produced For:
Maps Produced By:
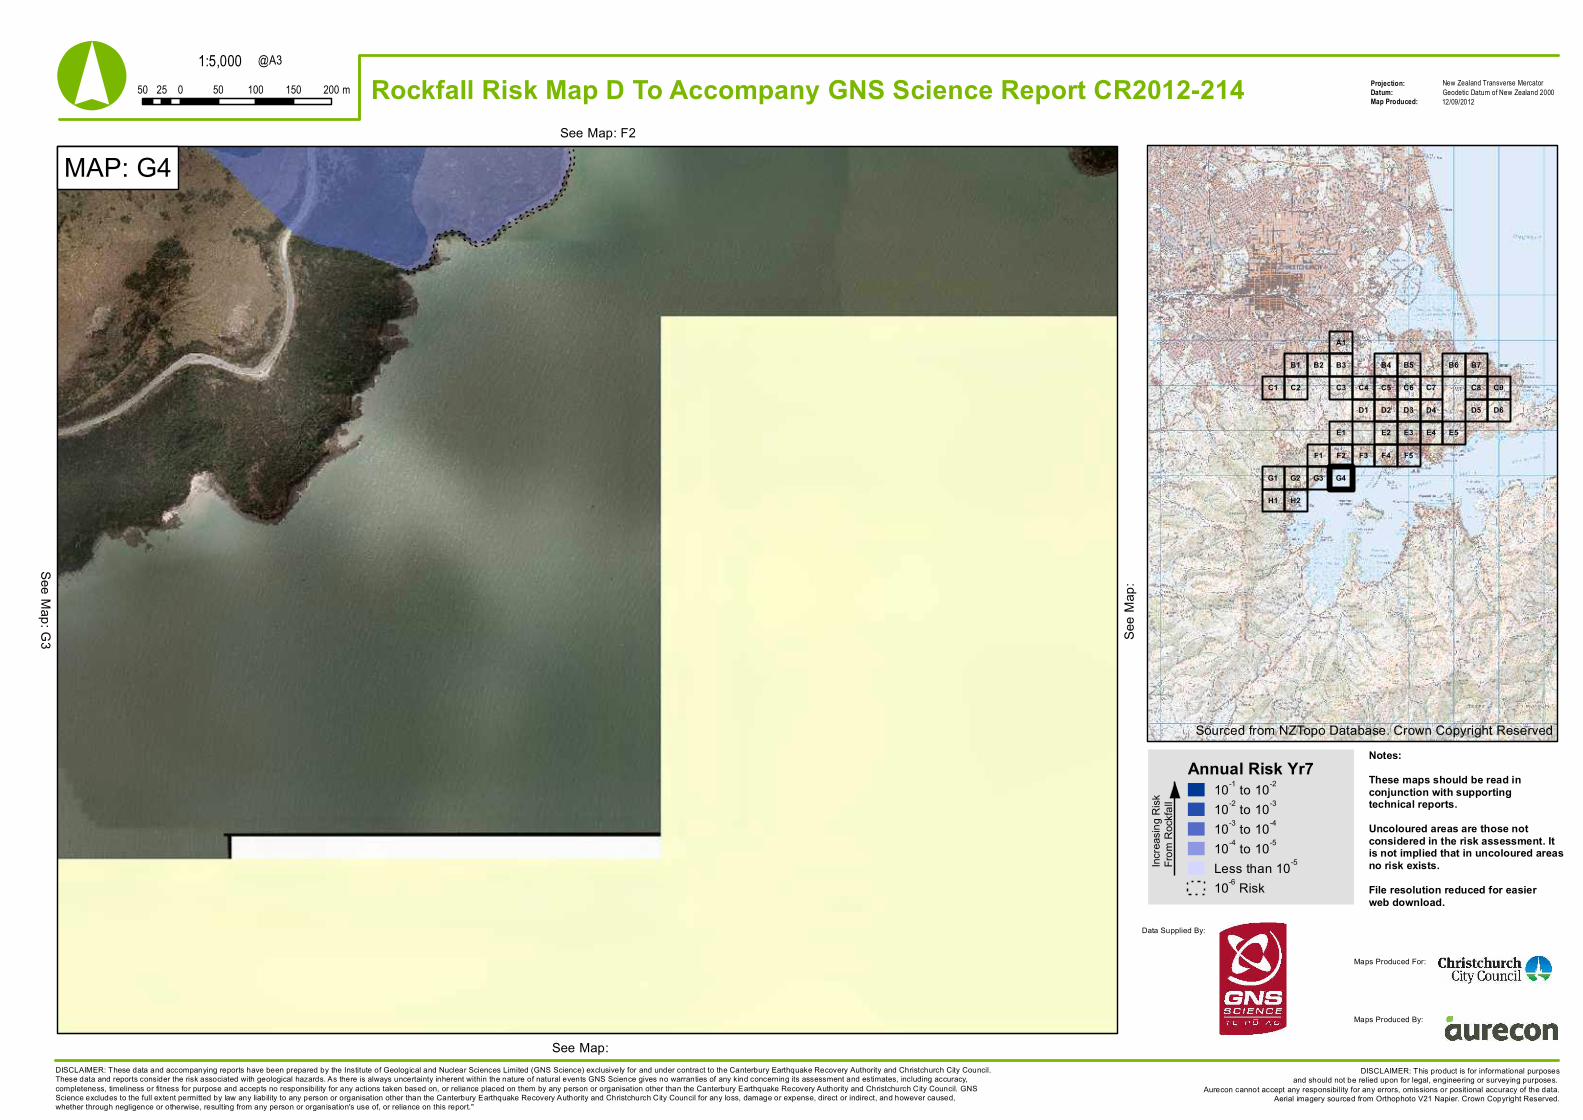
1:5,000Projection:Datum:Map Produced:
New Zealand Transverse MercatorGeodetic Datum of New Zealand 200050 0 50 100 150 20025 m
@A3
DISCLAIMER: This product is for informational purposesand should not be relied upon for legal, engineering or surveying purposes.
Aurecon cannot accept any responsibility for any errors, omissions or positional accuracy of the data.Aerial imagery sourced from Orthophoto V21 Napier. Crown Copyright Reserved.
° Rockfall Risk Map D To Accompany GNS Science Report CR2012-214 12/09/2012
F5F4F3F1 F2
E1 E5E4E3E2
B5 B6 B7
C4 C5 C6 C7 C8 C9
D1 D2 D3 D4 D5 D6
H1
B1
C2
H2
B4B2
C3C1
B3
A1
G1 G2 G3 G4
MAP: G4See Map: F2
See M
ap:
See Map:
See Map: G3
Sourced from NZTopo Database. Crown Copyright Reserved
Annual Risk Yr710-1 to 10-2
10-2 to 10-3
10-3 to 10-4
10-4 to 10-5
Less than 10-5
10-6 Risk
Notes:These maps should be read inconjunction with supportingtechnical reports.Uncoloured areas are those notconsidered in the risk assessment. Itis not implied that in uncoloured areasno risk exists.File resolution reduced for easierweb download.
DISCLAIMER: These data and accompanying reports have been prepared by the Institute of Geological and Nuclear Sciences Limited (GNS Science) exclusively for and under contract to the Canterbury Earthquake Recovery Authority and Christchurch City Council.These data and reports consider the risk associated with geological hazards. As there is always uncertainty inherent within the nature of natural events GNS Science gives no warranties of any kind concerning its assessment and estimates, including accuracy,completeness, timeliness or fitness for purpose and accepts no responsibility for any actions taken based on, or reliance placed on them by any person or organisation other than the Canterbury Earthquake Recovery Authority and Christchurch City Council. GNSScience excludes to the full extent permitted by law any liability to any person or organisation other than the Canterbury Earthquake Recovery Authority and Christchurch City Council for any loss, damage or expense, direct or indirect, and however caused,whether through negligence or otherwise, resulting from any person or organisation's use of, or reliance on this report."
Increa
sing R
iskFro
m Ro
ckfal
l
Data Supplied By:
Maps Produced For:
Maps Produced By:
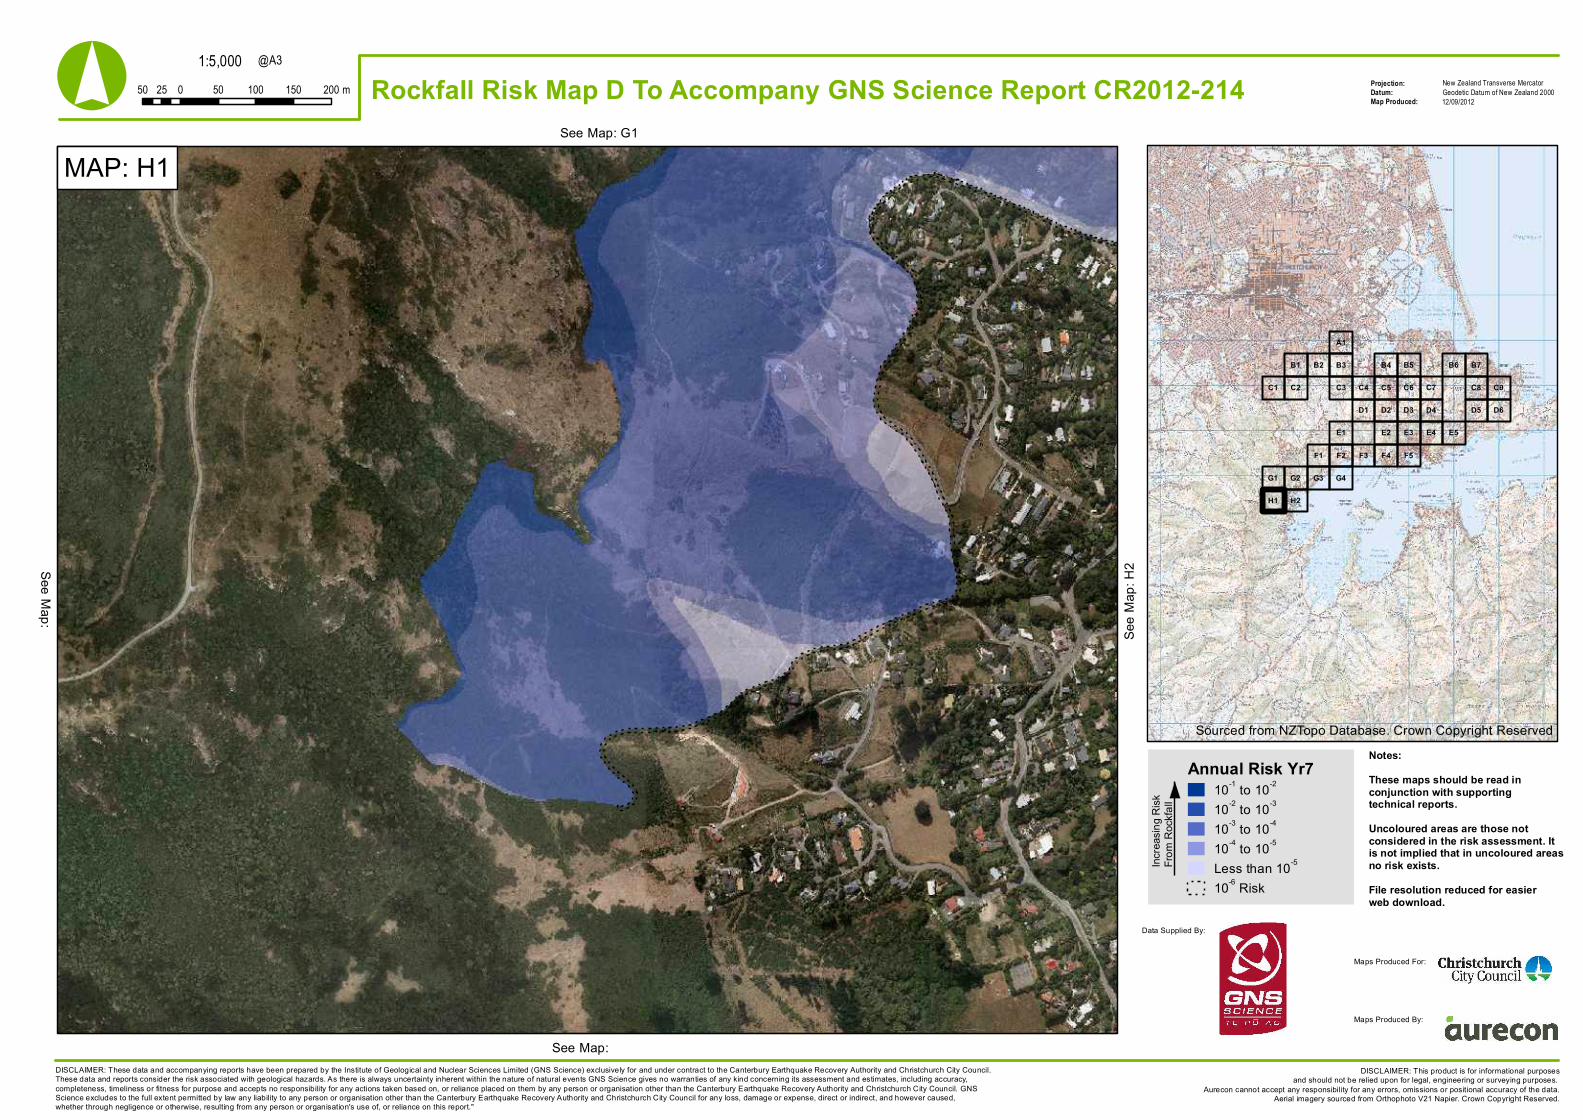
1:5,000Projection:Datum:Map Produced:
New Zealand Transverse MercatorGeodetic Datum of New Zealand 200050 0 50 100 150 20025 m
@A3
DISCLAIMER: This product is for informational purposesand should not be relied upon for legal, engineering or surveying purposes.
Aurecon cannot accept any responsibility for any errors, omissions or positional accuracy of the data.Aerial imagery sourced from Orthophoto V21 Napier. Crown Copyright Reserved.
° Rockfall Risk Map D To Accompany GNS Science Report CR2012-214 12/09/2012
F5F4F3F1 F2
E1 E5E4E3E2
B5 B6 B7
C4 C5 C6 C7 C8 C9
D1 D2 D3 D4 D5 D6
H1
B1
C2
H2
B4B2
C3C1
B3
A1
G1 G2 G3 G4
MAP: H1See Map: G1
See M
ap: H
2
See Map:
See Map:
Sourced from NZTopo Database. Crown Copyright Reserved
Annual Risk Yr710-1 to 10-2
10-2 to 10-3
10-3 to 10-4
10-4 to 10-5
Less than 10-5
10-6 Risk
Notes:These maps should be read inconjunction with supportingtechnical reports.Uncoloured areas are those notconsidered in the risk assessment. Itis not implied that in uncoloured areasno risk exists.File resolution reduced for easierweb download.
DISCLAIMER: These data and accompanying reports have been prepared by the Institute of Geological and Nuclear Sciences Limited (GNS Science) exclusively for and under contract to the Canterbury Earthquake Recovery Authority and Christchurch City Council.These data and reports consider the risk associated with geological hazards. As there is always uncertainty inherent within the nature of natural events GNS Science gives no warranties of any kind concerning its assessment and estimates, including accuracy,completeness, timeliness or fitness for purpose and accepts no responsibility for any actions taken based on, or reliance placed on them by any person or organisation other than the Canterbury Earthquake Recovery Authority and Christchurch City Council. GNSScience excludes to the full extent permitted by law any liability to any person or organisation other than the Canterbury Earthquake Recovery Authority and Christchurch City Council for any loss, damage or expense, direct or indirect, and however caused,whether through negligence or otherwise, resulting from any person or organisation's use of, or reliance on this report."
Increa
sing R
iskFro
m Ro
ckfal
l
Data Supplied By:
Maps Produced For:
Maps Produced By:
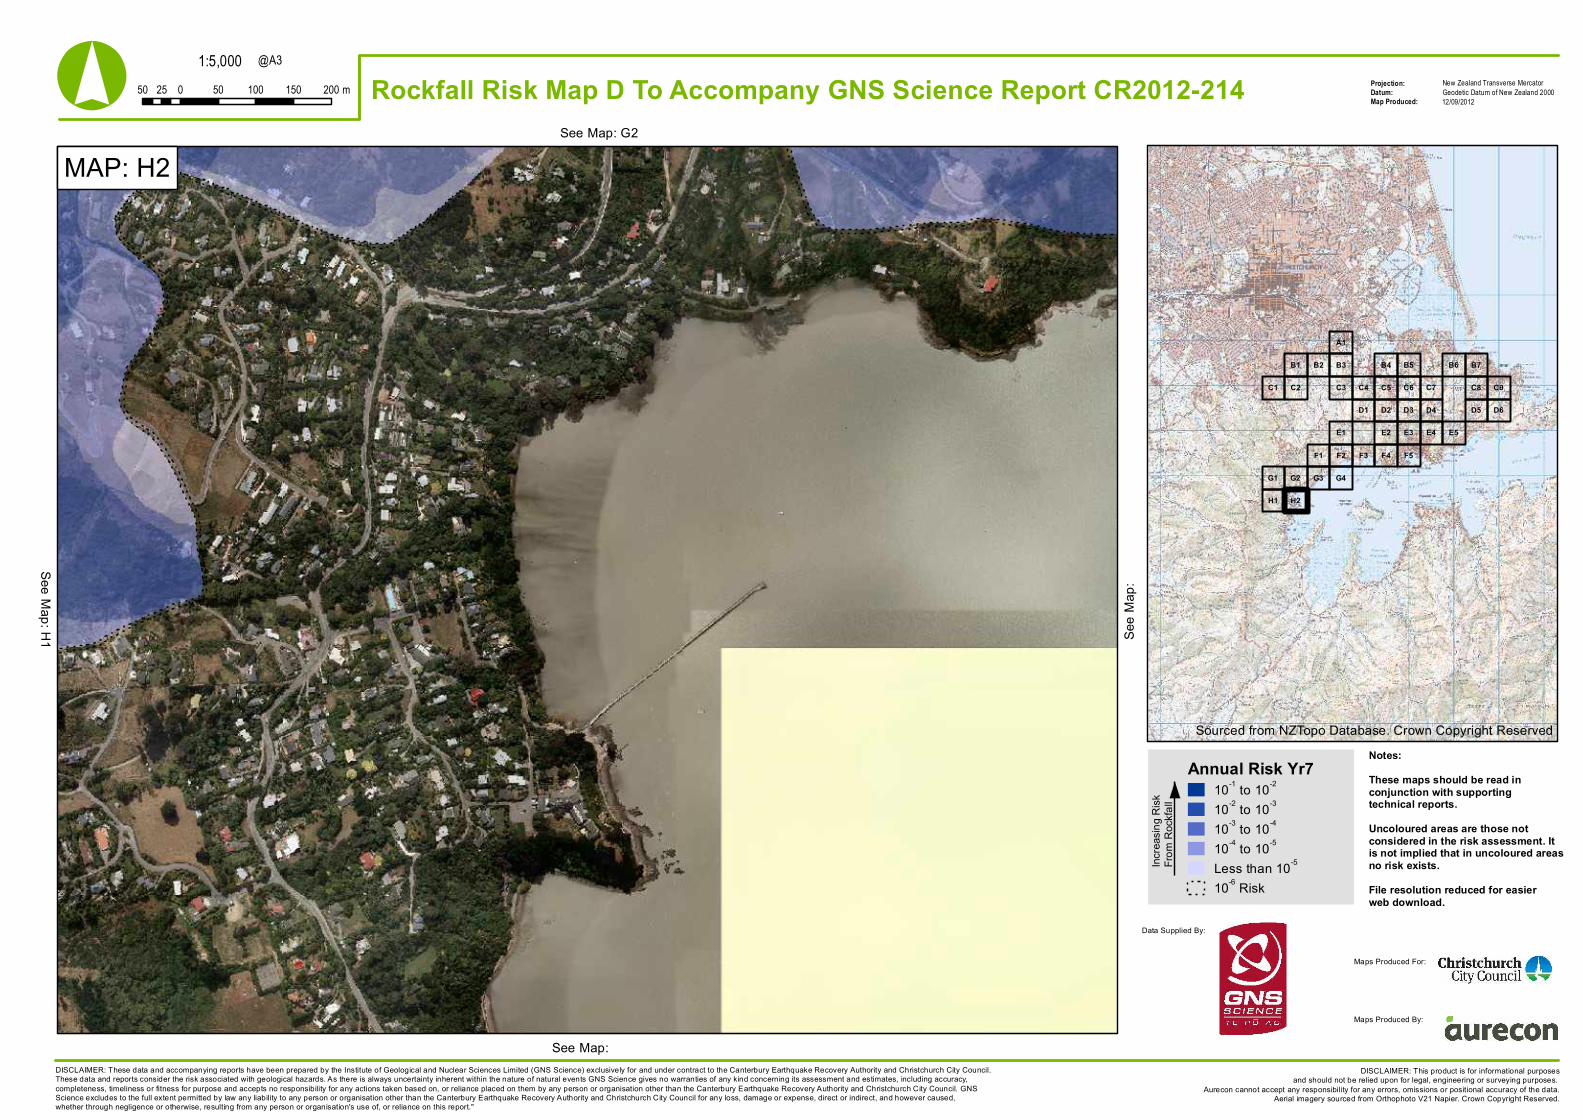
1:5,000Projection:Datum:Map Produced:
New Zealand Transverse MercatorGeodetic Datum of New Zealand 200050 0 50 100 150 20025 m
@A3
DISCLAIMER: This product is for informational purposesand should not be relied upon for legal, engineering or surveying purposes.
Aurecon cannot accept any responsibility for any errors, omissions or positional accuracy of the data.Aerial imagery sourced from Orthophoto V21 Napier. Crown Copyright Reserved.
° Rockfall Risk Map D To Accompany GNS Science Report CR2012-214 12/09/2012
F5F4F3F1 F2
E1 E5E4E3E2
B5 B6 B7
C4 C5 C6 C7 C8 C9
D1 D2 D3 D4 D5 D6
H1
B1
C2
H2
B4B2
C3C1
B3
A1
G1 G2 G3 G4
MAP: H2See Map: G2
See M
ap:
See Map:
See Map: H1
Sourced from NZTopo Database. Crown Copyright Reserved
Annual Risk Yr710-1 to 10-2
10-2 to 10-3
10-3 to 10-4
10-4 to 10-5
Less than 10-5
10-6 Risk
Notes:These maps should be read inconjunction with supportingtechnical reports.Uncoloured areas are those notconsidered in the risk assessment. Itis not implied that in uncoloured areasno risk exists.File resolution reduced for easierweb download.
DISCLAIMER: These data and accompanying reports have been prepared by the Institute of Geological and Nuclear Sciences Limited (GNS Science) exclusively for and under contract to the Canterbury Earthquake Recovery Authority and Christchurch City Council.These data and reports consider the risk associated with geological hazards. As there is always uncertainty inherent within the nature of natural events GNS Science gives no warranties of any kind concerning its assessment and estimates, including accuracy,completeness, timeliness or fitness for purpose and accepts no responsibility for any actions taken based on, or reliance placed on them by any person or organisation other than the Canterbury Earthquake Recovery Authority and Christchurch City Council. GNSScience excludes to the full extent permitted by law any liability to any person or organisation other than the Canterbury Earthquake Recovery Authority and Christchurch City Council for any loss, damage or expense, direct or indirect, and however caused,whether through negligence or otherwise, resulting from any person or organisation's use of, or reliance on this report."
Increa
sing R
iskFro
m Ro
ckfal
l
Data Supplied By:
Maps Produced For:
Maps Produced By: