Embed Size (px)
Citation preview

A1: Title and Approval Sheet
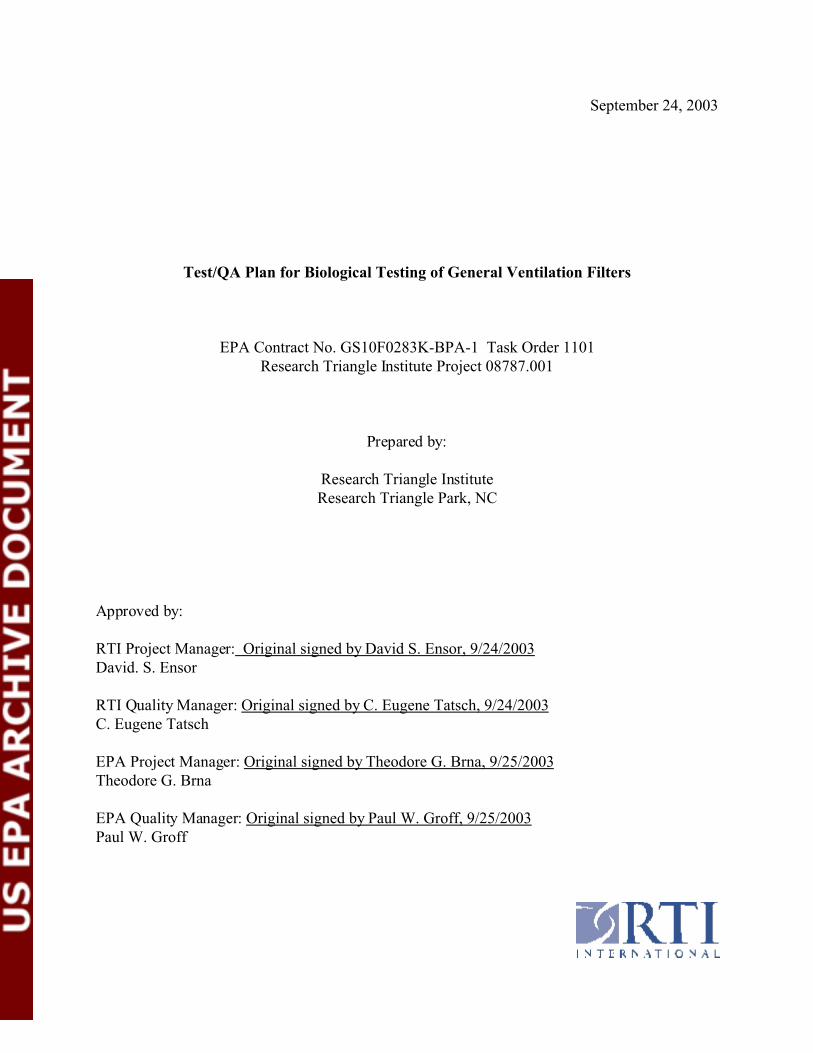
September 24, 2003
Test/QA Plan for Biological Testing of General Ventilation Filters
EPA Contract No. GS10F0283K-BPA-1 Task Order 1101 Research Triangle Institute Project 08787.001
Prepared by:
Research Triangle Institute Research Triangle Park, NC
Approved by:
RTI Project Manager: Original signed by David S. Ensor, 9/24/2003 David. S. Ensor
RTI Quality Manager: Original signed by C. Eugene Tatsch, 9/24/2003 C. Eugene Tatsch
EPA Project Manager: Original signed by Theodore G. Brna, 9/25/2003 Theodore G. Brna
EPA Quality Manager: Original signed by Paul W. Groff, 9/25/2003 Paul W. Groff
Research Triangle Institute
ETV Test/Quality Assurance Plan
Biological Testing of General Ventilation Filters Page ii
This page left intentionally blank.
A2: Table of Contents
Research Triangle Institute
ETV Test/Quality Assurance Plan
Biological Testing of General Ventilation Filters Page iii
TABLE OF CONTENTS
A1: Title and Approval Sheet . . . . . . . . . . . . . . . . . . . . . . . . . . . . . . . . . . . . . . . . . . . . . . . . . . . . i
A2: Table of Contents . . . . . . . . . . . . . . . . . . . . . . . . . . . . . . . . . . . . . . . . . . . . . . . . . . . . . . . . . iii
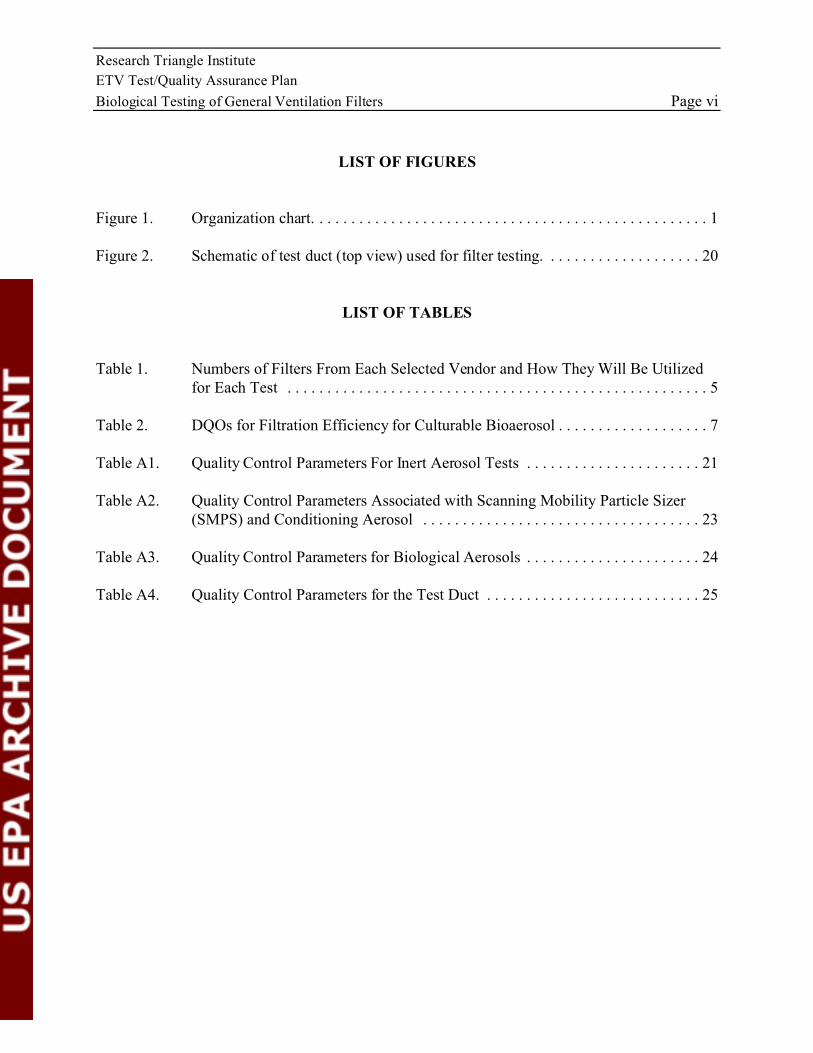
List of Figures . . . . . . . . . . . . . . . . . . . . . . . . . . . . . . . . . . . . . . . . . . . . . . . . . . . . . . . . . . . . . . . vi
List of Tables . . . . . . . . . . . . . . . . . . . . . . . . . . . . . . . . . . . . . . . . . . . . . . . . . . . . . . . . . . . . . . . . vi
A3: Distribution List . . . . . . . . . . . . . . . . . . . . . . . . . . . . . . . . . . . . . . . . . . . . . . . . . . . . . . . . . vii
List of Acronyms/Abbreviations/Definitions . . . . . . . . . . . . . . . . . . . . . . . . . . . . . . . . . . . . . . . viii
SECTION A: PROJECT MANAGEMENT . . . . . . . . . . . . . . . . . . . . . . . . . . . . . . . . . . . . . . . . . 1
A4: Project/Task Organization . . . . . . . . . . . . . . . . . . . . . . . . . . . . . . . . . . . . . . . . . . . . . . . . . . . 1 A4.1: Management Responsibilities . . . . . . . . . . . . . . . . . . . . . . . . . . . . . . . . . . . . . . . . . 1
A4.1.2: RTI Project Manager . . . . . . . . . . . . . . . . . . . . . . . . . . . . . . . . . . . . . . . . 2 A4.1.3: RTI Task Leader . . . . . . . . . . . . . . . . . . . . . . . . . . . . . . . . . . . . . . . . . . . 2
A4.2: Quality Assurance Responsibilities . . . . . . . . . . . . . . . . . . . . . . . . . . . . . . . . . . . . 2 A4.2.1: EPA Quality Manager . . . . . . . . . . . . . . . . . . . . . . . . . . . . . . . . . . . . . . . 2 A4.2.2: RTI Quality Manager . . . . . . . . . . . . . . . . . . . . . . . . . . . . . . . . . . . . . . . . 3
A5: Problem Definition/Background Information . . . . . . . . . . . . . . . . . . . . . . . . . . . . . . . . . . . . 3
A6: Task Description and Schedule . . . . . . . . . . . . . . . . . . . . . . . . . . . . . . . . . . . . . . . . . . . . . . . 4 A6.1: Task Description . . . . . . . . . . . . . . . . . . . . . . . . . . . . . . . . . . . . . . . . . . . . . . . . . . . 4
A6.1.1: Identification and Acquisition of General Ventilation Filters . . . . . . . . . 5 A6.1.2: Performance of ASHRAE Standard 52.2 Test . . . . . . . . . . . . . . . . . . . . . 5 A6.1.3: Performance of Culturable Bioaerosol Testing . . . . . . . . . . . . . . . . . . . . 5 A6.1.4: Preparation of Report . . . . . . . . . . . . . . . . . . . . . . . . . . . . . . . . . . . . . . . . 5
A6.2: Schedule . . . . . . . . . . . . . . . . . . . . . . . . . . . . . . . . . . . . . . . . . . . . . . . . . . . . . . . . . 6
A7: Data Quality Objectives and Criteria for Measurement Data . . . . . . . . . . . . . . . . . . . . . . . . 6
A8: Special Training Requirements/Certification . . . . . . . . . . . . . . . . . . . . . . . . . . . . . . . . . . . . . 6
A9: Documentation and Records . . . . . . . . . . . . . . . . . . . . . . . . . . . . . . . . . . . . . . . . . . . . . . . . . 7 A9.1: Laboratory Documentation . . . . . . . . . . . . . . . . . . . . . . . . . . . . . . . . . . . . . . . . . . . 7
A9.1.1: Inert Aerosol Test . . . . . . . . . . . . . . . . . . . . . . . . . . . . . . . . . . . . . . . . . . . 7
Research Triangle Institute
ETV Test/Quality Assurance Plan
Biological Testing of General Ventilation Filters Page iv
A9.1.2: Bioaerosol Tests . . . . . . . . . . . . . . . . . . . . . . . . . . . . . . . . . . . . . . . . . . . . 7 A9.2: QA Reports . . . . . . . . . . . . . . . . . . . . . . . . . . . . . . . . . . . . . . . . . . . . . . . . . . . . . . . 8 A9.3: Reporting . . . . . . . . . . . . . . . . . . . . . . . . . . . . . . . . . . . . . . . . . . . . . . . . . . . . . . . . . 8 A9.4: Verification Reports and Verification Statements . . . . . . . . . . . . . . . . . . . . . . . . . 8
SECTION B: MEASUREMENT/DATA ACQUISITION . . . . . . . . . . . . . . . . . . . . . . . . . . . . . 9
B1: Test Design . . . . . . . . . . . . . . . . . . . . . . . . . . . . . . . . . . . . . . . . . . . . . . . . . . . . . . . . . . . . . . . 9 B1.1: Inert Testing . . . . . . . . . . . . . . . . . . . . . . . . . . . . . . . . . . . . . . . . . . . . . . . . . . . . . . 9
B1.1.1: Particle Counters . . . . . . . . . . . . . . . . . . . . . . . . . . . . . . . . . . . . . . . . . . . 9 B1.1.2: Inert Aerosol Generation . . . . . . . . . . . . . . . . . . . . . . . . . . . . . . . . . . . . 10B1.1.3: Inert Conditioning Procedure . . . . . . . . . . . . . . . . . . . . . . . . . . . . . . . . . 10
B1.2: Culturable Bioaerosol Testing . . . . . . . . . . . . . . . . . . . . . . . . . . . . . . . . . . . . . . . . 10B1.2.1: Test Organisms . . . . . . . . . . . . . . . . . . . . . . . . . . . . . . . . . . . . . . . . . . . . 11B1.2.2: Bioaerosol Preparation and Generation . . . . . . . . . . . . . . . . . . . . . . . . . 11
B2: Sampling Methods Requirements . . . . . . . . . . . . . . . . . . . . . . . . . . . . . . . . . . . . . . . . . . . . 12
B3: Sample Handling and Custody Requirements . . . . . . . . . . . . . . . . . . . . . . . . . . . . . . . . . . . 13
B4: Analytical Methods Requirements . . . . . . . . . . . . . . . . . . . . . . . . . . . . . . . . . . . . . . . . . . . . 13
B5: Quality Control Requirements . . . . . . . . . . . . . . . . . . . . . . . . . . . . . . . . . . . . . . . . . . . . . . . 13
B6: Instrument/Equipment Testing, Inspection, and Maintenance Requirements . . . . . . . . . . . 13
B7: Instrument Calibration and Frequency . . . . . . . . . . . . . . . . . . . . . . . . . . . . . . . . . . . . . . . . . 13
B8: Inspection/Acceptance Requirements for Supplies and Consumables . . . . . . . . . . . . . . . . . 13
B9: Data Acquisition Requirements (Non-direct measurements) . . . . . . . . . . . . . . . . . . . . . . . . 14
B10: Data Management . . . . . . . . . . . . . . . . . . . . . . . . . . . . . . . . . . . . . . . . . . . . . . . . . . . . . . . 14B10.1: Data Recording . . . . . . . . . . . . . . . . . . . . . . . . . . . . . . . . . . . . . . . . . . . . . . . . . . 14B10.2: Data Analysis . . . . . . . . . . . . . . . . . . . . . . . . . . . . . . . . . . . . . . . . . . . . . . . . . . . 14
B10.2.1: Inert Aerosol Data . . . . . . . . . . . . . . . . . . . . . . . . . . . . . . . . . . . . . . . . 14B10.2.2: Bioaerosol Data . . . . . . . . . . . . . . . . . . . . . . . . . . . . . . . . . . . . . . . . . . 15
B10.3: Data Storage and Retrieval . . . . . . . . . . . . . . . . . . . . . . . . . . . . . . . . . . . . . . . . . 16
SECTION C: ASSESSMENT/OVERSIGHT . . . . . . . . . . . . . . . . . . . . . . . . . . . . . . . . . . . . . . . 17
C1: Assessments and Response Actions . . . . . . . . . . . . . . . . . . . . . . . . . . . . . . . . . . . . . . . . . . . 17C1.1: Audits . . . . . . . . . . . . . . . . . . . . . . . . . . . . . . . . . . . . . . . . . . . . . . . . . . . . . . . . . . 17
Research Triangle Institute
ETV Test/Quality Assurance Plan
Biological Testing of General Ventilation Filters Page v
C1.2: Corrective Actions . . . . . . . . . . . . . . . . . . . . . . . . . . . . . . . . . . . . . . . . . . . . . . . . 17
C2: Reports to Management . . . . . . . . . . . . . . . . . . . . . . . . . . . . . . . . . . . . . . . . . . . . . . . . . . . . 17
SECTION D: DATA VALIDATION AND USABILITY . . . . . . . . . . . . . . . . . . . . . . . . . . . . . 18
D1: Data Review, Validation, and Verification Requirements . . . . . . . . . . . . . . . . . . . . . . . . . . 18
D2: Validation and Verification Methods . . . . . . . . . . . . . . . . . . . . . . . . . . . . . . . . . . . . . . . . . . 18
D3: Reconciliation with Data Quality Objectives . . . . . . . . . . . . . . . . . . . . . . . . . . . . . . . . . . . . 18
References . . . . . . . . . . . . . . . . . . . . . . . . . . . . . . . . . . . . . . . . . . . . . . . . . . . . . . . . . . . . . . . . . . 19
Appendix A: Test Specifications . . . . . . . . . . . . . . . . . . . . . . . . . . . . . . . . . . . . . . . . . . . . . . . . 20
Appendix B: Inert Aerosol Run Sheet . . . . . . . . . . . . . . . . . . . . . . . . . . . . . . . . . . . . . . . . . . . . 26
Appendix C: Bioaerosol Run Sheet . . . . . . . . . . . . . . . . . . . . . . . . . . . . . . . . . . . . . . . . . . . . . . 28
List of Figures
List of Tables
Research Triangle Institute
ETV Test/Quality Assurance Plan
Biological Testing of General Ventilation Filters Page vi
LIST OF FIGURES
Figure 1. Organization chart. . . . . . . . . . . . . . . . . . . . . . . . . . . . . . . . . . . . . . . . . . . . . . . . . . 1
Figure 2. Schematic of test duct (top view) used for filter testing. . . . . . . . . . . . . . . . . . . . 20
LIST OF TABLES
Table 1. Numbers of Filters From Each Selected Vendor and How They Will Be Utilizedfor Each Test . . . . . . . . . . . . . . . . . . . . . . . . . . . . . . . . . . . . . . . . . . . . . . . . . . . . . 5
Table 2. DQOs for Filtration Efficiency for Culturable Bioaerosol . . . . . . . . . . . . . . . . . . . 7
Table A1. Quality Control Parameters For Inert Aerosol Tests . . . . . . . . . . . . . . . . . . . . . . 21
Table A2. Quality Control Parameters Associated with Scanning Mobility Particle Sizer(SMPS) and Conditioning Aerosol . . . . . . . . . . . . . . . . . . . . . . . . . . . . . . . . . . . 23
Table A3. Quality Control Parameters for Biological Aerosols . . . . . . . . . . . . . . . . . . . . . . 24
Table A4. Quality Control Parameters for the Test Duct . . . . . . . . . . . . . . . . . . . . . . . . . . . 25
Research Triangle Institute
ETV Test/Quality Assurance Plan
Biological Testing of General Ventilation Filters Page vii
A3: Distribution List
EPA Dr. Theodore Brna
Research Triangle Institute Ms. Karin Foarde Mr. Michael Herman Mr. James Hanley Ms. Kathleen Owen Ms. Tricia Webber Dr. David Ensor Ms. Deborah Franke Dr. C. E. Tatsch Ms. Elizabeth Rodes Mr. Clint Clayton Mr. Barry Saunders
Research Triangle Institute
ETV Test/Quality Assurance Plan
Biological Testing of General Ventilation Filters Page viii
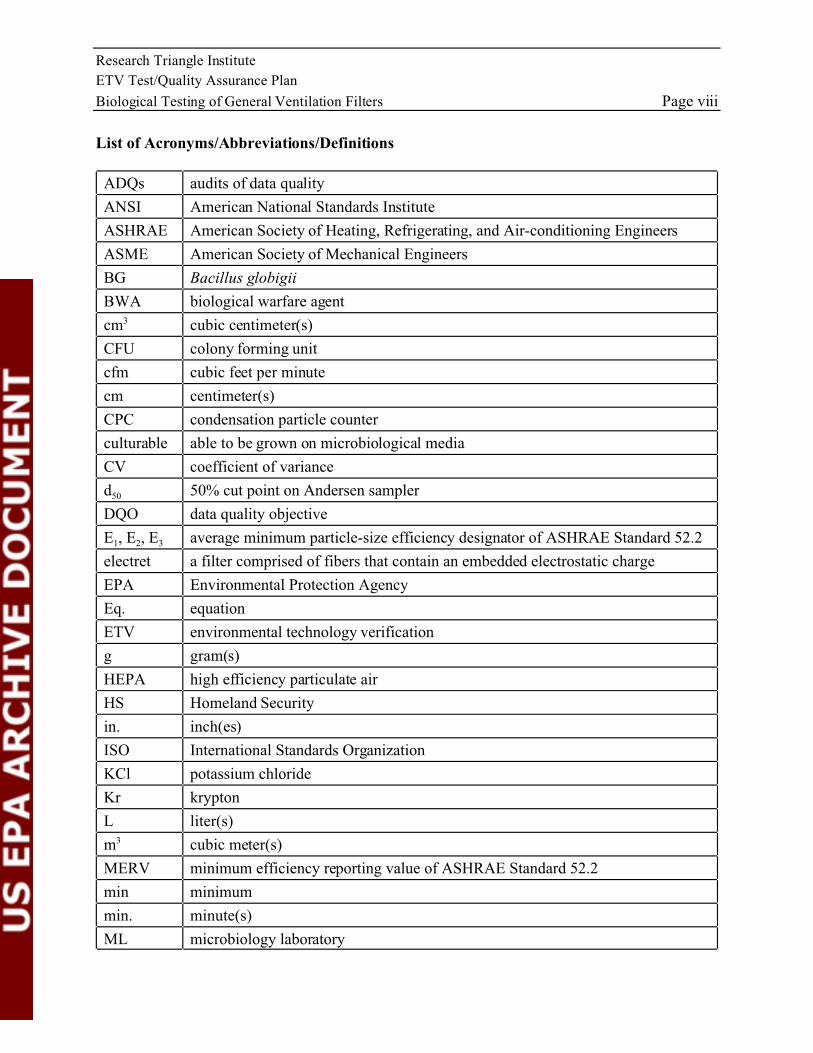
List of Acronyms/Abbreviations/Definitions
ADQs audits of data quality
ANSI American National Standards Institute
ASHRAE American Society of Heating, Refrigerating, and Air-conditioning Engineers
ASME American Society of Mechanical Engineers
BG Bacillus globigii
BWA biological warfare agent
cm3 cubic centimeter(s)
CFU colony forming unit
cfm cubic feet per minute
cm centimeter(s)
CPC condensation particle counter
culturable able to be grown on microbiological media
CV coefficient of variance
d50 50% cut point on Andersen sampler
DQO data quality objective
E1, E2, E3 average minimum particle-size efficiency designator of ASHRAE Standard 52.2
electret a filter comprised of fibers that contain an embedded electrostatic charge
EPA Environmental Protection Agency
Eq. equation
ETV environmental technology verification
g gram(s)
HEPA high efficiency particulate air
HS Homeland Security
in. inch(es)
ISO International Standards Organization
KCl potassium chloride
Kr krypton
L liter(s)
m3 cubic meter(s)
MERV minimum efficiency reporting value of ASHRAE Standard 52.2
min minimum
min. minute(s)
ML microbiology laboratory
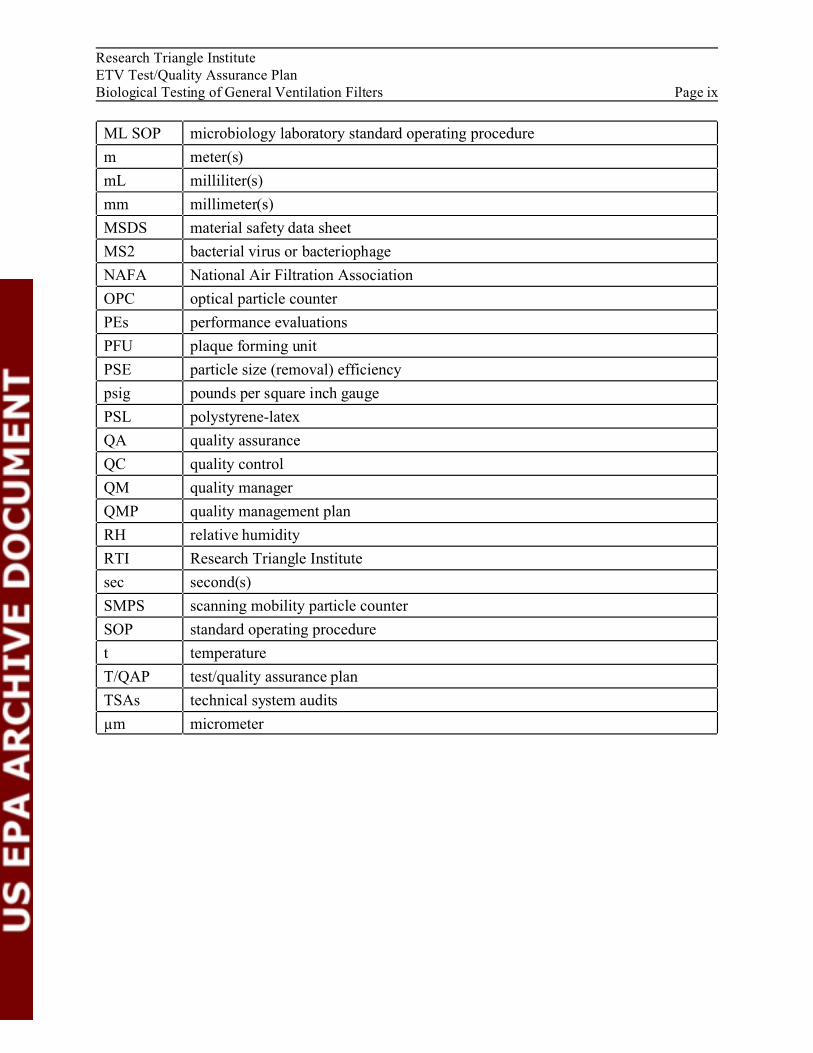
Research Triangle Institute ETV Test/Quality Assurance Plan Biological Testing of General Ventilation Filters Page ix
ML SOP microbiology laboratory standard operating procedure
m meter(s)
mL milliliter(s)
mm millimeter(s)
MSDS material safety data sheet
MS2 bacterial virus or bacteriophage
NAFA National Air Filtration Association
OPC optical particle counter
PEs performance evaluations
PFU plaque forming unit
PSE particle size (removal) efficiency
psig pounds per square inch gauge
PSL polystyrene-latex
QA quality assurance
QC quality control
QM quality manager
QMP quality management plan
RH relative humidity
RTI Research Triangle Institute
sec second(s)
SMPS scanning mobility particle counter
SOP standard operating procedure
t temperature
T/QAP test/quality assurance plan
TSAs technical system audits
µm micrometer
Research Triangle Institute ETV Test/Quality Assurance Plan Biological Testing of General Ventilation Filters Page 1
SECTION A: PROJECT MANAGEMENT
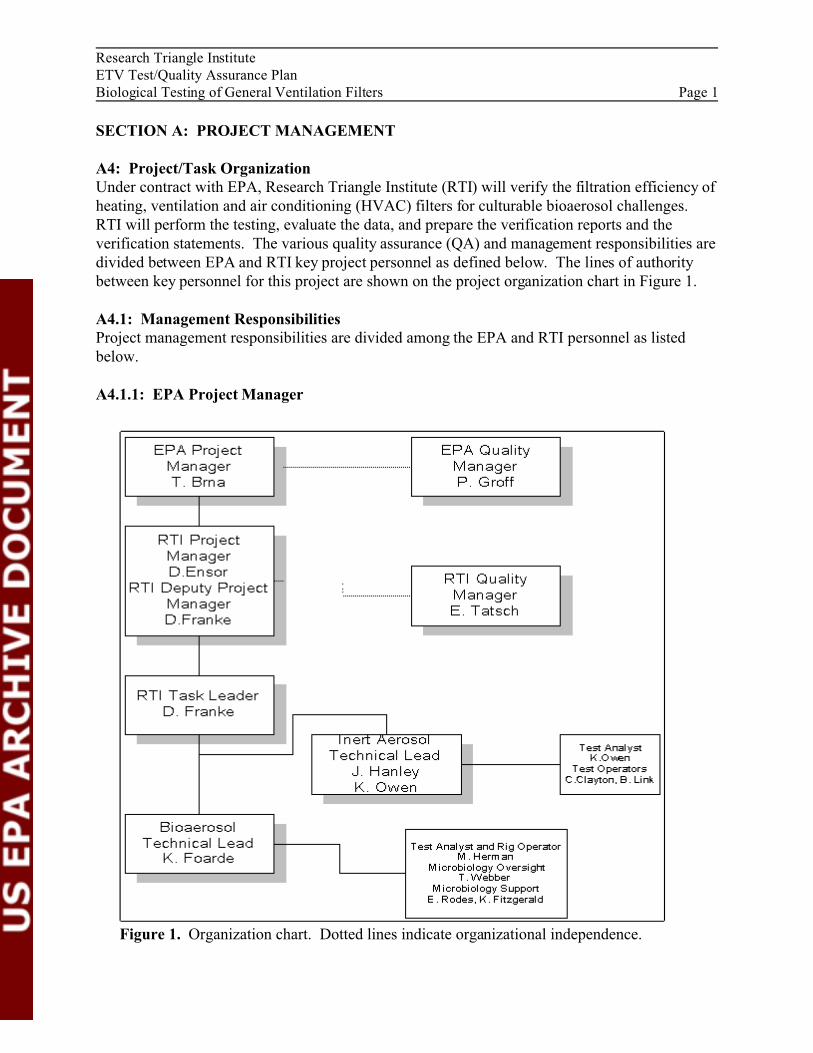
A4: Project/Task Organization Under contract with EPA, Research Triangle Institute (RTI) will verify the filtration efficiency of heating, ventilation and air conditioning (HVAC) filters for culturable bioaerosol challenges. RTI will perform the testing, evaluate the data, and prepare the verification reports and the verification statements. The various quality assurance (QA) and management responsibilities are divided between EPA and RTI key project personnel as defined below. The lines of authority between key personnel for this project are shown on the project organization chart in Figure 1.
A4.1: Management Responsibilities Project management responsibilities are divided among the EPA and RTI personnel as listed below.
A4.1.1: EPA Project Manager
Figure 1. Organization chart. Dotted lines indicate organizational independence.
Research Triangle Institute ETV Test/Quality Assurance Plan Biological Testing of General Ventilation Filters Page 2
The EPA Project Manager, Dr. Theodore Brna, has overall technical responsibility for the program. He is responsible for granting final approval of project plans and reports and seeing that the plans are implemented according to schedule, and he recommends the resources necessary to meet project objectives and requirements.
A4.1.2: RTI Project Manager The RTI Project Manager, Dr. David Ensor, and RTI Deputy Project Manager, Ms. Deborah Franke, are responsible for task implementation and technical quality control. The RTI Project Manager is also responsible for the following: • Monitor and direct the task leaders, • Update and distribute revisions of the Test/Quality Assurance Project Plan (T/QAP) as
necessary, and • Oversee preparation of verification reports and verification statements.
A4.1.3: RTI Task Leader The RTI Task Leader, Ms. Deborah Franke, will: • Define task objectives, • Develop a detailed work plan schedule, • Work with vendors and stakeholders, • Review work progress to ensure that task budgets and schedules are met, and • Prepare verification reports and verification statements.
Ms. Karin Foarde, the Bioaerosol Technical Lead, will have responsibility for the technical oversight required for the bioaerosol testing. Mr. Jim Hanley and Ms. Kathleen Owen will be co-technical leads for the inert aerosol tests. These technical leaders will review and compare the inert and biological aerosol results for consistency based on their experience with the respective components of the tests. While exact agreement is not expected (due to the different measurements/instruments), similar results are expected.
The RTI Technical Leaders will: • Assist the RTI Task leader with the work plan schedule, • Review/prepare operating procedures applicable to the testing, • Review test apparatus and procedures prior to commencement of testing, • Oversee testing of the ventilation filters, • Review test data /results for attainment of DQOs and reasonableness, • Initiate corrective actions when needed, • Review test results, and • Submit test results to RTI Task Manager.
A4.2: Quality Assurance Responsibilities QA responsibilities are divided among the EPA personnel and RTI personnel as listed below.
A4.2.1: EPA Quality Manager The EPA Quality Manager (EPA QM), Mr. Paul Groff, will conduct audits of RTI’s QA System and of specific technical activities on the project. He will be available to resolve any QA issues
Research Triangle Institute ETV Test/Quality Assurance Plan Biological Testing of General Ventilation Filters Page 3
relating to performance and EPA’s QA requirements. Specific functions and duties of the EPA QA Manager include approving the contents of this T/QAP and subsequent revisions and reviewing QA reports prepared by RTI, including QA evaluations and audits.
A4.2.2: RTI Quality Manager The RTI Quality Manger (RTI QM), Dr. C. E. Tatsch, is organizationally independent of the RTI Project Manager and is responsible for ensuring that QA/quality control (QC) procedures described in this T/QAP are followed. In addition, the RTI QM will: • Maintain regular communication with the EPA QM regarding QA issues, • Report on the adequacy, status, and effectiveness of the QA program on a regular basis to the
Task Manager, • Conduct audits of lab activities as necessary and prepare audit reports, • Ensure that corrective action, if necessary, is properly implemented and documented, • Review and approve test (including QC) reports, and • Prepare the QA section of each verification statement and verification report.
A5: Problem Definition/Background Information This ETV T/QAP for Biological Testing of General Ventilation Filters describes the test and QA procedures that will be used to provide data on the removal efficiency of surrogate biological warfare agents (BWA) by general air ventilation filters.
While data and methods are available for measuring single-pass inert particle removal efficiencies of air cleaners and filters, no standard method exists for evaluating culturable bioaerosol reduction by these devices. RTI has developed a test method for measuring culturable bioaerosol filtration efficiencies of devices ranging from a room air cleaner to duct-mounted ventilation filters to vacuum cleaner filters1, 2, 3.
RTI has extensive experience in the development of particulate testing methods of various air cleaning devices. RTI’s inert particulate filter testing methodology was the basis of ASHRAE Standard 52.24. These same methods are the basis for the bioaerosol test. An intrinsic property of an air filter is the removal efficiency under specified air flow rates as a function of a welldefined particle diameter. This property can be used to extrapolate bioaerosol results obtained at one particle size to bioaerosols of other sizes. Inert particle efficiency tests are used as a point of comparison for QA/QC of the culturable bioaerosol results and will be used as a "self-consistency" check within the same QA framework for the bioaerosol tests. Solid-phase inert test aerosols are themselves a simulant for some bioaerosols (dry bioaerosols of similar size)1,2,3. Taking advantage of this, inert particle efficiency tests will be performed on the media air filters to provide both a point of comparison for QA/QC of the bioaerosol results and to extend the results to a wider range of particle size than is covered by the bioaerosol tests alone.
The use of microorganisms as the challenge aerosol requires that a number of technical issues be addressed. These issues include: • Maintaining the survivability and culturability of the organisms through the aerosol
generation and collection process,
Research Triangle Institute ETV Test/Quality Assurance Plan Biological Testing of General Ventilation Filters Page 4
• Determining whether the test organisms are being aerosolized as singlets (or single organisms) with a narrow size distribution,
• Generating the bioaerosol challenge in sufficient concentration to maintain the sampling duration within the sample time limits of the bioaerosol sampler,
• Establishing the generation protocol for the test organisms, and• Selecting appropriate test organisms for the application.All of these issues have been addressed in earlier RTI work, but will be revisited for the specificorganisms used in the ETV-HS testing.
The test duct required for this method operates at positive pressure to minimize infiltration of room air or bioaerosol. Bioaerosol injection is located upstream of a mixing baffle to provide aerosol mixing with the airstream. Bioaerosol concentration is measured both upstream and downstream of the test section to obtain the challenge and penetrating concentrations, respectively.
Each test filter type tested will be subjected to the same series of tests. An ASHRAE Standard 52.24 test will be run to determine the minimum efficiency reporting value (MERV) of the filter. In reporting the filtration efficiency of filters for biological challenges, it is important that the MERV for the filters is accurately represented. After the ASHRAE Standard 52.2 test, the biological tests will be run. The biological test will use three different organisms and include a test with inert particles for QC purposes. The biological tests will be performed on clean, conditioned (if an electret filter), and fully dust-loaded (ASHRAE test dust) filters.
A6: Task Description and Schedule A6.1: Task Description The task consists of the four steps summarized below: • Procuring the general ventilation filters for testing ( NAFA will assist RTI in procuring the
filters and follow the procedure described in their Product Certification Program Procedural Guide5),
• Performing an ASHRAE Standard 52.24 test to establish MERV, • Performing the biological testing of the filters. Test three bioaerosols and one inert aerosol
on clean, conditioned (if electret), and fully dust-loaded filters, and • Preparing verification reports and statements.
A6.1.1: Identification and Acquisition of General Ventilation Filters NAFA has committed to assisting RTI in the procurement of filters. NAFA’s selection will be governed by the NAFA Product Certification Program Procedural Guide5. This requires random selection of filters from a manufacturer’s warehouse by a third party. RTI will provide oversight in the selection of representative filters. For each filter type, four filters will be procured. K. Owen will be the custodian of the filters and will be responsible for storage, labeling, etc. of the filters. The reserve filters (see Table 1) will be stored in Bay 1 at RTI. The filters from a given vendor/manufacturer will be utilized as shown in Table 1.
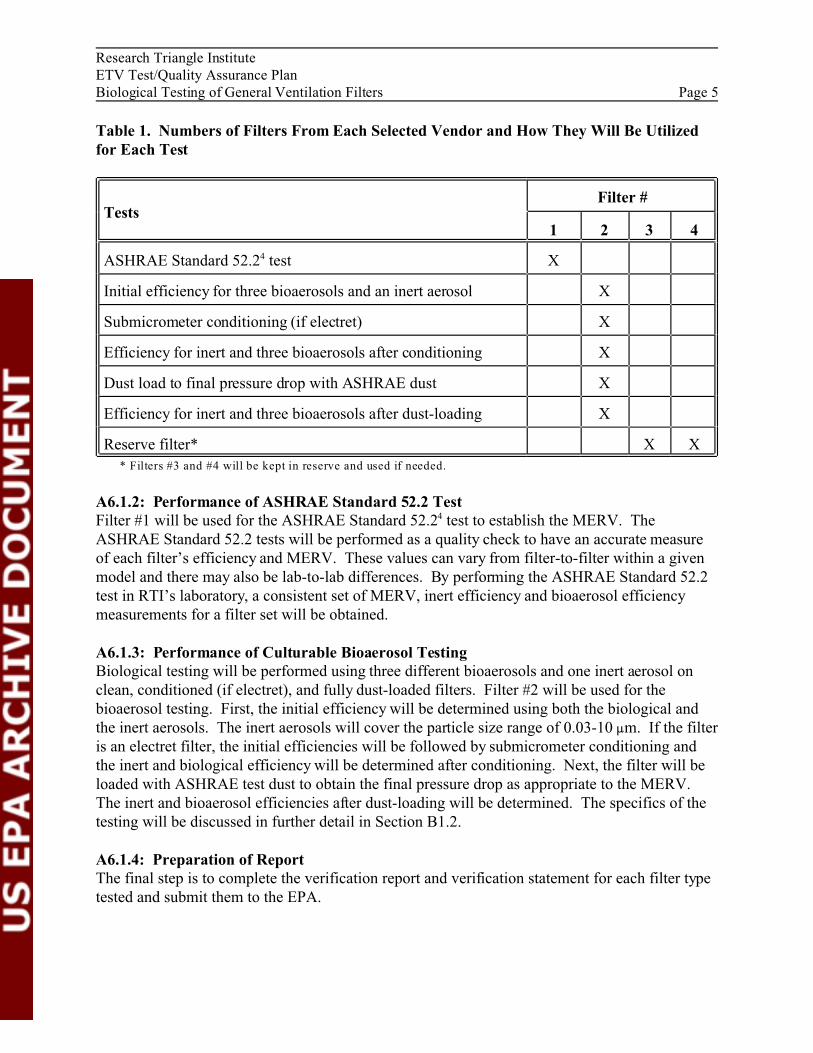
Research Triangle Institute ETV Test/Quality Assurance Plan Biological Testing of General Ventilation Filters Page 5
Table 1. Numbers of Filters From Each Selected Vendor and How They Will Be Utilized for Each Test
Tests Filter #
1 2 3 4
ASHRAE Standard 52.24 test X
Initial efficiency for three bioaerosols and an inert aerosol X
Submicrometer conditioning (if electret) X
Efficiency for inert and three bioaerosols after conditioning X
Dust load to final pressure drop with ASHRAE dust X
Efficiency for inert and three bioaerosols after dust-loading X
Reserve filter* X X
* Filters #3 and #4 will be kept in reserve and used if needed.
A6.1.2: Performance of ASHRAE Standard 52.2 Test Filter #1 will be used for the ASHRAE Standard 52.24 test to establish the MERV. The ASHRAE Standard 52.2 tests will be performed as a quality check to have an accurate measure of each filter’s efficiency and MERV. These values can vary from filter-to-filter within a given model and there may also be lab-to-lab differences. By performing the ASHRAE Standard 52.2 test in RTI’s laboratory, a consistent set of MERV, inert efficiency and bioaerosol efficiency measurements for a filter set will be obtained.
A6.1.3: Performance of Culturable Bioaerosol Testing Biological testing will be performed using three different bioaerosols and one inert aerosol on clean, conditioned (if electret), and fully dust-loaded filters. Filter #2 will be used for the bioaerosol testing. First, the initial efficiency will be determined using both the biological and the inert aerosols. The inert aerosols will cover the particle size range of 0.03-10 :m. If the filter is an electret filter, the initial efficiencies will be followed by submicrometer conditioning and the inert and biological efficiency will be determined after conditioning. Next, the filter will be loaded with ASHRAE test dust to obtain the final pressure drop as appropriate to the MERV. The inert and bioaerosol efficiencies after dust-loading will be determined. The specifics of the testing will be discussed in further detail in Section B1.2.
A6.1.4: Preparation of Report The final step is to complete the verification report and verification statement for each filter type tested and submit them to the EPA.
Research Triangle Institute ETV Test/Quality Assurance Plan Biological Testing of General Ventilation Filters Page 6
A6.2: Schedule Procurement of the filters will begin in May 2003. Testing of the filters is scheduled to begin in June and will be completed by October 31, 2003. All final verification reports with statements will be issued by December 15, 2003.
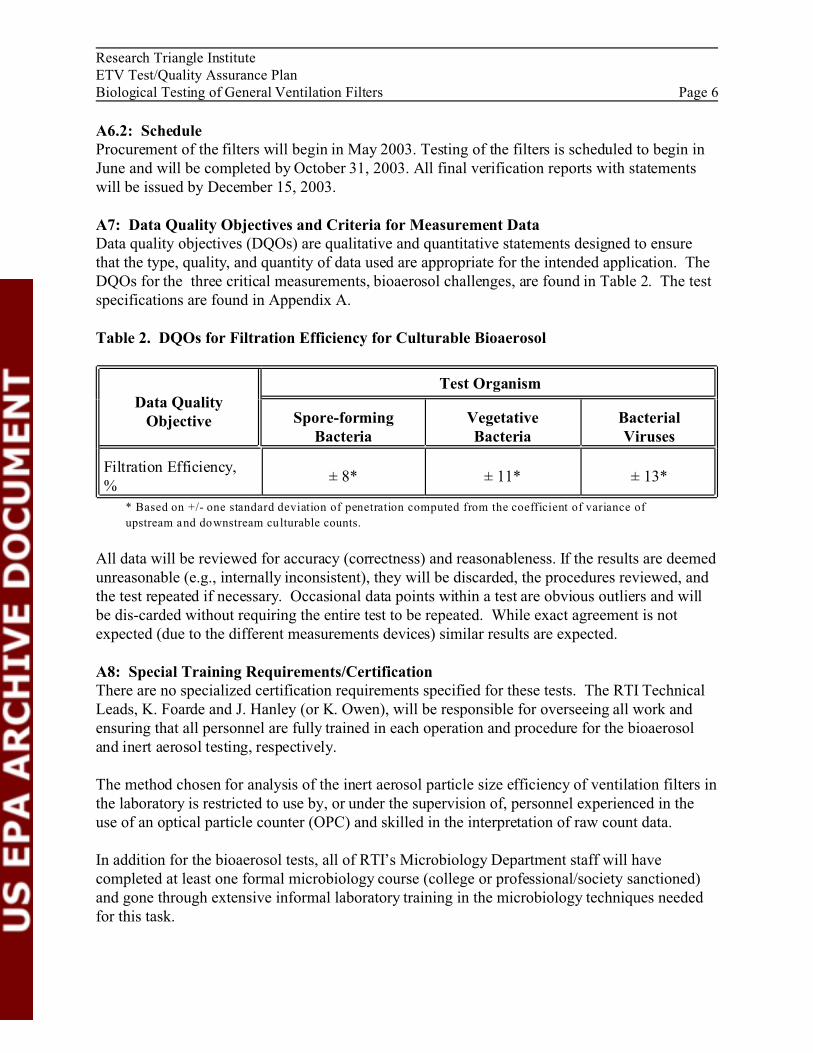
A7: Data Quality Objectives and Criteria for Measurement Data Data quality objectives (DQOs) are qualitative and quantitative statements designed to ensure that the type, quality, and quantity of data used are appropriate for the intended application. The DQOs for the three critical measurements, bioaerosol challenges, are found in Table 2. The test specifications are found in Appendix A.
Table 2. DQOs for Filtration Efficiency for Culturable Bioaerosol
Test Organism Data Quality
Objective Spore-forming Bacteria
Vegetative Bacteria
Bacterial Viruses
Filtration Efficiency, %
± 8* ± 11* ± 13*
* Based on +/- one standard deviation of penetration computed from the coefficient of variance of
upstream a nd do wnstream cu lturable counts.
All data will be reviewed for accuracy (correctness) and reasonableness. If the results are deemed unreasonable (e.g., internally inconsistent), they will be discarded, the procedures reviewed, and the test repeated if necessary. Occasional data points within a test are obvious outliers and will be dis-carded without requiring the entire test to be repeated. While exact agreement is not expected (due to the different measurements devices) similar results are expected.
A8: Special Training Requirements/Certification There are no specialized certification requirements specified for these tests. The RTI Technical Leads, K. Foarde and J. Hanley (or K. Owen), will be responsible for overseeing all work and ensuring that all personnel are fully trained in each operation and procedure for the bioaerosol and inert aerosol testing, respectively.
The method chosen for analysis of the inert aerosol particle size efficiency of ventilation filters in the laboratory is restricted to use by, or under the supervision of, personnel experienced in the use of an optical particle counter (OPC) and skilled in the interpretation of raw count data.
In addition for the bioaerosol tests, all of RTI’s Microbiology Department staff will have completed at least one formal microbiology course (college or professional/society sanctioned) and gone through extensive informal laboratory training in the microbiology techniques needed for this task.
Research Triangle Institute ETV Test/Quality Assurance Plan Biological Testing of General Ventilation Filters Page 7
A9: Documentation and Records This section identifies the documents and reports to be generated as part of the verification program and the information to be included in the verification reports and verification statements. A description of the data management system established for this task is presented in Section B10.
Requirements for record keeping and data management for the overall program are found in the U.S. EPA, Environmental Technology Verification Program Quality Management Plan6. All SOPs are maintained on file at RTI. Access to these files is permitted on-site at RTI.
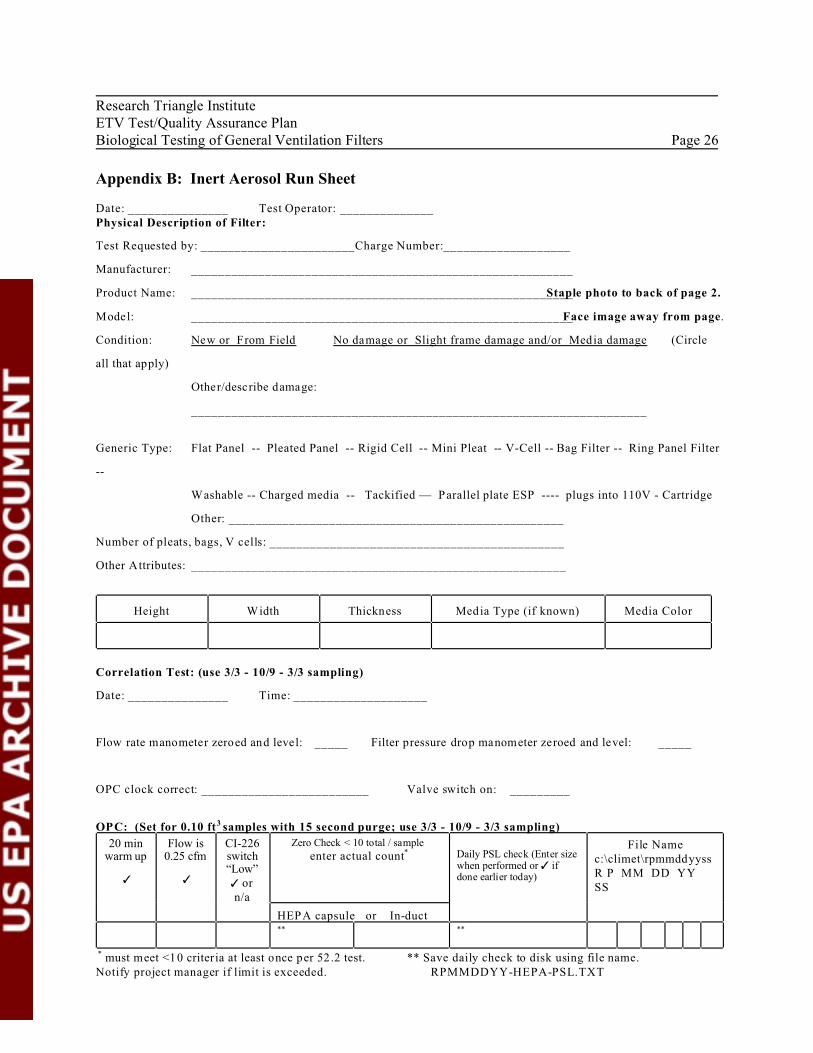
A9.1: Laboratory Documentation A9.1.1: Inert Aerosol Test The test operator for the inert aerosol test will record the test data and run notes on test run sheets prepared specifically for these tests (An example is presented in Appendix B.) The sheets will be kept in a labeled three-ring binder. The run sheets are designed to prompt the test operator for all required test information: • Testing date, time, and operator; • Manufacturer and model number of filter; • Physical description of the filter; • QA checks on the equipment and data; and • Test conditions (temperature, relative humidity, atmospheric pressure, air flow rate, filter
pressure drop).
The particle count data generated by the OPC are recorded by the computer. The file will be saved to the hard drive and later copied to a floppy disk or shared directory for backup.
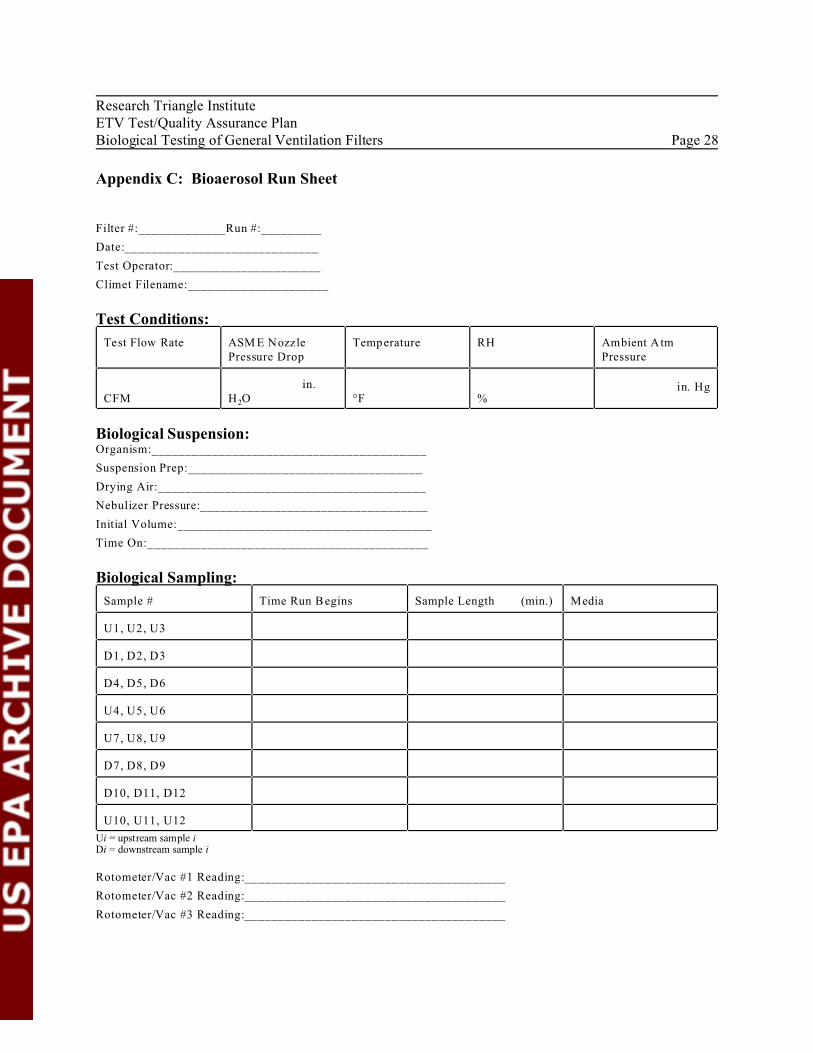
A9.1.2: Bioaerosol Tests The bioaerosol test operator will record the test data and note on a bioaerosol test run sheet (presented in Appendix C). The sheets are kept in a labeled three-ring binder. The run sheets are patterned from the inert aerosol run sheets and designed to prompt the test operator for all required test information: • Filter and run #; • Testing date and operator; • Test conditions (t, RH, ambient pressure, air flow rate, pressure drop across filter; • Biological suspension information (test organism, suspension preparation, drying air,
nebulizer pressure, initial volume, and time on); • Biological sampling scheme (time run begins, sample length, and media); and • Rotameter readings showing the flow rate into the vacuum pump.
The organism counts are entered in the project notebook or recorded by a computer. If recorded to a computer, the file will be saved to the hard drive and later copied to a floppy disk or shared directory for backup.
Research Triangle Institute ETV Test/Quality Assurance Plan Biological Testing of General Ventilation Filters Page 8
A9.2: QA Reports The RTI QM will perform a system audit based on the approved T/QAP during the first month of testing; this is considered suitable since this testing program is using well-known measurement systems components. A report will be prepared for the Task Leader within 15 days of completion of the audit.
RTI will cooperate with audits performed by the EPA Project Manager, Quality Manager, or their designee insofar as resources permit.
A9.3: Reporting After the completion of verification tests, the control test data, sample inventory logs, calibration records, and certificates of calibration will be stored. Calibration records will include such information as the instrument being calibrated, raw calibration data, calibration equations, analyzer identifications, calibration dates, calibration standards used and their traceabilities, identification of calibration equipment used, and the staff conducting the calibration. Final reports of self-assessments and independent assessments (i.e., technical systems audits, performance evaluations, and audits of data quality [TSAs, PEs, and ADQs]) will be retained. Each verification report and verification statement will contain a QA section, which will describe the extent that verification test data comply with DQOs.
A9.4: Verification Reports and Verification Statements Verification reports and verification statements will be prepared by RTI’s Task Leader and QA Officer and reviewed by RTI’s Project Manager and the Quality Manager prior to submittal to the EPA Project Manager for approval. Procedures for the preparation, review, and dissemination of verification reports and verification statements are described in U.S. EPA, Environmental Technology Verification Program Quality Management Plan6.
It is anticipated that the verification reports and statements will include the filtration efficiency of the tested device for each of the three bioaerosol challenges for the clean and fully dust-loaded filter.
The following additional information will be noted in the verification reports and verification statements: • The fractional filtration efficiency of the air filter over the 0.03 - 10 :m size range for the
clean, conditioned (electret only), and fully dust-loaded filter; • The pressure drop across the clean and fully dust-loaded filter; • The test air flow rate; • The measured MERV and the associated E1, E2, and E3 values of the ASHRAE Standard
52.24 test; and • A description and photograph of the filter tested.
Research Triangle Institute ETV Test/Quality Assurance Plan Biological Testing of General Ventilation Filters Page 9
SECTION B: MEASUREMENT/DATA ACQUISITION
B1: Test Design The test program will measure the culturable bioaerosol removal efficiency of general ventilation filters. Two tests are required to accomplish this goal. The first test is the performance of an ASHRAE Standard 52.24 test on one filter of the test filter type to determine the MERV of the filter. After determining the MERV, the biological test using three different bioaerosols and one inert aerosol on both clean, conditioned (electret only), and fully dust-loaded filters will be performed. All tests will be performed on filters nominally 0.61 x 0.61 m (24 x 24 in.) at an air flow rate of 0.93 m3/sec (1970 cfm) to conform to the conditions described in ASHRAE Standard 52.2.
B1.1: Inert Testing The inert aerosol tests will follow ASHRAE Standard 52.24 for determining the filter's MERV and on a second filter will use modified 52.2 procedures to extend the measurements to smaller particle sizes and to condition electret media. All the inert aerosol tests will use laboratorygenerated potassium chloride (KCl) particles dispersed into the airstream as the test aerosol. A particle counter will measure and count the particles in a series of size ranges both upstream and downstream of the test filters for its efficiency determinations. To simulate the effects of dust accumulation on the filters, the filters will be tested in both their clean and dust-loaded condition. The dust-loading will follow ASHRAE 52.2 procedures as applicable.
B1.1.1: Particle Counters For the inert aerosol filtration efficiency measurements, the particle sizing measurements will be made with two particle counting instruments: a Climet Model 500 spectrometer (OPC) covering the particle diameter size range from 0.3 - 10 µm in 12 particle sizing channels and a TSI Scanning Mobility Particle Sizer (SMPS) to cover the range from 0.03 - 0.5 µm. For the conditioning aerosol, a TSI condensation particle counter (CPC) (model 3022A or similar) will be used to monitor the upstream concentration. The CPC will function to monitor the concentration of the submicrometer-sized particles used for conditioning; it will not aid in measuring the efficiency of the filters.
The OPC uses a laser-light illumination source and has a wide collection angle for the scattered light. The OPC's sampling rate is 7.1 L/min. (0.25 cfm). The OPC is equipped to provide a contact closure at the end of each sample and also provides a 15 sec. delay in particle counting after each sample. The contact closure is used to control the operation of electromechanical valve actuators in the upstream and downstream sample lines. The 15 sec. delay allows time for the new sample to be acquired. The SMPS consists of a TSI Model 3071 electrostatic classifier and a TSI Model 3010 or 3022 CPC.
Research Triangle Institute ETV Test/Quality Assurance Plan Biological Testing of General Ventilation Filters Page 10
B1.1.2: Inert Aerosol Generation Three aerosol generators will be used for the tests. Three generators are needed to cover the range of particle sizes needed; one for the 0.03 - 0.5 µm tests, one for the 0.3 - 10 µm tests, and one to generate the submicrometer conditioning aerosol. All of the aerosols will be generated from potassium chloride (KCl) in aqueous solution. The concentrations of KCl will vary as will the generation technique to give particles in the needed size ranges.
For the 0.3 - 10 µm efficiency tests, the KCl solution will be nebulized using a two-fluid (air and liquid) atomizing nozzle (Spray Systems 1/4 J siphon spray nozzle). The full description of the test duct is in Appendix A. The nozzle is positioned at the top of a 0.30 m (12 in.)-diameter, 1.3 m (51 in.)-tall transparent acrylic spray tower. The tower serves two purposes. It allows the salt droplets to dry by providing an approximately 40 sec. mean residence time, and it allows larger particles to fall out from the aerosol. After generation, the aerosol passes through a TSI Model 3054 aerosol neutralizer (Krypton-85 radioactive source) to neutralize any electrostatic charge on the aerosol (electrostatic charging is an unavoidable consequence of most aerosol-generation methods). The KCl solution is fed to the atomizing nozzle at 1.2 mL/min. by a pump. Varying the operating air pressure of the generator allows control of the output aerosol concentration.
For the 0.03 - 0.5 µm tests, the KCl solution will be nebulized with a Collison nebulizer or Laskin nozzle generator. Both of these devices generate smaller particles than the spray nozzle.
B1.1.3: Inert Conditioning Procedure For Electret Filters For the conditioning step, the aerosol will be produced using a bank of up to four Laskin nozzles nebulizing a 0.1% KCl aqueous solution (1 g KCl to 1 L of water). This is a refinement of procedures developed by RTI on earlier EPA supported research7. Previous measurements have indicated that the resultant aerosol is < 0.1 µm in mean diameter. Periodically during the conditioning portion of the test, the filter’s efficiency will be measured (0.3 - 10 µm) to determine if the efficiency has fallen to it’s minimum condition. Once the efficiency is at or near it’s minimum, the conditioning will cease. The duration of conditioning and the concentration of the conditioning aerosol are monitored during the test.
B1.2: Culturable Bioaerosol Testing The bioaerosol testing is based on the inert methodology and uses the same test rig as the inert aerosol. The methodology is described in ML SOP #038 (SOP for the Determination of the Filtration Efficiency of Bioaerosols). Two primary differences from the inert aerosol methodology are that the bioaerosol is generated from a suspension of the test organism and the sampling is achieved using bioaerosol samplers. The use of microorganisms as the challenge aerosol requires that a number of technical issues be addressed. These include: • Measuring the survivability and culturability of the organisms through the aerosol generation
and collection process; • Determining whether the test organisms are being aerosolized as singlets with a narrow size
distribution; • Generating the bioaerosol challenge in sufficient concentration to maintain the sampling
duration within the sample time limits of the bioaerosol sampler; and
Research Triangle Institute ETV Test/Quality Assurance Plan Biological Testing of General Ventilation Filters Page 11
• Establishing the generation protocol for the test organisms.All of these issues have been addressed in earlier RTI work, but they will be revisited for thespecific organisms used in the ETV testing.
B1.2.1: Test Organisms The size and shape of the organisms selected for testing are important because the organisms are going to be aerosolized as surrogates for BWAs. These organisms naturally vary in both their sizes and shapes. Therefore, there is the need to select organisms that reflect that natural diversity.
The bioaerosol tests will be conducted using the spore form of the bacteria Bacillus atrophaeus (formerly B. subtilis var niger and Bacillus globigii or BG). The BG spore is elliptically shaped with dimensions of 0.7 - 0.8 x 1 - 1.5 µm. Serratia marcescens will be utilized as the surrogate for the rod-shaped gram negative bacteria. S. marcescens is 0.5 - 0.8 x 0.9 - 2.0 µm.
Human viruses utilized as BWA are thought to be spread by airborne or droplet transmission. Because human viruses can be expensive and cumbersome to work with, the bacterial virus (bacteriophage) MS2 (0.02 - 0.03 µm), having approximately the same aerosol characteristics as a human virus, will serve as a surrogate for the viruses of similar and larger size and shape.
Although the individual virus particles are in the submicrometer size range, the test particle size planned for the virus tests will span a range of sizes (polydispersed bioaerosol). This test is not designed to study the removal efficiencies for single individual virus particles; rather, it is designed to determine the removal efficiencies for virus particles as they are commonly found indoors. A representative challenge would be a polydispersed aerosol containing the phage because: • The aerosols created from sneezing and coughing vary in size from < 1 to 20 µm 8, but the
largest particles settle out and only the smaller sizes remain in the air for extended periods for potential removal by an air cleaner;
• For some viruses (i.e., Coxsackie virus), few viruses have been found associated with the smallest particles9; and
• Nearly all 1 - 2 µm particles are deposited in the respiratory tract, while larger particles may not be respired.
B1.2.2: Bioaerosol Preparation and Generation Bacteria suspension preparation for the aerosolization process requires that the specific test organism be grown in the laboratory and the suspension prepared for aerosol generation in the test rig following ML SOP #012 (SOP for the Quantitation of Viable Microorganisms in Suspension). The microbial challenge suspensions are prepared by either: • Inoculating the test organism on solid or liquid media, incubating the culture until mature,
wiping organisms from the surface of the pure culture (if solid media), and eluting them into sterile 18 megohm/cm water to a known concentration, or
• Purchasing a spore suspension from a commercial vendor and diluting it in sterile water.
Research Triangle Institute ETV Test/Quality Assurance Plan Biological Testing of General Ventilation Filters Page 12
Both correspond to a concentration of approximately 1 x 10⁷ CFUs (colony forming units)/mL. Resuspension in sterile 18 megohm/cm water is essential to minimize the particle counts from sources other than the organisms themselves (e.g., dissolved solids). Trypticase soy agar will be used to enumerate the bacteria.
The phage challenge will be prepared by inoculating a logarithmic phase broth culture of the host bacteria with phage and allowing it to multiply until the majority of the host bacteria are lysed. The mixture will be centrifuged to remove the majority of the cell fragments. The resultant supernatant will be the phage stock and will be used as the challenge aerosol. The concentration of the phage stock will be approximately 1 x 10⁹ or higher plaque forming units (PFU)/mL.
The challenge organism suspensions will be aerosolized using a Collison nebulizer (BGI, Waltham, MA) at 15 psi air pressure. The Collison nebulizer generates droplets with an approximate volume mean diameter of 2 µm. The particle diameter after the water evaporates depends on the solids content of the suspension. Particle size is determined by the size of the suspended particles (if singlets).
Upstream and downstream sampling of the bacteria will be accomplished using a one-stage Andersen viable bioaerosol sampler. The one-stage Andersen sampler is a 400-hole multiple-jet impactor operating at 28 L/min. The d50 is 0.65 µm. After sampling, the petri dishes will be removed from the sampler and incubated at appropriate times and temperatures for the test organism being used. CFUs are then enumerated and their identity confirmed.
The phage will be collected in AGI-30s. The AGI-30 is a high velocity liquid impinger operating at a flow rate of 12.3 - 12.6 L/min. The d50 is approximately 0.3 µm. The AGI-30 is the sampler against which the other commonly used bioaerosol samplers are often compared. The AGI-30 (containing 40 ml of collection fluid) will be used for the MS2 sampling.
The experimental conditions and sampling times will be adjusted so that these samplers will be used within their upper and lower sampling limits.
To quantify the microbial counts, the plates are incubated at the appropriate temperature and time for the test organism (overnight to a week). Colonies or plaques are counted. A "positive-hole" correction is applied10 to the one-stage Andersen data to correct for undercounting at high concentrations.
B2: Sampling Methods Requirements Inert aerosol sampling method requirements and critical dimensions and configurations of the test apparatus are specified in ASHRAE Standard 52.24. Bioaerosol sampling methodology will comply where appropriate. Bioaerosol samplers are operated according to the manufacturer’s specifications. The vacuum pumps required for operating the samplers are calibrated following ML SOP #029 (SOP for Calibrating Pump Flows Using a Dry Gas Meter).
Research Triangle Institute ETV Test/Quality Assurance Plan Biological Testing of General Ventilation Filters Page 13
B3: Sample Handling and Custody Requirements Sampling methods and laboratory procedures are described in specific laboratory SOPs. These SOPs address any anticipated failures and the methods that will be employed to overcome these failures. Most of the methods are well-known sampling methods; therefore, sampling failures are not anticipated. Any additional project-specific considerations will be addressed by the RTI Technical Leads and included in an updated SOP. Supporting measurements, such as temperature, relative humidity or atmospheric pressure, will be recorded in laboratory data logs or notebooks.
Upon receipt of the test filters, each will be serially numbered using a permanent marker (or other means as appropriate). All filters for this study will be stored in a single indoor, air conditioned common area (Bay 1).
B4: Analytical Methods Requirements The analytical method requirements for the inert aerosol testing are described in ASHRAE Standard 52.24. The requirements for biological testing are described in the appropriate ML SOPs.
B5: Quality Control Requirements The apparatus will be tested to verify that the test rig and sampling procedures are capable of providing quantitatively reliable particle size measurements. The qualification tests and procedures are detailed in ASHRAE Standard 52.24. The system qualification requirements are also specified ASHRAE Standard 52.2.
B6: Instrument/Equipment Testing, Inspection, and Maintenance Requirements Qualification tests will be conducted as required by the table shown in Appendix A. Typically, these tests are run as part of each test run, monthly, biannually, or after a change that may alter performance.
B7: Instrument Calibration and Frequency Calibration will be performed in accordance with the manufacturer’s recommendations or annually. Recommended instrument calibration frequencies are provided in the respective SOPs and manufacturer’s manuals. Pipettes will be calibrated gravimetrically following ML SOP #013 (SOP for Pipet Calibration).
B8: Inspection/Acceptance Requirements for Supplies and Consumables Chemicals, supplies, and other consumables will be purchased from sources that have provided high quality products to the laboratory in the past. Materials such as growth media will be purchased from a single source to help ensure uniformity throughout the duration of the project. All supplies will be inspected by the lab personnel. RTI's purchasing department will assist with the return of any equipment or materials that do not meet project requirements.
Research Triangle Institute ETV Test/Quality Assurance Plan Biological Testing of General Ventilation Filters Page 14
B9: Data Acquisition Requirements (Non-direct measurements) No types of data are needed for project implementation or decision making that would be obtained from non-measurement sources such as computer databases, programs, literature files, or historical databases.
Manual methods of primary data acquisition (e.g., visual CFU counting) are described in ML's SOPs, while automated data acquisition equipment (e.g., balances and environmental controls) is checked using procedures recommended by the manufacturer. Procedures for screening and verifying manually entered data are used to reduce input errors to a minimum through double checking each other. Non-experimental data, such as an MSDS, will be included in the project notebook and a copy maintained in the RTI Technical Leader's project file.
B10: Data Management Guidelines on the use of computers, data security, backup, etc. are part of the overall RTI Quality Management Plan (QMP) for Environmental Programs (2003)11. RTI is currently preparing a QMP for this project.
Guidelines for data management in the ML include the description, location, format, and organization of all types of records. The RTI Technical Leader will oversee all data management activities. This section identifies the activities and processes planned for documenting the traceability of the data, calibrations, and information in the verification report.
B10.1: Data Recording Data for this task will be collected either by computer or by manual (handwritten) entries. Observations and records (e.g., sample description and collection information) will be recorded manually in lab notebooks kept exclusively for this task. Output data generated by the OPC instruments will be transferred directly to a computer file and stored as a spreadsheet; printed output will be taped into the lab notebook.
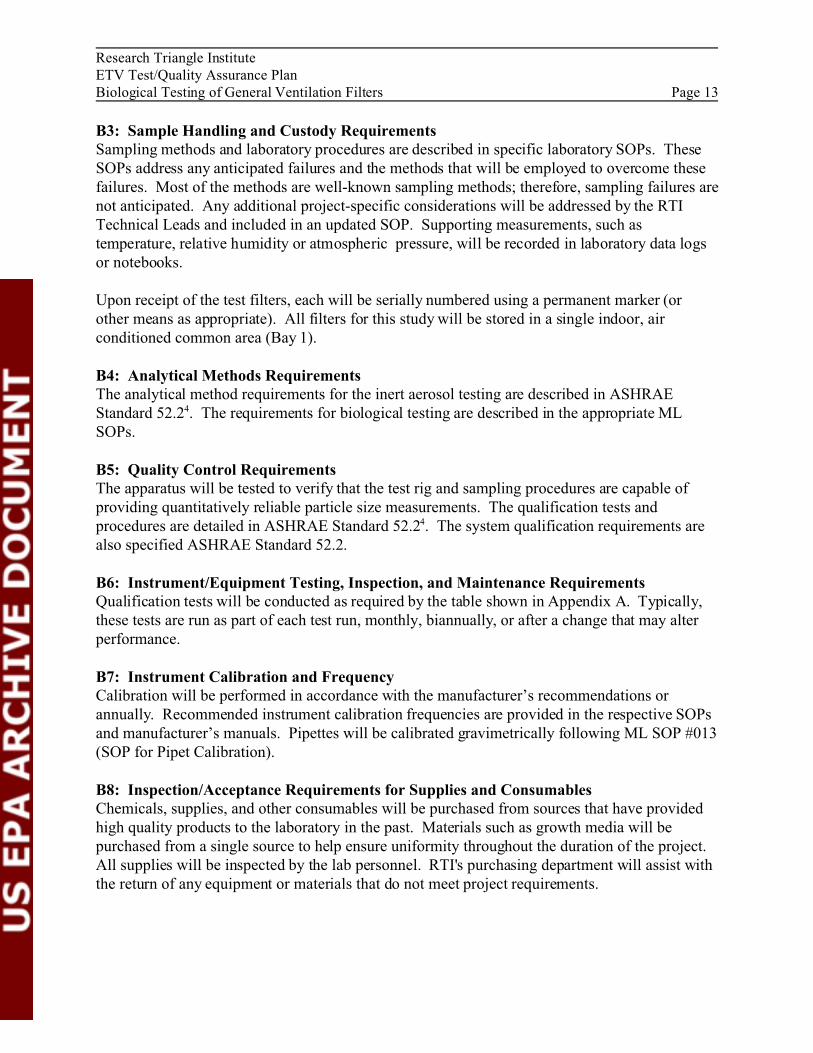
B10.2: Data Analysis B10.2.1: Inert Aerosol Data The computation of inert aerosol filtration efficiency is based on the ratio of the downstream-to-upstream particle concentrations corrected on a channel-by-channel basis for:
• Background counts (i.e., upstream and downstream counts observed when the aerosol generator is off) and
• For the correlation ratio measured at the start of the test sequence. A minimum of two background and six upstream and six downstream counts will be taken. These data will be used for determining filtration efficiency by computing the observed penetration (Pobserved):
(1)
where:
Research Triangle Institute ETV Test/Quality Assurance Plan Biological Testing of General Ventilation Filters Page 15
DD = Downstream particle count,
b = Downstream background count,U = Upstream count, and
=Ub Upstream background count.
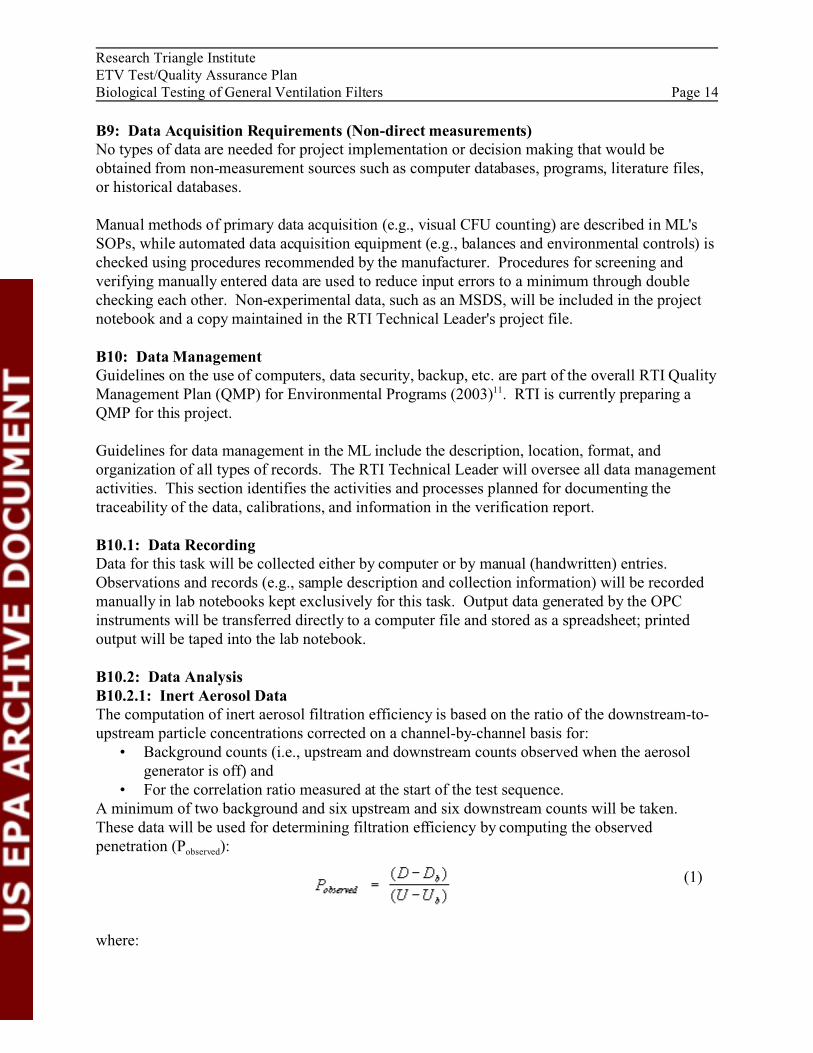
PTo remove system bias, the observed penetration is corrected by the correlation ratio (R) (the
observed measured during a blank control test for which no filter is installed in the duct).
(2)
The filtration efficiency is then computed.
(3)
B10.2.2: Bioaerosol Data Data analysis will be performed using commercially available software (Microsoft Excel12) to enter the raw data into a spreadsheet and calculate results from a series of equations.
Samples will be collected simultaneously using multiple samplers. A minimum of six, usually twelve, replicates will be collected for each efficiency determination.
The mean upstream and downstream CFUs will be calculated as:
(4)and
U
Dwhere:
i = Downstream count of the ith sample and n is the number of replicate samples collected and
i = Upstream count of the ith sample and n is the number of replicate samples collected.
The calculation of the penetration is based on the ratio of the downstream to upstream culturable counts. The penetration with the filter installed in the test rig (Pmeasured) is shown in the following equation:
(5)
where: 6D = Mean downstream count with a filter installed in the test rig and 6U = Mean upstream count with a filter installed in the test rig.
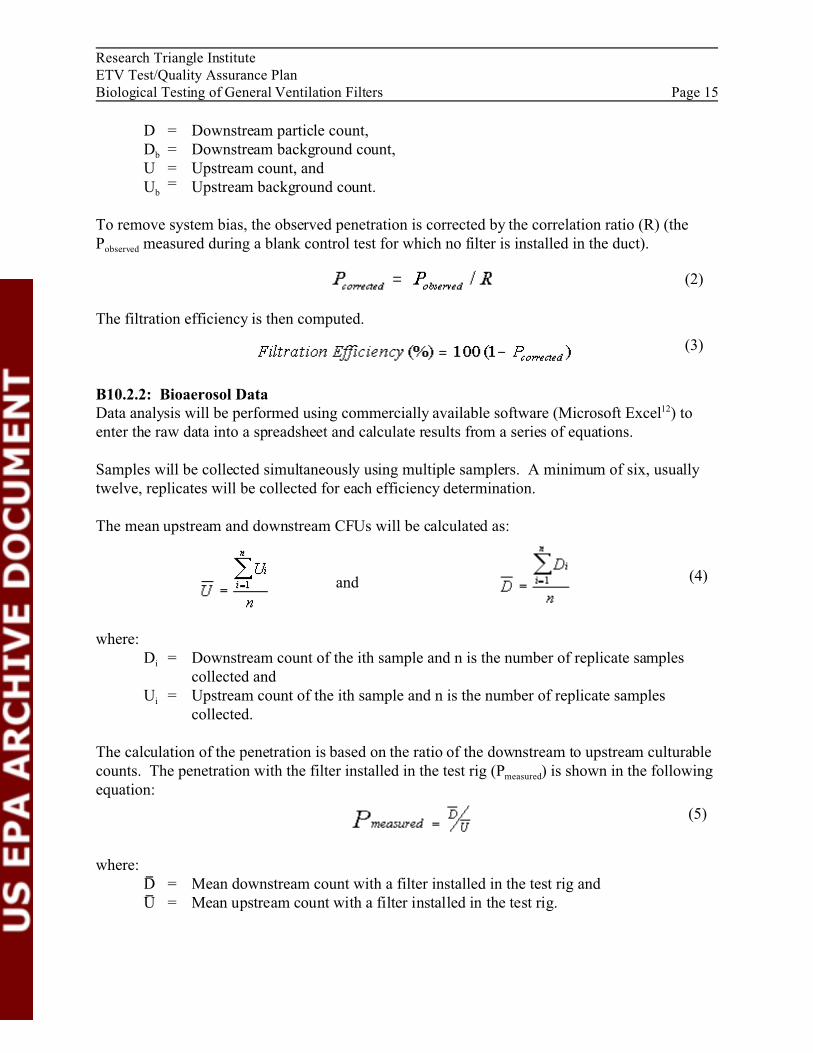
Research Triangle Institute ETV Test/Quality Assurance Plan Biological Testing of General Ventilation Filters Page 16
The P100 (no filter installed in the test rig) is calculated as the Pmeasured but using the results of the no filter tests.
(6)
where: 6D100 = Mean downstream count with no filter in the test rig and 6U100 = Mean upstream count with no filter in the test rig.
To remove system bias, the Pmeasured is corrected by the penetration of a blank “no filter” test for which no air cleaner is installed in the duct (P100).
(7)
The filtration efficiency is then calculated as shown in Eq. 10.
(8)
The DQOs will be calculated based on +/- one standard deviation of penetration computed from the coefficient of variance of upstream and downstream culturable counts as shown in Eq. 11.
(9)
Pwhere:
measured = Penetration calculated from the upstream and downstream culturable counts, CVU = Coefficient of variance for the upstream counts, and CVD = Coefficient of variance for the downstream counts.
B10.3: Data Storage and Retrieval Laboratory notebooks containing manually recorded information and data output generated from instrumentation will be stored in the custody of the appropriate Technical Lead for the duration of the project.
Spreadsheet files including raw and calculated data will be stored on computers. The files will be downloaded to a network server backed up nightly on magnetic tape.
Following policy at RTI, as well as ETV policy, project files will be archived offsite at a secure facility for a minimum of 7 years following the end of the project. The records will not be destroyed without written approval from EPA.
Research Triangle Institute ETV Test/Quality Assurance Plan Biological Testing of General Ventilation Filters Page 17
SECTION C: ASSESSMENT/OVERSIGHT
C1: Assessments and Response Actions C1.1: Audits The labs will be subject to both external and internal audits. An external audit may be conducted by EPA or a designated representative before testing begins. The auditor(s) will document their findings and note where corrective actions are necessary. The auditor(s) will distribute audit reports to those listed in Section A3 as well as to the supervisor whose lab was audited.
C1.2: Corrective Actions Technical personnel will have the direct responsibility for ensuring that the T/QAP plan is implemented, that the operating parameters are within acceptable limits, and that corrective actions are taken when appropriate. Corrective action will be taken whenever measurement accuracy or bias is outside the limits of objectives for the critical measurements. Corrective actions include: • Problem identification; • Attempting to find the cause; • Attempting immediate repairs (if possible); • Reporting or documenting the problem; • Planning for corrective action (if major repairs are needed); • Checking that problem was corrected; • Documenting the corrective actions taken; and • Recommending changes to instruments, SOPs, etc. to avoid similar future occurrences.
The RTI QM, Task Leader, and the Technical Leaders will be jointly responsible for proper documentation of corrective actions. Minor corrective actions are to be recorded in the laboratory notebooks. Major problems will be addressed as outlined above. All corrective actions will be noted in the test report. Depending on the time and expense involved with necessary corrective actions, it will be necessary to consult the Program Manager or the sponsor before implementing any changes in the planned activities.
C2: Reports to Management The RTI Task Leader will notify RTI's and EPA’s Project Manager and Quality Manager when testing under this project is being conducted. The RTI Task Leader will submit verification reports and verification statements, as well as data, to the RTI Quality Manager. After technical assessments, the RTI QM will submit the assessment report to the RTI Project Manager. The RTI Project Manager will submit verification reports and verification statements to the EPA Project Manager and will submit assessment reports to the EPA Project Manager for informational purposes.
Audit reports will be sent to all those on the distribution list for the T/QAP.
Research Triangle Institute ETV Test/Quality Assurance Plan Biological Testing of General Ventilation Filters Page 18
SECTION D: DATA VALIDATION AND USABILITY
D1: Data Review, Validation, and Verification Requirements The test is acceptable if all the measured parameters fall within the DQO limits described in Table 2. The test operator and analyst are responsible for checking that all measured parameters fall within prescribed limits before continuing testing.
D2: Validation and Verification Methods The test analysis will verify that the test data have been correctly entered and processed by double checking each other. Newly-developed or modified software, including spreadsheets, will be checked for correctness before being used to process project data. All manual calculations will be double- checked.
Each verification report will be reviewed by the RTI QM for compliance with the applicable method and for the quality of the data reported.
The RTI QM will check for the following: • Data completeness, • Initial and continuing calibrations, and • QC reference and internal standards.
D3: Reconciliation with Data Quality Objectives Each ETV verification statement will summarize testing conditions and will state test results. Each ETV test report will present the critical and relevant ancillary measurements.
Actual data quality will be compared with the DQOs specified in Section A7; if the data quality meets or exceeds the objectives and test specifications have been met, the test data will be considered acceptable. If exceptions are identified, the issues will be investigated for impact on the credibility of the data, the EPA Quality Manager will be consulted, and the test results disposed of on the basis of this careful consideration; the verification statement will note the exception(s) and their potential impact on the utility of results.
Research Triangle Institute ETV Test/Quality Assurance Plan Biological Testing of General Ventilation Filters Page 19
References
1. Foarde, K. and J. Hanley. 2001. Determine the Efficacy of Antimicrobial Treatments of Fibrous Air Filters. ASHRAE Transactions. Volume 107, Part 1. 156-170.
2. Foarde, K.K. and J.T. Hanley. 1999. A New Laboratory Method for Measuring the Bioaerosol Filtration Efficiency of Air Cleaners. Proceedings: 1999 Air Filtration Conference: Fall Topical Conference pp. 47-54.
3. Foarde, K.K., J.T. Hanley, D.S. Ensor, and P.F. Roessler. 1999. Development of a Method for Measuring Single-Pass Bioaerosol Removal Efficiencies of a Room Air Cleaner. Aerosol Science and Technology. 30: 223-234.
4. ANSI/ASHRAE (American National Standards Institute/American Society of Heating, Refrigerating and Air-Conditioning Engineers). 1999. ANSI/ASHRAE Standard 52.2-1999, Method of Testing General Ventilation Air-Cleaning Devices for Removal Efficiency by Particle Size, Atlanta, GA.
5. NAFA (National Air Filtration Association). 2001. Product Certification Program Procedural Guide Approved Version 1, Second Revision February 2001. Virginia Beach, VA.
6. U.S. EPA. 2002. Environmental Technology Verification Program Quality Management Plan, EPA/600/R-03/021, U.S. EPA, Cincinnati, OH, 2002.
7. RTI (Research Triangle Institute). 1999. Environmental Technology Verification Test Method, General Ventilation Filters, Research Triangle Park, NC. ETV document web site. http://etv.rti.org/iap/documents.cfm.
8. Knight, V. 1973. Viral and Mycoplasmal Infections of the Respiratory Tract, Lea & Febiger, Philadelphia, PA.
9. Buckland, F.E., and Tyrell, D.A.S. 1962. Loss of Infectivity on Drying Various Viruses, Nature 195: 1063-1064.
10. Macher, J.M. 1989. Positive Hole Correction of Multiple-jet Impactors for Collecting Viable Microorganisms, American Industrial Hygiene Association Journal. 50: 561-568.
11. RTI (Research Triangle Institute). 2003. Quality Management Plan for Environmental Programs, Research Triangle Park, NC.
12. Microsoft Corporation. Microsoft Excel® 2000. Redmond, WA.
Research Triangle Institute ETV Test/Quality Assurance Plan Biological Testing of General Ventilation Filters Page 20
Appendix A: Test Specifications
Test specifications for the inert aerosol tests are defined in ASHRAE Standard 52.24 and shown in Table A1. These will be used for both the ASHRAE Standard 52.2 testing and the inert aerosol component of the bioaerosol test. The test specifications associated with the SMPS and the conditioning aerosol are found in Table A2. Table A3 shows the test specifications for the bioaerosol test. The test duct performance specifications applicable to all testing are found in Table A4.
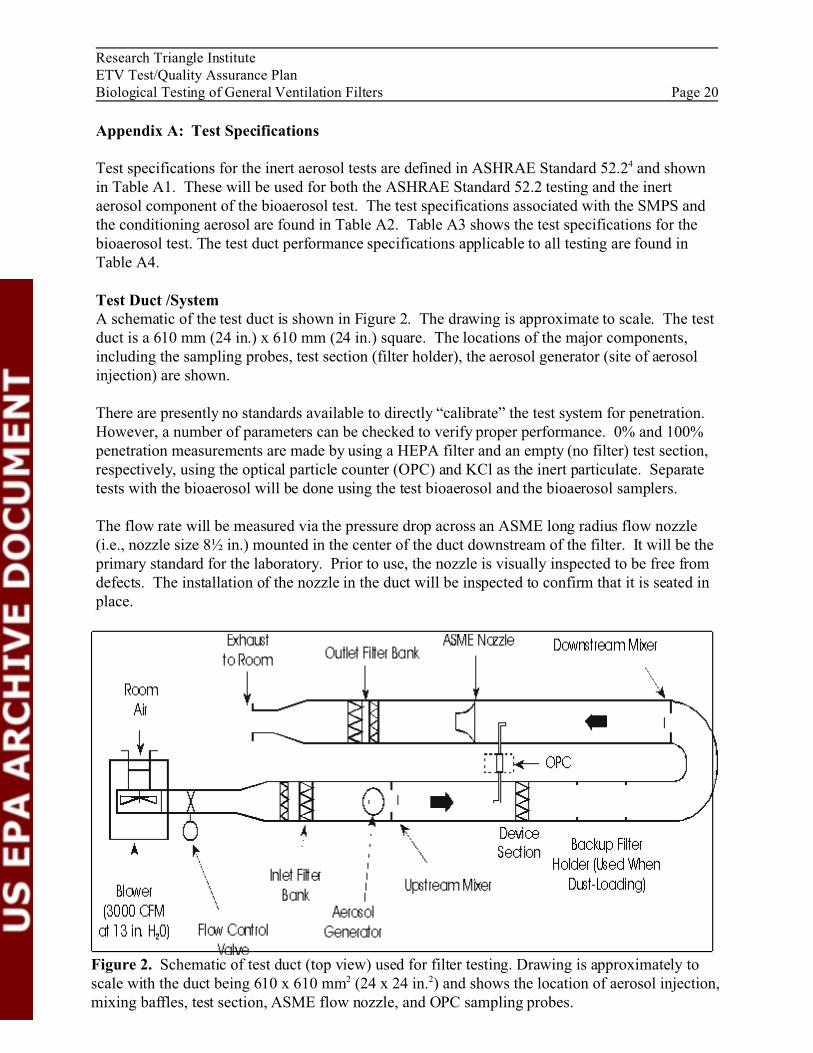
Test Duct /System A schematic of the test duct is shown in Figure 2. The drawing is approximate to scale. The test duct is a 610 mm (24 in.) x 610 mm (24 in.) square. The locations of the major components, including the sampling probes, test section (filter holder), the aerosol generator (site of aerosol injection) are shown.
There are presently no standards available to directly “calibrate” the test system for penetration. However, a number of parameters can be checked to verify proper performance. 0% and 100% penetration measurements are made by using a HEPA filter and an empty (no filter) test section, respectively, using the optical particle counter (OPC) and KCl as the inert particulate. Separate tests with the bioaerosol will be done using the test bioaerosol and the bioaerosol samplers.
The flow rate will be measured via the pressure drop across an ASME long radius flow nozzle (i.e., nozzle size 8½ in.) mounted in the center of the duct downstream of the filter. It will be the primary standard for the laboratory. Prior to use, the nozzle is visually inspected to be free from defects. The installation of the nozzle in the duct will be inspected to confirm that it is seated in place.
Figure 2. Schematic of test duct (top view) used for filter testing. Drawing is approximately to scale with the duct being 610 x 610 mm2 (24 x 24 in.2) and shows the location of aerosol injection, mixing baffles, test section, ASME flow nozzle, and OPC sampling probes.
Research Triangle Institute ETV Test/Quality Assurance Plan Biological Testing of General Ventilation Filters Page 21
The pressure drop across the filter will be measured with an inclined manometer and/or a digital micromanometer. The zero and level of the manometer will be confirmed and connecting tubing inspected for integrity.
Measurements of the in-duct temperature and relative humidity (RH) and room atmospheric pressure will be made. These measurements are not critical to the program and are being collected simply to document the general test environment. A wet and dry bulb psychrometer will be used for determination of temperature and relative humidity and an aneroid barometer for atmospheric pressure (periodically compared to a mercury barometer in an adjoining lab). For the bioaerosol, the RH goal is 20 - 70%. No specific quality control checks on these instruments are planned other than an inspection of the instruments for mechanical faults (e.g., mercury separation in the thermometers, poor tubing connections), and inspection of the data for reasonableness.
Table A1. Quality Control Parameters For Inert Aerosol Tests
Parameter Frequency and description
Control Limits
Minimum counts per OPCa
channel for challenge aerosol For each efficiency test, the total number of particles counted per OPC sizing channel for the upstream challenge aerosol is computed.
Minimum total of 500 particle counts per channel.
Maximum total OPC count per sample
Each efficiency test. Not to exceed maximum challenge aerosol concentration determined in the OPC upper concentration limit test referenced in Table A4.
100% Efficiency test (0% Penetration)
Monthly. A HEPA filter is used for the test device.
Measured penetration must be <0.01.
100% Penetration (correlation test)
A 100% penetration test performed at least once per week during testing.
Particle Acceptable Size range Penetration Range: 0.3 to 1 :m: 0.90 to 1.10 1 to 3 :m: 0.80 to 1.20 3 to 10 :m: 0.70 to 1.30
Penetration error limit for OPC data
Each test. Statistical check of data quality. Expected to be achieved on tests of clean air cleaners. May not always be achieved with dust-loaded air cleaners if the air cleaner sheds a significant amount of the collected dust.
Per definitions and procedures of ASHRAE 52.2 Section 10.6.44
T = T-distribution variable, n = number of samples, P = penetration (fraction), F = standard deviation
OPC calibration: primary calibration
Primary calibration performed by manufacturer at manufacturer-specified intervals; but at least annually.
Manufacturer provides certificate of calibration.
OPC sizing accuracy check: polystyrene latex spheres (PSL)
Daily. Sample aerosolized PSL spheres. Peak of distribution should be in correct OPC channel.
OPC reference filter check A filtration efficiency test is performed on a reference filter monthly during testing.
Efficiency must be consistent with reference filter measurements made after OPC’s primary calibration; efficiency within +/- 10 percentage points.
Research Triangle Institute ETV Test/Quality Assurance Plan Biological Testing of General Ventilation Filters Page 22
Parameter Frequency and Control Limits description
OPC zero count Each correlation and initial efficiency Less than 10 counts per sample. test.
Background count rate Measured during correlation and clean Upper 95% confidence limit on background counts must be less than 5% of filter tests. challenge counts.
Pressure drop across empty test section
Each correlation test. Measured pressure drop must be < 0.03 in. H2 O.
Pressure drop across the air Annual. Compare to reference Inclined fluid manometer or digital manometer readable to within ±0.01 in. cleaner manometer. H2 O. 10 % or better accurac y.
Pressure drop across the ASME Annual. Compare to reference Inclined fluid manometer or digital manometer readable to within ±0.01 in. flow nozzle used for manometer. H2 O. 10 % or better accurac y. measurement of airflow
Aerosol charge neutralizer Monthly. Confirm activity of radioactive Activity must be detected in radioactive neutralizers. Corona discharge charge neutralizers. Confirm balance of neutralizers must be in balance. corona discharge neutralizers.
Filter weight Filters will be weighed before and after Electronic balance with 0.1 g resolution, 10% accuracy or better, calibrated completion of dust-loading. annually.
Weight of ASHRAE dust fed Each test based on the change in weight Electronic balance with 0.1 g resolution, 10% accuracy or better, calibrated into the test duct of the dust on the dust-loading tray. annually.
a OPC = optical particle counter
Research Triangle Institute ETV Test/Quality Assurance Plan Biological Testing of General Ventilation Filters Page 23
Table A2. Quality Control Parameters Associated with Scanning Mobility Particle Sizer (SMPS) and Conditioning Aerosol
Parameter Frequency and description Control Limit
0% Efficiency test At least once every five efficiency tests. A Particle Acceptable (100% Penetration) 100% penetration test is performed with no
filter in the test section. Size range Penetration Range: 0.01 - 1.0 :m 0.70 to 1.30
SMPS: Standard deviation Computed for each efficiency test based on < 0.30 on upstream counts the upstream particle counts.
Conditioning aerosol concentration
Measured with a condensation particle counter (CPC).
Concentration will not exceed instrument’s specified concentration limit.
SMPS operational checks:
sizing accuracy check
instrument flow rates
instrument zero - filtered inlet
instrument zero - 0 volt setting
inlet impactor
photodetector
At start of project and at least weekly during testing, sample aerosolized monodisperse PSL spheres.
Confirmed prior to test program using reference flow meter.
Checked at start of project and weekly during testing.
Checked at start of project and weekly during testing.
Visually confirm inpactor orifice is free of debris and that the impactor plate is greased. Daily.
Check at start of program. Filter on CPC inlet and/or sample pump off.
A relative peak in the number distribution is observed within 20% of the PSL particle diameter
Flows should be within 10% of set points.
< 0.1 particle/cm3 a counted by CPC.
< 0.1 particles/cm3 counted by CPC.
Orifice clear of visible obstructions. Impactor has very thin film of vacuum grease.
0 +/- 0.05 volts
Reference flow meter Bios International Model DryCal DC1 Primary Air Flow Meter (soapless piston-type cell) or the Gilabrator (good for lower flowrates). Used to confirm SMPS flow rates at beginning of program.
Based on the fundamental nature of this positive displacement piston flow meter, the manufacturer’s accuracy claim is accepted. The unit is visually inspected for proper operation prior to use.
Reference manometer TSI Model 8702/8704 digital manometer Digital manometer to receive primary calibration by and/or Meriam Model 50MH10-8 inclined fluid manometer.
manufacturer within prior 12 months. Fluid manometer inspected for zero and level.
a cm3 = cubic centimeter
Research Triangle Institute ETV Test/Quality Assurance Plan Biological Testing of General Ventilation Filters Page 24
Table A3. Quality Control Parameters for Biological Aerosols
Parameter Frequency and description Control Limits
Minimum upstream counts for samplers Each efficiency test. Minimum of 10 CFUa /plate or PFUb /plate
Maximum counts for samplers Each efficiency test. Maximum of 400 CFU/plate or PFUb /plate
100% Penetration (correlation test)
Performed at least once per test sequence per organism
Test Acceptable Organism Penetration Range: B. subtilis 0.85 to 1.15 S. marcescens 0.80 to 1.20 MS2 0.85 to 1.15
Upstream CFUs Each test. Statistic al check of data quality. CVc # 0.20
Upstream PFUs Each test. Statistic al check of data quality. CVc # 0.35
a CFU = colony forming units b PFU = plaque forming unit c CV = coefficient of variance
Research Triangle Institute ETV Test/Quality Assurance Plan Biological Testing of General Ventilation Filters Page 25
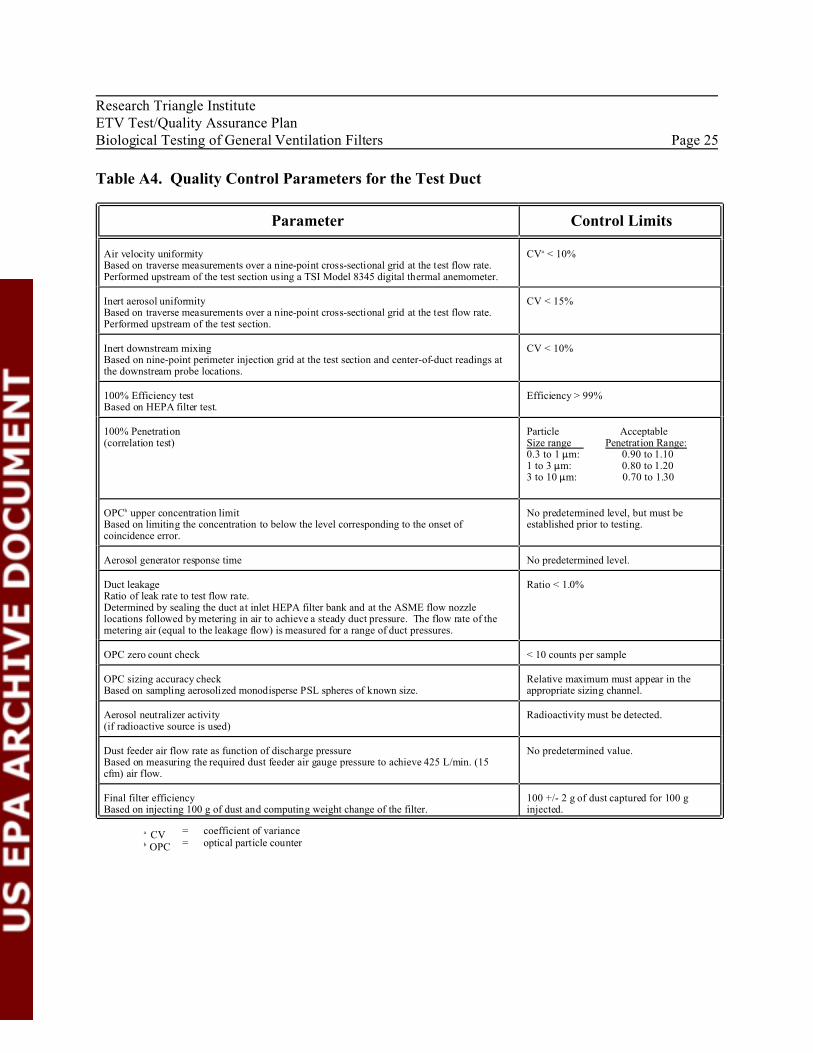
Table A4. Quality Control Parameters for the Test Duct
Parameter Control Limits
Air velocity uniformity Based on traverse measurements over a nine-point cross-sectional grid at the test flow rate.
CVa < 10%
Performed upstream of the test section using a TSI Model 8345 digital thermal anemometer.
Inert aerosol uniformity Based on traverse measurements over a nine-point cross-sectional grid at the test flow rate.
CV < 15%
Performed upstream of the test section.
Inert downstream mixing Based on nine-point perimeter injection grid at the test section and center-of-duct readings at
CV < 10%
the downstream probe locations.
100% Efficiency test Based on HEPA filter test.
Efficiency > 99%
100% Penetration (correlation test)
Particle Acceptable Size range Penetration Range: 0.3 to 1 :m: 0.90 to 1.10 1 to 3 :m: 0.80 to 1.20 3 to 10 :m: 0.70 to 1.30
OPCb upper concentration limit Based on limiting the concentration to below the level corresponding to the onset of
No predetermined level, but must be established prior to testing.
coincidence error.
Aerosol generator response time No predetermined level.
Duct leakage Ratio of leak rate to test flow rate.
Ratio < 1.0%
Determined by sealing the duct at inlet HEPA filter bank and at the ASME flow nozzle locations followed by metering in air to achieve a steady duct pressure. The flow rate of the metering air (equal to the leakage flow) is measured for a range of duct pressures.
OPC zero count check < 10 counts per sample
OPC sizing accuracy check Based on sampling aerosolized monodisperse PSL spheres of known size.
Relative maximum must appear in the appropriate sizing channel.
Aerosol neutralizer activity Radioactivity must be detected. (if radioactive source is used)
Dust feeder air flow rate as function of discharge pressure Based on measuring the required dust feeder air gauge pressure to achieve 425 L/min. (15
No predetermined value.
cfm) air flow.
Final filter efficiency Based on injecting 100 g of dust and computing weight change of the filter.
100 +/- 2 g of dust captured for 100 g injected.
a CV = coefficient of variance b OPC = optical particle counter
____________________________________________________________________
--
--
-- ----
Research Triangle Institute ETV Test/Quality Assurance Plan Biological Testing of General Ventilation Filters Page 26
Appendix B: Inert Aerosol Run Sheet
Date: _______________ Test Operator: ______________ Physical Description of Filter:
Test Requested by: _______________________Charge Number:___________________
Manufacturer: _________________________________________________________
Product Name: _________________________________________________________Staple photo to back of page 2.
Model: _________________________________________________________ Face image away from page.
Condition: New or From Field No damage or Slight frame damage and/or Media damage (Circle
all that apply)
Other/describe damage:
Generic Type: Flat Panel Pleated Panel -- Rigid Cell -- Mini Pleat -- V-Cell -- Bag Filter -- Ring Panel Filter
Washable -- Charged media Tackified — Parallel plate ESP plugs into 110V - Cartridge
Other: __________________________________________________
Number of pleats, bags, V cells: ____________________________________________
Other Attributes: ________________________________________________________
Height Width Thickness Media Type (if known) Media Color
Correlation Test: (use 3/3 - 10/9 - 3/3 sampling)
Date: _______________ Time: ____________________
Flow rate manometer zeroed and level: _____ Filter pressure drop manometer zeroed and level: _____
OPC clock correct: _________________________ Valve switch on: _________
OPC: (Set for 0.10 ft3 samples with 15 second purge; use 3/3 - 10/9 - 3/3 sampling)
20 min warm up
T
Flow is 0.25 cfm
T
CI-226 switch “Low” T or n/a
Zero Check < 10 total / sample
enter actual count* Daily PSL check (Enter size when performed or T if done earlier today)
File Name c:\climet\rpmmddyyss R P MM DD YY SS
HEPA capsule or In-duct ** **
* must meet <10 criteria at least once per 52 .2 test. ** Save daily check to disk using file name. Notify project manager if limit is exceeded. RPMMDDYY-HEPA-PSL.TXT
Research Triangle Institute ETV Test/Quality Assurance Plan Biological Testing of General Ventilation Filters Page 27
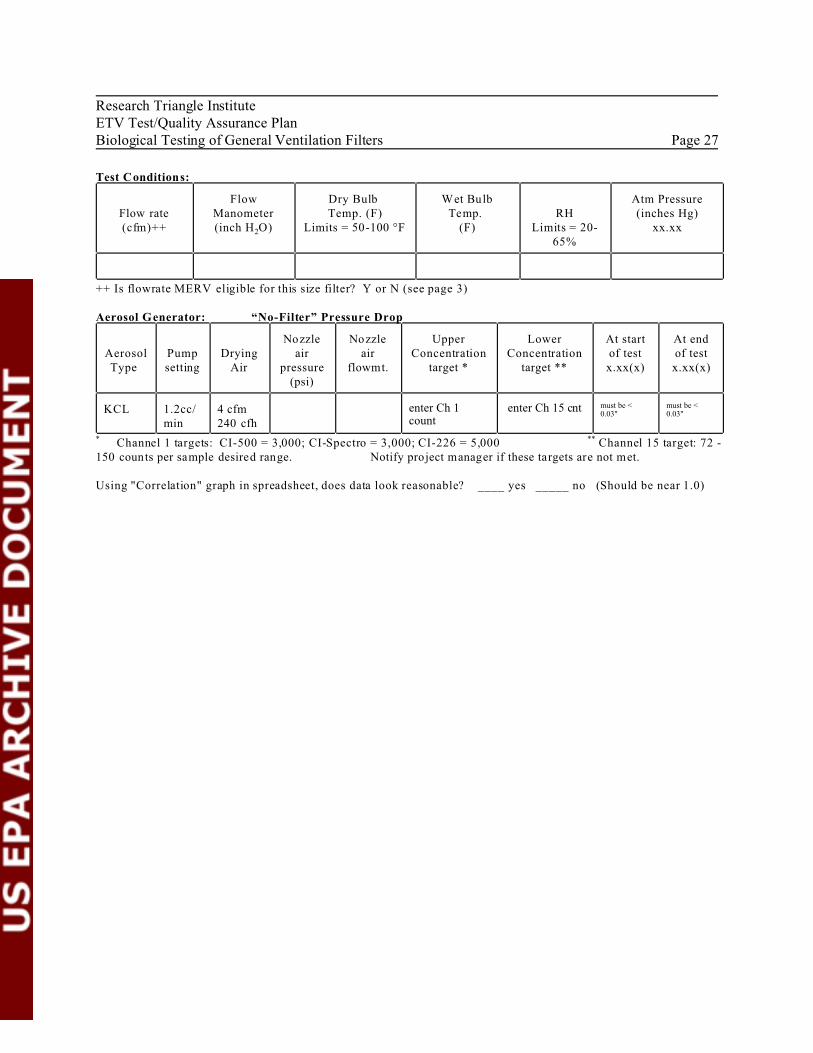
Test Conditions:
Flow rate (cfm)++
Flow Manometer (inch H2O)
Dry Bulb Temp. (F)
Limits = 50-100 °F
Wet Bulb Temp.
(F) RH
Limits = 2065%
Atm Pressure (inches Hg)
xx.xx
++ Is flowrate MERV eligible for this size filter? Y or N (see page 3)
Aerosol Generator: “No-Filter” Pressure Drop
Aerosol Type
Pump setting
Drying Air
Nozzle air
pressure (psi)
Nozzle air
flowmt.
Upper Concentration
target *
Lower Concentration
target **
At start of test x.xx(x)
At end of test x.xx(x)
KCL 1.2cc/ min
4 cfm 240 cfh
enter Ch 1 count
enter Ch 15 cnt must be < 0.03"
must be < 0.03"
* Channel 1 targets: CI-500 = 3,000; CI-Spectro = 3,000; CI-226 = 5,000 ** Channel 15 target: 72 150 counts per sample desired range. Notify project manager if these targets are not met.
Using "Correlation" graph in spreadsheet, does data look reasonable? ____ yes _____ no (Should be near 1.0)
Research Triangle Institute ETV Test/Quality Assurance Plan Biological Testing of General Ventilation Filters Page 28
Appendix C: Bioaerosol Run Sheet
Filter #:_____________Run #:_________
Date:_____________________________
Test Operator:______________________
Climet Filename:_____________________
Test Conditions:
Test Flow Rate ASM E Nozzle Pressure Drop
Temperature RH Ambient Atm Pressure
CFM in.
H2O °F % in. Hg
Biological Suspension: Organism:_________________________________________
Suspension Prep:___________________________________
Drying Air:________________________________________
Nebulizer Pressure:__________________________________
Initial Volume:______________________________________
Time On:__________________________________________
Biological Sampling:
Sample # Time Run B egins Sample Length (min.) Media
U1, U2, U3
D1, D2, D3
D4, D5, D6
U4, U5, U6
U7, U8, U9
D7, D8, D9
D10, D11, D12
U10, U11, U12
Ui = upstream sample i Di = downstream sample i
Rotometer/Vac #1 Reading:_______________________________________
Rotometer/Vac #2 Reading:_______________________________________
Rotometer/Vac #3 Reading:_______________________________________