Embed Size (px)
Citation preview

ReferenceNBSPubli-
NATL INST. OF STAND & TECH
A111DS TA5flb?
'•ons
v
7"
*^EAU O* *s NBS TECHNICAL NOTE 1056
U.S. DEPARTMENT OF COMMERCE / National Bureau of Standards
•QC
100
.U5753
No. 105
1933

NATIONAL BUREAU OF STANDARDS
The National Bureau of Standards' was established by an act of Congress on March 3, 1901.
The Bureau's overall goal is to strengthen and advance the Nation's science and technology
and facilitate their effective application for public benefit. To this end, the Bureau conducts
research and provides: (1) a basis for the Nation's physical measurement system, (2) scientific
and technological services for industry and government, (3) a technical basis for equity in
trade, and (4) technical services to promote public safety. The Bureau's technical work is per-
formed by the National Measurement Laboratory, the National Engineering Laboratory, and
the Institute for Computer Sciences and Technology.
THE NATIONAL MEASUREMENT LABORATORY provides the national system of
physical and chemical and materials measurement; coordinates the system with measurement
systems of other nations and furnishes essential services leading to accurate and uniform
physical and chemical measurement throughout the Nation's scientific community, industry,
and commerce; conducts materials research leading to improved methods of measurement,
standards, and data on the properties of materials needed by industry, commerce, educational
institutions, and Government; provides advisory and research services to other Government
agencies; develops, produces, and distributes Standard Reference Materials; and provides
calibration services. The Laboratory consists of the following centers:
Absolute Physical Quantities 2 — Radiation Research — Chemical Physics —Analytical Chemistry — Materials Science
THE NATIONAL ENGINEERING LABORATORY provides technology and technical ser-
vices to the public and private sectors to address national needs and to solve national
problems; conducts research in engineering and applied science in support of these efforts;
builds and maintains competence in the necessary disciplines required to carry out this
research and technical service; develops engineering data and measurement capabilities;
provides engineering measurement traceability services; develops test methods and proposes
engineering standards and code changes; develops and proposes new engineering practices;
and develops and improves mechanisms to transfer results of its research to the ultimate user.
The Laboratory consists of the following centers:
Applied Mathematics — Electronics and Electrical Engineering2 — Manufacturing
Engineering — Building Technology — Fire Research — Chemical Engineering2
THE INSTITUTE FOR COMPUTER SCIENCES AND TECHNOLOGY conducts
research and provides scientific and technical services to aid Federal agencies in the selection,
acquisition, application, and use of computer technology to improve effectiveness and
economy in Government operations in accordance with Public Law 89-306 (40 U.S.C. 759),
relevant Executive Orders, and other directives; carries out this mission by managing the
Federal Information Processing Standards Program, developing Federal ADP standards
guidelines, and managing Federal participation in ADP voluntary standardization activities;
provides scientific and technological advisory services and assistance to Federal agencies; and
provides the technical foundation for computer-related policies of the Federal Government.
The Institute consists of the following centers:
Programming Science and Technology — Computer Systems Engineering.
'Headquarters and Laboratories at Gaithersburg, MD, unless otherwise noted;
mailing address Washington, DC 20234.2Some divisions within the center are located at Boulder, CO 80303.

/VSS Techntc^i Nok.taauM*
<s?c
Picosecond Time Difference .'Ss-7^^
Measurements Utilizing CAMAC-Based Vco./^s
ANSI/IEEE-488 Data Acquisition m 3
HardwareOperating Manual IE3
Version 1.0
D.J. Glaze
S.R. Stein
Time and Frequency Division
National Measurement Laboratory
National Bureau of Standards
U.S. Department of CommerceBoulder, Colorado 80303
/ V %
U.S. DEPARTMENT OF COMMERCE, Malcolm Baldrige, Secretary
NATIONAL BUREAU OF STANDARDS, Ernest Ambler, Director
Issued August 1 983
National Bureau of Standards Technical Note 1056
Natl. Bur. Stand. (U.S.), Tech. Note 1056, 36 pages (August 1983)
CODEN: NBTNAE
U.S. GOVERNMENT PRINTING OFFICEWASHINGTON: 1983
For sale by the Superintendent of Documents, U.S. Government Printing Office, Washington, DC 20402
Price $3.75
(Add 25 percent for other than U.S. mailing)

CONTENTS
1. Introduction 1
2. Theory 2
3. Hardware Description and Configuration 2
3.1 Crate Configuration 3
3.2 Module Configuration and Installation 3
3.3 System Synthesizer 4
3.4 System Signals, Cables, and Connections 4
3.5 Cables for 5 MHz Signals 4
3.6 Other Cable Connections 6
3.7 Configuration of Remaining Switches 6
3.8 System Controller 7
3.9 System Clock 7
3.10 System Plotter 7
4. Operation 7
4.1 Power Up Sequence 7
4.2 Operation 8
5. Software Description and Discussion 10
5.1 Introduction 10
5.2 Command Structure 10
5.3 General Program Flow for Data Acquisition 11
5.4 Detailed Program Flow for Data Acquisition 12
5.5 Detailed Program Flow for Data Processing 15
Appendix 24
l] l

Picosecond Tine Difference MeasurementsUtilizing CAMAC-Based ANSI/ TEEE-488 Data Acquisition Hardware
Operating Manual TE3 Version 1.0
D. J. Glaze and S. R. SteinTime and Frequency 'Division
National Bureau of StandardsBoulder, Colorado 80303
Automated time-difference measurements at the picosecond level
have been achieved. The system described combines the best propertiesof three common methods: the single heterodvne measurement technique,the frequency divider, and the dual-mixer time-difference measurementsystem. This particular system combines two instrumentation standards,ANSI/IEEE-583 and ANSI/ I EEE-488 with new, modular dual -mixer time-difference measurement hardware. The modular, standardized hardwaretogether with the new measurement techniques permit the data acqui-sition modules to be contained in a standard CAMAC crate. This system,along with an external controller, is capable of measuring eight clocks,at the present time, and is expandable to twenty-four clocks withmodified software and additional measurement modules. The system noise
-12 -1performance is described by a (t) = 3 x 10 t for time differencemeasurements.
Key words: ANSI/IEEE-488; ANSI/IEEE-583; automated data acquisitionsystem; dual-mixer measurements; picosecond time-difference measurements
1. Introduction
The measurement system described was developed to make simple, reliable
picosecond time-difference measurements on high-performance atomic frequency
standards utilized in such applications as atomic scale systems, laboratory or
field calibrations, sigma-tau and phase stability measurements. Utilization
of adjacent time-difference or phase points provides frequency measurement
capability. Software and hardware available yield phase data, sigma-tau data
and phase plots (on suitable output devices).
The hardware utilizes two special modules commercially manufactured to
NBS specifications. Other special modules, low-noise, isolation amplifiers,
were not commercially available in the form required at the time the system
was implemented. These items were designed and constructed at the NBS
laboratories. All other items, CAMAC crate and interface modules, clock
timer, and computing calculator operating over the IEEE-488 bus, are
commercially available.
The system has been designed to provide time-difference capability for
measurement intervals of 1 second and longer. The speed of the specific
implementation described below is limited by software to intervals 5 seconds
and longer. Hardware limitations for the present system are due to the tape
cartridge which limits data collection to 100 points each for eight clocks
under test. System performance is best described by a specification of:
o (t) = 3 x 10" 12/t
2. Theory
A theoretical description of the system operation is included in Appendix
1.
3. Hardware Description and Configuration
The modular design of the data acquisition hardware used in this system
employs a standard CAMAC (IEEE-583) crate, Model 1500-P1K, and power supply as
supplied by the manufacturer . The interface modules are designated in the
following way:
Model 3981-Z1B Auxiliary rate controller
Model 3953-Z1B Auxiliary controller adapter
Model 3388-G1A IEEE-488 interface
Equivalent hardware manufactured by other vendors is expected to function
in precisely the same manner but has not been tested.
The following manuals are provided by the manufacturer of the CAMAC
equipment
Model 1500 powered CAMAC crate
Model 3388-G1A IEEE-488 interface
Model 3953-Z1B Auxiliary controller adapter
Model 3981-Z1B Auxiliary crate controller
Model 8021 3981-Based IEEE-488 crate
Controller system
Model 6120-B10 Software manual
Routines for 488-controlled
CAMAC I/O
Block diagrams for the operation and control of the pulse distribution
module and the quad clock measurement modules are also included. These
circuit diagrams are important to an understanding of the system. They
contain sufficient information to permit the design of compatible measurement
equipment.
3.1 Crate Configuration
As supplied , the crate is Model 1500-P1Z. Power to the crate and
modules is derived from a rear mounted, modular power supply. It provides
± 24V dC, ± 12V dC, and ± 6V dC. When mounting the power supply to the crate,
follow instructions provided in the crate manual. Install the sheet
insulating film provided between the power supply and the crate dataway
wirewrap pins. Failure to do so may cause shorts on various pins and destroy
the crate and power supply.
3.2 Module Configuration and Installation
Modules are installed in the following way. The crate is constructed so
that modules are installed from the front into numbered openings or slots.
These slots are numbered from left to right beginning with 1 and continuing
through 25. Slot 25 is not a normal slot, but is used for controllers only.

Connect the 40 pin ribbon cable to the connectors on the back and top of
the 3953 module and the 3981 module. Note that the 40 pin cable does not
connect to the 3388 module.
2Install the pulse distribution module in the slots labelled 1 and 2.
N=2 for this module.
2Install the first quad measurement module" in the slots labelled 3 and 4,
and the second one in slots 5 and 6. The crate addresses for these modules
are N=3 and N=5 respectively. Two of these modules will permit measurement of
8 clocks. Up to four more quad measurement modules may be added to the system
allowing measurement of 24 clocks; however software modifications would be
required for these additional modules.
3.3 System Synthesizer
The synthesizer, is offset in frequency by 10Hz below the nominal 5.0 MHz
value. The synthesizer (user provided) must be referenced to the clock which
drives the master channel.
3.4 System Signals, Cables, and Connections
All RF signals are nominally IV rms at the 50 ohm impedance level. With
the present release of system software, (IE3 version 1.0) channel 1 must be
the master channel
.
3.5 Cables for 5 MHz Signals
Connect cables from clocks to be measured, through suitable isolation
amplifiers, to the SMA clock inputs of each quad measurement module. Signals
for the NBS isolation amplifiers should be IV rms at the 50 ohm impedance
level
.
Attach cables from the synthesizer output, again suitably isolated, to
the offset reference SMA connector(s) of the quad measurement module(s).

Install the 3953-Z1R auxiliary controller adapter in the last pair of
slots: 24 and 25. The crate address for this nodule is N=25.
Prior to installation of the 3388-G1A module, set the eight-section
switch on the circuit board so that all sections are off. Install the
3388-G1A in the next pair of slots: 22 and 23. The crate address for this
module is N=23. However, commands written to this module by the program use
the address 700.
Prior to installation of the 3981-Z1B module check to see if the
following wire-wrap jumpers have been installed. If not, install them and
check to see that no shorts exist between wirewrap pins and adjacent traces of
the circuit board. Use only one set of jumpers corresponding to the
particular prom supplied. The circuit board jumper pins are numbered from 1
to 14.
Prom 2708 or Prom TI2716
Connect Pins: 9 to 13 9 to 3
11 to 3 11 to 8
10 to 13 10 to 2
12 to 2 12 to 8
7 to 8 7 to 13
14 to 5 14 to 6
1 to 4 1 to 5
Consult the 3981-Z1B hardware manual on page 4-2. Note the location and
orientation of the prom sockets and install the prom in socket designated prom
1. The four-section switch on the module circuit board should be set so that
all sections are off.
Install the 3981-Z1B auxiliary crate controller in slot 21. N=21 for
this module.

Connect a cable from the isolated signal driving channel 1 to the synthesizer
reference input. The frequency of the reference signal for the synthesizer
should be nominally 5.0 MHz within manufacturers specifications. Set the
synthesizer frequency to 4.9999900 MHz (10 Hz below nominal 5.0 MHz).
3.6 Other Cable Connections
In subsequent discussions the following conventions apply:
QMM = Quad measurement module
PDM = Pulse distribution module
Attach cables as follows. Use LEMO COAX cables:
From To
PDM (Slots 1, 2) QMM(l) (Slots 3, 4)
Master CH 10 Hz in Channel 1 10 Hz out
PDM 10 MHz out QMM(l) 10 MHz in
PDM 10 MHz out QMM(2) (Slots 5, 6)
10 MHz in
PDM ARM/Start out QMM1 ARM/Start in
PDM ARM/Start out QMM2 ARM/Start in
3981 Request 3981 Grant in
Attach IEEE-488 cables as follows:
From To9825A, 9872A 3388 IEEE-488 Conn.
59308A (see H and I and J below)
3.7 Configuration of Remaining Switches
3981 module. Set halt-cont switch to center position. This switch is
spring loaded and will remain in this position. Set the enable-disable switch
to enable position.
3953 module. Set the online-offline switch to online position. C-Z
switch should be at center position (spring loaded and will return to center).
3.8 System Controller
3The system controller for this application is a 9825A desk top
calculator. Required components are:
9872A plotter-gen I/O ROM
98216A extended I/O ROM
98210A string-adv prog ROM
As operated in this system, the 9825A has a total of 23228 bytes of
memory. Any other IEEE-488 compatible controller will work with modifications
in software. There may be some effect on system speed.
3.9 System Clock
3The system "clock" is a 59308A timing generator.
Switch Positions: Front Panel: Function SW: Pacer
Rear Panel: Ext Freq Std: 5 MHz
Ext. Std. Signal: 5.0 MHz derived from
System ref. signal driving channel 1.
Bus Pacer: Off
Trigger and option sections: Not used
Switch A: Al=l; All other sections = zero
3.10 System Plotter
3The plotting hardware for the system is a four color pen plotter, Model
9872A.
4. Operation
4.1 Power Up Sequence
When all cables and components are properly installed, the crate may be
turned on. Check the multifunction meter monitoring system and the crate

manual to be certain that operating voltages and currents are proper. The
voltages should be at the monitor set point in all cases.
The other IEEE-488 devices may be powered up. The tape cartridge
containing the operating software should be installed in the 98?5A. (Rewind
the cartridge before it is removed. Failure to do so may destroy program or
data stored near the position of the tape head) rewind the cartridge. Press
erase a, then reset, for power-up mode only.
4.2 Operation
Data are stored on the tape cartridge on track 1. This track must be
formatted before the program can store data. One should use the following
commands to format the data tape:
Rewind
TRK 1
Execute
MRK, 800, 64
Execute
Rewind
One may mark more files than 800, but usually only approximately 80? files may
be marked before end of tape (EOT) and an error are encountered.
To begin the data acquisition phase of the operation, one must execute
the following commands:
TRK
Execute
LDF
Execute
Run
The controller will now prompt responses from the operator. The
questions and responses will be described in a subsequent section. After all
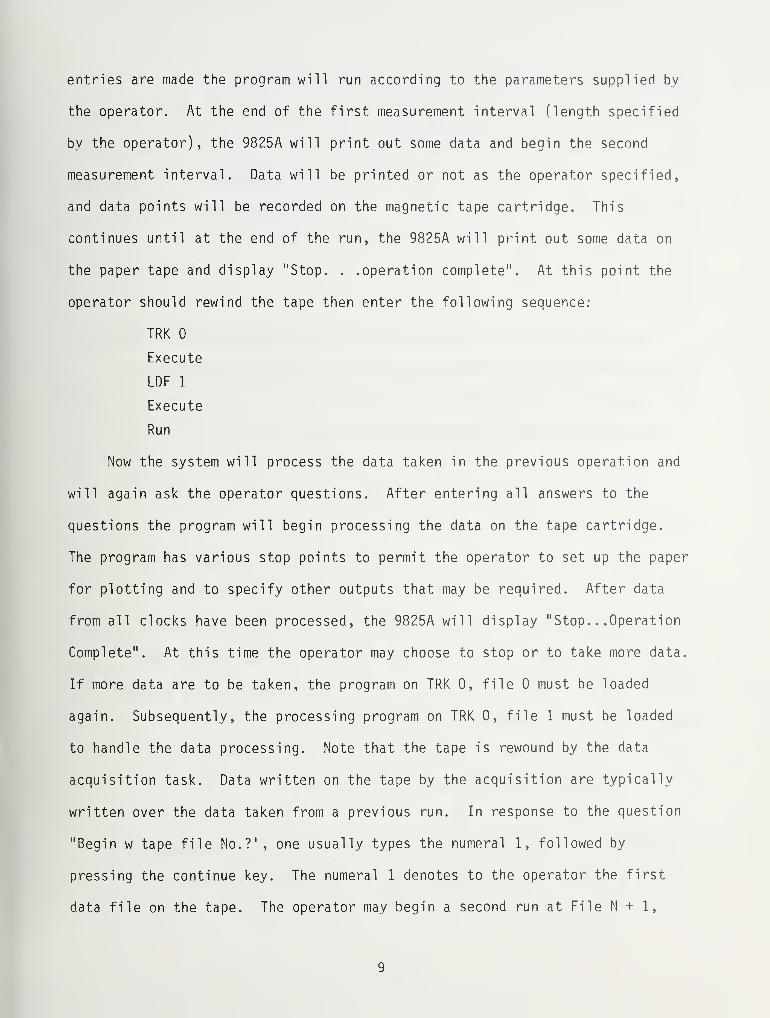
entries are made the program will run according to the parameters supplied by
the operator. At the end of the first measurement interval (length specified
by the operator), the 9825A will print out some data and begin the second
measurement interval. Data will be printed or not as the operator specified,
and data points will be recorded on the magnetic tape cartridge. This
continues until at the end of the run, the 9825A will print out some data on
the paper tape and display "Stop. . .operation complete". At this point the
operator should rewind the tape then enter the following sequence:
TRK
Execute
LDF 1
Execute
Run
Now the system will process the data taken in the previous operation and
will again ask the operator questions. After entering all answers to the
questions the program will begin processing the data on the tape cartridge.
The program has various stop points to permit the operator to set up the paper
for plotting and to specify other outputs that may be required. After data
from all clocks have been processed, the 9825A will display "Stop. . .Operation
Complete". At this time the operator may choose to stop or to take more data.
If more data are to be taken, the program on TRK 0, file must be loaded
again. Subsequently, the processing program on TRK 0, file 1 must be loaded
to handle the data processing. Note that the tape is rewound by the data
acquisition task. Data written on the tape by the acquisition are typically
written over the data taken from a previous run. In response to the question
"Begin w tape file No.?', one usually types the numeral 1, followed by
pressing the continue key. The numeral 1 denotes to the operator the first
data file on the tape. The operator may begin a second run at File N + 1,
thereby not writing over the first points taken in an earlier run. One must
remember, however, where the break points are; otherwise, the data processing
task may run together points from more than one set of data, and incorrect
results will occur. One may of course use a second data tape if previous data
are to be retained. The total number of points recorded may not exceed 800 on
any given tape (typically 100 per clock for 8 clocks).
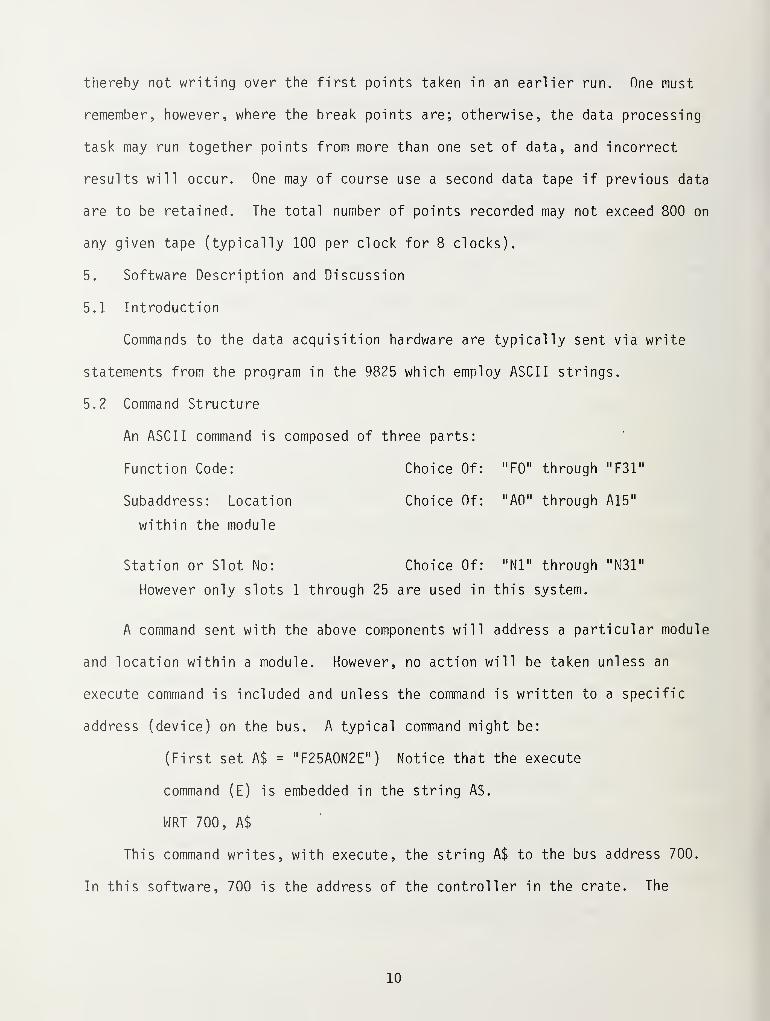
5. Software Description and Discussion
5.1 Introduction
Commands to the data acquisition hardware are typically sent via write
statements from the program in the 9825 which employ ASCII strings.
5.2 Command Structure
An ASCII command is composed of three parts:
Function Code: Choice Of: "F0" through "F31"
Subaddress: Location Choice Of: "A0" through A15"
within the module
Station or Slot No: Choice Of: "Nl" through "N31"
However only slots 1 through 25 are used in this system.
A command sent with the above components will address a particular module
and location within a module. However, no action will be taken unless an
execute command is included and unless the command is written to a specific
address (device) on the bus. A typical command might be:
(First set A$ = "F25A0N2E") Notice that the execute
command (E) is embedded in the string A$.
WRT 700, A$
This command writes, with execute, the string A$ to the bus address 700.
In this software, 700 is the address of the controller in the crate. The
10

string sent, F25A0N2E, causes the crate controller to initiate a measurement
sequence: (This occurs when the above command string is sent to the Pulse
Distribution module through the crate controller.)
F25 is the Measurement command
AO is the Address within the slot
N2 is the Slot no. of the Pulse Distribution module
(701 is the address of the system clock)
(705 is the address of the system plotter)
5.3 General Program Flow for Data Acquisition
As described in Section 5.2, a command has been sent to the 3388 module ,
which then causes a measurement sequence in the PDM module, in Slot N=2, to be
initiated. All measurements are started by the PDM. After the read command
(as above) is received by the PDM, the following sequence occurs:
1. The PDM issues an ARM/Start Command wich arms the counters.
2. The next 10 Hz zero-crossing starts the system counters for all quad
meas. modules.
3. The following 5 MHz zero-crossings, obtained from each of the
individual clock signals, stop the 10 Mhz counters on each individual channel.
At this point the data, in the counters at the time of the measurement,
are stored in registers in the 3981 module. Data are read out in the form of
three bytes (24 bits are required to contain the data word):
1. High order data byte: Bits 24 through 17
2. Middle order byte: Bits 16 through 9
3. Low order data byte: Bits 8 through 1
These three bytes are transferred out of the registers in the 3981 into
variables defined in the 9825A data acquisition task. These variables are
combined algebraically to form the raw data. Both the 10 Hz and 10 MHz
11
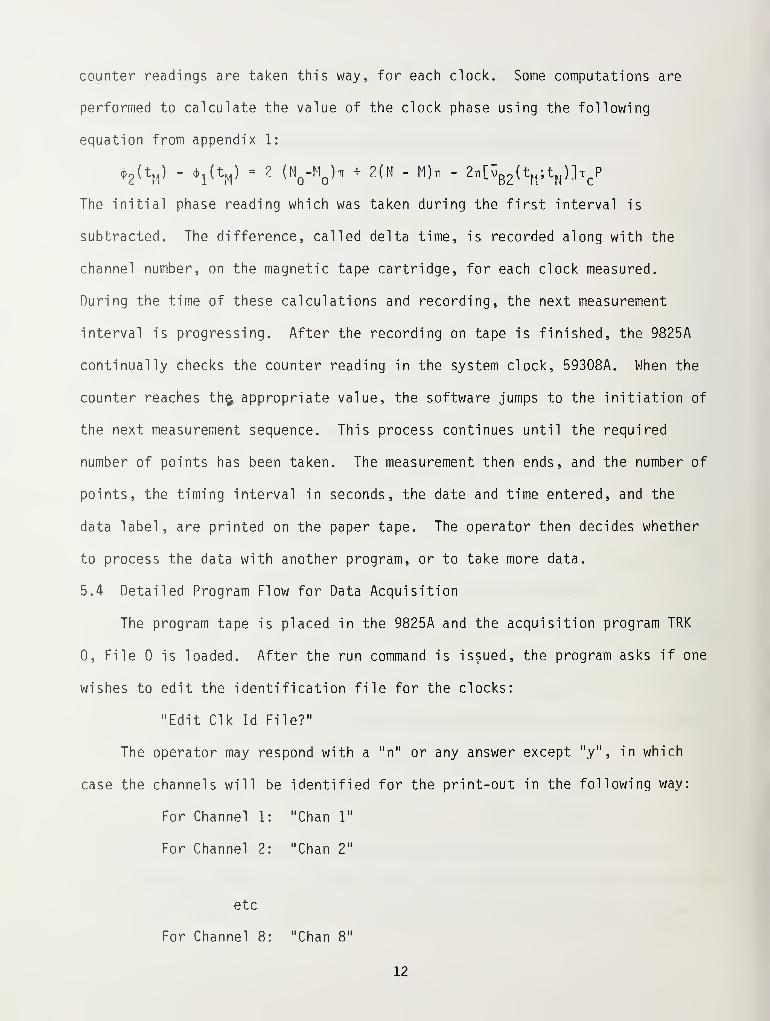
counter readings are taken this way, for each clock. Some computations are
performed to calculate the value of the clock phase using the following
equation from appendix 1:
*2(t
M ) - *!(tM ) = 2 (N -M )ir + 2(N - M).ir - 2^^
B 2(
t
M;t
N)]T
cP
The initial phase reading which was taken during the first interval is
subtracted. The difference, called delta time, is recorded along with the.
channel number, on the magnetic tape cartridge, for each clock measured.
During the time of these calculations and recording, the next measurement
interval is progressing. After the recording on tape is finished, the 9825A
continually checks the counter reading in the system clock, 59308A. When the
counter reaches th$ appropriate value, the software jumps to the initiation of
the next measurement sequence. This process continues until the required
number of points has been taken. The measurement then ends, and the number of
points, the timing interval in seconds, the date and time entered, and the
data label, are printed on the paper tape. The operator then decides whether
to process the data with another program, or to take more data.
5.4 Detailed Program Flow for Data Acquisition
The program tape is placed in the 9825A and the acquisition program TRK
0, File is loaded. After the run command is issued, the program asks if one
wishes to edit the identification file for the clocks:
"Edit Clk Id File?"
The operator may respond with a "n" or any answer except "y" , in which
case the channels will be identified for the print-out in the following way:
For Channel 1: "Chan 1"
For Channel 2: "Chan 2"
etc
For Channel 8: "Chan 8"
12

The operator may also respond with a "y" , in which case the program will
ask: "Channel 1 Clk ID?... 6 Char max". To this the operator should respond
by typing some suitable name for the clock driving channel 1, then press
continue. The program will ask for identification for each clock in turn, and
then the following sequence occurs.
1. Initialize command is sent to the crate, i.e., "ZE".
2. Enable channel operation command is sent to all even sub-addresses of
the two QMM's, i.e., "F26A0N3E".
3. Reset LAM Status command is sent to all odd sub-addresses of the
QMM's, i.e., "F10A1N3E".
4. Reset 10 Hz register overflow command is sent to all even
sub-addresses of the QMM's, i.e., "F9A0N3E".
5. Reset 10 Hz register command is sent to all even sub-addresses of the
QMM's, i.e., "F12A0N3E".
After this sequence is completed, the program asks several questions.
6. "Enter Date. . .dd-mmm-yy" ; the operator types e.g., 27-Apr-82, and
then presses continue.
7. "Label?" The operator may enter a label describing the experiment,
up to 35 characters, then press continue.
8. "Print Data Output?" A "y" answer here causes flag 2 to be cleared.
This in turn causes all data from each point to be printed on the paper tape.
The data are always recorded on the magnetic tape cartridge. If, after a few
points are printed, the operator wishes to stop the print-out, one simply
types "sTg2", followed by "execute", from the live keyboard during a time when
the program is in the timing interval between points. This action will
suppress all further print-outs until the program ends. Any answer other than
"y" to question 8, will inhibit all print out except the value subtracted from
13

the delta time reading during the first timing interval. Selecting the print
option slows the program significantly. With printing, eight clocks require
at least 40 seconds. Without printing, this is reduced to approximately 5
seconds.
9. "Enter Seconds in timing interval". This is the number of seconds
desired for the elapsed time between points. Type the number (not less than 5
discussed above), then press continue.
10. "Number of clocks?" A number from 1 to 8 should be typed, then
press continue. If a number greater than 8 is entered, the program displays
"Max Clocks = 8" and returns to question 10 for the proper response.
11. "No. of points?" The operator should enter the number of points per
clock desired for that run, then press continue. The program must take one
more point in order to compute frequency for the first interval. However,
this is accounted for in the program, and the number of points requested will
be taken, provided there is room on the magnetic tape.
12. "Begin w/tape file no.?" If the first data file on the tape is to
be used, enter 1, and then press continue. If one wants to skip over data
already recorded, e.g., to the 16th point, type 16, then continue. This
option is included only to permit one to save previously recorded data. One
must, however, keep track of these points on the data tape, because the phase
points will not be continuous from one run to the next, the processing program
will not know that more than one run exists in the data set, and erroneous
results will occur.
13. "To start timing, press continue". Here is a pause so that the
operator may start the run on a particular second. When continue is pressed,
the program begins data acquisition according to the entries made by the
operator. The system will run until the specified number of points has been
14
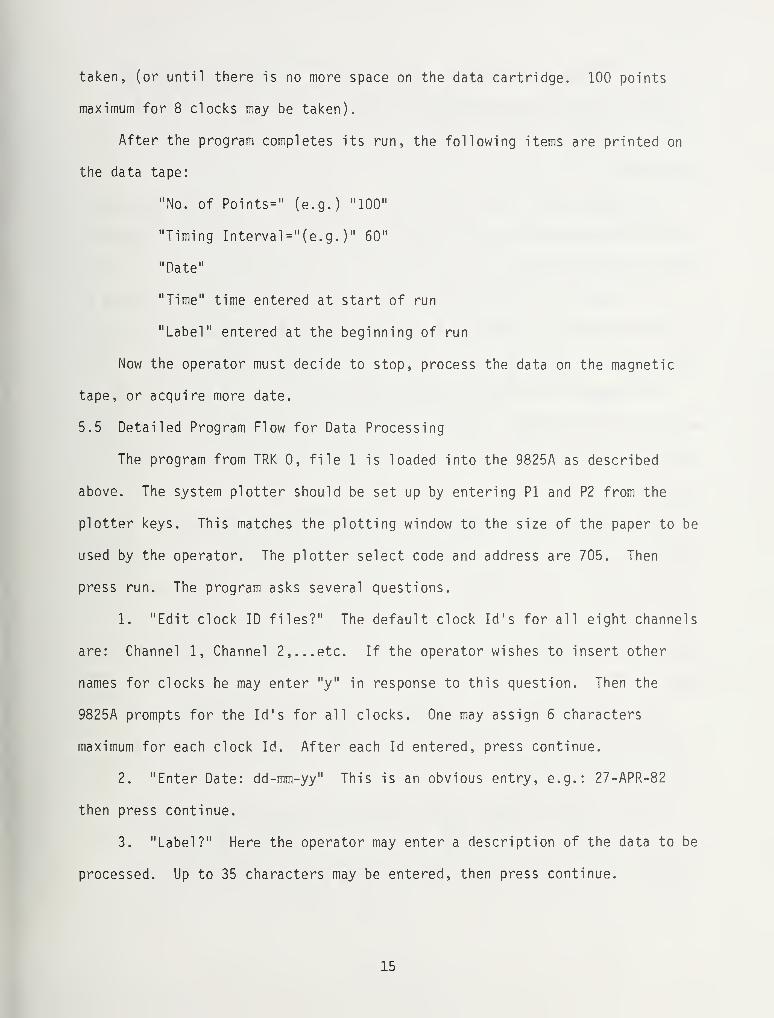
taken, (or until there is no more space on the data cartridge. 100 points
maximum for 8 clocks may be taken).
After the program completes its run, the following items are printed on
the data tape:
"No. of Points=" (e.g.) "100"
"Timing Interval="(e.g. )" 60"
"Date"
"Time" time entered at start of run
"Label" entered at the beginning of run
Now the operator must decide to stop, process the data on the magnetic
tape, or acquire more date.
5.5 Detailed Program Flow for Data Processing
The program from TRK 0, file 1 is loaded into the 9825A as described
above. The system plotter should be set up by entering PI and P2 from the
plotter keys. This matches the plotting window to the size of the paper to be
used by the operator. The plotter select code and address are 705. Then
press run. The program asks several questions.
1. "Edit clock ID files?" The default clock Id's for all eight channels
are: Channel 1, Channel 2,... etc. If the operator wishes to insert other
names for clocks he may enter "y" in response to this question. Then the
9825A prompts for the Id's for all clocks. One may assign 6 characters
maximum for each clock Id. After each Id entered, press continue.
2. "Enter Date: dd-mm-yy" This is an obvious entry, e.g.: 27-APR-82
then press continue.
3. "Label?" Here the operator may enter a description of the data to be
processed. Up to 35 characters may be entered, then press continue.
15
4. "Process data tape?" If one answers "n" or any answer other than
"y", the program branches unconditionally to the end and stops, displaying:
"Stop. . .operation complete". If one answers "y" » tape processing begins with
question 5.
5. "Read all 8 clocks?" A "y" answer here sets a counter so that data
for all 8 clocks will be read from the tape. Branch to question 7. Any other
answer causes a branch to question 6.
6. "Enter No. of Clocks to be Read". Here one enters a number from 1 to
8. The clocks will be read beginnning with clock 1 and ending with the clock
number entered by the operator. The program continues with question 7.
7. "Number of First data point?" Enter the number of the data point
with which the run began. If it is the first point taken, enter 1, and press
continue. If one wants to skip to the 10th point, enter 10, ...etc., then
continue.
8. "Number of last data point?" If 100 points were taken, type 100,
then press continue. If one wishes to process only a partial set of the data,
type the number of the end point and then press continue. One must specify at
least 4 points, otherwise some of the subroutines will not work correctly.
Obviously there must be at least 4 points on the tape from the acquisition
task.
9. "Measurement Interval, Seconds." Here one should enter the number of
seconds in the timing or measurement interval for the data run, e.g., type
100, then press continue.
At this point the tape is read. All points specified for all clocks
specified are read. For 8 clocks and 100 points this may take about 6
minutes. Then a branch to question 10, the actual processing, occurs.
16

10. "Compute sigma(y)?" If one wishes a sigma-tau plot of the data, the
answer to this question should be "y". If not the program branches to the
point where it asks whether a phase plot is desired. (Question 13).
11. "Subtract linear Lst sqr fit?" Mere, if one answers "y" , the
program will subtract the best linear least square fit from the data points
stored in the 9825A registers for that clock. The orginal data, for that
clock, as read from the tape is now modified by this procedure, and is lost.
If one wishes to reclaim the original data, the tape must be read again for
that clock. The least square fit data are retained in the registers for that
clock and are used for the sigma-tau plot and for the phase plot that may
follow. In the sigma(y) print out following a "y" answer to both 4. and 5.,
the intercept, Y, the fractional frequency, for the least square line, is also
printed out just before the sigma-tau values for the data set for that clock
and run.
12. "Plot sigma?" In this case a "y" answer will set up the plotter for
a sigma-tau plot. If a point plot is desired, the operator need only press
continue in response to the display:
"sig y plot: if line plot cfg6"
If a solid line plot is desired, one should type "cfg6", then press execute,
then continue. A pause and prompt to set paper in the plotter follows. Once
the paper is set, press continue and the plot will be completed.
13. "Plot Phase?" A "y" answer here will result in a phase plot with
either a least square fit subtracted, or not, as requested by the operator in
question 13. A prompt and pause to permit replacement of paper in the plotter
occurs. When paper is ready, press continue and the plot follows.
This is the last portion of the processing tor any clock. After this,
the program returns to the point, question 10, at which the data for the next
17
clock are processed. Questions 10 through 13 are again answered by the
operator. After data for all clocks specified have been processed, the
program ends, and displays:
"Stop. . .Operation complete".
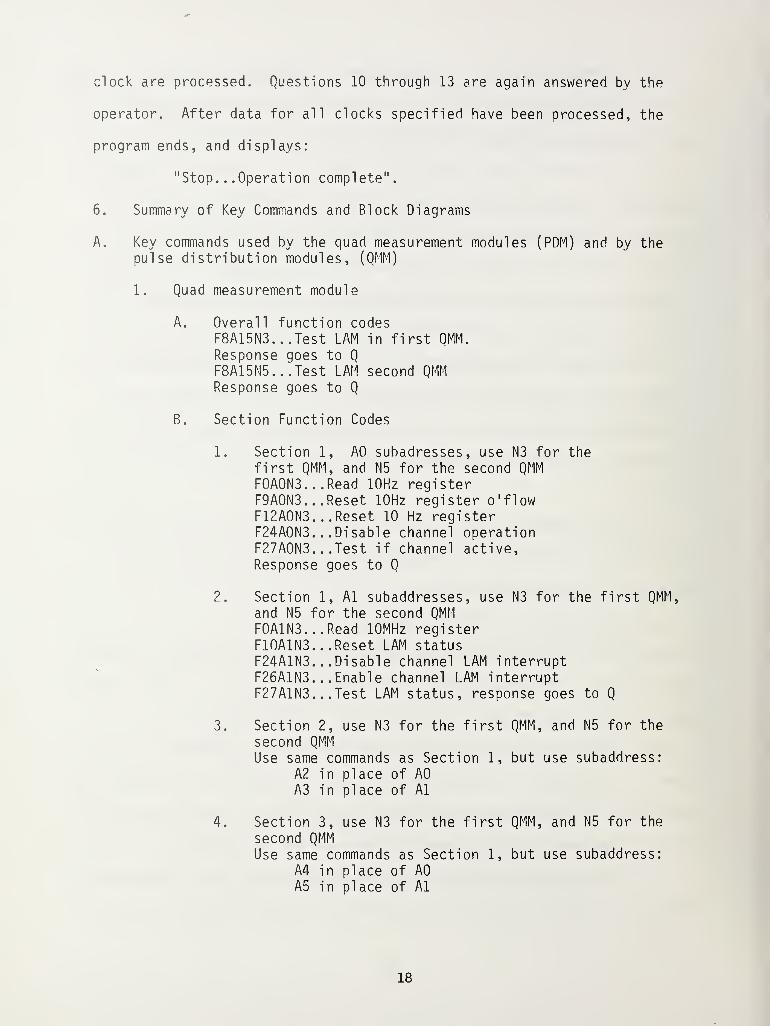
6. Summary of Key Commands and Block Diagrams
A. Key commands used by the quad measurement modules (PDM) and by thepulse distribution modules, (OMM)
1. Quad measurement module
A. Overall function codesF8A15N3...Test LAM in first OMM.
Response goes to QF8A15N5...Test LAM second QMMResponse goes to Q
B. Section Function Codes
1. Section 1, A0 subadresses, use N3 for thefirst QMM, and N5 for the second QMMF0A0N3...Read 10Hz registerF9A0N3... Reset 10Hz register o'flowF12A0N3... Reset 10 Hz registerF24A0N3. . .Disable channel operationF27A0N3...Test if channel active,Response goes to Q
2. Section 1, Al subaddresses, use N3 for the first QMM,
and N5 for the second QMMF0A1N3... .Read 10MHz registerF10A1N3... Reset LAM statusF24A1N3... Disable channel LAM interruptF26A1N3... Enable channel LAM interruptF27A1N3. . .Test LAM status, response goes to Q
3. Section 2, use N3 for the first QMM, and N5 for the
second QMMUse same commands as Section 1, but use subaddress:
A2 in place of A0A3 in place of Al
4. Section 3, use N3 for the first QMM, and N5 for the
second QMMUse same commands as Section 1, but use subaddress:
A4 in place of A0A5 in place of Al
18

5. Section 4, use N3 for the first OHM,and N5 for the second OMMUse same commands as Section 1, but use subaddress
A6 in place of AOA7 in place of Al
2. Pulse distribution module
A. Overall function codes (Subaddress AO)
F0A0N2...Read statusF8A0N2...Test LAM, Response goes to
F10A0M2. . .Reset LAM status and stop measurement cycleF24A0N2... Disables PDM LAM interruptF25A0N2. . .Start next measurement cycleF26A0N2... Enable PDM LAM interrupt
B. There are no other subaddresses used bv the PDM
B. Diagrams of operational modes
1. Fig. 1.
2. Fig. 2.
3. Fig. 3.
Control logic, Pulse Distribution Module,
Control logic, Quad Measurement Module.Counting logic, Quad Measurement Module.
19

Footnotes:
(1) Supplied for this application by Kinetic Systems Corporation,
Lockport, 111
.
(2) Based on NBS-supplied conceptual specifications, ERBTEC Engineering
Inc., Boulder, CO., designed and manufactured the pulse distribution and quad
measurement modules used in this implementation. The original NBS specifica-
tion and critical ANSI/ IEEE-583 interface requirements for these two module
types are contained in Section 6. More detailed CAMAC ANSI/ IEEE instrumenta-
tion standards may be found in (4).
(3) These items were supplied by Hewlett-Packard Co., Denver, Co.
(4) CAMAC Instrumentation and Interface Standards, Institute of
Electrical and Electronics Engineering, Inc., 345 E. 47th St., New York, NY
10017.
DISCLAIMER
Certain commercial equipment, instruments, or
materials are identified in this document in orderto adequately specify the experimental procedure.Such identification does not imply recommendationor endorsement by the National Bureau of Standards,nor does it imply that the materials or equipmentidentified are necessarily the best available forthe purpose.
20

LU-I3ao
g
CO
DCh-co
aHICO
zo
o •
c co •COCO cE i.k. CD© CDa c>» o»J3 c
LUOO
CD O+*c HI CD
1- "
a CD 3CD CC OCC III CO
in£
oao
oCCHZOo
v-i
zo
<
u)oo
</>
u:
ao<OV)
<D
I
I
I
enHO(1)
ft
u-H
o
I
'21

HI_l
aO
h-zin
UJQC
CO<UJ
<
OOo
oDC
zoo
__ M M "<*'
Ui Ui
if
a <v « <*
o o oit U. u. u.
<
1
X
ui
QO<
V)
V-~Z.
On
-1 a
2 -x
tt
li5 ^
o r
c cO "1
8 gE *c
a c
° iS °
© o w:Vino•z *- 2a S 2®GC OCC UJ CO
22

K
UJ-J3Oo
Z111
UJDC
CO<HI
<o
goo-j
ozI-
oo
23

APPENDIX
36th Annual Frequency Control Symposium - 1982
PERFORMANCE OF AN AUTOMATED HIGH ACCURACYPHASE MEASUREMENT SYSTEM
S. Stein, D. Glaze, J. Levine, J. Gray, D. Hi 11 iard, D. HoweTime and Frequency Division
National Bureau of StandardsBoulder, Colorado 80303
and
L. ErbERBTEC Engineering Inc.
Boulder, Colorado
Summary
A fully automated measurement system has
been developed that combines many propertiespreviously realized with separate techniques.
This system is an extension of the dual mixertime difference technique, and maintains its
important features: zero dead time, absolutephase difference measurement, very high preci-sion, the ability to measure oscillators of
equal frequency and the ability to make mea,sure-
ments at the time of the operator's choice. For
one set of design parameters, the theoreticalresolution is 0.2 ps, the measurement noise is 2
ps rms and measurements may be made within 0.1 s
of any selected time. The dual mixer techniquehas been extended by adding scalers which remove
the cycle ambiguity experienced in previousrealizations. In this respect, the systemfunctions like a divider plus clock, storing the
epoch of each device under test in hardware.
The automation is based on2the ANSI/IEEE-
583 (CAMAC) interface standard. Each measure-ment channel consists of a mixer, zero-crossingdetector, scaler and time interval counter.
Four channels fit in a double width CAMAC modulewhich in turn is installed in a standard CAMACcrate. Controllers are available to interfacewith a wide variety of computers as well as any
IEEE-488 compatible device. Two systems havebeen in operation for several months. Oneoperates 24 hours a day, taking data from 15clocks for the NBS time scale, and the other is
used for short duration laboratory experiments.
Review of the Dual MixerTime Difference Technique
It is advantageous to measure time directlyrather than time fluctuations, frequency orfrequency fluctuationns. These measurementsconstitute a hierarchy in which the subsequentlylisted quantities may always be calculated fromthe previous ones. However, the reverse is nottrue when there are gaps in the measurements.In the past, frequency was usually not derivedfrom time measurements for short sample timesbecause time interval measurements could not beperformed with adequate precision. The dual
mixer technique, illustrated in Figure 1, madeit possible to realize the precision of the beatfrequency technique in time interval measure-ments.
The signals from two oscillators (clocks) areapplied to two ports of a pair of double balan-ced mixers. Another signal synthesized from oneof the oscillators is applied to the remainingtwo ports of the mixer pair. The input signalsmay be represented in the usual fashion
Vx(t) =V
1Qsin [2;n>
10t + f^t)],
V2(t) = V
2Qsin [2m>
20t + ^(t)] and
Vs(t) = V
socos[2nv
sot + 4
s(t)]
where v = v,q(1-1/R) and R is a constantusually called the heterodyne factor.
The low passed outputs of the two mixersare
VB1
= VB10
sin [*l(t)
"*s(t)] and
VB2
= VB20
sin t*2 (t) "*s(t)] where
*(t) = 2m>ot + <t>(t).
The time interval counter starts at time tMwhen
Vn-> crosses zero in the positive direction and
stops at time tN
, the time of the very next
positive zero crossing of Vno- Thus
*1 (V "W = 2Mn and
*2(t
N) - *
s(t
N) = 2Nn where
N and M are integers.
Subtracting the two equations in order to com-
pare the phases of oscillators 1 and 2, one
obtains
*2(t
N)-*
1(tM ) = *
s(t
N)-*
s(t
M)+2(N-M)7t.
The phase of an oscillator at time t>, may
be written in terms of its phase at tM and its
24
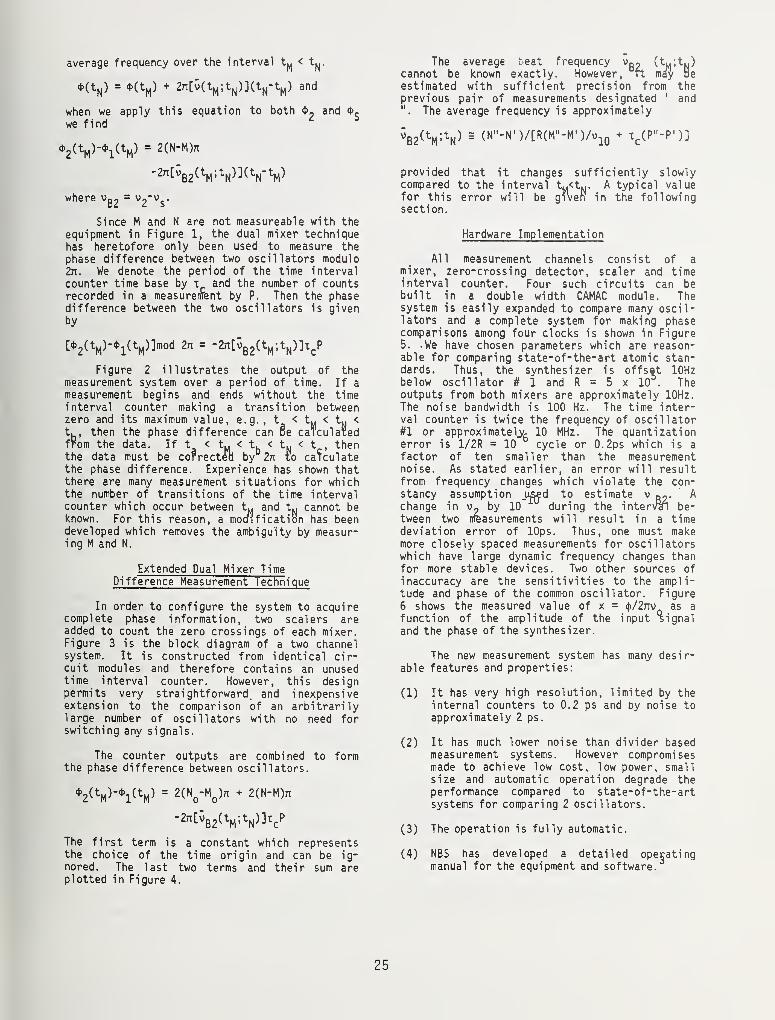
average frequency over the interval t,. < t*,.
(tii) = (tM )+ 27i[v(tM ;tN )](tN-tM ) and
"NJ
L
M M,U
N;
"N "MJ
when we apply this equation to both *2
and 4>
swe find
W'W = 2(N_M)n
-2n[vB2
(tM;t
N)](t
N-t
M )
where vg2
= v ?" vs'
Since M and N are not measureable with the
equipment in Figure 1, the dual mixer techniquehas heretofore only been used to measure thephase difference between two oscillators modulo2n. We denote the period of the time intervalcounter time base by t and the number of countsrecorded in a measurement by P. Then the phasedifference between the two oscillators is givenby
[2(t
M)-*
1(t
M)]mod 2ti = -27i[v
B2(tM;t
N)]x
cP
Figure 2 illustrates the output of themeasurement system over a period of time. If ameasurement begins and ends without the timeinterval counter making a transition betweenzero and its maximum value, e.g., t < t„ < t
N<
t. , then the phase difference can Be calculatedfrom the data. If t < t
M< t. < t
N< t , then
the data must be correctea by 2n t!o calculatethe phase difference. Experience has shown thatthere are many measurement situations for whichthe number of transitions of the time intervalcounter which occur between tw and t
Ncannot be
known. For this reason, a modification has beendeveloped which removes the ambiguity by measur-ing M and N.
Extended Dual Mixer TimeDifference Measurement Technique
In order to configure the system to acquirecomplete phase information, two scalers areadded to count the zero crossings of each mixer.Figure 3 is the block diagram of a two channelsystem. It is constructed from identical cir-cuit modules and therefore contains an unusedtime interval counter. However, this designpermits very straightforward, and inexpensiveextension to the comparison of an arbitrarilylarge number of oscillators with no need forswitching any signals.
The counter outputs are combined to formthe phase difference between oscillators.
2(tM)-*
1(t
M) = 2(N -M
o)tt + 2(N-M)n
-27t[uB2
(tM;t
N)]t
cP
The first term is a constant which representsthe choice of the time origin and can be ig-nored. The last two terms and their sum areplotted in Figure 4.
The average l^eat Frequency u™ UM;t
N )
cannot be known exactly. However, ft may Be
estimated with sufficient precision from theprevious pair of measurements designated ' and
. The average frequency is approximately
vB2
(tM;t
N) = (N"-N
l )/[R(M"-M')/v10
+ xc(P' •P')]
provided that it changes sufficiently slowlyA typica
in the followingcompared to the interval tM<t k]
. A typical valuefor thissection.
error will be g^vef
Hardware Implementation
All measurement channels consist of a
mixer, zero-crossing detector, scaler and timeinterval counter. Four such circuits can bebuilt in a double width CAMAC module. Thesystem is easily expanded to compare many oscil-lators and a complete system for making phasecomparisons among four clocks is shown in Figure5. -We have chosen parameters which are reason-able for comparing state-of-the-art atomic stan-dards. Thus, the synthesizer is offset 10Hzbelow oscillator # 1 and R = 5 x 10 . Theoutputs from both mixers are approximately 10Hz.The noise bandwidth is 100 Hz. The time inter-val counter is twice the frequency of oscillator#1 or approximately 10 MHz. The quantizationerror is 1/2R =10 cycle or 0.2ps which is a
factor of ten smaller than the measurementnoise. As stated earlier, an error will resultfrom frequency changes which violate the con-stancy assumption .used to estimate v
R?. A
change in v„ by 10 during the interval be-tween two measurements will result in a timedeviation error of lOps. Thus, one must makemore closely spaced measurements for oscillatorswhich have large dynamic frequency changes thanfor more stable devices. Two other sources ofinaccuracy are the sensitivities to the ampli-tude and phase of the common oscillator. Figure6 shows the measured value of x = 4>/2n\> as a
function of the amplitude of the input signal
and the phase of the synthesizer.
The new measurement system has many desir-
able features and properties:
(1) It has very high resolution, limited by theinternal counters to 0.2 ps and by noise to
approximately 2 ps.
(2) It has much lower noise than divider basedmeasurement systems. However compromisesmade to achieve low cost, low power, smallsize and automatic operation degrade theperformance compared to state-of-the-artsystems for comparing 2 oscillators.
(3) The operation is fully automatic.
(4) NBS has developed a detailed operatingmanual for the equipment and software.
25
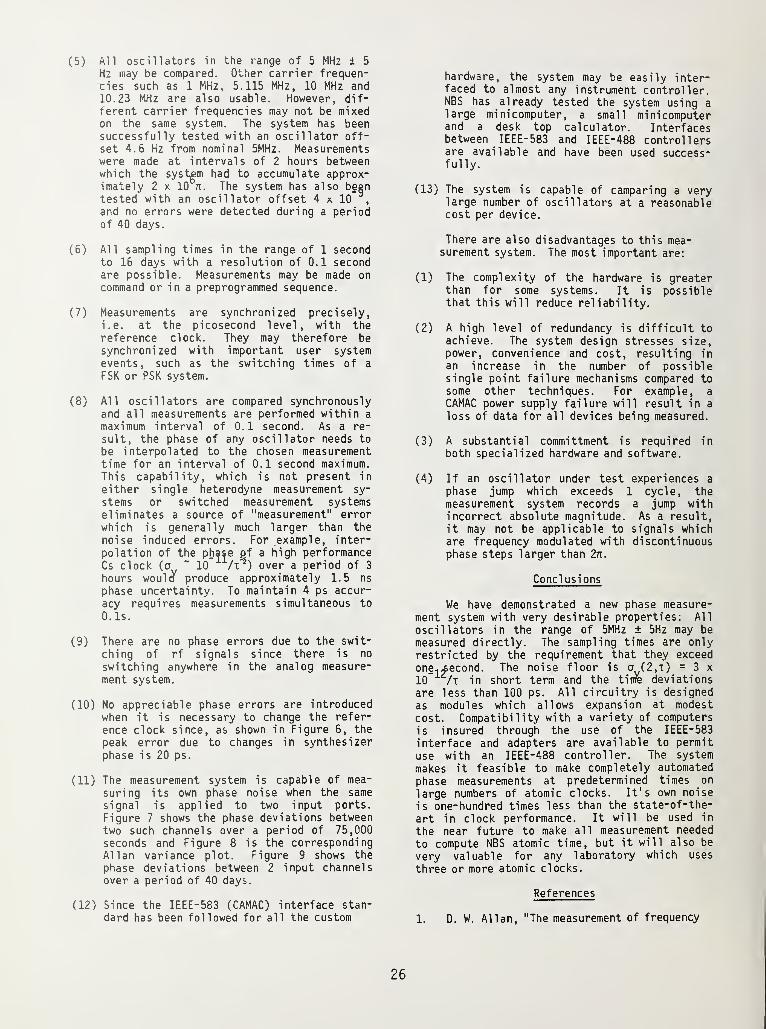
(5) All oscillators in the range of 5 MHz + 5
Hz may be compared. Other carrier frequen-cies such as 1 MHz, 5.115 MHz, 10 MHz and10.23 MHz are also usable. However, dif-ferent carrier frequencies may not be mixedon the same system. The system has beensuccessfully tested with an oscillator off-set 4.6 Hz from nominal 5MHz. Measurementswere made at intervals of 2 hours betweenwhich the system had to accumulate approx-imately 2 x 10 n. The system has also beentested with an oscillator offset 4 x 10 ,
and no errors were detected during a periodof 40 days.
(6) All sampling times in the range of 1 secondto 16 days with a resolution of 0.1 secondare possible. Measurements may be made oncommand or in a preprogrammed sequence.
(7) Measurements are synchronized precisely,i.e. at the picosecond level, with thereference clock. They may therefore besynchronized with important user systemevents, such as the switching times of a
FSK or PSK system.
(8) All oscillators are compared synchronouslyand all measurements are performed within a
maximum interval of 0.1 second. As a re-
sult, the phase of any oscillator needs to
be interpolated to the chosen measurementtime for an interval of 0.1 second maximum.This capability, which is not present in
either single heterodyne measurement sy-
stems or switched measurement systemseliminates a source of "measurement" errorwhich is generally much larger than the
noise induced errors. For example, inter-
polation of the phase gf a high performanceCs clock (a " 10 A"5) over a period of 3
hours woula produce approximately 1.5 ns
phase uncertainty. To maintain 4 ps accur-
acy requires measurements simultaneous to
0.1s.
(9) There are no phase errors due to the swit-
ching of rf signals since there is no
switching anywhere in the analog measure-
ment system.
(10) No appreciable phase errors are introducedwhen it is necessary to change the refer-
ence clock since, as shown in Figure 6, the
peak error due to changes in synthesizerphase is 20 ps.
(11) The measurement system is capable of mea-
suring its own phase noise when the same
signal is applied to two input ports.
Figure 7 shows the phase deviations betweentwo such channels over a period of 75,000seconds and Figure 8 is the correspondingAllan variance plot. Figure 9 shows the
phase deviations between 2 input channelsover a period of 40 days.
(12) Since the IEEE-583 (CAMAC) interface stan-dard has been followed for all the custom
hardware, the system may be easily inter-faced to almost any instrument controller.NBS has already tested the system using alarge minicomputer, a small minicomputerand a desk top calculator. Interfacesbetween IEEE-583 and IEEE-488 controllersare available and have been used success-fully.
(13) The system is capable of camparing a verylarge number of oscillators at a reasonablecost per device.
There are also disadvantages to this mea-surement system. The most important are:
(1) The complexity of the hardware is greaterthan for some systems. It is possiblethat this will reduce reliability.
(2) A high level of redundancy is difficult toachieve. The system design stresses size,power, convenience and cost, resulting in
an increase in the number of possiblesingle point failure mechanisms compared to
some other techniques. For example, aCAMAC power supply failure will result in a
loss of data for all devices being measured.
(3) A substantial committment is required in
both specialized hardware and software.
(4) If an oscillator under test experiences a
phase jump which exceeds 1 cycle, themeasurement system records a jump withincorrect absolute magnitude. As a result,it may not be applicable to signals whichare frequency modulated with discontinuousphase steps larger than In.
Conclusions
We have demonstrated a new phase measure-ment system with very desirable properties: All
oscillators in the range of 5MHz ± 5Hz may be
measured directly. The sampling times are only
restricted by the requirement that they exceedone,,second. The noise floor is a (2,t) = 3 x
10 A in short term and the time deviations
are less than 100 ps. All circuitry is designed
as modules which allows expansion at modest
cost. Compatibility with a variety of computers
is insured through the use of the IEEE-583
interface and adapters are available to permit
use with an IEEE-488 controller. The system
makes it feasible to make completely automated
phase measurements at predetermined times on
large numbers of atomic clocks. It's own noise
is one-hundred times less than the state-of-the-
art in clock performance. It will be used in
the near future to make all measurement needed
to compute NBS atomic time, but it will also be
very valuable for any laboratory which uses
three or more atomic clocks.
References
1. D. W. Allan, "The measurement of frequency
26

2.
3.
and frequency stability of precisionoscillators," NBS Tech. Note 669(1975)."CAMAC Instrumentation and Interface stan-dards," Institute of Electrical and Elec-tronic Engineers, Inc., 345 E. 47th St.
New York, NY 10017.D. J. Glaze and S. R. Stein, "Picosecondtime difference measurements utilizing CA-MAC based ANSI/IEEE -488 data acquisitionhardware", NBS Tech Note 1056 (in prepara-tion).
VB2= V
2" V8
ZEROCROSSINGDETECTOR
STOP
8TART
DTIME
INTERVALCOUNTER %
"«-
ZEROCROSSINGDETECTOR
"»
[2(tH)-»
1(tM))»od 2n = -2n[J
B2(tM ;t
N)]t
cf>
Figure 1. Dual Mixer Time Difference Measurement System
Figure 2. Dual Mixer Data
+2©
FREQUENCYSYNTH.
*1
0-
B2r2
KS
ZEROCROSSINGDETECTOR
SCALER
STOPSTART
Vs= ^(1-1/R)
TIMEINTERVALCOUNTER ^P
\
JHZERO
CROSSINGDETECTOR
-»SCALER
STOPSTART
"bi = VR
TIMEINTERVALCOUNTER
Figure 3. Extended Dual Mixer Time Difference Measurement
System
27

W'W = 2(No"Mo ) " * 2(N "M)"
- 2n^B2 (t«:tN)1,
cP
-2"I»B2 (tM:t
ll)lx
eP
2(N-H)it
Sum
Figure 4. Extended Dual Mixer Data
Clock *1 0—*—[>-
Synthesizer
">
• 0—0-1Clock +4 [>
Offset
5 MHz
Start
PULSE DISTRIBUTION
MODULE
"rr-rr tt—n—rr
Start Start 10 MHz Time BaseOutput ,nPut
MEASUREMENT MODULE
Stop Inputs DATA
6X4= 24 clocks maximumrequires one pulse distribution module and
six measurement modules maximum
Figure 5. System Block Diagram
x(ps)
1000 -
800
600i1
400
200 ee
a _!__
INPUT AMPLITUDEOdB «1Vrms
' II
II
-3 -6 -9dB
SYNTHESIZER PHASE
Figure 6. Measured Time Difference vs. Input Amplitude and
Synthesizer Phase
23

PHASE PLOT Cloak No. 4- B
Lot Bar- Slope of - 1. 05B2OBo-l 7/6 R.
nbo4o —nbo4b>d E>W BS may B2
lo-ll
.Bo..«a
-lo-U 1
T- 747BB SECONDS
Figure 7. Raw Phase Data for Two Channels Driven from the
Same Source
-12.
log Sidy
\ "" '
Mi IBflrls. Clook No, 4- 6
-14.
-is,
-i«
-17,
n >» in
log T
e
Figure 8. Noise Floor of Measurement System
29

e.ee 9.7S 19.seI'fiYS
29.2'
CLOCKS 11 )- 21 ) ,X0P6. •45647. 19-HOR-82
Figure 9. Raw Phase Data for Two Channels Driven from the
Same Source
30

NBS-1 14A (REV. 2-80)
U.S. DEPT. OF COMM.
BIBLIOGRAPHIC DATASHEET (See instructions)
1. PUBLICATION ORREPORT NO.
NBS TN-1056
2. Performing Organ. Report No. 3. Publication Date
August 1983
4. TITLE AND SUBTITLE
PICOSECOND TIME DIFFERENCE MEASUREMENTS UTILIZING CAMAC-BASED ANSI/IEEE-488DATA ACQUISITION HARDWAREOPERATION MANUAL IE3 Version 1.0
5. AUTHOR(S)
D. J. Glaze and S. R. Stein
6. PERFORMING ORGANIZATION (If joint or other than NBS. see instructions)
NATIONAL BUREAU OF STANDARDSDEPARTMENT OF COMMERCEWASHINGTON, D.C. 20234
7. Contract/Grant No.
8. Type of Report & Period Covered
9. SPONSORING ORGANIZATION NAME AND COMPLETE ADDRESS (Street. City. State, ZIP)
10. SUPPLEMENTARY NOTES
2] Document describes a computer program; SF-185, FIPS Software Summary, is attached.
11. ABSTRACT (A 200-word or less factual summary of most significant information. If document includes a significant
bibliography or literature survey, mention it here)
Automated time-difference measurements at the picosecond level have beenachieved. The system described combines the best properties of three commonmethods: the single heterodyne measurement technique, the frequency divider,and the dual-mixer time-difference measurement system. This particular systemcombines two instrumentation standards, ANSI/I EEE-583 and ANSI/IEEE-488 withnew, modular dual-mixer time-difference measurement hardware. The modular,standardized hardware together with the new measurement techniques permit thedata acquisition modules to be contained in a standard CAMAC crate. This system,along with an external controller, is capable of measuring eight clocks, at thepresent time, and is expandable to twenty-four clocks with modified software andadditional measurement modules. The system noise performance is described by
-12 -1a (t) = 3 x 10 t~ for time difference measurements.
12. KEY WORDS (Six to twelve entries; alphabetical order; capitalize only proper names; and separate key words by semicolons)
ANSI/IEEE-488; ANSI/IEEE-583; automated data acquisition system; dual-mixermeasurements; picosecond time-difference measurements.
13. AVAILABILITY
FJX) Unlimited
1 |
For Official Distribution. Do Not Release to NTIS
|~~Xl Order From Superintendent of Documents, U.S. Government Printing Office, Washington, D.C.20402.
2] Order From National Technical Information Service (NTIS), Springfield, VA. 22161
14. NO. OFPRINTED PAGES
36
15. Price
$3.75
JSCOMM-DC 6043-P80
<r U.S. Government Printing Office 1983 - 681-125/468 Reg.


NBS TECHNICAL PUBLICATIONS
PERIODICALS
JOURNAL OF RESEARCH—The Journal of Research of the
National Bureau of Standards reports NBS research and develop-
ment in those disciplines of the physical and engineering sciences in
which the Bureau is active. These include physics, chemistry,
engineering, mathematics, and computer sciences. Papers cover a
broad range of subjects, with major emphasis on measurement
methodology and the basic technology underlying standardization.
Also included from time to lime are survey articles on topics
closely related to the Bureau's technical and scientific programs.
As a special service to subscribers each issue contains complete
citations to all recent Bureau publications in both NBS and non-
NBS media. Issued six times a year. Annual subscription: domestic
$18; foreign $22.50. Single copy, $4.25 domestic; $5.35 foreign.
NONPERIODICALS
Monographs—Major contributions to the technical literature onvarious subjects related to the Bureau's scientific and technical ac-
tivities.
Handbooks—Recommended codes of engineering and industrial
practice (including safety codes) developed in cooperation with in-
terested industries, professional organizations, and regulatory
bodies.
Special Publications—Include proceedings of conferences spon-
sored by NBS, NBS annual reports, and other special publications
appropriate to this grouping such as wall charts, pocket cards, andbibliographies.
Applied Mathematics Series— Mathematical tables, manuals, andstudies of special interest to physicists, engineers, chemists,
biologists, mathematicians, computer programmers, and others
engaged in scientific and technical work.
National Standard Reference Data Series— Provides quantitative
data on the physical and chemical properties of materials, com-piled from the world's literature and critically evaluated.
Developed under a worldwide program coordinated by NBS underthe authority of the National Standard Data Act (Public Law90-396).
NOTE: The principal publication outlet for the foregoing data is
the Journal of Physical and Chemical Reference Data (JPCRD)published quarterly for NBS by the American Chemical Society(ACS) and the American Institute of Physics (AIP). Subscriptions,reprints, and supplements available from ACS, 1 155 Sixteenth St.,
NW, Washington, DC 20056.
Building Science Series— Disseminates technical information
developed at the Bureau on building materials, components,
systems, and whole structures. The series presents research results,
test methods, and performance criteria related to the structural andenvironmental functions and the durability and safety charac-
teristics of building elements and systems.
Technical Notes— Studies or reports which are complete in them-
selves but restrictive in their treatment of a subject. Analogous to
monographs but not so comprehensive in scope or definitive in
treatment of the subject area. Often serve as a vehicle for final
reports of work performed at NBS under the sponsorship of other
government agencies.
Voluntary Product Standards— Developed under procedures
published by the Department of Commerce in Part 10, Title 15, of
the Code of Federal Regulations. The standards establish
nationally recognized requirements for products, and provide all
concerned interests with a basis for common understanding of the
characteristics of the products. NBS administers this program as a
supplement to the activities of the private sector standardizing
organizations.
Consumer Information Series-^Practical information, based on
N BS research and experience, covering areas of interest to the con-
sumer. Easily understandable language and illustrations provide
useful background knowledge for shopping in today's tech-
nological marketplace.
Order the above NBS publications from: Superintendent of Docu-
ments, Government Printing Office. Washington, DC 20402.
Order the following NBS publications—FIPS and NBSIR's—fromthe National Technical Information Services. Springfield. VA 22161
.
Federal Information Processing Standards Publications,(FIPS
PUB)— Publications in this series collectively constitute the
Federal Information Processing Standards Register. The Register
serves as the official source of information in the Federal Govern-
ment regarding standards issued by NBS pursuant to the Federal
Property and Administrative Services Act of 1949 as amended,
Public Law 89-306 (79 Stat. 1127), and as implemented by Ex-
ecutive Order 117.17(38 FR 12315, dated May 11, 1973) and Part 6
of Title 15 CFR (Code of Federal Regulations).
NBS Interagency Reports (NBSIR)—A special series of interim or
final reports on work performed by NBS for outside sponsors
(both government and non-government). In general, initial dis-
tribution is handled by the sponsor; public distribution is by the
National Technical Information Services, Springfield, VA 22161,
in paper copy or microfiche form.

U.S. Department of CommerceNational Bureau of Standards
Washington, D.C. 20234Official Business
Penalty for Private Use $300
POSTAGE AND FEES PAID
U S DEPARTMENT OF COMMERCECOM-215
FIRST CLASS