Embed Size (px)
Citation preview
a2a2016
InvestorGuidebook
November 2016
This information was prepared by A2A and it is not to be relied on by any 3rd party without A2A’s prior written consent.
DISCLAIMER - This document has been prepared by A2A solely for investors and analysts. This document does not constitute an offer or invitation to purchase or subscribe any shares or other securities and neither it nor anypart of it shall form the basis of or be relied upon in connection with any contract or commitment whatsoever. Some information contained herein and other material discussed at the meetings may include forward-lookinginformation based on A2A’s current beliefs and expectations. These statements are based on current plans, estimates, projections, and projects and therefore you should not place undue reliance on them. Forward-lookingstatements involve inherent risks and uncertainties. We caution you that a number of important factors could cause actual results to differ materially from those contained in any forward-looking statement. Such factorsinclude, but are not limited to: changes in global economic business, changes in the price of certain commodities including electricity, gas and coal, the competitive market and regulatory factors. Moreover, forward-lookingstatements are current only at the date they are made.
This symbol marks the pages where Exceldownloads are availableHistorical series available in the Annual andquarterly Databooks:http://www.a2a.eu/en/investor/tool/index.htmlor in dedicated sections
This symbol marks the pages which may besubject to updates during the year
Reference to more in-depth, updates anddocuments available in A2A website@
Resources:
Databook in excel: this file is part of the
Guidebook kit and contains annual and quarterlyeconomic, financial and operational Company data as of2008 and all the tables published in this document.
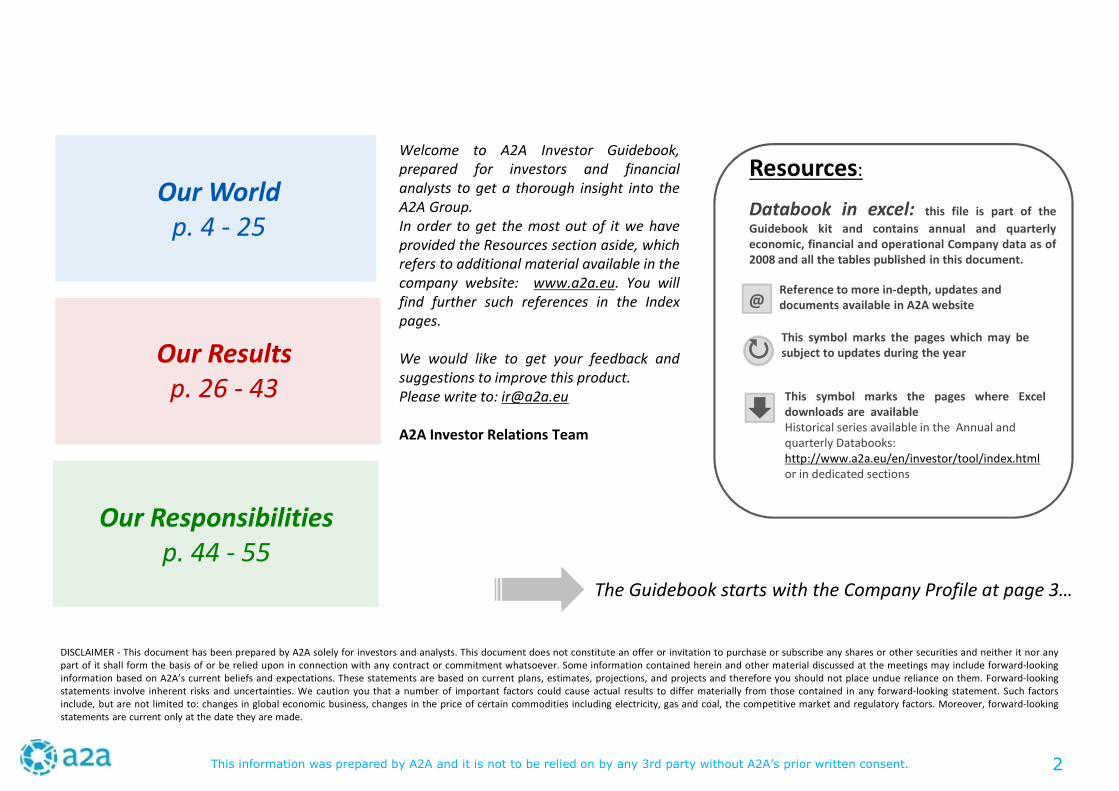
Our Worldp. 4 - 25
Our Resultsp. 26 - 43
Our Responsibilitiesp. 44 - 55
Welcome to A2A Investor Guidebook,prepared for investors and financialanalysts to get a thorough insight into theA2A Group.In order to get the most out of it we haveprovided the Resources section aside, whichrefers to additional material available in thecompany website: www.a2a.eu. You willfind further such references in the Indexpages.
We would like to get your feedback andsuggestions to improve this product.Please write to: [email protected]
A2A Investor Relations Team
The Guidebook starts with the Company Profile at page 3…
2
This information was prepared by A2A and it is not to be relied on by any 3rd party without A2A’s prior written consent.
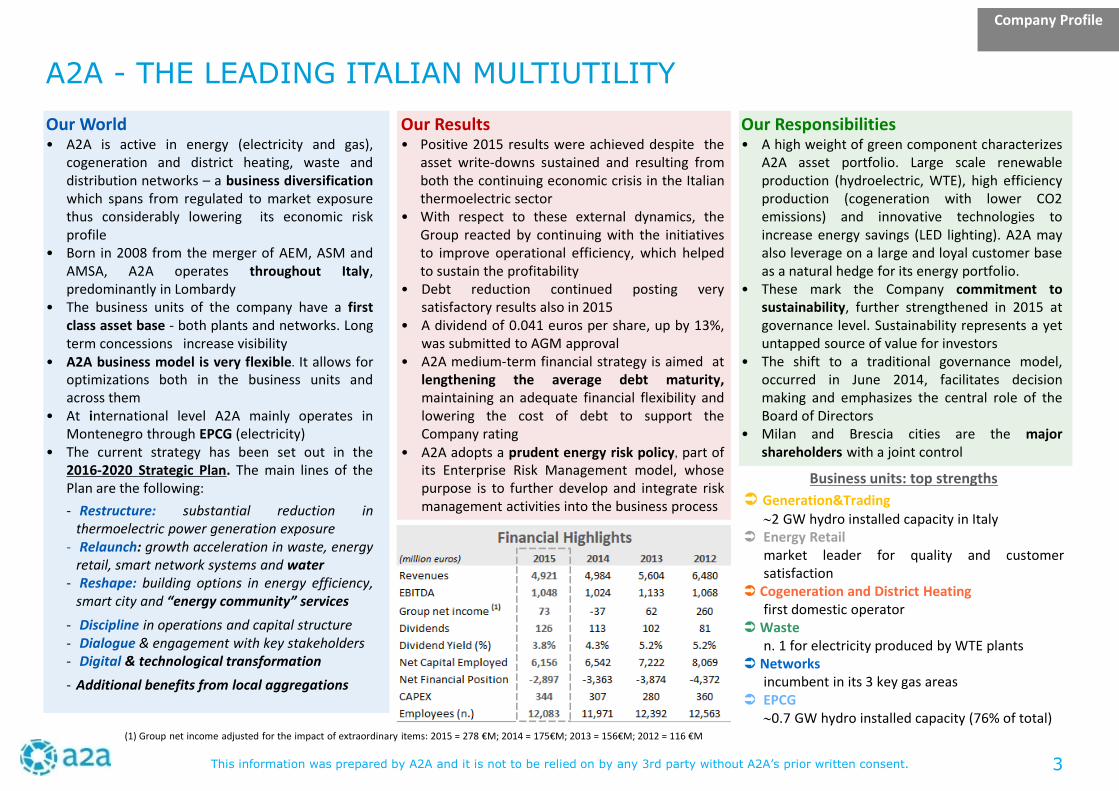
Our Responsibilities• A high weight of green component characterizes
A2A asset portfolio. Large scale renewableproduction (hydroelectric, WTE), high efficiencyproduction (cogeneration with lower CO2emissions) and innovative technologies toincrease energy savings (LED lighting). A2A mayalso leverage on a large and loyal customer baseas a natural hedge for its energy portfolio.
• These mark the Company commitment tosustainability, further strengthened in 2015 atgovernance level. Sustainability represents a yetuntapped source of value for investors
• The shift to a traditional governance model,occurred in June 2014, facilitates decisionmaking and emphasizes the central role of theBoard of Directors
• Milan and Brescia cities are the majorshareholders with a joint control
Company Profile
A2A - THE LEADING ITALIAN MULTIUTILITY
(1) Group net income adjusted for the impact of extraordinary items: 2015 = 278 €M; 2014 = 175€M; 2013 = 156€M; 2012 = 116 €M
Business units: top strengths
Generation&Trading
∼2 GW hydro installed capacity in Italy Energy Retail
market leader for quality and customersatisfaction
Cogeneration and District Heatingfirst domestic operator
Wasten. 1 for electricity produced by WTE plants
Networksincumbent in its 3 key gas areas
EPCG∼0.7 GW hydro installed capacity (76% of total)
Our World• A2A is active in energy (electricity and gas),
cogeneration and district heating, waste anddistribution networks – a business diversificationwhich spans from regulated to market exposurethus considerably lowering its economic riskprofile
• Born in 2008 from the merger of AEM, ASM andAMSA, A2A operates throughout Italy,predominantly in Lombardy
• The business units of the company have a firstclass asset base - both plants and networks. Longterm concessions increase visibility
• A2A business model is very flexible. It allows foroptimizations both in the business units andacross them
• At international level A2A mainly operates inMontenegro through EPCG (electricity)
• The current strategy has been set out in the2016-2020 Strategic Plan. The main lines of thePlan are the following:
- Restructure: substantial reduction inthermoelectric power generation exposure
- Relaunch: growth acceleration in waste, energyretail, smart network systems and water
- Reshape: building options in energy efficiency,smart city and “energy community” services
- Discipline in operations and capital structure- Dialogue & engagement with key stakeholders- Digital & technological transformation
- Additional benefits from local aggregations
Our Results• Positive 2015 results were achieved despite the
asset write-downs sustained and resulting fromboth the continuing economic crisis in the Italianthermoelectric sector
• With respect to these external dynamics, theGroup reacted by continuing with the initiativesto improve operational efficiency, which helpedto sustain the profitability
• Debt reduction continued posting verysatisfactory results also in 2015
• A dividend of 0.041 euros per share, up by 13%,was submitted to AGM approval
• A2A medium-term financial strategy is aimed atlengthening the average debt maturity,maintaining an adequate financial flexibility andlowering the cost of debt to support theCompany rating
• A2A adopts a prudent energy risk policy, part ofits Enterprise Risk Management model, whosepurpose is to further develop and integrate riskmanagement activities into the business process
3
This information was prepared by A2A and it is not to be relied on by any 3rd party without A2A’s prior written consent.
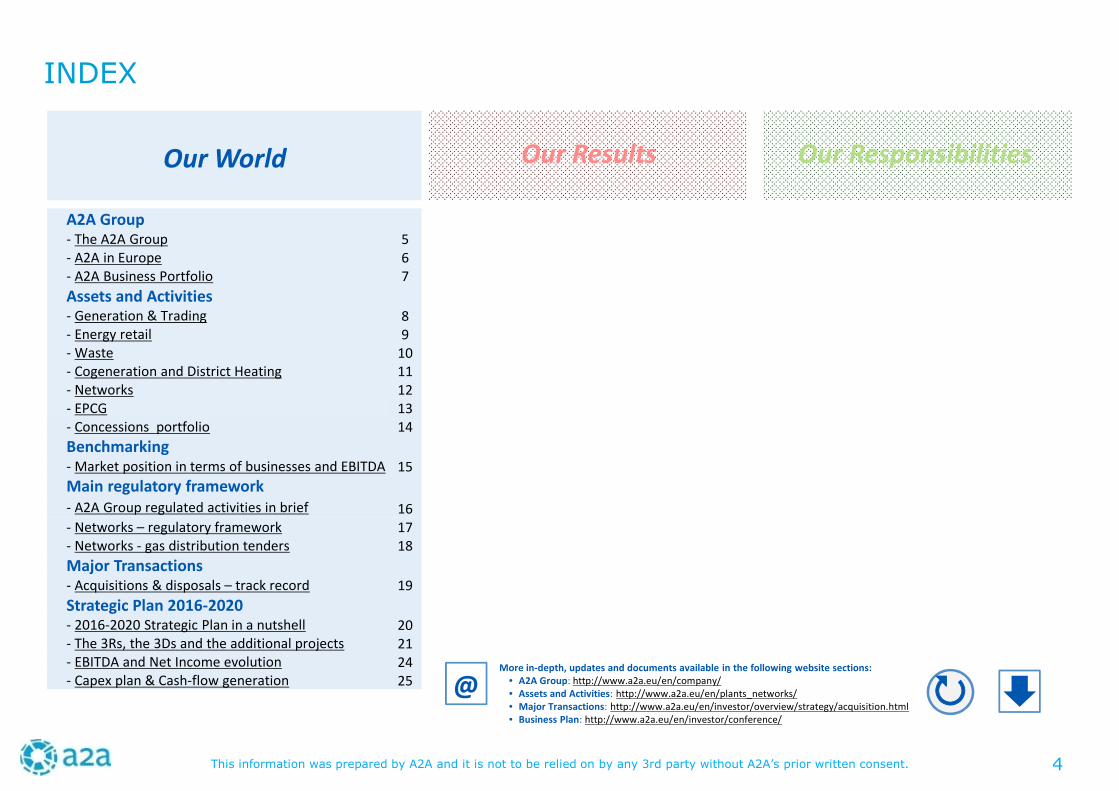
INDEX
Our World Our Results Our Responsibilities
More in-depth, updates and documents available in the following website sections:• A2A Group: http://www.a2a.eu/en/company/• Assets and Activities: http://www.a2a.eu/en/plants_networks/• Major Transactions: http://www.a2a.eu/en/investor/overview/strategy/acquisition.html• Business Plan: http://www.a2a.eu/en/investor/conference/
@
A2A Group- The A2A Group 5- A2A in Europe 6- A2A Business Portfolio 7
Assets and Activities- Generation & Trading 8- Energy retail 9- Waste 10- Cogeneration and District Heating 11- Networks 12- EPCG 13- Concessions portfolio 14
Benchmarking- Market position in terms of businesses and EBITDA 15
Main regulatory framework- A2A Group regulated activities in brief 16- Networks – regulatory framework 17- Networks - gas distribution tenders 18
Major Transactions- Acquisitions & disposals – track record 19
Strategic Plan 2016-2020- 2016-2020 Strategic Plan in a nutshell 20- The 3Rs, the 3Ds and the additional projects 21- EBITDA and Net Income evolution 24- Capex plan & Cash-flow generation 25
4
This information was prepared by A2A and it is not to be relied on by any 3rd party without A2A’s prior written consent.
THE A2A GROUP
Our WorldA2A Group
(1) Stakes held through Linea Group Holding S.p.A.(2) Stake held through Linea Più S.p.A.(3) Of which 0.38% held through A2A Reti Gas;(4) The Business Unit includes network and
distring heating activities as of 2016. A singlecompany for electricity and gas distributionservices, Unareti, is operative as of Q2 2016.
Networks and Heat(4)
Other Companies
Areas of activity
Back to Index
Generation & Trading
Energy Retail
Waste
EPCG
5
(1)
(1)
(1)
(1)
(1)
(1) (1)
(2)
(3)
This information was prepared by A2A and it is not to be relied on by any 3rd party without A2A’s prior written consent.
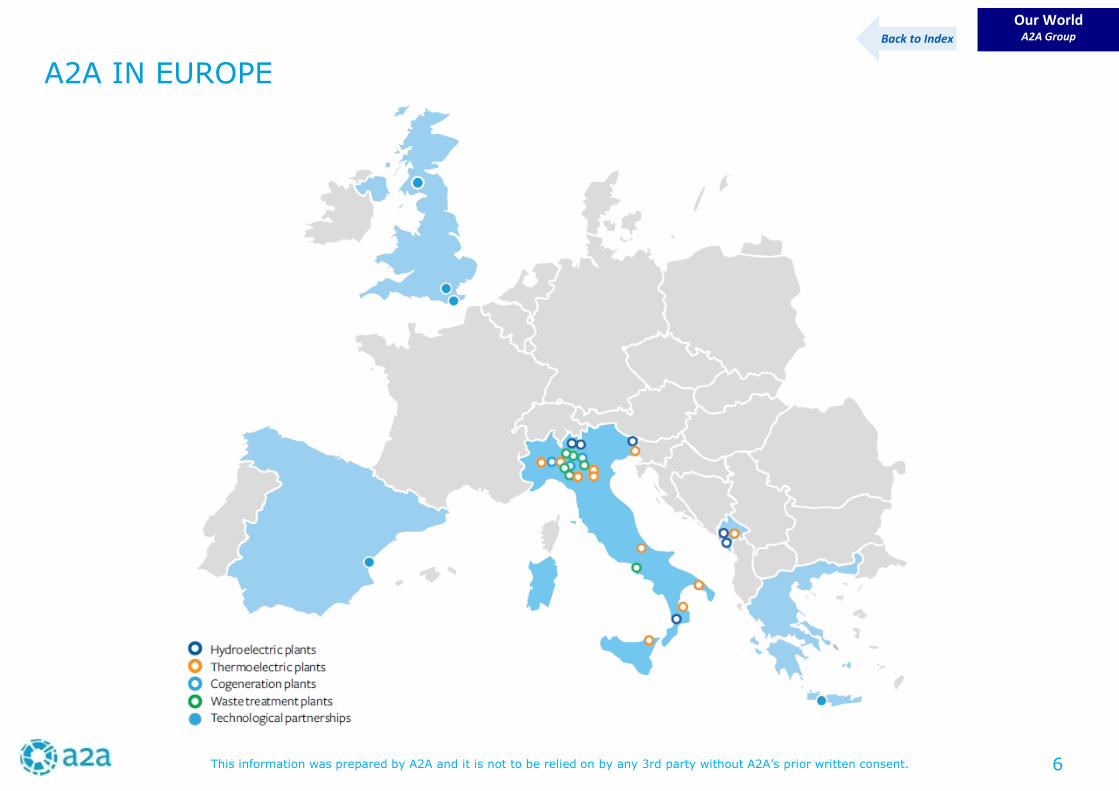
A2A IN EUROPE
Our WorldA2A GroupBack to Index
6
This information was prepared by A2A and it is not to be relied on by any 3rd party without A2A’s prior written consent.
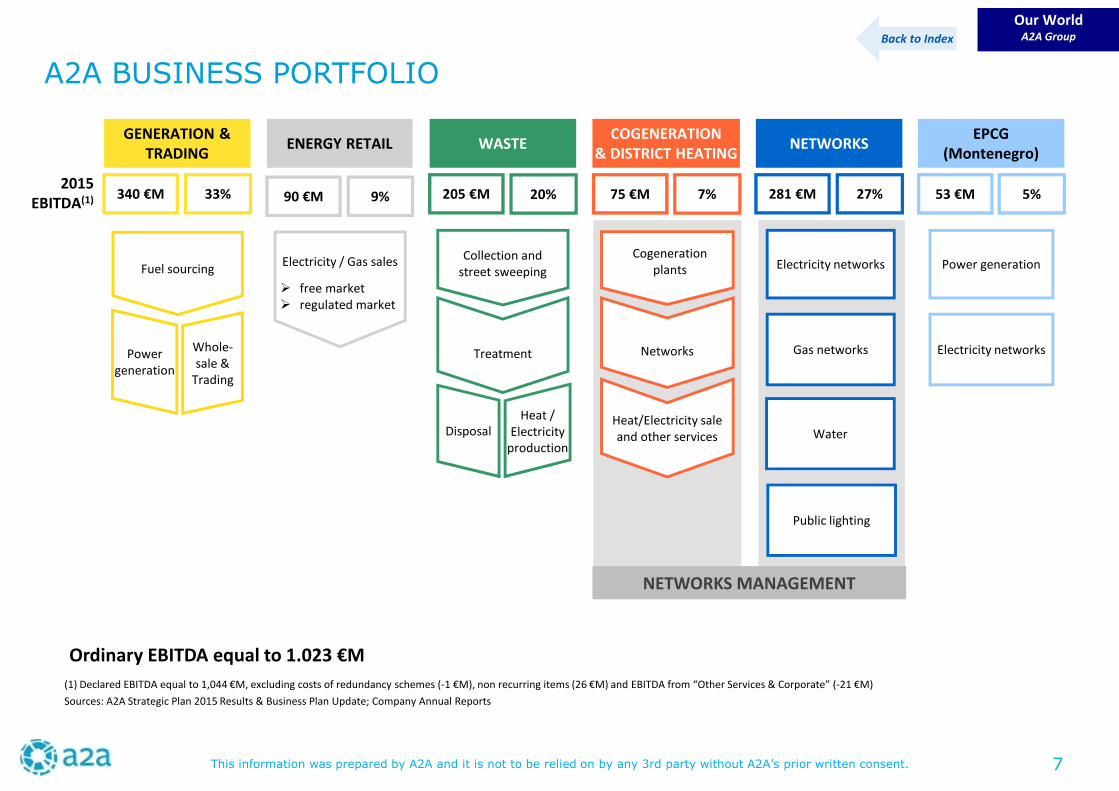
A2A BUSINESS PORTFOLIO
Our WorldA2A GroupBack to Index
Ordinary EBITDA equal to 1.023 €M
(1) Declared EBITDA equal to 1,044 €M, excluding costs of redundancy schemes (-1 €M), non recurring items (26 €M) and EBITDA from “Other Services & Corporate” (-21 €M)
Sources: A2A Strategic Plan 2015 Results & Business Plan Update; Company Annual Reports
2015EBITDA(1)
COGENERATION& DISTRICT HEATING
Cogenerationplants
Networks
75 €M 7%
WASTE
Collection andstreet sweeping
Treatment
205 €M 20%
NETWORKS
Water
Electricity networks
Gas networks
281 €M 27%
GENERATION &TRADING
Fuel sourcing
Powergeneration
Whole-sale &
Trading
340 €M 33%
NETWORKS MANAGEMENT
DisposalHeat/Electricity saleand other services
Heat /Electricity
production
EPCG(Montenegro)
Power generation
Electricity networks
53 €M 5%
ENERGY RETAIL
90 €M 9%
Electricity / Gas sales
free market regulated market
Public lighting
7
This information was prepared by A2A and it is not to be relied on by any 3rd party without A2A’s prior written consent.
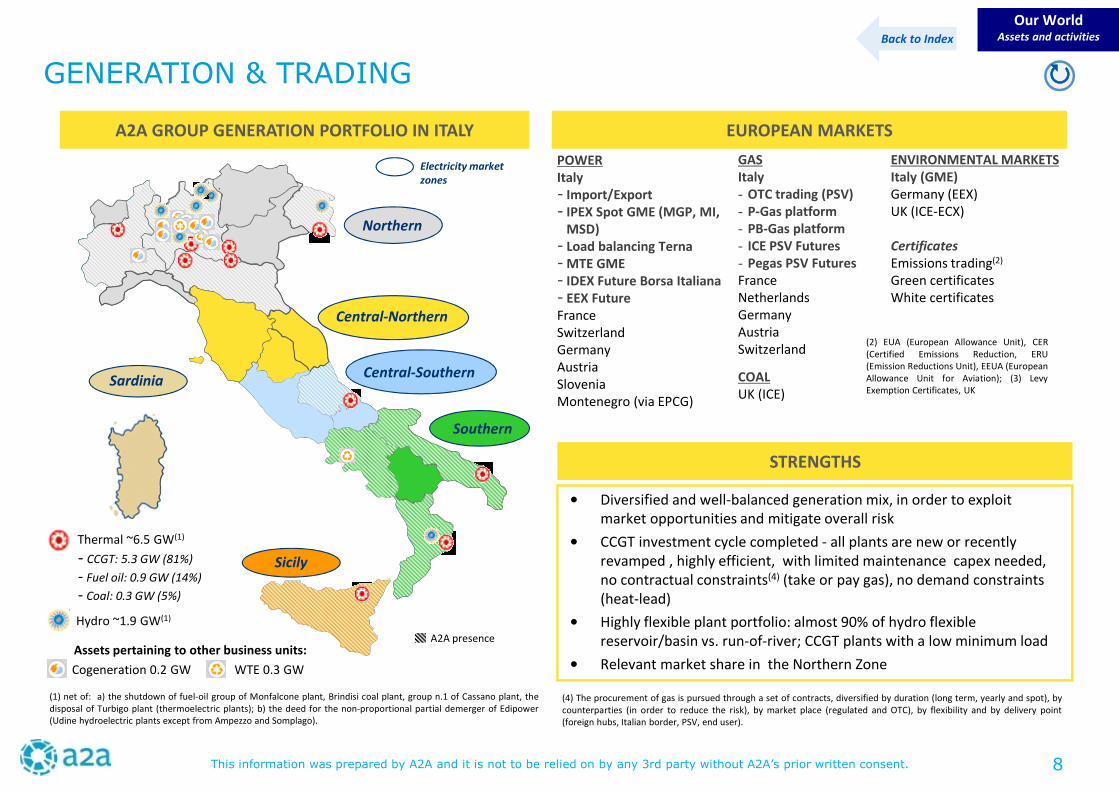
Sardinia
Hydro ~1.9 GW(1)
Thermal ~6.5 GW(1)
- CCGT: 5.3 GW (81%)
- Fuel oil: 0.9 GW (14%)
- Coal: 0.3 GW (5%)
WTE 0.3 GWCogeneration 0.2 GW
STRENGTHS
• Diversified and well-balanced generation mix, in order to exploitmarket opportunities and mitigate overall risk
• CCGT investment cycle completed - all plants are new or recentlyrevamped , highly efficient, with limited maintenance capex needed,no contractual constraints(4) (take or pay gas), no demand constraints(heat-lead)
• Highly flexible plant portfolio: almost 90% of hydro flexiblereservoir/basin vs. run-of-river; CCGT plants with a low minimum load
• Relevant market share in the Northern Zone
(1) net of: a) the shutdown of fuel-oil group of Monfalcone plant, Brindisi coal plant, group n.1 of Cassano plant, thedisposal of Turbigo plant (thermoelectric plants); b) the deed for the non-proportional partial demerger of Edipower(Udine hydroelectric plants except from Ampezzo and Somplago).
Northern
Central-Northern
Central-Southern
Southern
Sicily
Electricity marketzones
GENERATION & TRADING
A2A presence
Our WorldAssets and activities
A2A GROUP GENERATION PORTFOLIO IN ITALY
(4) The procurement of gas is pursued through a set of contracts, diversified by duration (long term, yearly and spot), bycounterparties (in order to reduce the risk), by market place (regulated and OTC), by flexibility and by delivery point(foreign hubs, Italian border, PSV, end user).
Back to Index
EUROPEAN MARKETS
POWERItaly- Import/Export- IPEX Spot GME (MGP, MI,
MSD)- Load balancing Terna- MTE GME- IDEX Future Borsa Italiana- EEX FutureFranceSwitzerlandGermanyAustriaSloveniaMontenegro (via EPCG)
GASItaly- OTC trading (PSV)- P-Gas platform- PB-Gas platform- ICE PSV Futures- Pegas PSV FuturesFranceNetherlandsGermanyAustriaSwitzerland
COALUK (ICE)
ENVIRONMENTAL MARKETSItaly (GME)Germany (EEX)UK (ICE-ECX)
CertificatesEmissions trading(2)
Green certificatesWhite certificates
(2) EUA (European Allowance Unit), CER(Certified Emissions Reduction, ERU(Emission Reductions Unit), EEUA (EuropeanAllowance Unit for Aviation); (3) LevyExemption Certificates, UK
Assets pertaining to other business units:
8
This information was prepared by A2A and it is not to be relied on by any 3rd party without A2A’s prior written consent.
ENERGY RETAIL
Our WorldAssets and activitiesBack to Index
STRENGTHS
• Competitive cost-to-serve for residential customers in core territories (< 20€/year)
• Cost-to-acquire: payback period < 1 year (average)
• Market leader for quality and good track record in customer satisfaction: A2Aranks at the top in the surveys for the domestic electricity market
• Complete range of energy solutions in Gas & Electricity for domestic customers,SMEs and large companies
• Solutions adapted to the specific needs of each segment and environmentallyfriendly (for example, )
• Digital channels: increase of the online bill penetration (from 7.7% in 2012 to 12%in 2015)
• Indirect channels
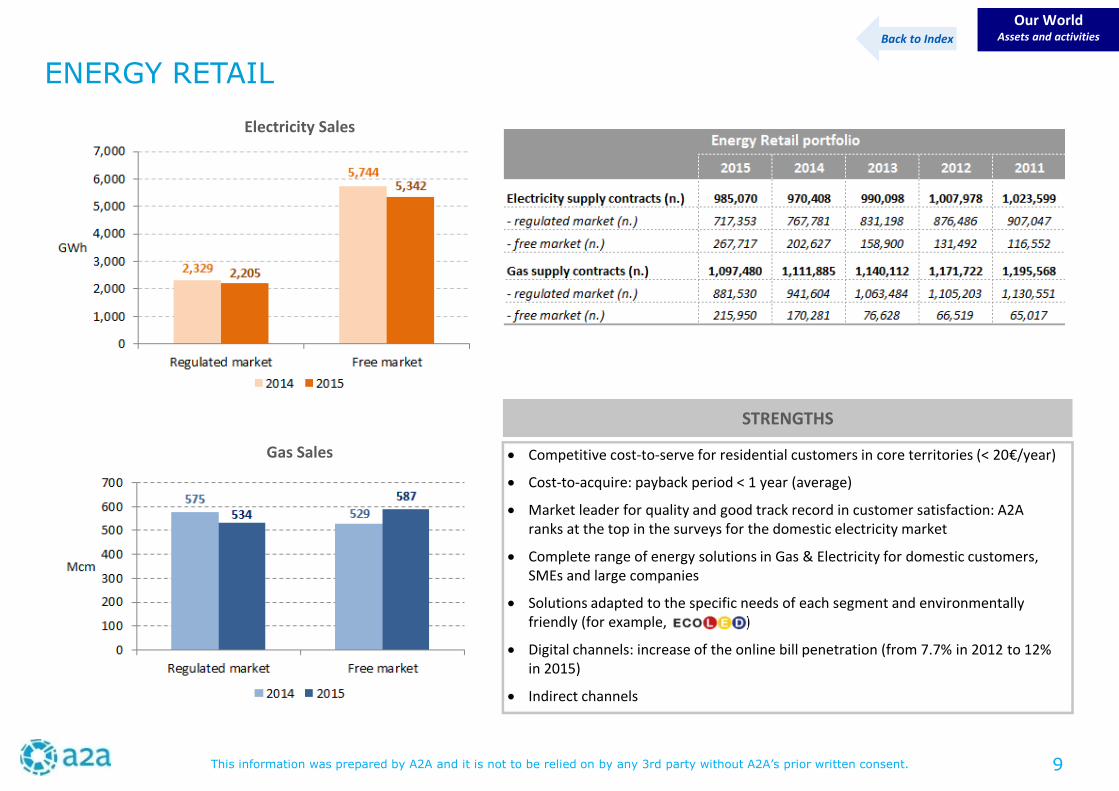
Electricity Sales
Gas Sales
9
This information was prepared by A2A and it is not to be relied on by any 3rd party without A2A’s prior written consent.
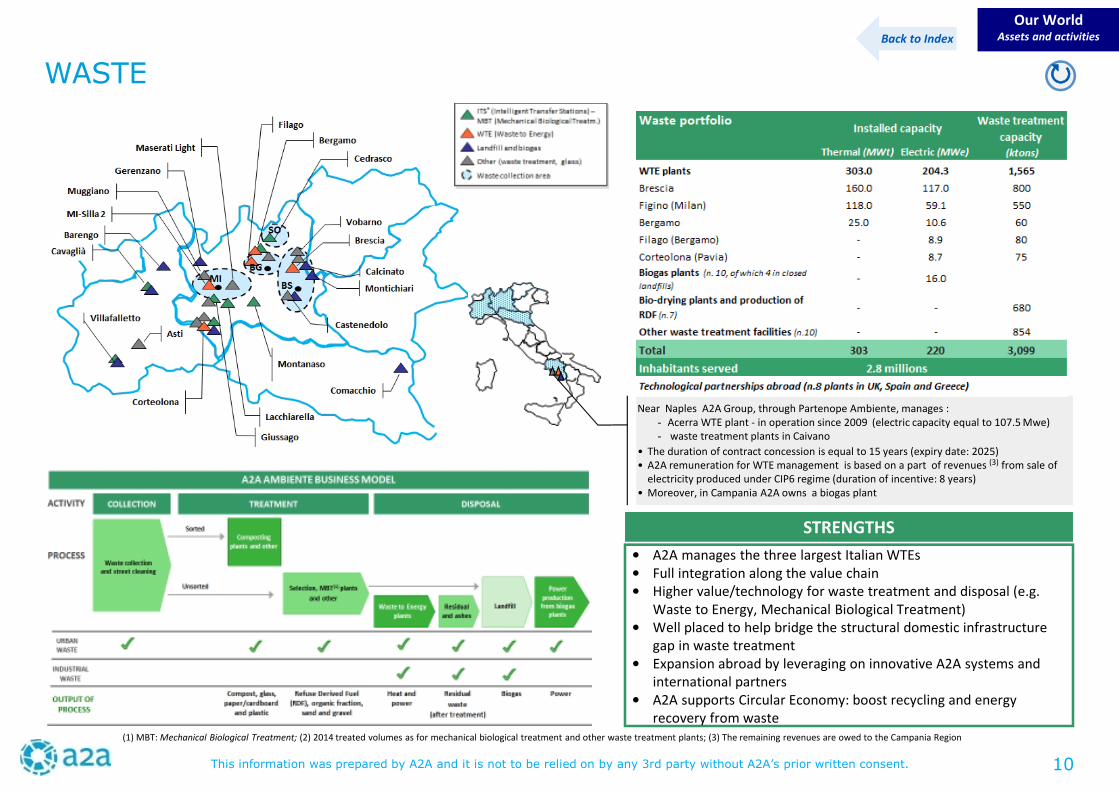
• A2A manages the three largest Italian WTEs• Full integration along the value chain• Higher value/technology for waste treatment and disposal (e.g.
Waste to Energy, Mechanical Biological Treatment)• Well placed to help bridge the structural domestic infrastructure
gap in waste treatment• Expansion abroad by leveraging on innovative A2A systems and
international partners• A2A supports Circular Economy: boost recycling and energy
recovery from waste
WASTE
Our WorldAssets and activities
STRENGTHS
(1) MBT: Mechanical Biological Treatment; (2) 2014 treated volumes as for mechanical biological treatment and other waste treatment plants; (3) The remaining revenues are owed to the Campania Region
Near Naples A2A Group, through Partenope Ambiente, manages :- Acerra WTE plant - in operation since 2009 (electric capacity equal to 107.5 Mwe)- waste treatment plants in Caivano
• The duration of contract concession is equal to 15 years (expiry date: 2025)• A2A remuneration for WTE management is based on a part of revenues (3) from sale of
electricity produced under CIP6 regime (duration of incentive: 8 years)• Moreover, in Campania A2A owns a biogas plant
Back to Index
10
This information was prepared by A2A and it is not to be relied on by any 3rd party without A2A’s prior written consent.
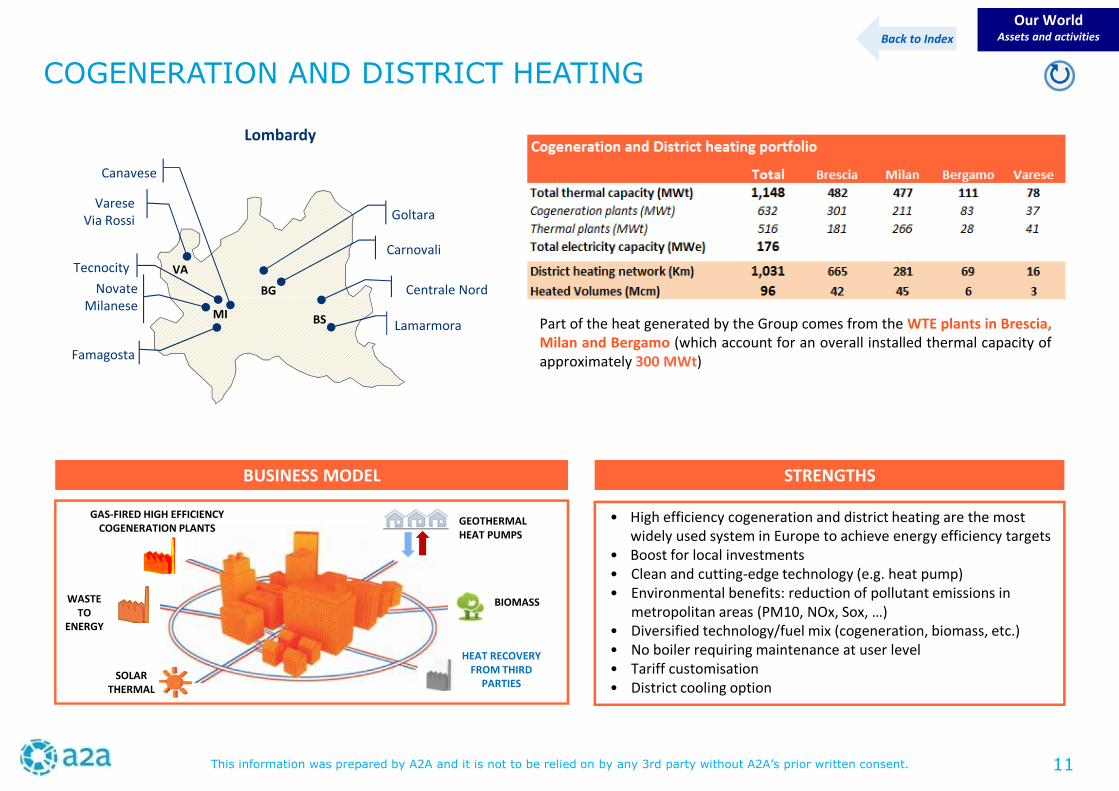
COGENERATION AND DISTRICT HEATING
Our WorldAssets and activities
STRENGTHS
• High efficiency cogeneration and district heating are the mostwidely used system in Europe to achieve energy efficiency targets
• Boost for local investments• Clean and cutting-edge technology (e.g. heat pump)• Environmental benefits: reduction of pollutant emissions in
metropolitan areas (PM10, NOx, Sox, …)• Diversified technology/fuel mix (cogeneration, biomass, etc.)• No boiler requiring maintenance at user level• Tariff customisation• District cooling option
BUSINESS MODEL
MI
BG
BS
VA
Famagosta
Tecnocity
NovateMilanese
Goltara
Lamarmora
Carnovali
VareseVia Rossi
Lombardy
Back to Index
Canavese
Centrale Nord
HEAT RECOVERYFROM THIRD
PARTIESSOLAR
THERMAL
WASTETO
ENERGY
GAS-FIRED HIGH EFFICIENCYCOGENERATION PLANTS
BIOMASS
Part of the heat generated by the Group comes from the WTE plants in Brescia,Milan and Bergamo (which account for an overall installed thermal capacity ofapproximately 300 MWt)
GEOTHERMALHEAT PUMPS
11
This information was prepared by A2A and it is not to be relied on by any 3rd party without A2A’s prior written consent.
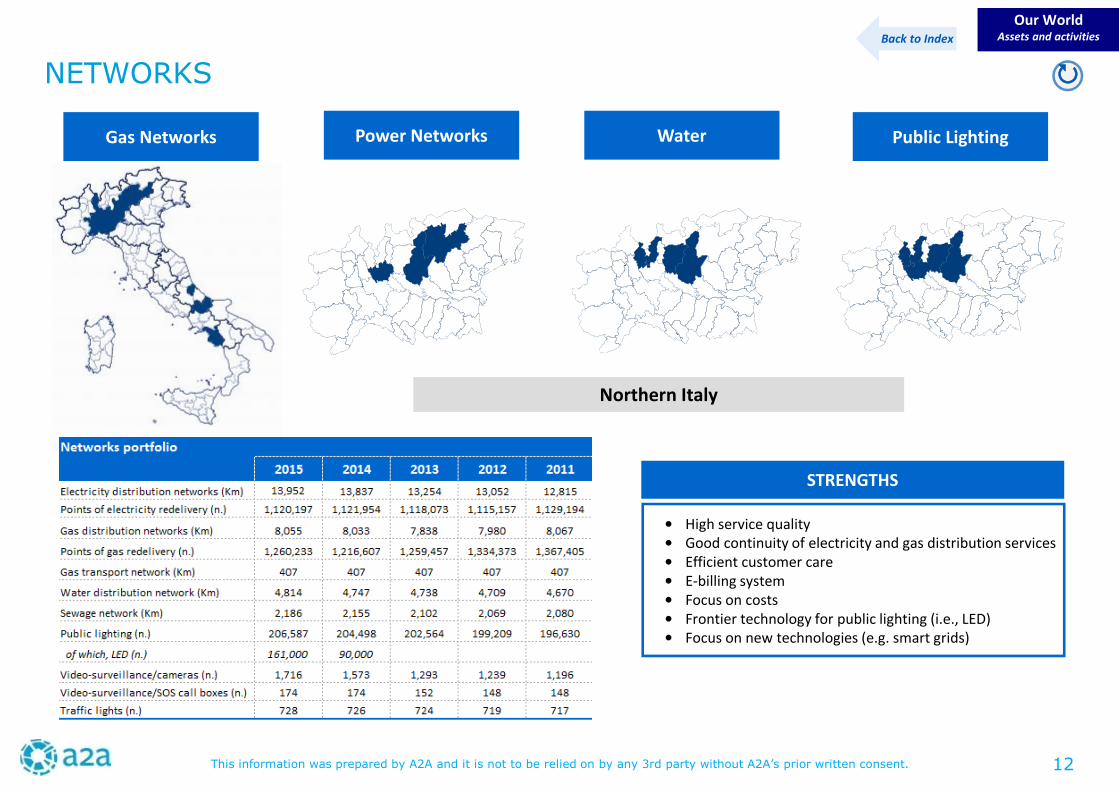
NETWORKS
Our WorldAssets and activities
STRENGTHS
• High service quality• Good continuity of electricity and gas distribution services• Efficient customer care• E-billing system• Focus on costs• Frontier technology for public lighting (i.e., LED)• Focus on new technologies (e.g. smart grids)
Back to Index
Power Networks Water Public LightingGas Networks
Northern Italy
12
This information was prepared by A2A and it is not to be relied on by any 3rd party without A2A’s prior written consent.
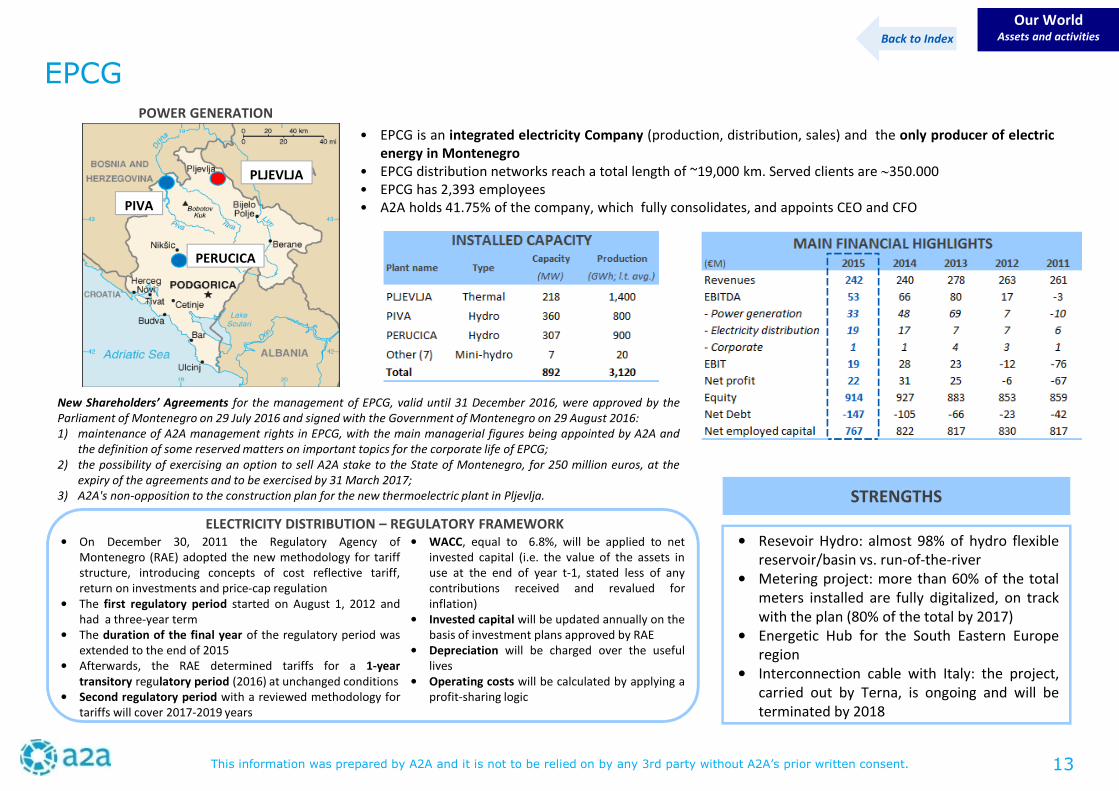
EPCG
Our WorldAssets and activities
PLJEVLJA
PIVA
PERUCICA
• EPCG is an integrated electricity Company (production, distribution, sales) and the only producer of electricenergy in Montenegro
• EPCG distribution networks reach a total length of ~19,000 km. Served clients are ∼350.000• EPCG has 2,393 employees• A2A holds 41.75% of the company, which fully consolidates, and appoints CEO and CFO
• WACC, equal to 6.8%, will be applied to netinvested capital (i.e. the value of the assets inuse at the end of year t-1, stated less of anycontributions received and revalued forinflation)
• Invested capital will be updated annually on thebasis of investment plans approved by RAE
• Depreciation will be charged over the usefullives
• Operating costs will be calculated by applying aprofit-sharing logic
POWER GENERATION
ELECTRICITY DISTRIBUTION – REGULATORY FRAMEWORK• On December 30, 2011 the Regulatory Agency of
Montenegro (RAE) adopted the new methodology for tariffstructure, introducing concepts of cost reflective tariff,return on investments and price-cap regulation
• The first regulatory period started on August 1, 2012 andhad a three-year term
• The duration of the final year of the regulatory period wasextended to the end of 2015
• Afterwards, the RAE determined tariffs for a 1-yeartransitory regulatory period (2016) at unchanged conditions
• Second regulatory period with a reviewed methodology fortariffs will cover 2017-2019 years
Back to Index
STRENGTHS
• Resevoir Hydro: almost 98% of hydro flexiblereservoir/basin vs. run-of-the-river
• Metering project: more than 60% of the totalmeters installed are fully digitalized, on trackwith the plan (80% of the total by 2017)
• Energetic Hub for the South Eastern Europeregion
• Interconnection cable with Italy: the project,carried out by Terna, is ongoing and will beterminated by 2018
New Shareholders’ Agreements for the management of EPCG, valid until 31 December 2016, were approved by theParliament of Montenegro on 29 July 2016 and signed with the Government of Montenegro on 29 August 2016:1) maintenance of A2A management rights in EPCG, with the main managerial figures being appointed by A2A and
the definition of some reserved matters on important topics for the corporate life of EPCG;2) the possibility of exercising an option to sell A2A stake to the State of Montenegro, for 250 million euros, at the
expiry of the agreements and to be exercised by 31 March 2017;3) A2A's non-opposition to the construction plan for the new thermoelectric plant in Pljevlja.
13
This information was prepared by A2A and it is not to be relied on by any 3rd party without A2A’s prior written consent.
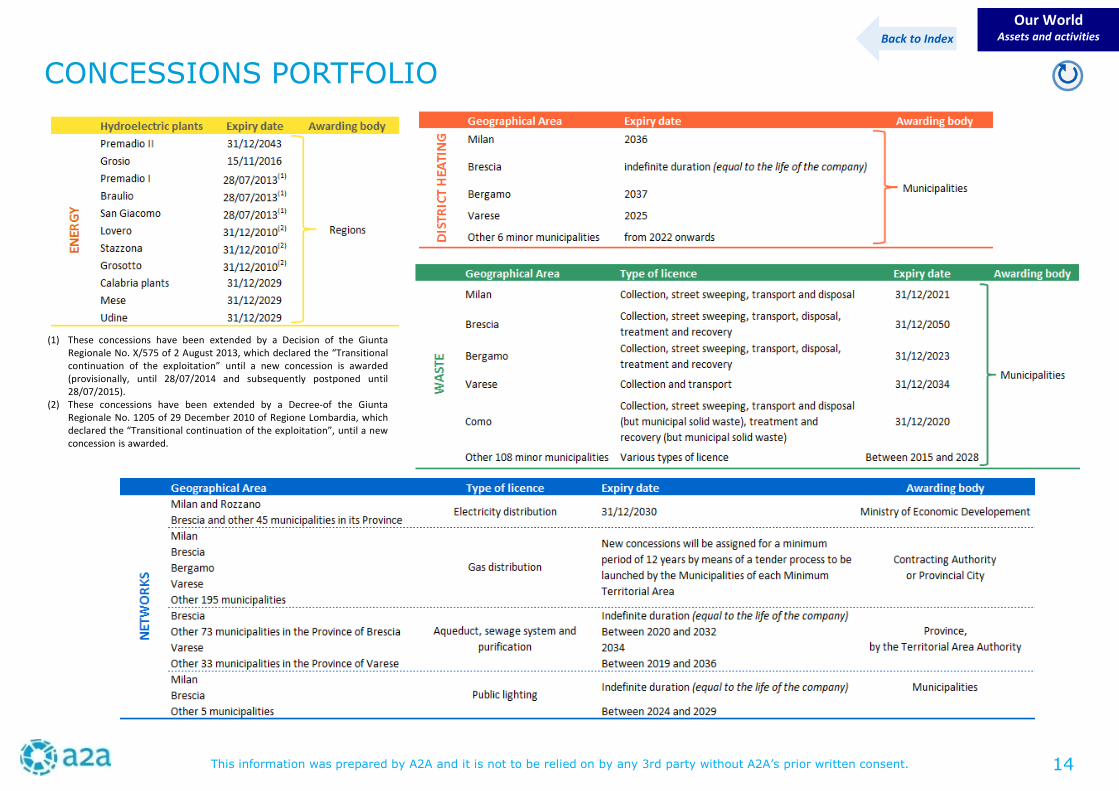
CONCESSIONS PORTFOLIO
Our WorldAssets and activities
(1) These concessions have been extended by a Decision of the GiuntaRegionale No. X/575 of 2 August 2013, which declared the “Transitionalcontinuation of the exploitation” until a new concession is awarded(provisionally, until 28/07/2014 and subsequently postponed until28/07/2015).
(2) These concessions have been extended by a Decree-of the GiuntaRegionale No. 1205 of 29 December 2010 of Regione Lombardia, whichdeclared the “Transitional continuation of the exploitation”, until a newconcession is awarded.
Back to Index
14
This information was prepared by A2A and it is not to be relied on by any 3rd party without A2A’s prior written consent.
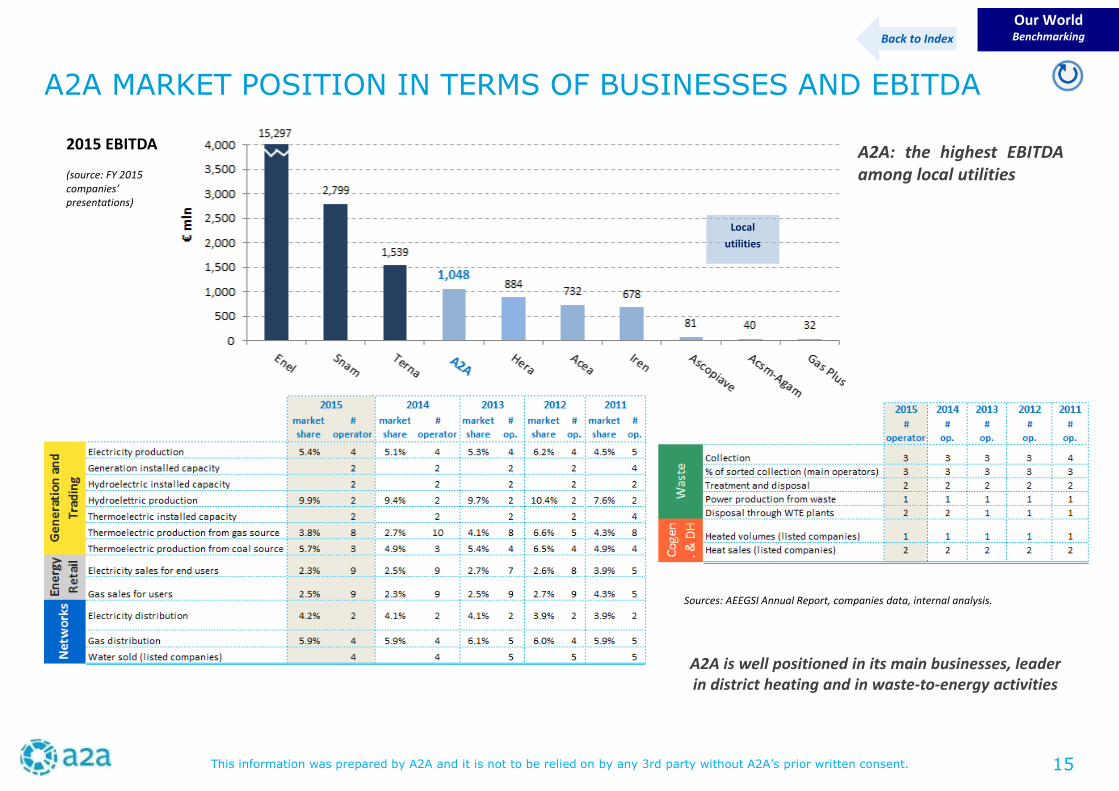
A2A MARKET POSITION IN TERMS OF BUSINESSES AND EBITDA
A2A is well positioned in its main businesses, leaderin district heating and in waste-to-energy activities
Our WorldBenchmarking
Sources: AEEGSI Annual Report, companies data, internal analysis.
2015 EBITDA
(source: FY 2015companies’presentations)
A2A: the highest EBITDAamong local utilities
Local
utilities
15
Back to Index
This information was prepared by A2A and it is not to be relied on by any 3rd party without A2A’s prior written consent.
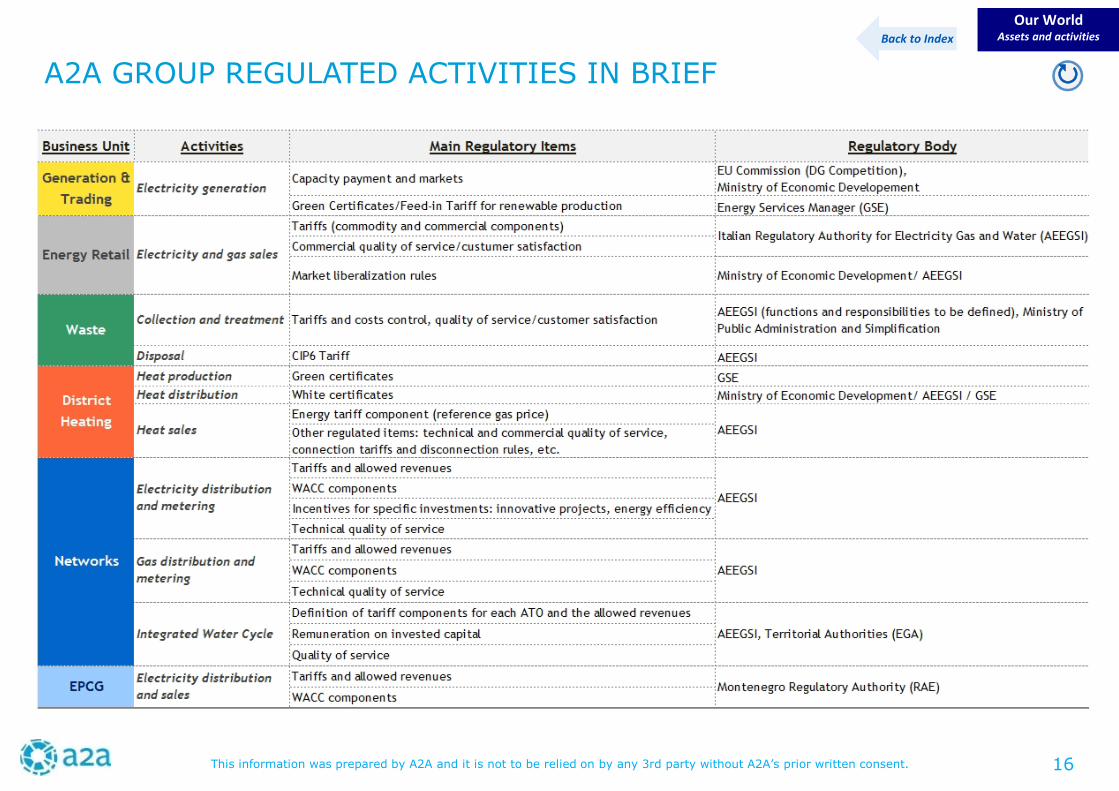
A2A GROUP REGULATED ACTIVITIES IN BRIEF
Our WorldAssets and activities
16
Back to Index
This information was prepared by A2A and it is not to be relied on by any 3rd party without A2A’s prior written consent.
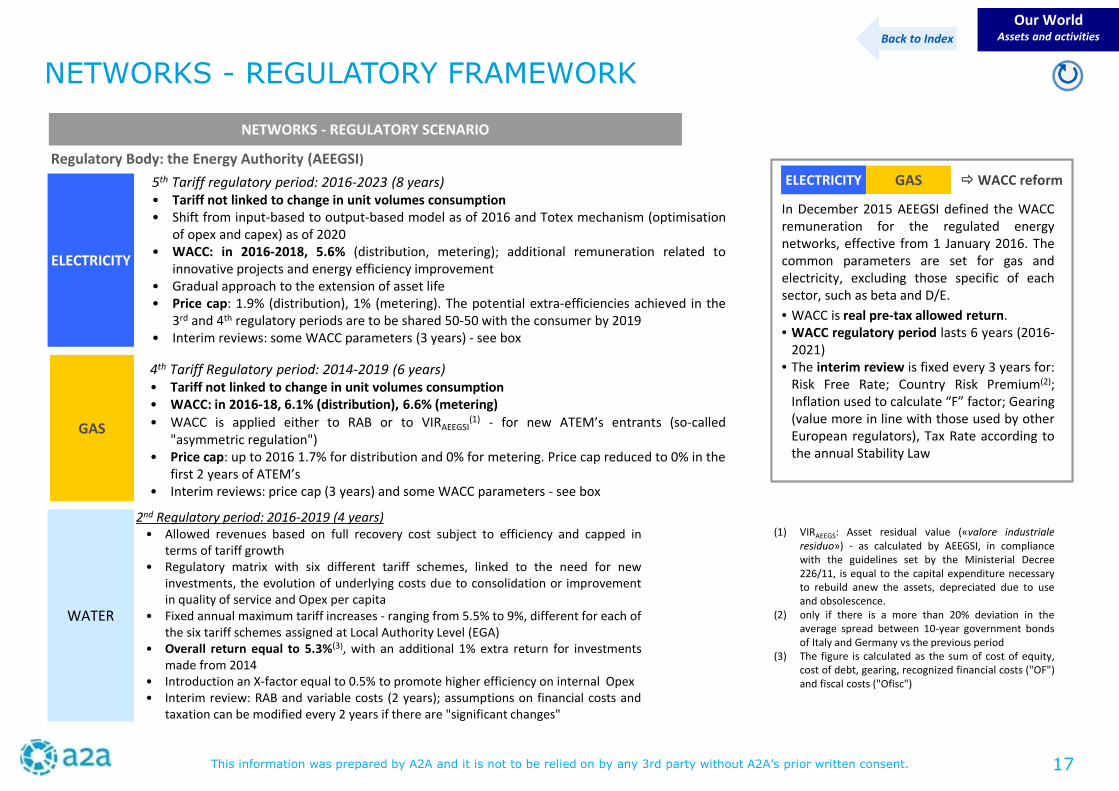
NETWORKS - REGULATORY SCENARIO
ELECTRICITY
5th Tariff regulatory period: 2016-2023 (8 years)• Tariff not linked to change in unit volumes consumption• Shift from input-based to output-based model as of 2016 and Totex mechanism (optimisation
of opex and capex) as of 2020• WACC: in 2016-2018, 5.6% (distribution, metering); additional remuneration related to
innovative projects and energy efficiency improvement• Gradual approach to the extension of asset life• Price cap: 1.9% (distribution), 1% (metering). The potential extra-efficiencies achieved in the
3rd and 4th regulatory periods are to be shared 50-50 with the consumer by 2019• Interim reviews: some WACC parameters (3 years) - see box
GAS
4th Tariff Regulatory period: 2014-2019 (6 years)• Tariff not linked to change in unit volumes consumption• WACC: in 2016-18, 6.1% (distribution), 6.6% (metering)• WACC is applied either to RAB or to VIRAEEGSI
(1) - for new ATEM’s entrants (so-called"asymmetric regulation")
• Price cap: up to 2016 1.7% for distribution and 0% for metering. Price cap reduced to 0% in thefirst 2 years of ATEM’s
• Interim reviews: price cap (3 years) and some WACC parameters - see box
WATER
Regulatory Body: the Energy Authority (AEEGSI)
NETWORKS - REGULATORY FRAMEWORK
Our WorldAssets and activities
In December 2015 AEEGSI defined the WACCremuneration for the regulated energynetworks, effective from 1 January 2016. Thecommon parameters are set for gas andelectricity, excluding those specific of eachsector, such as beta and D/E.
• WACC is real pre-tax allowed return.• WACC regulatory period lasts 6 years (2016-
2021)• The interim review is fixed every 3 years for:
Risk Free Rate; Country Risk Premium(2);Inflation used to calculate “F” factor; Gearing(value more in line with those used by otherEuropean regulators), Tax Rate according tothe annual Stability Law
ELECTRICITY GAS WACC reform
(1) VIRAEEGS: Asset residual value («valore industrialeresiduo») - as calculated by AEEGSI, in compliancewith the guidelines set by the Ministerial Decree226/11, is equal to the capital expenditure necessaryto rebuild anew the assets, depreciated due to useand obsolescence.
(2) only if there is a more than 20% deviation in theaverage spread between 10-year government bondsof Italy and Germany vs the previous period
(3) The figure is calculated as the sum of cost of equity,cost of debt, gearing, recognized financial costs ("OF")and fiscal costs ("Ofisc")
17
2nd Regulatory period: 2016-2019 (4 years)• Allowed revenues based on full recovery cost subject to efficiency and capped in
terms of tariff growth• Regulatory matrix with six different tariff schemes, linked to the need for new
investments, the evolution of underlying costs due to consolidation or improvementin quality of service and Opex per capita
• Fixed annual maximum tariff increases - ranging from 5.5% to 9%, different for each ofthe six tariff schemes assigned at Local Authority Level (EGA)
• Overall return equal to 5.3%(3), with an additional 1% extra return for investmentsmade from 2014
• Introduction an X-factor equal to 0.5% to promote higher efficiency on internal Opex• Interim review: RAB and variable costs (2 years); assumptions on financial costs and
taxation can be modified every 2 years if there are "significant changes"
Back to Index
This information was prepared by A2A and it is not to be relied on by any 3rd party without A2A’s prior written consent.
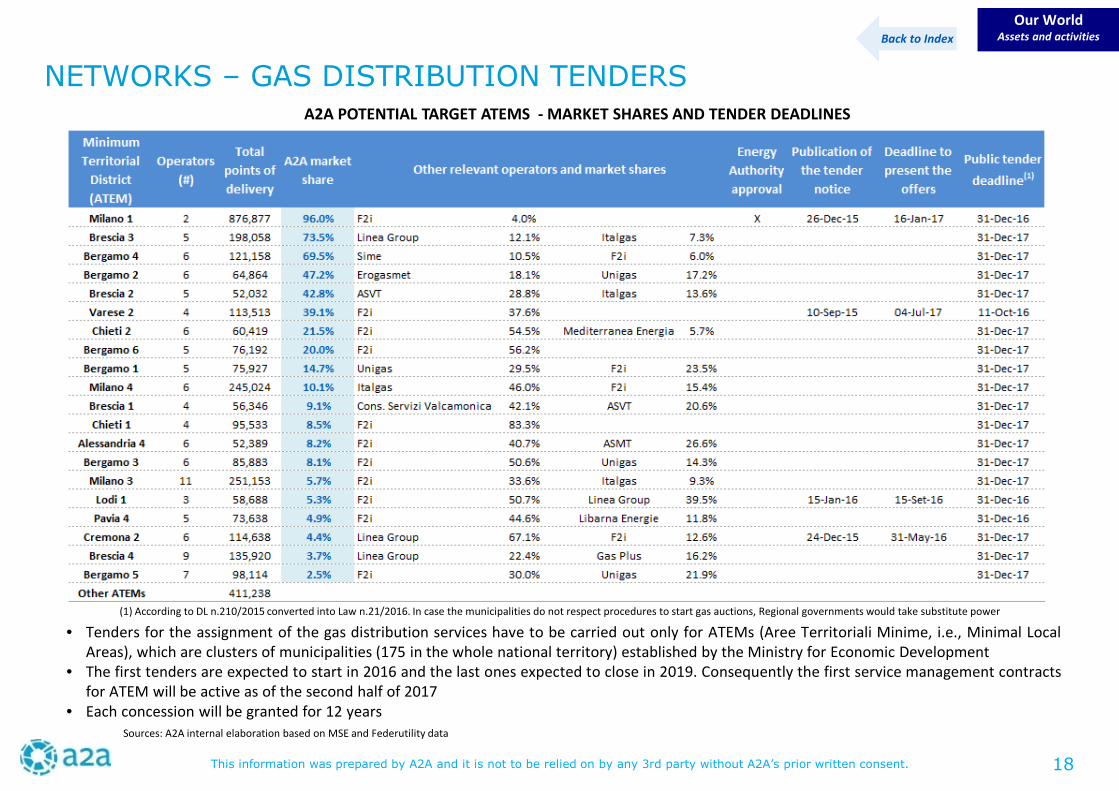
NETWORKS – GAS DISTRIBUTION TENDERS
• Tenders for the assignment of the gas distribution services have to be carried out only for ATEMs (Aree Territoriali Minime, i.e., Minimal LocalAreas), which are clusters of municipalities (175 in the whole national territory) established by the Ministry for Economic Development
• The first tenders are expected to start in 2016 and the last ones expected to close in 2019. Consequently the first service management contractsfor ATEM will be active as of the second half of 2017
• Each concession will be granted for 12 years
A2A POTENTIAL TARGET ATEMS - MARKET SHARES AND TENDER DEADLINES
Sources: A2A internal elaboration based on MSE and Federutility data
Our WorldAssets and activitiesBack to Index
(1) According to DL n.210/2015 converted into Law n.21/2016. In case the municipalities do not respect procedures to start gas auctions, Regional governments would take substitute power
18
This information was prepared by A2A and it is not to be relied on by any 3rd party without A2A’s prior written consent.
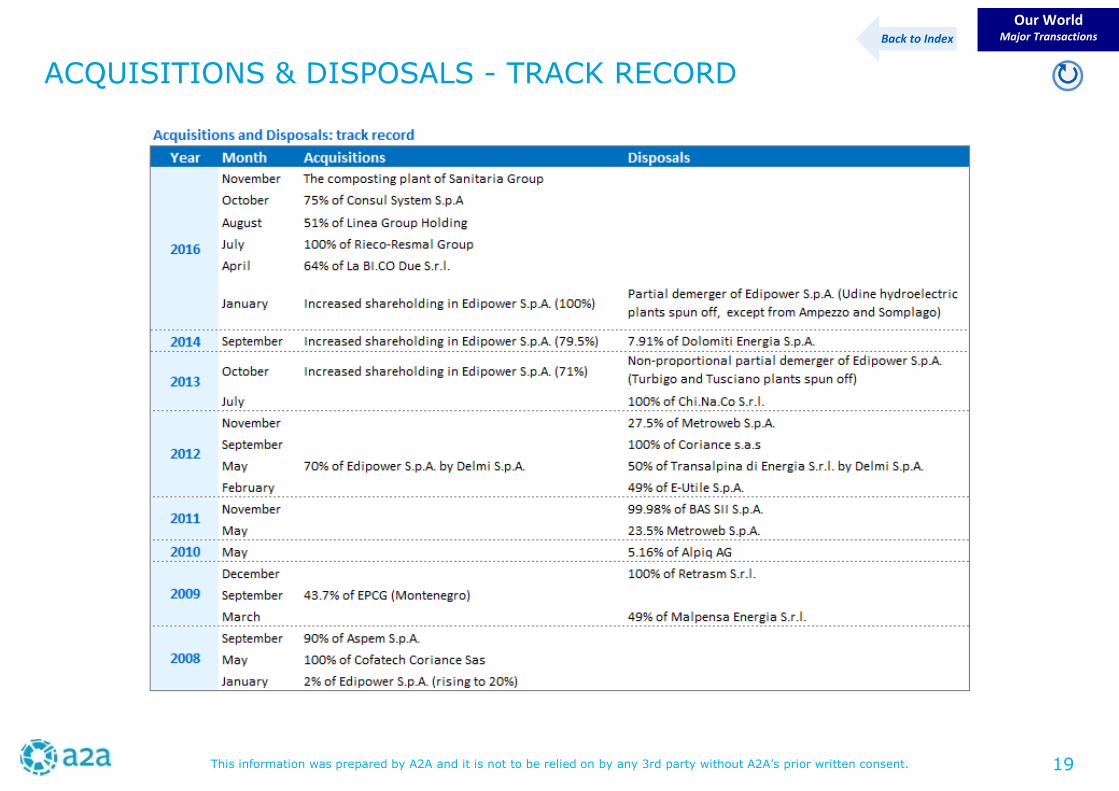
ACQUISITIONS & DISPOSALS - TRACK RECORD
Our WorldMajor Transactions
Back to Index
19
This information was prepared by A2A and it is not to be relied on by any 3rd party without A2A’s prior written consent.
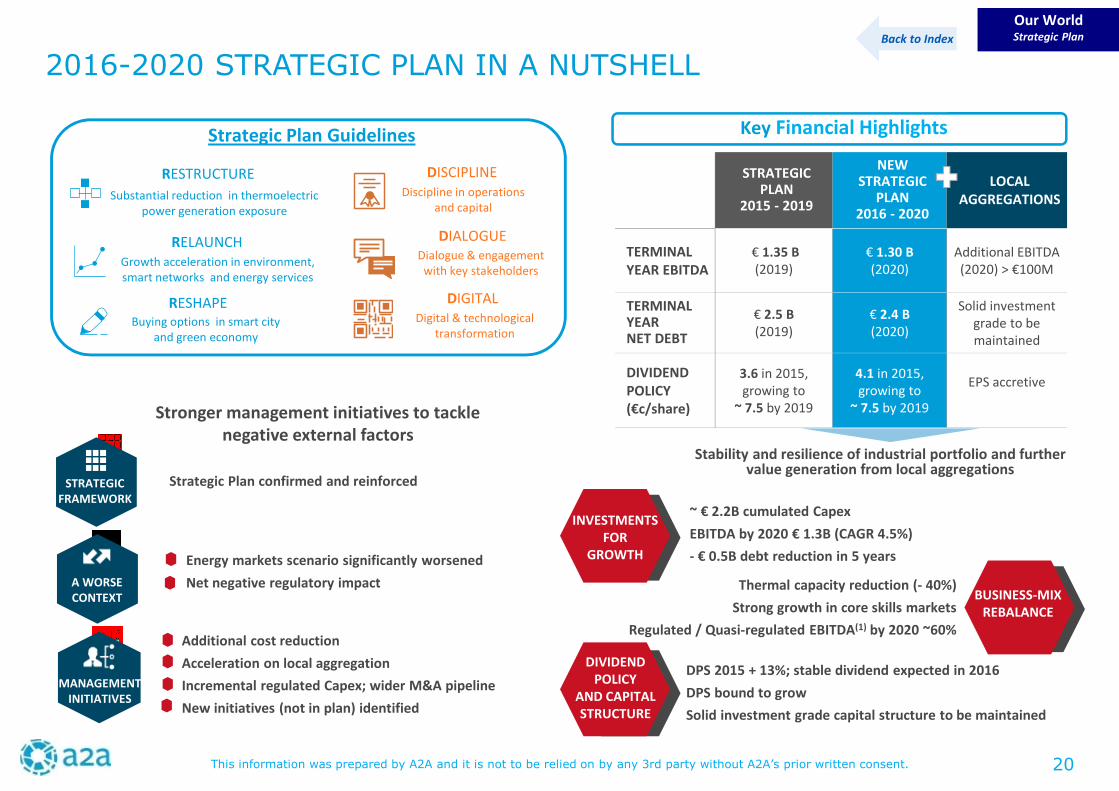
2016-2020 STRATEGIC PLAN IN A NUTSHELL
Our WorldStrategic PlanBack to Index
Strategic Plan confirmed and reinforced
Energy markets scenario significantly worsened
Net negative regulatory impact
Additional cost reduction
Acceleration on local aggregation
Incremental regulated Capex; wider M&A pipeline
New initiatives (not in plan) identified
A WORSECONTEXT
MANAGEMENTINITIATIVES
STRATEGICFRAMEWORK
Stronger management initiatives to tacklenegative external factors
STRATEGICPLAN
2015 - 2019
NEWSTRATEGIC
PLAN2016 - 2020
LOCALAGGREGATIONS
TERMINALYEAR EBITDA
€ 1.35 B(2019)
€ 1.30 B(2020)
Additional EBITDA(2020) > €100M
TERMINALYEARNET DEBT
€ 2.5 B(2019)
€ 2.4 B(2020)
Solid investmentgrade to bemaintained
DIVIDENDPOLICY(€c/share)
3.6 in 2015,growing to
~ 7.5 by 2019
4.1 in 2015,growing to
~ 7.5 by 2019
EPS accretive
Stability and resilience of industrial portfolio and furthervalue generation from local aggregations
RESTRUCTURE
Substantial reduction in thermoelectricpower generation exposure
RELAUNCHGrowth acceleration in environment,smart networks and energy services
RESHAPEBuying options in smart city
and green economy
DISCIPLINEDiscipline in operations
and capital
DIALOGUEDialogue & engagement
with key stakeholders
DIGITALDigital & technological
transformation
Strategic Plan Guidelines
INVESTMENTSFOR
GROWTH
~ € 2.2B cumulated Capex
EBITDA by 2020 € 1.3B (CAGR 4.5%)
- € 0.5B debt reduction in 5 years
Thermal capacity reduction (- 40%)
Strong growth in core skills markets
Regulated / Quasi-regulated EBITDA(1) by 2020 ~60%
DPS 2015 + 13%; stable dividend expected in 2016
DPS bound to grow
Solid investment grade capital structure to be maintained
DIVIDENDPOLICY
AND CAPITALSTRUCTURE
BUSINESS-MIXREBALANCE
Key Financial Highlights
20
This information was prepared by A2A and it is not to be relied on by any 3rd party without A2A’s prior written consent.
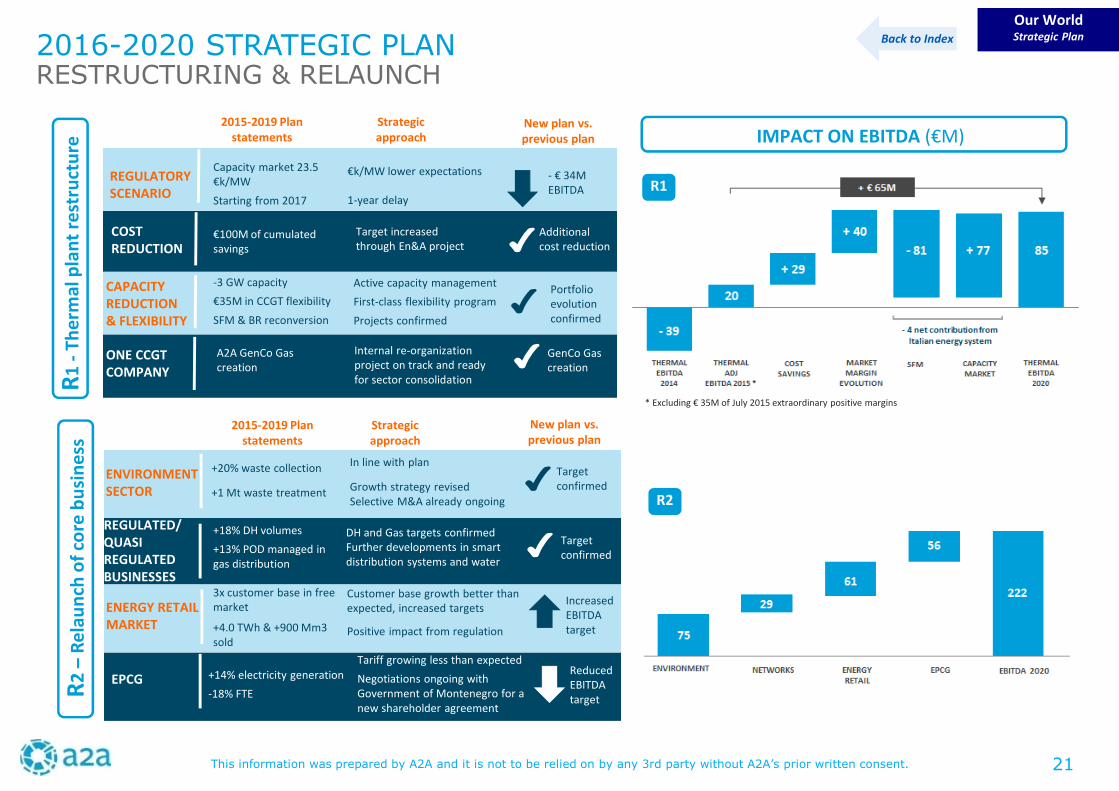
R1
-Th
erm
alp
lan
tre
stru
ctu
reR
2–
Rel
aun
cho
fco
reb
usi
nes
s
Our WorldStrategic PlanBack to Index
REGULATORYSCENARIO
ONE CCGTCOMPANY
ENVIRONMENTSECTOR
REGULATED/QUASIREGULATEDBUSINESSES
ENERGY RETAILMARKET
EPCG
R1
CAPACITYREDUCTION& FLEXIBILITY
COSTREDUCTION
* Excluding € 35M of July 2015 extraordinary positive margins
2015-2019 Planstatements
Strategicapproach
New plan vs.previous plan
Capacity market 23.5€k/MW
Starting from 2017
€100M of cumulatedsavings
-3 GW capacity
€35M in CCGT flexibility
SFM & BR reconversion
A2A GenCo Gascreation
Target increasedthrough En&A project
Active capacity management
First-class flexibility program
Projects confirmed
Internal re-organizationproject on track and readyfor sector consolidation
€k/MW lower expectations
1-year delay
2015-2019 Planstatements
Strategicapproach
New plan vs.previous plan
- € 34MEBITDA
Additionalcost reduction
Portfolioevolutionconfirmed
GenCo Gascreation
+20% waste collection
+1 Mt waste treatment
+18% DH volumes
+13% POD managed ingas distribution
3x customer base in freemarket
+4.0 TWh & +900 Mm3sold
+14% electricity generation
-18% FTE
DH and Gas targets confirmedFurther developments in smartdistribution systems and water
Customer base growth better thanexpected, increased targets
Positive impact from regulation
Tariff growing less than expected
Negotiations ongoing withGovernment of Montenegro for anew shareholder agreement
In line with plan
Growth strategy revisedSelective M&A already ongoing
Targetconfirmed
Targetconfirmed
IncreasedEBITDAtarget
ReducedEBITDAtarget
R2
IMPACT ON EBITDA (€M)
2016-2020 STRATEGIC PLANRESTRUCTURING & RELAUNCH
21
This information was prepared by A2A and it is not to be relied on by any 3rd party without A2A’s prior written consent.
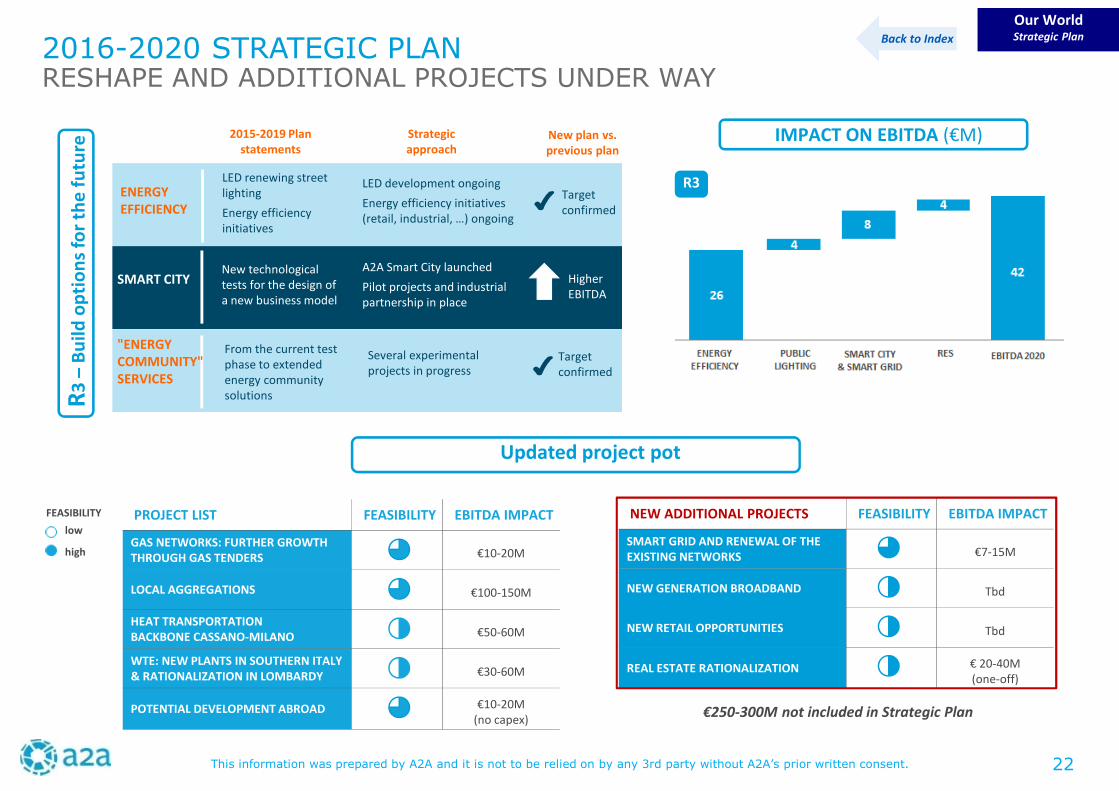
R3
–B
uild
op
tio
ns
for
the
futu
re
Our WorldStrategic PlanBack to Index
IMPACT ON EBITDA (€M)
ENERGYEFFICIENCY
SMART CITY
2016-2020 STRATEGIC PLANRESHAPE AND ADDITIONAL PROJECTS UNDER WAY
R3
2015-2019 Planstatements
Strategicapproach
New plan vs.previous plan
"ENERGYCOMMUNITY"SERVICES
LED renewing streetlighting
Energy efficiencyinitiatives
LED development ongoing
Energy efficiency initiatives(retail, industrial, …) ongoing
Targetconfirmed
New technologicaltests for the design ofa new business model
A2A Smart City launched
Pilot projects and industrialpartnership in place
HigherEBITDA
From the current testphase to extendedenergy communitysolutions
Several experimentalprojects in progress
Targetconfirmed
Updated project pot
FEASIBILITY
low
high
PROJECT LIST FEASIBILITY EBITDA IMPACT
GAS NETWORKS: FURTHER GROWTHTHROUGH GAS TENDERS €10-20M
LOCAL AGGREGATIONS €100-150M
HEAT TRANSPORTATIONBACKBONE CASSANO-MILANO €50-60M
WTE: NEW PLANTS IN SOUTHERN ITALY& RATIONALIZATION IN LOMBARDY €30-60M
POTENTIAL DEVELOPMENT ABROAD €10-20M(no capex)
NEW ADDITIONAL PROJECTS FEASIBILITY EBITDA IMPACT
SMART GRID AND RENEWAL OF THEEXISTING NETWORKS €7-15M
NEW GENERATION BROADBAND Tbd
NEW RETAIL OPPORTUNITIES Tbd
REAL ESTATE RATIONALIZATION € 20-40M(one-off)
€250-300M not included in Strategic Plan
22
This information was prepared by A2A and it is not to be relied on by any 3rd party without A2A’s prior written consent.
Our WorldStrategic PlanBack to Index
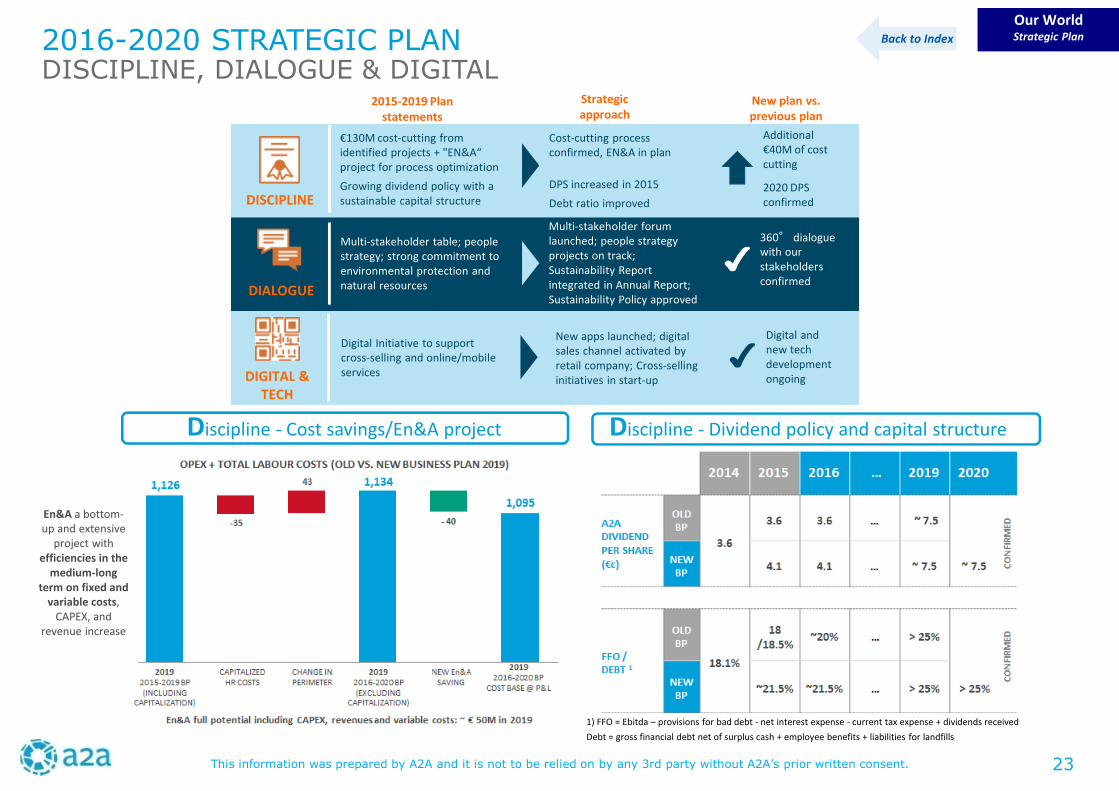
1) FFO = Ebitda – provisions for bad debt - net interest expense - current tax expense + dividends received
Debt = gross financial debt net of surplus cash + employee benefits + liabilities for landfills
2016-2020 STRATEGIC PLANDISCIPLINE, DIALOGUE & DIGITAL
Discipline - Cost savings/En&A project Discipline - Dividend policy and capital structure
DISCIPLINE
DIGITAL &TECH
DIALOGUE
2015-2019 Planstatements
Strategicapproach
New plan vs.previous plan
€130M cost-cutting fromidentified projects + "EN&A“project for process optimization
Growing dividend policy with asustainable capital structure
Multi-stakeholder table; peoplestrategy; strong commitment toenvironmental protection andnatural resources
Digital Initiative to supportcross-selling and online/mobileservices
Cost-cutting processconfirmed, EN&A in plan
DPS increased in 2015
Debt ratio improved
Multi-stakeholder forumlaunched; people strategyprojects on track;Sustainability Reportintegrated in Annual Report;Sustainability Policy approved
New apps launched; digitalsales channel activated byretail company; Cross-sellinginitiatives in start-up
360° dialoguewith ourstakeholdersconfirmed
Additional€40M of costcutting
2020 DPSconfirmed
Digital andnew techdevelopmentongoing
En&A a bottom-up and extensive
project withefficiencies in the
medium-longterm on fixed and
variable costs,CAPEX, and
revenue increase
23
This information was prepared by A2A and it is not to be relied on by any 3rd party without A2A’s prior written consent.
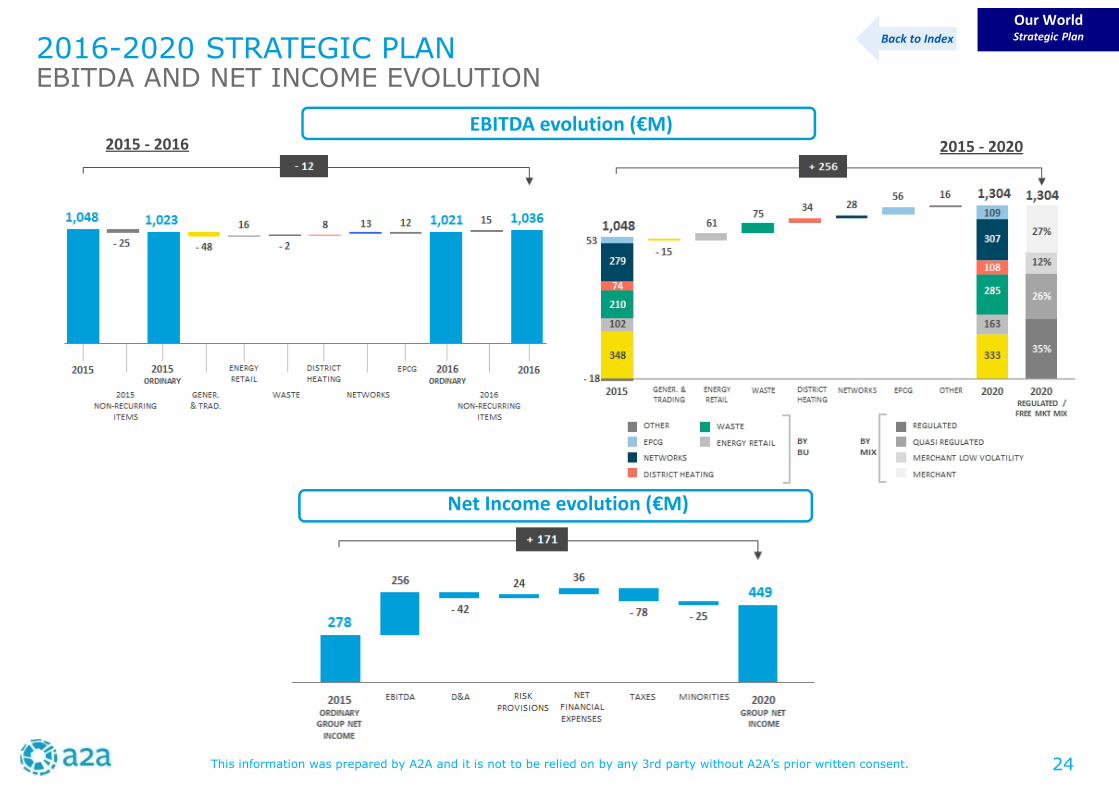
2016-2020 STRATEGIC PLANEBITDA AND NET INCOME EVOLUTION
Our WorldStrategic PlanBack to Index
EBITDA evolution (€M)2015 - 2016
Net Income evolution (€M)
2015 - 2020
24
This information was prepared by A2A and it is not to be relied on by any 3rd party without A2A’s prior written consent.
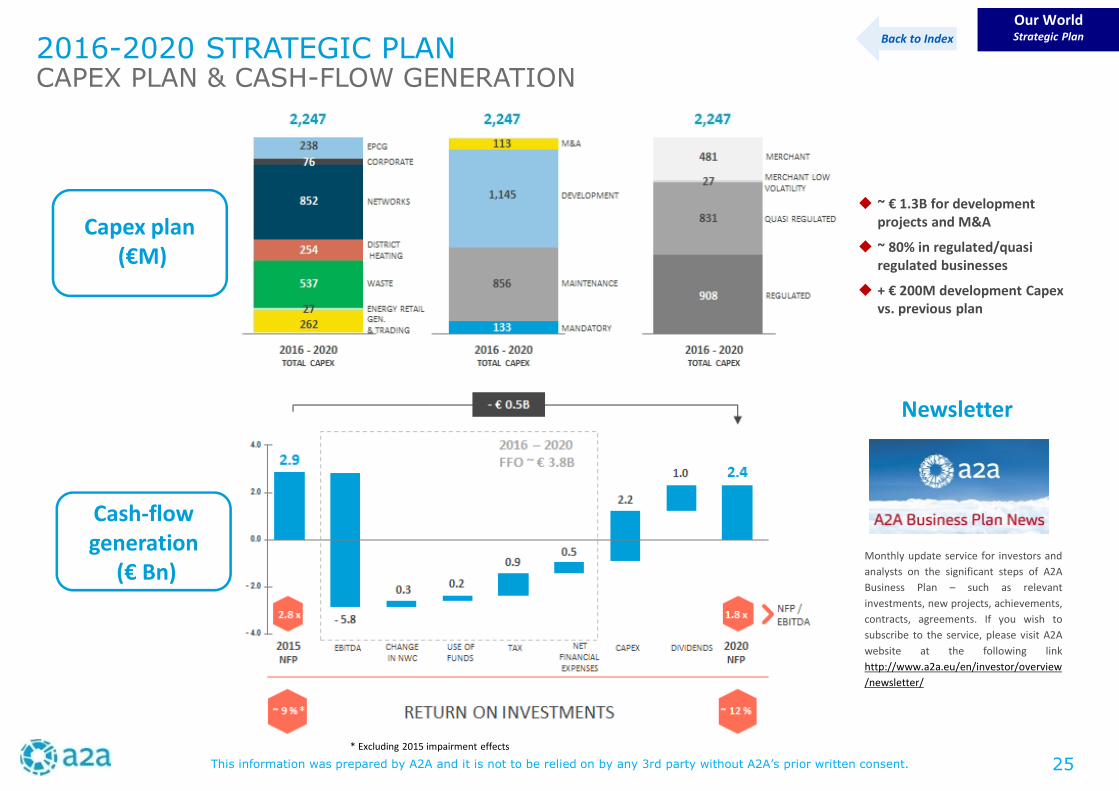
2016-2020 STRATEGIC PLANCAPEX PLAN & CASH-FLOW GENERATION
Our WorldStrategic PlanBack to Index
Capex plan(€M)
* Excluding 2015 impairment effects
~ € 1.3B for developmentprojects and M&A
~ 80% in regulated/quasiregulated businesses
+ € 200M development Capexvs. previous plan
Cash-flowgeneration
(€ Bn)Monthly update service for investors and
analysts on the significant steps of A2A
Business Plan – such as relevant
investments, new projects, achievements,
contracts, agreements. If you wish to
subscribe to the service, please visit A2A
website at the following link
http://www.a2a.eu/en/investor/overview
/newsletter/
Newsletter
25
This information was prepared by A2A and it is not to be relied on by any 3rd party without A2A’s prior written consent.
INDEX
Our Results Our ResponsibilitiesOur World
More in-depth, updates and documents available in the following website sections• Operating and Consolidated results: http://www.a2a.eu/en/investor/reports/• Debt: http://www.a2a.eu/en/investor/debt/• Risk Management: http://www.a2a.eu/en/investor/risk_management/
@
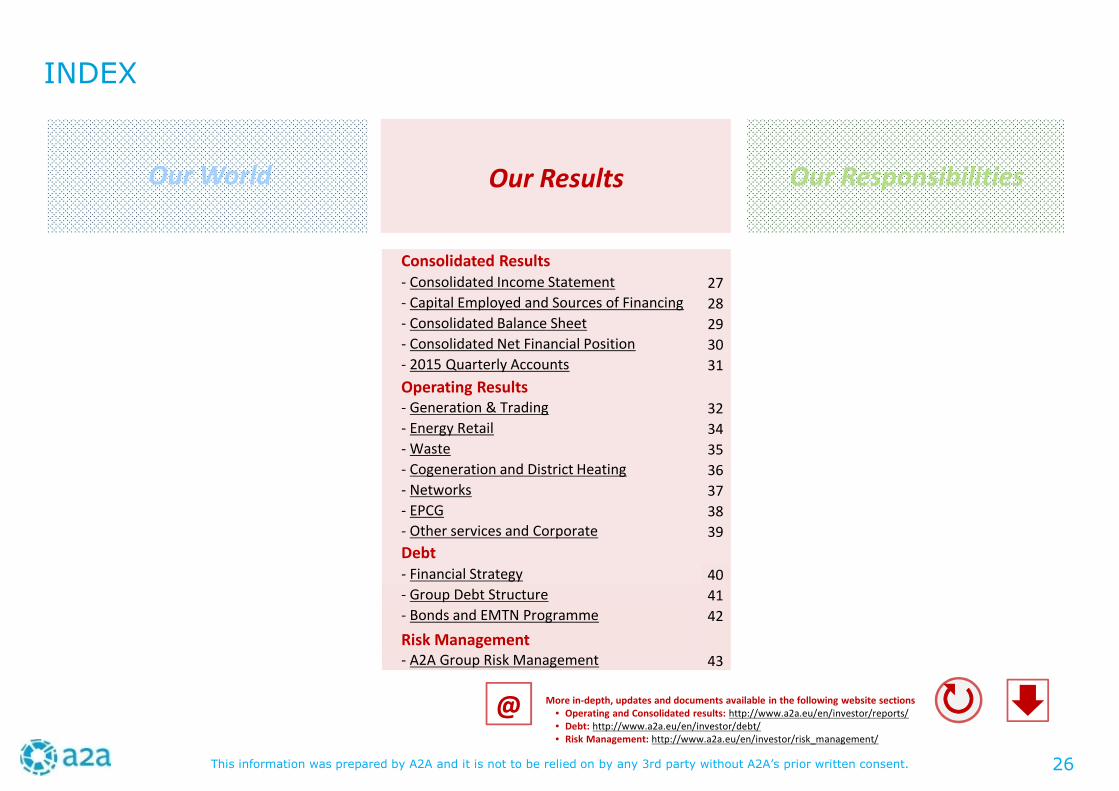
Consolidated Results- Consolidated Income Statement 27- Capital Employed and Sources of Financing 28- Consolidated Balance Sheet 29- Consolidated Net Financial Position 30- 2015 Quarterly Accounts 31
Operating Results- Generation & Trading 32- Energy Retail 34- Waste 35- Cogeneration and District Heating 36- Networks 37- EPCG 38- Other services and Corporate 39
Debt- Financial Strategy 40- Group Debt Structure 41- Bonds and EMTN Programme 42
Risk Management- A2A Group Risk Management 43
26
This information was prepared by A2A and it is not to be relied on by any 3rd party without A2A’s prior written consent.
Our ResultsConsolidated Results
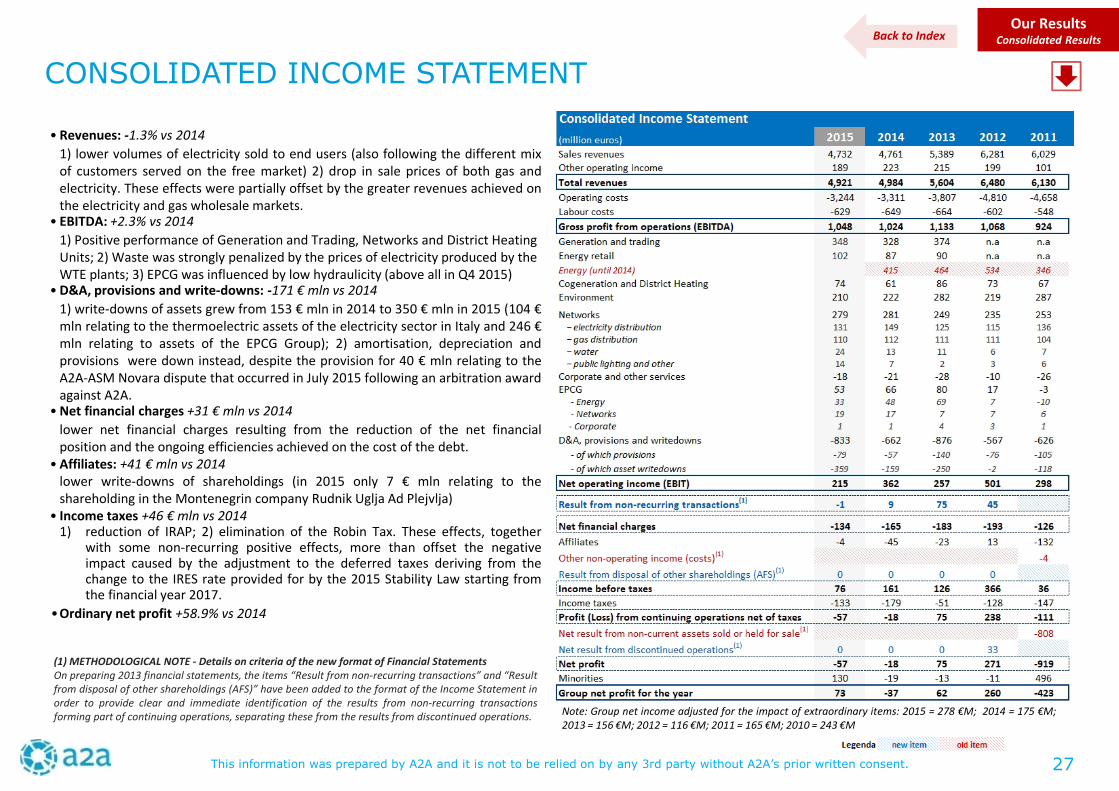
CONSOLIDATED INCOME STATEMENT
Note: Group net income adjusted for the impact of extraordinary items: 2015 = 278 €M; 2014 = 175 €M;2013 = 156 €M; 2012 = 116 €M; 2011 = 165 €M; 2010 = 243 €M
(1) METHODOLOGICAL NOTE - Details on criteria of the new format of Financial StatementsOn preparing 2013 financial statements, the items “Result from non-recurring transactions” and “Resultfrom disposal of other shareholdings (AFS)” have been added to the format of the Income Statement inorder to provide clear and immediate identification of the results from non-recurring transactionsforming part of continuing operations, separating these from the results from discontinued operations.
• Revenues: -1.3% vs 2014
1) lower volumes of electricity sold to end users (also following the different mixof customers served on the free market) 2) drop in sale prices of both gas andelectricity. These effects were partially offset by the greater revenues achieved onthe electricity and gas wholesale markets.
• EBITDA: +2.3% vs 2014
1) Positive performance of Generation and Trading, Networks and District HeatingUnits; 2) Waste was strongly penalized by the prices of electricity produced by theWTE plants; 3) EPCG was influenced by low hydraulicity (above all in Q4 2015)
• D&A, provisions and write-downs: -171 € mln vs 2014
1) write-downs of assets grew from 153 € mln in 2014 to 350 € mln in 2015 (104 €mln relating to the thermoelectric assets of the electricity sector in Italy and 246 €mln relating to assets of the EPCG Group); 2) amortisation, depreciation andprovisions were down instead, despite the provision for 40 € mln relating to theA2A-ASM Novara dispute that occurred in July 2015 following an arbitration awardagainst A2A.
• Net financial charges +31 € mln vs 2014
lower net financial charges resulting from the reduction of the net financialposition and the ongoing efficiencies achieved on the cost of the debt.
• Affiliates: +41 € mln vs 2014lower write-downs of shareholdings (in 2015 only 7 € mln relating to theshareholding in the Montenegrin company Rudnik Uglja Ad Plejvlja)
• Income taxes +46 € mln vs 20141) reduction of IRAP; 2) elimination of the Robin Tax. These effects, together
with some non-recurring positive effects, more than offset the negativeimpact caused by the adjustment to the deferred taxes deriving from thechange to the IRES rate provided for by the 2015 Stability Law starting fromthe financial year 2017.
•Ordinary net profit +58.9% vs 2014
Back to Index
27
This information was prepared by A2A and it is not to be relied on by any 3rd party without A2A’s prior written consent.
Our ResultsConsolidated Results
CAPITAL EMPLOYED AND SOURCES OF FINANCING
(1) IFRIC 12 states that, based on the characteristics of the concession arrangement, the infrastructures used in the provision ofpublic services under concession are to be recognized as intangible assets if the operator has the right to receive a paymentfrom the customer for the service provided, or as a financial asset if the operator has the right to receive payment from thepublic sector entity.
(2) Net of balances included in net financial position
Scope of consolidationThe Annual Report of the A2A Group at December 31, 2015 includes thefigures of the parent A2A S.p.A. and those of the subsidiaries over which A2AS.p.A. exercises either direct or indirect control, even if the holding is less than50%. In addition, companies in which the parent exercises joint control withother entities (joint ventures) and those over which it has a significantinfluence are consolidated using the equity method.
Changes in the scope of consolidationFollowing the acquisition in April 2015 of the remaining 50% of the sharecapital of the company Bellisolina S.r.l., the latter, previously consolidatedwith the equity method, at December 31, 2015 is 100% controlled by A2AAmbiente S.p.A. and was therefore fully consolidated.Following the acquisition of the additional 50% of the share capital of thecompany Bergamo Servizi S.r.l., the latter, previously valued using the equitymethod, at December 31, 2015, is 100% controlled by Aprica S.p.A. and wasfully consolidated.In the first half-year of 2015, the acquisition was finally completed of anadditional 30% of the share capital the SED S.r.l. by A2A Ambiente S.p.A.. AtDecember 31, 2015, SED S.r.l. is 80% controlled by A2A Ambiente S.p.A. andwas therefore consolidated on a line-by-line basis.The investment in SEASM S.r.l. held 67% by A2A S.p.A. previously consolidatedon a line-by-line basis, has been reclassified to “Non-current assets held forsale”, following management’s decision to sell the investment
• The consolidated “Capital employed” at 31 December 2015came to 6,156 € mln and was covered by the Net Equity for3,259 € mln and the net financial debt for 2,897 € mln. TheCapital employed includes assets/liabilities held for sale for147 € mln.
• The “Net working capital” amounted to 180 € mln, reducedby 168 € mln compared to 31 December 2014 mainly as aresult of the reduction of gas inventories and the decrease incurrent tax assets.
• The “Net fixed capital” amounted to 5,829 € mln, areduction of 365 € mln compared to 31 December 2014mainly due to the decrease in tangible assets following write-downs and depreciation for the year and the reclassification,for 166 € mln of tangible assets held for sale.
Back to Index
28
This information was prepared by A2A and it is not to be relied on by any 3rd party without A2A’s prior written consent.
Our ResultsConsolidated Results
CONSOLIDATED BALANCE SHEET
(1) Book values on A2A Separate Financial Statements at 31 December, 2015(2) Book value impacted by a write-down amounting to 54 € mln in 2014(3) At their general meeting on 17 July 2014, EPCG shareholders approved a share capital increase arising from the
conversion of the company’s tax liability. As a result, A2A shareholding decreased to 41.75%, with no variations in A2Arights to manage the company as established in the agreements signed in 2009
(4) At 31 December 2015 A2A S.p.A. reserves available for distribution to shareholders amounted to 406,743,957 euro.
Back to Index
29
This information was prepared by A2A and it is not to be relied on by any 3rd party without A2A’s prior written consent.
Mandate for the legal audit of the accounts for theyears from 2016 to 2024The AGM called On 11 June 2015 the AGM conferred themandate for the legal audit of the accounts for the yearsfrom 2016 to 2024 to Reconta Ernst & Young S.p.A..
Our ResultsConsolidated Results
CONSOLIDATED NET FINANCIAL POSITION
• 2015 showed a further substantial reduction of the“Net Financial Position” by 466 million euros.TheNFP, amounting to 2,897 € mln, benefited from thegeneration of net cash flow of 466 € mln afterinvestments of 344 € mln million euros (upcompared to 307 € mln in 2014) and the paymentof dividends for 113 € mln (up compared to 102 €mln in 2014).
• The debt ratio (Net Debt/EBITDA) reached 2.76x(3.28x at the end of 2014, 3.42x at the end of 2013)
(1) Net of capital gains from shareholding disposals(2) Net of balances with contra-entry in equity
Business outlook for operations (updated at Q1 2016)The energy scenario continues to be characterised bymajor volatility and a commodity price level that isbelow last year, as well as - albeit to a lesser extent -below the levels hypothesised by thecompany in itsStrategic Plan.In April/May 2016, however, a recovery was recordedto oil prices and the forward curves on energy priceswould also appear to have reversed the downwardtrend. Moreover, the company covered around 70% ofits 2016 production through forward contracts,guaranteeing at least a partial level of indifference tomarket price changes.In view of the cover in place and the multiple activitiesunderway, A2A believes that the year may conclude asplanned, without any significant differences ascompared with 2015.
Back to Index
External auditorsAuditing activities for the separate and consolidated financialstatements of A2A S.p.A. are currently carried out byPricewaterhouseCoopers S.p.A., whose appointment was made on26 April 2007 and will expire on the date of the meeting called todeliberate the allocation of the profits for the year 2015.
30
This information was prepared by A2A and it is not to be relied on by any 3rd party without A2A’s prior written consent.
Our ResultsConsolidated Results
2015 QUARTERLY ACCOUNTSBack to Index
31
This information was prepared by A2A and it is not to be relied on by any 3rd party without A2A’s prior written consent.
Our ResultsOperating Results
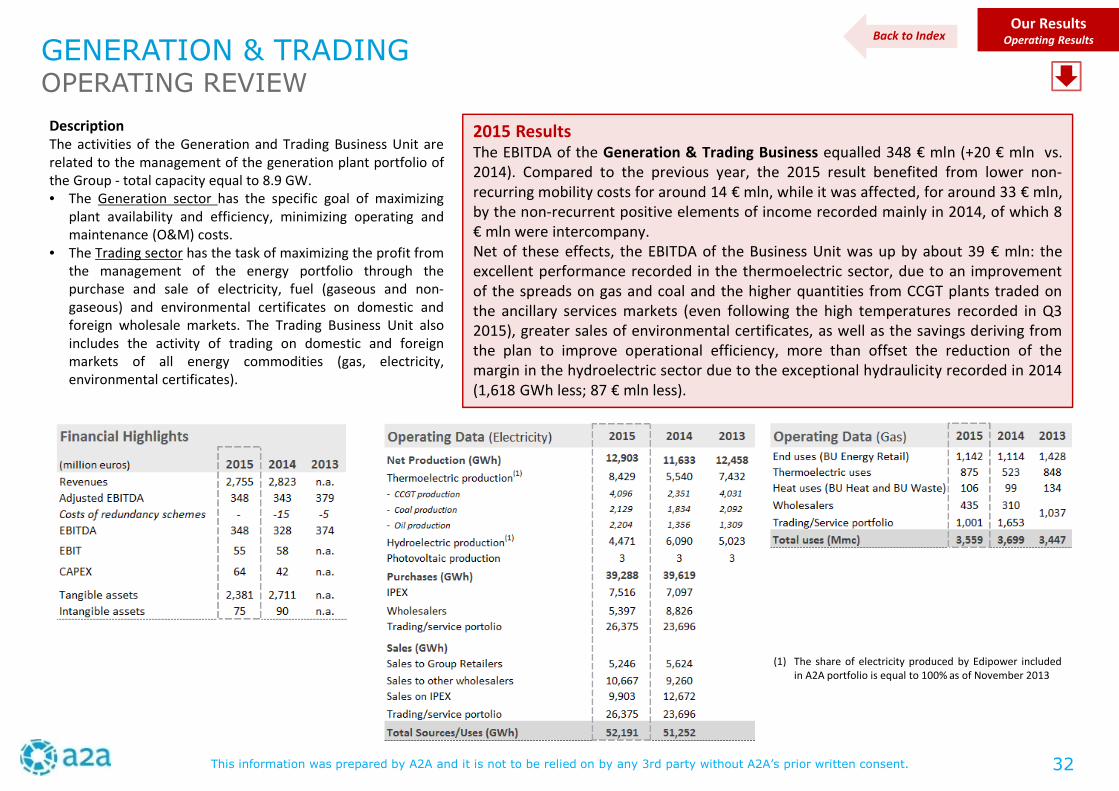
DescriptionThe activities of the Generation and Trading Business Unit arerelated to the management of the generation plant portfolio ofthe Group - total capacity equal to 8.9 GW.• The Generation sector has the specific goal of maximizing
plant availability and efficiency, minimizing operating andmaintenance (O&M) costs.
• The Trading sector has the task of maximizing the profit fromthe management of the energy portfolio through thepurchase and sale of electricity, fuel (gaseous and non-gaseous) and environmental certificates on domestic andforeign wholesale markets. The Trading Business Unit alsoincludes the activity of trading on domestic and foreignmarkets of all energy commodities (gas, electricity,environmental certificates).
2015 ResultsThe EBITDA of the Generation & Trading Business equalled 348 € mln (+20 € mln vs.2014). Compared to the previous year, the 2015 result benefited from lower non-recurring mobility costs for around 14 € mln, while it was affected, for around 33 € mln,by the non-recurrent positive elements of income recorded mainly in 2014, of which 8€ mln were intercompany.Net of these effects, the EBITDA of the Business Unit was up by about 39 € mln: theexcellent performance recorded in the thermoelectric sector, due to an improvementof the spreads on gas and coal and the higher quantities from CCGT plants traded onthe ancillary services markets (even following the high temperatures recorded in Q32015), greater sales of environmental certificates, as well as the savings deriving fromthe plan to improve operational efficiency, more than offset the reduction of themargin in the hydroelectric sector due to the exceptional hydraulicity recorded in 2014(1,618 GWh less; 87 € mln less).
(1) The share of electricity produced by Edipower includedin A2A portfolio is equal to 100% as of November 2013
GENERATION & TRADINGOPERATING REVIEW
Back to Index
32
This information was prepared by A2A and it is not to be relied on by any 3rd party without A2A’s prior written consent.
(1) A2A estimates on the basis of Terna data for CCGT capacity, on the basis of Unione Petrolifera data for coalcapacity
(2) The figures include biomass, biogas and bioliquids(3) Load factor of CCGT plants not subjected to dispatching constraints(4) Equal to the ratio between reserve and requirement. Percentage calculated by using higher reserve between
winter and summer periods(5) The yearly figures refer to the thermal year(6) Italian National Price of the electricity(7) CCGT Gas Cost based on: EniMix formula for 2008-2009 with 54.7% efficiency (2008 gas cost: 35.34 c€/mc; 2009
gas cost: 27.23 c€/mc), GasRelease2007 formula for 2010-2011 with 54.7% efficiency (2010 gas cost: 28.69 c€/mc;2011 gas cost: 32.06 c€/mc), gas at virtual trading point (PSV) for 2012-2014 with 51% efficiency (previously 53%).The figures include transport costs.
(8) Spark spread net of environmental costs (GC + CO2)(9) Dark spread net of environmental costs (GC + CO2). The environmental costs for a coal plant are equal to: -15.84
€/MWh (2010); -5.09 €/MWh (2011); 1.36 €/MWh (2012); 8.52 €/MWh (2013); 8.14 €/MWh (2014). Coal plantsefficiency is equal to 35%. The figures include logistics costs.
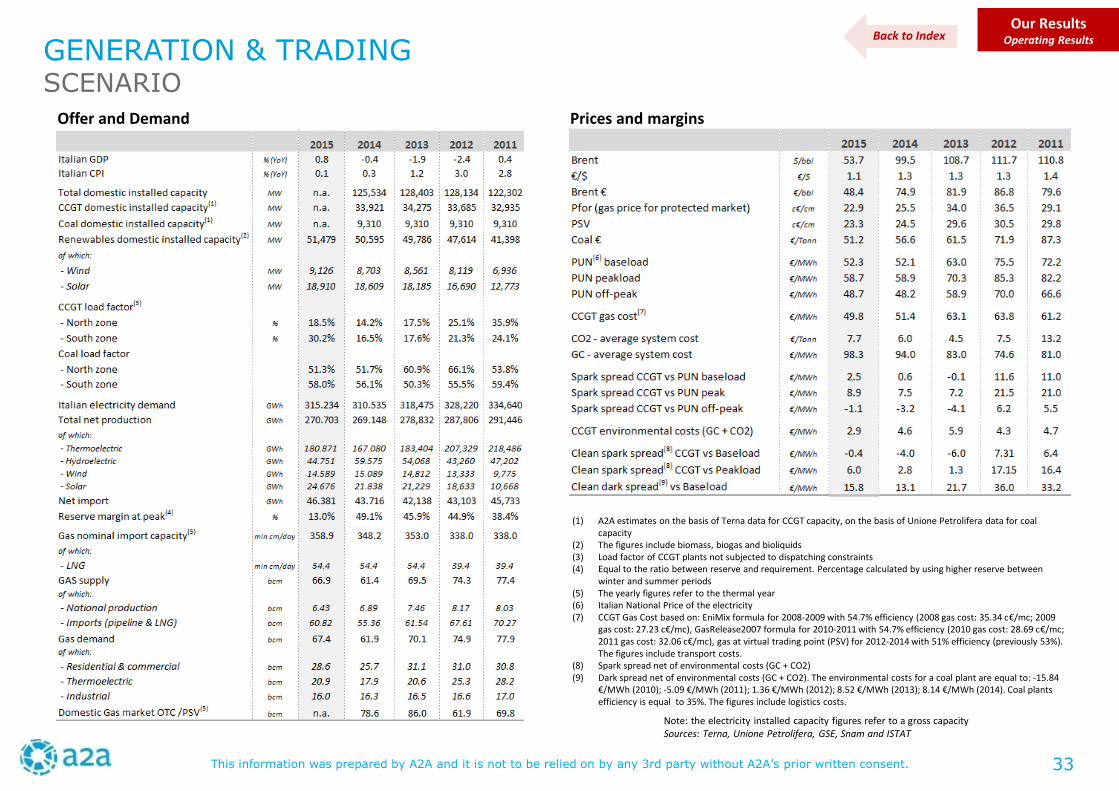
GENERATION & TRADINGSCENARIO
Our ResultsOperating Results
Prices and marginsOffer and Demand
Note: the electricity installed capacity figures refer to a gross capacitySources: Terna, Unione Petrolifera, GSE, Snam and ISTAT
Back to Index
33
This information was prepared by A2A and it is not to be relied on by any 3rd party without A2A’s prior written consent.
Our ResultsOperating Results
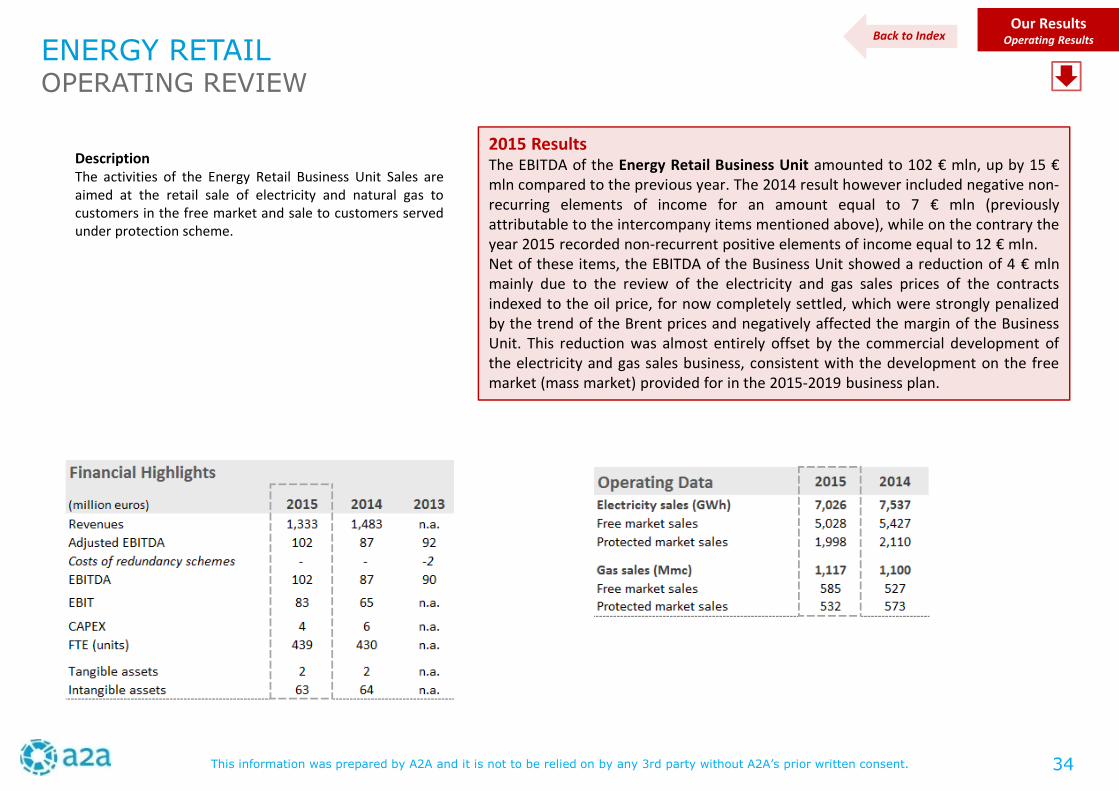
DescriptionThe activities of the Energy Retail Business Unit Sales areaimed at the retail sale of electricity and natural gas tocustomers in the free market and sale to customers servedunder protection scheme.
2015 ResultsThe EBITDA of the Energy Retail Business Unit amounted to 102 € mln, up by 15 €mln compared to the previous year. The 2014 result however included negative non-recurring elements of income for an amount equal to 7 € mln (previouslyattributable to the intercompany items mentioned above), while on the contrary theyear 2015 recorded non-recurrent positive elements of income equal to 12 € mln.Net of these items, the EBITDA of the Business Unit showed a reduction of 4 € mlnmainly due to the review of the electricity and gas sales prices of the contractsindexed to the oil price, for now completely settled, which were strongly penalizedby the trend of the Brent prices and negatively affected the margin of the BusinessUnit. This reduction was almost entirely offset by the commercial development ofthe electricity and gas sales business, consistent with the development on the freemarket (mass market) provided for in the 2015-2019 business plan.
ENERGY RETAILOPERATING REVIEW
Back to Index
34
This information was prepared by A2A and it is not to be relied on by any 3rd party without A2A’s prior written consent.
Our ResultsOperating Results
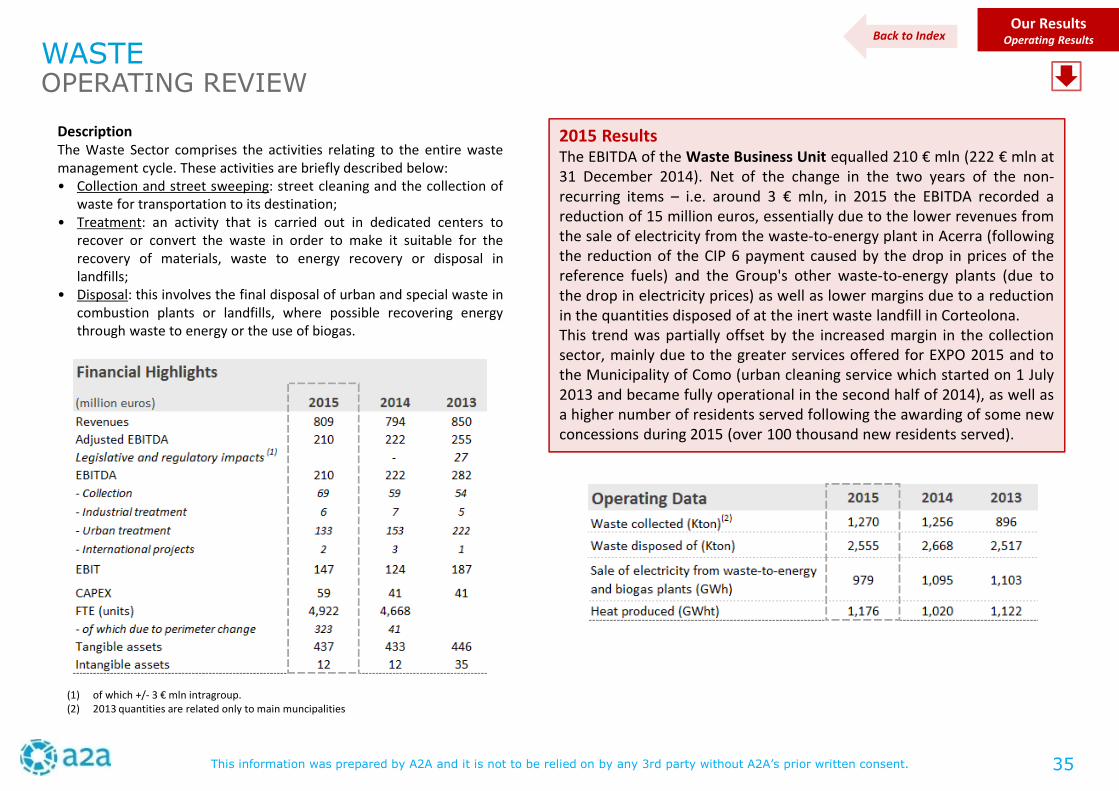
DescriptionThe Waste Sector comprises the activities relating to the entire wastemanagement cycle. These activities are briefly described below:• Collection and street sweeping: street cleaning and the collection of
waste for transportation to its destination;• Treatment: an activity that is carried out in dedicated centers to
recover or convert the waste in order to make it suitable for therecovery of materials, waste to energy recovery or disposal inlandfills;
• Disposal: this involves the final disposal of urban and special waste incombustion plants or landfills, where possible recovering energythrough waste to energy or the use of biogas.
2015 ResultsThe EBITDA of the Waste Business Unit equalled 210 € mln (222 € mln at31 December 2014). Net of the change in the two years of the non-recurring items – i.e. around 3 € mln, in 2015 the EBITDA recorded areduction of 15 million euros, essentially due to the lower revenues fromthe sale of electricity from the waste-to-energy plant in Acerra (followingthe reduction of the CIP 6 payment caused by the drop in prices of thereference fuels) and the Group's other waste-to-energy plants (due tothe drop in electricity prices) as well as lower margins due to a reductionin the quantities disposed of at the inert waste landfill in Corteolona.This trend was partially offset by the increased margin in the collectionsector, mainly due to the greater services offered for EXPO 2015 and tothe Municipality of Como (urban cleaning service which started on 1 July2013 and became fully operational in the second half of 2014), as well asa higher number of residents served following the awarding of some newconcessions during 2015 (over 100 thousand new residents served).
(1) of which +/- 3 € mln intragroup.(2) 2013 quantities are related only to main muncipalities
WASTEOPERATING REVIEW
Back to Index
35
This information was prepared by A2A and it is not to be relied on by any 3rd party without A2A’s prior written consent.
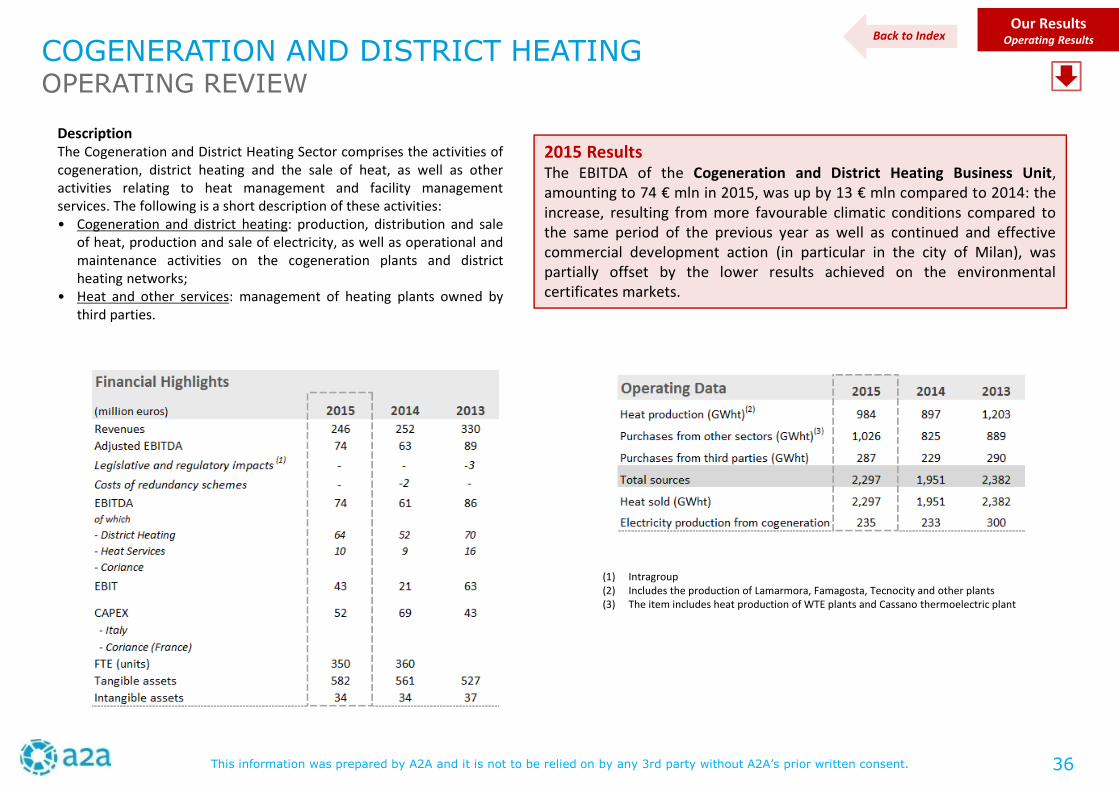
Our ResultsOperating Results
DescriptionThe Cogeneration and District Heating Sector comprises the activities ofcogeneration, district heating and the sale of heat, as well as otheractivities relating to heat management and facility managementservices. The following is a short description of these activities:• Cogeneration and district heating: production, distribution and sale
of heat, production and sale of electricity, as well as operational andmaintenance activities on the cogeneration plants and districtheating networks;
• Heat and other services: management of heating plants owned bythird parties.
2015 ResultsThe EBITDA of the Cogeneration and District Heating Business Unit,amounting to 74 € mln in 2015, was up by 13 € mln compared to 2014: theincrease, resulting from more favourable climatic conditions compared tothe same period of the previous year as well as continued and effectivecommercial development action (in particular in the city of Milan), waspartially offset by the lower results achieved on the environmentalcertificates markets.
(1) Intragroup(2) Includes the production of Lamarmora, Famagosta, Tecnocity and other plants(3) The item includes heat production of WTE plants and Cassano thermoelectric plant
COGENERATION AND DISTRICT HEATINGOPERATING REVIEW
Back to Index
36
This information was prepared by A2A and it is not to be relied on by any 3rd party without A2A’s prior written consent.
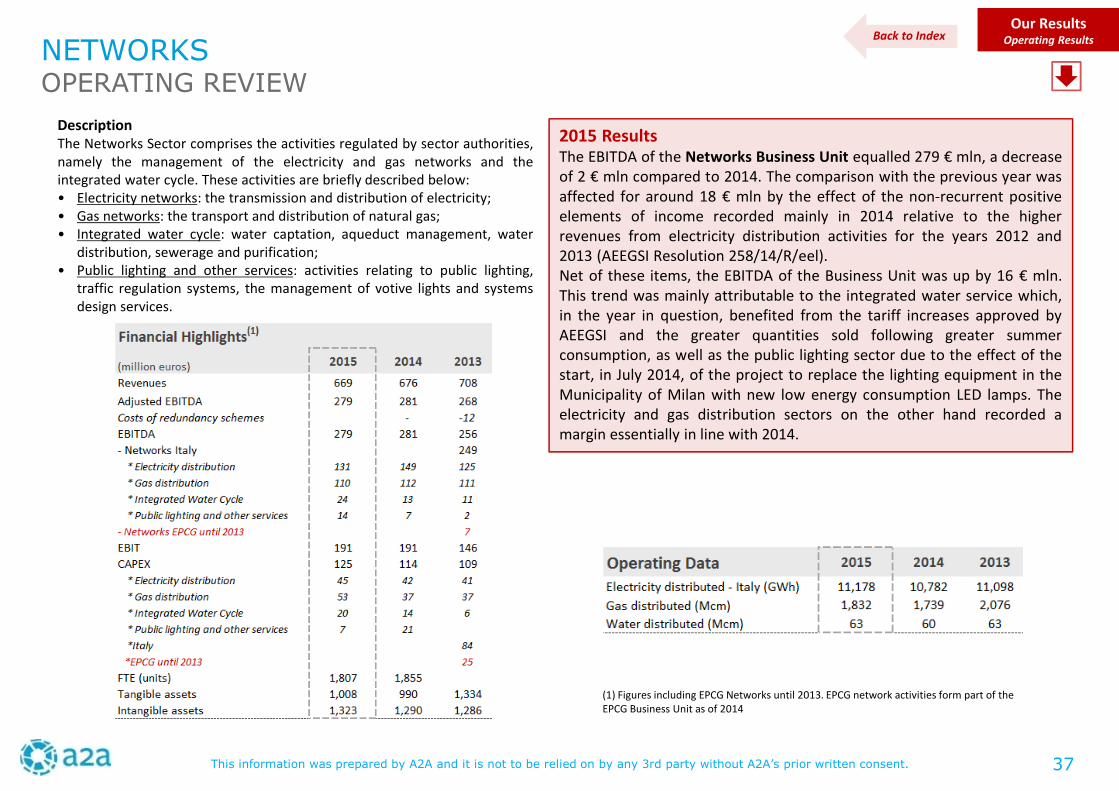
DescriptionThe Networks Sector comprises the activities regulated by sector authorities,namely the management of the electricity and gas networks and theintegrated water cycle. These activities are briefly described below:• Electricity networks: the transmission and distribution of electricity;• Gas networks: the transport and distribution of natural gas;• Integrated water cycle: water captation, aqueduct management, water
distribution, sewerage and purification;• Public lighting and other services: activities relating to public lighting,
traffic regulation systems, the management of votive lights and systemsdesign services.
2015 ResultsThe EBITDA of the Networks Business Unit equalled 279 € mln, a decreaseof 2 € mln compared to 2014. The comparison with the previous year wasaffected for around 18 € mln by the effect of the non-recurrent positiveelements of income recorded mainly in 2014 relative to the higherrevenues from electricity distribution activities for the years 2012 and2013 (AEEGSI Resolution 258/14/R/eel).Net of these items, the EBITDA of the Business Unit was up by 16 € mln.This trend was mainly attributable to the integrated water service which,in the year in question, benefited from the tariff increases approved byAEEGSI and the greater quantities sold following greater summerconsumption, as well as the public lighting sector due to the effect of thestart, in July 2014, of the project to replace the lighting equipment in theMunicipality of Milan with new low energy consumption LED lamps. Theelectricity and gas distribution sectors on the other hand recorded amargin essentially in line with 2014.
Our ResultsOperating Results
NETWORKSOPERATING REVIEW
Back to Index
(1) Figures including EPCG Networks until 2013. EPCG network activities form part of theEPCG Business Unit as of 2014
37
This information was prepared by A2A and it is not to be relied on by any 3rd party without A2A’s prior written consent.
Our ResultsOperating Results
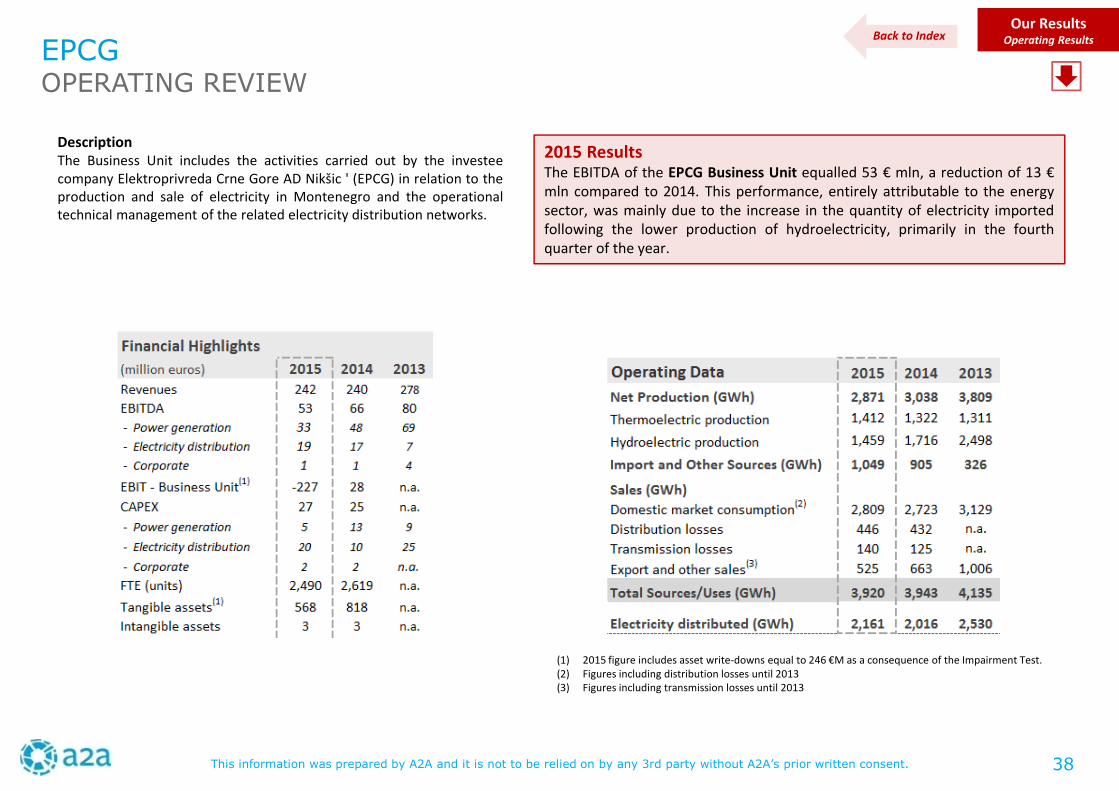
DescriptionThe Business Unit includes the activities carried out by the investeecompany Elektroprivreda Crne Gore AD Nikšic ' (EPCG) in relation to theproduction and sale of electricity in Montenegro and the operationaltechnical management of the related electricity distribution networks.
2015 ResultsThe EBITDA of the EPCG Business Unit equalled 53 € mln, a reduction of 13 €mln compared to 2014. This performance, entirely attributable to the energysector, was mainly due to the increase in the quantity of electricity importedfollowing the lower production of hydroelectricity, primarily in the fourthquarter of the year.
EPCGOPERATING REVIEW
Back to Index
(1) 2015 figure includes asset write-downs equal to 246 €M as a consequence of the Impairment Test.(2) Figures including distribution losses until 2013(3) Figures including transmission losses until 2013
38
This information was prepared by A2A and it is not to be relied on by any 3rd party without A2A’s prior written consent.
Our ResultsOperating Results
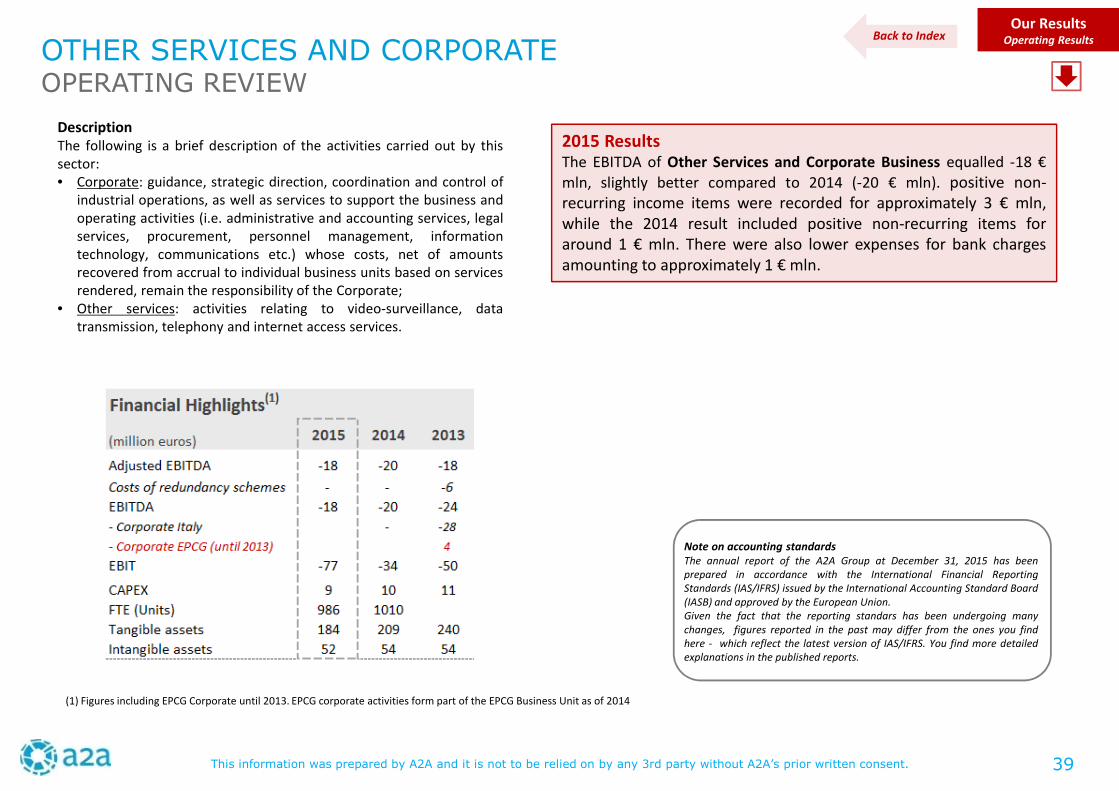
DescriptionThe following is a brief description of the activities carried out by thissector:• Corporate: guidance, strategic direction, coordination and control of
industrial operations, as well as services to support the business andoperating activities (i.e. administrative and accounting services, legalservices, procurement, personnel management, informationtechnology, communications etc.) whose costs, net of amountsrecovered from accrual to individual business units based on servicesrendered, remain the responsibility of the Corporate;
• Other services: activities relating to video-surveillance, datatransmission, telephony and internet access services.
2015 ResultsThe EBITDA of Other Services and Corporate Business equalled -18 €
mln, slightly better compared to 2014 (-20 € mln). positive non-recurring income items were recorded for approximately 3 € mln,while the 2014 result included positive non-recurring items foraround 1 € mln. There were also lower expenses for bank chargesamounting to approximately 1 € mln.
OTHER SERVICES AND CORPORATEOPERATING REVIEW
Note on accounting standardsThe annual report of the A2A Group at December 31, 2015 has beenprepared in accordance with the International Financial ReportingStandards (IAS/IFRS) issued by the International Accounting Standard Board(IASB) and approved by the European Union.Given the fact that the reporting standars has been undergoing manychanges, figures reported in the past may differ from the ones you findhere - which reflect the latest version of IAS/IFRS. You find more detailedexplanations in the published reports.
Back to Index
(1) Figures including EPCG Corporate until 2013. EPCG corporate activities form part of the EPCG Business Unit as of 2014
39
This information was prepared by A2A and it is not to be relied on by any 3rd party without A2A’s prior written consent.
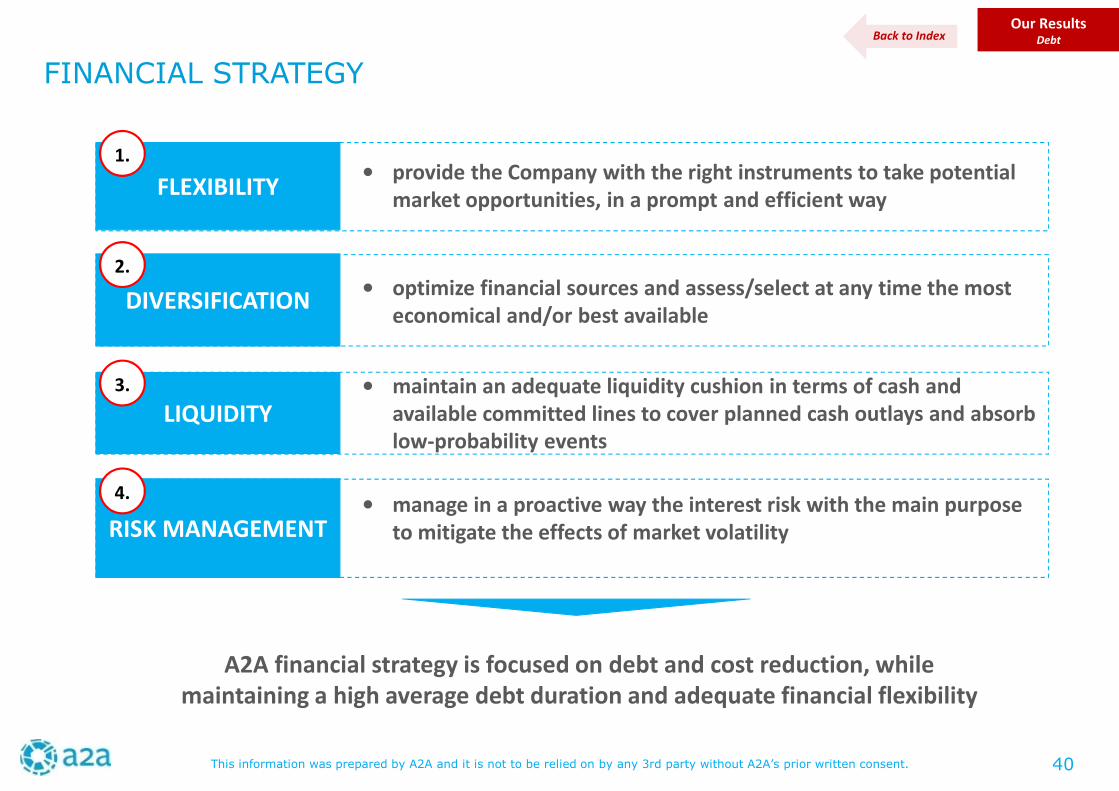
FINANCIAL STRATEGY
Our ResultsDebt
FLEXIBILITY• provide the Company with the right instruments to take potential
market opportunities, in a prompt and efficient way
DIVERSIFICATION• optimize financial sources and assess/select at any time the most
economical and/or best available
LIQUIDITY• maintain an adequate liquidity cushion in terms of cash and
available committed lines to cover planned cash outlays and absorblow-probability events
RISK MANAGEMENT• manage in a proactive way the interest risk with the main purpose
to mitigate the effects of market volatility
1.
2.
3.
4.
A2A financial strategy is focused on debt and cost reduction, whilemaintaining a high average debt duration and adequate financial flexibility
Back to Index
40
This information was prepared by A2A and it is not to be relied on by any 3rd party without A2A’s prior written consent.
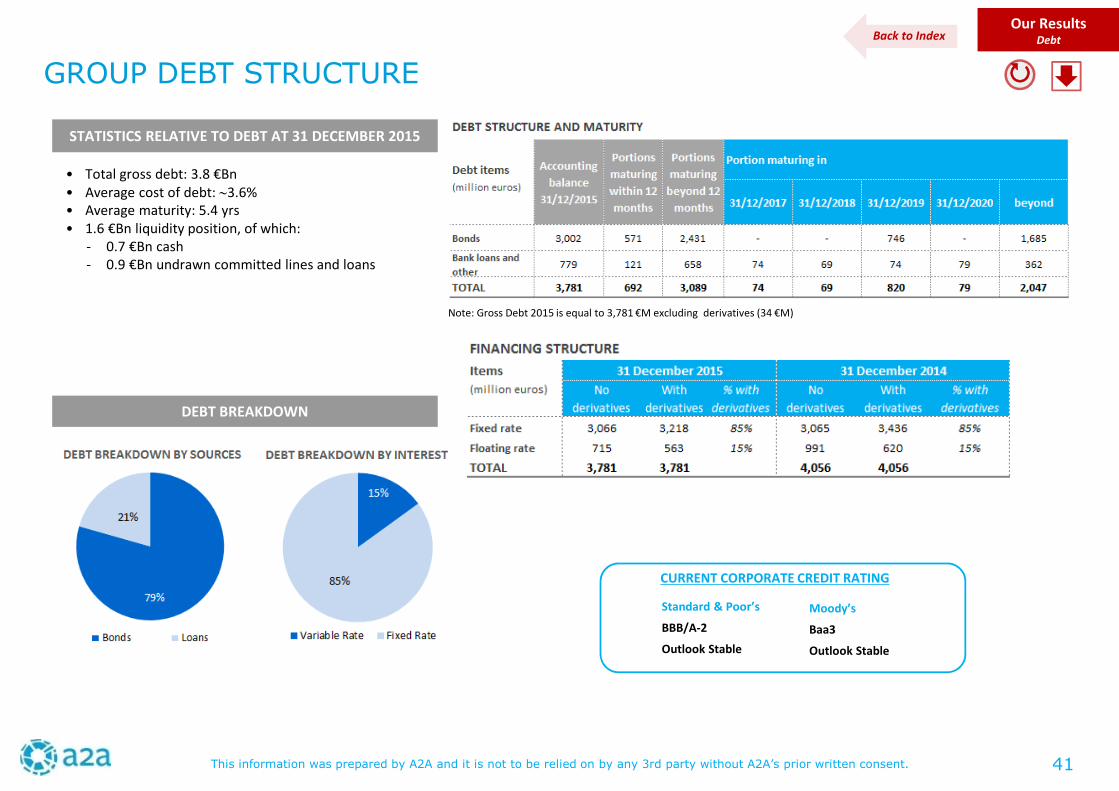
GROUP DEBT STRUCTURE
• Total gross debt: 3.8 €Bn• Average cost of debt: ∼3.6%• Average maturity: 5.4 yrs• 1.6 €Bn liquidity position, of which:
- 0.7 €Bn cash- 0.9 €Bn undrawn committed lines and loans
STATISTICS RELATIVE TO DEBT AT 31 DECEMBER 2015
Our ResultsDebt
DEBT BREAKDOWN
Back to Index
Note: Gross Debt 2015 is equal to 3,781 €M excluding derivatives (34 €M)
CURRENT CORPORATE CREDIT RATING
Standard & Poor’s
BBB/A-2
Outlook Stable
Moody’s
Baa3
Outlook Stable
41
This information was prepared by A2A and it is not to be relied on by any 3rd party without A2A’s prior written consent.
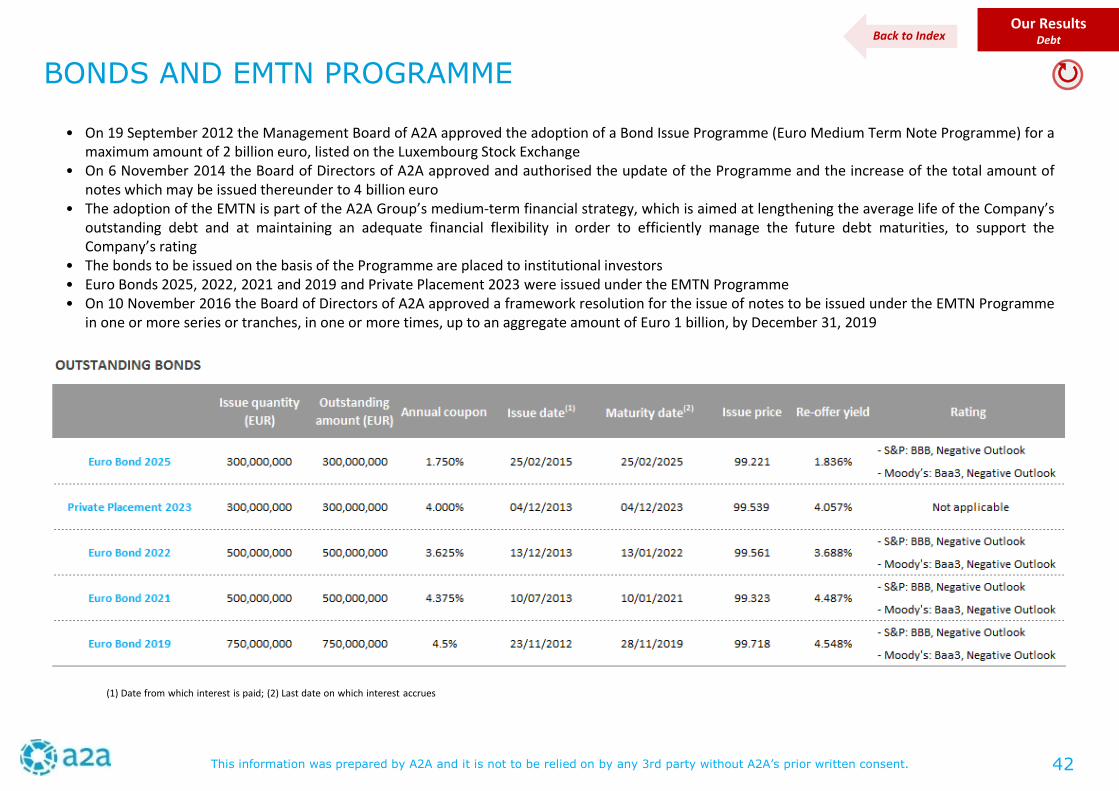
BONDS AND EMTN PROGRAMME
(1) Date from which interest is paid; (2) Last date on which interest accrues
Our ResultsDebt
• On 19 September 2012 the Management Board of A2A approved the adoption of a Bond Issue Programme (Euro Medium Term Note Programme) for amaximum amount of 2 billion euro, listed on the Luxembourg Stock Exchange
• On 6 November 2014 the Board of Directors of A2A approved and authorised the update of the Programme and the increase of the total amount ofnotes which may be issued thereunder to 4 billion euro
• The adoption of the EMTN is part of the A2A Group’s medium-term financial strategy, which is aimed at lengthening the average life of the Company’soutstanding debt and at maintaining an adequate financial flexibility in order to efficiently manage the future debt maturities, to support theCompany’s rating
• The bonds to be issued on the basis of the Programme are placed to institutional investors• Euro Bonds 2025, 2022, 2021 and 2019 and Private Placement 2023 were issued under the EMTN Programme• On 10 November 2016 the Board of Directors of A2A approved a framework resolution for the issue of notes to be issued under the EMTN Programme
in one or more series or tranches, in one or more times, up to an aggregate amount of Euro 1 billion, by December 31, 2019
Back to Index
42
This information was prepared by A2A and it is not to be relied on by any 3rd party without A2A’s prior written consent.
A2A GROUP RISK MANAGEMENT
Our ResultsRisk Management
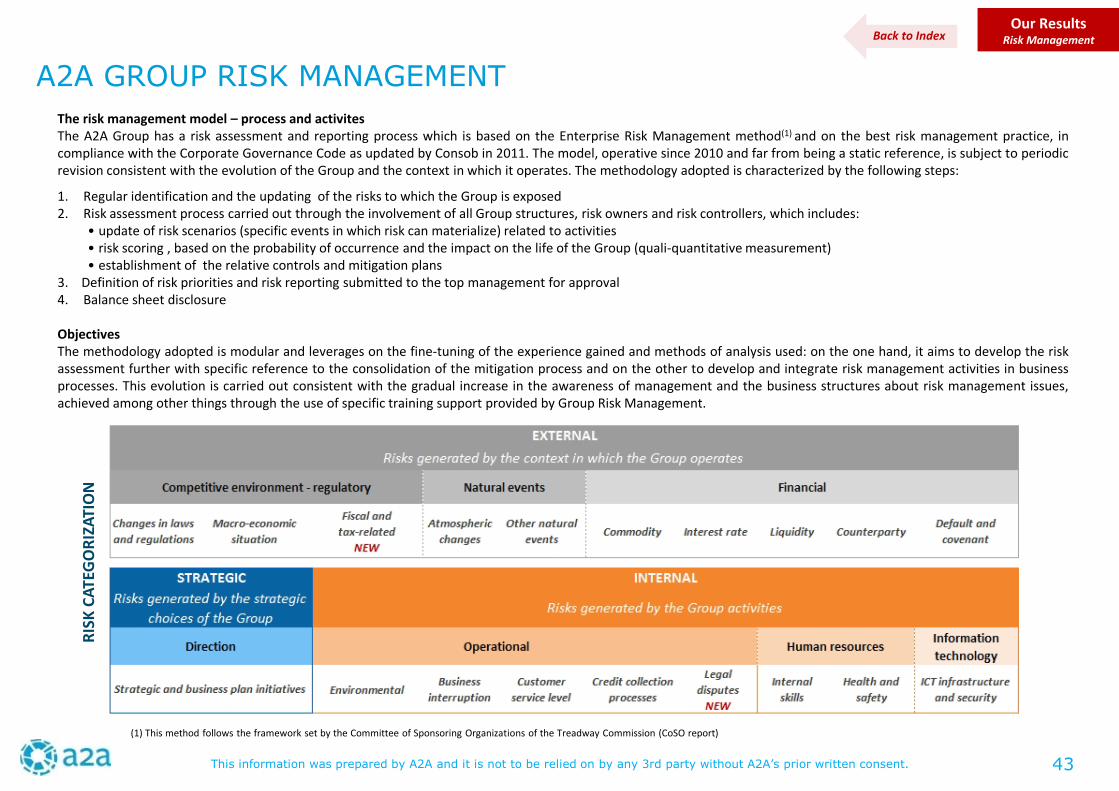
The risk management model – process and activitesThe A2A Group has a risk assessment and reporting process which is based on the Enterprise Risk Management method(1) and on the best risk management practice, incompliance with the Corporate Governance Code as updated by Consob in 2011. The model, operative since 2010 and far from being a static reference, is subject to periodicrevision consistent with the evolution of the Group and the context in which it operates. The methodology adopted is characterized by the following steps:
1. Regular identification and the updating of the risks to which the Group is exposed2. Risk assessment process carried out through the involvement of all Group structures, risk owners and risk controllers, which includes:
• update of risk scenarios (specific events in which risk can materialize) related to activities• risk scoring , based on the probability of occurrence and the impact on the life of the Group (quali-quantitative measurement)• establishment of the relative controls and mitigation plans
3. Definition of risk priorities and risk reporting submitted to the top management for approval4. Balance sheet disclosure
ObjectivesThe methodology adopted is modular and leverages on the fine-tuning of the experience gained and methods of analysis used: on the one hand, it aims to develop the riskassessment further with specific reference to the consolidation of the mitigation process and on the other to develop and integrate risk management activities in businessprocesses. This evolution is carried out consistent with the gradual increase in the awareness of management and the business structures about risk management issues,achieved among other things through the use of specific training support provided by Group Risk Management.
(1) This method follows the framework set by the Committee of Sponsoring Organizations of the Treadway Commission (CoSO report)
Back to Index
RIS
KC
ATE
GO
RIZ
ATI
ON
43
This information was prepared by A2A and it is not to be relied on by any 3rd party without A2A’s prior written consent.
INDEX
Our Results Our ResponsibilitiesOur World
More in-depth, updates and documents available in the following website sections• Sustainability: http://www.a2a.eu/en/sustainability/• Corporate Governance: http://www.a2a.eu/en/governance/• Investors: http://www.a2a.eu/en/investor/shares/
http://www.a2a.eu/en/investor/calendar/
@
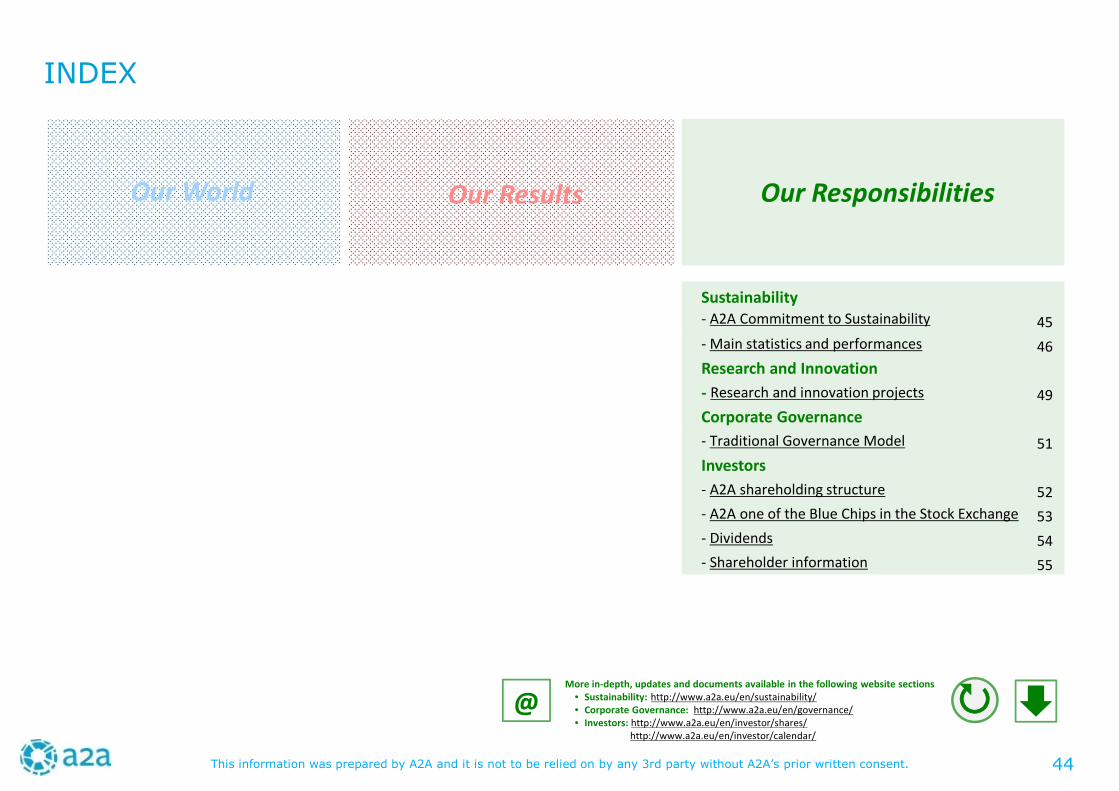
Sustainability- A2A Commitment to Sustainability 45
- Main statistics and performances 46
Research and Innovation
- Research and innovation projects 49
Corporate Governance
- Traditional Governance Model 51
Investors
- A2A shareholding structure 52
- A2A one of the Blue Chips in the Stock Exchange 53
- Dividends 54
- Shareholder information 55
44
This information was prepared by A2A and it is not to be relied on by any 3rd party without A2A’s prior written consent.
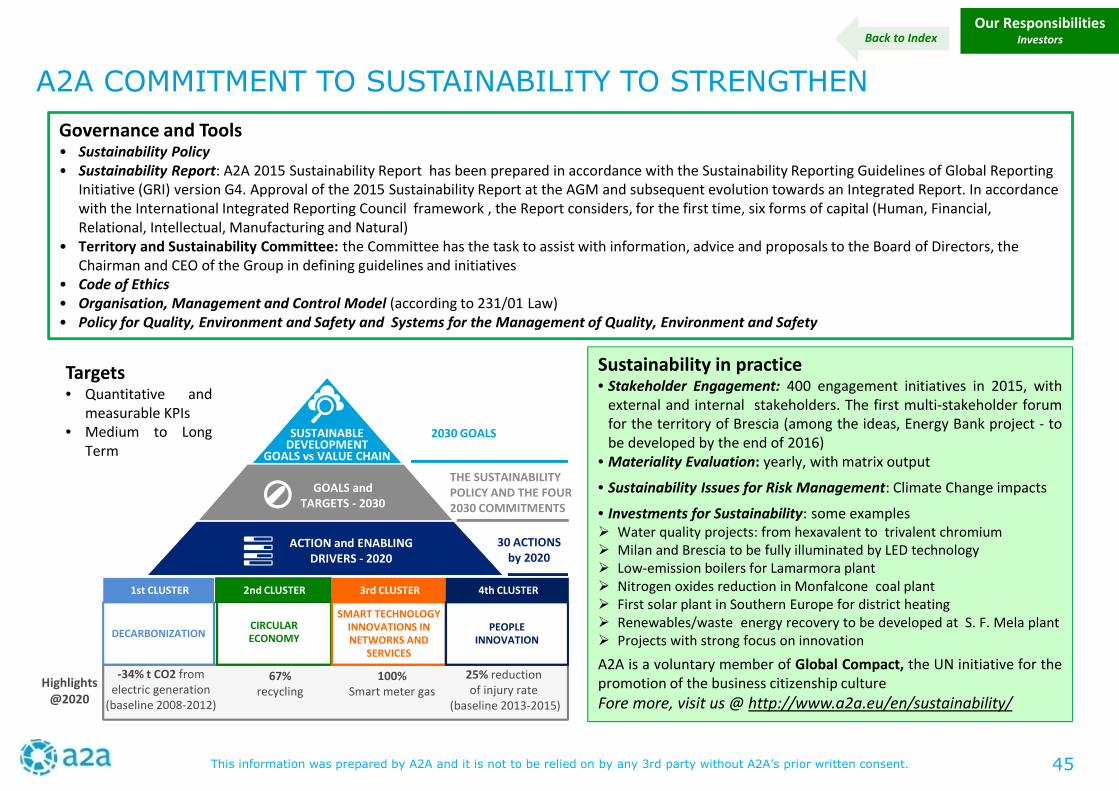
A2A COMMITMENT TO SUSTAINABILITY TO STRENGTHEN
Our ResponsibilitiesInvestors
30 ACTIONSby 2020
Piano Industriale 2015-2019
SUSTAINABLEDEVELOPMENT
GOALS vs VALUE CHAIN
GOALS andTARGETS - 2030
ACTION and ENABLINGDRIVERS - 2020
2030 GOALS
THE SUSTAINABILITYPOLICY AND THE FOUR2030 COMMITMENTS
DECARBONIZATION
1st CLUSTER
CIRCULARECONOMY
2nd CLUSTER
SMART TECHNOLOGYINNOVATIONS INNETWORKS AND
SERVICES
3rd CLUSTER
PEOPLEINNOVATION
4th CLUSTER
67%recycling
100%Smart meter gas
25% reductionof injury rate
(baseline 2013-2015)
-34% t CO2 fromelectric generation
(baseline 2008-2012)
Targets• Quantitative and
measurable KPIs• Medium to Long
Term
Governance and Tools• Sustainability Policy• Sustainability Report: A2A 2015 Sustainability Report has been prepared in accordance with the Sustainability Reporting Guidelines of Global Reporting
Initiative (GRI) version G4. Approval of the 2015 Sustainability Report at the AGM and subsequent evolution towards an Integrated Report. In accordancewith the International Integrated Reporting Council framework , the Report considers, for the first time, six forms of capital (Human, Financial,Relational, Intellectual, Manufacturing and Natural)
• Territory and Sustainability Committee: the Committee has the task to assist with information, advice and proposals to the Board of Directors, theChairman and CEO of the Group in defining guidelines and initiatives
• Code of Ethics• Organisation, Management and Control Model (according to 231/01 Law)• Policy for Quality, Environment and Safety and Systems for the Management of Quality, Environment and Safety
Highlights@2020
Sustainability in practice• Stakeholder Engagement: 400 engagement initiatives in 2015, with
external and internal stakeholders. The first multi-stakeholder forumfor the territory of Brescia (among the ideas, Energy Bank project - tobe developed by the end of 2016)
• Materiality Evaluation: yearly, with matrix output
• Sustainability Issues for Risk Management: Climate Change impacts
• Investments for Sustainability: some examples Water quality projects: from hexavalent to trivalent chromium Milan and Brescia to be fully illuminated by LED technology Low-emission boilers for Lamarmora plant Nitrogen oxides reduction in Monfalcone coal plant First solar plant in Southern Europe for district heating Renewables/waste energy recovery to be developed at S. F. Mela plant Projects with strong focus on innovation
A2A is a voluntary member of Global Compact, the UN initiative for thepromotion of the business citizenship culture
Fore more, visit us @ http://www.a2a.eu/en/sustainability/
Back to Index
45
This information was prepared by A2A and it is not to be relied on by any 3rd party without A2A’s prior written consent.
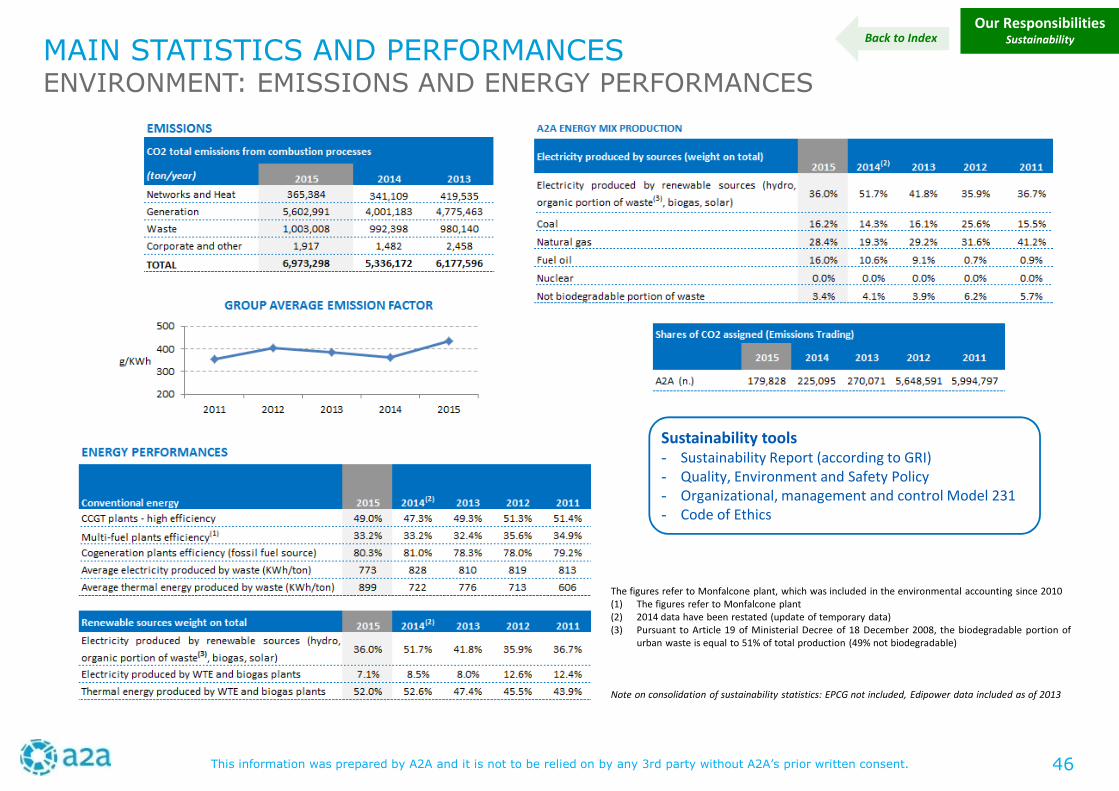
The figures refer to Monfalcone plant, which was included in the environmental accounting since 2010(1) The figures refer to Monfalcone plant(2) 2014 data have been restated (update of temporary data)(3) Pursuant to Article 19 of Ministerial Decree of 18 December 2008, the biodegradable portion of
urban waste is equal to 51% of total production (49% not biodegradable)
Note on consolidation of sustainability statistics: EPCG not included, Edipower data included as of 2013
MAIN STATISTICS AND PERFORMANCESENVIRONMENT: EMISSIONS AND ENERGY PERFORMANCES
Our ResponsibilitiesSustainability
Sustainability tools- Sustainability Report (according to GRI)- Quality, Environment and Safety Policy- Organizational, management and control Model 231- Code of Ethics
Back to Index
46
This information was prepared by A2A and it is not to be relied on by any 3rd party without A2A’s prior written consent.
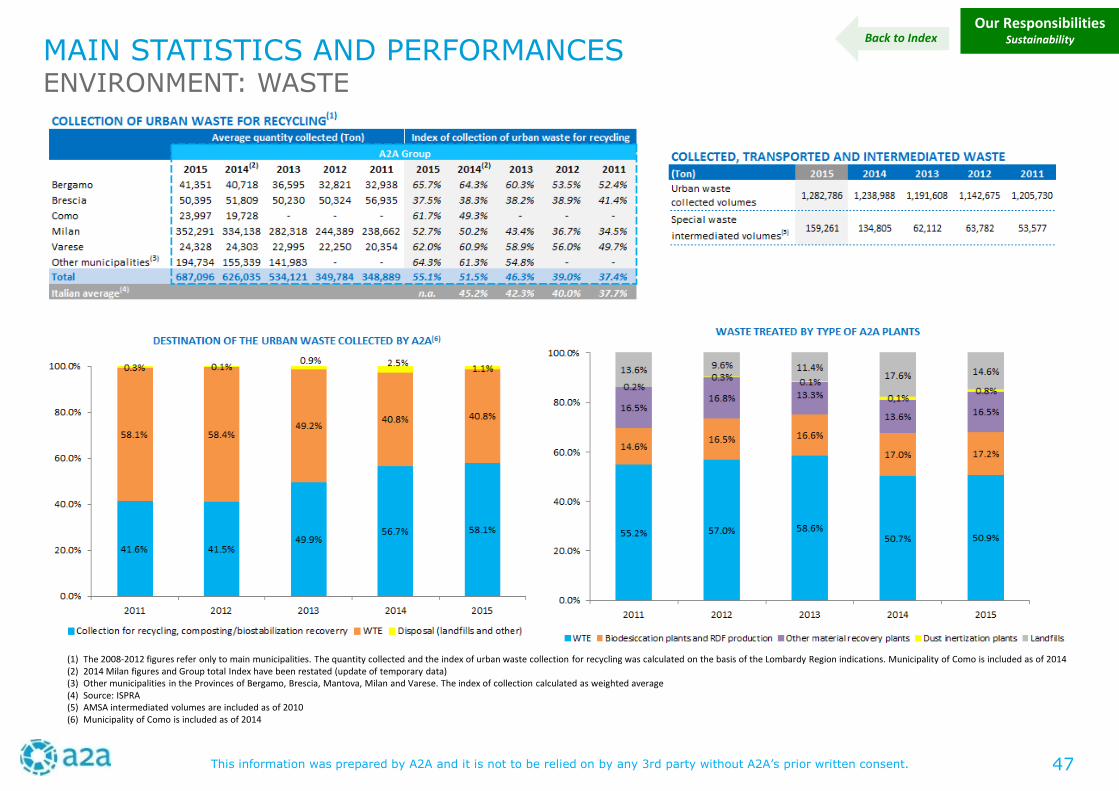
MAIN STATISTICS AND PERFORMANCESENVIRONMENT: WASTE
Our ResponsibilitiesSustainability
(1) The 2008-2012 figures refer only to main municipalities. The quantity collected and the index of urban waste collection for recycling was calculated on the basis of the Lombardy Region indications. Municipality of Como is included as of 2014(2) 2014 Milan figures and Group total Index have been restated (update of temporary data)(3) Other municipalities in the Provinces of Bergamo, Brescia, Mantova, Milan and Varese. The index of collection calculated as weighted average(4) Source: ISPRA(5) AMSA intermediated volumes are included as of 2010(6) Municipality of Como is included as of 2014
Back to Index
47
This information was prepared by A2A and it is not to be relied on by any 3rd party without A2A’s prior written consent.
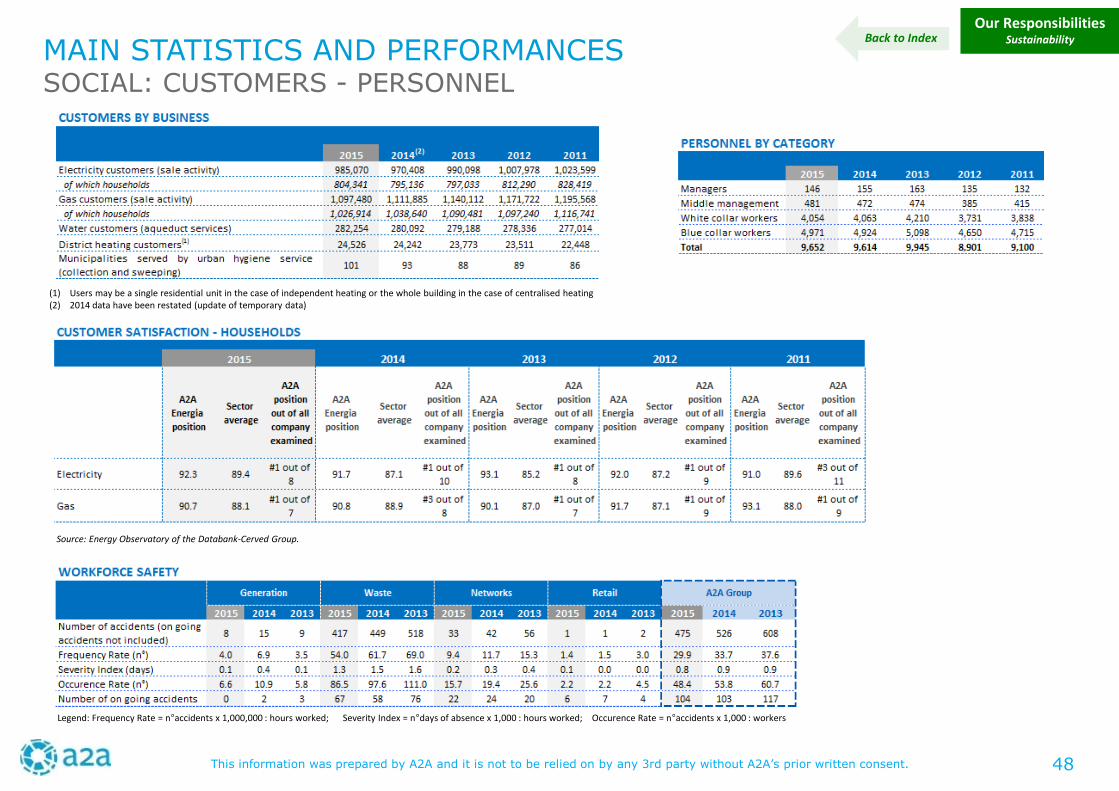
(1) Users may be a single residential unit in the case of independent heating or the whole building in the case of centralised heating(2) 2014 data have been restated (update of temporary data)
Legend: Frequency Rate = n°accidents x 1,000,000 : hours worked; Severity Index = n°days of absence x 1,000 : hours worked; Occurence Rate = n°accidents x 1,000 : workers
Source: Energy Observatory of the Databank-Cerved Group.
MAIN STATISTICS AND PERFORMANCESSOCIAL: CUSTOMERS - PERSONNEL
Our ResponsibilitiesSustainabilityBack to Index
48
This information was prepared by A2A and it is not to be relied on by any 3rd party without A2A’s prior written consent.
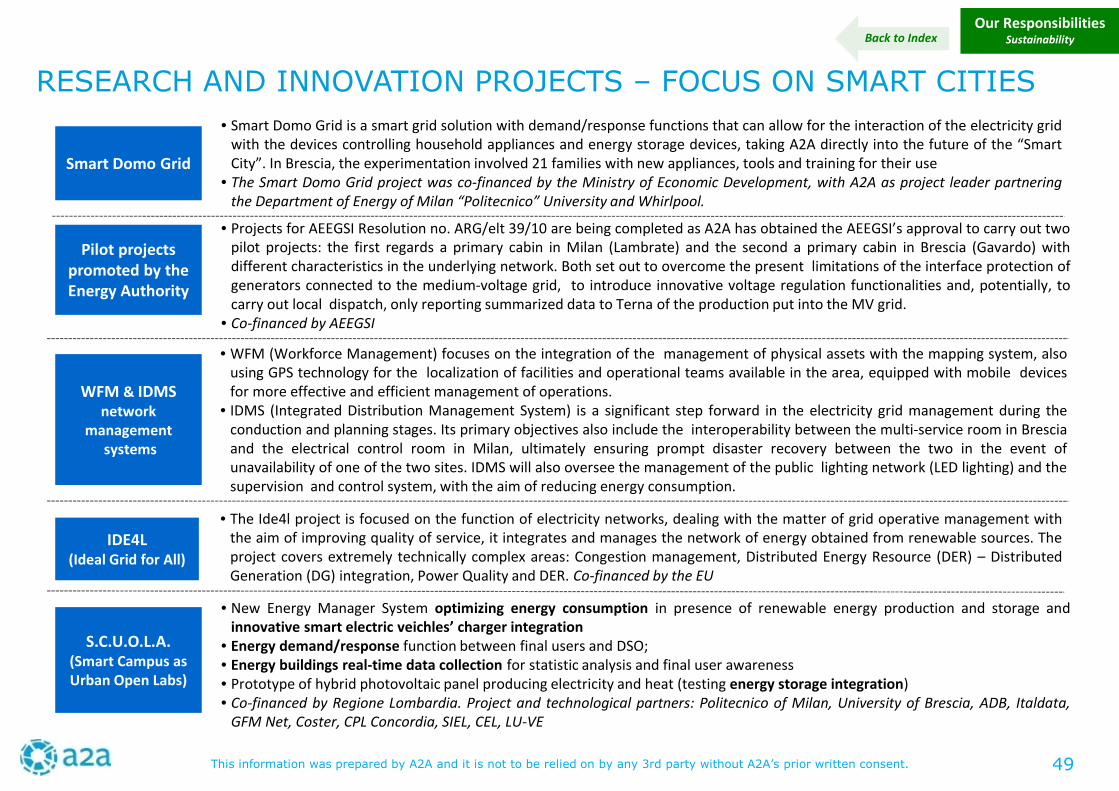
RESEARCH AND INNOVATION PROJECTS – FOCUS ON SMART CITIES
Our ResponsibilitiesSustainability
Smart Domo Grid
• Smart Domo Grid is a smart grid solution with demand/response functions that can allow for the interaction of the electricity gridwith the devices controlling household appliances and energy storage devices, taking A2A directly into the future of the “SmartCity”. In Brescia, the experimentation involved 21 families with new appliances, tools and training for their use
• The Smart Domo Grid project was co-financed by the Ministry of Economic Development, with A2A as project leader partneringthe Department of Energy of Milan “Politecnico” University and Whirlpool.
IDE4L(Ideal Grid for All)
• The Ide4l project is focused on the function of electricity networks, dealing with the matter of grid operative management withthe aim of improving quality of service, it integrates and manages the network of energy obtained from renewable sources. Theproject covers extremely technically complex areas: Congestion management, Distributed Energy Resource (DER) – DistributedGeneration (DG) integration, Power Quality and DER. Co-financed by the EU
• Projects for AEEGSI Resolution no. ARG/elt 39/10 are being completed as A2A has obtained the AEEGSI’s approval to carry out twopilot projects: the first regards a primary cabin in Milan (Lambrate) and the second a primary cabin in Brescia (Gavardo) withdifferent characteristics in the underlying network. Both set out to overcome the present limitations of the interface protection ofgenerators connected to the medium-voltage grid, to introduce innovative voltage regulation functionalities and, potentially, tocarry out local dispatch, only reporting summarized data to Terna of the production put into the MV grid.
• Co-financed by AEEGSI
Pilot projectspromoted by theEnergy Authority
• WFM (Workforce Management) focuses on the integration of the management of physical assets with the mapping system, alsousing GPS technology for the localization of facilities and operational teams available in the area, equipped with mobile devicesfor more effective and efficient management of operations.
• IDMS (Integrated Distribution Management System) is a significant step forward in the electricity grid management during theconduction and planning stages. Its primary objectives also include the interoperability between the multi-service room in Bresciaand the electrical control room in Milan, ultimately ensuring prompt disaster recovery between the two in the event ofunavailability of one of the two sites. IDMS will also oversee the management of the public lighting network (LED lighting) and thesupervision and control system, with the aim of reducing energy consumption.
WFM & IDMSnetwork
managementsystems
S.C.U.O.L.A.(Smart Campus asUrban Open Labs)
• New Energy Manager System optimizing energy consumption in presence of renewable energy production and storage andinnovative smart electric veichles’ charger integration
• Energy demand/response function between final users and DSO;• Energy buildings real-time data collection for statistic analysis and final user awareness• Prototype of hybrid photovoltaic panel producing electricity and heat (testing energy storage integration)• Co-financed by Regione Lombardia. Project and technological partners: Politecnico of Milan, University of Brescia, ADB, Italdata,
GFM Net, Coster, CPL Concordia, SIEL, CEL, LU-VE
Back to Index
49
This information was prepared by A2A and it is not to be relied on by any 3rd party without A2A’s prior written consent.
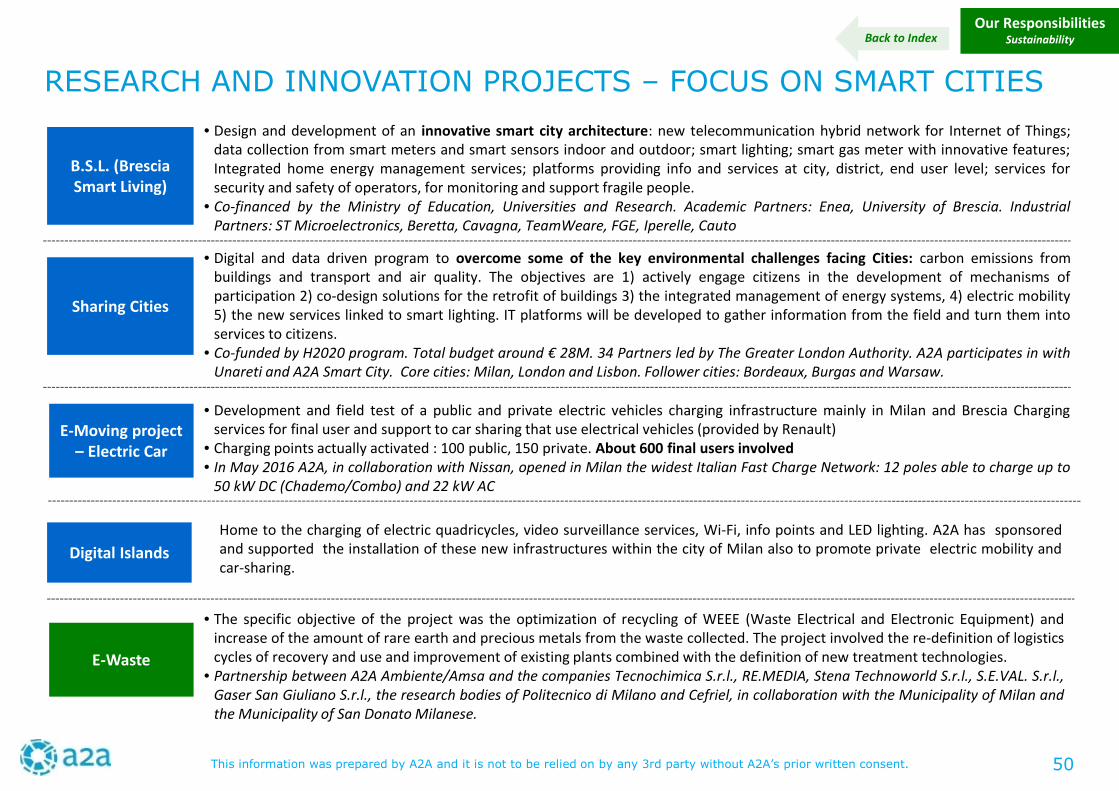
Our ResponsibilitiesSustainability
B.S.L. (BresciaSmart Living)
• Design and development of an innovative smart city architecture: new telecommunication hybrid network for Internet of Things;data collection from smart meters and smart sensors indoor and outdoor; smart lighting; smart gas meter with innovative features;Integrated home energy management services; platforms providing info and services at city, district, end user level; services forsecurity and safety of operators, for monitoring and support fragile people.
• Co-financed by the Ministry of Education, Universities and Research. Academic Partners: Enea, University of Brescia. IndustrialPartners: ST Microelectronics, Beretta, Cavagna, TeamWeare, FGE, Iperelle, Cauto
E-Moving project– Electric Car
• Development and field test of a public and private electric vehicles charging infrastructure mainly in Milan and Brescia Chargingservices for final user and support to car sharing that use electrical vehicles (provided by Renault)
• Charging points actually activated : 100 public, 150 private. About 600 final users involved• In May 2016 A2A, in collaboration with Nissan, opened in Milan the widest Italian Fast Charge Network: 12 poles able to charge up to
50 kW DC (Chademo/Combo) and 22 kW AC
• Digital and data driven program to overcome some of the key environmental challenges facing Cities: carbon emissions frombuildings and transport and air quality. The objectives are 1) actively engage citizens in the development of mechanisms ofparticipation 2) co-design solutions for the retrofit of buildings 3) the integrated management of energy systems, 4) electric mobility5) the new services linked to smart lighting. IT platforms will be developed to gather information from the field and turn them intoservices to citizens.
• Co-funded by H2020 program. Total budget around € 28M. 34 Partners led by The Greater London Authority. A2A participates in withUnareti and A2A Smart City. Core cities: Milan, London and Lisbon. Follower cities: Bordeaux, Burgas and Warsaw.
Sharing Cities
Home to the charging of electric quadricycles, video surveillance services, Wi-Fi, info points and LED lighting. A2A has sponsoredand supported the installation of these new infrastructures within the city of Milan also to promote private electric mobility andcar-sharing.
Digital Islands
E-Waste
• The specific objective of the project was the optimization of recycling of WEEE (Waste Electrical and Electronic Equipment) andincrease of the amount of rare earth and precious metals from the waste collected. The project involved the re-definition of logisticscycles of recovery and use and improvement of existing plants combined with the definition of new treatment technologies.
• Partnership between A2A Ambiente/Amsa and the companies Tecnochimica S.r.l., RE.MEDIA, Stena Technoworld S.r.l., S.E.VAL. S.r.l.,Gaser San Giuliano S.r.l., the research bodies of Politecnico di Milano and Cefriel, in collaboration with the Municipality of Milan andthe Municipality of San Donato Milanese.
RESEARCH AND INNOVATION PROJECTS – FOCUS ON SMART CITIES
Back to Index
50
This information was prepared by A2A and it is not to be relied on by any 3rd party without A2A’s prior written consent.
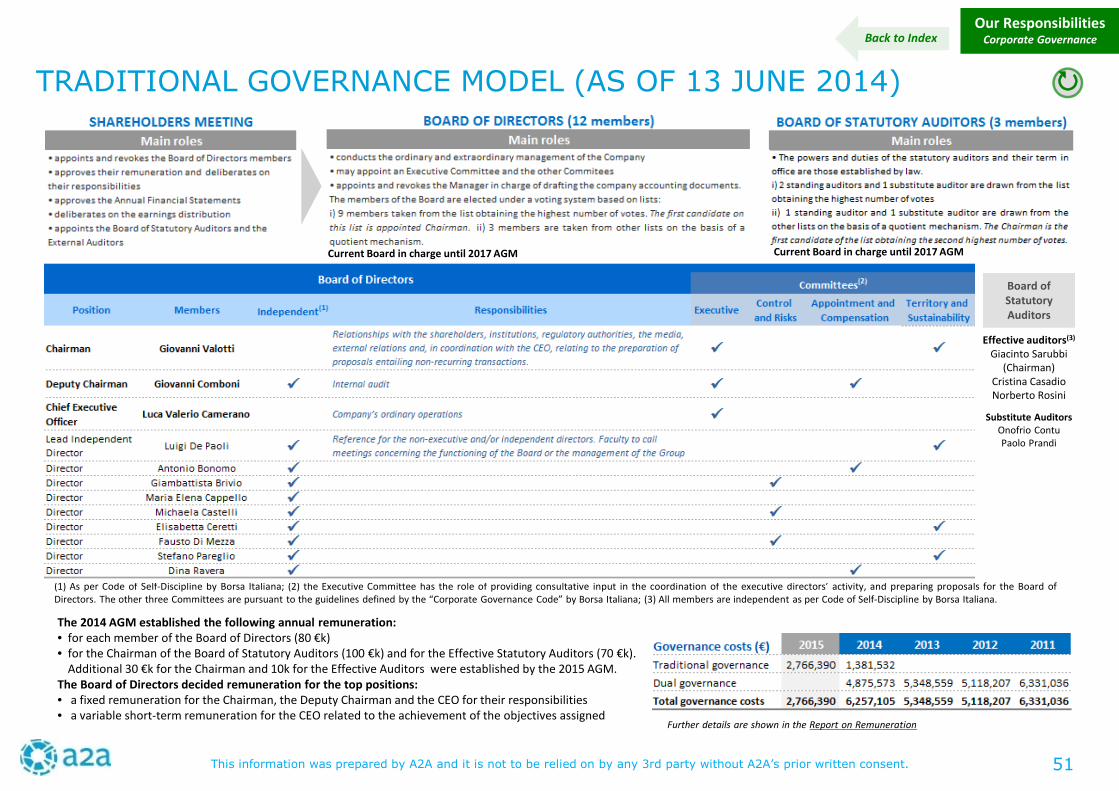
Our ResponsibilitiesCorporate Governance
(1) As per Code of Self-Discipline by Borsa Italiana; (2) the Executive Committee has the role of providing consultative input in the coordination of the executive directors’ activity, and preparing proposals for the Board ofDirectors. The other three Committees are pursuant to the guidelines defined by the “Corporate Governance Code” by Borsa Italiana; (3) All members are independent as per Code of Self-Discipline by Borsa Italiana.
Effective auditors(3)
Giacinto Sarubbi(Chairman)
Cristina CasadioNorberto Rosini
Substitute AuditorsOnofrio ContuPaolo Prandi
TRADITIONAL GOVERNANCE MODEL (AS OF 13 JUNE 2014)
Current Board in charge until 2017 AGM Current Board in charge until 2017 AGM
Board ofStatutoryAuditors
The 2014 AGM established the following annual remuneration:• for each member of the Board of Directors (80 €k)• for the Chairman of the Board of Statutory Auditors (100 €k) and for the Effective Statutory Auditors (70 €k).
Additional 30 €k for the Chairman and 10k for the Effective Auditors were established by the 2015 AGM.The Board of Directors decided remuneration for the top positions:• a fixed remuneration for the Chairman, the Deputy Chairman and the CEO for their responsibilities• a variable short-term remuneration for the CEO related to the achievement of the objectives assigned
Further details are shown in the Report on Remuneration
Back to Index
51
This information was prepared by A2A and it is not to be relied on by any 3rd party without A2A’s prior written consent.
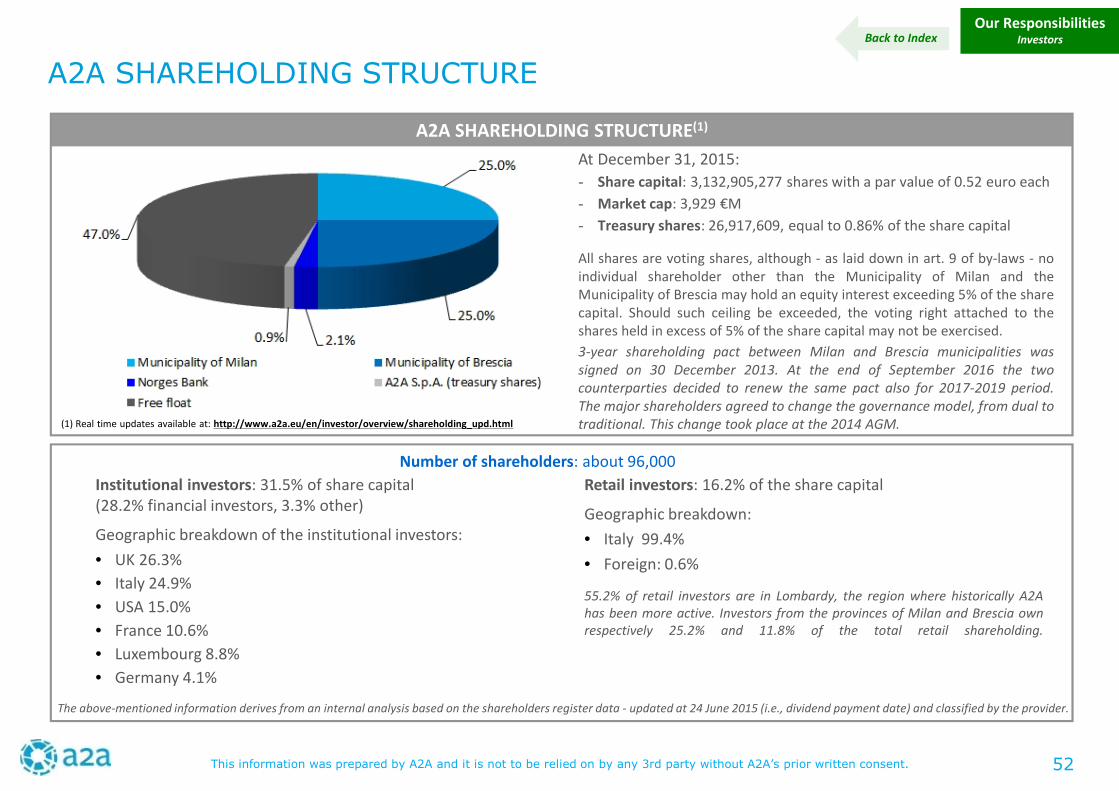
A2A SHAREHOLDING STRUCTURE(1)
Institutional investors: 31.5% of share capital(28.2% financial investors, 3.3% other)
Geographic breakdown of the institutional investors:
• UK 26.3%
• Italy 24.9%
• USA 15.0%
• France 10.6%
• Luxembourg 8.8%
• Germany 4.1%
A2A SHAREHOLDING STRUCTURE
At December 31, 2015:
- Share capital: 3,132,905,277 shares with a par value of 0.52 euro each
- Market cap: 3,929 €M
- Treasury shares: 26,917,609, equal to 0.86% of the share capital
All shares are voting shares, although - as laid down in art. 9 of by-laws - noindividual shareholder other than the Municipality of Milan and theMunicipality of Brescia may hold an equity interest exceeding 5% of the sharecapital. Should such ceiling be exceeded, the voting right attached to theshares held in excess of 5% of the share capital may not be exercised.
3-year shareholding pact between Milan and Brescia municipalities wassigned on 30 December 2013. At the end of September 2016 the twocounterparties decided to renew the same pact also for 2017-2019 period.The major shareholders agreed to change the governance model, from dual totraditional. This change took place at the 2014 AGM.
Retail investors: 16.2% of the share capital
Geographic breakdown:
• Italy 99.4%
• Foreign: 0.6%
55.2% of retail investors are in Lombardy, the region where historically A2Ahas been more active. Investors from the provinces of Milan and Brescia ownrespectively 25.2% and 11.8% of the total retail shareholding.
The above-mentioned information derives from an internal analysis based on the shareholders register data - updated at 24 June 2015 (i.e., dividend payment date) and classified by the provider.
Number of shareholders: about 96,000
Our ResponsibilitiesInvestors
(1) Real time updates available at: http://www.a2a.eu/en/investor/overview/shareholding_upd.html
Back to Index
52
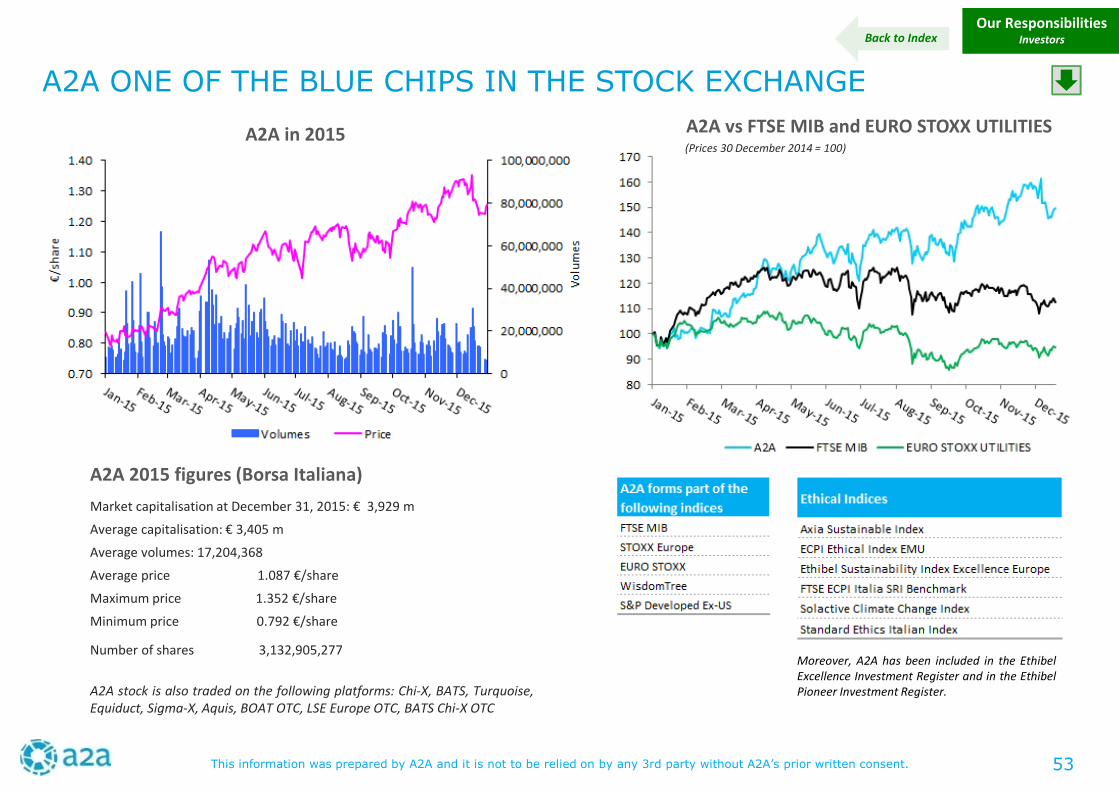
This information was prepared by A2A and it is not to be relied on by any 3rd party without A2A’s prior written consent.
Our ResponsibilitiesInvestors
A2A ONE OF THE BLUE CHIPS IN THE STOCK EXCHANGE
A2A vs FTSE MIB and EURO STOXX UTILITIESA2A in 2015(Prices 30 December 2014 = 100)
A2A 2015 figures (Borsa Italiana)
Market capitalisation at December 31, 2015: € 3,929 m
Average capitalisation: € 3,405 m
Average volumes: 17,204,368
Average price 1.087 €/share
Maximum price 1.352 €/share
Minimum price 0.792 €/share
Number of shares 3,132,905,277
A2A stock is also traded on the following platforms: Chi-X, BATS, Turquoise,Equiduct, Sigma-X, Aquis, BOAT OTC, LSE Europe OTC, BATS Chi-X OTC
Moreover, A2A has been included in the EthibelExcellence Investment Register and in the EthibelPioneer Investment Register.
Back to Index
53
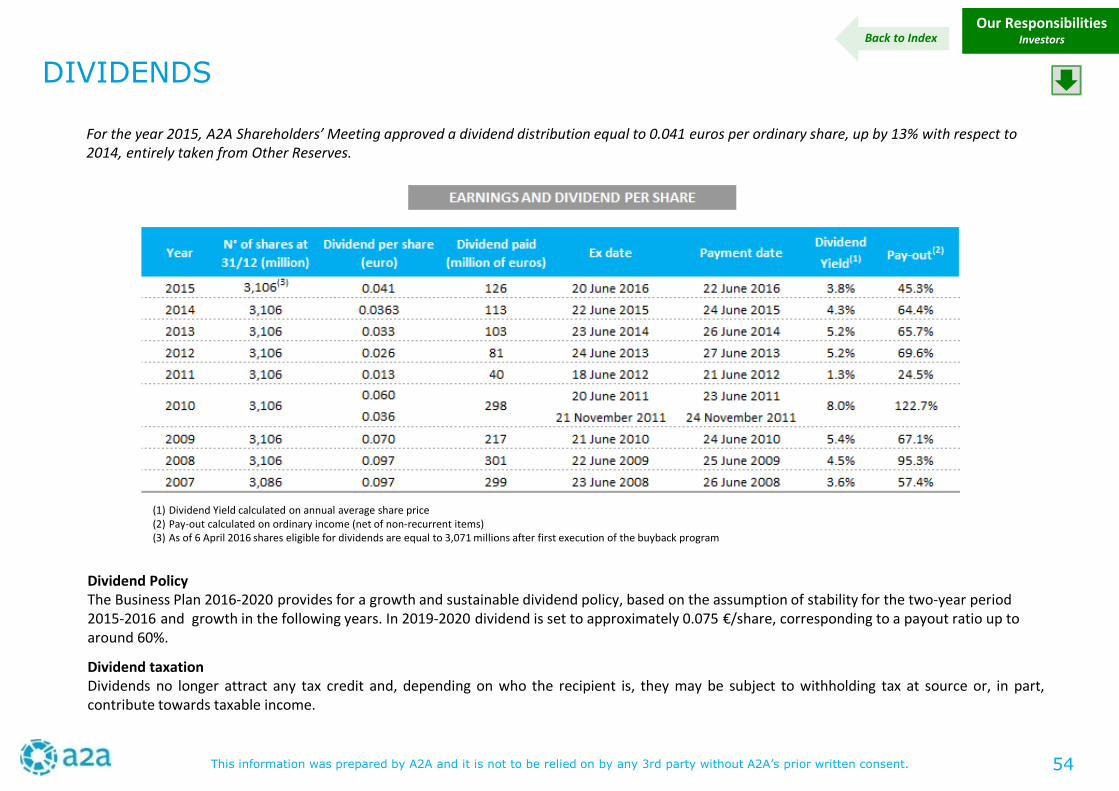
This information was prepared by A2A and it is not to be relied on by any 3rd party without A2A’s prior written consent.
Our ResponsibilitiesInvestors
DIVIDENDS
(1) Dividend Yield calculated on annual average share price(2) Pay-out calculated on ordinary income (net of non-recurrent items)(3) As of 6 April 2016 shares eligible for dividends are equal to 3,071 millions after first execution of the buyback program
Dividend PolicyThe Business Plan 2016-2020 provides for a growth and sustainable dividend policy, based on the assumption of stability for the two-year period2015-2016 and growth in the following years. In 2019-2020 dividend is set to approximately 0.075 €/share, corresponding to a payout ratio up toaround 60%.
Dividend taxationDividends no longer attract any tax credit and, depending on who the recipient is, they may be subject to withholding tax at source or, in part,contribute towards taxable income.
For the year 2015, A2A Shareholders’ Meeting approved a dividend distribution equal to 0.041 euros per ordinary share, up by 13% with respect to2014, entirely taken from Other Reserves.
Back to Index
54
This information was prepared by A2A and it is not to be relied on by any 3rd party without A2A’s prior written consent.
SHAREHOLDER INFORMATIONShareholders’ meetingsAs laid down in A2A by-laws, the company holds one compulsory Shareholders’ GeneralMeeting per year. The Annual General Meeting is called by the Board of Directors within120 days (or 180 days under certain circumstances) of the end of the fiscal year. Withreference to the procedures for the AGM call, please refer to A2A By-laws and CorporateGovernance section of the company website (i.e., Shareholders’ Meetings). This sectionalso contains all relevant documents for the AGM.
American Depositary ReceiptsA2A American Depositary Receipts (ADRs) are traded on the US Over The Counter market(OTC) under the symbol AEMMY. Three unsponsored ADR programs were launched byDeutsche Bank (2008), BNY Mellon (2008) and Citibank (2014) respectively. In all cases,one ADR represents five A2A ordinary shares. Further details are available at websiteswww.adr.com and www.sec.gov.
A2A Investor Relations policy• Main goal: promote and support the correct knowledge and valuation of the A2A
stock by the financial community, through a communication which is active,transparent, well-timed, constant, correct and not discriminatory
• Core activities:- hold regular meetings (one-to-one and group meetings) with the financial community
in Italy and abroad- arrange conference calls with the management at the time of the release of the Group
results- organize International roadshows with the top management for the presentation of
important strategic developments• Blackout period: during the 15 days before the release of the financial resultsThe IR department is not in charge neither of comments about A2A performance in theStock Exchange, nor of financial advice about the investment in A2A.
DocumentationAnnual Reports, Quarterly and Interim Reports, Sustainability Reports, Corporate Governance Reportand Report on remuneration are available on our website (www.a2a.eu ). They may also be obtained,on request, from the Company Secretary at the company’s registered office or through e-mail [email protected] .
Our ResponsibilitiesInvestors
Purchase and disposal of treasury shares: main pointsThe 2016 Shareholders’ General Meeting authorized the Board of Directorsto conduct treasury share purchase and disposal transactions to the extentto which such authority has not been exercised after 2015 AGM:• the maximum number of treasury shares that can be held is 313,290,527,
which is equal to one-tenth of the shares making up the share capital,considering the shares already owned by A2A S.p.A. and by its subsidiaries;
• treasury share purchases and disposals will be conducted to pursue, in theinterest of the Company and in respect of the principle of equal treatmentof shareholders and of current applicable regulations, objectives such astransactions related to cash flow management and transactions related toindustrial plans consistent with the Company strategy, with regard towhich there will be opportunities for share exchanges;
• The authorization to purchase and dispose of the shares will have a term ofvalidity of 18 months starting on the date of the Meeting resolution
• A2A treasury shares were equal to 0.7572% of the share capital at 5August 2016.
Additional InformationAdditional information about A2A is available at www.a2a.eu. Share price information, previousAnnual Reports and Interim Accounts, press releases and other relevant information can be found inthe Investor Relations section of that site. Comments and suggestions are welcome (email: [email protected]).
Back to Index
In case of payment of dividend for the fiscal year 2015, it will be available from 22 June 2016.Ex-dividend date is 20 June 2016 – Record date on 21 June 2016
55