Embed Size (px)
Citation preview

Decision Making: Applications in Management and Engineering Vol. 2, Issue 2, 2019, pp. 81-99. ISSN: 2560-6018 eISSN: 2620-0104
DOI: https://doi.org/10.31181/dmame1902021a
* Corresponding author. E-mail addresses: [email protected] (P. Anthony), [email protected] (B. Behnoee), [email protected] (Malek Hassanpour), [email protected] (D. Pamucar)
FINANCIAL PERFORMANCE EVALUATION OF SEVEN INDIAN CHEMICAL COMPANIES
Patrick Anthony 1*, Babak Behnoee 2, Malek Hassanpour 3 and Dragan Pamucar 4
1 Department of Commerce and Business Management, UCC & BM, Osmania University, Telengana, India
2 Department of Commerce and Business Management, UCC & BM, Osmania University, Telengana, India
3 Department of Environmental Science, UCS, Osmania University, Telangana, India 4 Department of logistics, Military Academy, University of Defence in Belgrade, Serbia
Received: 26 February 2019; Accepted: 20 May 2019; Available online: 22 May 2019.
Original scientific paper
Abstract: Financial appraises create a prominent media for giving advice in the expansion, development of any society as well as its role in forbearance and stamina in depletion and recession. Obviously, manufacturing units have a main role in the development and progress of modern India. Indian economic relied on agricultural activities but industries also provide a prominent booster for the economic cycle. The current empirical study investigated the 7 Indian chemical companies in terms of financial aspect using ratio analysis, Technique for Order of Preference by Similarity to Ideal Solution (TOPSIS), COmplex PRoportional ASsessment (COPRAS) and Data Envelopment Analysis (DEA) along with weighing systems of equal weighing, Entropy Shannon and Friedman test as the objective of research during 2010 to 2018. By the way, present research resulted in weighing and ranking of above-named industries in three classes. The weighing systems of Friedman test and Entropy Shannon were revealed a relatively linear scatter plot with no significant differences between values. DEA model had distinguished and classified the efficient companies based on rank values.
Key words: Financial performance, Companies, DEA, Ratio analysis.

Anthony et al./Decis. Mak. Appl. Manag. Eng. 2 (2) (2019) 81-99
82
1. Introduction
Financial estimations create a prominent media in the expansion, development of any society as well as its role in forbearance and stamina in depression and depletion. At the micro and macro positions, the financial viability of any industrial sector presents the economic achievements and progresses. To figure out the development trend and also any fall or rise parallel with revolution towards sustainability of companies, the financial outcomes are posed as a level of judge.
Obviously, industries, companies and manufacturing units have a main role in flourish and growth of modern India. Indian economic relies on agricultural activities but industries also provide a prominent booster for the economic cycle. The preliminary activities to set up the industries started after British rule in India. The industrial sector encompassed 3 major sectors such as (1) primary sector devoted to the exploitation of raw materials using agricultural activities or mining and aggregate extractions. (2) The second sector included refining, building and construction and manufacturing developments. (3) The third sector is related to distribution, delivery of commodities and marketing purposes (Arab et al 2015; Kettiramalingam et al 2017).
By the 1938 Indian chemical council was found in order to further development of companies in this regard. This sector placed the third greatest producer in Asia and 12th in the world because of marketing expansion. It has been forecasted the growth rate around 14% per year from $ 160 billion in 2013 to $ 350 billion by 2021. The majority of Indian chemical products encompassed based chemicals, which include the petrochemicals, man-made fibres, industrial gases, fertilizers, chlor-alkali, and other organic and inorganic chemicals etc. over 70000 commercial products. Also, this sector included 12.5% of the total industrial output and approximately 16.2% of the total exports in India.
Financial analysis refers to the process of evaluating companies, businesses or projects in terms of budgeting and other financial aspects of these institutions, which is used to determine the suitability of these institutions for investing through financial statements. Financial analysis is often used to assess the strength of an institution and its ability to pay debts, as well as its liquidity and profitability. Financial analysis often focuses on the profit and loss account, balance sheet and cash flow, which, based on the firm's past, estimates its future performance (Kumar and Bhatia 2014).
Many scholars recognize decision making as an essential factor in management. Decision-making is the result of a process that ultimately leads to a decision, while those who are not in the decision-making process. Only see the result of the decision. In recent years, the attention of academic assemblies has attracted more decision making science in the country and relatively comprehensive research has been done in order to choose the best option in the fields of industry, commerce, trade, mining and so on. Among different decision-making methods, depending on the data of this study, COPRAS and TOPSIS methods have been selected as the ranking and weighing systems. Weighing systems have been used for data recording. In this study, Entropy Shannon and Friedman have been used for this purpose (Bulgurcu 2012; Zavadskas et al., 2008).
Data Envelopment Analysis (DEA) has been empirically declared for evaluation of relative efficiency and inefficiency of various companies and industries etc. The main purpose to figure out the DEA in industries refers to the sustainability of industries and companies. DEA can be calculated via the ratio of output costs to inputs costs. Therefore, financial data of input and output from industries are the main information to investigate the performance of industries. So, in parallel with distinguish input and

Financial performance evaluation of seven Indian chemical companies
83
outputs outlay to estimate DEA, we tried to find out both financial items of profit and loss of industries. Many kinds of research have completed based on limited criteria of industries and they focused on some single group industries or single industry during a certain period. Also, they tried to represent their results based on one methodology either DEA or financial analysis (Sinha 2015). The current study was conducted to an analysis of financial performance of selected companies with respect to liquidity ratios, turn over ratios, solvency ratio, and profitability ratios along with efficiency classification of companies' based on DEA and weighing additive models. The final achievement of the present study includes the sustainability progresses of industries and companies.
2. Literature review
The financial performance of many companies such as Tata Steel Ltd., Jindal Steel & Power Ltd., J S W Steel Ltd., Bhushan Steel Ltd. and Steel Authority of India Ltd evaluated based on Liquidity, Solvency, Activity and Profitability ratios in India (Arab et al 2015). Kettiramalingam et al (2017) estimated the financial performance using productivity and efficiency relationships as a case study industry in India. The obtained results revealed a rise in the performance of the industry in a period of 20 years. To investigate the interplay between executive compensation and companies performance has been used the ratios analysis as main and important variables by Raithatha and Komera (2016) in Indian companies. 50 listed non-financial companies on Pakistani Stock Market investigated for financial performance via working capital management, inventory turnover, cash conversion cycle, average collection period, and average payment period, return on asset, return on equity and earning per share in a period ranging from 2005 to 2014 (Bagh et al 2016).
Lots of methods have been posed for weighting and ranking systems based on multi-criteria networks and financial ratios analysis such as TOPSIS, VIKOR, WASPAS, COPRAS, EDAS, and ARAS etc. Yalcin et al (2012) set up a weighing system in the hierarchical financial performance system and ranked the criteria in the TOPSIS and VIKOR models. To compare the financial situation of 13 technology companies has been utilized ratios analysis along with the TOPSIS method in the Istanbul Stock Exchange. The results were used to rank the firm during 2009-2011 (Bulgurcu 2012). Anderkinda and Rakhmetova (2013) surveyed the financial outcomes of industries holding an adverse relationship between them such as liquidity decline, profitability loss, financial instability, raise in expenses and etc. By the way, some economic and financial models have released to further studies. The inventory turnover ratio, debtor turnover ratio, investment turnover ratio, fixed assets turnover ratio and total assets turnover ratio were studied to measure the financial performance of a case study steel industry in India (Pinku Paul and Mukherjee 2013). Kumar and Bhatia (2014) evaluated the financial performance of Tata Motors and Maruti Suzuki using ratios analysis including the liquidity, assets, profitability etc. A study by Margineana et al (2015) included ratios analysis and the existing relationship among various kinds of ratios, expenses paid for around 700 staff and raw material flow based on real data during 2006 to 2013.
Fenyves et al (2015) implemented a benchmarking method to evaluate the performance of companies based on financial analysis. So the study pointed out that the DEA procedure was a dominant method to investigate the profit-making trend comparison of companies. Rezaee and Ghanbarpour (2017) carried out research on the DEA model for investigating 59 Iranian manufacturing units based on linear multi-

Anthony et al./Decis. Mak. Appl. Manag. Eng. 2 (2) (2019) 81-99
84
group relations. By the way, it was developed a score based on DEA performance model for industries individually. Rahimi et al (2013) applied a DEA model for figuring the performance out for around 22 poultry companies in Iran. It was matured the efficiency score in DEA solver. DEA model has been used for financial performance analysis (liquidity, activities, leverage) profitability (output) to find efficient and inefficient industries for around 36 companies in a period of 5 years. Findings paved the way for the classification of companies and figure out the reasons for weakness and strong points among 9 efficient and 27 inefficient units in the group (Tehrani et al 2012). Some attempts done resulted in figure out the financial analysis of around 85 Spanish industries using DEA model (Rodríguez‐Pérez et al 2011). According to discussions outlined the DEA model is a dominant method for traditional ratio analysis and it also able to measure a prominent procedure to determine the operational and managerial efficiencies of companies and industries etc (Feroz et al 2017). DEA model used to measure the efficiency level of 15 insurance companies from 2005 to 2012. So, despite demystifying the efficient companies, it has been reported significant fluctuations between the technical efficiency levels obtained in the distinguished time interval (Sinha 2015). Saranga and Nagpal (2016) used a model of DEA to distinguish the efficient and inefficient Indian airline companies in terms of operational efficiency of drivers. On the other hands, the efficiency of airline companies was obtained in a high relationship with prices and cost efficiency relied on the technical aspect. A study targeted to evaluate the performance of manufacturing 744 small and medium enterprises based on input and output variables in Turkey. By the way, it has been reported to exist around 94 efficient units (Bulak and Turkyilmaz 2014). A study estimated the efficiency score (relies on value-added amounts) of manufacturing companies of both China and Turkey via the DEA model. The canonical correlation analysis used to figure out the weight values. The t-test analysis has been selected to compare the significant differences between the efficiency values of two groups of companies. The statistical analysis has been manifested the highest efficiency level to Chinese companies (Bayyurt and Duzu 2008). Amini and Alinezhad (2016) carried out his research using the DEA method for ranking 15 Iranian industries. In the following steps, it was found around 8 efficient industries with a score of 1. The research conducted by Lu et al (2014) used a similar procedure close to DEA to figure out the efficiency of industries. The results appeared with the efficiency scores about 0.905 to 0.973 for 34 Chinese life insurance companies from 2006 to 2010. An article devoted to assessing the efficiency and performance of around 40 retail workshops via DEA method in the Portuguese in the period of 2010 to 2013. It has been reported that the technical efficiency complied from a failure. Therefore the authors tried to offer some improvement steps of marketing and selling trends (Xavier et al 2015). Ahmadi and Ahmadi (2012) revealed that DEA models can provide efficiency scores scaled to a maximum value of 1 to evaluate efficiency and inefficiency of industries (case study conducted among 23 main industries). So, obtained results revealed amounts of around 0.591, 0.418 and 0.484 for Iranian recycling industries at efficiency scale, while values were about 1, 1, and 1 at pure technical efficiency during 2005, 2006 and 2007 respectively. Also, results asserted that there are 3 major manufacturing industries and two provinces which are identified as the best performers, namely tobacco, transport equipment and coal coke. Among 30 provinces, Bushehr and North Khorasan provinces have the utmost performance. Keramidou et al (2011) evaluated the purely technical and scale efficiency of the Greek meat products industry from 1994 to 2007 via DEA. The results presented the presence of inefficiencies in firms as well as a waning trend the efficiencies due to mismanagement and wastage of capital.

Financial performance evaluation of seven Indian chemical companies
85
Rahmani (2017) used the DEA model for estimating the industrial productivity of a country.
3. Methodology
This study has relied on secondary data obtained from valuable resources (website) and then secondary data came through the following procedures. Seven Indian large chemical companies were chosen as case studies in a period from 2010 to 2018. Companies have been chosen from around the top 10 chemical companies in India. An appropriate performance analysis demands a reliable procedure to measure the availability in the best possible situation. It requires a procedure to conduct the empirical methods and practices such as DEA, ratios analysis (turn over ratios, liquidity, profitability and solvency). In order to analyze the collected data, the IBM SPSS statistics 20 and EXCEL package were used. Companies were ranked by the TOPSIS, COPRAS and DEA models.
3.1. Financial ratio analysis
To conduct the financial ratios analysis below equations were used to get the results. Below displays the applied equations.
(1) (Current Assets/Current Liabilities) Current Ratio
(2) (Quick Assets) / (Current Liabilities) Acid Test Ratio
(3) (Absolute liquid assets) / (Current liabilities) Absolute liquid ratio
(4) (Net Credit Sales) / (Average Trade Debtors) Debtor Turnover Ratio
(5) (Total Sales / (Total Assets) Total asset turnover
(6) (Cost of goods sold) / (Average Inventory)
Inventory Turnover Ratio
(7) (Shareholder funds) / (Total assets) Equity Ratio
(8) Outsider Funds (Total Debts)/ (Shareholder Funds or Equity)
Debt equity ratio
(9) (Total Debts) / (Total Assets)
Debt to total capital ratio
(10) (Fixed Assets × 100) / ( Net Worth)
Fixed assets to net worth ratio
(11) (Earnings after tax × 100) / (Net Sales)
Net profit margin or ratio
(12) (Earnings Before Interest & Tax (EBIT) × 100) / Net capital
Return on net capital
Then TOPSIS procedure was assigned for ranking of companies and determining
the performance values based on ratio analysis values (Bulgurcu 2012).
3.2. Friedman test
The current empirical study of seven Indian chemical industries was accomplished to determine the performance of industries. In the SPSS software structure, there is a test defined as the Friedman test. The Friedman test was selected to estimate weight values. This test is used by Equations 13 to 17 to estimate the weight of criteria and factors in separate columns. The test structure is formatted so that all values in the columns form a matrix with various rows and columns. The weight of each column is

Anthony et al./Decis. Mak. Appl. Manag. Eng. 2 (2) (2019) 81-99
86
then estimated by comparing the values in the columns. In this estimation, higher weights are assigned to columns of higher values and medium weights for average values and vice versa. Therefore, the Friedman test is used as a highly valid test in estimating the weight of numbers with a variety of values. In the matrix of [rij] n×k the entry rij is the estimated weight of Xij within the block of I individually. The test statistic is calculated by equation 17 (Eisinga et al 2017).
ȓ. j =1
n ∑ 𝑟𝑖𝑗𝑛
𝑖=1 (13)
ȓ =1
nk ∑ ∑ 𝑟𝑖𝑗𝑘
𝑗=1𝑛𝑖=1 (14)
SSt = n ∑ (ȓ. 𝑗 − ȓ)2.𝑗=1 (15)
SSe =1
n(k−1) ∑ ∑ (𝑟𝑖𝑗 − ȓ)2𝑘
𝑗=1𝑛𝑖=1 (16)
Q =SSt
SSe (17)
3.3. TOPSIS Method
TOPSIS method has been defined pertaining to the smallest distance best possible and ideal solution value and largest distance from the negative on unreliable solution value. So the findings based on the present procedure provide a steady rise and fall in the values. The important stages posed in running the process include (1) set up the matrix of data (2) weight estimation base on Hwang's rule (3) set up the non-scale matrix (4) figure out the best solutions values (5) finding the relative proximity and ranking the alternatives. To set up the non-dimension matrix was used the equation 18. In this equation, aij is the numerical value of each industry i, according to the index j. The equal weights were assumed about 0.0715 for 15 criteria individually as they provide the same significance (∑wi=1). The symbol of Wi is the weight for each ratio or criterion. Then, according to equation 19 the weights assigned to the rows of the matrix as a special vector. The special vector has collected the values in the non-scaled matrix. To find the best ideal values (A+) and (A-) were applied the equations of 20 and 21. The largest and smallest values were assumed as the best ideals solutions in the columns individually. Then Euclidean distance was employed to find the positive and negative ideal solutions for each company. The distances were calculated regarding the equations of 22 to 24. The higher the cli+, the higher the weighting value will be provided (Bulgurcu 2012).
Nd =aij
√∑ (𝑎𝑖𝑗)2 𝑚𝑖=1
(18)
V = Nd × Wn. n (19)
A+= {(max 𝑉𝑖𝑗|𝑗 ∈ 𝐽), (min 𝑉𝑖𝑗|𝑗 ∈ 𝑗′)|𝑖 = 1,2, … , 𝑚} = {V1+, V2+,..Vj+, Vn+} (20) A−= {(min i 𝑉𝑖𝑗|𝑗 ∈ 𝐽), (max 𝑉𝑖𝑗|𝑗 ∈ 𝑗′)|𝑖 = 1,2, … , 𝑚} = {V1-, V2-,..Vj-, Vn-} (21)
di+= {∑ (𝑉𝑖𝑗 − 𝑉𝑗 +𝑛𝑗=1 )
2}0.5 ; 𝑖, = 1,2,3, … 𝑚 (22)

Financial performance evaluation of seven Indian chemical companies
87
di−= {∑ (𝑉𝑖𝑗 − 𝑉𝑗 −𝑛𝑗=1 )
2}0.5 ; 𝑖, = 1,2,3, … 𝑚 (23)
cli+=di−
di(+)+(𝑑𝑖−) 𝑖 = 1,2, … , 𝑚 (24)
3.4. Entropy Shannon weighing system
This method like other methods needs to compose a matrix for the existing data. To normalize the existing data was employed equation 25, and 26 and 27 for entropy values. The distance between each of the options was obtained from the entropy value using equation 28. It was used the equation of 29 to release the weight of each indicator by Excel 2013.
Pij =Xij
∑ 𝑋𝑖𝑗𝑚𝑖=1
𝑗 = 1, … . , 𝑛 (25)
Ej = −k ∑ 𝑃𝑖𝑗 × 𝐿𝑛 𝑃𝑖𝑗 𝑖 = 1,2, … , 𝑚𝑚𝑖=1 (26)
k =1
Ln 𝑚 (27)
dj = 1 − Ej (28)
Wj =dj
∑ 𝑑𝑗 (29)
3.5. DEA
Determining the performance of each company is done using the DEA method. In this method, the ranking of each option is done according to the weight assigned to it. In this study, the weight of each column was obtained by the Friedman test. Then the data was sorted by input and output and according to formulas 30 to 34, and the efficiency of the companies was estimated (Xavier et al 2015).
DEA = 0 ≤∑ 𝑈𝑟 𝑌𝑟𝑗𝑆
𝑟=1
∑ 𝑉𝑖 𝑋𝑖𝑗𝑚𝑖=1
≤ 1 (30)
Max Z = ∑ 𝑈𝑟 𝑌𝑟𝑗𝑆
𝑟=1
∑ 𝑉𝑖 𝑋𝑖𝑗𝑚𝑖=1
≤ 1 , 𝑗 = 1,2,3, … . 𝑛 (31)
Ur, Vi ≥ 0 (32)
𝐷𝐸𝐴 =Output (1)Weight (1) + Output (2)Weight (2) + … + Output (s)Weight (s)
Input (1) Weight (1) + Input (2)Weight (2) + … + Input (m)Weight (m) (33)
3.6. Ranking system based on COPRAS
COPRAS method is a dominant procedure to rank the alternatives that it was introduced in 1996 firstly. The procedure makes it easy for the decision making processes for multi-criteria options. It follows some steps to complete the ranking operation. Equation 35 was employed to normalize the decision matrix. By the way, the Xij and W are the values and weighted values respectively. To sum the normalized values, figure out the relative importance of alternatives and the greatest value of relative importance (Qmax) were used the equation of 36 to 39 respectively. The S-min (minimum value of S-i) and Nj (ranking amount), S+j, (maximizing criterion of j-th alternative) S-I (minimum value of the sum of minimizing criteria of the j-th option) and S-i (minimizing criteria of the j-th option) were distinguished respectively (Zavadskas et al., 2008).

Anthony et al./Decis. Mak. Appl. Manag. Eng. 2 (2) (2019) 81-99
88
Pij =Xij .W
∑ 𝑋𝑖𝑗𝑛𝑖=1
𝑖 = 𝛤, 𝑚; 𝑗 = 𝛤, 𝑛 (34)
S + j = ∑ +𝑃𝑖𝑗𝑚𝑖=1 𝑖 = 𝛤, 𝑚; 𝑗 = 𝛤, 𝑛 (35)
S − j = ∑ −𝑃𝑖𝑗𝑚𝑖=1 𝑖 = 𝛤, 𝑚; 𝑗 = 𝛤, 𝑛 (36)
Qj = Sj+, +S−min × ∑ 𝑠𝑗−𝑛
𝐼=1
Sj−,∑ (𝑆−𝑚𝑖𝑛
𝑆𝑗−)𝑛
𝑖=1
= Sj+, +∑ 𝑆𝑗−𝑛
𝐼=1
Sj−,∑ (1
𝑆𝑗−)𝑛
𝑖=1
(37)
Nj =Qj
𝑄𝑚𝑎𝑥∗ 100 (38)
4. Results and discussion
4.1. Financial data analysis
Financial Statements (FS) are summaries of the operating, financing, and investment activities of a business. FS should present useful data to both investors and creditors in making credit, investment, and other business decisions. This usefulness means that investors and creditors can use these statements to predict, compare, and evaluate the amount, timing, and uncertainty of potential cash flows. In other words, FS provides the information needed to assess a company's future earnings and therefore the cash flows expected to result from those earnings. By this study, the financial data of 7 Indian industries were collected according to Table 1.
Table 1. Financial data of industries during 2010-2018 (Profit & Loss
account in Rs, Cr)
Tata Chemicals (A) (1) 3,447.99 3,591.36 8,170.30 9,984.39 8,590.23 8,440.93 7,912.63 6,225.27 5,411.70 (2) 3,466.01 3,606.80 8,220.86 10,082.06 8,689.64 8,529.87 7,996.25 6,332.86 5,411.70 (3) 194.49 176.92 164.37 194.75 202.92 365.6 308.57 108.03 88.35 (4) 531.39 479.95 2,041.14 3,778.55 3,194.24 2,988.79 2,864.91 2,198.87 2,724.92 (5) -19.7 39.95 591.34 -850.84 130.19 273.78 -409.36 -10.07 171.17 (6) 258.03 266.66 286.27 330.17 267.05 273.56 239.75 207.38 204.66 (7) 86.51 100.98 215.16 186.78 185.32 203.25 210.19 201.49 189.71 (8) 126.55 129.6 153.5 192.71 158.82 214.29 224.68 204.46 187.19 (9) 1,537.82 1,513.61 2,031.18 3,072.81 2,556.19 2,542.98 2,109.54 1,744.50 717.95
Gujarat Fluorochemicals (B) (1) 2,044.48 1,417.22 1,319.08 1,309.21 1,134.87 1,504.16 2,065.56 978.97 985.57 (2) 2,050.46 1,421.52 1,338.31 1,320.97 1,140.94 1,596.08 2,069.00 982.85 985.57 (3) 103.02 71.12 52.36 56.19 65.06 56.9 57.64 99.53 49.23 (4) 539.38 374.41 335.54 410.09 320.84 303.47 252.35 212.16 377.57 (5) 38.42 1.19 50.63 -47.05 41.05 -75.08 -94.3 39.66 -9.2 (6) 138.35 120.06 103.04 96.16 80.69 74.53 66.53 55.63 56.97 (7) 47.62 35.18 47.73 51.98 55.28 68.95 57.13 29.87 48.03 (8) 152.14 148.84 144.15 123.85 101.7 96.38 77.82 44.86 57.03 (9) 755.3 615.38 559.59 581.94 507.66 588.8 760.65 350.71 83.35
Solar Industries India (C) (1) 1,230.54 1,094.29 1,084.25 1,009.18 896.76 884.56 722.62 531.21 480.21 (2) 1,273.27 1,137.31 1,089.50 1,014.75 904.03 886.99 723.75 534.01 480.21 (3) 18.23 13.38 10.19 19.83 17.1 17.64 24.97 24.81 20.09 (4) 750.02 678.57 640.97 599.86 489.22 509.02 393 261.62 218.92 (5) -19.46 -1.79 -2.98 2.37 -3.81 -1.61 -1.87 -0.43 0.19 (6) 69 54.35 43.41 40.42 38.69 32.24 24.15 18.88 16.83 (7) 14.23 13.79 7.92 7.24 14.48 21.91 20.09 11.45 8.27 (8) 26.09 19.28 17.72 17.66 12.57 10.31 8.05 6.64 6.32 (9) 154.81 113.27 164.54 161.13 206.44 162.45 109.63 102.62 95.62

Financial performance evaluation of seven Indian chemical companies
89
Gujarat Alkalies & Chemicals (D) (1) 2,420.13 2,023.04 1,955.67 1,931.81 1,882.85 1,794.31 1,698.22 1,423.17 1,280.47 (2) 2,454.50 2,070.21 1,995.45 1,948.12 1,896.06 1,814.60 1,710.97 1,434.68 1,280.47 (3) 105.74 55.92 46.23 48.95 30.27 18.7 11.77 12.01 49.26 (4) 1,177.41 1,132.21 1,219.66 675.57 717.22 714.75 720.8 615.79 807.34 (5) 1.47 5.68 -1.95 25.04 -4.47 3.71 -30.57 -4.66 6.2 (6) 201.39 169.76 162.1 167 151.44 118.9 118.13 114.93 119.91 (7) 14.9 12.83 9.93 9.34 6.36 8.34 20.53 21.17 17.48 (8) 127.32 110.92 107.44 98.06 150.65 151.52 138.95 133.12 121.55 (9) 285.78 308.67 268.82 800.46 658.4 481.93 506.43 423.31 64.89
Phillips Carbon Black (E) (1) 2,542.63 1,924.04 1,892.03 2,467.24 2,276.10 2,280.72 2,180.65 1,690.14 1,232.57 (2) 2,546.98 1,926.95 1,894.10 2,470.19 2,277.46 2,284.91 2,186.78 1,695.72 1,232.57 (3) 19.73 18.94 16.76 14.42 20.51 9.27 10.44 20.91 25.62 (4) 1,650.89 1,221.26 1,291.46 1,864.41 1,856.05 1,889.63 1,701.80 1,228.17 937.15 (5) 8.42 15.28 35.61 43.09 -25.54 -26.03 -43.57 11.24 -15.06 (6) 97.18 81.8 72.61 70.16 62.91 58.43 52.35 47.7 36.66 (7) 41.44 51.45 72.1 94.8 80.23 72.13 67.63 43.75 31.21 (8) 60.52 60.62 62.15 57.53 53.74 50.79 48.59 38.58 31.15 (9) 404.44 349.96 311.06 307.34 358.48 289.27 267.01 182.83 100.8
Gujarat Heavy Chemicals (F) (1) 2,905.65 2,780.70 2,532.19 2,361.58 2,210.82 2,106.28 1,868.88 1,469.11 1,215.87 (2) 2,905.65 2,780.70 2,532.19 2,373.61 2,224.21 2,124.95 1,896.73 1,498.17 1,215.87 (3) 35.75 10.78 7.47 11.26 5 2.98 9.63 13.3 14.28 (4) 1,100.08 1,069.91 900.42 903.92 888.6 790.91 770.75 593.61 655.15 (5) 23.62 -43.53 -5.33 -12.77 -10.13 5.58 -24.35 -25.15 11.41 (6) 176.37 158.13 133.24 125.87 121.99 111.03 99.93 95.67 82.98 (7) 124.16 133.77 162.82 163.84 170.53 157.96 184.96 110.43 103.39 (8) 109.53 85.69 81.74 84.45 81.57 81.97 80.85 84.4 76.11 (9) 866.62 790.79 806.23 772.06 762.08 739.55 583.56 479.04 131.13
UPL (G) (1) 7,091.00 6,794.00 5,821.76 5,226.20 4,814.85 3,826.27 3,216.99 2,822.46 2,699.10 (2) 7,263.00 6,939.00 5,982.53 5,334.99 4,968.27 3,939.44 3,308.00 2,911.09 2,699.10 (3) 435 325 458.78 240.47 317.84 134.32 151.49 153.59 103.88 (4) 3,517.00 3,029.00 2,833.75 2,438.76 2,014.58 1,838.39 1,557.89 1,270.96 1,415.03 (5) 2 -108 -66.28 -207.37 -153.99 -38.2 -116.85 -51.05 108.57 (6) 486 445 390.41 317.8 257.87 237.46 184.65 153.12 127.36 (7) 135 149 192.61 35.27 243.29 105.99 164.37 293.64 108.34 (8) 666 655 243.94 186.75 169.09 157.76 143.49 114.68 107.91 (9) 1,905.00 1,929.00 1,720.56 1,630.12 1,380.77 1,127.93 876.67 788.52 508.63 Revenue From Operations [Net] (1), Total Operating Revenues (2), Other Income (3), Cost Of Materials Consumed (4), Changes In Inventories Of FG,WIP And Stock-In Trade (5), Employee Benefit Expenses (6), Finance Costs (7), Depreciation And Amortization Expenses (8), Other Expenses (9)
Based on existing data in Table 1, one sample t-test had shown a significant difference around 0.001 among criteria such as Revenue From Operations [Net], Total Operating Revenues, Other Income, Cost Of Materials Consumed, Changes In Inventories Of FG, WIP And Stock-In Trade, Employee Benefits Expenses, Finance Costs, Depreciation and Amortization Expenses and Other Expenses. It was found the amount of around 0.806 for the Cronbach, s alpha reliability test. The distributions of revenue from operations (net), total operation revenues, distribution of other income, distribution of changes in inventories of FG, WIP, and stock-in-trade, depreciation amortization expenses and other expenses were obtained normally with mean and standard deviation of 2843.29 and 2273.20, 2877.84 and 2308.48, 2877.84 and 2306.48, 88.06 and 110.02, 64.72 and 140.32, 118.69 and 115.19, 762.99 and 702.47 based on one sample Kolmogorov-Simonov test. Therefore, the null hypothesis was retained for them respectively. The distributions of the cost of materials consumed, employee benefit expenses and finance cost with the mean and standard deviation of 1229.84 and 912.45, 144.00 and 104.08, 88.18 and 74.21 were also achieved normally based on the same test but null hypothesis was rejected for them respectively. Chi-

Anthony et al./Decis. Mak. Appl. Manag. Eng. 2 (2) (2019) 81-99
90
square test had revealed a value of 0.000 for all criteria such as revenue from operation (net), total operating revenues, other income, cost of materials consumed, changes in inventories of FG, WIP and stock-in-trade, employee benefit expenses, finance costs, depreciation and amortization expenses and other expenses. The Friedman test was revealed the mean weights around 8.08, 8.92, 2.68, 6.83, 1.71, 4.37, 2.89, 3.38 and 6.14 for the revenue from operation (net), total operating revenues, other income, cost of materials consumed, changes in inventories of FG, WIP and stock-in-trade, employee benefit expenses, finance costs, depreciation and amortization expenses and other expenses respectively (with a chi-square value around 446.966).
4.2. Performance ranking by TOPSIS based on financial ratio analysis
Tables 2 and 3 present the data associated with financial ratio analysis from 2010 to 2018 for 7 Indian industries and weighted matrix respectively. The columns of tables were composed with the following layout. Liquidity ratio (current ratio (1), quick ratio (2), cash ratio (3)); Turnover ratio (debt turnover ratio (4), assets turnover ratio (5), inventory turnover ratio (6)); Solvency ratio (equity ratio (7), debt-equity ratio (8), debt to total capital ratio (9), (fixed assets/net worth ratio (10))); Profitability ratio (net profit margin ratio (11), (return on net worth/equity ratio (12)), return on capital employed ratio (13), return on assets ratio (14), (total debt/equity ratio (15))).
The vector of A+=0.036499171, 0.03880029, 0.0314006, 0.03763651, 0.041673431, 0.047213935, 0.042005393, 0.061909557, 0.041915856, 0.047567033, 0.04991575, 0.017316467, 0.042615593, 0.042736267, 0.047403448. The vector of A-= 0.01609707, 0.012867944, 0.002692456, 0.013447954, 0.014037746, 0.014127247, 0.00378427, 0.003621045, 0.008111058, 0.007857528, 0.011726501, 0.007936345, 0.014754619, 0.011453475, 0.004778268. Table 4 displays the TOPSIS ranking system results.

Financial performance evaluation of seven Indian chemical companies
91
Ta
ble
2. D
ata
of
fin
anci
al r
atio
an
aly
sis
fro
m 2
01
0 t
o 2
01
8 f
or
sev
en c
om
pa
nie
s
15
1
4
13
1
2
11
1
0
9
8
7
6
5
4
3
2
1
Co
0.4
3
5.8
4
8.0
6
10
.3
13
.22
3
20
7.3
6
21
.93
9
53
.2
2.2
5
7.8
8
61
.76
7
32
.5
7.8
8
1.0
9
1.3
9
A
0.2
7
8.1
2
10
.69
1
2.4
2
20
.43
9
25
6.1
3
17
.32
5
68
7.7
1
0.3
4
.59
3
8.9
4
52
7.7
5
89
0
.93
1
.4
B
0.4
4
10
.97
1
6.0
3
19
.55
9
.47
6
20
3.3
7
22
.67
9
14
.69
2
.51
1
5.3
4
11
5.6
7
64
.77
7
6.4
2
1.2
1
.49
C
0.1
26
6
.86
8
.97
1
0.3
7
12
.5
86
31
.25
7
.75
3
32
.67
2
.3
10
.58
5
5.8
7
60
8.6
5
91
.9
1.5
8
1.9
5
D
1.2
5
2.9
4
5.5
5
8.9
6
30
.35
1
53
68
.77
3
5.8
9
22
75
.94
1
.59
6
.79
9
3.3
8
44
1.6
9
1
0.5
8
0.8
6
E
1.1
5
6.4
1
1.5
2
17
.76
8
.94
1
94
16
.36
4
0.0
5
12
04
.13
3
.33
5
.21
7
1.5
4
88
9.9
8
90
.78
0
.52
4
0.9
54
F
0.4
5
4.4
5
6.5
7
9.1
6
7.1
3
54
45
.96
2
0.5
1
52
0.9
5
1.3
3
6
60
.7
31
8
70
.7
1.3
7
1.7
4
G

Anthony et al./Decis. Mak. Appl. Manag. Eng. 2 (2) (2019) 81-99
92
Ta
ble
3. W
eigh
ted
mat
rix
8
7
6
5
4
3
2
1
Co
0.0
10
37
53
87
0
.02
83
82
02
2
0.0
24
25
33
12
0
.02
22
64
28
3
0.0
30
97
68
13
0
.00
26
92
45
6
0.0
26
76
72
88
0
.02
60
17
35
8
A
0.0
61
90
95
57
0
.00
37
84
27
0
.01
41
27
24
7
0.0
14
03
77
46
0
.02
23
18
10
6
0.0
30
40
97
22
0
.02
28
38
14
5
0.0
26
20
45
33
B
0.0
09
95
62
13
0
.03
16
61
72
3
0.0
47
21
39
35
0
.04
16
73
43
1
0.0
32
34
14
84
0
.02
61
11
35
9
0.0
29
46
85
74
0
.02
78
89
11
C
0.0
03
62
10
45
0
.02
90
12
73
4
0.0
32
56
34
57
0
.02
01
40
95
7
0.0
25
73
93
0
.03
14
00
6
0.0
38
80
02
9
0.0
36
49
91
71
D
0.0
24
77
31
4
0.0
20
05
66
29
0
.02
08
98
47
6
0.0
33
66
31
92
0
.01
86
74
89
5
0.0
31
09
30
86
0
.01
42
43
14
4
0.0
16
09
70
7
E
0.0
13
10
67
08
0
.04
20
05
39
3
0.0
16
03
55
02
0
.02
57
89
94
2
0.0
37
63
65
1
0.0
31
01
79
16
0
.01
28
67
94
4
0.0
17
85
65
18
F
0.0
16
55
52
29
0
.01
67
76
92
9
0.0
18
46
69
89
0
.02
18
82
15
6
0.0
13
44
79
54
0
.02
41
56
93
6
0.0
33
64
32
89
0
.03
25
68
49
1
G
1
5
14
1
3
12
1
1
10
9
C
o
0
.01
63
06
78
6
0.0
22
75
11
21
0
.02
14
27
42
8
0.0
09
12
32
53
0
.02
17
42
54
4
0.0
07
85
75
28
0
.02
29
51
67
9
A
0
.01
02
39
14
5
0.0
31
63
34
08
0
.02
84
19
25
7
0.0
11
00
10
49
0
.03
36
00
61
9
0.0
22
67
60
65
0
.01
81
26
90
7
B
0
.01
66
86
01
4
0.0
42
73
62
67
0
.04
26
15
59
3
0.0
17
31
64
67
0
.01
55
75
03
0
.01
51
97
28
2
0.0
23
72
61
54
C
0
.00
47
78
26
8
0.0
26
72
47
76
0
.02
38
46
65
4
0.0
09
18
52
56
0
.02
05
58
38
1
0.0
21
14
52
07
0
.00
81
11
05
8
D
0
.04
74
03
44
8
0.0
11
45
34
75
0
.01
47
54
61
9
0.0
07
93
63
45
0
.04
99
15
75
0
.03
76
51
07
3
0.0
37
56
20
49
E
0
.04
36
11
17
2
0.0
24
93
27
36
0
.03
06
25
80
3
0.0
15
73
09
69
0
.01
47
03
35
4
0.0
47
56
70
33
0
.04
19
15
85
6
F
0
.01
70
65
24
1
0.0
17
33
60
43
0
.01
74
66
27
8
0.0
08
11
34
95
0
.01
17
26
50
1
0.0
13
34
17
47
0
.02
14
55
05
7
G

Financial performance evaluation of seven Indian chemical companies
93
Table 4. TOPSIS ranking system results
Ranks cli+ (di+)+(di-) di- di+ Co. 6 0.317233465 0.142612596 0.045241488 0.097371108 A 4 0.476166445 0.161005577 0.076665453 0.084340124 B 3 0.495475692 0.160104742 0.079328008 0.080776734 C 5 0.38164729 0.158292269 0.060411816 0.097880454 D 2 0.520332447 0.160900794 0.083721904 0.07717889 E 1 0.526029684 0.168044337 0.08839631 0.079648027 F 7 0.308841556 0.144121922 0.044510839 0.099611083 G
4.3. Performance analysis based on financial data using DEA method
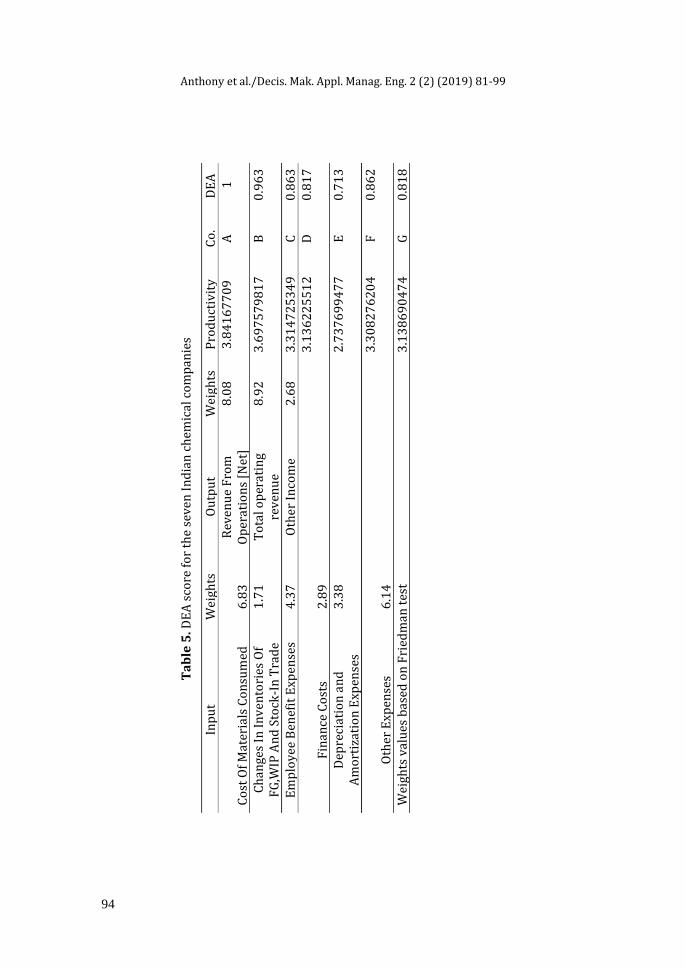
In many studies the financial performance evaluation ratios have been defined as asset turnover ratio (input/output), inventory turnover ratio (input/output), receivable accounts turnover ratio (input), quick ratio (input), current ratio (input), cash earned from set activities to company earning ratio (input), interest coverage ratio (input), total debt to equity ratio (input), debt ratio (input/output), earning per share ratio (output), return on assets ratio (output), net profit margin ratio (output), economic value added (output), growth rate of sales (output), growth rate of earnings per share (output), sustainable growth rate (output), price to earnings ratio (input/output), Tobin Q ratio (output). A study determined the universe of input/output parameters of introduced into DEA equations including return on equity, return on assets, net profit margin, earnings/share, receivables turnover, inventory turnover, current ratio, quick ratio, debt to equity ratio, leverage ratio, solvency ratios, price to earnings ratio, price to book ratio, revenue growth rate, net income growth rate and EPS growth rate (Edirisinghe and Zhang 2010). DEA is a non-statistical method methodology is used to measure performance in a relative manner and each producer unit or decision maker is compared to the best unit in that industry. Of course, the higher the number of units, the better the comparison and the more realistic results. Simple ratios do not lead to ranking and comparison of companies' performance, and multiple inputs and outputs in this field should be used. Also, through the method of DEA, there is no need for a definite form of production function as it is in the economy, and this technique can be used with minimal data. According to our knowledge, financial ratios and indicators make an ad hoc and a relative appraise of corporate performance, however, we know DEA can be employed to develop very complex investigations (Fenyves et al 2015). Table 5 shows the DEA score for the seven Indian chemical companies [This study].
Anthony et al./Decis. Mak. Appl. Manag. Eng. 2 (2) (2019) 81-99
94
Ta
ble
5. D
EA
sco
re f
or
the
sev
en I
nd
ian
ch
emic
al c
om
pan
ies
DE
A
C
o.
Pro
du
ctiv
ity
W
eigh
ts
Ou
tpu
t
Wei
ghts
In
pu
t
1
A
3.8
41
67
70
9
8.0
8
Rev
enu
e F
rom
O
per
atio
ns
[Net
]
6.8
3
Co
st O
f M
ater
ials
Co
nsu
med
0
.96
3
B
3.6
97
57
98
17
8
.92
T
ota
l op
erat
ing
rev
enu
e 1
.71
C
han
ges
In I
nv
ento
ries
Of
FG
,WIP
An
d S
tock
-In
Tra
de
0.8
63
C
3
.31
47
25
34
9
2.6
8
Oth
er I
nco
me
4
.37
E
mp
loy
ee B
enef
it E
xpen
ses
0.8
17
D
3
.13
62
25
51
2
2
.89
F
inan
ce C
ost
s 0
.71
3
E
2.7
37
69
94
77
3
.38
D
epre
ciat
ion
an
d
Am
ort
izat
ion
Exp
ense
s 0
.86
2
F
3.3
08
27
62
04
6.1
4
Oth
er E
xpen
ses
0.8
18
G
3
.13
86
90
47
4
Wei
ghts
val
ues
bas
ed o
n F
ried
man
tes
t

Financial performance evaluation of seven Indian chemical companies
95
4.4. Performance analysis based on financial data using COPRAS method
The criteria used for weighing by Entropy Shannon were encompassed; Revenue From Operations [Net] (1), Total Operating Revenues (2), Other Income (3), Cost Of Materials Consumed (4), Changes In Inventories Of FG,WIP And Stock-In Trade (5), Employee Benefit Expenses (6), Finance Costs (7), Depreciation and Amortization Expenses (8), Other Expenses (9). There are negative and positive relations among 9 aforementioned criteria. Therefore, the weighting and ranking systems were selected Entropy Shannon and COPRAS. Table 6 includes weighted values based on Entropy Shannon procedure.
Table 6. Weighted values based on Entropy Shannon procedure
Criteria E dj=1-Ej Wj ∑ 𝑑𝑗 K
1 1.995278628 -0.99527863 0.133719351 7.44304112- 0.5139
2 1.994522361 -0.99452236 0.133617744 3 1.817204902 -0.8172049 0.10979449 4 2.001968116 -1.00196812 0.134618108 5 0.776434672 0.223565328 -0.03003683 6 2.008943625 -1.00894363 0.135555294 7 1.946715084 -0.94671508 0.12719466 8 1.959818549 -0.95981855 0.128955159 9 1.942155183 -0.94215518 0.12658202
Table 7. The ranking system developed in COPRAS method
Co. Total revenue
Total expenses
Rank based on revenue score
Rank based on expenses score
A 35.44 131.94 3 2 B 13.75 44.2 6 4 C 57.04 291.766 2 1 D 14.3 29.67 5 7 E 15.12 38.7 4 5 F 11.44 31.23 7 6 G 84.089 53.883 1 3
It was found a significant difference about 0.012 between total revenue and total expenses values (between seven industries) in Table 7 according to the t-test analysis.
4.5. The relationship between the weights values obtained from the Friedman test
and Entropy Shannon
It was conducted a scatter plot for the data of weights values obtained from the Friedman test and Entropy Shannon base on the results of profit & loss accounts according to Figure 1.

Anthony et al./Decis. Mak. Appl. Manag. Eng. 2 (2) (2019) 81-99
96
Figure 1. Scatter plot developed for the weights values obtained from the Friedman
test and Entropy Shannon
According to the t-teat analysis, there is no significant difference between the weights values obtained from the Friedman test and Entropy Shannon. Moreover, the scatter plot is representing that there is a relatively linear relationship between both weight values obtained from Friedman test and Entropy Shannon with receding the weight values associated to a criterion of changes in inventories of FG, WIP and stock-in-trade.
5. Conclusion
By the present study, we tried to figure out the efficiency of seven Indian industries. The obtained results for the efficiency of industries were approached to full efficiency of industries in most cases. The statistical analysis revealed significant differences among the data of industries. The Friedman test has provided valuable weights for raw values. The Entropy Shannon weighting system has provided the positive and negative weights for existing values and also sought the highest consistency with the COPRAS ranking system. By the way, the COPRAS ranking system had classified industries based on negative and positive criteria (expenses and revenues). The TOPSIS procedure ranked the industries based on the available ratio analysis and it has emerged a good agreement among the industries ratio values. The profit and loss analysis made clear the output incomes and input expenses. Also, it resulted in output and input criteria for introducing into the DEA model. The findings based on the COPRAS model predict the situation of industries for the further financial statement concept. With regard to a rise in the expenses, the ranking system for the income will be taken lots of fluctuations.
Acknowledgement: This research was conducted as corresponding author PhD research work. I would like to extend my thanks to the managers and colleagues in
-0.04
-0.02
0
0.02
0.04
0.06
0.08
0.1
0.12
0.14
0.16
0.002.004.006.008.0010.00

Financial performance evaluation of seven Indian chemical companies
97
Osmania University because of their support in offering and collecting the data and resources in running the program.
References
Ahmadi, V. & Ahmadi A. (2012). Application of Data Envelopment Analysis in manufacturing industries of Iran. Interdisciplinary journal of contemporary research in business, 4(8), 534-544.
Amini A. & Alinezhad A. (2016). A combined evaluation method to rank alternatives based on VIKOR and DEA with belief structure under uncertainty. Iranian Journal of Optimization, 8(2), 111-122.
Andekina R. & Rakhmetova R. (2013). Financial Analysis and Diagnostics of the Company. Procedia Economics and Finance, 5, 50–57.
Arab, R.O., Masoumi S.S. & Asoumi, B.A. (2015). Financial Performance of the Steel Industry in India: A Critical Analysis. Middle-East Journal of Scientific Research, 23(6), 1085-1090.
Bagh, T., Nazir, M.I., Khan, M.A., Khan, M.A. & Razzaq, S. (2016). The Impact of Working Capital Management on Firms Financial Performance: Evidence from Pakistan. International journal of Economic and Finance, 6(3), 1097-1105.
Bayyurt, N. & Duzu, G. (2008). Performance Measurement of Turkish and Chinese Manufacturing Firms: A Comparative Analysis. Eurasian Journal of Business and Economics, 1(2), 71-83.
Bulak, M. E. & Turkyilmaz, A. (2014). Performance assessment of manufacturing SMEs: a frontier approach. Industrial Management & Data Systems, 114(5), 797-816.
Bulgurcu B. (2012). Application of TOPSIS Technique for Financial Performance Evaluation of Technology Firms in Istanbul Stock Exchange Market. Procedia - Social and Behavioral Sciences. 62, 1033–1040.
Bulgurcu, B.K. (2012). Application of TOPSIS Technique for Financial Performance Evaluation of Technology Firms in Istanbul Stock Exchange Market. Procedia - Social and Behavioral Sciences, 62, 1033–1040.
Edirisinghe, N.C.P. & Zhang. X. (2010). Input/output selection in DEA under expert information, with application to financial markets. European Journal of Operational Research, 207, 1669–1678.
Eisinga, R., Heskes, T., Pelzer, B. & Te Grotenhuis, M. (2017). Exact p-values for pairwise comparison of Friedman rank sums, with application to comparing classifiers. BMC Bioinformatics, 18(68), 2-18.
Fenyves, V., Tarnóczi, T. & Zsidó, K. (2015). Financial Performance Evaluation of agricultural enterprises with DEA Method. Procedia Economics and Finance, 32, 423 – 431.
Fenyves, V., Tarnóczi, T. & Zsidóa, K. (2015). Financial Performance Evaluation of agricultural enterprises with DEA method. International Journal of Procedia Economics and Finance, 32, 423 – 431.
Anthony et al./Decis. Mak. Appl. Manag. Eng. 2 (2) (2019) 81-99
98
Feroz, E.H., Kim, S. & Raab, R.L. (2017). Financial Statement Analysis: A Data Envelopment Analysis Approach. Journal of the Operational Research Society, 54, 48-58.
Karamidou, J., Mimis, A. & Pappa, E. (2011). Estimating Technical and Scale Efficiency of Meat Products Industry: The Greek Case. Journal of Applied Science, 11(6), 971-979.
Kettiramalingam, A.Y., Sowmiya, K. & Sangeetha, P. (2017). Financial performance analysis of select cement companies. Intercontinental journal of finance research, 5(4), 15-27.
Kumar, S. & Bhatia, G.K. (2014). Financial Performance of Indian Automobile Companies after Liberalization: A Comparative Study of Maruti Suzuki and Tata Motors International Journal of Advanced Research in Management and Social Sciences, 3(9), 50-55.
Lu, W.-M., Wang, W.-K. & Kweh, Q. L. (2014). Intellectual capital and performance in the Chinese life insurance industry. Omega, 42, 65–74.
Margineana, R., Mihaltan, D.C. & Todea, N. (2015). Structure ratios of Profit and Loss Account – source of information for performance analysis. Procedia Economics and Finance, 26, 396–403.
Rahimi I, Behmanesh R, Mohd R. Yusuff MR. (2013). A Hybrid Method for Prediction and Assessment Efficiency of Decision Making Units: Real Case Study: Iranian Poultry Farms. International Journal of Decision Support System Technology, 5(1), 1-18.
Rahmani, M. (2017). A productivity analysis of Iranian industries using an additive data envelopment analysis. Management Science Letters, 7, 197–204.
Raithatha, M. & Komera, S. (2016). Executive compensation and firm performance: Evidence from Indian firms. IIMB Management Review, 28, 160–169.
Rezaee, M.J. & Ghanbarpour, T. (2016). Energy Resources Consumption Performance in Iranian Manufacturing Industries Using Cost/Revenue Efficiency Model. IJE Transactions C: Aspects, 29(9), 1282-1291.
Rodríguez-Pérez G., Slof, J., Solà, M., Torrent, M. & Vilardell, I. (2011). Assessing the Impact of Fair-Value Accounting on Financial Statement Analysis: A Data Envelopment Analysis Approach. ABACUS, 47(1), 14-20.
Saranga, H. & Nagpal, R. (2016). Drivers of operational efficiency and its impact on market performance in the Indian Airline industry. Journal of Air Transport Management, 53, 165-176.
Sena, P., Roy, M. & Pal, P. (2017). Evaluation of environmentally conscious manufacturing programs using a three-hybrid multi-criteria decision analysis method. International Journal of Ecological Indicators, 73, 264–273.
Sinha, R. P. (2015). A Dynamic DEA Model for Indian Life Insurance Companies. Global Business Review, 16(2) 1-12.
Tehrani, R., Mehragan, M.R. & Golkani, M.R. (2012). A Model for Evaluating Financial Performance of Companies by Data Envelopment Analysis. International Business Research, 5(8), 20-31.

Financial performance evaluation of seven Indian chemical companies
99
Xavier, J.M., Moutinho, V.F. & Moreira, A.C. (2015). An empirical examination of performance in the clothing retailing in-dustry: A case study. Journal of Retailing and Consumer Services, 25, 96–105.
Yalcin, N., Bayrakdaroglu, A. & Kahraman, C. (2012). Application of fuzzy multi-criteria decision-making methods for financial performance evaluation of Turkish manufacturing industries. Expert Systems with Applications, 39, 350–364.
Zavadskas, E.K., & Turskis, Z. (2008). A new logarithmic normalization method in games theory. Informatica, 19(2), 303-314.
© 2018 by the authors. Submitted for possible open access publication under the
terms and conditions of the Creative Commons Attribution (CC BY) license
(http://creativecommons.org/licenses/by/4.0/).


![nss,sssssnssss sssssssssssssssssssssssssssss ...ekladata.com/a6f3QoLBd_95hHcCrUoyBSAgCzM/ABBA-Gold-Greates… · 37] a aaa a aa a.a aaa a aa a aa a aaaaa aa a. 30] 0 1 a f aa a a](https://img.pdfslide.net/doc/110x75/606c4a5e6aac720add62c132/nsssssssnssss-sssssssssssssssssssssssssssss-37-a-aaa-a-aa-aa-aaa-a-aa-a-aa.jpg)