Embed Size (px)
Citation preview
AA British Insurance Premium Index
© Automobile Association Insurance Services Limited 2017 Page 1
AA British Insurance Premium Index – 2017 quarter 2 24 July 2017
The AA British Insurance Premium Index (Index) has been tracking the quarterly movement of car and home insurance since 1994. It measures the five cheapest quotes for each 'customer' to provide an average or Shoparound index.
Motor insurance premiums 2
Home insurance premiums 6
Index motor insurance trends since 1994 9
Index home insurance trends since 1994 10
Media contact
Ian Crowder
01256 492 844 – [email protected]
The information in the Index may only be used internally by the business (Internal Business Use) on the following terms. Internal Business Use means use of the information contained in the Index in reports and submissions – that do not carry advertising – in internal business activities. It specifically excludes any commercial use and exploitation including any use whereby the user obtains direct or indirect revenue, for example as part of any publishing activity, promotion, marketing or advertising. The AA copyright notice must be displayed on all such information. Press journalists may use the Index for editorial purposes without prior permission.
Any use of the Index other than as above is not permitted without the prior written consent of the AA (contact details above).
The AA excludes all implied warranties and conditions to the fullest extent permitted by law. The AA does not in any way warrant the accuracy or completeness of the Index, and by using the Index the user acknowledges that it is relying upon its own skill in determining its suitability for any general or specific purpose and accepts that the Index may not be error free.
Automobile Association Insurance Services Limited is authorised and regulated by the Financial Conduct Authority (FCA).
AA British Insurance Premium Index
© Automobile Association Insurance Services Limited 2017 Page 2
Motor insurance premiums – 2017 quarter 2
Car insurance misery piles up for drivers
• AA Index shows premiums at highest level for 23 years
• Premiums rise nearly 20% over 12 months
• Discount rate hits young drivers hardest
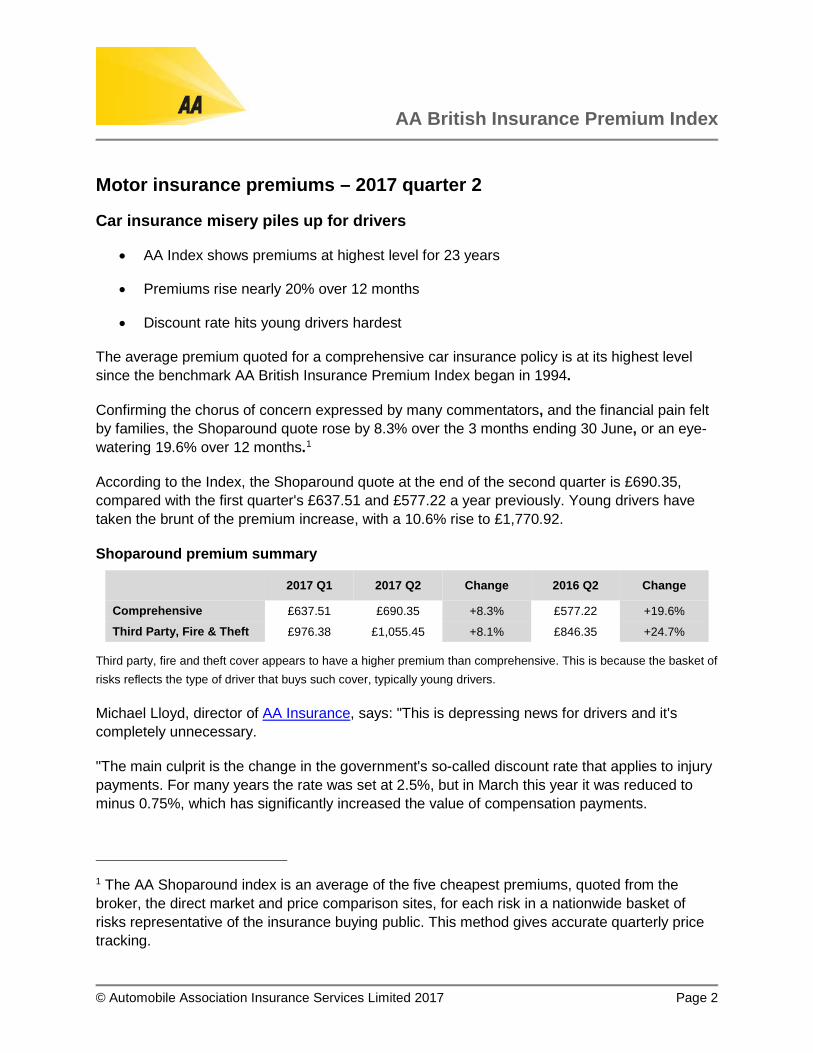
The average premium quoted for a comprehensive car insurance policy is at its highest level since the benchmark AA British Insurance Premium Index began in 1994.
Confirming the chorus of concern expressed by many commentators, and the financial pain felt by families, the Shoparound quote rose by 8.3% over the 3 months ending 30 June, or an eye-watering 19.6% over 12 months.1
According to the Index, the Shoparound quote at the end of the second quarter is £690.35, compared with the first quarter's £637.51 and £577.22 a year previously. Young drivers have taken the brunt of the premium increase, with a 10.6% rise to £1,770.92.
Shoparound premium summary
2017 Q1 2017 Q2 Change 2016 Q2 Change
Comprehensive £637.51 £690.35 +8.3% £577.22 +19.6%
Third Party, Fire & Theft £976.38 £1,055.45 +8.1% £846.35 +24.7%
Third party, fire and theft cover appears to have a higher premium than comprehensive. This is because the basket of risks reflects the type of driver that buys such cover, typically young drivers.
Michael Lloyd, director of AA Insurance, says: "This is depressing news for drivers and it's completely unnecessary.
"The main culprit is the change in the government's so-called discount rate that applies to injury payments. For many years the rate was set at 2.5%, but in March this year it was reduced to minus 0.75%, which has significantly increased the value of compensation payments.
1 The AA Shoparound index is an average of the five cheapest premiums, quoted from the broker, the direct market and price comparison sites, for each risk in a nationwide basket of risks representative of the insurance buying public. This method gives accurate quarterly price tracking.
AA British Insurance Premium Index
© Automobile Association Insurance Services Limited 2017 Page 3
"The discount rate is based on returns from government bonds and was overdue for review, but it was slashed by a much larger margin than anyone expected.
"The increase in compensation applied immediately to both lump sum payouts, which can run to millions of pounds for very serious injuries, and lifetime Periodic Payment Orders for life-changing injuries. As a result, many insurers found themselves facing immediate financial losses because of the much larger reserves needed to meet future claims.
"Because young drivers are responsible for the greatest number and the highest cost of injury claims, their premiums have taken the brunt of the rises."
Increases in Insurance Premium Tax (IPT) and the continuing scandal of whiplash injury claims, encouraged by cold-calling law firms, have also contributed to the rises.
"Yet the insurance industry remains extremely competitive, and to a certain extent that has contributed to the sharp rises we see today. The culture of comparing prices online, which is the subject of a Competition and Markets Authority investigation, has led insurers to offer unprofitable introductory rates to attract new business. That has been underlined by recent research suggesting that for every £100 taken in premiums, insurers are now paying out £109 in claims and costs.2
"That is clearly unsustainable," says Lloyd.
"Insurers now show the previous year's premium on renewal notices, which is welcome transparency for customers, but is leading to more shopping around. This in turn is likely to force insurers to increase premiums to new customers.3
"We are in a sharp upward price spiral, and that will continue until competitive pressure once again forces premiums downward – but that is some way off."
Lloyd says that the spiralling premiums should wake up the government to reverse decisions that have hit hard-working families hard in the pocket.
Continued
2 The AA has contributed to the CMA’s ‘Digital Comparison Tools Market Study’, for which written submissions closed in April 2017.
Ernst & Young, Motor insurance insights: facts, figures and predictions, 22 June 2017.
3 On 1 April 2017 new Financial Conduct Authority (FCA) rules came into effect to increase transparency and engagement at renewal in general insurance markets. This included showing the previous premium on renewal notices.
AA British Insurance Premium Index
© Automobile Association Insurance Services Limited 2017 Page 4
"The government hadn't thought through the consequences of slashing the discount rate. They promised a review, but the general election got in the way and I strongly urge them now to listen to the industry and do something about it.
"I also fear that the Chancellor of the Exchequer may once again target IPT in the Autumn Statement, as a quick win to fill some of the government's fiscal holes. Instead, I urge them to at least freeze the current rate, and consider dropping IPT completely for young drivers who demonstrate responsibility by using telematics insurance.
"Otherwise there is a serious risk that young drivers will take drastic measures such as driving uninsured or getting parents to front their policies.
"And the sooner the government can implement its plans to stamp on the shameful cold-calling firms milking the industry, reintroduced for the third time in the recent Queen's Speech, the better it will be for all of us."
Winners and losers
Shoparound by region
Anglia saw the biggest jump, rising by 11% to £677.14 over the quarter. Scotland remains the cheapest region to insure a car even though it saw the second-biggest premium increase, of 10.3% to £524.31.The smallest increase was in Northern Ireland, up 3.5% to £952.92, but still the highest Shoparound quote. Next most costly is Granada (the north-west), which saw an increase of 7.0% to £937.02 over the 3 months.
Shoparound by age
Male and female drivers can expect the same premium if all other elements of the quote are identical (car, mileage, occupation, address, driving record). Men are nevertheless on average quoted a higher Shoparound premium than women due to other factors. Thus according to the Index, men aged 17–22 can expect to pay £280 more than women in the same age group.
Young drivers had the biggest hit over the quarter (up 10.6% to £1,770.92) due to the discount rate for injury claims. The lowest average increase is for those aged 70 and over, who saw their premiums rise by 6.6% to £580.97. Despite recent media interest suggesting the contrary, older drivers remain significantly less likely to be involved in a serious crash than young drivers.
Continued
AA British Insurance Premium Index
© Automobile Association Insurance Services Limited 2017 Page 5
Motor insurance premiums – summary tables and charts 2017 Q2
Download the Index (Excel file) for motor insurance
2,800 risks for car insurance
AA British Insurance Premium Index – Motor insurance trends since 1994 (chart)
All channels combined
Motor insurance Shoparound premium movements (chart)
Motor insurance Shoparound premium movements (table)
Motor insurance Shoparound premium movements – region and age (tables)
Comprehensive insurance Shoparound premium trend (chart)
Third-party insurance Shoparound premium trend (chart)
AA British Insurance Premium Index
© Automobile Association Insurance Services Limited 2017 Page 6
Home insurance premiums – 2017 quarter 2
Premiums are edging upwards, says AA Index
• Increase wholly attributable to Insurance Premium Tax
• Weak pound, higher costs and fraud will lead to further rises
Following a flat first quarter and last year's falling trend, the average quoted premiums for home insurance have now started to rise, according to the benchmark AA British Insurance Premium Index.
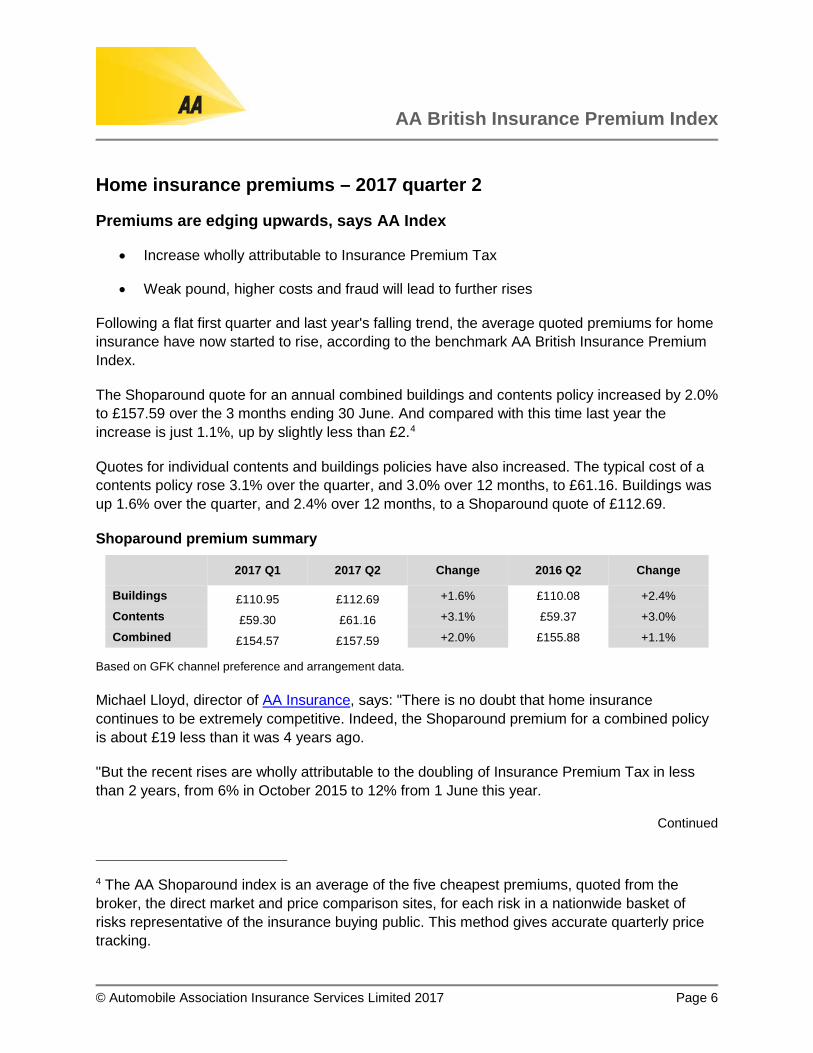
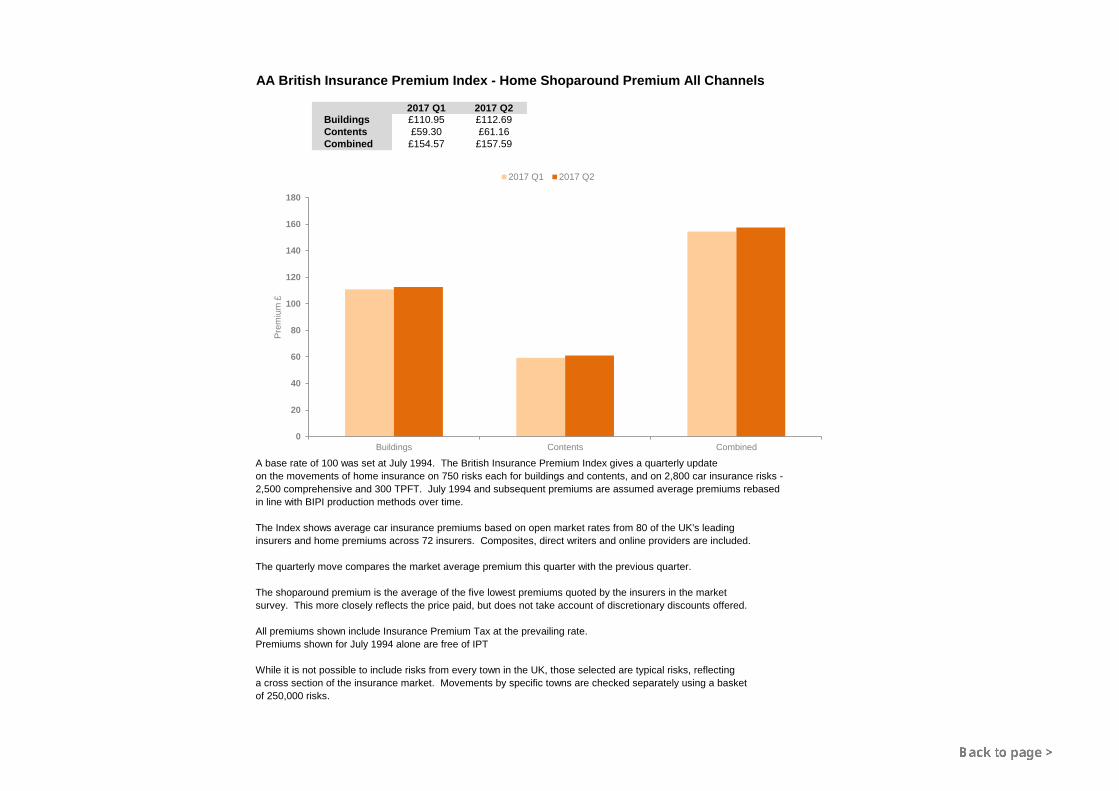
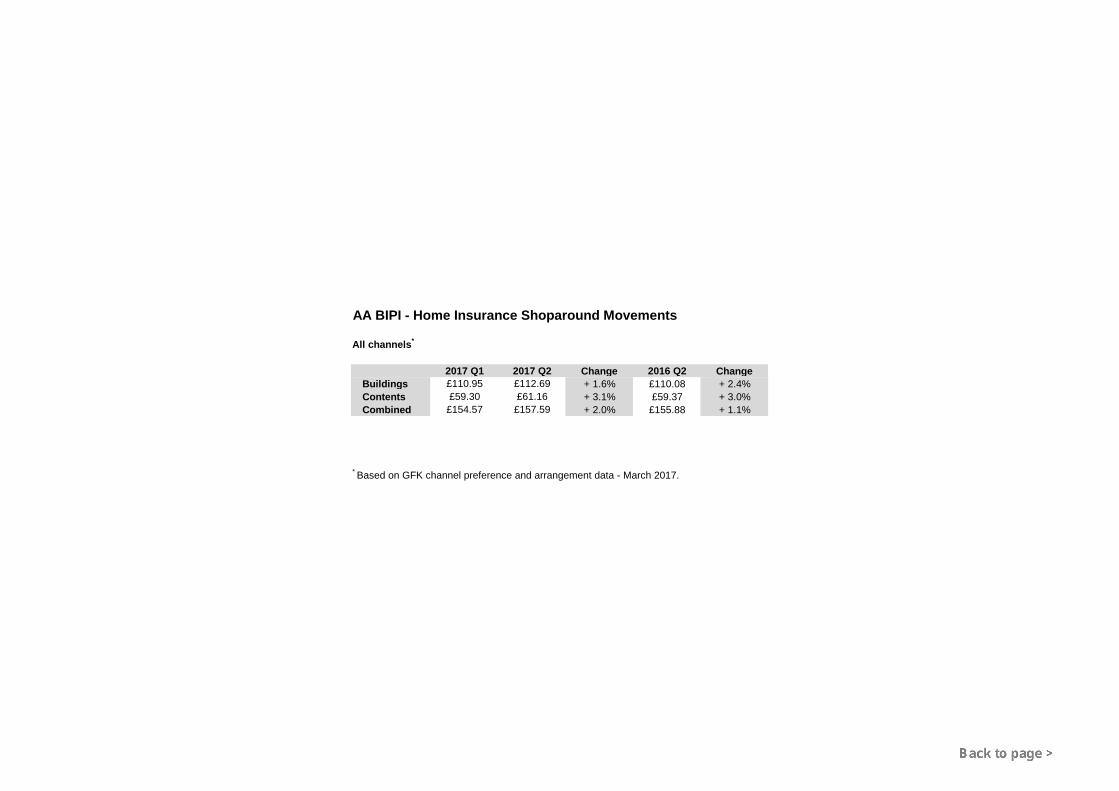
The Shoparound quote for an annual combined buildings and contents policy increased by 2.0% to £157.59 over the 3 months ending 30 June. And compared with this time last year the increase is just 1.1%, up by slightly less than £2.4
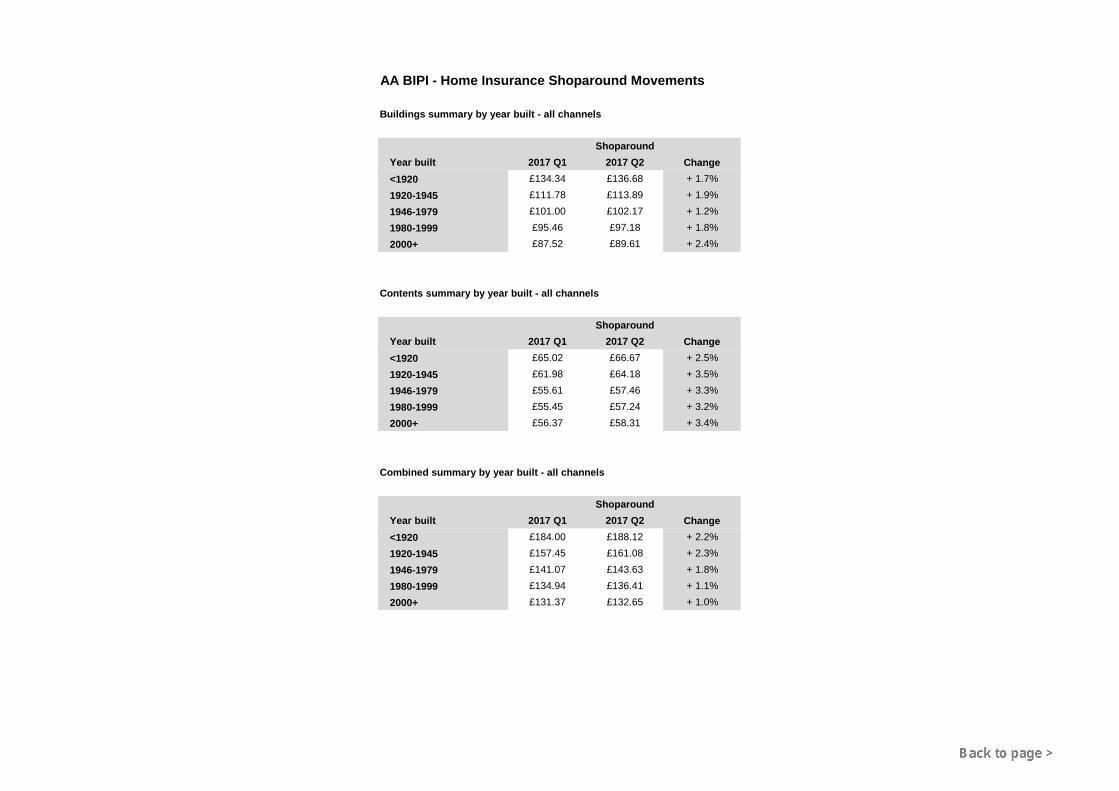
Quotes for individual contents and buildings policies have also increased. The typical cost of a contents policy rose 3.1% over the quarter, and 3.0% over 12 months, to £61.16. Buildings was up 1.6% over the quarter, and 2.4% over 12 months, to a Shoparound quote of £112.69.
Shoparound premium summary
2017 Q1 2017 Q2 Change 2016 Q2 Change
Buildings £110.95 £112.69 +1.6% £110.08 +2.4%
Contents £59.30 £61.16 +3.1% £59.37 +3.0%
Combined £154.57 £157.59 +2.0% £155.88 +1.1%
Based on GFK channel preference and arrangement data.
Michael Lloyd, director of AA Insurance, says: "There is no doubt that home insurance continues to be extremely competitive. Indeed, the Shoparound premium for a combined policy is about £19 less than it was 4 years ago.
"But the recent rises are wholly attributable to the doubling of Insurance Premium Tax in less than 2 years, from 6% in October 2015 to 12% from 1 June this year.
Continued
4 The AA Shoparound index is an average of the five cheapest premiums, quoted from the broker, the direct market and price comparison sites, for each risk in a nationwide basket of risks representative of the insurance buying public. This method gives accurate quarterly price tracking.
AA British Insurance Premium Index
© Automobile Association Insurance Services Limited 2017 Page 7
"The Treasury has pointed out that IPT is higher in other European countries such as France and Germany. But I fear that there will be a further increase in the Autumn Statement to prop up the government's crumbling finances.
"This is a sneaky tax that punishes people who rightly protect their homes and cars.
"And there is an important difference between the UK and Europe. Most countries' IPT pays for regulation of the insurance industry. But in the UK insurers are expected to pay direct for their own regulation and pay IPT, which apart from just 0.5% used to help finance flood defences goes straight into the Treasury coffers."
Yet while competitive pressure is keeping premium increases to a minimum, the AA believes that the weaker pound is putting pressure on home insurers, as well as rising rebuilding and repair costs, and fraud. Analysis of the home insurance industry has suggested that costs are rising faster than premiums, which in the long term is unsustainable.5
Adds Lloyd: "While I don't expect the steep increases we are seeing with car insurance, I believe that home premiums will continue their gradual upward trend."
It is now a decade since the disastrous floods of summer 2007, which led to over £3 billion in claims, causing home insurance premiums to rise by more than 20% over the following months. Lloyd says that it would take similarly catastrophic weather to again prompt sharp home premium rises.
He says: "Over the past 10 years there has been considerable investment in flood alleviation schemes. And the launch of Flood Re has helped to bring affordable insurance to those whose homes are most at risk of flooding. But with the consequences of climate change ahead, there is no room for complacency."
Winners and losers
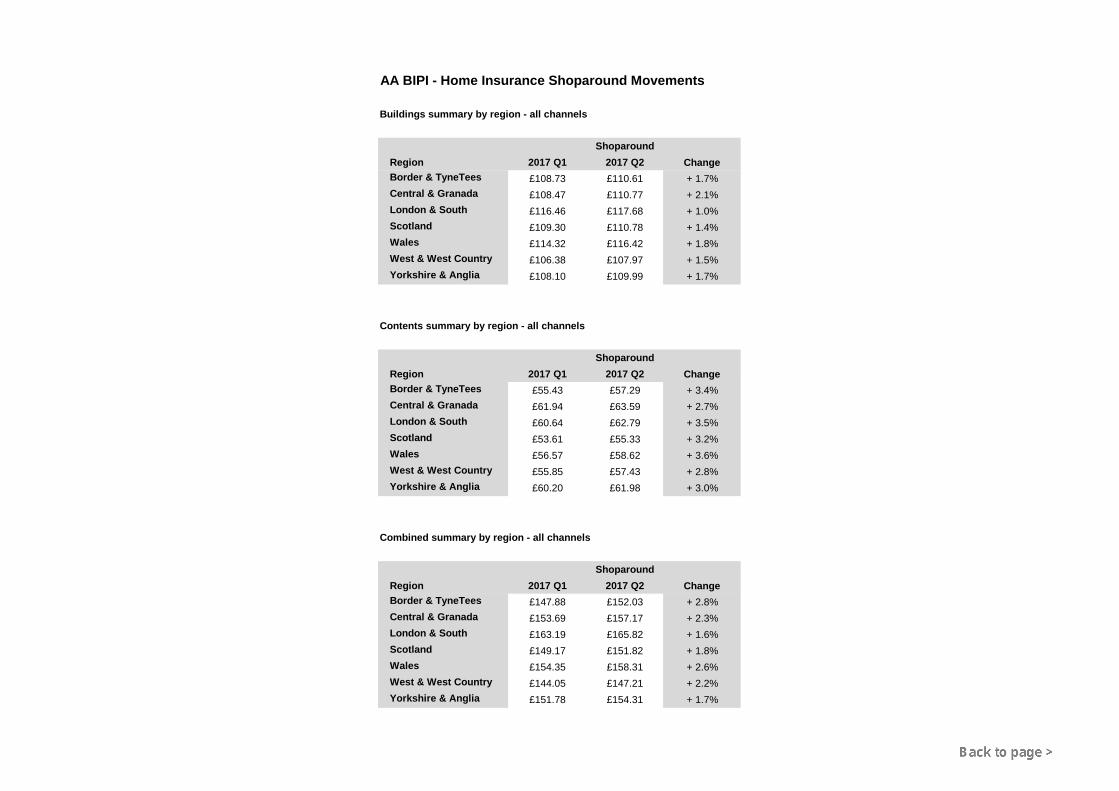
Shoparound by region – combined buildings and contents policy
The region that has seen the largest increase in home insurance premiums for a typical combined home and contents policy is Border and Tyne-Tees; on average the Shoparound quote increased by 2.8% to £152.03. The most costly region to insure a home remains London and the south-east, where premiums increased by 1.6% to a Shoparound quote of £165.82. The West Country enjoys the lowest premium at £147.21, despite a 2.2% increase over the second quarter of 2017.
Continued
5 Ernst & Young, Annual Home Insurance report, December 2016.
AA British Insurance Premium Index
© Automobile Association Insurance Services Limited 2017 Page 8
Home insurance premiums – summary tables and charts 2017 Q2
Download the Index (Excel file) for home insurance:
750 risks for home insurance
AA British Insurance Premium Index - Home insurance trends since 1994 (chart)
All channels combined
Home insurance Shoparound premium movements (chart)
Home insurance Shoparound premium movements (table)
Home insurance Shoparound premium movements – region (tables)
Home insurance Shoparound premium movements – age (tables)
Home insurance Shoparound premium movements – property type (tables)
Home insurance Shoparound premium movements – year built (tables)
Buildings insurance Shoparound premium trend (chart)
Contents insurance Shoparound premium trend (chart)
Buildings and contents insurance Shoparound premium trend (chart)
0
50
100
150
200
250
300
350
400
450
500
550
600
Month 1995Q1
1996Q1
1997Q1
1998Q1
1999Q1
2000Q1
2001Q1
2002Q1
2003Q1
2004Q1
2005Q1
2006Q1
2007Q1
2008Q1
2009Q1
2010Q1
2011Q1
2012Q1
2013Q1
2014Q1
2015Q1
2016Q1
2017Q1
Inde
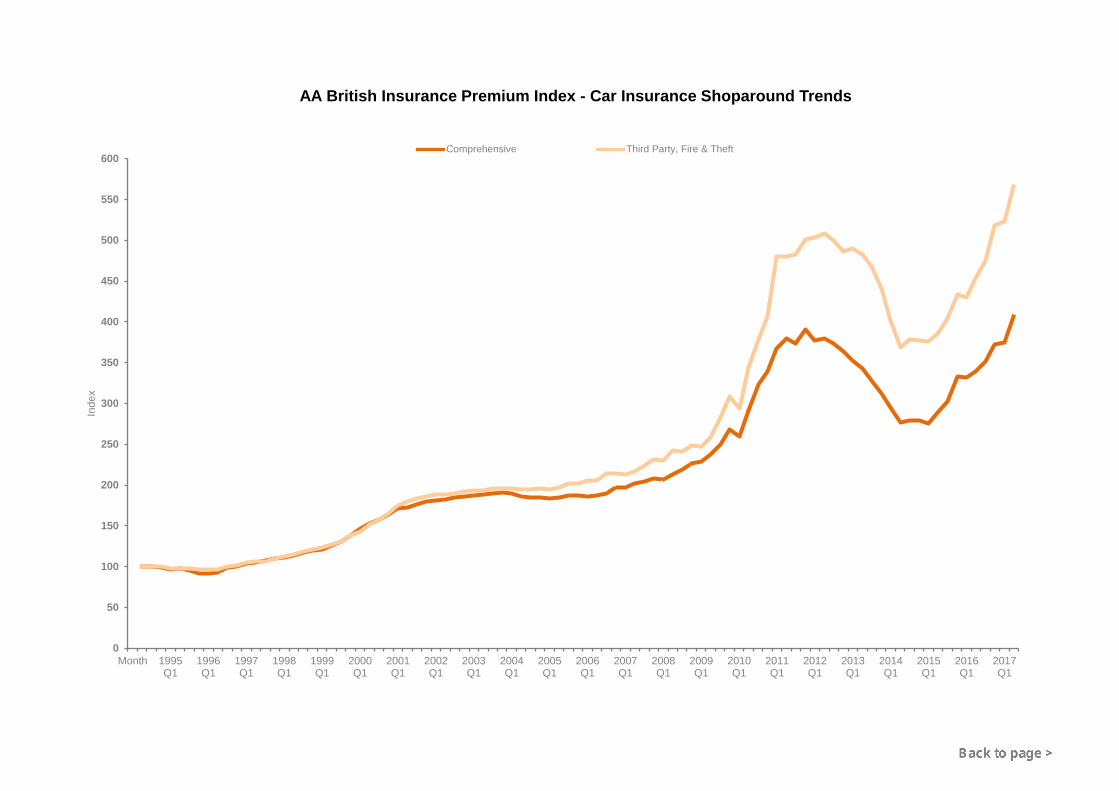
xAA British Insurance Premium Index - Car Insurance Shoparound Trends
Comprehensive Third Party, Fire & Theft
0
50
100
150
Month 1995Q1
1996Q1
1997Q1
1998Q1
1999Q1
2000Q1
2001Q1
2002Q1
2003Q1
2004Q1
2005Q1
2006Q1
2007Q1
2008Q1
2009Q1
2010Q1
2011Q1
2012Q1
2013Q1
2014Q1
2015Q1
2016Q1
2017Q1
Inde
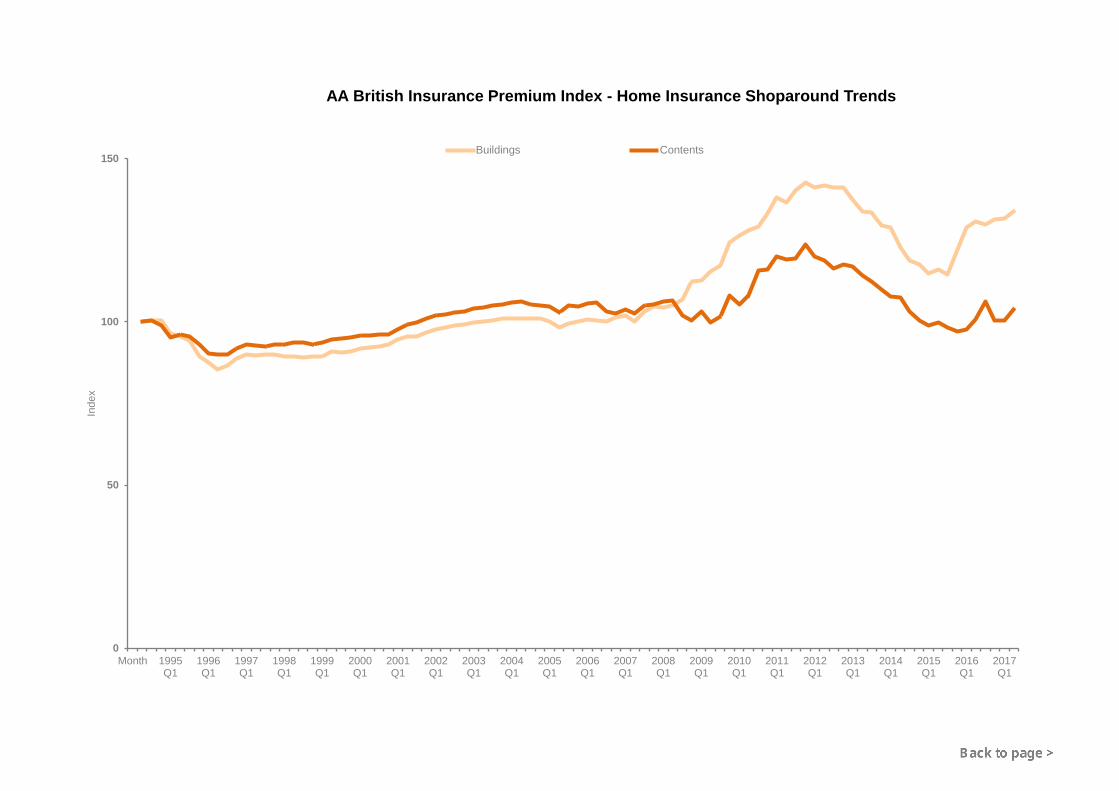
xAA British Insurance Premium Index - Home Insurance Shoparound Trends
Buildings Contents
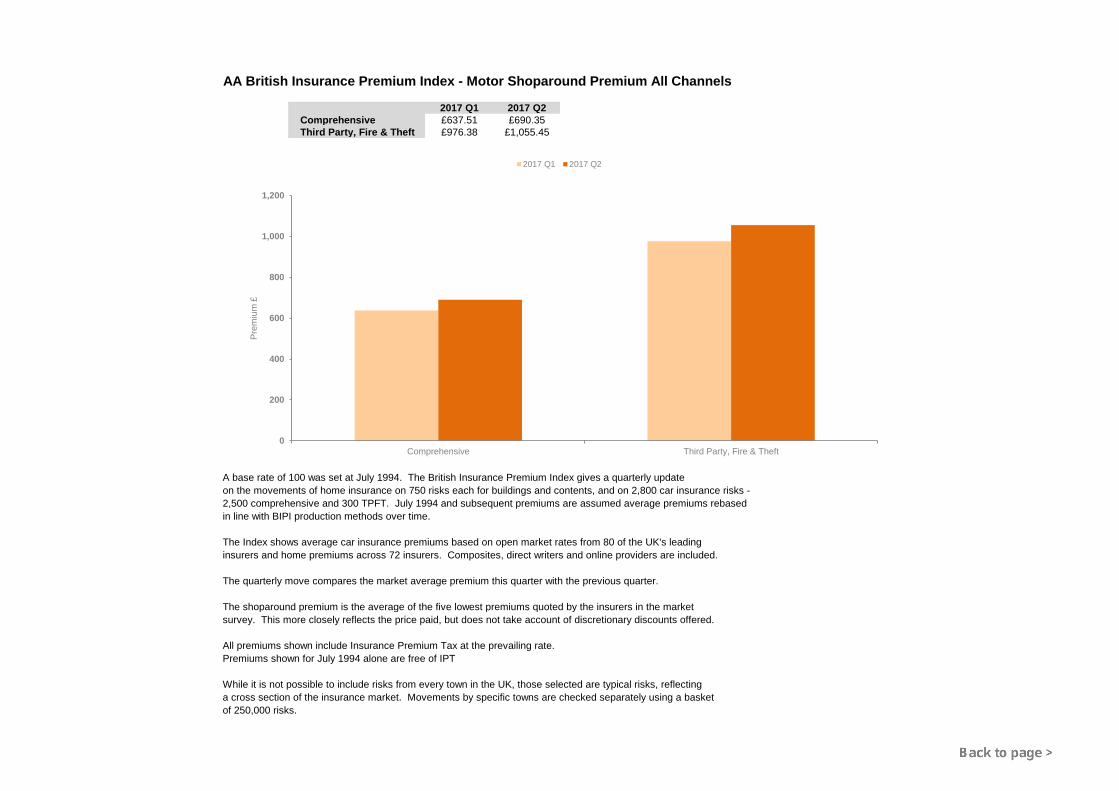
AA British Insurance Premium Index - Motor Shoparound Premium All Channels
2017 Q1 2017 Q2Comprehensive £637.51 £690.35Third Party, Fire & Theft £976.38 £1,055.45
A base rate of 100 was set at July 1994. The British Insurance Premium Index gives a quarterly update on the movements of home insurance on 750 risks each for buildings and contents, and on 2,800 car insurance risks - 2,500 comprehensive and 300 TPFT. July 1994 and subsequent premiums are assumed average premiums rebased in line with BIPI production methods over time.
The Index shows average car insurance premiums based on open market rates from 80 of the UK's leadinginsurers and home premiums across 72 insurers. Composites, direct writers and online providers are included.
The quarterly move compares the market average premium this quarter with the previous quarter.
The shoparound premium is the average of the five lowest premiums quoted by the insurers in the marketsurvey. This more closely reflects the price paid, but does not take account of discretionary discounts offered.
All premiums shown include Insurance Premium Tax at the prevailing rate.Premiums shown for July 1994 alone are free of IPT
While it is not possible to include risks from every town in the UK, those selected are typical risks, reflectinga cross section of the insurance market. Movements by specific towns are checked separately using a basketof 250,000 risks.
0
200
400
600
800
1,000
1,200
Comprehensive Third Party, Fire & Theft
Prem
ium
£
2017 Q1 2017 Q2
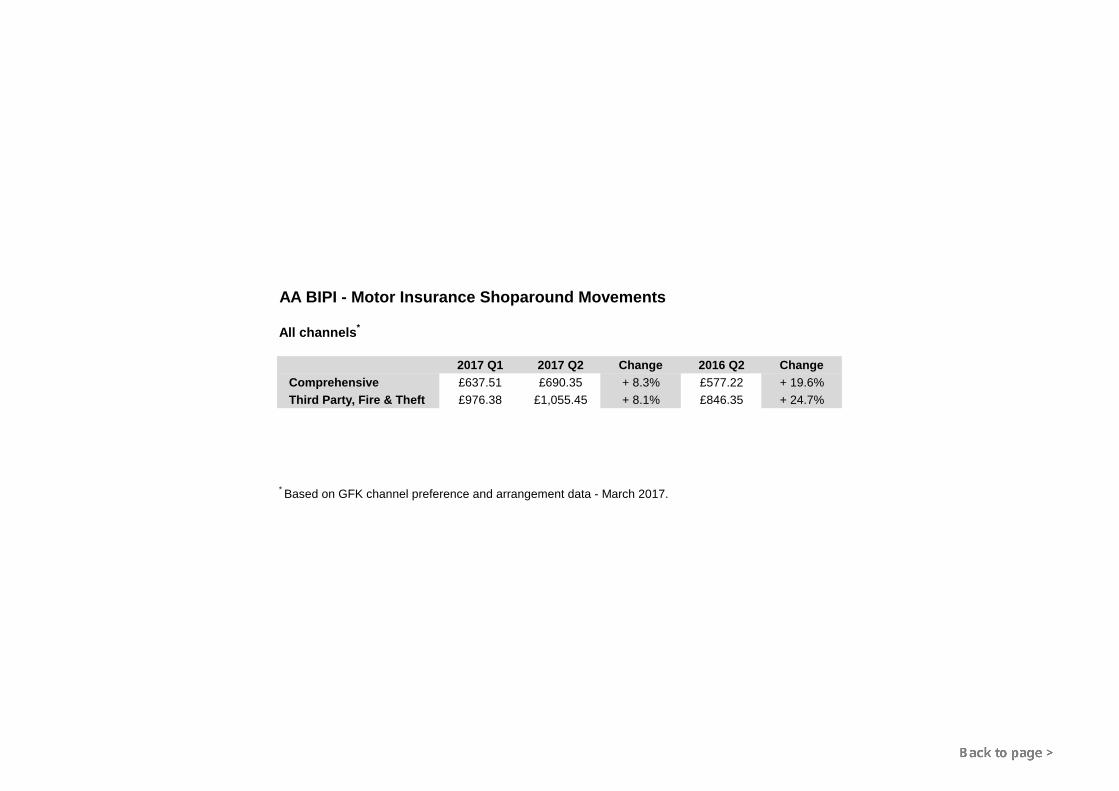
AA BIPI - Motor Insurance Shoparound Movements
All channels*
2017 Q1 2017 Q2 Change 2016 Q2 ChangeComprehensive £637.51 £690.35 + 8.3% £577.22 + 19.6%Third Party, Fire & Theft £976.38 £1,055.45 + 8.1% £846.35 + 24.7%
* Based on GFK channel preference and arrangement data - March 2017.
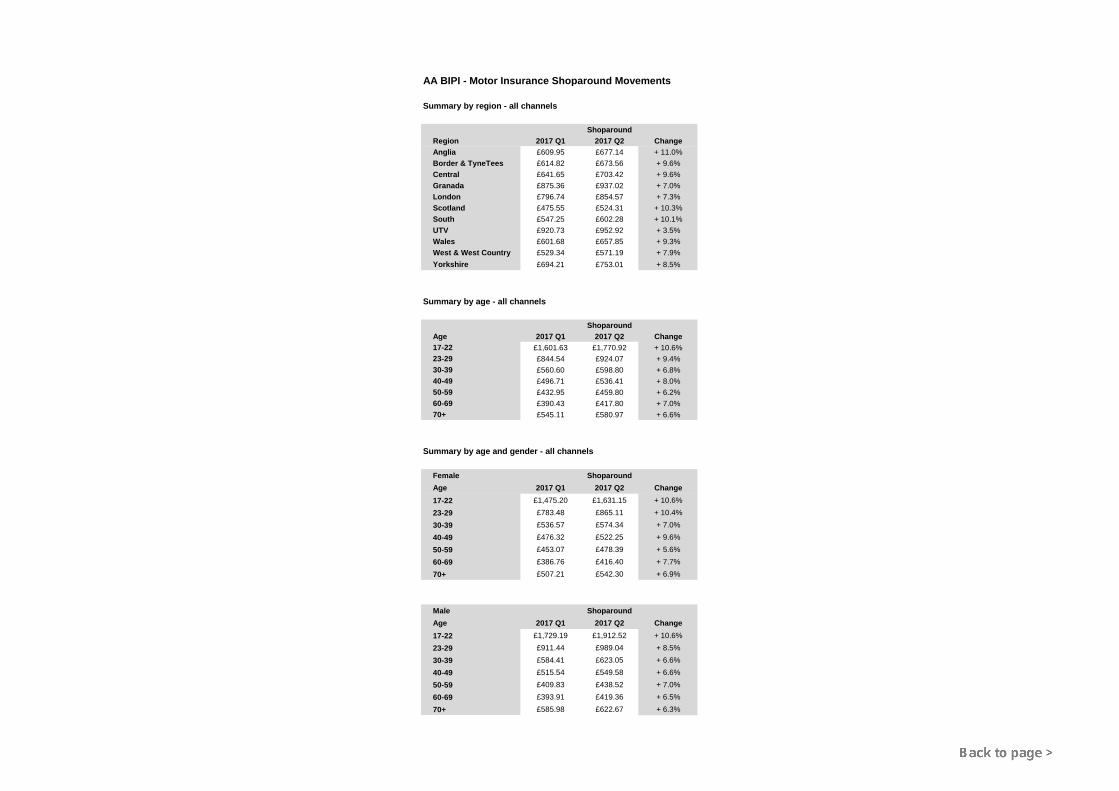
AA BIPI - Motor Insurance Shoparound Movements
Summary by region - all channels
ShoparoundRegion 2017 Q1 2017 Q2 ChangeAnglia £609.95 £677.14 + 11.0%Border & TyneTees £614.82 £673.56 + 9.6%Central £641.65 £703.42 + 9.6%Granada £875.36 £937.02 + 7.0%London £796.74 £854.57 + 7.3%Scotland £475.55 £524.31 + 10.3%South £547.25 £602.28 + 10.1%UTV £920.73 £952.92 + 3.5%Wales £601.68 £657.85 + 9.3%West & West Country £529.34 £571.19 + 7.9%Yorkshire £694.21 £753.01 + 8.5%
Summary by age - all channels
ShoparoundAge 2017 Q1 2017 Q2 Change17-22 £1,601.63 £1,770.92 + 10.6%23-29 £844.54 £924.07 + 9.4%30-39 £560.60 £598.80 + 6.8%40-49 £496.71 £536.41 + 8.0%50-59 £432.95 £459.80 + 6.2%60-69 £390.43 £417.80 + 7.0%70+ £545.11 £580.97 + 6.6%
Summary by age and gender - all channels
Female ShoparoundAge 2017 Q1 2017 Q2 Change17-22 £1,475.20 £1,631.15 + 10.6%23-29 £783.48 £865.11 + 10.4%30-39 £536.57 £574.34 + 7.0%40-49 £476.32 £522.25 + 9.6%50-59 £453.07 £478.39 + 5.6%60-69 £386.76 £416.40 + 7.7%70+ £507.21 £542.30 + 6.9%
Male ShoparoundAge 2017 Q1 2017 Q2 Change17-22 £1,729.19 £1,912.52 + 10.6%23-29 £911.44 £989.04 + 8.5%30-39 £584.41 £623.05 + 6.6%40-49 £515.54 £549.58 + 6.6%50-59 £409.83 £438.52 + 7.0%60-69 £393.91 £419.36 + 6.5%70+ £585.98 £622.67 + 6.3%
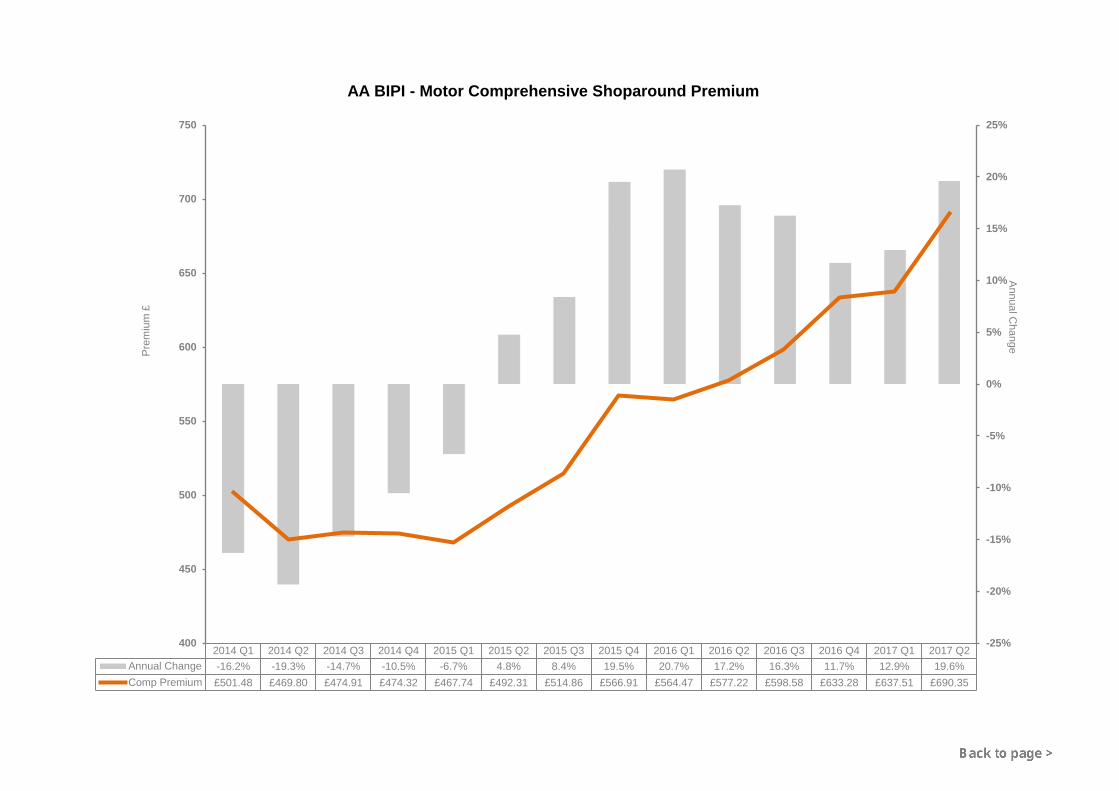
2014 Q1 2014 Q2 2014 Q3 2014 Q4 2015 Q1 2015 Q2 2015 Q3 2015 Q4 2016 Q1 2016 Q2 2016 Q3 2016 Q4 2017 Q1 2017 Q2Annual Change -16.2% -19.3% -14.7% -10.5% -6.7% 4.8% 8.4% 19.5% 20.7% 17.2% 16.3% 11.7% 12.9% 19.6%Comp Premium £501.48 £469.80 £474.91 £474.32 £467.74 £492.31 £514.86 £566.91 £564.47 £577.22 £598.58 £633.28 £637.51 £690.35
-25%
-20%
-15%
-10%
-5%
0%
5%
10%
15%
20%
25%
400
450
500
550
600
650
700
750Annual C
hange
Prem
ium
£
AA BIPI - Motor Comprehensive Shoparound Premium
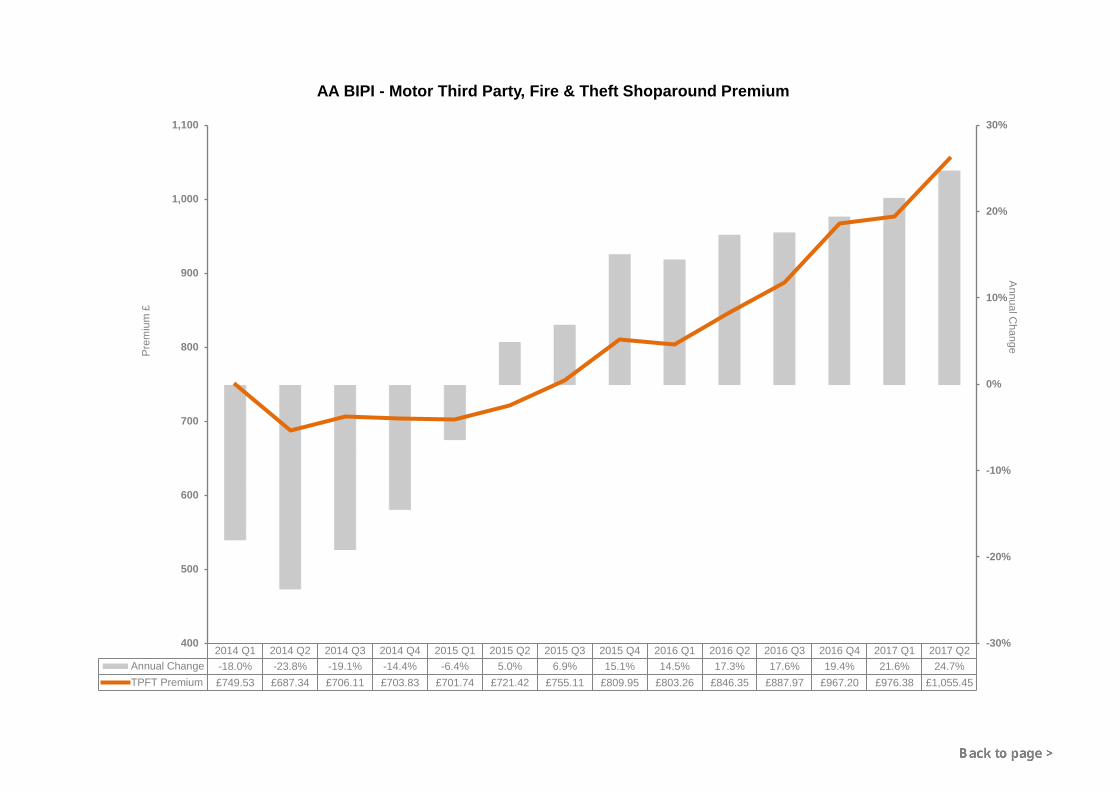
2014 Q1 2014 Q2 2014 Q3 2014 Q4 2015 Q1 2015 Q2 2015 Q3 2015 Q4 2016 Q1 2016 Q2 2016 Q3 2016 Q4 2017 Q1 2017 Q2Annual Change -18.0% -23.8% -19.1% -14.4% -6.4% 5.0% 6.9% 15.1% 14.5% 17.3% 17.6% 19.4% 21.6% 24.7%TPFT Premium £749.53 £687.34 £706.11 £703.83 £701.74 £721.42 £755.11 £809.95 £803.26 £846.35 £887.97 £967.20 £976.38 £1,055.45
-30%
-20%
-10%
0%
10%
20%
30%
400
500
600
700
800
900
1,000
1,100Annual C
hange
Prem
ium
£
AA BIPI - Motor Third Party, Fire & Theft Shoparound Premium
AA British Insurance Premium Index - Home Shoparound Premium All Channels
2017 Q1 2017 Q2Buildings £110.95 £112.69Contents £59.30 £61.16Combined £154.57 £157.59
A base rate of 100 was set at July 1994. The British Insurance Premium Index gives a quarterly update on the movements of home insurance on 750 risks each for buildings and contents, and on 2,800 car insurance risks - 2,500 comprehensive and 300 TPFT. July 1994 and subsequent premiums are assumed average premiums rebased in line with BIPI production methods over time.
The Index shows average car insurance premiums based on open market rates from 80 of the UK's leadinginsurers and home premiums across 72 insurers. Composites, direct writers and online providers are included.
The quarterly move compares the market average premium this quarter with the previous quarter.
The shoparound premium is the average of the five lowest premiums quoted by the insurers in the marketsurvey. This more closely reflects the price paid, but does not take account of discretionary discounts offered.
All premiums shown include Insurance Premium Tax at the prevailing rate.Premiums shown for July 1994 alone are free of IPT
While it is not possible to include risks from every town in the UK, those selected are typical risks, reflectinga cross section of the insurance market. Movements by specific towns are checked separately using a basketof 250,000 risks.
0
20
40
60
80
100
120
140
160
180
Buildings Contents Combined
Prem
ium
£
2017 Q1 2017 Q2
AA BIPI - Home Insurance Shoparound Movements
All channels*
2017 Q1 2017 Q2 Change 2016 Q2 ChangeBuildings £110.95 £112.69 + 1.6% £110.08 + 2.4%Contents £59.30 £61.16 + 3.1% £59.37 + 3.0%Combined £154.57 £157.59 + 2.0% £155.88 + 1.1%
* Based on GFK channel preference and arrangement data - March 2017.
AA BIPI - Home Insurance Shoparound Movements
Buildings summary by region - all channels
ShoparoundRegion 2017 Q1 2017 Q2 ChangeBorder & TyneTees £108.73 £110.61 + 1.7%Central & Granada £108.47 £110.77 + 2.1%London & South £116.46 £117.68 + 1.0%Scotland £109.30 £110.78 + 1.4%Wales £114.32 £116.42 + 1.8%West & West Country £106.38 £107.97 + 1.5%Yorkshire & Anglia £108.10 £109.99 + 1.7%
Contents summary by region - all channels
ShoparoundRegion 2017 Q1 2017 Q2 ChangeBorder & TyneTees £55.43 £57.29 + 3.4%Central & Granada £61.94 £63.59 + 2.7%London & South £60.64 £62.79 + 3.5%Scotland £53.61 £55.33 + 3.2%Wales £56.57 £58.62 + 3.6%West & West Country £55.85 £57.43 + 2.8%Yorkshire & Anglia £60.20 £61.98 + 3.0%
Combined summary by region - all channels
ShoparoundRegion 2017 Q1 2017 Q2 ChangeBorder & TyneTees £147.88 £152.03 + 2.8%Central & Granada £153.69 £157.17 + 2.3%London & South £163.19 £165.82 + 1.6%Scotland £149.17 £151.82 + 1.8%Wales £154.35 £158.31 + 2.6%West & West Country £144.05 £147.21 + 2.2%Yorkshire & Anglia £151.78 £154.31 + 1.7%
AA BIPI - Home Insurance Shoparound Movements
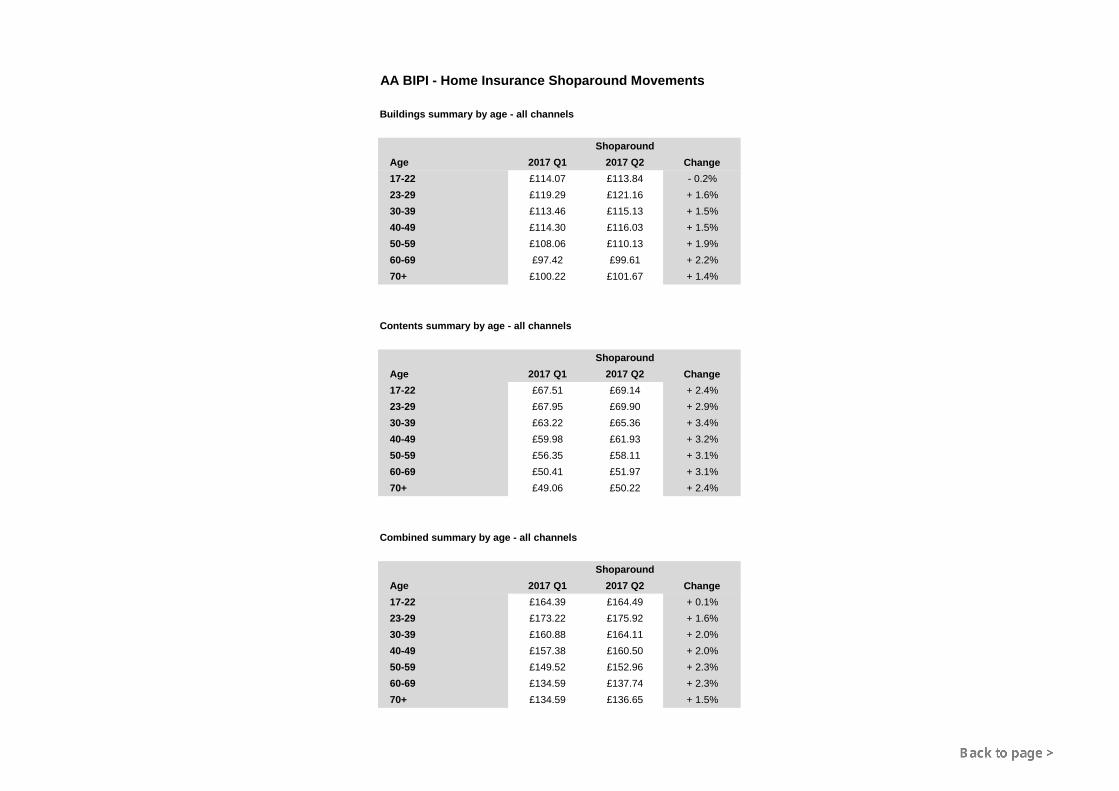
Buildings summary by age - all channels
ShoparoundAge 2017 Q1 2017 Q2 Change17-22 £114.07 £113.84 - 0.2%23-29 £119.29 £121.16 + 1.6%30-39 £113.46 £115.13 + 1.5%40-49 £114.30 £116.03 + 1.5%50-59 £108.06 £110.13 + 1.9%60-69 £97.42 £99.61 + 2.2%70+ £100.22 £101.67 + 1.4%
Contents summary by age - all channels
ShoparoundAge 2017 Q1 2017 Q2 Change17-22 £67.51 £69.14 + 2.4%23-29 £67.95 £69.90 + 2.9%30-39 £63.22 £65.36 + 3.4%40-49 £59.98 £61.93 + 3.2%50-59 £56.35 £58.11 + 3.1%60-69 £50.41 £51.97 + 3.1%70+ £49.06 £50.22 + 2.4%
Combined summary by age - all channels
ShoparoundAge 2017 Q1 2017 Q2 Change17-22 £164.39 £164.49 + 0.1%23-29 £173.22 £175.92 + 1.6%30-39 £160.88 £164.11 + 2.0%40-49 £157.38 £160.50 + 2.0%50-59 £149.52 £152.96 + 2.3%60-69 £134.59 £137.74 + 2.3%70+ £134.59 £136.65 + 1.5%
AA BIPI - Home Insurance Shoparound Movements
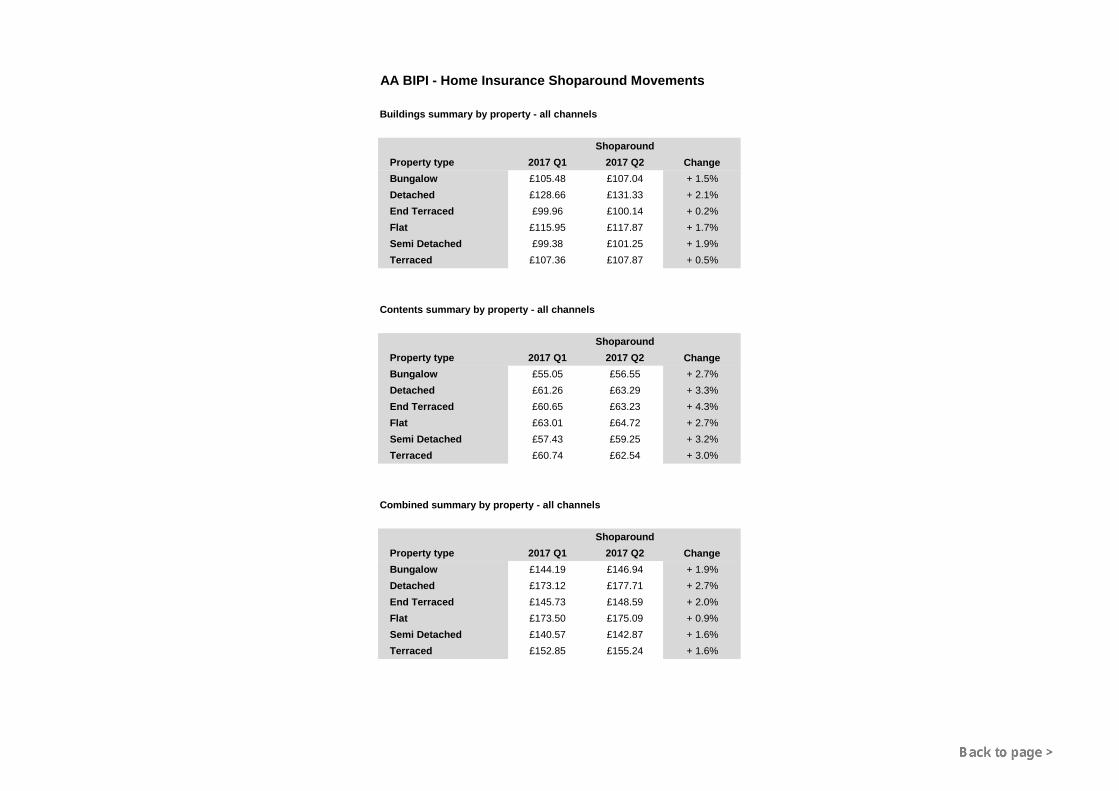
Buildings summary by property - all channels
ShoparoundProperty type 2017 Q1 2017 Q2 ChangeBungalow £105.48 £107.04 + 1.5%Detached £128.66 £131.33 + 2.1%End Terraced £99.96 £100.14 + 0.2%Flat £115.95 £117.87 + 1.7%Semi Detached £99.38 £101.25 + 1.9%Terraced £107.36 £107.87 + 0.5%
Contents summary by property - all channels
ShoparoundProperty type 2017 Q1 2017 Q2 ChangeBungalow £55.05 £56.55 + 2.7%Detached £61.26 £63.29 + 3.3%End Terraced £60.65 £63.23 + 4.3%Flat £63.01 £64.72 + 2.7%Semi Detached £57.43 £59.25 + 3.2%Terraced £60.74 £62.54 + 3.0%
Combined summary by property - all channels
ShoparoundProperty type 2017 Q1 2017 Q2 ChangeBungalow £144.19 £146.94 + 1.9%Detached £173.12 £177.71 + 2.7%End Terraced £145.73 £148.59 + 2.0%Flat £173.50 £175.09 + 0.9%Semi Detached £140.57 £142.87 + 1.6%Terraced £152.85 £155.24 + 1.6%
AA BIPI - Home Insurance Shoparound Movements
Buildings summary by year built - all channels
ShoparoundYear built 2017 Q1 2017 Q2 Change<1920 £134.34 £136.68 + 1.7%1920-1945 £111.78 £113.89 + 1.9%1946-1979 £101.00 £102.17 + 1.2%1980-1999 £95.46 £97.18 + 1.8%2000+ £87.52 £89.61 + 2.4%
Contents summary by year built - all channels
ShoparoundYear built 2017 Q1 2017 Q2 Change<1920 £65.02 £66.67 + 2.5%1920-1945 £61.98 £64.18 + 3.5%1946-1979 £55.61 £57.46 + 3.3%1980-1999 £55.45 £57.24 + 3.2%2000+ £56.37 £58.31 + 3.4%
Combined summary by year built - all channels
ShoparoundYear built 2017 Q1 2017 Q2 Change<1920 £184.00 £188.12 + 2.2%1920-1945 £157.45 £161.08 + 2.3%1946-1979 £141.07 £143.63 + 1.8%1980-1999 £134.94 £136.41 + 1.1%2000+ £131.37 £132.65 + 1.0%
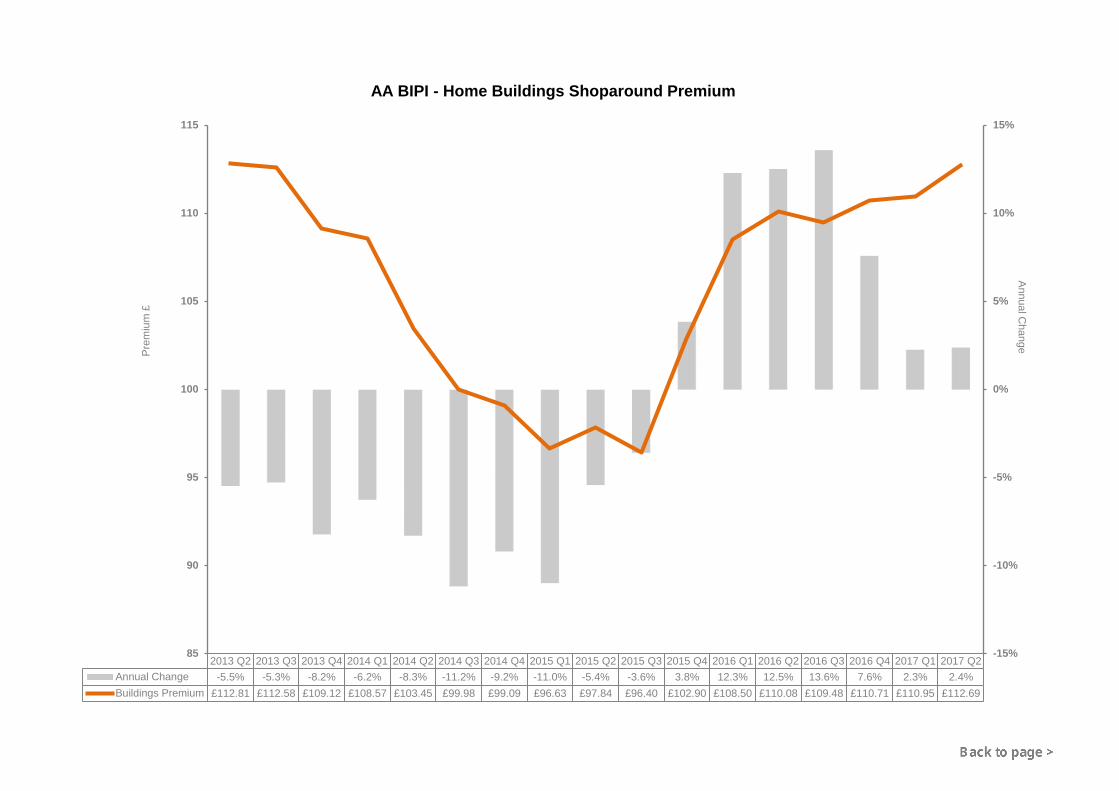
2013 Q2 2013 Q3 2013 Q4 2014 Q1 2014 Q2 2014 Q3 2014 Q4 2015 Q1 2015 Q2 2015 Q3 2015 Q4 2016 Q1 2016 Q2 2016 Q3 2016 Q4 2017 Q1 2017 Q2Annual Change -5.5% -5.3% -8.2% -6.2% -8.3% -11.2% -9.2% -11.0% -5.4% -3.6% 3.8% 12.3% 12.5% 13.6% 7.6% 2.3% 2.4%Buildings Premium £112.81 £112.58 £109.12 £108.57 £103.45 £99.98 £99.09 £96.63 £97.84 £96.40 £102.90 £108.50 £110.08 £109.48 £110.71 £110.95 £112.69
-15%
-10%
-5%
0%
5%
10%
15%
85
90
95
100
105
110
115
Annual Change
Prem
ium
£
AA BIPI - Home Buildings Shoparound Premium
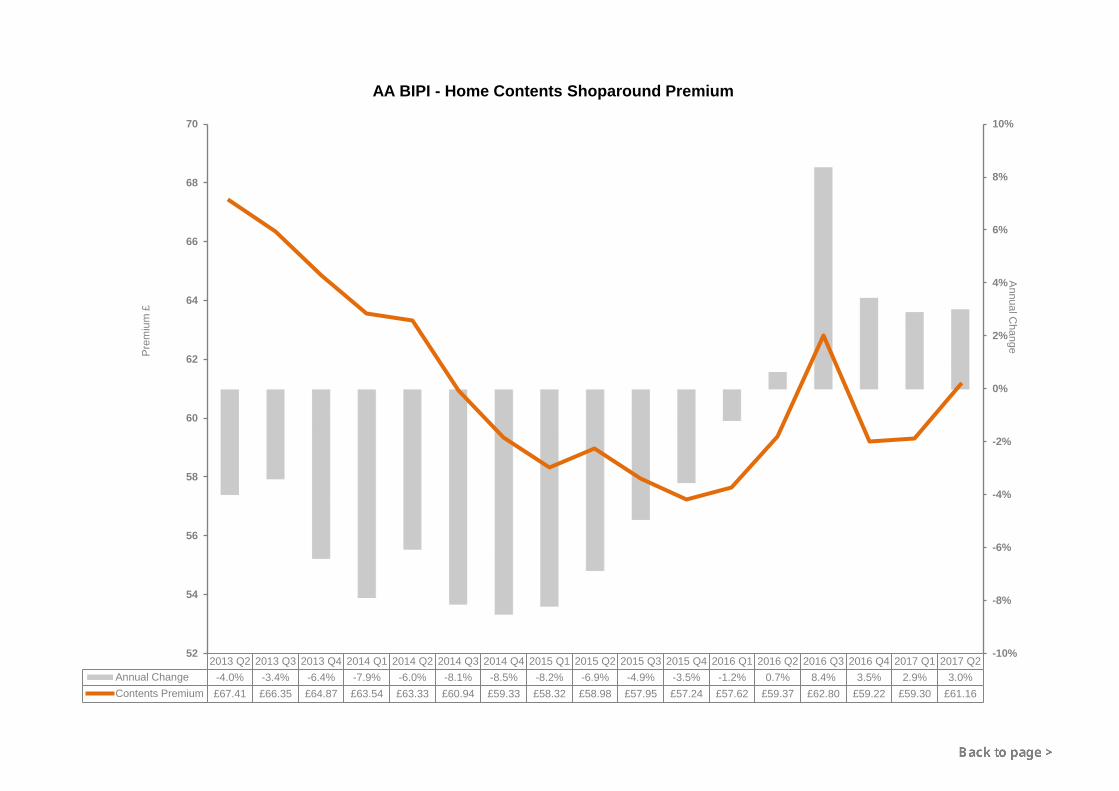
2013 Q2 2013 Q3 2013 Q4 2014 Q1 2014 Q2 2014 Q3 2014 Q4 2015 Q1 2015 Q2 2015 Q3 2015 Q4 2016 Q1 2016 Q2 2016 Q3 2016 Q4 2017 Q1 2017 Q2Annual Change -4.0% -3.4% -6.4% -7.9% -6.0% -8.1% -8.5% -8.2% -6.9% -4.9% -3.5% -1.2% 0.7% 8.4% 3.5% 2.9% 3.0%Contents Premium £67.41 £66.35 £64.87 £63.54 £63.33 £60.94 £59.33 £58.32 £58.98 £57.95 £57.24 £57.62 £59.37 £62.80 £59.22 £59.30 £61.16
-10%
-8%
-6%
-4%
-2%
0%
2%
4%
6%
8%
10%
52
54
56
58
60
62
64
66
68
70Annual C
hange
Prem
ium
£
AA BIPI - Home Contents Shoparound Premium
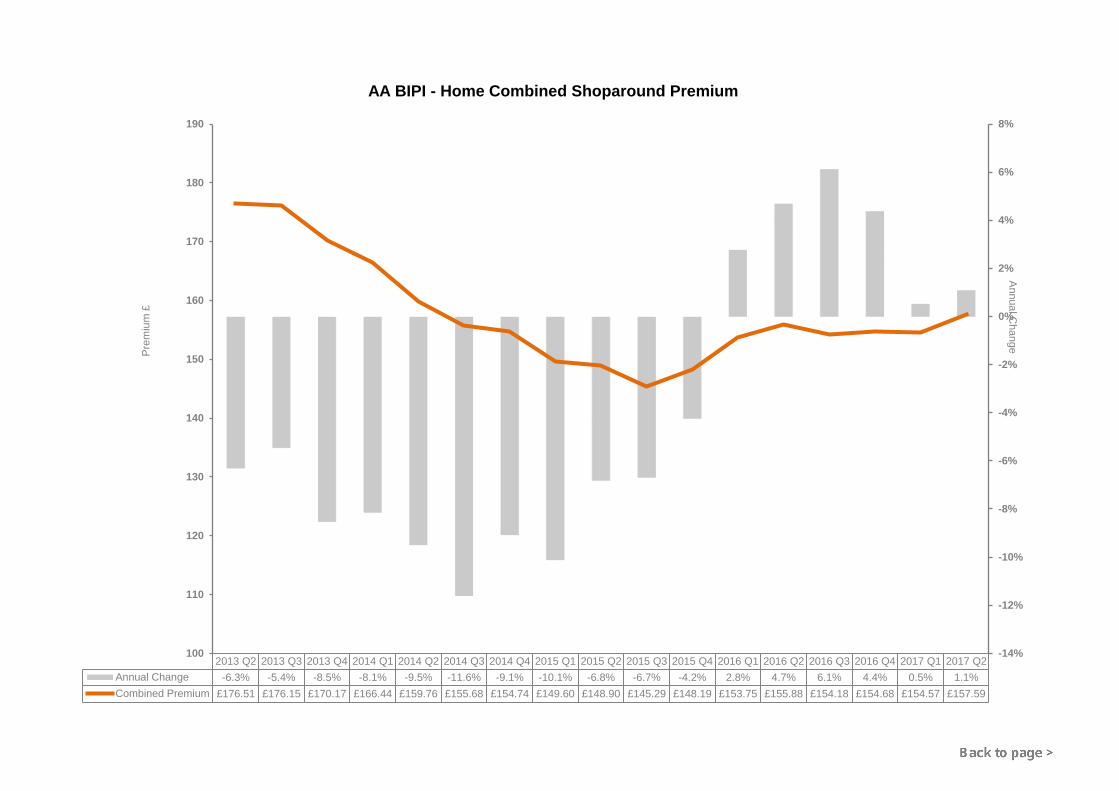
2013 Q2 2013 Q3 2013 Q4 2014 Q1 2014 Q2 2014 Q3 2014 Q4 2015 Q1 2015 Q2 2015 Q3 2015 Q4 2016 Q1 2016 Q2 2016 Q3 2016 Q4 2017 Q1 2017 Q2Annual Change -6.3% -5.4% -8.5% -8.1% -9.5% -11.6% -9.1% -10.1% -6.8% -6.7% -4.2% 2.8% 4.7% 6.1% 4.4% 0.5% 1.1%Combined Premium £176.51 £176.15 £170.17 £166.44 £159.76 £155.68 £154.74 £149.60 £148.90 £145.29 £148.19 £153.75 £155.88 £154.18 £154.68 £154.57 £157.59
-14%
-12%
-10%
-8%
-6%
-4%
-2%
0%
2%
4%
6%
8%
100
110
120
130
140
150
160
170
180
190Annual C
hange
Prem
ium
£
AA BIPI - Home Combined Shoparound Premium
AA BRITISH INSURANCE PREMIUM INDEX - 2017 Q2
Note: IPT at 2.5 per cent was introduced to premiums between July and October 1994IPT was increased to 4% on 1 April 1997, to 5% on 1 July 1999, to 6% on 4 January 2011, to 9.5% on 1 November 2015, to 10% on 1 October 2016 and then12% on 1st June 2017Figures shown include IPT, whereas on July 1994 premiums IPT did not apply
Important NoteThe information contained in the British Insurance Premium Index (“Index”) is the AA copyright:
© Automobile Association Insurance Services Limited 2017. All rights reserved.
The information may only be used internally by the business (“Internal Business Use”) on the following terms.
Internal Business Use means use of the information contained in the Index in reports and submissions, that do not carry advertising, in internal business activities. It specifically excludes any commercial use and exploitation including any use whereby the user obtains direct or indirect revenue, for example as part of any publishing activity, promotion, marketing or advertising. The AA Copyright notice must be displayed on all such information.
Press journalists may use the Index for editorial purposes without prior permission.
Any use of the Index other than as above is not permitted without the prior written consent of the AA (details below).
AA excludes all implied warranties and conditions to the fullest extent permitted by law. AA does not in any way warrant the accuracy or completeness of the Index and by using the Index the user acknowledges that it is relying upon its own skill in determining its suitability for any general or specific purposeand accepts that the Index may not be error free.
Automobile Association Insurance Services Limited is an intermediary and is regulated by the Financial Conduct Authority.
For further information, please contact Ian Crowder, telephone 01256 492 844 or email [email protected].