Embed Size (px)
Citation preview

Aalborg Universitet
HT-PEM Fuel Cell System with Integrated Thermoelectric Exhaust Heat Recovery
Gao, Xin
Publication date:2014
Document VersionPublisher's PDF, also known as Version of record
Link to publication from Aalborg University
Citation for published version (APA):Gao, X. (2014). HT-PEM Fuel Cell System with Integrated Thermoelectric Exhaust Heat Recovery. Departmentof Energy Technology, Aalborg University.
General rightsCopyright and moral rights for the publications made accessible in the public portal are retained by the authors and/or other copyright ownersand it is a condition of accessing publications that users recognise and abide by the legal requirements associated with these rights.
? Users may download and print one copy of any publication from the public portal for the purpose of private study or research. ? You may not further distribute the material or use it for any profit-making activity or commercial gain ? You may freely distribute the URL identifying the publication in the public portal ?
Take down policyIf you believe that this document breaches copyright please contact us at [email protected] providing details, and we will remove access tothe work immediately and investigate your claim.
Downloaded from vbn.aau.dk on: April 25, 2017

HT-PEM Fuel Cell System with
Integrated Thermoelectric Exhaust
Heat Recovery
Xin Gao
Dissertation submitted to the Faculty of Engineering and
Science at Aalborg University in partial fulfillment of
the requirements for the degree of
DOCTOR OF PHILOSOPHY
Aalborg University
Department of Energy Technology
Aalborg, Denmark

HT-PEM Fuel Cell System with Integrated Thermoelectric Exhaust Heat
Recovery
Xin Gao © 2014
ISBN: 978-87-92846-38-9
Printed in Denmark by UniPrint
Aalborg University
Department of Energy Technology
Pontoppidanstræde 101
9220 Aalborg
Denmark

Title: HT-PEM Fuel Cell System with Integrated Thermoelectric Exhaust Heat
Recovery
PhD student: Xin Gao
Supervisor: Søren Knudsen Kær, Professor
Co-supervisor: Søren Juhl Andreasen, Associate Professor
List of Publications:
Paper 1: Gao, Xin; Chen, Min; Andreasen, Søren Juhl; Kær, Søren Knudsen:
“Potential Usage of Thermoelectric Devices in a High-Temperature Polymer
Electrolyte Membrane (PEM) Fuel Cell System: Two Case Studies”. In
Journal of Electronic Materials, 41(6), 2012, p. 1838-1844.
Paper 2: Gao, Xin; Andreasen, Søren Juhl; Chen, Min; Kær, Søren Knudsen:
“Numerical Model of a Thermoelectric Generator with Compact Plate-Fin Heat
Exchanger for High Temperature PEM Fuel Cell Exhaust Heat Recovery”. In
International Journal of Hydrogen Energy, 37(10), 2012, p. 8490-8498.
Paper 3: Gao, Xin; Andreasen, Søren Juhl; Kær, Søren Knudsen; Rosendahl,
Lasse Aistrup: “Optimization of a Thermoelectric Generator Subsystem for
High Temperature PEM Fuel Cell Exhaust Heat Recovery”. In International
Journal of Hydrogen Energy, 2014; Doi: 10.1016/j.ijhydene.2014.01.193.
Paper 4: Gao, Xin; Andreasen, Søren Juhl; Kær, Søren Knudsen; Rosendahl,
Lasse Aistrup; Kolaei, Alireza Rezania: “Heat Exchanger Selection and
Optimization of a Thermoelectric Generator Subsystem for HT-PEM Fuel Cell
Exhaust Heat Recovery”. Under review by International Conference on
Thermoelectrics, July 2014.
Paper 5: Gao, Xin; Chen, Min; Snyder, G. Jeffrey; Andreasen, Søren Juhl;
Kær, Søren Knudsen: “Thermal Management Optimization of a
Thermoelectric-Integrated Methanol Evaporator Using a Compact CFD
Modeling Approach”. In Journal of Electronic Materials, 42(7), 2013, p. 2035-
2042.
This present report combined with the above listed scientific papers has been
submitted for assessment in partial fulfilment of the PhD degree. The scientific

papers are not included in this version due to copyright issues. Detailed
publication information is provided above and the interested reader is referred
to the original published papers. As part of the assessment, co-author
statements have been made available to the assessment committee and are also
available at the Faculty of Engineering and Science, Aalborg University.
v
Abstract
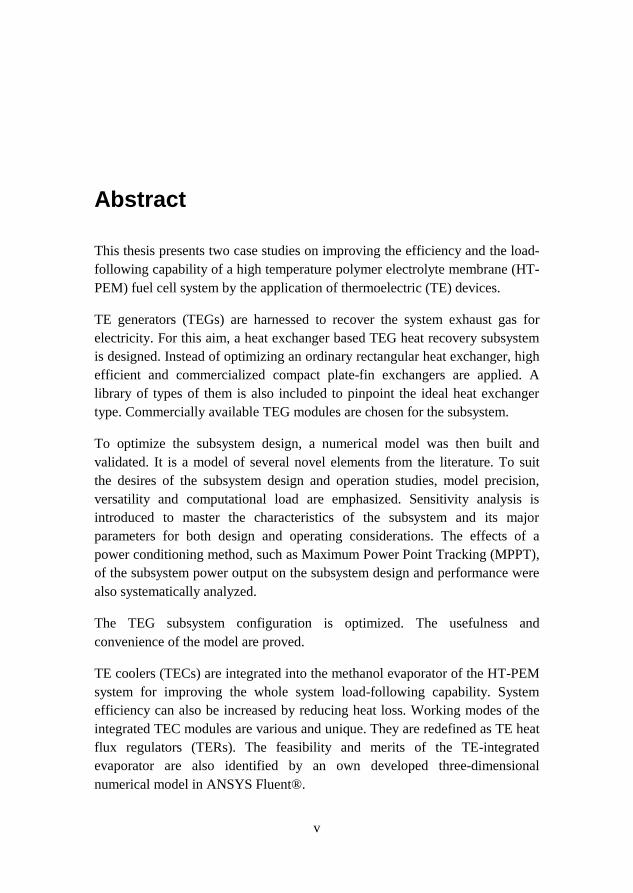
This thesis presents two case studies on improving the efficiency and the load-
following capability of a high temperature polymer electrolyte membrane (HT-
PEM) fuel cell system by the application of thermoelectric (TE) devices.
TE generators (TEGs) are harnessed to recover the system exhaust gas for
electricity. For this aim, a heat exchanger based TEG heat recovery subsystem
is designed. Instead of optimizing an ordinary rectangular heat exchanger, high
efficient and commercialized compact plate-fin exchangers are applied. A
library of types of them is also included to pinpoint the ideal heat exchanger
type. Commercially available TEG modules are chosen for the subsystem.
To optimize the subsystem design, a numerical model was then built and
validated. It is a model of several novel elements from the literature. To suit
the desires of the subsystem design and operation studies, model precision,
versatility and computational load are emphasized. Sensitivity analysis is
introduced to master the characteristics of the subsystem and its major
parameters for both design and operating considerations. The effects of a
power conditioning method, such as Maximum Power Point Tracking (MPPT),
of the subsystem power output on the subsystem design and performance were
also systematically analyzed.
The TEG subsystem configuration is optimized. The usefulness and
convenience of the model are proved.
TE coolers (TECs) are integrated into the methanol evaporator of the HT-PEM
system for improving the whole system load-following capability. System
efficiency can also be increased by reducing heat loss. Working modes of the
integrated TEC modules are various and unique. They are redefined as TE heat
flux regulators (TERs). The feasibility and merits of the TE-integrated
evaporator are also identified by an own developed three-dimensional
numerical model in ANSYS Fluent®.

vi
This thesis introduces the progress of this project in a cognitive order. The first
chapter initially prepares the theory and characteristics of the fuel cell system
and TE devices. Project motivations are conceived. Then similar studies
existing in literature are reviewed for their experiences. Afterwards, the project
road map is identified by a list of project objectives. The detailed
considerations and steps during carrying out the project are addressed in the
second chapter. Major innovations out of this project are also highlighted. The
third chapter presents the main results and discussions. Conclusions and future
work are discussed in the last chapter.

vii
Dansk Resumé
I denne afhandling præsenteres to studier, hvis formål det har været at forbedre
effektiviteten og den dynamiske last-respons af et højtemperatur-polymer-
elektrolyt-membran-brændselscelle-system (HT-PEM-system) ved hjælp af
termoelektriskeenheder (TE-enheder).
Termoelektriskegeneratorer (TEG) kan blive brugt til at genvinde en del af den
uudnyttede termiske energi i udstødningsgasser ved at omdanne denne til
elektricitet. Til dette formål er der i dette projekt blevet designet et TEG-
varmegenvindingsdelsystem baseret på en varmeveksler. I stedet for at
optimere en ordinær rektangulær varmeveksler benyttes højeffektive og
kommercielt tilgængelige kompaktpladevarmevekslere. Til at fastlægge den
ideelle varmeveksler er et bibliotek af forskellige typer blevet benyttet i
optimeringen af systemet.
Til at optimere delsystemets design er en numerisk model blevet opbygget og
valideret. Modelen kombinerer forskellige nye elementer fra litteraturen. For at
imødekomme delsystemets behov samt dem der er forbundet med
driftsstudierne, er modelpræcisionen, alsidigheden og beregningsbelastningen
blevet understreget. En sensitivitetsanalyse introduceres, som et værktøj til at
klarlægge delsystemets karakteristik og dets primære design- og
driftsparameter. Ligeledes analyseres systematisk koblingen mellem
anvendelsen af effektomformningsmetode på delsystemet, så som Maximum
Power Point Tracking (MPPT), og delsystemets design og drift.
Et optimalt TEG-delsystemskonfiguration bestemmes og modelens
anvendelighed samt belejlighed bevises.
Termoelektriskekølere (TEK) er blevet integreret i HT-PEM-systemets
metanolfordamper for at forbedre hele systemets dynamiske last-respons.
Systemeffektiviteten kan også forhøjes ved at mindske varmetabene. De
integrerede TEK-modulers driftsmønstre er forskellige og unikke. Styrkerne

viii
ved den integrerede TE-fordamper er også blevet identificeret af en
egenudviklet tredimensionel numerisk model i ANSYS Fluent.
Denne afhandling er opbygget således at den reflekterer den naturlige
udviklingsproces hvorved projektet er forløbet. Det første kapitel beskriver
indledningsvis teorien og den karakteristiske opførelse af
brændselscellesystemet samt TE-enheder. Projektmotivationen beskrives i
forlængelse heraf. Dernæst evalueres lignende studier i litteraturen med
henblik på deres erfaringer, og en arbejdsplan for projektet identificeres
igennem projektformål. I det andet kapitel bliver de detaljerede overvejelser,
der blev gjort under projektforløbet, taget fat på. Disse omfatter de mest
betydningsfulde innovationer. I tredje kapitel præsenteres og diskuteres
hovedresultaterne. Endeligt afsluttes afhandlingen med en konklusion og
perspektivering.

ix
Acknowledgements
This thesis is submitted to The Faculty of Engineering and Science at Aalborg
University, Denmark in partial fulfilment of the requirements of the PhD
degree. The financial support from Aalborg University and China Scholarship
Council is gratefully acknowledged.
Pursuing a PhD degree is no easy a journey. I am profoundly indebted to many
people. Without you all, I just could not make it.
First and foremost, I offer my deepest gratitude to my supervisors, Professors
Søren Knudsen Kær and Søren Juhl Andreasen: thank you for your
understanding, patient guidance and encouragement; for the relaxing
atmosphere during every discussion, the freedom given to carry out the project
in my way, and the care taken not only for my work, but also for my feelings. I
would also like to express my appreciation to Chungen Yin, Lasse Aistrup
Rosendahl, Min Chen, Mads Pagh Nielsen, Kaiyuan Lu, Thomas Condra and
Torsten Berning, for your valuable suggestions, kind help and time. You all,
images of experienced researchers, are also invaluable examples to me.
Further, special thanks to my dear officemates, Alexandros Arsalis, Anders
Christian Olesen, Vincenzo Liso, Jakob Rabjerg Vang, Haftor Örn Sigurdsson
and Samuel Simon Araya, for selflessly helping me out whenever I was in need,
your patience in improving my English, and so many fruitful and joyful
discussions in the office. Your support is deeply appreciated! Thanks also go to
John Kim Pedersen, all the secretaries and the rest people who have ever
helped me in the Department of Energy Technology. Thank you all for
providing such a smooth organization and such a friendly atmosphere.
Lastly, I am indebted to my parents, my brother and sisters, and my wife, for
your unconditional love, encouragement, trust in me, bracing me from

x
whatever trouble and reminding me the meaning of life. Really nice to have
you in my life.
Xin Gao
Aalborg, Denmark
March 2014
xi
Thesis Outline
Guide to the Reader
This dissertation is prepared as a collection of scientific papers produced
during my PhD period, which are composed of responses to the project
objectives set at the beginning of the research work. Accordingly the thesis is
primarily made up of 4 chapters, which are divided as follows:
Chapter 1 states the motivations of this project in the large background of the
global energy concerns. It then describes the generalities of the main
components investigated on, HT-PEM fuel cells and thermoelectric (TE)
devices. After that, it summarizes representative studies in literature for
experiences on TE applications and detailed design and operating concerns.
During the literature review, the project objectives are gradually formulated
and presented at the end of this chapter.
Chapter 2 shows the methodology for the work. Simulation is decided as the
main research approach. Considerations on the architecture of the TEG
subsystem are initially given herein. This chapter then notes the processes of
modeling the fuel cell stack and the model development of the TEG subsystem.
It also explains the analytical procedure, namely the sensitivity analysis. Ideas
on modifying the design of the methanol evaporator are presented lastly.
Chapter 3 summarizes the main contributions of this project in relation to the
available literature and the objectives of the project. For easy reading, the
results are separated into two sections, which are distinguished by the working
modes of TE modules.
Chapter 4 concludes the dissertation by giving the final remarks. Facing the
limitations of the work, possible plans for future work are addressed.


xiii
Contents
Abstract .............................................................................................................. v
Dansk Resumé .................................................................................................. vii
Acknowledgements ........................................................................................... ix
Thesis Outline ................................................................................................... xi
Contents........................................................................................................... xiii
List of Figures .................................................................................................. xv
List of Tables .................................................................................................. xvii
Abbreviations ................................................................................................ xviii
1 Introduction ................................................................................................ 1
1.1 Project Motivations ........................................................................... 1
1.2 Background........................................................................................ 2
1.2.1 Global Fossil Fuel Concerns ......................................................... 2
1.2.2 Sustainable Development .............................................................. 3
1.3 Fuel Cells ........................................................................................... 4
1.3.1 Fuel Cell Fundamentals ................................................................. 4
1.3.2 Proton Exchange Membrane Fuel Cells ........................................ 6
1.3.3 High Temperature PEM Fuel Cells ............................................... 8
1.3.4 The HT-PEM Fuel Cell Power System ....................................... 11
1.4 Thermoelectric Devices ................................................................... 17
1.4.1 Thermoelectrics ........................................................................... 18
1.4.2 Thermoelectric Generators .......................................................... 21
1.4.3 Thermoelectric Coolers ............................................................... 29

xiv
1.5 Literature Review ............................................................................ 31
1.5.1 Thermoelectric Materials............................................................. 31
1.5.2 Module Design and Operating Concerns ..................................... 34
1.5.3 Thermoelectric Applications ....................................................... 35
1.6 Project Objectives ............................................................................ 43
2 Methodology ............................................................................................ 45
2.1 Modeling of the HT-PEM Fuel Cell Stack ...................................... 45
2.2 Design and Modeling of the TEG Subsystem ................................. 46
2.2.1 The TEG Modules ....................................................................... 47
2.2.2 Heat exchangers .......................................................................... 49
2.3 Overview of TEG Subsystem Characteristics ................................. 53
2.4 Modification of the Methanol Evaporator ....................................... 53
3 Principal Results and Discussion ............................................................. 57
3.1 TEG Exhaust Heat Recovery ........................................................... 57
3.2 TE-integration in the Evaporator ..................................................... 60
4 Conclusions and Future Work .................................................................. 63
References ........................................................................................................ 67
Paper 1 .............................................................................................................. 87
Paper 2 .............................................................................................................. 97
Paper 3 ............................................................................................................ 109
Paper 4 ............................................................................................................ 121
Paper 5 ............................................................................................................ 137

xv
List of Figures
1.1 - World energy consumption by fuel type, 1990-2040 (10^15 Btu). ........... 3
1.2 - Global new investment in renewable energy by technology, developed
and developing countries, 2012. ................................................................. 4
1.3 - Schematic diagram and operating principles of various fuel cells. ............ 5 1.4 - The central part of a HT-PEM single cell. ............................................... 10
1.5 - HT-PEM fuel cell typical performance CV curve. .................................. 11
1.6 - Picture of a HT-PEM fuel cell stack. ....................................................... 11 1.7 - A HT-PEM power system configuration under normal operation. .......... 12
1.8 - Picture of the integrated HT-PEM power system. ................................... 13
1.9 - Energy flow Sankey diagram. .................................................................. 14
1.10 - General energy flow in the evaporator with adjustable auxiliary electric
heat (maximum 300W). ........................................................................... 14
1.11 - Design of the evaporator. ....................................................................... 15
1.12 - System temperatures during simulation using adjustable electric heat to
evaporator. ................................................................................................ 15
1.13 - Illustration and picture of the SMR. ....................................................... 16
1.14 - Picture of a typical TE module. ............................................................. 18 1.15 - How a TE module works. a) Seebeck effect makes TE generators. b)
Peltier effect makes TE heat pumps. c) Thermocouples packed into a
module. ..................................................................................................... 19
1.16 - zT of commercial TE materials. ............................................................. 24
1.17 - Alternative segmented TEG modules. ................................................... 27
1.18 - Schematic diagram comparing segmented and cascaded TEGs. ........... 27
1.19 - Photo of a 'thermoelectric tube'. ............................................................. 28 1.20 - Tubular PbTe module consisting of four thermocouples connected with
nickel bridges. .......................................................................................... 29
1.21 - Schematic arrangement of a two-stage TEC module. ............................ 30
1.22 - A three-stage TEC module. .................................................................... 31
1.23 - Pictures of a) a mini TEC module, b) a thin-film TEC module in 0.1 mm
x 3.0 mm x 3.5 mm. ................................................................................. 31

xvi
1.24 - Compromise of material properties to maximize zT. ............................. 32
1.25 - History of Thermoelectric Figure of Merit, ZT. .................................... 33
2.1 - A test stand for module parameters. ......................................................... 49
2.2 - Illustration of straight-base rectangular fins. ........................................... 50 2.3 - Design of the TEG subsystem (1,4 - Water jackets; 2 - TEG module
assembly; 3 - Compact heat exchanger housing; 5 - Diffuser). ............... 51
2.4 - Types of fin geometries: a) plain rectangular, b) plain trapezoidal, c)
wavy, d) serrated or offset strip fin, e) louvered, and f) perforated.......... 51
2.5 - Modification of the methanol evaporator. ................................................ 54
3.1 - The final optimal architecture of the TEG subsystem.............................. 58
3.2 - Contribution of TE heat recovery to the fuel cell system, ZT=0.50. ....... 59
3.3 - Expected contribution of TE heat recovery to the fuel cell system, ZT=2.
.................................................................................................................. 60
3.4 - Differences in chamber heat output versus electric current between two
designs of the evaporator. ........................................................................ 60

xvii
List of Tables
1.1 - Summary of major fuel cell types. ............................................................. 5
1.2 - Power output and efficiency equations of a typical TEG module. ........... 22
1.3 - Peak performances of a typical TEC module. .......................................... 29
2.1 - Some research groups on HT-PEM fuel cell modelling. ......................... 45 2.2 - Tentative assessment of all the possible TEG installation positions. ....... 47

xviii
Abbreviations
Acronyms
AFC Alkaline Fuel Cell
BoP Balance of Plant
CCD Charge-coupled device
CHP Combined heat and power
CO Carbon monoxide
COP Coefficient of performance
CPL Capillary pump loop
CV Voltage-current
DMFC Direct Methanol Fuel Cell
EES Engineering equation solver
EGR Exhaust gas recirculation
EIS Electrochemical impedance spectroscopy
ESC Extremum seeking control
GDL Gas diffusion layer
GHG Greenhouse gas
HFC Hydro-fluorocarbon
HT-PEM High temperature polymer electrolyte membrane
HVAC Automotive heating, ventilation, and air-conditioning
ICEs Internal combustion engines
LT-PEM Low temperature PEM
MD Methanol decomposition
MEA Membrane Electrode Assembly
MPPT Maximum Power Point Tracking
NOx Nitric oxides
PAFC Phosphoric Acid Fuel Cell
PBI Polybenzimidazole
PEMFC Polymer Electrolyte Membrane Fuel Cell
PM2.5 Soot particles less than 2.5 micrometers in diameter

xix
PTFE Polytetrafluoroethylene
P&O Perturb and observe
SLCPs Short-lived climate pollutants
SOFC Solid Oxide Fuel Cell
SOx Sulfur oxides
SMR Steam methanol reformer
SR Steam reforming
TE Thermoelectric
TEC Thermoelectric cooler
TEG Thermoelectric generator
TER Thermoelectric heat flux regulator
WGS Water-gas shift
zT Figure of merit of TE materials
ZT Figure of merit of thermoelectric devices


1
1 Introduction
This chapter explains the motivations of this project and introduces the
features of the main components investigated on. A literature review is then
presented. Afterwards, the detailed project objectives and the supposed
outcomes are conceived in the end of this chapter.
1.1 Project Motivations
Environmental deterioration and resource depletion are urging our whole
human race to adopt a more environmentally friendly and sustainable lifestyle.
Safety of energy supply concern further strengthens the eagerness. The key
step here is finding cleaner and more efficient energy conversion technologies
and renewable energy sources. Furthermore ensuring their successful market
penetration is another vital factor. Among all possible novel solutions, high
temperature polymer electrolyte membrane (HT-PEM) fuel cells and methanol
seem a promising combination for approaching some of these challenges. HT-
PEM fuel cell systems with on-board methanol steam reformers are clean,
efficient, and compact-design. Methanol can be abounding from various
renewable sources and is rather seamless with today’s fossil fuel infrastructure.
Harnessing all the above advantages makes these fuel cell systems an
outstanding candidate, e.g., in the transport sector.
In a HT-PEM fuel cell system with on-board methanol steam reformer, every
1kW power output is accompanied by approximately 1kW exhaust heat [1],
which is usually discharged unused. These systems need rechargeable lithium
battery packs to supplement the parasitic losses under some occasions, such as
system cold start. Recovering the exhaust heat for electricity to lower the
battery power demand as well as boost the system efficiency is the first project
motivation. Considering the magnitude and quality of the exhaust heat,
thermoelectric generators (TEGs) are probably superb in this application. The
other motivation is originated from the inherent agility of another system

1.2 Background
2
component, the methanol evaporator, to fluctuations in operating parameters.
Some designs can affect the system load-following capability significantly.
Thermoelectric coolers (TECs) can be used as miniature heat regulators,
moving heat back and forth swiftly under control. Hopefully, integrating them
into the current chosen evaporator and driving them to regulate the inner heat
flux can enhance the evaporator’s controllability and the system dynamic
performance. This project analyzes these two topics.
1.2 Background
1.2.1 Global Fossil Fuel Concerns
Global environmental pollution and climate change are already an undeniable
presence. Behind these, the burning of fossil fuels, i.e., liquid fuels, natural gas
and coal, is a major source. Combustion flue gas contains various hazardous
pollutants, such as carbon monoxide (CO), sulfur oxides (SOx), and nitric
oxides (NOx). Combustion yielded carbon dioxide takes the primary part of the
world greenhouse gas (GHG) emissions and causes global warming.
Incomplete combustion emits black carbon (soot). In recent years, the adverse
health and environmental impacts of soot particles less than 2.5 micrometers in
diameter (PM2.5) start drawing particular concern. It is estimated by the World
Health Organization that annually over 1 million premature deaths are caused
from exposure to outdoor fine particulate air pollution in urban areas [2]. Also
after carbon dioxide, black carbon has the second strongest contribution to
global warming [3], which is particularly evident in the Arctic. Besides black
carbon, ground-level ozone (tropospheric ozone), methane and some hydro-
fluorocarbons (HFCs) have similar short period environmental impacts. They
are together labeled as the short-lived climate pollutants (SLCPs). Fast and
sustainably reducing their emissions is considered as a key for a successful
near-term environmental protection [ 4 ]. Despite the environmental issues,
consumption of fossil fuels is still increased steadily and is expected to remain
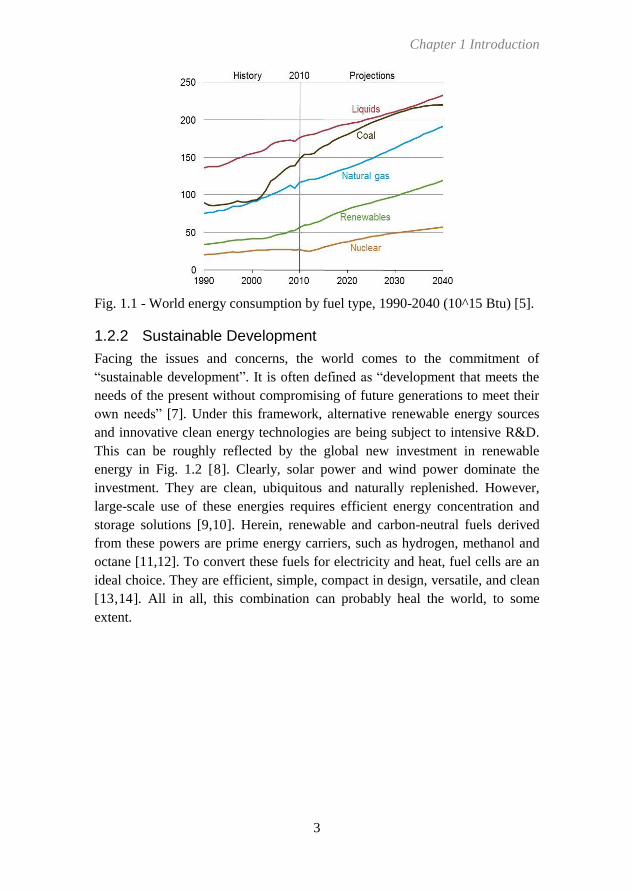
the largest source of energy through 2040, as shown in Fig. 1.1 [5 ]. To
maintain this trend, it is reported that we may need the equivalent of two earths
by the 2030s [6]. Fossil fuel depletion is just a matter of time. Another issue of
fossil fuels is their uneven reserves around the world. It triggers the regional
energy security concerns and is another important stimulant for countries to
explore for alternative sources.
Chapter 1 Introduction
3
Fig. 1.1 - World energy consumption by fuel type, 1990-2040 (10^15 Btu) [5].
1.2.2 Sustainable Development
Facing the issues and concerns, the world comes to the commitment of
“sustainable development”. It is often defined as “development that meets the
needs of the present without compromising of future generations to meet their
own needs” [7]. Under this framework, alternative renewable energy sources
and innovative clean energy technologies are being subject to intensive R&D.
This can be roughly reflected by the global new investment in renewable
energy in Fig. 1.2 [8]. Clearly, solar power and wind power dominate the
investment. They are clean, ubiquitous and naturally replenished. However,
large-scale use of these energies requires efficient energy concentration and
storage solutions [9,10]. Herein, renewable and carbon-neutral fuels derived
from these powers are prime energy carriers, such as hydrogen, methanol and
octane [11,12]. To convert these fuels for electricity and heat, fuel cells are an
ideal choice. They are efficient, simple, compact in design, versatile, and clean
[13,14]. All in all, this combination can probably heal the world, to some
extent.

1.3 Fuel Cells
4
Fig. 1.2 - Global new investment in renewable energy by technology,
developed and developing countries, 2012 [8].
1.3 Fuel Cells
1.3.1 Fuel Cell Fundamentals
Fuel cells are a category of electrochemical converters that directly converts
chemical energy of fuels into DC electricity [14]. Similar as batteries, fuel cells
are another important type of galvanic cells. The main difference between them
lies in that, of a battery, the chemical reactants are an inherent and inner part;
whereas fuels must be supplied from external reservoirs to a fuel cell [15].
Unlike a battery, a fuel cell will keep generating electricity as long as fuels are
supplied; it cannot ‘go flat’. This feature is in common with internal
combustion engines. However, fuel cells have no intermediate step of heat or
mechanical energy production before electric power output. They can be solid
state energy conversion devices without any moving parts [13]. Fig. 1.3
illustrates their architecture and operating principles. A fuel cell typically has
two electrodes, namely anode and cathode, in between of which is the
electrolyte. Anode electrode is where fuel oxidation happens and electrons
flow out; cathode is where oxidant reduction takes place and electrons flow in.
The function of the electrolyte, simply speaking, is to conduct ions between the
electrodes and stop electrons and fuels from crossing over [16].
Depending on the material of the electrolyte used, there are several types of
fuel cells. As also shown in Fig. 1.3, the main five types of fuel cells are: a)
Alkaline Fuel Cell (AFC), b) Polymer Electrolyte Membrane Fuel Cell
(PEMFC), c) Phosphoric Acid Fuel Cell (PAFC), d) Molten Carbonate Fuel

Chapter 1 Introduction
5
Cell (MCFC), and e) Solid Oxide Fuel Cell (SOFC). Their characteristics are
summarized in Table 1.1. Sometimes, a Direct Methanol Fuel Cell (DMFC) is
also classified as yet another type of fuel cell; however based on its electrolyte,
it is essentially a PEMFC that uses methanol other than hydrogen as a fuel.
Like batteries, fuel cell performance is quantitatively described by voltage-
current (CV) curves (polarization curves). A CV curve also illustrates the main
four irreversibilities in a fuel cell: a) activation losses, b) fuel crossover and
internal currents, c) ohmic losses, and d) mass transport or concentration losses.
However, a Nyquist plot from an electrochemical impedance spectroscopy
(EIS) test can give a much more detailed and insightful understanding of these
phenomena [17].
Fig. 1.3 - Schematic diagram and operating principles of various fuel cells [14].
Table 1.1 - Summary of major fuel cell types [14,16,18].
AFC PEMFC PAFC MCFC SOFC
Electrolyte Liquid KOH
in a matrix H
conductive
polymer
membrane
Liquid
H3PO4 in
SiC matrix
Molten
carbonates
in LiAlO2
matrix
Ceramic
Mobile ion OH H H 2
3CO 2O
Operating
temperature
50-250℃ 60-200℃ 150-200℃ 600-700℃ 800-1000℃
Typical
catalyst
Ni, Ag, metal
oxides
Platinum Platinum Nickel Nickel

1.3 Fuel Cells
6
Fuel intake 2H
2H ,
3CH OH
2H 2 4, H CH
2, H CO ,
4CH
Electrical
efficiency
45-60% 40-60% 35-40% 45-60% 50-65%
Typical kWe >20kW <250kW 200kW >200kW <200kW
Applications Submarines,
spacecraft
Vehicles,
small
stationary
Stationary Stationary Stationary
To sum up, fuel cells have many advantages. Since there is no combustion
involved in the energy conversion, they are clean, silent, potentially more
durable and efficient. Unlike batteries, they have more scalability in power
(determined by the fuel cell size) and capacity (limited by the fuel reservoir
size). Fuel cells can easily scale from 1-W range (portable electronics) to
megawatt range (power plants). They can also be quickly recharged by simply
refueling. Their fuel flexibility is another advantage; especially these fuels
mostly are renewable and carbon-neutral. Although they currently still need
breakthroughs in material development, system design, and infrastructure
construction, fuel cells are still a quite promising candidate for powering a
sustainable future.
1.3.2 Proton Exchange Membrane Fuel Cells
The PEMFC, also called the low temperature PEM (LT-PEM) fuel cell, was
initially developed by the American company General Electric in 1960s for
NASA’s first manned space vehicles.
A PEMFC usually consumes hydrogen and oxygen to produce electricity. The
following electrochemical half reactions take place simultaneously in the two
electrodes.
2
2 2
2 2 (anode)
12 2 (cathode)
2
H H e
O H e H O
(1.1)
Protons H are the mobile ions that go through the electrolyte. The electrolyte
deployed is famous with its name Nafion, a registered trademark of Dupont. It
is a sulphonated polytetrafluoroethylene (PTFE) membrane. The PTFE base,
which is also sold as Teflon, makes the electrolyte membrane mechanically
strong, highly durable, particularly hydrophobic, and resistant to chemical
attack. It separates the two electrodes. The sulphonation then forms H
pathways through the PTFE polymer via adding side chains ending with 3HSO

Chapter 1 Introduction
7
to PTFE molecules. Now the sulphonated PTFE membrane is ready as the
remarkable electrolyte for a PEMFC. The mechanism of H pathways
determines that the membrane is H conductive only when soaked in water.
This limits PEMFC operating temperatures to ≤80℃ [19].
In this temperature range, Platinum is the best catalyst for both the anode and
the cathode. The basic structure of the two electrodes is usually identical.
Platinum catalyst is treated into very fine particles and bound on the surface of
larger particles of carbon powder. To prevent the electrodes from being
flooded by the product water, Nafion ionomer is also added using its highly
hydrophobic feature. It also helps H transportation in the electrodes and
improves their performance [20]. Then the Nafion/carbon-supported catalyst
particles are either hot pressed or sprayed or ‘printed’ onto the two surfaces of
the electrolyte [21,22,23]. The method chosen depends on whether the catalyst
is immersed in the gas diffusion layer (GDL) or not. The GDL is generally a
carbon paper or carbon cloth. Its function is to diffuse gases, discharge product
water, form an electrical connection, and protect the very thin layer of catalyst.
The two GDLs are labeled ‘anode’ and ‘cathode’ in Fig. 1.3. Between them
and the electrolyte membrane are the two catalyst layers. Binding the five
layers together forms the sandwich-structure Membrane Electrode Assembly
(MEA). The remaining structures in Fig. 1.3 are two bipolar plates. Flow fields
for fuels and products are carved in them. Bipolar plates are also collectors of
electrons for the external circuit. Force is applied on them to clamp the MEA
tightly and reduce the electrical contact resistance in between.
Compared with other fuel cell types, PEMFCs are more compact and efficient
thanks to their very thin MEAs and the outstanding performance of Nafion®
membrane. In other words, their power densities are higher than other types,
ranging from 300 to 1000 2mWe cm [13]. Working at relative low temperatures
also guarantees that PEMFCs have swifter on-off operations and startups than
other fuel cells, such as SOFCs and MCFCs. For the above reasons, PEMFCs
are a prime candidate to replace today’s vehicular internal combustion engines
(ICEs) and a promising substitute to batteries in portable applications [24].
However, low operating temperatures make PEMFCs have very limited
options of catalysts. Platinum is still the most practical but costly choice.
Besides, under these low temperatures, Platinum catalyst is rather vulnerable to
and easily deactivated by fuel impurities, e.g., CO, SOx, NOx, H2S, and NH3
[ 25 ]. Hydrogen purification adds a further cost burden. Costly hydrogen
storage and lack of refueling infrastructure are another two barriers to bring
PEMFC systems into market. On-board producing and decontaminating

1.3 Fuel Cells
8
hydrogen from hydrocarbons is a good solution. However, this also raises the
PEMFC system complexity and cost. PEMFC thermal management then
consumes extra space and power. The relatively small temperature gap
between PEMFC system and environment results in a sluggish heat rejection
and in turn a large radiator. Furthermore, water management of a PEMFC is
complicated, due to the characteristics of Nafion membrane and the liquid-
phase product water.
1.3.3 High Temperature PEM Fuel Cells
HT-PEM fuel cells can be considered as the technical off-springs of LT-PEM
fuel cells. They make use of Phosphoric acid doped Polybenzimidazole (PBI)
membrane as the electrolyte. Unlike the PAFC electrolyte, most acid molecules
herein are immobilized. These membranes were first invented by Wang et al.
in 1995 [26,27]. Since then, they have drawn much attention as their excellent
characteristics versus Nafion membranes.
PBI base films have excellent oxidative and thermal stability [ 28 ]. Their
operational temperature can reach up to 200℃ without affecting the
mechanical flexibility. PBI films themselves are also good vapor, electron and
ion barriers and exhibits low gas permeability. Proton H conductivity thereof
is added by the doped Phosphoric acid and is comparable to Nafion. The acid
doped membrane also possesses an almost zero electro-osmotic drag number,
compared to the drag number of 0.6-2.0 for Nafion [29,30,31]. These features
make the doped PBI membrane an ideal electrolyte. This membrane allows
HT-PEM fuel cells operating above 100℃, since no membrane hydration is
needed for the proton pathways. The recommended operating range is from
140℃ to 170℃ [32]. Benefits from the elevated operating temperature are
threefold: a) thermal management is eased; heat rejection to the ambient is
facilitated; b) water management is barely an issue anymore, since membrane
hydration is of no need and product water is now steam; c) the Platinum
catalyst can tolerate fuel contaminations (CO is the main concern) at much
higher concentrations. It can withstand up to 5% CO without any performance
loss at 180℃ [ 33 ]. Regarding Nafion, the number is 10ppm (0.001%)
[16,34,35].
In practice, the above advantages can translate into much simpler and more
compact system design, higher system efficiency, and more flexibility in fuels.
Fuel humidifiers can be safely ruled out of a HT-PEM fuel cell system now.
Taking advantage of the enhanced heat rejection, much smaller radiator and
coolant circulation pump are required.

Chapter 1 Introduction
9
At present, the use of pure hydrogen as a fuel source still has quite a few
formidable limitations [34]. Especially in transportation applications, a major
one is on-board hydrogen storage. To refuel a fuel cell vehicle using hydrogen
would be time-consuming; the major storage schemes, i.e., cryogenic liquid
hydrogen, compressed hydrogen gas, and metal hydride adsorption, each have
significant drawbacks [ 36 ]. Then the lack of infrastructure for hydrogen
distribution further exacerbates these on-board storage issues. Another fact is
that hydrogen is nearly not available in natural form on earth. Thus, the method
of on-board reforming liquid hydrocarbon or alcohol fuels to generate
hydrogen comes into focus, among which fuels the most likely candidate is
methanol [37,38]. As analyzed by Lindström et al. [38], its reforming processes
have a superior hydrogen yield on both weight and volume basis than other
fuels; the reforming processes are rather easily achieved at relatively low
temperatures; methanol is abundant as a chemical material and already bulk-
produced in industry; and the present network for distributing gasoline only
needs minor changes to be ‘methanol-ready’. In addition, the reformate gas
mixture of methanol contains about 74% hydrogen, 25% carbon dioxide and 1-
2% CO [39]. The CO concentration is far below the 5% criterion mentioned
above. HT-PEM fuel cells can directly consume the on-board product
hydrogen without significant performance loss. Fuel purification devices are
simply unnecessary for a HT-PEM fuel cell system. All the above save
considerable space and parasitic losses. The fuel flexibility and convenience
further notably enhance the competitiveness of HT-PEM fuel cells. In a word,
the commercialization barriers of fuel cells can possibly be greatly mitigated
by the HT-PEM fuel cell.
On the other hand, HT-PEM fuel cells still have some obstacles to their full
commercialization. Their efficiency is still slightly low. It is reported that they
require cell voltages over 0.7V to achieve higher system efficiencies than LT-
PEM fuel cells, which target has not been reached [40]. Durability is the
second concern. Under higher operating temperatures, the corrosion of the
catalyst carbon support becomes notable. This decreases the number of sites
available to anchor the Platinum particles and degrade the catalyst performance
[41,42]. Agglomeration or dissolution of Platinum particles on the carbon
support is also more evident. Cost is another challenge in several aspects.
Decreasing the Platinum catalyst loading and developing non-noble metals as
catalyst materials are the two main answers. Last but not least, Phosphoric acid
leaching is concerned as a main degradation factor to the PBI MEA. But it is
analyzed that this phenomenon is negligible during normal operation [40].
Liquid water is another threat to dilute the Phosphoric acid and cause the
1.3 Fuel Cells
10
leaching during startup, this can be handled by heating up the MEA to above
100℃ before operating.
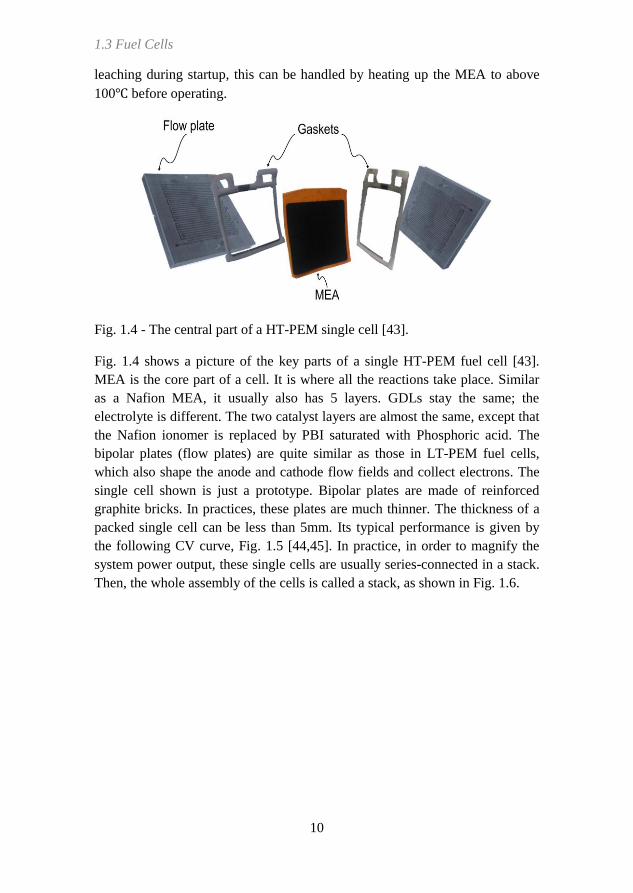
Fig. 1.4 - The central part of a HT-PEM single cell [43].
Fig. 1.4 shows a picture of the key parts of a single HT-PEM fuel cell [43].
MEA is the core part of a cell. It is where all the reactions take place. Similar
as a Nafion MEA, it usually also has 5 layers. GDLs stay the same; the
electrolyte is different. The two catalyst layers are almost the same, except that
the Nafion ionomer is replaced by PBI saturated with Phosphoric acid. The
bipolar plates (flow plates) are quite similar as those in LT-PEM fuel cells,
which also shape the anode and cathode flow fields and collect electrons. The
single cell shown is just a prototype. Bipolar plates are made of reinforced
graphite bricks. In practices, these plates are much thinner. The thickness of a
packed single cell can be less than 5mm. Its typical performance is given by
the following CV curve, Fig. 1.5 [44,45]. In practice, in order to magnify the
system power output, these single cells are usually series-connected in a stack.
Then, the whole assembly of the cells is called a stack, as shown in Fig. 1.6.

Chapter 1 Introduction
11
Fig. 1.5 - HT-PEM fuel cell typical performance CV curve [44,45].
Fig. 1.6 - Picture of a HT-PEM fuel cell stack [46].
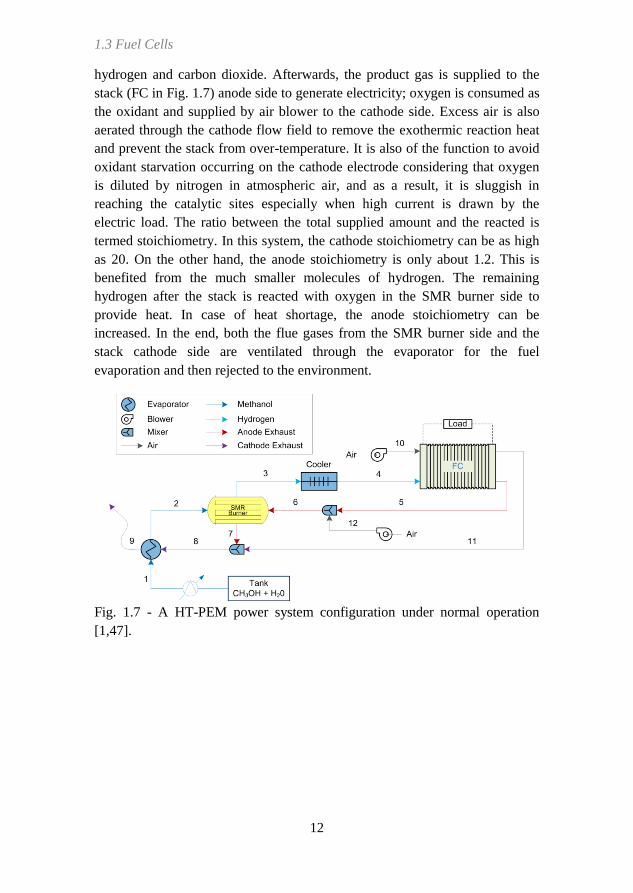
1.3.4 The HT-PEM Fuel Cell Power System
The HT-PEM fuel cell power system studied in this project is from the
previous work by Andreasen et al. [1]. Its nominal electric power output is
1kWe. The system configuration and elementary components are illustrated in
Fig. 1.7. It is methanol fueled, of which the advantages are abovementioned.
The fuel, liquid methanol/water mixture, is stored in the fuel tank. When the
system is running, the fuel is pumped to the evaporator and gets evaporated
and superheated. Then the evaporated methanol/water steam is delivered into
the steam methanol reformer (SMR) whereat it is converted mainly to
1.3 Fuel Cells
12
hydrogen and carbon dioxide. Afterwards, the product gas is supplied to the
stack (FC in Fig. 1.7) anode side to generate electricity; oxygen is consumed as
the oxidant and supplied by air blower to the cathode side. Excess air is also
aerated through the cathode flow field to remove the exothermic reaction heat
and prevent the stack from over-temperature. It is also of the function to avoid
oxidant starvation occurring on the cathode electrode considering that oxygen
is diluted by nitrogen in atmospheric air, and as a result, it is sluggish in
reaching the catalytic sites especially when high current is drawn by the
electric load. The ratio between the total supplied amount and the reacted is
termed stoichiometry. In this system, the cathode stoichiometry can be as high
as 20. On the other hand, the anode stoichiometry is only about 1.2. This is
benefited from the much smaller molecules of hydrogen. The remaining
hydrogen after the stack is reacted with oxygen in the SMR burner side to
provide heat. In case of heat shortage, the anode stoichiometry can be
increased. In the end, both the flue gases from the SMR burner side and the
stack cathode side are ventilated through the evaporator for the fuel
evaporation and then rejected to the environment.
Fig. 1.7 - A HT-PEM power system configuration under normal operation
[1,47].

Chapter 1 Introduction
13
Fig. 1.8 - Picture of the integrated HT-PEM power system [1].
Fig. 1.8 gives a picture of the integrated HT-PEM power system although with
a slightly different configuration. The fuel cell stack is in the white box in the
back. The stack is wrapped in the foam insulation to avoid insufficient
temperatures during operation. Under the standard working condition 20.6i A cm , the stack can produce 1kWe electricity and approximate 1kW
reaction heat. This is more clearly shown by the system energy flow Sankey
diagram, Fig. 1.9 [1,48]. As explained above, the 1kW reaction heat is carried
out of the stack by the cathode flue gas in the form of exhaust heat and is then
reused by the evaporator. It can be noticed that there is still nearly 70% of the
exhaust heat rejected into the environment unutilized, even if the 329W heat
for the evaporator is entirely supplied by the exhaust gas. However, in reality it
is not this supposed condition and the evaporator is rather inefficient. This can
be explained by Fig. 1.10 [1]. ,Evap ConvectionP in the figure is the heat that the
evaporator harvests from the exhaust heat. In most time, ,Evap ConvectionP is negative,
which means the evaporator actually is losing heat to the exhaust gas, i.e., the
exhaust gas is being heated up. This is exactly opposite of the design purpose.
It can also be noticed that no matter if the evaporator is gaining or losing heat
from or to the exhaust gas, the evaporator cannot work independently without
the auxiliary electric heat. All these issues can be traced back to the evaporator
design and operating set points.

1.3 Fuel Cells
14
Fig. 1.9 - Energy flow Sankey diagram [1,48].
Fig. 1.10 - General energy flow in the evaporator with adjustable auxiliary
electric heat (maximum 300W) [1].

Chapter 1 Introduction
15
Fig. 1.11 - Design of the evaporator [47].
The design of the evaporator is illustrated in Fig. 1.11 and shown in the bottom
right part of the picture Fig. 1.8. Basically, it is a plain plate-fin heat exchanger.
The evaporation chamber (the flow fields) for the liquid methanol/water
mixture is carved in the base plates. Here are also mounted the cartridge
heaters. The evaporator is supposed to work like this: during normal operation,
the liquid methanol/water mixture is pumped into the evaporation chamber and
gets evaporated then superheated, using the heat recovered from the exhaust
gas by the plain plate fins. Occasionally, when heat shortage happens, e.g.,
during system startup, the cartridge heaters will be turned on to supplement
with electric heat. Regarding that, the methanol/water mixture boiling point is
about 72℃ [49] and the exhaust heat temperature is around 160℃ [1], this
design is feasible; the evaporation and superheating can be accomplished.
Fig. 1.12 - System temperatures during simulation using adjustable electric
heat to evaporator [1].
1.3 Fuel Cells
16
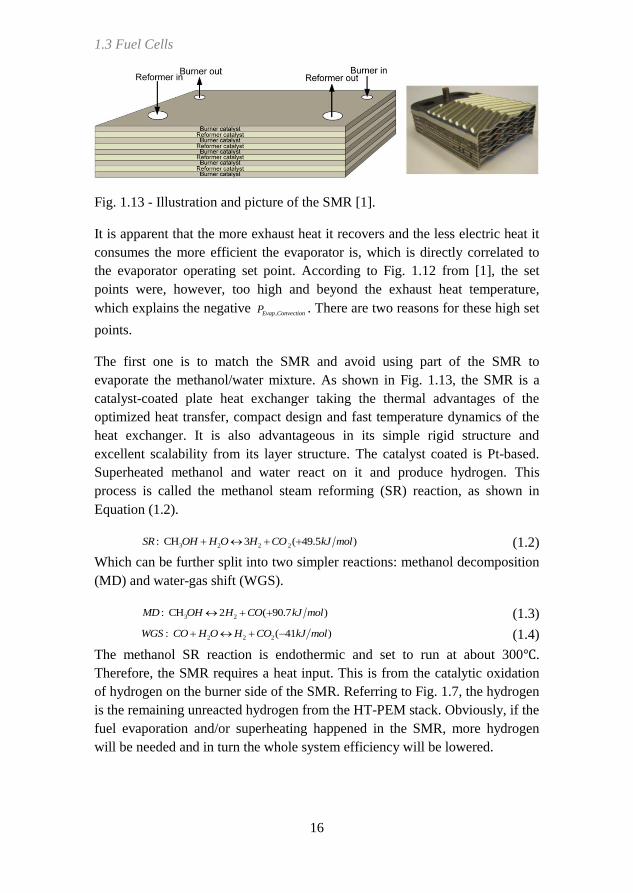
Fig. 1.13 - Illustration and picture of the SMR [1].
It is apparent that the more exhaust heat it recovers and the less electric heat it
consumes the more efficient the evaporator is, which is directly correlated to
the evaporator operating set point. According to Fig. 1.12 from [1], the set
points were, however, too high and beyond the exhaust heat temperature,
which explains the negative ,Evap ConvectionP . There are two reasons for these high set
points.
The first one is to match the SMR and avoid using part of the SMR to
evaporate the methanol/water mixture. As shown in Fig. 1.13, the SMR is a
catalyst-coated plate heat exchanger taking the thermal advantages of the
optimized heat transfer, compact design and fast temperature dynamics of the
heat exchanger. It is also advantageous in its simple rigid structure and
excellent scalability from its layer structure. The catalyst coated is Pt-based.
Superheated methanol and water react on it and produce hydrogen. This
process is called the methanol steam reforming (SR) reaction, as shown in
Equation (1.2).
3 2 2 2: CH 3 ( 49.5 )SR OH H O H CO kJ mol (1.2)
Which can be further split into two simpler reactions: methanol decomposition
(MD) and water-gas shift (WGS).
3 2: CH 2 ( 90.7 )MD OH H CO kJ mol (1.3)
2 2 2: ( 41 )WGS CO H O H CO kJ mol (1.4)
The methanol SR reaction is endothermic and set to run at about 300℃.
Therefore, the SMR requires a heat input. This is from the catalytic oxidation
of hydrogen on the burner side of the SMR. Referring to Fig. 1.7, the hydrogen
is the remaining unreacted hydrogen from the HT-PEM stack. Obviously, if the
fuel evaporation and/or superheating happened in the SMR, more hydrogen
will be needed and in turn the whole system efficiency will be lowered.

Chapter 1 Introduction
17
The second reason of the high set points is to keep a safe distance from the fuel
boiling point for the evaporator to handle load fluctuations. This is because of
its limited dynamic performance, which can be noticed in Fig. 1.12. To sum up,
the fuel evaporation and superheating in the current system will either cause
heat loss to the exhaust gas or drain heat from the SMR. Either condition will
compromise the system efficiency.
Despite the above issue, the dynamic performance, i.e., the load-following
capability, of the whole HT-PEM power system possibly still needs
improvement [48]. From Fig. 1.7, it can be predicted that as soon as the electric
load increases, the stack will consume more hydrogen immediately to fulfil the
need and demand more hydrogen from the SMR. So the SMR needs more heat
to produce the additional hydrogen. Contrarily, less hydrogen at the moment is
left from the stack for the catalytic oxidation in the SMR to generate heat as
more has already been reacted in the stack. If the system is more efficient, i.e.,
the stoichiometry is more precisely controlled, the consequences of this
countermove will be even worse. When the electric load decreases, the above
behaviors are vice versa. Surplus hydrogen now will cause SMR temperature
overshoot, more CO in the reformate hydrogen risking poisoning the stack and
lower system efficiency.
To deal with the above issues, the first scenario is to keep the HT-PEM power
system working in steady state as a range extender (basically a battery charger).
Second scenario can be a new design of the evaporator that has improved heat
management and dynamic performance [47]. Nevertheless, a simple
calculation can reveal that an ideal evaporator only needs around 100W
exhaust heat to evaporate and superheat enough methanol/water mixture. The
rest exhaust heat, which still contains almost 1kW, will remain ejected unused
to the ambient. Therefore, another more direct choice is to cut the loop and try
out some other compact devices to recover the exhaust heat for electricity to
boost the whole system efficiency. Most likely, the generated electricity can
also mitigate the load-following issues.
All the above analyses explain the motivations of this project.
1.4 Thermoelectric Devices
Thermoelectric (TE) devices are solid-state energy converters. They are both
heat engines and heat pumps [50]. Their combination of thermal, electrical and
semiconducting properties allows them to directly generate electricity from

1.4 Thermoelectric Devices
18
waste heat or convert electrical power directly into cooling and heating. They
are superb in their miniature outline, excellent scalability, outstanding
reliability and long lifetime, yet still suffering from their low efficiency. Fig.
1.14 below shows a typical TE device.
Fig. 1.14 - Picture of a typical TE module.
1.4.1 Thermoelectrics
As shown in the above picture, a TE module includes multiple semiconductor
legs. They are either p- or n- type and alternately arranged. Each pair of the p-
and n-legs is electrically connected in series by a conducting strip (usually
copper) and forms the basic unit a TE module, a ‘thermocouple’. All the
thermocouples in a module are then connected together electrically in series
and thermally in parallel. Finally, all the connected thermocouples are
sandwiched by two ceramic substrates on top and bottom and a TE module is
complete.

Chapter 1 Introduction
19
Fig. 1.15 - How a TE module works [51 ]. a) Seebeck effect makes TE
generators. b) Peltier effect makes TE heat pumps. c) Thermocouples packed
into a module.
The thermoelectric effects which underlie thermoelectric energy conversion are
called Seebeck effect, Peltier effect and Thomson effect. As illustrated by a
thermocouple in Fig. 1.15a, if the junction at the top are heated and the two
feet at the bottom are cooled, a voltage potential, the Seebeck voltage, which
drives the hole/electron flow in the two semiconductor legs, is created by the
temperature difference between the junction and the feet. If connected to an
external circuit, the voltage source can then output power. Observed by
Seebeck in 1821, this effect is named after him and is the basis for TE power
generation [52]. The voltage across the two feet can be expressed as:
pn pn h cU T T (1.5)
Where pn is the difference of the Seebeck coefficients between two legs and
h cT T is the temperature difference falls on the two legs. This equation also
defines the Seebeck coefficient.
1.4 Thermoelectric Devices
20
Thirteen years after Seebeck’s discovery, Peltier published an article on his
observation of temperature anomalies in the boundary vicinity between two
different conductors when an electric current is flowing through them [52].
This phenomenon is then called Peltier effect after his name. It is the reverse
situation of Seebeck effect. As shown in Fig. 1.15b, when an external power
source is applied on the two feet of the thermocouple and a current I flows in
a clockwise sense in the legs, a rate of heat q is absorbed at the junction and
ejected from the two feet. When the current I direction reverses, the heat flow
will also be instantly changed into the opposite direction. This is the Peltier
effect and describes the capability of heating and cooling of a TE module when
a current is applied on it. Quantitatively, it is given by Kelvin’s Law using the
following equation. pn is the thermocouple’s Peltier coefficient.
pnq I (1.6)
The above two effects, Seebeck and Peltier, are the two main thermoelectric
effects. The last one, the Thomson effect, consists of reversible heating or
cooling q . It is induced when there is both a flow of electric current I and a
temperature gradient T existing through a single homogeneous conductor.
Compared to this, it should be clear that Seebeck and Peltier effects are not
interfacial phenomena although they only take place at junctions between
dissimilar conductors [53]. The reason is that all three effects depend on the
bulk properties of the materials involved. Thomson coefficient is given as:
q I T (1.7)
The discovery of Thomson effect actually unveils the interdependency of the
Seebeck and Peltier phenomena. All these three coefficients are convertible to
each other by the Kelvin relationships:
, pn pn pn p nT d dT T (1.8)
These relationships are deduced by irreversible thermodynamics [ 54 ]. In
practice, especially in applications with moderate temperature gradients,
Thomson effect is of much less significance than the other two and usually just
neglected [ 55 ]. Besides the above three thermoelectric phenomena, other
effects, such as volumetric Joule heating, contact resistance etc., also affect TE
device performances significantly and should be carefully considered.
In principle, a single thermocouple can be adapted to fulfil the required power
generation capability or heating/cooling capacity by altering its ratio of length
to cross-sectional area. However, such a uni-couple device would operate

Chapter 1 Introduction
21
under a very small voltage and a very large current unless the request is
minimal [53]. For practical reasons, hundreds of them are typically electrically
connected in series and packed as a TE module, as shown in Fig. 1.14 and Fig.
1.15c.
1.4.2 Thermoelectric Generators
A thermoelectric generator (TEG) is a TE module working on Seebeck effect
to generate power from heat. In principle, since Seebeck and Peltier effects are
reversible, TEG is a definition of a working mode of a TE device;
Thermoelectric Cooler (TEC) is the other. To describe a TEG’s performances,
the following characteristic parameters are employed.
1.4.2.1 Characteristic Parameters
1) Figure of merit of TE materials (zT)
The dimensionless figure of merit of materials (zT) determines the maximum
efficiency of a thermoelectric material for both power generation and cooling.
It is defined as:
2
zT Tk
(1.9)
where is the Seebeck coefficient, is the material electrical conductivity, k
is the thermal conductivity, and temperature T in the unit of Kelvin, is used to
make this parameter dimensionless.
2) Figure of merit of thermoelectric devices (ZT)
The device figure of merit (ZT) indicates the efficiency of a thermoelectric
device. It depends on some other factors other than the zT of materials. One
thing needs to be clearly distinguished is that ZT (uppercase) has different
meaning from the lower-case zT, the material’s figure of merit. For a TE
generator, the maximum device efficiency ( max ) is used to determine ZT:
max
1 1, 2
1h c
ch
h
T ZTT T T
TTZT
T
(1.10)
In the equation, hT is the temperature of heat source (heat input), cT is the
temperature of heat sink (heat removal), T is the temperature difference
between hT and cT . ZT is the device figure of merit at temperature T . Of a
typical TE module as in Fig. 1.14, Z can be calculated from

1.4 Thermoelectric Devices
22
2( ) ,
K = , R =L
p n e t
t p p p n n n e p p p n n n
Z R K
k A L k A L A L A
(1.11)
There are two conditions, under which Z (uppercase) equals z. The first one is
that one leg of a thermocouple is superconductor. The other condition is that
the n- and p-leg material properties are assumed independent from temperature
and equivalent to each other, i.e., , and k of the two legs have nearly the
same values. Although the second two assumptions are believed inaccurate in
many cases [56], they are a widely used simplification in literatures with
satisfactory accuracy (within 10% accuracy [54] and better in lower
temperature applications). If the above assumptions are true, there is
2
Z zk
(1.12)
Where 2 is termed as the electrical power factor.
3) Efficiency of a TEG module
The efficiency of a TEG module is given by
TEG
energy supplied to the loadh =
heat energy absorbed at the hot junction (1.13)
Assume that a TEG module is ideally insulated from the ambient, , and k
of two legs of every thermocouple are the same and constant under temperature
changes, and the contact resistances at the junctions are negligible, then the
efficiency can be expressed as
2
2(T T ) 2
loadTEG tc
tc tc h c tc pn h tc e
I R
n k n T I n I R
(1.14)
Where loadR is the external circuit,
tck is the thermal conductance of a single
thermocouple, tc
eR is the electrical resistance of every thermocouple in a TEG
module, and tcn is their total number. Based on the above assumptions,
equations describing the maximum power output point and peak efficiency
point of a typical TEG module are listed in Table 1.2 [54,57].
Table 1.2 - Power output and efficiency equations of a typical TEG
module.
maxP max
I 2 TEG
TEG eT R (M 1) TEG
TEG eT R
loadR TEG
eR TEG
eR M

Chapter 1 Introduction
23
P 2 2 4 TEG
TEG eT R 2 2 2(M 1) TEG
TEG eM T R
4 hZ T ZT ZT 1 1 hM T M T T
1M ZT , TEG tc pnn ,
h cT T T , (T T ) 2h cT
4) Thermoelectric compatibility factor
Thermoelectric compatibility factor explains the phenomenon that the real
electric current needed for a TE module to reach its peak efficiency point max
s
is smaller than the value predicted by Z as shown in Table 1.2. max
s is also
lower than the theoretical value max in the table. This effect is most important
for segmented TEGs, which are designed for applications under large
temperature gradients, e.g., cases with T > 600℃ in [56,58 , 59 ]. If not
considered, the device ZT of a segmented TEG module can be significantly
lower than the average zT of materials. However, in calculating the exact
performances for all other types of TE modules, this factor also affects [54].
The thermoelectric compatibility factor for a TE material is expressed as:
1 1s zT T (1.15)
For small zT , this approximately equals to
2
zs
(1.16)
Then it can be derived that the reduced peak efficiency point max
s is
max
1 1
1 1
s zT
zT
(1.17)
In a TEG module, if the compatibility factor of one part is significantly
different from another part, no current match will possibly be set up between
them for each part to operate nearby to its max
s . For higher efficiency, as a rule
of thumb, this factor of different TE materials in a TE module should be within
about a factor of two across the different temperature ranges [54].
The compatibility factor is an intrinsic property of thermoelectric materials. It
must be counted for segmented TEGs in high temperature applications, since it
always affects the device efficiency largely. In similar applications for
cascaded TEGs, however, efforts could be done to avoid the compatibility
influences on device performance, which is one advantage of this kind of TEGs.

1.4 Thermoelectric Devices
24
1.4.2.2 TEG Categories
TEG types and materials discussed here are those commercialized, i.e., only
mature TEG modules and materials are discussed in this section. Sorted by
operational temperature intervals as shown in Fig. 1.16 and determined by the
properties of TE materials employed, generally speaking, there are three
categories of TEGs: a) low-temperature (<200℃), b) medium-temperature (200
- 600℃), and c) high-temperature (600 - 1000℃).
Fig. 1.16 - zT of commercial TE materials.
Fig. 1.16 also gives the material zT values of most commercial available
materials [60]. These are believed the ‘Best Practice’ materials [61]. 2 3Bi Te
based materials (n-leg composition close to 2 0.8 0.2 3Bi Te Se , typical p-leg
composition 0.8 0.2 32Sb Bi Te ) dominate the applications around room temperature
(<200℃) [62]. Peak zT value for these materials usually falls in the range 0.8-
1.1.
For TEGs applied in temperature range from 200 to 600℃, group-IV tellurides,
such as PbTe, GeTe and SnTe, are typically employed as n-leg materials with
peak zT at about 0.8. In these medium-temperature applications, 2AgSbTe -based
alloys can be used both in n-legs and p-legs. These materials are reported
several times with peak zT>1. Among them, p-type TAGS, 20.85 0.15GeTe AgSbTe ,
has been successfully applied in long-life TEGs for a long time, of which the
maximum zT>1.2. For TEGs working in this 200 - 600℃ range, there are some
more material choices for both p-legs and n-legs, e.g., skutterudite-based
compounds, complex oxides and silicide-based materials. Silicide-based
materials in [63] (n-type 2Mg Si and p-type 1.73MnSi ) and [58,64] (n-type 2Mg SiSn
with 1.1maxzT and p-type 4 3Zn Sb with 1.3maxzT ) were deployed other than lead
alloys, which are restricted according to environment regulations. There are

Chapter 1 Introduction
25
still some other novel materials reported with higher zT values, most of which
are bulk nanostructured materials. However, none has been yet reproduced by
other laboratories, not to mention their industrialization [65,66].
For applications from 600℃ up to 1000℃, SiGe alloys are one of the only a
few ideal choices for both n-legs and p-legs [67]. TEGs operational in these
applications are usually Radioisotope Thermoelectric Generators (RTGs) for
the reason that they consume the released heat from the nuclear decay of
radioactive isotopes (typically Plutonium-238) to generate electrical power.
It should be noticed that there is another interesting property for all the TE
materials. By changing their carrier concentration, their zT could reach its peak
values at different temperatures in their operational ranges [56,65,68,69]. This
brings the convenience that it can be assumed TEGs are working at their max
zT points during TEG system design and optimization, as long as their
operating temperatures are constant or only fluctuate in relatively narrow
intervals.
Despite distinguishing TEGs by their working temperature ranges, they can
also be sorted by the ways how the thermocouples in a module are arranged.
TEG modules can then be labelled either conventional (theoretical) or
segmented or cascaded. Actually these differences in module design are also
with the purpose to suit different operating temperatures. Applications around
room temperature are suitable for the conventional TEG modules. Segmented
TEG modules are typically used in automotive applications with temperatures
up to about 500℃. The operational temperature range of cascaded TEGs is
partially overlapped with segmented TEGs. Theoretically, their operating
temperatures can go much higher. Another advantage of cascaded TEGs is that
their design can avoid the material compatibility issues.
1) Conventional (theoretical)
Thermocouples in this category are connected thermally in parallel and
electrically in series, as illustrated in Fig. 1.15c. Each leg of a thermocouple is
casted by one homogeneous composition. This module configuration is still the
most widely used by far, because of the structure’s simplicity and durability.
Its detailed pros and cons are:
Simplest structure; easiest to manufacture.
Convenient and direct to calculate out the performances of the TE
materials.

1.4 Thermoelectric Devices
26
Easier to optimize their working conditions.
TEG modules in this category have the longest lifetime.
Lower efficiency, since only a few layers of TE materials in legs work on
the ideal temperature points; inner temperature gradients are not included;
carrier concentration is not tuned.
Heterogeneous thermal expansion of legs can easily happen; it affects the
module lifetime especially when temperature gradients are large.
2) Segmented
Segmented TEGs are for large temperature differences (typical 600T ).
Thermocouples in this category are still thermally in parallel between legs, and
electrically in series. The only difference now is that p- and n- legs are
combinations of TE material segments and segments in each leg are thermally
and electrically both in series. Alternative configurations of segmented TEG
modules are shown in Fig. 1.17 [70 ]. The motivation of this segmented
arrangement is to optimize TE materials along the temperature gradients in legs.
Operational temperature ranges and peak zT temperature points are different
between various thermoelectric materials. In case a TEG device working
between extremely large temperature differences, one homogeneous TE leg,
e.g., the legs in a conventional TEG module, will probably sinter on the hot
side and work far below optimal zT regions on the cold side. These phenomena
have negative effects on device efficiency or even can unfit a TEG module
from these applications. Using different materials in series in each leg, each
segment can be adapted near to its maximum zT point. As a total, the device
efficiency is improved and operational temperature range is extended. Material
compatibility within each leg and between legs is very important, as explained
in the above section. In order to handle this, each material segment may have
different aspect ratios (cross-sectional area to segment thickness) [71]. The
advantages and disadvantages of these segmented TEGs are:
Improved efficiency; easier to get the maximum zT.
Higher total contact resistance.
Higher design complexity and lower manufacturability, affected by the
compatibility and the thermal expansion.
Bad device stability because of the segment connections.

Chapter 1 Introduction
27
Fig. 1.17 - Alternative segmented TEG modules.
3) Cascaded
Similar as the segmented style, cascaded arrangement is also for high
temperature applications. Their structures are compared in Fig. 1.18 [54].
Besides the aim to improve the working temperature of every material spot, the
invention of cascaded arrangement is mainly to get rid of the material
compatibility issue. In a cascaded module, each stage has an independent
circuit comparable with each thermocouple in a conventional module. By
nature, the compatibility issue is ruled out. Cascaded TEG modules have the
following pros and cons:
Improved efficiency; easier to get the peak zT.
Higher total contact resistance.
Higher design complexity than conventional modules, although simpler
than the segmented.
Bad device stability from the stage connections.
Fig. 1.18 - Schematic diagram comparing segmented and cascaded TEGs.

1.4 Thermoelectric Devices
28
To summarize, it can be noticed that all the above module designs are plate-
like. Thickness of the modules is mainly in the range from millimeters (the
thin-film TE devices [72]) to centimeters. Except for the plate-like modules,
some other module styles have also been proposed, such as ring-structured
module design for heat flows in radial direction [73]. It is concluded that this
configuration is advantageous in that the thermoelectric converter is at the
same time working as conductor and generator. In addition, the efficiency
could be improved because it enhances its heat sink capabilities and depresses
the reverse heat transfer inside the converter, which usually are the two main
factors downgrading a TEG’s performance. However, this configuration
dramatically increases manufacturing complexity and still remains as lab
demonstration setups. An mW-level module, a ‘thermoelectric tube’, was
exposed in [73] and is shown here in Fig. 1.19. Two years after, a report from
DOE by Bell and Crane referred that a similar cylindrical TEG system was
being under construction by BSST [ 74 ]. But no further details could be
identified and no further reports have come out afterwards. Recently, another
tubular module is fabricated by Schmitz et al. [75]. It has an updated design to
[73] that can better release thermal stress. A picture of the module is given in
Fig. 1.20. There are also some other types of TEGs, such as flexible polymer
based micro TEGs for wearable electronics, of which details can be found in
[76,77].
Fig. 1.19 - Photo of a 'thermoelectric tube'.

Chapter 1 Introduction
29
Fig. 1.20 - Tubular PbTe module consisting of four thermocouples connected
with nickel bridges.
1.4.3 Thermoelectric Coolers
Thermoelectric coolers (TECs) are heat pumps utilizing the Peltier effect. They
harness electrical power to accelerate heat transfer from hot to cold or force
heat to flow from cold to hot [78]. As the other working mode of a TE device,
TECs share most characteristics with TEGs. They are connected through the
Kelvin relationship by Equation (1.8). The performance of any refrigerator is
generally described quantitatively by its coefficient of performance (COP).
This is given by the heat flux being pumped by the device, TEC
cQ , divided by the
rate at which electrical energy is supplied, TEC
eP .
TEC
c
TEC
e
heat flux being pumped QCOP =
electrical power input P (1.18)
2
1 2 12 (T T )TEC tc
c tc pn tc e tc tcQ n T I n I R n k (1.19)
2
2 1(T T )TEC tc
e tc pn tc eP n I n I R (1.20)
In the above equations, 1T is the temperature of the surface the pumped heat is
removed from. 2T is the surface end of the pumped heat flux. All the other
variables can refer to the previous section for detailed definitions.
Correspondingly, based on the previous assumptions, equations describing the
maximum pumping capability maxQ , peak COP point maxCOP , and achievable
highest temperature difference between the two substrate surfaces maxT of a
conventional TEC module are listed in Table 1.3 [54,57].
Table 1.3 - Peak performances of a typical TEC module.
maxQ maxCOP maxT
T 2
1 2Z T

1.4 Thermoelectric Devices
30
I 1
TEC
TEC eT R 1 TEC
TEC eT M R 1
TEC
TEC eT R
V 2TECT 1TECM T M 2TECT
TEC
cQ
2
1 12
TEC
Z TK T
T
1
2 1
(M 1)1TEC
TK T ZT
T T
0
1M ZT , TEC tc pnn ,
2 1T T T , 2 1(T T ) 2T ,
TEC tc tcK n k
As TEGs, segmented TEC modules also have the material compatibility
concerns. But different from TEGs, the compatibility factor of TECs is
expressed as [79]:
1 1s zT T (1.21)
Similar to TEGs, TECs can also be sorted into categories. In applications, if a
TEC module has to operate between widely different temperature differences,
it is unlikely that a single conventional module will suffice. Segmented or
Cascaded TEC modules may be adequate. The problem of segmented modules
is that their achievable maximum temperature difference is still limited by
2
1 2Z T ; cascaded modules are just complicated to design and manufacture.
Instead, conventional modules are stacked together and named multi-stage
modules [53]. It should be clear that these multi-stage TECs do not belong to
another category of TE devices. They are just another way of building
cascaded modules, except that cascaded modules are usually for TEGs and
multi-stage modules are typically used to call these TECs. Fig. 1.25 gives a
schematic illustration of a two-stage TEC module.
Fig. 1.21 - Schematic arrangement of a two-stage TEC module [53].
TECs are unique miniature heat pumps and coolers. As TEGs, TECs have
excellent scalability. An ordinary module as shown in Fig. 1.14 has a size of
around 5mm x 40 mm x 40 mm. There are also mass-produced modules in
larger sizes and they can be stacked to be multi-stage. Smaller modules can be

Chapter 1 Introduction
31
in several cubic millimeters; thin-film modules can be thin as a piece of paper.
Some pictures of these modules are given below in Fig. 1.22 and Fig. 1.23.
Fig. 1.22 - A three-stage TEC module [80].
Fig. 1.23 - Pictures of a) a mini TEC module [81], b) a thin-film TEC module
in 0.1 mm x 3.0 mm x 3.5 mm [82].
1.5 Literature Review
In short, the motivations of this project are trying to harness thermal energy
using TEGs in the HT-PEM power system to improve its system efficiency and
to deploy TECs to improve the load-following capability of the HT-PEM
system. Since this project is application-oriented, literature review is carried
out covering three main aspects.
1.5.1 Thermoelectric Materials
Over the past decades, the exploration of high-efficient thermoelectric
materials has been under intensive research from both an academic perspective
and with a view to industrial applications. It is the mainstream in the whole

1.5 Literature Review
32
thermoelectric community. The focus is on increasing the TE material figure of
merit, zT, aiming for more energy-efficient and cost-effective systems.
Referring to Equation (1.9) and (1.12), to maximize zT, the following
approaches are required: to maximize the Seeback coefficient , to increase
the material electrical conductivity , and to minimize the thermal
conductivity k . However, these three properties are typically conflicting to
each other. Lower carrier concentration insulators and semiconductors have
larger Seebeck coefficient. By the same token, it results in poorer material
electrical conductivity. Fig. 1.24 shows the compromise between the three
properties changing with carrier concentration [56]. It can be noticed that the
optimum carrier concentrations for peak zT are between 1910 and 2110 carriers
per 3cm . In this range, typical materials are heavily doped semiconductors.
Compared to them, electrical and thermal properties of metals are directly
related by electrons. On the other extreme, non-metals just have too low
electrical and thermal conductivities.
Fig. 1.24 - Compromise of material properties to maximize zT [56].
In the past several decades, laboratory zT values have been increased several
fold. Thermoelectric materials being intensively studied include bismuth and
bismuth-antimony, lead telluride and related compounds, silicon-germanium
alloys, skutterudites and clathrates, oxides, and some other types, e.g., zinc
antimonide, half-heusler compounds, metal silicides, and boron carbide [53,83].
To achieve higher zT values on these materials, typical material treatment
methods include nanotechnology [ 84 ], reducing device dimensionality
[85,86,87], engineering the band structure by doping [88,89], and exploring

Chapter 1 Introduction
33
new materials with complex crystalline structure [56,90]. Fig. 1.25 presents the
history of zT and some recent achievements in labs [65,91]. Yet most of these
materials or devices have not been available in market by today. So far as
actual applications are concerned, bismuth telluride is still the most common
thermoelectric material with 1zT [65,68,92]. Unfortunately, zT must have
values of two or higher to enable thermoelectrics from niche applications into
the mainstream of energy technologies.
Fig. 1.25 - History of Thermoelectric Figure of Merit, ZT.
Until now, most efforts are being done on the reduction of the thermal
conductivity for higher zT value from various scattering sources to block the
phonon propagation [88]. It is believed that further reduction in the thermal
conductivity alone may be sufficient to raise zT up to 2. For zT values of 3 or
even higher, it is becoming essential to enhance both the Seeback coefficient
and the electrical conductivity steadily. In order to realize these breakthroughs,
a clear challenge for the thermoelectric research community is to understand
exactly the physics behind the reported high zT values [65,78,88].
It should be mentioned that, besides the theoretical immaturity, there are also
some other factors hampering the progress for higher zT. They are the
measurement inaccuracy and material sensitivity [54]. The temperature
gradients, particularly larger ones, induce considerable systematic inaccuracies,
which could easily make the zT uncertainty reach 50%. Moreover, the material
sensitivity to its impurity, dopant concentration variation and inhomogeneity

1.5 Literature Review
34
makes the measurement accuracy far worse. These factors are also the reasons
that many materials reported with remarkable high zT values, but few have
been confirmed by others.
TE material developing is under so intensive research that many novel
materials come out every day in literature. Since this project is application-
oriented, it is not in this project’s scope to go too deep into thermoelectric
material science. For more detailed reviews, these books [53,54,93,94], review
papers [56,92,95,96,97] and some other papers cited above are excellent
references.
1.5.2 Module Design and Operating Concerns
Module-level (also called device-level) researches on thermoelectrics have
been done on [98]:
The geometric parameters of thermocouple legs (ratio of length to cross-
sectional area and non-uniform shape) [99],
The combination optimization of n- and p- type legs [100],
The thermal and electrical contact resistances [101],
The Joule heat effects due to the material electric resistance [102,103],
Heat and its induced thermal stress from Thomson effect
[104,105,106,107],
The effects of futile heat transfer forms (e.g., the inner reverse heat
convection and heat losses to the ambient) [108],
The dynamic behaviors of TE device [109,110],
The effects of thermocouple arrangements in segmented and
cascaded/multi-stage TE devices [111,112].
These studies not only cover the design, modeling, optimization and
fabrication of the hardware (the concrete thermocouple and module), but also
include some operating strategy considerations, such as the proposed “pulse
mode” operation of TEG modules for higher efficiency in [109]. Of TECs,
transient cooling effect for improved performances has been extensively
investigated [113,114,115]. Working mode switch between TEG and TEC is
also considered by Buist and Lau in [116]. They concluded that TECs can be
safely used as TEGs and vice versa. Working as TEGs, TEC modules provide
the highest conversion efficiency, since TEC modules are fabricated from the
highest performance material available for that temperature range. In other
words, material requirements of TECs are more rigorous. Admasu et al. [117]
Chapter 1 Introduction
35
analyzed the effects of temperature non-uniformity on a module and concluded
that uniform temperature distribution delivered better module power output.
TECs can carry out bidirectional heating and cooling and they act fast. A
conventional single-stage TEC module can achieve a cooling target in several
seconds; novel thin-film TEC modules are even faster and on the order of
milliseconds [82]! Whether it is heating or cooling depends on the direction of
the electric current put on the module. They are also capable: a conventional
TEC module can generate a temperature difference up to 70℃ between its two
substrate surfaces, or can drive a heat flux at a rate of 125W [118]. As Yang
and Stabler concluded in [ 119 ], TEC characteristics have not been fully
harnessed in applications.
In [120], Gao and Rowe concluded that inner electrical and thermal contact
resistances will probably have no substantial effect on module performances as
long as leg length of thermocouples not short than 1mm. Later in [99], they
theoretically and experimentally proved that a reduction in thermocouple leg
length can significantly enhance the module power output by about 75% but
slightly lower the module efficiency by 8%. This conclusion also has important
economic benefits and can save nearly 50% of the module cost, based on the
assumption that these modules have at least 20-year lifetime. Xuan [121] draws
similar conclusions. Besides the module cost, heat exchanger and operating
costs were also considered in the report.
As mentioned previously, Thomson effect is typically neglected in applications
under the condition that temperature gradients or fluctuations are relatively
modest and no large electric current is drawn out [55,122,123]. However, as
proved in experiments [124,125,126], Thomson coefficient can be on the same
order of magnitude of Seebeck coefficient. Thomson heat affects the module
performances evidently and brings extra thermal stress onto thermocouples
aside from the Joule’s heat [107].
1.5.3 Thermoelectric Applications
1.5.3.1 TEG Applications
TEGs are competitive in waste-heat recovery, but rarely used as primary power
suppliers due to their low heat to electricity ratio [127]. Major waste-heat
sources could be industrial processing heat, cogeneration system, waste heat
from the transportation sector, and municipal solid waste. In contrast with
conventional energy conversion systems, TEG systems can be more suitable to

1.5 Literature Review
36
these energy sources because of the desirable merits, such as no moving parts,
simple configuration, long-run unattended operation for thousands of hours,
adaptability for any temperature range or energy level, no scaling effect from
mW to several hundred kW, and so on [54].
In applications, a practical TEG system basically consists of four parts
[119,139]:
A support structure, a heat exchanger housing, which works as a heat
source, and on which surfaces the thermoelectric modules are located. It
generally looks like a tube with modified inner faces to benefit the heat
absorption from the exhaust media (gases or liquids). It can also include a
fuel combustion unit to provide heat, if sufficiently efficient TEG modules
can be designed [119].
TEG modules, the heat-power convertors, the materials of which need
tuned accordingly to the operating temperature range (the exhaust media
temperature), as mentioned above.
A heat rejection system, a heat sink. The function is to maintain
temperature gradients through the TE modules by drawing heat from them
and rejecting the heat out of the TEG system.
An electrical power conditioning and interface unit, to bridge the TEG
system and external electric load and to keep the TEG system working
around its maximum power point.
The whole TEG system should be studied as an integrated solution, because TE
material properties and heat exchanging performance are closely linked [128].
There are also other auxiliary parts, such as valves, pumps, fans, sensors and
controllers to make sure the TEG system working properly. Due to the present
low efficiency of TEGs, the power consumption of these balance of plant (BoP)
needs to be elaborately reduced for higher net power output of a TEG system.
1) TEG and fuel cells
Exhaust heat from various fuel cells is low-grade in general for TEGs. The
application of TEGs in recovering this exhaust heat is relatively novel. In 2004,
Huston et al. finished a report named: Application of Thermoelectric Devices
to Fuel Cell Power Generation: Demonstration and Evaluation [129]. It is the
first project that has systematically studied applying TEGs in a fuel cell system
for increased electrical generation efficiency and reduced environmental
impacts. This feasibility study was carried out on a UTC 200kW Phosphoric

Chapter 1 Introduction
37
Acid Fuel Cell Power Plant (PC25C) and TEG modules manufactured by
Leonardo Technologies, Inc. (LTI). Tasks were conducted on TEG potential
contribution assessment, site assessment, installation and initial operation and
supplementary TE wafer (single thermocouple) study. Precious experiences
and lessons were gained. TE Device test stands (Control & Data Acquisition
System) and procedures were developed. Cost estimations were accomplished.
However, system optimization was not carried out in this project.
Chen et al. [130] proposed a PEMFC-TEG system. In the system, TEGs were
used to recover the exhaust heat from a HT-PEM fuel cell stack. A module-
level three dimensional full-geometry physical TEG model in ANSYS
FLUENT® was prepared for the convenience of the co-design and co-
optimization of the system. A prototype PEMFC-TEG setup was also
demonstrated in the lab. The TEG system developed is an aluminum exhaust
pipe with hexagonal cross-sectional shape and un-finned bare inner surface.
TEG modules are anchored on the pipe external surface. In this work, model
was prepared; experiments were carried out to validate the TEG model.
However, optimization was neither done on the TEG system nor its operational
scenarios.
A solid oxide fuel cell and TEG (SOFC-TEG) hybrid system was studied in
[ 131 ] using a zero-dimensional system model. Heat recovery through a
regenerative heat exchanger was assumed ideal. SOFC and TEG were
supposed working under the same current density. The main parameters and
the optimally operating regions of the hybrid system, SOFC and thermoelectric
generator were determined. More recently, the application potential of TEGs in
a SOFC micro combined heat and power (CHP) system was assessed by
Rosendahl et al. [132]. Results proved that with TEG application it is possible
to increase the micro-CHP system power output by more than 15%, or system
efficiency by some 4 to 5 percentage points. However, the tested hybrid micro-
CHP did not gain those percentage points as inefficient commercially available
TEG modules were applied. Energy flow analysis and new designs of TEG
systems were also prepared for future work.
Kuo et al. [ 133 ] designed and built a LT-PEM fuel cell thermoelectric
cogeneration system in the lab. It is a sophisticated system that provides both
high-quality electric power and heated water. Key components include the fuel
cell stack, hydrogen feeding subsystem, air supply subsystem, humidifier
subsystem, and TEG heat recovery subsystem. System dynamic simulation and
a comprehensive analysis were conducted both theoretically and
1.5 Literature Review
38
experimentally. The concurrent simulation was carried out in
MATLAB/Simulink to guide the system design beforehand and facilitate
operation analysis afterwards. The model accuracy was proved >95%.
Experiments showed that the combined efficiency was higher than 92%.
However, almost no details on design and optimization of the TEG subsystem
were addressed in the report. Results also indicated that the TEG heat recovery
contribution to the cogeneration system efficiency seemed limited, which was
only about 1%. Still, this work is a detailed reference of the design and
operation of a fuel cell-TEG cogeneration system.
An idea of employing a cylindrical TE p-leg as the cathode material of a SOFC
single cell for an additional electric potential was explained in [134]. It is a
novel way of applying TEGs in a SOFC system. Results showed that the open
circuit voltage of the cell increased, ascribed to the additional TE voltage.
2) TEGs in automotives
TEG applications on waste-heat recovery from the transportation sector
(especially in vehicles) have been thoroughly studied for decades. The
motivations of integrating TEGs into automotives are stimulated by the pursuit
for high system efficiency, the emission regulations (especially CO2) and the
advantages of TEGs.
Birkholz et al, in collaboration with Porsche studied the installation of a TEG
system into Porsche 944 in the 1980s [135]. Nissan Research Centre has also
developed TEGs for different temperature ranges and tested them under
different working conditions of ICEs [136,137]. In Japan, there was another a
national project launched from 2002 by the New Energy and Industrial
Technology Development Organization (NEDO), named “The Development
for Advanced Thermoelectric Conversion Systems” [138].
Vázquez et al. reviewed most of the past automotive projects (Porsche, Nissan,
Hi-Z projects), which had reported relatively low efficiencies [139]. In this
paper, he concluded that the following factors should be considered in
constructing an efficient TEG system:
The space and weight of a whole TEG system are constrained and the
support structure takes the major part.
The inner part of a support structure is often finned and/or hole-plate to
enhance heat convection. The optimization of its geometry is vital, since:
proper turbulence needs to be generated for better heat convection;

Chapter 1 Introduction
39
pressure drop caused by the inner structure should be controlled; its size
should be appropriately tuned to enable all TEG modules to keep working
near their peak performance points; its material is also important covering
both performance and lifetime aspects. The heat exchanger degradation
mechanisms should also be counted.
Different TEG module materials and configurations may need to be chosen
for various temperature ranges. In some cases, the shape, size and
configuration of the thermocouples are also taken into account for higher
efficiency, space taken, mechanical strength and so on.
The heat sink design and its integration. Heat sinks reported in most
automotive applications are designed as liquid coolant jackets in aluminum
and integrated as part of the ICE coolant circulation system. Few are air-
cooled radiator. The integration method is also quite important to improve
for the efficiency.
TEG mounting methods. The mounting methods should guarantee lower
contact resistance on both surfaces of a module and be elastic to
compensate thermal stress.
Thermal and electrical insulation of TEGs. Thermal insulations done on
modules should be both inner-module and external between the ambient.
Inner heat bypasses between thermocouples and heat loss to the ambient
can both affect the module performance significantly. It needs to be sure
that most heat passes through thermocouple legs instead of the bypasses.
Electrical insulation is an important part of all electrical systems and also
important to eliminate safety hazards.
Later, Saqr et al. has done a more detailed and theoretical analysis on these
factors [140]. After a theoretical analysis on TEG system energy balance, this
paper reviewed the following TEG systems reported in literature: a 1kW
system from Hi-Z Inc., a 35.6W system from Nissan and a 300W HZ-20
system jointly built by Clarkson University, Delphi Systems and General
Motors (GM). He summarized that the following four main factors controls the
efficiency of a TEG system:
Heat exchanger geometry
Heat exchanger materials
The installation site of the TEG
The coolant system of the TEG
In recent years, several companies in vehicle industry, BMW/Ford, GM,
General Electric, and Cummins, have accomplished a few vehicle-TEG
1.5 Literature Review
40
cogeneration projects funded by the US Department of Energy Freedom Car
Office, in the scope of the “Advanced combustion Engines” research plan
[141,142]. In these projects, TE materials and material-related supports were
provided by Marlow Industries. G. Jeffrey Snyder from Jet Propulsion
Laboratory was consulted on material theory and segmenting technology.
Crane et al. from Gentherm subsidiary BSST proposed the integration
architectures and assisted the above companies to bring into practice [143].
They have done detailed systematic researches on TEG integration and
optimization. Most of the results are already published and patented. As part of
the fruits, GM has developed a TEG exhaust heat recovery system and tested
on a Chevrolet Suburban. Some experiences and results can be found in
[144,145].
Another project also funded by DOE was on TEG waste-heat recovery from
stationary diesel generators [146]. TEG system architectures were evaluated
and analyzed. Fuel diversity effects were also studied. An economic analysis
was carried out and coded in Visual Basic to facilitate other similar projects.
In addition, there are also some other teams who have done a great amount of
research examining vehicle exhaust heat recovery. Hendricks et al.
[128,147,148,149] has created a generic generator model and subsequently
optimized the system under various conditions and TEG materials. Thacher et
al. [150,151,152] concentrates on testing and optimizing TEGs in vehicle
exhaust heat recovery applications. Instead of most other studies focusing
barely on TEG systems, they paid much attention to their impacts on whole
vehicle systems. Full of details, their studies are valuable and practical samples.
Espinosa et al. from European vehicle companies AB Volvo and Renault
Trucks SAS also undertook a numerical investigation on the feasibility of
applying TEGs to recover the exhaust heat from a truck diesel engine [69].
TEG modules they used are uni-couples, i.e., a single module contains a single
thermocouple. Temperature unevenness among TEG modules and its effects on
TE material properties were considered. The whole TEG assembly was divided
into two parts: high temperature portion and low temperature portion. TEG
modules composed of Mg2Si/Zn4Sb3 were for high temperatures followed by
Bi2Te3 for the low temperature portion. Compact plate-fin heat exchanger
‘Strip-fin plate-fin, surface 1/4(s)-11.1’, which was used here for the diesel
engine exhaust gas, was directly taken from a mass-produced exhaust gas
recirculation (EGR) unit. It was composed of five plates, each of which
included a hot-side heat exchanger housing, a cold side and an intermediate

Chapter 1 Introduction
41
wall. Water coolant from the engine at 90℃ was circulated in the cold side as
the heat sink. TEG modules were supposed mounted in the walls. The whole
TEG system was then numerically discretized by the size of modules through
the finite-difference method in engineering equation solver (EES) software.
After model validated, the number of modules along the exhaust gas flow
direction was optimized under two conditions: a) all the modules were
electrically in series; b) all of them were in parallel. These are also the only
two electrical connection styles of all the TEG modules considered in this work.
In the above analysis, the number of modules perpendicular to the exhaust gas
was fixed to 100. Afterwards, it was variable and studied for a fixed total
number of modules, 10000, all of which were assumed electrically in parallel.
System pressure drop and power output were plotted. In the end, the optimum
ratio between the two TE module portions has been addressed. This study is an
entire piece of work with plenty of practical and detailed considerations.
In recent few years, there are also some other studies on vehicle-TEG
cogeneration. Andersson from Scania AB studied different power conditioning
techniques for TEGs in vehicle waste heat recovery [153]. Two different
Maximum Power Point Tracking (MPPT) technologies were compared. It was
concluded that for the tens of watts TEG-rig worked on, a switching network
with two states seems more efficient than a DC/DC converter. Phillip et al.
[154] investigated two MPPT algorithms for TEGs: the perturb and observe
(P&O) algorithm and extremum seeking control (ESC). The study was carried
out in MATLAB/Simulink. The results showed that an ESC MPPT algorithm
in combination with a buck-boost DC-DC converter was more favorable for
TEG systems. Various MPPT algorithms for TEGs were also reviewed and
compared by Chatzidakis et al. in [155]. It was concluded that, compared to
short circuit current method (Isc), open-circuit voltage (Voc) method is more
practical for TEG systems with power output less than 1kW. For over 1kW
TEG systems, P&O method and Incremental Conductance method (InC) are
more competitive, although they are more complex. Transient behaviors of a
TEG-EGR system was simulated using a 3D CFD model by Högblom et al.
[156]. They concluded that the greatest heat transfer resistance was identified
in the gas phase and it was a tricky tradeoff between the heat convection
performance and the maximum allowable pressure drop. A thermal buffering
device was developed by Mizuno et al. to cope with temperature fluctuations
for a TE power generator [157]. There are also some other studies on these
similar topics [158,159,160,161].
1.5 Literature Review
42
Besides all the aforementioned TEG application studies, some other
application potentials, e.g., in wearable electronics [162], in furnaces or stoves
[163], on ships [164], as sensors [165], in wireless sensor or telecom networks
[166], in photovoltaic-TEG hybrid systems [167] etc., have also been analyzed.
Compared to them, researches on vehicle-TEG cogeneration are more
systematic and thorough. Publications from these researches are the main
references in relation to this project.
1.5.3.2 TEC Applications
TECs, which are also well known as Peltier coolers, have been successfully
commercialized for decades. The merits of them are that they are unique
miniature heat pumps and can manipulate high heat-flux transfer swiftly and
precisely. In contrast, conventional fluid-refrigerant systems may be more
efficient in kW-level applications or above. They are just too bulky to suit
high-performance, compact cooling systems, from milliwatts to hundreds watts.
In addition, characteristics like system simplicity, maintenance-free, noiseless,
rugged, highly scalable, and low cost in mass production, make TECs more
competitive [54]. Although there are still some other future miniature
refrigeration cooling technologies, such as MEMS vapor compression and
capillary pump loop (CPL), none of them are yet commercialized [168]. In
applications, TEC systems usually have quite similar elements and design and
operation concerns as the abovementioned TEG systems.
In electronic or optoelectronic cooling applications, TECs have been widely
deployed to remove heat from the surfaces of microchips and other component,
to cool down infrared detectors and charge-coupled devices (CCDs), and to
stabilize the temperature of laser diodes etc. [168,169,170]. The purposes are to
maintain a safe temperature for, to increase the working frequency of and
reduce electromagnetic noise in integrated circuits.
TE dehumidification has been examined by several researchers. Vian et al.
developed a small dehumidifier prototype made up of three TEC modules and
optimized its design and performance by a homemade computational model
(AERO) [171]. Their system COP was proved much lower than the vapor-
compression devices. Another study was conducted by Jradi et al. [172] who
constructed an integrated TE-photovoltaic renewable system to dehumidify air
and produce fresh water. A system model was also built and validated by
experiments. They determined that the air flow rate, air inlet conditions and
electric current input to the TEC modules were the controlling parameters. The
system was considered practical for stand-alone remote areas applications.

Chapter 1 Introduction
43
Automotive applications of TECs are believed of great interest [119]. TECs
have the potential to bring revolution into automotive heating, ventilation, and
air-conditioning (HVAC) systems, as the forthcoming TE-HVAC systems have
many desirable features. They can be more silent and compact, potentially
lighter, faster, more reliable and durable than today’s conventional systems.
Actually, some mature products are already available in the market, such as
climate seats from Gentherm [173].
There are still many other applications of TECs, e.g., in mug rugs, in cup
holders, in picnic baskets, in mobile freezers, as sensors, in reformers and in
medical instruments [118,174,175]. As Yang and Stabler commented in [119],
the entire potentials of TECs, especially their quick response and bidirectional
heating/cooling capabilities, are not yet fully appreciated or utilized.
1.6 Project Objectives
The general motivation of this PhD study is to improve the performances of a
methanol-fueled HT-PEM power system by virtue of TE device integration. In
particular, TEGs are introduced with the purpose of increasing the system
efficiency through recovering the exhaust heat; system dynamic performance,
the load-following capability, is also hopefully to be enhanced by applying
TECs for a better heat management of components, in turn, improved system
efficiency can also be envisaged.
In previous sections, the theories and features of the components being worked
on and experiences of similar projects in literature have been studied and
surveyed. To form the detailed tasks and to draw the roadmap of this project,
the present study comprises the answers of the following questions:
1) What are the application potentials of TE devices in the HT-PEM system?
2) How to optimize the performance of the TEG subsystem?
3) What are the controlling parameters of the design and operation of the
TEG subsystem?
4) What is the optimal design of the TEG subsystem?
5) Can TECs improve the performances of the methanol evaporator in the
HT-PEM system?
The initial question is with the purpose to draw a blueprint of the whole project.
Answers to it have embodied Paper 1, in which question 5 is also partially
consisted. Question 2-4 are then formulated to examine TEG contributions to

1.6 Project Objectives
44
the HT-PEM fuel cell system in details. Answers to these questions are the
main body of this study and contribute the major improvement to current state-
of-the-art studies on TEG applications. These answers are presented
successively in Paper 2, 3 and 4. The last question is meant to assess the roles
of TECs in a TE-integrated methanol evaporator. Feasibility of the new
evaporator design is proved by simulation results elaborated in Paper 5. In this
paper, contributions to the research community on exploring novel applications
of TECs are embodied by a new concept as well.

45
2 Methodology
In this chapter, the methodology employed in this research is described in
detail. Overall, it consists of four parts: modeling of the HT-PEM fuel cell
stack, design and modeling of the TEG subsystem, overview of TEG subsystem
characteristics, and modification of the methanol evaporator.
2.1 Modeling of the HT-PEM Fuel Cell Stack
The scheme, energy flow, operating principles and main issues of the current
HT-PEM fuel cell power system have been introduced in section 1.3.4. Since
the fuel cell stack is the main exhaust heat source [48], modeling of it is of first
priority. A short literature survey has picked out several major research groups
working on HT-PEM fuel cell modeling. They are listed in Table 2.1.
Table 2.1- Some research groups on HT-PEM fuel cell modelling.
Authors Model features Publications Solvers
Cheddie,
Munroe et
al.
2D, 3D; single-phase, multi-phase;
isothermal, non-isothermal; pure-
numerical, semi-empirical
[176,177,178,179,
180,181,182]
COMSOL
Multiphysics®
Sousa,
Mamlouk,
Scott et al.
2D, single phase, isothermal [183,184] COMSOL
Multiphysics®
Peng, Lee
et al.
3D, single-phase, non-isothermal
and isothermal
[185] ANSYS Fluent®
lobato,
Cañizares,
Rodrigo et
al.
3D, single-phase, isothermal, half-
cell
[186,187] COMSOL
Multiphysics®
Korsgaard,
Bang,
Andreasen,
Kær et al.
0D, semi-empirical, cell and
lumped stack
[188,189,190,191,
192]
EES and Matlab
Simulink®
Zenith et
al.
0D, empirical, cell and lumped
stack
[193,194,195,196,
197]
Matlab
Simulink®/C++

2.2 Design and Modeling of the TEG Subsystem
46
These models can be roughly divided into two categories by the modeling
purposes. First three groups are all about in-situ electrochemical modeling of
phenomena happening in part of a single cell. Their models are more
theoretical exhaustive and cell-design-oriented compared to the second
category, the remaining two groups.
In the second category, the dynamic HT-PEM fuel cell model from Zenith et al.
is specific for control purposes. Not like other models, this model uses the
external load characteristic as the cell operating input, such as MOSFET
transient. All the modeling and parameter regression were done at fuel cell
working at 150℃. This study and the model created are exclusively focused on
different time constants of various phenomena taking place in a fuel cell and
scenarios handling them. In a word, they are all control-oriented, which are not
so desirable to this project.
The HT-PEM fuel cell model composed by Korsgaard et al. uses a series of
semi-empirical equations to express the fuel cell voltage versus current density,
anode CO impurity, cathode stoichiometry and cell temperature. It is
operating-oriented. This model shows excellent accordance with experiments
on PEMEAS P1000 MEAs operated between 120℃ and 200℃, which gives
the probability of carrying out an accurate heat-balance calculation on a HT-
PEM fuel cell stack. Furthermore, taking into account of fuel contamination
effects on the fuel cell performance offers more versatility for future work.
Since this model is also on hand, it is chosen to describe the electrochemical
reactions of the fuel cell stack in this work.
All the equations were written in EES, a general-purpose numerical solver.
Another reason for choosing this software is that a sophisticated database of
substance thermodynamic and kinetic properties is contained, which means
higher accuracy of calculations, such as on the heat balance.
2.2 Design and Modeling of the TEG Subsystem
The TEG subsystem is designed for the cathode exhaust gas of the HT-PEM
fuel cell stack. It is the main exhaust heat source, which conclusion is from the
tentative assessment done in Paper 1 and shown below. In practice, it can be
concluded from section 1.5.3 that a concrete TEG system is always composed
of an assembly of numbers of TEG modules with efficient heat exchanging
structures. They are together scaled properly to account for the magnitude of
the exhaust heat sources.

Chapter 2 Methodology
47
Table 2.2 - Tentative assessment of all the possible TEG installation positions.
Position TH (℃)/TC (℃) Heat flux (W) Representative
materials
Ppeak
Cathode exhaust 145/25 1012 Bi2Te3 & (Bi,Sb)2Te3 58W
Evaporator 250/70 329 Mg2SiSn & Zn4Sb3 24W
Reformer 400*/250 160 Mg2SiSn & Zn4Sb3 7W*
Cooler 205/25 39 Bi2Te3 & (Bi,Sb)2Te3 3.1W
Burner exhaust 137.5/25 34.5 Bi2Te3 & (Bi,Sb)2Te3 2W
*The temperature of hydrogen catalytic combustion is in the range 100 -
2210℃. Here a typical temperature is used.
2.2.1 The TEG Modules
First of all, the type of the TEG modules needs to be decided. Since the
cathode exhaust gas temperature is below 200℃ and this project is application-
oriented, conventional TEG modules made from bismuth telluride (Bi2Te3) are
the prime choice. There will be certain amount of these modules in the TEG
subsystem.
The next question is how to model all these Bi2Te3 TEG modules, the whole
TEG assembly. In all those researches reviewed above, module models applied
can be sorted into lumped models, one-dimensional models and multi-
dimensional models. All these models are based on or derived from the
classical analytical model from Ioffe, the Figure of Merit theory [52].
Lumped models are usually the direct use of Ioffe’s theory. If material
properties are independent from temperature and all the contact resistances are
neglected, main equations for TEG modules are
2(T T ) 2tc
h tc h c pn h e tc TEMQ k T I I R n n (2.1)
2(T T ) 2tc
c tc h c pn c e tc TEMQ k T I I R n n (2.2)
2 tc
e h c pn h c e tc TEMP Q Q T T I I R n n (2.3)
Where hQ means heat energy absorbed at the hot side and cQ is the rejected
heat from the cold side. TEMn is the total number of TE modules in a system. eP
is the system power output. Similar as the above, control equations for TEC
modules can also be derived from Equation (1.19) and (1.20).
TE devices described by these models can be a uni-couple module ( 1tcn ), a
multi-thermocouple module ( 1tcn ), and multi-modules (a whole TE assembly,
1TEMn ) [69,131,198,199]. Lumped models are scarcely applied in module-

2.2 Design and Modeling of the TEG Subsystem
48
level studies, because inner phenomena of a module cannot be described. They
are more operating- or application- oriented. In other words, they are more
system-level suitable. Though they seem all over-simplified, these models are
handy tools to preliminarily assess performances of a TE system with
satisfactory accuracy and help identify some key features. The tentative
assessment conducted in Paper 1 is based on these lumped models.
One-dimensional (1D) and two-dimensional (2D) device models can be
available for either module-level or system-level studies. Inner structure
optimizations, i.e., module-level studies, assisted by 1D or 2D device models
are numerous [99,108,120,200]. In system-level studies, representative device
models are from Crane and Jackson [201], Espinosa et al. [69], Yu and Zhao
[202], and Karri et al. [152]. TEG assemblies considered in their works consist
of multi-modules. Dealing with uneven temperature and heat flux distributions,
TEG assemblies in these models are typically discretized into control-volumes.
Control volumes can be single thermocouples [202], uni-couple modules
[69,201], and multi-thermocouple modules [152]. TEG performance in each
control volume is calculated by the above lumped model. In general, these
models can be expressed as:
2(T T ) 2TEM tc
tc
h tc h c pn h e
n n
Q k T I I R (2.4)
2(T T ) 2TEM tc
tc
c tc h c pn c e
n n
Q k T I I R (2.5)
2
TEM tc
tc
e h c pn h c e
n n
P Q Q T T I I R (2.6)
pn , tck and tc
eR can either be constant or varying with temperature. Most values
of these variables in the above studies are directly substituted by material
properties. Due to model simplifications, e.g., neglecting contact resistances,
module performances deduced in this way are higher than tested. A simple
solution is to adapt these values to fit [152]. Moreover, these studies usually
involve module design optimizations, such as leg length, feature ratios and so
on. For system-level studies, modules should be mature; they should have been
optimized beforehand. Therefore, modules are just treated as black boxes in
this work. Numerical discretization of them is also reconsidered. Our
simulation results show that discretizing modules by thermocouples is
unnecessarily fine; treating each module lumped is contrarily too coarse and
module performance is overestimated in this way. Module parameters in our
studies, , k and eR , are directly from workbench [203]. A typical test stand is
shown as follows; test procedures can also be found in [203]. These empirical

Chapter 2 Methodology
49
module parameters are believed easier reproducible in real-life applications.
Overall, modeling modules in such way has two advantages: a) mitigating the
model complexity and b) keeping the model precision from vulnerable to
simplifications.
Fig. 2.1 - A test stand for module parameters [203].
Phenomena inside and outside of TE devices are not always uni-dimensional or
bi-dimensional. TE device design and optimization are complicated. To count
in all these phenomena and design and optimization aspects thoroughly and
unconstrainedly, only three dimensional (3D) TE device models are capable.
For the same reasons, these models are cumbersome to solve and numerical
solvers, e.g., ANSYS Fluent® and COMSOL Multiphasic®, are used in most
cases. These features further inherently determine that these models are
powerful tools for module-level studies but difficult to use when up to system-
level [98,106,107,117,130]. Representative models in this category are from
Antonova and Looman [204] and Jaegle [205]. It is believed that a lot of work
still needs to be done in this area especially after the thermoelectric
mechanisms are understood more deeply in the future. In our work, TEC
modules are modeled in 3D. The abovementioned two models combined with a
simplified model from Chen and Snyder [206] were referred as literature input.
2.2.2 Heat exchangers
Heat exchangers are key components of a TE system and affect its
performance significantly. Investigations under way in literature on heat
exchanger performances include: fin geometry design, configuration

2.2 Design and Modeling of the TEG Subsystem
50
optimization, more precise simulation, and operation assessment. In the open
literature, fin geometries widely used in TE applications are basic straight-base
rectangular fins (illustrated in Fig. 2.2) and optimization of them has been
scarcely addressed [152,201,202,203]. Discussions on different fin geometries
and optimal heat exchanger configuration, i.e., mainly on optimal heat
exchanger housing size, are even fewer [69,207,208,209,210,211].
Fig. 2.2 - Illustration of straight-base rectangular fins.
In our work, the cold side of the designed TEG subsystem for the HT-PEM
fuel cell stack is two blocks of water jacket, as shown in Fig. 2.3. Flowing
inside these water jackets is the liquid coolant, liquid methanol/water fuel
stored in the tank (shown in Fig. 1.7). The hot side heat exchanger of the TEG
subsystem is for the exhaust gas from the fuel cell stack. Instead of the basic
rectangular fin heat exchangers, compact plate-fin heat exchangers are chosen.
Similar choice was made in [69]. Since in a gas-to-liquid heat exchanger, the
heat transfer coefficient of the liquid side is ordinarily orders of magnitude
larger than the gas side [212]. Following a broadly used simplification in
literature, the two water jackets were represented by the ambient temperature
in our studies.
The main effort was invested on optimizing the hot side. Compact heat
exchangers, by their very nature, lead to high performance [213]. There are
kinds of compact plate-fin heat exchangers [213], such as plain rectangular,
plain trapezoidal, wavy, serrated or offset strip fin, louvered, perforated, and
pin fin. Some are presented in Fig. 2.4. Which of them is more suitable in the
current TEG subsystem yet needs to be answered. In [69], compact plate-fin
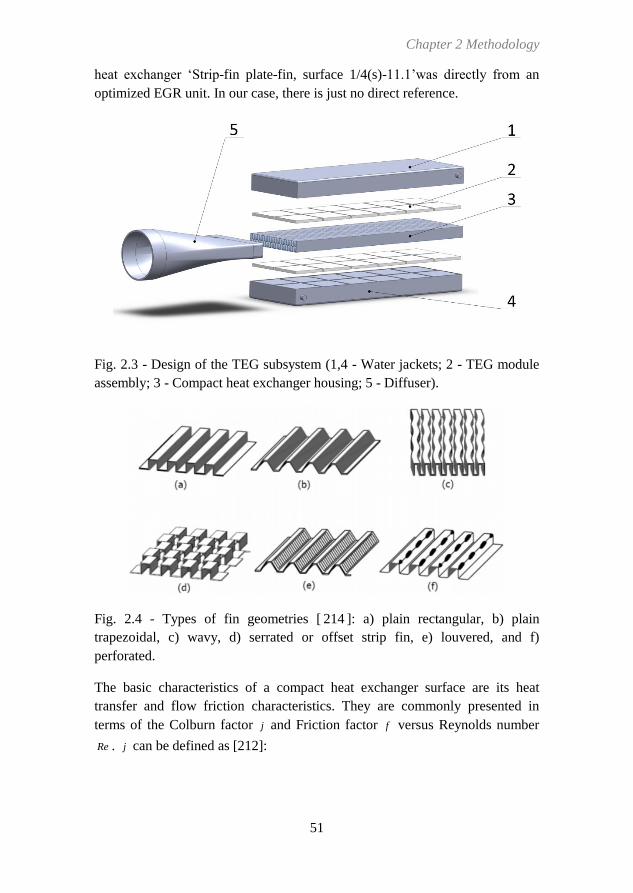
Chapter 2 Methodology
51
heat exchanger ‘Strip-fin plate-fin, surface 1/4(s)-11.1’was directly from an
optimized EGR unit. In our case, there is just no direct reference.
Fig. 2.3 - Design of the TEG subsystem (1,4 - Water jackets; 2 - TEG module
assembly; 3 - Compact heat exchanger housing; 5 - Diffuser).
Fig. 2.4 - Types of fin geometries [ 214 ]: a) plain rectangular, b) plain
trapezoidal, c) wavy, d) serrated or offset strip fin, e) louvered, and f)
perforated.
The basic characteristics of a compact heat exchanger surface are its heat
transfer and flow friction characteristics. They are commonly presented in
terms of the Colburn factor j and Friction factor f versus Reynolds number
Re . j can be defined as [212]:

2.2 Design and Modeling of the TEG Subsystem
52
, .
2 3 out h
min
h m c GDj = StPr , St = ,G = ,Pr = Re=
Gc A k
(2.7)
In the above equations, St is the Stanton number and Pr is the Prandtl number.
outh is the fluid-heat exchanger heat convection coefficient. c is the fluid
specific heat. G is the fluid mass flux. m is the mass flow rate. minA is the
minimum free flow cross section area of the heat exchanger. is the kinetic
viscosity and k is the thermal conductivity of the fluid. hD is the hydraulic
diameter of the flow channels. After outh is calculated from j , thermal
conductance UA (the heat exchanging performance of the heat exchanger) can
finally be identified. On the other hand, f determines the pressure drop of a
heat exchanger, in turn the parasitic loss and net heat recovery benefit, through
the following equation. Detailed definitions of variables in the equation can be
found in Paper 2.
2
, 2
, ,
,
4[ 1 1 ]
2
gas hx hx gas in
hx gas in gas out
gas in h gas
u f Lp
D
(2.8)
For compact heat exchangers, the relationships between j , f and Re are
unfortunately different for different surfaces and are hard to describe
accurately by equations, although there are some correlations for less-critical
design purposes in literature [215], such as Magahanic correlation, Wieting
correlation and Joshi & Webb correlation. In other words, these characteristic
data of compact heat exchangers are all empirical and screening as many kinds
of compact heat exchangers as available is becoming the only choice for our
purposes. Hereon, the database from Kays and London on compact heat
exchangers [213] is becoming a handy tool and was referred to in our
simulations. It includes a wide range of fin geometries and for which j and f
are directly gained from series of experiments. The database has been
extensively applied in industry for decades. For our studies, the other way,
numerical predictions, is just again too cumbersome and easily mismatching
from experimental data.
Optimizing a heat exchanger is always an art of compromise between heat
exchanging performance and its pressure drop. Besides the fin geometry, the
dimensions of the heat exchanger housing also matter. The reasons are that the
cross section area of the heat exchanger housing determines Re of the fluid and
the length of it decides the pressure drop. Nowadays, another factor, the MPPT
power conditioning, is becoming an increasingly popular after treatment
method of a TEG system. Whether it affects the heat exchanger design has

Chapter 2 Methodology
53
never been answered clearly in literature. All these uncertainties have been
systematically analyzed in Paper 2 and 3.
2.3 Overview of TEG Subsystem Characteristics
A multiple parameter sensitivity analysis approach was performed on the TEG
subsystem model to grab a whole picture of the subsystem characteristics.
Structural and operating parameters that affect the subsystem performances
most were helped identified. This approach was originally designed to assess
the effects of measurement inaccuracy in experiments on calculated variables
[216]. The assumption supporting this calculation is that all the input variables
are uncorrelated and random. It means the covariance between them is
assumed to be zero. Then the uncertainty in a system’s performance can be
expressed by the following equation. In our studies, this approach was
imported through an uncertainty propagation tool in EES. Details can be found
in Paper 2 and the main references [217,218,219].
2 2
1 2, , , , .ii X ni
U X U f X X X (2.9)
2.4 Modification of the Methanol Evaporator
Modification of the methanol evaporator is with the purposes to benefit the
whole HT-PEM system efficiency and its load-following capability from the
merits of integrated TE modules. The integration takes place between the
evaporator fins and the evaporation chamber through replacing the cartridge
heaters in the original design with TE modules. The modification is illustrated
in the following figure.

2.4 Modification of the Methanol Evaporator
54
Fig. 2.5 - Modification of the methanol evaporator.
The feasibility and the advantages of the TE-integrated evaporator have been
elaborated in Paper 5 by simulation. From energy balance standpoint, this
modification reduces the heat loss of the original evaporator, in turn increases
the efficiency.
Instead of uni-directionally heating or cooling, these integrated TE modules
will alternately enhance and suppress the heat flux from the fins to the chamber
and shift between the two modes frequently. That is to say, they regulate the
heat flux. Moreover, the magnitude of the enhancement and suppression can be
simply and instantly manipulated by the electric current supplied to the
modules. All in all, these features will result in much more precise and swifter
heat flux control inside the evaporator and a superheated methanol/water
gaseous mixture with more accurately controlled temperature and flow rate. In
short, the TE-integrated evaporator can be more efficient and with enhanced
dynamic performance.
TEC modules herein are typically under rather small temperature gaps. They
control the heat flux other than temperature. Their working modes are various
and their dynamic performance is vital. To emphasize the specialties of this
application, TE modules are named thermoelectric heat flux regulators (TERs).
Aside from the above TE-modification, there are already some other designs of
the evaporator available in practice, for example, attaching the evaporation
chamber directly to the surface of the fuel cell stack. However, this TE-

Chapter 2 Methodology
55
integrated evaporator has more control freedom and is of more theoretical and
practical potentials.


57
3 Principal Results and Discussion
In this chapter, principle discoveries throughout the progress of this research
project are summarized. They are organized by the working modes of the TE
modules. Detailed results and discussions have been elaborated in all the
papers.
3.1 TEG Exhaust Heat Recovery
A numerical model of the TEG heat recovery system is developed in EES and
validated. It is a finite-element model with higher precision on fluid properties
and heat transfer. It is also of higher flexibility for both design-type and
simulation-type problems. In detail, its versatility is enhanced by integrating a
database of 59-type compact plate-fin heat exchangers. A discretized ɛ-NTU
solution method is additionally of great help.
Sensitivity analysis is conducted on the model and proves its value in
understanding the characteristics of the subsystem. Main parameters affecting
the design and operation of the subsystem are identified in descending
priorities.
Through simulation, the optimal configuration of the current TEG exhaust heat
recovery subsystem is confirmed. There are 48 TEG modules in the final
configuration. As arranged in the following Fig. 3.1, 2 blocks, each with 2
rows of 12 modules are installed. They together decide the dimensions of the
subsystem including the attached heat exchanger housing. The ideal type of the
heat exchanger is ‘Pin-fin plate-fin, surface PF-4(F)’. TEG module type was
temporarily selected to be Melcor HT8, of which the performance data are
from [203]. Taking into account of the MPPT power conditioning, all the
modules are electrically divided in 3 branches along the exhaust gas flow, as
represented in different colors in the figure. This configuration is optimized for
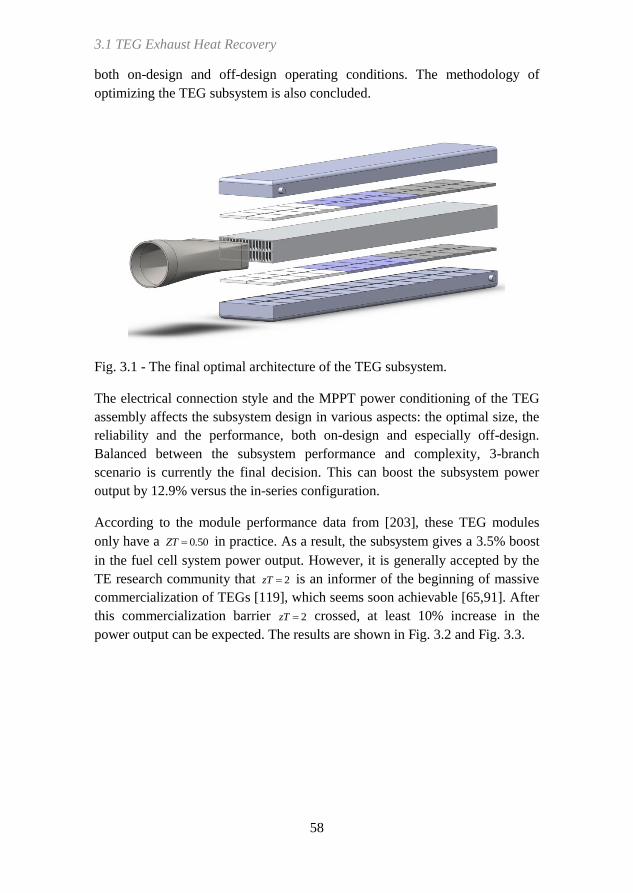
3.1 TEG Exhaust Heat Recovery
58
both on-design and off-design operating conditions. The methodology of
optimizing the TEG subsystem is also concluded.
Fig. 3.1 - The final optimal architecture of the TEG subsystem.
The electrical connection style and the MPPT power conditioning of the TEG
assembly affects the subsystem design in various aspects: the optimal size, the
reliability and the performance, both on-design and especially off-design.
Balanced between the subsystem performance and complexity, 3-branch
scenario is currently the final decision. This can boost the subsystem power
output by 12.9% versus the in-series configuration.
According to the module performance data from [203], these TEG modules
only have a 0.50ZT in practice. As a result, the subsystem gives a 3.5% boost
in the fuel cell system power output. However, it is generally accepted by the
TE research community that 2zT is an informer of the beginning of massive
commercialization of TEGs [119], which seems soon achievable [65,91]. After
this commercialization barrier 2zT crossed, at least 10% increase in the
power output can be expected. The results are shown in Fig. 3.2 and Fig. 3.3.

Chapter 3 Principal Results and Discussion
59
Fig. 3.2 - Contribution of TE heat recovery to the fuel cell system, ZT=0.50.
0.0 0.1 0.2 0.3 0.4 0.5 0.6 0.7 0.8 0.9 1.00
200
400
600
800
1000
1200
1400
1.015
1.020
1.025
1.030
1.035
1.040
1.045
Current density [A/cm2]
Po
wer
ou
tpu
t [W
]
Fuel cellFuel cell
Fuel cell+TEGFuel cell+TEG
No
rmali
zed
po
wer
ou
tpu
t [-
]
Normalized Fuel cell+TEGNormalized Fuel cell+TEG
0 10 20 30 40 5020
25
30
35
40
45
50
55
60
System current [A]
Syste
m v
olt
ag
e [
V]
Fuel cellFuel cell
Fuel cell+TEG for voltageFuel cell+TEG for voltage
Fuel cell+TEG for currentFuel cell+TEG for current
0.0 0.1 0.2 0.3 0.4 0.5 0.6 0.7 0.8 0.9 1.00
200
400
600
800
1000
1200
1400
1.05
1.06
1.07
1.08
1.09
1.10
1.11
1.12
Current density [A/cm2]
Po
wer
ou
tpu
t [W
]
Fuel cellFuel cell
Fuel cell+TEG, ZT=2Fuel cell+TEG, ZT=2
No
rmali
zed
po
wer
ou
tpu
t [-
]
Normalized Fuel cell+TEGNormalized Fuel cell+TEG

3.2 TE-integration in the Evaporator
60
Fig. 3.3 - Expected contribution of TE heat recovery to the fuel cell system,
ZT=2.
3.2 TE-integration in the Evaporator
TE-integration in the Evaporator is proved of mutual benefits. The evaporator
in the initial design can only constantly produce 50.1W heat or above if with
the supplementary electric heat from the cartridge heaters. As compared in Fig.
3.4, the TE-integrated evaporator can provide the chamber of 15.0-124.4W
heat actively. Besides, the characteristics of TE devices can be more fully
utilized when working as TERs. The TE-integrated evaporator furthermore
losses less heat to the ambient and supplies electric heat more efficiently to the
chamber during the system cold start.
Fig. 3.4 - Differences in chamber heat output versus electric current between
two designs of the evaporator.
0 10 20 30 40 5020
25
30
35
40
45
50
55
60
System current [A]
Syste
m v
olt
ag
e [
V]
Fuel cellFuel cell
Fuel cell+TEG for voltageFuel cell+TEG for voltage
Fuel cell+TEG for currentFuel cell+TEG for current

Chapter 3 Principal Results and Discussion
61
A 3-dimentional evaporator model is set up in ANSYS FLUENT®. With the
help of it, the heat output range of the TE-integrated evaporator has later been
extended to 2.5W to 152.2W. This is achieved by finer rectangular fins of
increased heat exchange surface area. However, the evaporator pressure drop is
also increased simultaneously. As always, there is tradeoff between them. The
numerical simulation also clarifies that axial conduction penalty is insignificant
in the heat exchanger of the TE-modified evaporator.


63
4 Conclusions and Future Work
Two case studies on modifying a HT-PEM fuel cell system with TE devices
have been carried out in this work. A TEG heat recovery subsystem was
designed for recovering heat for electricity from the exhaust gas ejected out of
the fuel cell stack. A numerical model was prepared and applied in optimizing
the subsystem configuration for various working conditions of the fuel cell
stack. Practices are carried out on identifying the optimal heat exchanger type,
its proper dimensions for the subsystem and power conditioning effects on the
subsystem design. Characteristics of the TEG subsystem are also analyzed
through simulations. TECs are integrated into the methanol evaporator of the
current fuel cell system to improve the load-following capability of the
evaporator and the whole system. A numerical model for the TE-integrated
evaporator is built and has assisted in all the analyses carried out and published.
The feasibility of this TE-integration is presented. It is also proven that the
whole system efficiency can be increased by the improved heat management of
the TE-integrated methanol evaporator. This work has broadened the
application of TE devices. The characteristics of TE devices have been more
thoroughly explored and better utilized. All these add up to the scientific
contributions of this work.
Throughout this work, it is shown that modifying the HT-PEM fuel cell system
with TE devices exhibits several benefits and potentials. It is proven that the
TEG recovered power can improve the fuel cell system efficiency during
normal operation. However, more potential values of the TEG application in
the current fuel cell system remain to be assessed by future work. Because
of its simplicity of operation, the TEG subsystem can potentially assist the fuel
cell system in some special occasions and supplement with some useful
features to the fuel cell system. For example, the TEG power can kick in much
earlier before the fuel cell stack temperature reaches 100 or 140℃, which can
be utilized to drive the BoP components and prepare the stack startup.
This whole idea has been introduced as ‘assist the system cold start’ in
Chapter 4 Conclusions and Future Work
64
Paper 1. The TEG power can also assist the fuel cell stack shutdown
process and prepare it into standby mode. When the whole system is in
standby mode, the TEG subsystem can treat the system as a heat capacitor
and use the ambient temperature fluctuations to power up essential
sensors and auxiliaries to monitor and maintain the fuel cell stack
condition. Potentially, these ‘special’ applications can prolong the fuel cell
lifetime and lower cost.
Up to this point, the TEG subsystem for HT-PEM fuel cell exhaust heat
recovery has been optimized through simulations. Results show that the
conducted optimization has increased the TEG subsystem power output by
12.9% through solely choosing an optimum power conditioning method. The
power output improvement then goes up to 40.6%, when the performance
differences between types of heat exchangers are also considered. Although it
turns out that the current optimized subsystem takes approximately the same
space of the fuel cell stack, it can only recover less than 100W power from the
exhaust gas. This improvement is relatively small especially regarding that the
fuel cell system is potentially for vehicle applications, of which power density
is crucial.
However, the methodology of applying compact heat exchangers, modeling the
subsystem and optimizing its configuration can be projected into various
projects including the fuel cell system design and optimization itself. The
design optimization of the TEG subsystem individually is an entire piece of
knowledge preparation before TEGs are successfully commercialized.
For future work, practical concerns and the feasibility of deploying this TEG
subsystem to increase the fuel cell system efficiency still need further
experimental assessments. Larger scale system-level modeling and simulation
study would also be beneficial. In detail, work can be carried out on the
following topics:
1) Concrete system build and assessment in the lab. The more variables
included the better. They can be:
heat exchanger type, size, material and fin geometry,
updated TEG modules of different materials, for example, quantum-
well thermoelectric material or oxides [152],
electrical connection styles,
power conditioning technologies.
2) Modeling and simulation studies can be on:
Chapter 4 Conclusions and Future Work
65
TEG subsystem water jacket design,
TEG subsystem diffuser design, experimental work can also be
included,
dynamic performance study,
HT-PEM-TEG whole system modeling and operation strategy study,
A rigorous thermo-economic optimization.
3) TEG power output power conditioning, integration into the whole system,
management and utilization can also be interesting.
TEC applications in the current fuel cell system, on the other hand, are already
practical. The simulation work in Paper 5 has revealed that the integration of
TE devices into the methanol evaporator can most likely make it work more
efficiently and improves its controllability. Possible further work can be:
1) A new evaporator model in EES, as the current 3D finite-element model
only describes part of the evaporator and will be cumbersome for study of
the whole evaporator;
2) Thermal and fluid dynamic optimization;
3) The transient performance of the TE-integrated evaporator;
4) Control scenario study and corresponding control circuit consideration and
buildup;
5) Experiments.
TECs have been widely applied in industry for a long time, because they are
unique miniature and capable. Applications as TERs have the potential to
redefine the device and have the possibility to let the device become epic.


67
References
[1] S.J. Andreasen. Design and Control of High Temperature PEM Fuel Cell System.
PhD dissertation, Aalborg University, 2009; ISBN: 87-89179-78-1.
[2] WHO/UNICEF (World Health Organization/The United Nations Children’s
Fund). Joint Monitoring Programme (JMP) for Water Supply and Sanitation.
2011. http:// www.wssinfo.org/data-estimates/introduction.
[3] V. Ramanathan, G. Carmichael. Global and regional climate changes due to black
carbon. Nature Geoscience 1, 221-227 (2008).
[4] United Nations Environment Programme (UNEP) Year Book 2013.
[5] U.S. Energy Information Administration (EIA), International Energy Outlook
2013, July 2013.
[6] GFN (Global Footprint Network) (2012). Annual report 2011.
http://www.footprintnetwork.org/en/index.php/GFN/page/world_footprint/
[7] United Nations. 1987."Report of the World Commission on Environment and
Development." General Assembly Resolution 42/187, 11 December 1987.
[8] Renewable Energy Policy Network for the 21st Century (REN21), Renewables
2013 Global Status Report.
[9] George A. Olah, Alain Goeppert, and G. K. Surya Prakash. Beyond Oil and Gas:
The Methanol Economy, 2nd ed.; Wiley-VCH: Weinheim, Germany, 2009.
[10] Vincenzo Balzani, Alberto Credi, and Margherita Venturi.Photochemical
Conversion of Solar Energy. ChemSusChem 1(1-2), 26-58, 2008.

References
68
[11] George W. Crabtree, Mildred S. Dresselhaus, and Michelle V. Buchanan. The
hydrogen economy. Physics Today 57(12), 39 (2004); doi:
10.1063/1.1878333.
[12] George A. Olah. Beyond oil and gas: the methanol economy. Angewandte
Chemie International Edition 44(18), 2636-2639, (2005); doi:
10.1002/anie.200462121.
[13] Ryan O’Hayre, Suk Won Cha, Whitney Colella, and Fritz B. Prinz. Fuel Cell
Fundamentals. John Wiley & Sons, Inc., 2nd edition, 2009. ISBN 978-0-470-
25843-9.
[14] F Barbir. PEM Fuel Cells: Theory and Practice. Academic Press. Elsevier /
Academic Press, 2012. ISBN 9780123877109. URL
http://books.google.dk/books?id=elO7n4Z6uLoC.
[15] Wolf Vielstich, Huber t A. Gasteiger , Arnold Lamm and Harumi Yokokawa.
Handbook of Fuel Cells - Fundamentals, Technology and Applications. 2010
John Wiley & Sons, Ltd. ISBN: 978-0-470-97400-1.
[16] Larminie, J., & Dicks, A. L. (2003). Fuel Cell Systems Explained (2nd ed.).
Chichester, UK: Wiley.
[17] Søren Juhl Andreasen, Jakob Rabjerg Vang, Søren Knudsen Kær. High
temperature PEM fuel cell performance characterisation with CO and CO2
using electrochemical impedance spectroscopy. International Journal of
Hydrogen Energy 2011;36: 9815-9830.
[18] Fuel Cell Today (2011). The Fuel Cell Today Industry Review 2011. Technical
report, Fuel Cell Today. xiii, 5, 6, 11.
[19] T.A. Zawodzinski, J. Davey, J. Valerio, S. Gottesfeld, Electrochim. Acta 40
(1995) 297.
[20] G Sasikumar, J.W Ihm, H Ryu. Dependence of optimum Nafion content in
catalyst layer on platinum loading. Journal of Power Sources 132(2004) 11-17.
[21] Lee J.H. and Lalk T.R. (1998a) “Modelling fuel cell stack systems”, Journal of
Power Sources, 73(2), 229-241.

References
69
[22] Giorgi L., Antolini E., Pozio A., and Passalacqua E. (1998) “Influence of the
PTFE content in the diffusion layer of low-Pt loading electrodes for polymer
electrolyte fuel cells”, Electrochimica Acta, 43(24), 3675-3680.
[23] Ralph T.R., Hards G.A., Keating J.E., Campbell S.A., Wilkinson D.P., Davis H.,
StPierre J., and Johnson M.C. (1997) “Low cost electrodes for proton
exchange membrane fuel cells”, Journal of the Electrochemical Society,
144(11), 3845-3857.
[24] Mench, M. M. (2008). Fuel Cell Engines (1st ed.). Hoboken, New Jersey: Wiley.
[25] Xuan Cheng, Zheng Shi, Nancy Glass, Lu Zhang, Jiujun Zhang, Datong Song,
Zhong-Sheng Liu, Haijiang Wang, Jun Shen. A review of PEM hydrogen fuel
cell contamination: Impacts, mechanisms, and mitigation. Journal of Power
Sources 165 (2007) 739-756.
[26] J.S. Wainright, J-T. Wang, D. Weng, R. F. Savinell and M. H. Litt. J.
Electrochem. Soc. 142. L121 (1995).
[27] Wang, J., R. Savinell, J. Wainright, M. Litt, and H. Yu (1996). A H2/O2 fuel
cell using acid doped polybenzimidazole as polymer electrolyte.
Electrochimica Acta 41(2), 193-197.
[28] Y. Zhai, H. Zhang, G. Liu, J. Hu, B. Yi, J. Electrochem. Soc. 154 (2007) B72.
[29] D. Weng, J. S. Waimight, U. Landau and R. F. Savinell, Ext. Abstract, 188th
Electrochemical Society Meeting. Chicago, IL, Oct 8-13, (1995).
[30] T.A. kawodziiski, Jr., T. E. Springer, J. Davey, R. Jestel. C. Lonez. J. Valerio
and S. Gottesfeld. J. Electrochem.. Soc. 140, 1981 (l993).
[31] T.F. Fuller and J. Newman, J. Electrochem. Sot. 139, 1332 (1992).
[32] Serenus 166/390 Air C fuel cell module. http://serenergy.com/wp-
content/uploads/2012/11/166_390-Air-C-data-sheet_v2.5-0210.pdf
[33] Das SK, Reis A, Berry K. Experimental evaluation of CO poisoning on the
performance of a high temperature proton exchange membrane fuel cell. J
Power Sources 2009;193(2): 691-8.
[34] Bellows RJ, Marucchi-Soos EP, Terence Buckley D. 1996. Analysis of reaction
kinetics for carbon monoxide and carbon dioxide on polycrystalline platinum

References
70
relative to fuel cell operation. Industrial Engineering and Chemical Research
35(4):1235-1242.
[35] D.S. Watkins, 1993. Research, development and demonstration of solid polymer
fuel cell systems. In Fuel Cell Systems, Blomen L, Mugerwa M (ed.). Plenum
Press: New York, 493-530.
[36] Salvador M. Aceves, Gene D. Berry, Joel Martinez-Frias, Francisco Espinosa-
Loza. Vehicular storage of hydrogen in insulated pressure vessels.
International Journal of Hydrogen Energy 31(2006) 2274-2283.
[37] Joan M. Ogden, Margaret M. Steinbugler, Thomas G. Kreutz. A comparison of
hydrogen, methanol and gasoline as fuels for fuel cell vehicles: implications
for vehicle design and infrastructure development. Journal of Power Sources
79(1999) 143-168.
[38] Bård Lindström, Lars J. Pettersson. Hydrogen generation by steam reforming of
methanol over copper-based catalysts for fuel cell applications. International
Journal of Hydrogen Energy 26(2001) 923-933.
[39] Divisek J, Oetjen H-F, Peinecke V, Schmidt VM, Stimming U. 1998.
Components for PEM fuel cell systems using hydrogen and CO containing
fuels. Electrochimica Acta, 43(24):3811-3815.
[40] Yuka Oono, Atsuo Sounai, Michio Hori. Influence of the phosphoric acid-
doping level in a polybenzimidazole membrane on the cell performance of
high-temperature proton exchange membrane fuel cells. Journal of Power
Sources 189(2009) 943-949.
[41] Jinfeng Wu, Xiao Zi Yuan, Jonathan J. Martin, Haijiang Wang, Jiujun Zhang,
Jun Shen, Shaohong Wu, Walter Merida. A review of PEM fuel cell durability:
Degradation mechanisms and mitigation strategies. Journal of Power Sources
184(2008) 104-119.
[42] Jinfeng Wu, Xiao-Zi Yuan, Jonathan J. Martin, Haijiang Wang, Daijun Yang,
Jinli Qiao, Jianxin Ma. Proton exchange membrane fuel cell degradation
under close to open-circuit conditions Part I: In situ diagnosis. Journal of
Power Sources 195(2010) 1171-1176.
[43] Samuel Simon Araya. High Temperature PEM Fuel Cells: Degradation and
Durability. PhD dissertation, Aalborg University, 2012; ISBN: 978-87-92846-
14-3.
References
71
[44] Stolten, D. (2010). Hydrogen and Fuel Cells: Fundamentals, Technologies and
Applications (1st ed.). Weinheim, Germany: Wiley-VCH.
[45] Alexandros Arsalis. Development of Next Generation micro-CHP System:
Based on High Temperature Proton Exchange Membrane Fuel Cell
Technology. PhD dissertation, Aalborg University, 2011; ISBN: 978-87-
92846-03-7.
[46] http://serenergy.com/wp-content/uploads/2013/05/S-
165L_datasheet_v1.0_0313.pdf
[47] X. Gao, M. Chen, G. J. Snyder, S. J. Andreasen and S. K. Kær. Thermal
management optimization of a thermoelectric-integrated methanol evaporator
using a compact CFD modeling approach. Journal of Electronic Materials. In
press, DOI: 10.1007/s11664-013-2514-2.
[48] X. Gao, M. Chen, S. J. Andreasen, S. K. Kær. Potential usage of thermoelectric
devices in a high-temperature polymer electrolyte membrane (PEM) fuel cell
system: Two case studies. Journal of Electronic Materials 2012; 41(6): 1838-
1844.
[49] Methanex Corporation, Technical Information & Safe Handling Guide for
Methanol (Version 3.0, September 2006).
[50] Francis J. DiSalvo. Thermoelectric Cooling and Power Generation. Science 285,
703-706 (1999).
[51] Lon E. Bell. Cooling, Heating, Generating Power, and Recovering Waste Heat
with Thermoelectric Systems. Science 321, 1457 (2008); DOI:
10.1126/science.1158899.
[52] A.F. Ioffe. Semiconductor thermoelements and thermoelectric cooling. London:
Infoseach Limited; 1957.
[53] H. Julian Goldsmid. Introduction to Thermoelectricity. New York: Springer;
2010.
[54] Thermoelectrics Handbook Macro to Nano (ed. Rowe, D. M.), CRC Taylor &
Francis, Boca Raton, 2006.
References
72
[55] Lazard M, Fraisse G, Goupil C, Scherrer H. Thermal analysis of a
thermoelectric: a way to non conventional design. In: Proceedings of the 6th
European Conference on thermoelectrics, vol. 1; 2008. p. 2-15.
[56] G. Jeffrey Snyder and Eric S. Toberer. Complex thermoelectric materials.
Nature Materials 2008;7(2):105-114.
[57] J. Zhang, Thermoelectric Technology, 1st ed. Tianjin: China Tianjin Institute of
Power Sources, 2008.
[58] G. Jeffrey Snyder. Application of the compatibility factor to the design of
segmented and cascaded thermoelectric generators. APPLIED PHYSICS
LETTERS, VOL 84, No. 13.
[59] G. Jeffrey Snyder and Tristan S. Ursell. Thermoelectric Efficiency and
Compatibility. PHYSICAL REVIEW LETTERS, VOLUME 91, NUMBER
14.
[60] http://www.thermoelectrics.caltech.edu/
[61] Cronin B. Vining. The Limited Role for Thermoelectrics in the Climate Crisis.
Solutions Summit, 20080501, NYC.
[62] D.M. Rowe, ed., CRC Handbook on Thermoelectrics (CRC Press, Boca Raton,
FL, 1995).
[63] Seijiro Sano, Hiroyuki Mizukami, Hiromasa Kaibe. Development of High-
Efficiency Thermoelectric Power Generation System. KOMATSU Technical
Report, 2003 VOL. 49 NO.152.
[64] http://tegnology.dk/p/materials
[65] Cronin B. Vining. ZT ~ 3.5: Fifteen Years of Progress and Things to Come. The
European Conference on Thermoelectrics, ECT2007, Odessa, Ukraine, Sept.
10-12, 2007.
[66] A. J. Minnich, M. S. Dresselhaus, Z. F. Ren and G. Chen. Bulk nanostructured
thermoelectric materials: current research and future prospects. Energy
Environ. Sci., 2009, 2, 466-479.
[67] Jihui Yang and Thierry Caillat. Thermoelectric Materials for Space and
Automotive Power Generation. MRS Bulletin 31(03),2006: 224-229.

References
73
[68] C.B. Vining, "The thermoelectric limit ZT~1: Fact or Artifact," Eleventh
International Conference on Thermoelectrics (ICT92), K. R. Rao, Ed.
Arlington, TX USA: Univ. of Texas at Arlington, Arlington, TX, 1992, pp.
223-231.
[69] N. Espinosa, M. Lazard, L. Aixala, and H. Scherrer. Modeling a Thermoelectric
Generator Applied to Diesel Automotive Heat Recovery. Journal of
Electronic Materials. 23 June 2010.
[70] J. LaGrandeur, D. Crane, S. Hung, B. Mazar, and A. Eder. Automotive waste
heat conversion to electric power using skutterudite, TAGS, PbTe and BiTe.
Int. Conf. Thermoelectrics, Aug. 2006, Paper B10-2, pp. 1-6.
[71] D. Crane and L. E. Bell. Progress towards maximizing the performance of a
thermoelectric power generator. Proc. Int. Conf. Thermoelectrics, pp. 1 2006.
[72] Rama Venkatasubramanian, Edward Siivola, Thomas Colpitts & Brooks
O'Quinn. Thin-film thermoelectric devices with high room-temperature
figures of merit. NATURE, VOL 413, 11 OCTOBER 2001.
[73] Gao Min and D M Rowe. Ring-structured thermoelectric module. Semicond. Sci.
Technol. 22 (2007) 880-883.
[74] L.E. Bell and D.T. Crane, Int. Conf. Thermoelect. (Freiburg, Germany, 2009).
[75] Andreas Schmitz, Christian Stiewe, and Eckhard Müller. Preparation of Ring-
Shaped Thermoelectric Legs from PbTe Powders for Tubular Thermoelectric
Modules. Journal of Electronic Materials, Vol. 42, No. 7, 2013; DOI:
10.1007/s11664-012-2402-1.
[76] J. Weber, K. Potje-Kamlotha, F. Haasea, P. Detemple, F. Völklein, T. Doll.
Coin-size coiled-up polymer foil thermoelectric power generator for wearable
electronics. Sensors and Actuators A 132 (2006) 325-330.
[77] Wulf Glatz, Simon Muntwyler, Christofer Hierold. Optimization and fabrication
of thick flexible polymer based micro thermoelectric generator. Sensors and
Actuators A 132 (2006) 337-345.
[78] Christophe Goupil, Wolfgang Seifert, Knud Zabrocki, Eckhard Müller and G.
Jeffrey Snyder. Thermodynamics of Thermoelectric Phenomena and
Applications. Entropy 2011, 13, 1481-1517; doi:10.3390/e13081481.

References
74
[79] Ursell, T. S. and Snyder, G. J. Compatibility of Segmented Thermoelectric
Generators.Twenty-first International Conference on Thermoelectrics ICT’02
412 (IEEE, Long Beach, California, USA, 2002).
[80] http://www.kryothermusa.com/indexd2f9.html?tid=79
[81] http://www.rmtltd.ru/company/news/details/?id=71
[82] S. Lee, Establishing a new performance paradigm with ultra-thin thermoelectric
modules. (Nextreme Thermal Solutions)
www.nextreme.com/media/pdf/articles/Thermoelectric_Cooling.pdf.
[83] Kunihito Koumoto, et al. Thermoelectric Ceramics for Energy Harvesting. J.
Am. Ceram. Soc., 96 (1) 1-23 (2013). DOI: 10.1111/jace.12076.
[84] Jingfeng Li, et al. High-performance nanostructured thermoelectric materials.
NPG Asia Mater. 2(4) 152-158 (2010). DOI: 10.1038/asiamat.2010.138.
[85] L.D. Hicks and M. S. Dresselhaus, Phys. Rev. B 47, 12727 (1993).
[86] L.D. Hicks and M. S. Dresselhaus, Phys. Rev. B 47, 16631 (1993).
[87] Raseong Kim, Supriyo Datta, and Mark S. Lundstrom. Influence of
dimensionality on thermoelectric device performance. Journal of Applied
Physics 105, 034506 (2009); Doi: 10.1063/1.3074347.
[88] Yanzhong Pei, Heng Wang, and G. J. Snyder. Band Engineering of
Thermoelectric Materials. Adv. Mater. 2012, 24, 6125-6135. DOI:
10.1002/adma.201202919.
[89] J. P. Heremans et al., Enhancement of Thermoelectric Efficiency in PbTe by
Distortion of the Electronic Density of States. Science 321, 554 (2008).
[90] Jong-Soo Rhyee et al. Peierls distortion as a route to high thermoelectric
performance in 4 3In Se crystals. Nature 459, 965-968, 2009.
doi:10.1038/nature08088.
[91] V. Jovanovich and S. Ghmaty, "Design, Fabrication and Testing of Energy
Harvesting Thermoelectric Generator," Proc. of SPIE, vol. 6173, pp. 1-8,
2006.
References
75
[92] G. Chen, M. S. Dresselhaus, J. P. Fleurial, and T. Caillat, "Recent
Developments in Thermoelectric Materials," International Materials Review,
vol. 48, pp. 45-66, 2003.
[93] J.P. Heremans, G. Chen, et al., Thermoelectricity: Thermoelectric And
Thermomagnetic Properties in Lowdimensional And Nanoscale Materials:
Springer-Verlag, 2007.
[94] J. Sharp, H. J. Goldsmid, et al., Principles of Thermoelectrics: Basics and New
Materials Development: Springer Verlag, 2001.
[95] Joseph R. Sootsman, Duck Young Chung, and Mercouri G. Kanatzidis. New
and Old Concepts in Thermoelectric Materials. Angew. Chem. Int. Ed. 2009,
48, 8616-8639.
[96] Terry M. Tritt. Recent Advances in Thermoelectric Nanocomposite Materials.
http://meetings.aps.org/link/ BAPS.2010.MAR.P29.4.
[97] M.S. Dresselhaus, G. Chen, et al., "New Directions for Low-Dimensional
Thermoelectric Materials," Advanced Materials, vol. 19, pp. 1043-1053, 2007.
[98] Min Chen, Design, modeling and utilization of thermoelectrical materials and
devices in energy systems. Ph. D dissertation, Aalborg University, 2009.
[99] G. Min and D. M. Rowe, "Optimisation of thermoelectric module geometry for
'waste heat' electric power generation," Journal of Power Sources, vol. 38, pp.
253-259, 1992.
[100] N.M. Zhukova, et al, Sov. Phys. Semicond. 23 (1989) 1183.
[101] D.L. Medlin and G. J. Snyder. Atomic-Scale Interfacial Structure in Rock Salt
and Tetradymite Chalcogenide Thermoelectric Materials. JOM, 65(3), 390-
400, 2013; DOI: 10.1007/s11837-012-0530-y.
[102] A.K. Pramanick, P.K. Das. Constructal design of a thermoelectric device.
International Journal of Heat and Mass Transfer 49 (2006) 1420-1429.
[103] Sisman A, Yavuz H. The effect of Joule losses on the total efficiency of a
thermoelectric power-cycle. Energy, 1995;20(6):573-576.

References
76
[104] Chen J, Yan Z. The influence of the Thomson effect on the maximum power-
output and maximum efficiency of a thermoelectric generator. J Appl Phys
1996;79(11):8823-8828.
[105] David Tai-ko Shaw. The static temperature distribution of a thermoelement
with temperature varying parameters. Advanced Energy Conversion, 6 (1966)
57-65.
[106] Meijiau Huang, Ruey-Hor Yen, An-Bang Wang. The influence of the
Thomson effect on the performance of a thermoelectric cooler. International
Journal of Heat and Mass Transfer, 48 (2005) 413-418.
[107] Meijiau Huang, Po-Kuei Chou, Ming-Chyuan Lin. Thermal and thermal stress
analysis of a thin-film thermoelectric cooler under the influence of the
Thomson effect. Sensors and Actuators A 126 (2006) 122-128.
[108] E.F. Thacher. Heat loss and thermoelectric generator design. Energy
Conversion and Management, 25 (1985) 519-525.
[109] Min Gao. Improving the conversion efficiency of thermoelectric generators
through “pulse mode” operation. AIP Conference Proceedings 1449, 447
(2012); doi: 10.1063/1.4731592.
[110] Naji M, Alata M, Al-Nimr MA. Transient behavior of a thermoelectric device.
Proc IMechE Part A: J Power & Energy 2003;217(6A):615-21.
[111] X.C. Xuan.On the optimal design of multistage thermoelectric coolers.
Semicond. Sci. Technol. 17 (2002) 625-629.
[112] Lingen Chen, Jun Li, Fengrui Sun, Chih Wu.Performance optimization of a
two-stage semiconductor thermoelectric-generator. Applied Energy 82 (2005)
300-312.
[113] Stilbans LS, Fedorovich NA. Cooling of thermoelectric cells under
nonstationary conditions. Sov Phys Tech Phys 1958;3:460-3.
[114] Hoyos GE, Rao KR, Jerger D. Numerical analysis of transient behavior of
thermoelectric coolers. Energy Conversion 1977;17:45-54.
[115] Snyder GJ, Fleurial J-P, Caillat T, Yang RG, Chen G. Supercooling of Peltier
cooler using a current pulse. J Appl Phys 2002;92:1564-9.

References
77
[116] Richard J. Buist and Pad G. Lau. Thermoelectric Power Generator Design and
Selection from TE Cooling Module Specifications. Thermoelectrics, 1997.
Proceedings ICT '97. XVI International Conference on;
DOI:10.1109/ICT.1997.667589.
[117] Bimrew Tamrat Admasu, Xiaobing Luo, Jiawei Yao. Effects of temperature
non-uniformity over the heat spreader on the outputs of thermoelectric power
generation system. Energy Conversion and Management, 76 (2013) 533-540.
[118] D. Martin, U.S. patent US20040042957 Al (4 March 2004).
[119] Jihui Yang and Francis R. Stabler. Automotive Applications of Thermoelectric
Materials. Journal of Electronic Materials, Vol. 38, No. 7, 2009; DOI:
10.1007/s11664-009-0680-z.
[120] Min Gao, D.M. Rowe. Measurement of Electrical and Thermal Contact
Resistance of Thermoelectric Device. Chinese Journal of Infrared Technology,
15(2), 1993, 15-18.
[121] X.C. Xuan. Optimum design of a thermoelectric device. Semicond. Sci.
Technol. 17 (2002) 114-119.
[122] S. Wisniewski, B. Staniszewski, R. Szymanik. Thermodynamics of
nonequilibrium processes, PWN-Polish Scientific Publishers, 1976.
[123] S.L. Soo, Direct Energy Conversion, Prentice-Hall Inc, 1968.
[124] K.F. Hsu, S. Loo, F. Guo, W. Chen, J.S. Dyck, C. Uher, T. Hogan, E.K.
Polychroniadis, M.G. Kanatzidis, Cubic AgPbmSbTe2+m
: bulk thermoelectric
materials with high figure of merit, Science 303 (2004) 818-821.
[125] V. Damodara Das, N. Soundararajan, Size and temperature effects on the
Seebeck coefficient of thin bismuth films, Phys. Rev. B 35 (1987) 5990-5996.
[126] D.M. Rowe, V.L. Kuznetsov, L.A. Kuznetsova, G. Min, Electric and thermal
transport properties of intermediate-valence YbAl3, J. Phys. D 35 (2002)
2183-2186.
[127] Yasmine Ammar, Sharon Joyce, Rosemary Norman, Yaodong Wang, Anthony
P. Roskilly. Low grade thermal energy sources and uses from the process
industry in the UK. Applied Energy 89 (2012) 3-20.
References
78
[128] Terry J. Hendricks and Jason A. Lustbader. Advanced Thermoelectric Power
System Investigations for Light-Duty and Heavy Duty Applications: Part II.
The 21st International Conference on Thermoelectrics, IEEE (2002), p. 381.
[129] John Huston, Chris Wyatt, Chris Nichols, Michael J. Binder, and Franklin H.
Holcomb. Application of Thermoelectric Devices to Fuel Cell Power
Generation Demonstration and Evaluation, 2004.
http://oai.dtic.mil/oai/oai?verb=getRecord&metadataPrefix=html&identifier=
ADA432046
[130] Chen M, Andreasen SJ, Rosendahl L, Kær SK, Condra T. System modeling
and validation of a thermoelectric fluidic power source: PEMFC-TEG.
Journal of Electronic Materials 2010; 39(9):1593-00.
[131] X. Chen, Y. Pan, and J. Chen. Performance and Evaluation of a Fuel Cell-
Thermoelectric Generator Hybrid System. Fuel Cells 10, 2010, No. 6, 1164-
1170; DOI: 0.1002/fuce.200900208.
[132] L.A. Rosendahl, Paw V. Mortensen, and Ali A. Enkeshafi. Hybrid Solid Oxide
Fuel Cell and Thermoelectric Generator for Maximum Power Output in
Micro-CHP Systems. Journal of Electronic Materials, Vol. 40, No. 5, 2011;
DOI: 10.1007/s11664-011-1552-x.
[133] Jenn-Kun Kuo, Jenn-Jiang Hwang, Chin-Hong Lin. Performance Analysis of a
Stationary Fuel Cell Thermoelectric Cogeneration System. Fuel Cells 12,
2012, No. 6, 1104-1114; DOI: 10.1002/fuce.201200111.
[134] Tao Wei, Yun-Hui Huang, Qin Zhang, et al. Thermoelectric Solid-Oxide Fuel
Cells with Extra Power Conversion from Waste Heat. Chem. Mater. 2012, 24,
1401−1403; dx.doi.org/10.1021/cm300159w.
[135] Birkholz, U., et al. Conversion of Waste Exhaust Heat in Automobile using
FeSi2 Thermoelements. Proc. 7th International Conference on Thermoelectric
Energy Conversion. 1988, Arlington, USA, pp. 124-128.
[136] Shinohara, K., et al. Application of Thermoelectric Generator for Automobile.
Journal of the Japan Society of Powder and Powder Metallurgy, Vol. 46, No.
5, (1999), pp. 524-528.
[137] Ikoma, K., et al. Thermoelectric Generator for Gasoline Engine Vehicles Using
Bi2Te3 Modules. J. Japan Inst. Metals. Special Issue on Thermoelectric
Energy Conversion Materials, Vol. 63, No. 11, (1999), pp. 1475-1478.

References
79
[138] http://www.nedo.go.jp/english/
[139] Jorge Vázquez, Miguel A. Sanz-Bobi, Rafael Palacios, Antonio Arenas. State
of the Art of Thermoelectric Generators Based on Heat Recovered from the
Exhaust Gases of Automobiles. Proc., 7th European Workshop on
Thermoelectrics, Pamplona, Spain, Paper No. 17, 2002.
[140] K.M. Saqr, M. K. Mansour and M. N. Musa. Thermal design of automobile
exhaust based thermoelectric generators: Objectives and challenges.
International Journal of Automotive Technology, Volume 9, Number 2, 155-
160.
[141] J. Lagrandeur, 2009 Hydrogen Program and Vehicle Technologies Program
Annual Merit Review (2009).
[142] H. Shock, 2009 Hydrogen Program and Vehicle Technologies Program Annual
Merit Review (2009).
[143] D.T. Crane and J.W. Lagrandeur. Progress Report on BSST-Led US
Department of Energy Automotive Waste Heat Recovery Program. Journal of
ELECTRONIC MATERIALS, published online: 13 November 2009.
[144]http://www1.eere.energy.gov/vehiclesandfuels/pdfs/thermoelectrics_app_2011/
monday/meisner.pdf
[145] Gregory P. Meisner. Program Final Report - Develop Thermoelectric
Technology for Automotive Waste Heat Recovery. 2012.
[146] Chuen-Sen Lin. Capture of Heat Energy from Diesel Engine Exhaust, Final
Report. DOE Award Number: DE-FC26-01NT41248, Task: 1.03.5.
November 2008.
[147] Hendricks TJ, Lustbader JA. Advanced thermoelectric power system
investigations for light-duty and heavy duty applications: part I. In:
Proceedings of the twenty-first international conference on thermoelectrics,
Long Beach, CA; 2002. p. 381-6.
[148] Hendricks TJ. Thermal system interactions in optimizing advanced
thermoelectric energy recovery systems. J Energy Resour Technol - Trans
ASME 2007;129(3):223-31.

References
80
[149] Terry J. Hendricks, Naveen K. Karri, Tim P. Hogan, Charles J. Cauchy. New
Perspectives in Thermoelectric Energy Recovery System Design Optimization.
Journal of Electronic Materials, Vol. 42, No. 7, 2013; DOI: 10.1007/s11664-
012-2406-x.
[150] Madhav A. Karri, Eric F. Thacher, Brian T. Helenbrook, Marc S. Compeau.
Thermoelectrical Energy Recovery from the Exhaust of a Light Truck.
Proceedings of 2003 Diesel Engine Emissions Reduction Conference
Newport, Rhode Island, August 24-28, 2003.
[151] Thacher EF, Helenbrook BT, Karri MA, Richter CJ. Testing an automobile
exhaust thermoelectric generator in a light truck. Proc IMechE, Part D: J
Automobile Eng 2007; 221(D1):95-107.
[152] M.A. Karri, E.F. Thacher, B.T. Helenbrook. Exhaust energy conversion by
thermoelectric generator: Two case studies. Energy Conversion and
Management 52 (2011) 1596-1611.
[153] Björn Andersson. A comparison of different connection techniques for
thermoelectric generators in vehicle waste heat recovery. Degree Project in
Industrial Electrical Engineering and Automation, EIE920, 2012.
[154] Navneesh Phillip, Othman Maganga, Keith J. Burnham, et al. Investigation of
Maximum Power Point Tracking for Thermoelectric Generators. Journal of
Electronic Materials, Vol. 42, No. 7, 2013; Doi: 10.1007/s11664-012-2460-4.
[155] Panagiotis G. Chatzidakis, Georgios C. Christidis and Emmanuel C. Tatakis.
Comparative Study of MPPT Algorithms for Thermoelectric Generators. 2013
15th European Conference on Power Electronics and Applications (EPE),
2013; Doi: 10.1109/EPE.2013.6634607.
[156] Olle Högblom and Ronnie Andersson. CFD modeling of thermoelectric
generators in automotive EGR-coolers.AIP Conference Proceedings 1449,
497 (2012); Doi: 10.1063/1.4731602.
[157] Kuniaki Mizuno, Kazunori Sawada, Takashi Nemoto, and Tsutomu Iida.
Development of a Thermal Buffering Device to Cope with Temperature
Fluctuations for a Thermoelectric Power Generator. Journal of Electronic
Materials, Vol. 41, No. 6, 2012; Doi: 10.1007/s11664-012-1911-2.

References
81
[158] Jing-Hui Meng, Xin-Xin Zhang, Xiao-Dong Wang. Dynamic response
characteristics of thermoelectric generator predicted by a three-dimensional
heat-electricity coupled model. Journal of Power Sources, 245(2014), 262-269.
[159] Jeffrey W. Fergus, Kirk Yerkes, and Kevin Yost. Numerical Modeling of
Multimaterial Thermoelectric Devices Under Static and Cyclic Thermal
Loading. Journal of Electronic Materials; Doi: 10.1007/s11664-013-2858-7.
[160] Yuchao Wang, Chuanshan Dai, Shixue Wang. Theoretical analysis of a
thermoelectric generator using exhaust gas of vehicles as heat source. Applied
Energy, 112(2013), 1171-1180.
[161] Sumeet Kumar, Stephen D. Heister, Xianfan Xu, James R. Salvador, and
Gregory P. Meisner. Thermoelectric Generators for Automotive Waste Heat
Recovery Systems Part I: Numerical Modeling and Baseline Model Analysis.
Journal of Electronic Materials, Vol. 42, No. 4, 2013; Doi: 10.1007/s11664-
013-2471-9.
[162] M.F. Silva, J.F. Ribeiro, J.P. Carmo, L.M. Gonçalves, and J.H. Correia. Thin
Films for Thermoelectric Applications. NanoScience and Technology 2013,
pp 485-528.
[163] T. Ota, C. Tokunaga, K. Fujita. Development of Thermoelectric Power
Generation system for Industrial Furnaces. 24th International Conference on
Thermoelectrics, 2005. ICT 2005, 335-338; Doi: 10.1109/ICT.2005.1519952.
[164] N.R. Kristiansen and H.K. Nielsen. Potential for Usage of Thermoelectric
Generators on Ships. Journal of Electronic Materials, Vol. 39, No. 9, 2010;
Doi: 10.1007/s11664-010-1189-1.
[165] J.P. Ploteau, P. Glouannec, H. Noel. Conception of thermoelectric flux meters
for infrared radiation measurements in industrial furnaces. Applied Thermal
Engineering, 27(2007): 674-681.
[166] Vladimir Leonov, Tom Torfs, Paolo Fiorini, Chris Van Hoof. Thermoelectric
Converters of Human Warmth for Self-Powered Wireless Sensor Nodes.
IEEE Sensors Journal, Vol. 7, No. 5, 2007.
[167] Mizue Mizoshiri, Masashi Mikami, Kimihiro Ozaki. Thermal--Photovoltaic
Hybrid Solar Generator Using Thin-Film Thermoelectric Modules. Japanese
Journal of Applied Physics, Volume 51, Issue 6, pp. 06FL07-06FL07-5
(2012).
References
82
[168] R. Chein, G. Huang. Thermoelectric cooler application in electronic cooling.
Appl Therm Eng 2004;24: 2207-17.
[169] M. Davis, R. Weymouth, P. Clarke. Thermoelectric CPU Cooling using High
Efficiency Liquid Flow Heat Exchangers. 2005, Hydrocool Pty Ltd,
Fremantle, Australia.
[170] Min Gao, D.M. Rowe, F. Volklein. Integrated thin film thermoelectric cooler.
Electron Lett 1998;34:222-3.
[171] Vian JG, Astrain D, Dominguez M. Numerical modeling and a design of a
thermoelectric dehumidifier. Applied Thermal Engineering 2002; 22(4): 407-
422.
[172] M. Jradi, N. Ghaddar, K. Ghali. Experimental and theoretical study of an
integrated thermoelectric-photovoltaic system for air dehumidification and
fresh water production. INTERNATIONAL JOURNAL OF ENERGY
RESEARCH 2012; 36:963-974.
[173] http://www.gentherm.com/page/climate-seats
[174] M. Rahmoun, A. El Hassani, D. Leclerq, E. Bendada. Peltier Effect Applied to
the Design and Realization of a New Mass Flow Sensor. Active andPassive
Elec. Comp., 1999, Vol. 22, pp. 165-174;
http://dx.doi.org/10.1155/2000/78576.
[175] Shigenao Maruyama, Atsuki Komiya, Hiroki Takeda, Setsuya Aiba.
Development of Precise-temperature-controlled Cooling Apparatus for
Medical Application by Using Peltier Effect. 2008 International Conference
on BioMedical Engineering and Informatics. DOI 10.1109/BMEI.2008.239.
[176] Dener F. Cheddie, Norman D. H. Munroe, A two-phase model of an
intermediate temperature PEM fuel cell. International Journal of Hydrogen
Energy, 32 (2007)832- 841.
[177] Dener F. Cheddie, Norman D. H. Munroe, Parametric model of an intermediate
temperature PEMFC. Journal of Power Sources 156(2006)414-423.
[178] Dener F. Cheddie, Norman D. H. Munroe, Semi-analytical proton exchange
membrane fuel cell modeling. Journal of Power Sources, 183 (2008) 164-173.

References
83
[179] Dener F. Cheddie, Norman D. H. Munroe, Three dimentional modeling of
high temperature PEM fuel cells. Journal of Power Sources 160 (2006) 215-
223.
[180] Dener F. Cheddie, Norman D. H. Munroe. Mathematical model of a PEMFC
using a PBI membrane. Energy Conversion and Management 47 (2006)1490-
1504.
[181] Dener F. Cheddie, Norman D. H. Munroe, modeling of High Temperature
PEM fuel cells using FEMLAB. Excerpt from the proceedings of the
COMSOL Multiphysics User’s Conference 2005 Boston.
[182] Dener F. Cheddie, Norman D. H. Munroe, Analytical corelations for
intermediate tempertature PEM fuel cells. Journal of Power Sources 160
(2006) 299-304.
[183] T. Sousa, M. Mamlouk , Kehth Scott. An isothermal model of a laboratory
intermediate temperature fuel cell using PBI doped phosphoric acid
membranes. Chemical Engineering Science 65 (2010) 2513-2530.
[184] Keith Scott, M. mamlouk. A cell voltage equation for an intermediate
temperature proton exchange membrane fuel cell. International journal of
hydrogen energy, 34 (2009) 9195-9202.
[185] Jie Peng, Seung Jae Lee. Numerical simulation of proton exchange membrane
fuel cells at high operating temperature. Journal of Power sources 162 (2206)
1182-1191.
[186] Justo Lobato, Pablo Cañizares, Manuel A. Rodrigo et al. PBI-based polymer
electrolyte membranes fuel cells Temperature effects on cell performance and
catalyst stability. Electrochimica Acta, 52 (2007)3910-3920.
[187] Justo Lobato, Pablo Cañizares, Manuel A. Rodrigo et, al. Three-dimensional
model of a 50 cm2 high temperature PEM fuel cell. Study of the flow channel
geometry influence. International Journal of Hydrogen Energy xxx (2010) I-II.
[188] Anders R. Korsgaard, Rasmus Refshauge, Mads P. Nielsen, Mads Bang, Søren
K. Kær. Experimental characterization and modeling of commercial
polybenzimidazole-based MEA performance. Journal of Power Sources 162
(2006)239-245.

References
84
[189] Anders R. Korsgaard, Rasmus Refshauge, Mads P. Nielsen, Mads Bang, Søren
K. Kær. Modeling of CO influence in PBI electroyte PEM fuel cells. The 4th
international conference of fuel cell science, engineering and technology.
[190] Anders R. Korsgaard, Mads P. Nielsen, Søren K. Kær. Part one: A novel
model of HTPEM-based micro-combined heat and power fuel cell system.
International journal of hydrogen energy 33 (2008) 1909- 1920.
[191] Anders R. Korsgaard, Mads P. Nielsen, Søren K. Kær. Part two: Control of a
novel HTPEM- based micro combined heat and power fuel cell system.
International Journal of Hydrogen Energy. 33 (2008) 1921-1931.
[192] Søren Juhl Andreasen, Søren Knudsen Kær. Dynamic Model of the High
Temperature Proton Exchange Membrane fuel cell stack temperature. Journal
of Fuel cell science and technology, 6 (2009).
[193] Federico Zenith. Control of fuel cells. Doctoral thesis, Norwegian University
of Science and Technology, 2007; ISBN 978-82-471-1447-6.
[194] Federico Zenith, Frode Seland, Ole Edvard Kongstein, Børre Børresen, Reidar
Tunold, Sigurd Skogestad. Control-Oriented modelling and experimental
study of the transient response of a high-temperature polymer fuel cell.
Journal of Power Sources 162 (2006) 215-227.
[195] Federico Zenith, Sigurd Skogestad. Control of fuel cell power output. Journal
of Process Control 17 (2007) 333- 347.
[196] Federico Zenith, Sigurd Skogestad. Control of the mass and energy dynamic of
polybenzimidazole-membrane fuel cells. Journal of Process Control 19 (2009)
425- 432.
[197] Federico Zenith, Sigurd Skogestad. Dynamic modeling and control of
polybenzimidazole fuel cells. Proceedings of ECOS 2005, Tondheim, Norway.
June 20-22, 2005.
[198] Simon Lineykin and Shmuel Ben-Yaakov. Modeling and Analysis of
Thermoelectric Modules. Ieee Transactions on Industry Applications, VOL.
43, NO. 2, 2007.
[199] Jincan Chen, Chih Wu. Analysis on the performance of a thermoelectric
generator. Journal of Energy Resources Technology 2000; 122(2):61-63.

References
85
[200] D.M. Rowe, Gao Min. Evaluation of thermoelectric modules for power
generation. Journal of Power Sources 73 (1998), 193-198.
[201] Crane D, Jackson G. Optimization of cross flow heat exchangers for
thermoelectric waste heat recovery. Energy Convers Manage 2004; 45(9-
10):1565-82.
[202] Yu J, Zhao H. A numerical model for thermoelectric generator with the
parallel-plate heat exchanger. Journal of Power Sources 2007; 172(1):428-34.
[203] Smith KD. An investigation into the viability of heat sources for thermoelectric
power generation systems. Master thesis, Rochester (NY): Rochester Institute
of technology, 2009.
[204] Elena E. Antonova and David C. Looman. Finite Elements for Thermoelectric
Device Analysis in ANSYS. International Conference on Thermoelectrics
(2005), p.200.
[205] Martin Jaegle. Simulating Thermoelectric Effects with Finite Element Analysis
using COMSOL. Proceedings ECT2007 (2007), p. 222.
[206] Min Chen, G. Jeffrey Snyder. Analytical and numerical parameter extraction
for compact modeling of thermoelectric coolers. International Journal of Heat
and Mass Transfer 60 (2013) 689-699.
doi:10.1016/j.ijheatmasstransfer.2013.01.020.
[207] J. Esartea, G. Min, D.M. Rowe. Modelling heat exchangers for thermoelectric
generators. Journal of Power Sources 93 (2001) 72-76.
[208] Suzuki RO, Tanaka D. Mathematical simulation of thermoelectric power
generation with the multi-panels. Journal of Power Sources 2003;122(2): 201-
9.
[209] Suzuki RO, Tanaka D. Mathematic simulation on thermoelectric power
generation with cylindrical multitubes. Journal of Power Sources
2003;124(1):293-8.
[210] Reiyu Chein, Guanming Huang. Thermoelectric cooler application in
electronic cooling. Applied Thermal Engineering 24 (2004) 2207-2217.
[211] A. Rezania, L.A. Rosendahl. Thermal effect of a thermoelectric generator on
parallel microchannel heat sink. Energy 37 (2012) 220-227.

References
86
[212] Nellis G, Klein S. Heat transfer. New York: Cambridge University Press; 2009.
[213] Kays WM, London AL. Compact heat exchangers. 3rd ed. New York:
McGraw Hill; 1984.
[214] http://www.engineeringagenda.com/heat-exchangers/
[215] Jainender Dewatwal. Design of Compact Plate Fin Heat Exchanger. Bachelor
thesis, National Institute of Technology Rourkela, 2009.
[216] Taylor BN, Kuyatt CE. Guidelines for evaluating and expressing the
uncertainty of NIST measurement results. National Institute of Standards and
Technology Technical Note 1297; 1994.
[217] N. Rajalakshmi, G. Velayutham, K. S. Dhathathreyan. Sensitivity Analysis of a
2.5 kW Proton Exchange Membrane Fuel Cell Stack by Statistical Method.
Journal of Fuel Cell Science and Technology, FEBRUARY 2009, Vol. 6,
011003.1-011003.6.
[218] A. Arsalis, Mads P. Nielsen, Søren K. Kær. Modeling and parametric study of
a 1 kWe HT-PEMFC-based residential micro-CHP system. International
Journal of Hydrogen Energy 36 (2011) 5010-5020.
[219] Anders Christian Olesen and Julian Ralf Jensen. Solid Oxide Fuel Cell Micro
Combined Heat and Power system - choosing the right reformer. Master
thesis, Aalborg University, 2009.

87
Paper 1
Potential Usage of Thermoelectric Devices in a High-Temperature Polymer
Electrolyte Membrane (PEM) Fuel Cell System: Two Case Studies
Gao, Xin; Chen, Min; Andreasen, Søren Juhl; Kær, Søren Knudsen
Journal of Electronic Materials, 41(6), 2012, p. 1838-1844.

Potential Usage of Thermoelectric Devicesin a High-Temperature Polymer ElectrolyteMembrane (PEM) Fuel Cell System: Two Case Studies
XIN GAO,1,2 MIN CHEN,1 SØREN JUHL ANDREASEN,1
and SØREN KNUDSEN KÆR1,3
1.—Department of Energy Technology, Aalborg University, Aalborg DK-9220, Denmark. 2.—e-mail:[email protected]. 3.—e-mail: [email protected]
Methanol-fueled, high-temperature polymer electrolyte membrane fuel cell(HTPEMFC) power systems are promising as the next generation of vehicleengines, efficient and environmentally friendly. Currently, their performancestill needs to be improved, and they still rely on a large Li-ion battery forsystem startup. In this article, to handle these two issues, the potential ofthermoelectric (TE) devices applied in a HTPEMFC power system has beenpreliminarily evaluated. First, right after the fuel cell stack or the methanolreformer, thermoelectric generators (TEGs) are embedded inside a gas–liquidheat exchanger to form a heat recovery subsystem jointly for electricity pro-duction. It is calculated that the recovered power can increase the systemefficiency and mitigate the dependence on Li-ion battery during systemstartup. To improve the TEG subsystem performance, a finite-differencemodel is then employed and two main parameters are identified. Second, TEcoolers are integrated into the methanol steam reformer to regulate heatfluxes herein and improve the system dynamic performance. Similar modifi-cation is also done on the evaporator to improve its dynamic performance aswell as to reduce the heat loss during system startup. The results demonstratethat the TE-assisted heat flux regulation and heat-loss reduction can alsoeffectively help solve the abovementioned two issues. The preliminary anal-ysis in this article shows that a TE device application inside HTPEMFC powersystems is of great value and worthy of further study.
Key words: Thermoelectric devices, fuel cell, heat recovery, heat regulation,heat loss
NomenclatureAstk Total reaction area in a stack (m2)ch Specific heat capacity (J/kg-K)F Faraday constant (C/mole)I Electric current (A)M Molar mass (kg/kmole)_m Mass flow rate (kg/s)
nx Total number of segments along the flowny Total number of segments crossing the flowP Power output (W)Q Heat flux (W)R Resistance
T Temperature (K or �C)UA Heat exchanger conductance (W/K)w Power output of each segment (W)Dh Enthalpy difference (J/kg)Dp Pressure drop (Pa)Z Figure of merit of TE module (1/K)zT Figure of merit of TE material (�)G Core mass velocity (Kg/s-m2)fhx Friction factorLhx Heat exchanger length (m)Dh Hydraulic diameter (m)NTU Number of transfer units
Greek Symbolsa Seebeck coefficient (V/K)ectf The effectiveness(Received July 20, 2011; accepted April 4, 2012;
published online May 9, 2012)
Journal of ELECTRONIC MATERIALS, Vol. 41, No. 6, 2012
DOI: 10.1007/s11664-012-2098-2� 2012 TMS
1838

g Efficiencyq Exhaust gas density (kg/m3)r Minimum free flow area/frontal area
Subscripts/Superscriptsex Cathode exhaustam Ambientpeak Peak valueave Average valueTE TEG moduleHX Heat exchangerh Hot gasc Coolanti Segment indexin Inletout Outlete Electric resistancetot Total valuet Thermal resistanceTEA Whole TEG assembly
INTRODUCTION
In recent years, the desire to alleviate the envi-ronmental pollution, find more efficient energyconversion devices, and reduce the dependence onfossil recourses has driven more and more attentiononto fuel cells. Among kinds of fuel cell systems,high-temperature polymer electrolyte membranefuel cell (HTPEMFC) power systems with onboardmethanol reformers are particularly practical andideal for automotive applications.1,2 But as conven-tional technologies, a large amount of exhaust heatis wasted without any utilization by these systems.Their dependence on a Li-ion battery during systemstartup also needs to be alleviated. Moreover,the system dynamic performance is still challeng-ing because some heat fluxes inside are almost
uncontrollable under the working condition fluctua-tions. To accommodate these challenges, novel sys-tem configurations even new technologies are needed.
Thermoelectric devices can be used as thermalelectric generators (TEGs) and thermal electriccoolers (TECs), respectively. TEGs are stronglyadvantageous compared with conventional technol-ogies in waste heat recovery for electricity.3 Gener-ally, TEGs could be deployed in any place as long as atemperature difference exists. By now, there havebeen a few projects using TEGs for waste heatrecovery in fuel cell systems.4,5 TECs have beenwidely used as miniature heat pumps because of theiroutstanding scalability. But it is believed there is stillroom for looking into fully analyzing and utilizing theirentire potential, such as quick response and bidirec-tional heating/cooling capabilities.6
In this article, to improve the system efficiency,dynamic performance including the startup process,TEGs and TECs are introduced into a HTPEMFCpower system. The heat sources in the system pos-sible for TEGs to recover are preliminarily assessed.For further optimizing the TEG subsystem, a finite-difference model is validated and employed later inthis article. Two factors affecting the subsystemperformance most significantly are identified.Finally, the feasibility of using TECs to improve thesystem dynamic performance, to reduce the heatloss, and in turn to make the system less dependenton initial Li-ion battery capacity is preliminarilyevaluated.
TEG APPLICATION
One typical configuration of a HTPEMFC powersystem is shown in Fig. 1.7 It is a configuration fornormal working conditions, different from systemstartup. The system electrical power output isapproximately 1 kW. Its fuel cell stack is cooled bythe cathode air flow. Usually the stoichiometry kc of
Fig. 1. A HTPEMFC power system configuration under normal working conditions.7
Potential Usage of Thermoelectric Devices in a High-Temperature PolymerElectrolyte Membrane (PEM) Fuel Cell System: Two Case Studies
1839

the cathode air is �20. Under the normal work-ing conditions, consisting of current density i ¼0:6 A/cm2, the energy flow of the system is illus-trated in Fig. 2.
Considering the energy flow, the largest heat fluxis the cathode exhaust, the stream 12 in Fig. 1.Based on energy balance, the stream temperaturecan be calculated from
Qex ¼ _mex � Dhex; (1)
mexcan be obtained by the Faraday’s law
_mex ¼Mex � kc � Astk=ð0:21 � 4 � FÞ: (2)
Then, the cathode exhaust temperature isTex ¼ 145�C. Assuming the ambient temperature isTam ¼ 25�C, the maximum TEG recovered powerfrom the exhaust can be deduced from8
gpeak ¼ Z � ðTex�TamÞ= 4þZ �Tex + Z�(TexþTamÞ=2ð Þ:(3)
A constant figure-of-merit value zTave ¼ 1:1 isused in this calculation to assess roughly the TEGpower output. It is the average value of Bi2Te3 and(Bi,Sb)2Te3 bulk materials, which are widely appliedin TEG modules working in this temperature range.Considering the relatively mild temperature differ-ence between Tex and Tam plus the material scienceprogress, TEG material properties herein are tem-porarily assumed temperature independent.9,10 Thencalculated byPpeak ¼ gpeak �Qex, the TEG power out-put is about 58 W. To obtain this power, TEG heatrecovery system needs to be carefully designed andoptimized.
The chosen architecture of the TEG heat recoverysystem is illustrated in Fig. 3. Basically, it is similarto a counter-flow plate heat exchanger. Cathodeexhaust passes through the heat exchanger housingin the middle. Two aluminum blocks with flow fieldinside are at the top and the bottom. Inside the flowfield is the liquid coolant circulating to establish the
temperature difference. TEG modules are assem-bled between the housing and the blocks.
To optimize this system, a finite-difference modelis used, as illustrated in Fig. 4. The main equationsare listed in Table I.
This model has the following advantages:
1. More precise description of the fluid propertiesand the heat transfer on each discretized seg-ment along the flow direction.
2. Obtain the TEG power output more preciselyby the discretized module model and the temper-ature-dependent material properties.
Fig. 2. Energy flow Sankey diagram.
Fig. 3. The configuration of TEG heat recovery system: 1, aluminumblock; 2, TEG assembly; 3, compact heat exchanger housing;4, coolant inlet/outlet; and 5, diffuser.
Fig. 4. Finite-difference scheme of the TEG heat recovery system.
Gao, Chen, Andreasen, and Kær1840

3. Heat-transfer and TEG performance are coupledin calculations.
4. Facilitate the heat exchanger structure optimi-zation with an integrated heat exchanger struc-ture database.12
5. Be able to cooptimize the system with largerpower output and lower pressure drop.
6. TEG modules and heat exchangers used are bothcommercial available.
7. Easier and faster to get solved through using thediscretized epsilon-NTU method.13–15
This model has data in Ref.13 The results are shownin Fig. 5. Using this model, the maximum electricityoutput from the previously mentioned cathodeexhaust turns out to be 23 W, only approximatelyhalf of Ppeak. One main reason is that TEG perfor-mance is highly correlated with temperature. Asensitivity study is performed on the model, and it isfound that the cathode exhaust temperature con-tributes 73.98% of the power output sensitivity.When the temperature goes down, the TEG poweroutput drops down sharply, and vice versa. Anothermain factor is the heat exchanger structure. Whenproperly adjusted, it can enhance the heat transfer
and reduce system pressure drop simultaneously.The pressure drop is roughly proportional to thesystem parasitic loss. Screening the heat exchangerstructure database, three types are identified withoutstanding performance, as shown in Fig. 6. Theyare Plain plate-fin, surface 10.27¢ (index 10), Strip-fin plate-fin, surface 1/6-12.18(D) (23), and Wavy-finplate-fin, surface 17.8-3/8 W (34). Further systemoptimization will be mainly focused on these threetypes.
In addition to the cathode exhaust heat recovery,the TEG heat recovery system can be used inassisting the HTPEMFC system startup. During thestartup, approximately 300 W electricity from aLi-ion battery is consumed to vaporize the methanoland warm up the HTPEMFC stack.7 The vaporizedmethanol then combusts with air catalytically in theburner side of the reformer (SMR-burner in Fig. 1).After that, the hot flue gas mixed with some freshair is pumped to heat up the fuel cell stack to itsworking temperature. The fresh air is to protect thefuel cell stack from overheated by the flue gas.Instead of the fresh air, TEG heat recovery systemcan be introduced to cool down the flue gas as well
Table I. Main equations11
Description Equations
TEG propertiesPnx;TE
Pny;TE ai ¼ aTE;Pnx;TE
Pny;TE Re;i ¼ RTE;e;Pnx;TE
Pny;TE Rt;i ¼ RTE;t
TEG power output Ii ¼ 0:5ðaiÞð �Th;TEðiÞ � �Tc;TEðiÞÞ=Re;i:
wTE;peakðiÞ ¼ aiIi Th;TEðiÞ � Tc;TEðiÞ� �
� I2i Re;i; PTEA ¼
XnxXny
wTE;peakðiÞ
Heat transfer _mhch;iðThðiÞ � Thðiþ 1ÞÞ ¼ UAHXðiÞðThðiÞ � Th;TEðiÞÞ_mhch;iðThðiÞ � Thðiþ 1ÞÞ ¼ ectf ðiÞ _mhch;iðThðiÞ � TcðiÞÞ
ectf ðiÞ ¼ 1� expð�NTUðiÞÞ; NTUðiÞ ¼ UAtotðiÞ=ð _mhch;iÞ;1=UAtotðiÞ ¼ 1=UAHXðiÞ þ 1=UATEðiÞ
Pressure drop Dp ¼ ðG2=ð2qinÞÞ½4fhx � Lflowqin
�Dh�qð Þ þ 1þ r2
� �qin=qoutð Þ � 1ð Þ�
HX, heat exchanger; NTU, number of transfer units; TE, TEG module; TEA, whole TEG assembly.
Fig. 5. Model validation by heat transferred and pressure drop.Fig. 6. System power output and pressure drop using different heatexchangers.
Potential Usage of Thermoelectric Devices in a High-Temperature PolymerElectrolyte Membrane (PEM) Fuel Cell System: Two Case Studies
1841

as to produce electricity. Based on fluid parametersfrom Ref. 7, electric power recovered in this study isapproximately 100 W. On the contrary, if installedafter the stack, the recovered electricity is only about34 W. Obviously, installing the TEG system afterthe reformer is preferable and can approximatelyreduce the Li-ion battery capacity by one-third.Although this preliminary estimation needs furtherverification, it reveals the great potential contribu-tion of TEG to the fuel cell system.
Inside the system in Fig. 1, some other places arealso available for TEG heat recovery. For conve-nience of further study, all possible positions areroughly evaluated and listed in Table II. Some cor-responding information is also included, such as theoriginal temperature difference and suitable TEGmaterials.
As a total, the efficiency of the fuel cell system willbe ideally increased by 9.6% through the TEG heatrecovery. In practice, the power capacity of a fuelcell system is usually approximately 60 kW.16 Inthese systems, the TEG-recovered electricity can bemore easily harnessed to drive the auxiliaries,charge batteries, assist the system startup/shut-down processes, act as a back-up power supply,etc.17 With TEG efficiency improved in the future, aHTPEMFC engine without relying on a large Li-ionbattery can be envisaged.
Reconsidering this HTPEMFC power system,efficiency can be improved by TEG heat recovery.But its dynamic performance still remains unsatis-factory. The idea is to use TECs to regulate heatfluxes in and between its components. Through theheat regulation, hopefully, system dynamic perfor-mance, system reliability, and durability can beimproved.
TEC APPLICATION
Two issues affect the system dynamic perfor-mance significantly. One is the unsatisfactorydynamic performance of the steam reformer (inFig. 7) and the exchanger-based methanol evapo-rator (in Fig. 8a). The other is the heat loss in themethanol evaporator during system startup. Bothare mainly from the limited controllability of heatfluxes inside the two components.
When the electric load increases in Fig. 1, the fuelcell stack demands more hydrogen from thereformer. Hydrogen production from methanolsteam reforming is endothermic, as in formula 4,
CH3OH + H2O! CO2 + 3H2 DH ¼þ49 kJ/molð Þ(4)
So the reformer needs more heat. But the heatgenerated by the hydrogen catalytic combustion iscontrarily depressed inside the burner side. Thereason is that more hydrogen now has been con-sumed by the stack and less is left for the burner. Inturn, the heat supply shortage and temperaturedecline appear. When the electric load decreases,the condition is vice versa. The consequence is thepoor dynamic performance of the reformer. Behindthis problem is the limited controllability of inter-layer heat fluxes inside the reformer. Solutionsinclude modifications on system configuration and/or components, such as the hybrid of fuel cell andLi-ion battery, the integration of the reformerand the evaporator, etc. Among them, the componentmodification done using TECs seems promising.
Redesign the reformer in Fig. 7, TECs will beembedded into the walls between the burner andthe reformer layers. Then, they will work as heatpumps to regulate the interlayer heat fluxes andtheir working modes are illustrated in Fig. 8. Whenthe spontaneous heat flux (SF) is insufficient for thereformer, heat pumped (HP) by TECs toward thereformer side will slow down the temperaturedecline, as shown in Fig. 8a. On the contrary, whenthe reformer is getting overheated, HP will be setto be opposite to SF and keep the reformer from
Table II. Possible TEG installation positions
Position TH (�C)/TC (�C) Heat Flux (W) Representative Materials13,14 Ppeak
Cathode exhaust 145/25 1012 Bi2Te3 and (Bi,Sb)2Te3 58 WEvaporator 250/70 329 Mg2SiSn and Zn4Sb3 24 WReformer 400a/250 160 Mg2SiSn and Zn4Sb3 7 Wa
Cooler 205/25 39 Bi2Te3 and (Bi,Sb)2Te3 3.1 WBurner exhaust 137.5/25 34.5 Bi2Te3 and (Bi,Sb)2Te3 2 W
aThe temperature of hydrogen catalytic combustion is in the range 100�C to 2210�C. Here, a typical temperature is used.
Fig. 7. Exchanger-based methanol steam reformer.7
Gao, Chen, Andreasen, and Kær1842
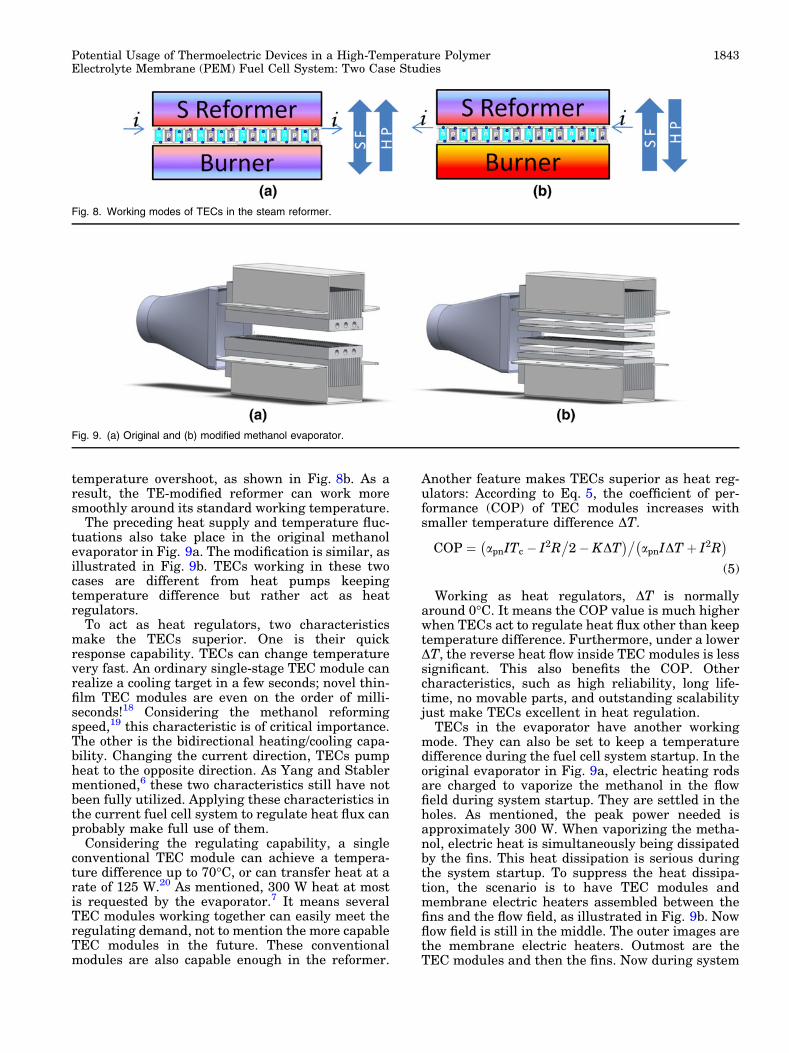
temperature overshoot, as shown in Fig. 8b. As aresult, the TE-modified reformer can work moresmoothly around its standard working temperature.
The preceding heat supply and temperature fluc-tuations also take place in the original methanolevaporator in Fig. 9a. The modification is similar, asillustrated in Fig. 9b. TECs working in these twocases are different from heat pumps keepingtemperature difference but rather act as heatregulators.
To act as heat regulators, two characteristicsmake the TECs superior. One is their quickresponse capability. TECs can change temperaturevery fast. An ordinary single-stage TEC module canrealize a cooling target in a few seconds; novel thin-film TEC modules are even on the order of milli-seconds!18 Considering the methanol reformingspeed,19 this characteristic is of critical importance.The other is the bidirectional heating/cooling capa-bility. Changing the current direction, TECs pumpheat to the opposite direction. As Yang and Stablermentioned,6 these two characteristics still have notbeen fully utilized. Applying these characteristics inthe current fuel cell system to regulate heat flux canprobably make full use of them.
Considering the regulating capability, a singleconventional TEC module can achieve a tempera-ture difference up to 70�C, or can transfer heat at arate of 125 W.20 As mentioned, 300 W heat at mostis requested by the evaporator.7 It means severalTEC modules working together can easily meet theregulating demand, not to mention the more capableTEC modules in the future. These conventionalmodules are also capable enough in the reformer.
Another feature makes TECs superior as heat reg-ulators: According to Eq. 5, the coefficient of per-formance (COP) of TEC modules increases withsmaller temperature difference DT.
COP ¼ apnITc � I2R�
2� KDT� ��
apnIDT þ I2R� �
(5)
Working as heat regulators, DT is normallyaround 0�C. It means the COP value is much higherwhen TECs act to regulate heat flux other than keeptemperature difference. Furthermore, under a lowerDT, the reverse heat flow inside TEC modules is lesssignificant. This also benefits the COP. Othercharacteristics, such as high reliability, long life-time, no movable parts, and outstanding scalabilityjust make TECs excellent in heat regulation.
TECs in the evaporator have another workingmode. They can also be set to keep a temperaturedifference during the fuel cell system startup. In theoriginal evaporator in Fig. 9a, electric heating rodsare charged to vaporize the methanol in the flowfield during system startup. They are settled in theholes. As mentioned, the peak power needed isapproximately 300 W. When vaporizing the metha-nol, electric heat is simultaneously being dissipatedby the fins. This heat dissipation is serious duringthe system startup. To suppress the heat dissipa-tion, the scenario is to have TEC modules andmembrane electric heaters assembled between thefins and the flow field, as illustrated in Fig. 9b. Nowflow field is still in the middle. The outer images arethe membrane electric heaters. Outmost are theTEC modules and then the fins. Now during system
Fig. 8. Working modes of TECs in the steam reformer.
Fig. 9. (a) Original and (b) modified methanol evaporator.
Potential Usage of Thermoelectric Devices in a High-Temperature PolymerElectrolyte Membrane (PEM) Fuel Cell System: Two Case Studies
1843

startup, TECs will be charged as a heat resistor tokeep the fin temperature low. In this way, the heatdissipation and the electricity consumption are bothless during the system startup.
DISCUSSION AND CONCLUSIONS
Modifying the HTPEMFC system with TEGs andTECs has mutual benefits. The performances of thefuel cell system can be significantly improved andthe characteristics of the TE devices can be betterutilized.
TEG heat recovery can increase the system effi-ciency by about 1/10 and help the system out ofLi-ion battery dependence. Under normal workingcondition, the major heat source TEGs can recoveris the fuel cell cathode exhaust. During systemstartup, the major heat source is the flue gas fromthe methanol reformer; TEG heat recovery can sig-nificantly reduce the capacity of the Li-ion battery.To recover heat more efficiently, two main param-eters of the TEG subsystem are identified using afinite-difference model. They are the cathodeexhaust temperature and the heat exchanger struc-ture. Based on the preliminary analysis, three heatexchanger structures with superior performance areidentified for further subsystem optimization.
The benefits of using TECs are twofold: I) improv-ing the system dynamic performance through theTE-assisted heat regulation and II) mitigatingthe system dependence on Li-ion battery throughthe TE-assisted suppression of the heat dissipation.Working as heat regulators, TECs seem capableand their characteristics can probably be fullyutilized.
Through the preliminary analyses in this article,it can be concluded that the applications of TE
devices inside HTPEMFC power systems could be ofbenefit and are worthy of further study.
ACKNOWLEDGEMENTS
The authors gratefully acknowledge financial sup-port from Aalborg University and China ScholarshipCouncil.
REFERENCES
1. S.J. Andreasen, L. Ashworth, I.N.M. Remon, and S.K. Kær,Int. J. Hydrogen Energy 33, 7137 (2008).
2. Y. Wang, K. Chen, J. Mishler, S.C. Cho, and X.C. Adroher,Appl. Energy 88, 981 (2011).
3. D.M. Rowe, Renew. Energy 5, 1470 (1994).4. D. Geng and C. Xie, Chin. J. Power Sour. 3, 34 (2010).5. X. Chen, Y. Pan, and J. Chen, Fuel Cells 10, 1164 (2010).6. J. Yang and F.R. Stabler, J. Electron. Mater. 38, 7 (2009).7. S.J. Andreasen (Ph.D. dissertation, Aalborg University, 2009).8. J. Zhang, Thermoelectric Technology, 1st ed. (Tianjin: China
Tianjin Institute of Power Sources, 2008), pp. 23.9. M. Lazard, G. Fraisse, C. Goupil, and H. Scherrer, (Paper
presented at the Proceedings of the 6th European Confer-ence on Thermoelectrics, Paris, France, 2–4 July 2008), p. 2.
10. G.J. Snyder and E.S. Toberer, Nat. Mater. 7, 105 (2008).11. X. Gao, S.J. Andreasen, M. Chen, and S.K. K�r, Int. J.
Hydrogen Energy. doi:10.1016/j.ijhydene.2012.03.009.12. F-Chart Software, EES Manual, v8.590 Edition (Madison,
WI: F-Chart Software, LLC, 2010), www.fchart.com.13. N. Espinosa, M. Lazard, L. Aixala, and H. Scherrer,
J. Electron. Mater. 39, 1446 (2010).14. K.D. Smith (Master’s thesis, Rochester Institute of Tech-
nology, 2009).15. G. Nellis and S. Klein, Heat Transfer, 2nd ed. (New York:
Cambridge University Press, 2009), pp. 841–851.16. C.E. Thomas and J. Hydrog, Energy 34, 6005 (2009).17. M. Chen, S.J. Andreasen, L.A. Rosendahl, S.K. Kær, and
T. Condra, J. Electron. Mater. 39, 9 (2010).18. S. Lee, Establishing a New Performance Paradigm with
Ultra-Thin Thermoelectric Modules (Research TrianglePark,NC: NextremeThermal Solutions,2010), www.nextreme.com/media/pdf/articles/Thermoelectric_Cooling.pdf.
19. K. Takeda, A. Baba, Y. Hishinuma, and T. Chikahisa, JSAERev. 23, 183 (2002).
20. D. Martin, U.S. patent US20040042957 Al (4 March 2004).
Gao, Chen, Andreasen, and Kær1844


97
Paper 2
Numerical Model of a Thermoelectric Generator with Compact Plate-Fin Heat
Exchanger for High Temperature PEM Fuel Cell Exhaust Heat Recovery
Gao, Xin; Andreasen, Søren Juhl; Chen, Min; Kær, Søren Knudsen
International Journal of Hydrogen Energy, 37(10), 2012, p. 8490-8498.


Numerical model of a thermoelectric generator with compactplate-fin heat exchanger for high temperature PEM fuel cellexhaust heat recovery
Xin Gao*, Søren Juhl Andreasen, Min Chen, Søren Knudsen Kær
Department of Energy Technology, Aalborg University, Pontoppidanstræde 101, Aalborg DK-9220, Denmark
a r t i c l e i n f o
Article history:
Received 25 December 2011
Received in revised form
22 February 2012
Accepted 4 March 2012
Available online 28 March 2012
Keywords:
Thermoelectric generator
Heat recovery
Fuel cell
Discretized model
Heat exchanger database
a b s t r a c t
This paper presents a numerical model of an exhaust heat recovery system for a high
temperature polymer electrolyte membrane fuel cell (HTPEMFC) stack. The system is
designed as thermoelectric generators (TEGs) sandwiched in the walls of a compact plate-
fin heat exchanger. Its model is based on a finite-element approach. On each discretized
segment, fluid properties, heat transfer process and TEG performance are locally calculated
for higher model precision. To benefit both the system design and fabrication, the way to
model TEG modules is herein reconsidered; a database of commercialized compact plate-
fin heat exchangers is adopted. Then the model is validated against experimental data and
the main variables are identified by means of a sensitivity analysis. Finally, the system
configuration is optimized for recovering heat from the exhaust gas. The results exhibit the
crucial importance of the model accuracy and the optimization on system configuration.
Future studies will concentrate on heat exchanger structures.
Copyright ª 2012, Hydrogen Energy Publications, LLC. Published by Elsevier Ltd. All rights
reserved.
1. Introduction
With the diminishing reserve of fossil fuels and the rising
concern on global green-house gas emissions, more attention
is being drawn by fuel cells [1]. Among other fuel cell tech-
nologies, high temperature polymer electrolyte membrane
fuel cell (HTPEMFC) power systems are considered to be
promising in practice [2]. Due to the high operating tempera-
tures of HTPEMFCs (160�Ce180 �C), the waste heat is of high
quality and thermoelectric generators (TEGs) are introduced
herein to recover this exhaust heat for electricity. As electric
power generators, TEGs are advantageous in low grade heat
recovery [3]. As opposed to traditional energy conversion
devices, they have very simple structures and no moving
parts. In addition, they are environmentally friendly, silent,
reliable, exhibit excellent scalability and pure DC power
output. Currently, TEGs are restricted to low heat-to-power
conversion ratios. They are primarily competitive in niche
applications, such as exhaust heat recovery, remote power
supply and back-up power units [4,5]. If their efficiency can be
improved in the future, for example from the present device
figure of merit (ZT) z 1 to ZT � 2, many applications will
materialize [6,7]. More widespread use of thermoelectrics
requires not only novel materials with improved performance
characteristics [8e10], but also TEG systems properly con-
structed [11e13].
Research on TEG systems can be categorized into optimi-
zation of the TEG modules themselves, and assembly of TEG
modules with heat transfer structures. There are numerous
publications considering the inner structure of TEG modules
[14e17]. However, as mentioned by Hendricks and Lustbader
[18], the whole TEG system should be studied as an integrated
* Corresponding author. Tel.: þ45 21370579, fax: þ45 98151411.E-mail addresses: [email protected] (X. Gao), [email protected] (S.K. Kær).
Available online at www.sciencedirect.com
journal homepage: www.elsevier .com/locate/he
i n t e rn a t i o n a l j o u r n a l o f h y d r o g e n en e r g y 3 7 ( 2 0 1 2 ) 8 4 9 0e8 4 9 8
0360-3199/$ e see front matter Copyright ª 2012, Hydrogen Energy Publications, LLC. Published by Elsevier Ltd. All rights reserved.doi:10.1016/j.ijhydene.2012.03.009
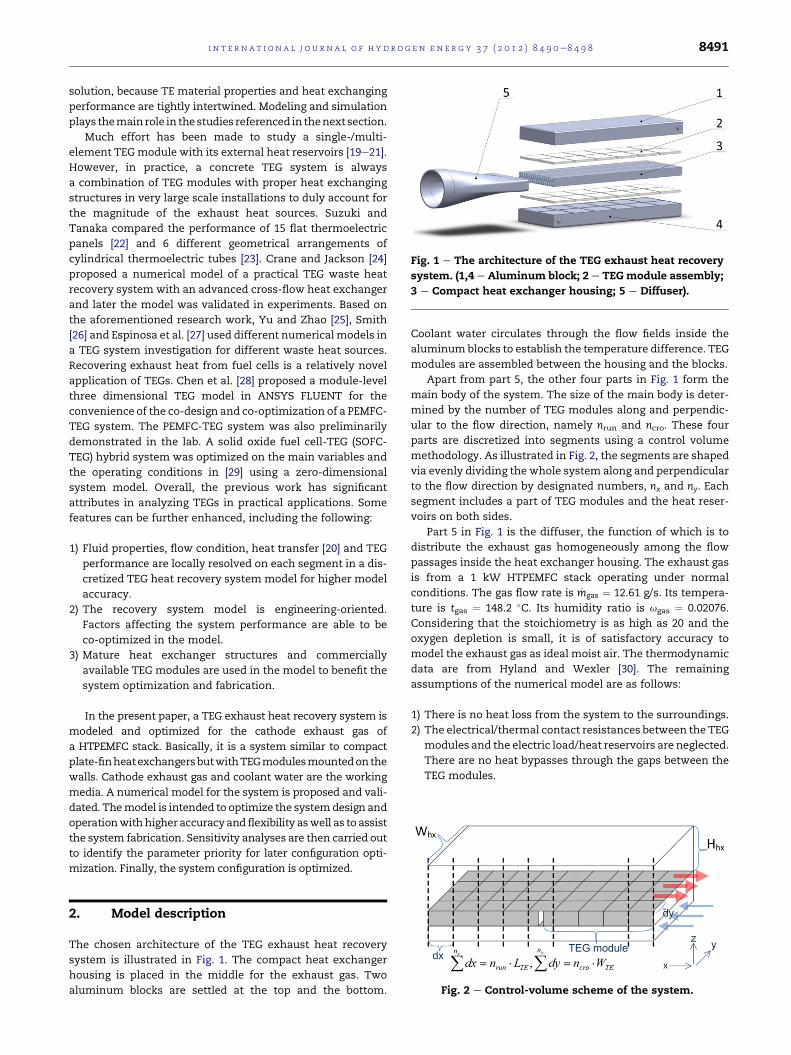
solution, because TE material properties and heat exchanging
performance are tightly intertwined. Modeling and simulation
plays themain role in the studies referenced in thenext section.
Much effort has been made to study a single-/multi-
element TEGmodule with its external heat reservoirs [19e21].
However, in practice, a concrete TEG system is always
a combination of TEG modules with proper heat exchanging
structures in very large scale installations to duly account for
the magnitude of the exhaust heat sources. Suzuki and
Tanaka compared the performance of 15 flat thermoelectric
panels [22] and 6 different geometrical arrangements of
cylindrical thermoelectric tubes [23]. Crane and Jackson [24]
proposed a numerical model of a practical TEG waste heat
recovery system with an advanced cross-flow heat exchanger
and later the model was validated in experiments. Based on
the aforementioned research work, Yu and Zhao [25], Smith
[26] and Espinosa et al. [27] used different numericalmodels in
a TEG system investigation for different waste heat sources.
Recovering exhaust heat from fuel cells is a relatively novel
application of TEGs. Chen et al. [28] proposed a module-level
three dimensional TEG model in ANSYS FLUENT for the
convenience of the co-design and co-optimization of a PEMFC-
TEG system. The PEMFC-TEG system was also preliminarily
demonstrated in the lab. A solid oxide fuel cell-TEG (SOFC-
TEG) hybrid system was optimized on the main variables and
the operating conditions in [29] using a zero-dimensional
system model. Overall, the previous work has significant
attributes in analyzing TEGs in practical applications. Some
features can be further enhanced, including the following:
1) Fluid properties, flow condition, heat transfer [20] and TEG
performance are locally resolved on each segment in a dis-
cretized TEG heat recovery system model for higher model
accuracy.
2) The recovery system model is engineering-oriented.
Factors affecting the system performance are able to be
co-optimized in the model.
3) Mature heat exchanger structures and commercially
available TEG modules are used in the model to benefit the
system optimization and fabrication.
In the present paper, a TEG exhaust heat recovery system is
modeled and optimized for the cathode exhaust gas of
a HTPEMFC stack. Basically, it is a system similar to compact
plate-finheatexchangersbutwithTEGmodulesmountedon the
walls. Cathode exhaust gas and coolant water are the working
media. A numerical model for the system is proposed and vali-
dated. Themodel is intended to optimize the systemdesign and
operationwithhigher accuracyandflexibility aswell as to assist
the system fabrication. Sensitivity analyses are then carried out
to identify the parameter priority for later configuration opti-
mization. Finally, the system configuration is optimized.
2. Model description
The chosen architecture of the TEG exhaust heat recovery
system is illustrated in Fig. 1. The compact heat exchanger
housing is placed in the middle for the exhaust gas. Two
aluminum blocks are settled at the top and the bottom.
Coolant water circulates through the flow fields inside the
aluminum blocks to establish the temperature difference. TEG
modules are assembled between the housing and the blocks.
Apart from part 5, the other four parts in Fig. 1 form the
main body of the system. The size of the main body is deter-
mined by the number of TEG modules along and perpendic-
ular to the flow direction, namely nrun and ncro. These four
parts are discretized into segments using a control volume
methodology. As illustrated in Fig. 2, the segments are shaped
via evenly dividing the whole system along and perpendicular
to the flow direction by designated numbers, nx and ny. Each
segment includes a part of TEG modules and the heat reser-
voirs on both sides.
Part 5 in Fig. 1 is the diffuser, the function of which is to
distribute the exhaust gas homogeneously among the flow
passages inside the heat exchanger housing. The exhaust gas
is from a 1 kW HTPEMFC stack operating under normal
conditions. The gas flow rate is _mgas ¼ 12.61 g/s. Its tempera-
ture is tgas ¼ 148.2 �C. Its humidity ratio is ugas ¼ 0.02076.
Considering that the stoichiometry is as high as 20 and the
oxygen depletion is small, it is of satisfactory accuracy to
model the exhaust gas as ideal moist air. The thermodynamic
data are from Hyland and Wexler [30]. The remaining
assumptions of the numerical model are as follows:
1) There is no heat loss from the system to the surroundings.
2) The electrical/thermal contact resistances between the TEG
modules and the electric load/heat reservoirs are neglected.
There are no heat bypasses through the gaps between the
TEG modules.
Fig. 1 e The architecture of the TEG exhaust heat recovery
system. (1,4 e Aluminum block; 2 e TEG module assembly;
3 e Compact heat exchanger housing; 5 e Diffuser).
Fig. 2 e Control-volume scheme of the system.
i n t e r n a t i o n a l j o u r n a l o f h y d r o g e n en e r g y 3 7 ( 2 0 1 2 ) 8 4 9 0e8 4 9 8 8491

3) Thermoelectric materials distribute homogeneously inside
each module.
4) No phase change occurs inside the heat exchanger. Axial
heat conduction is neglected. System performance is iden-
tical in the direction perpendicular to the exhaust gas flux.
5) When calculating the pressure drop, contraction and
expansion pressure losses are neglected.
6) Heat conduction and convection in the aluminum blocks as
well as between the TEGmodules and the aluminum blocks
are not taken into account. The coolant water flow is set to
be high enough so a uniform temperature of 20 �C can
represent the cold side.
Based on the above assumptions, the governing equations
for each segment can be given based on the energy balance.
2.1. TEG modules
The way to model TEG modules is reconsidered compared to
other publications in the field to better serve the system level
study. Modules are treated as black boxes in the model. Inside
each module, thermoelectric materials are supposed homo-
geneously distributed. Unlike most of the above literature,
module parameters are from the experiments in [26], not
directly substituted by material properties. Module perfor-
mance calculated from empirical parameters is more repro-
ducible in real-life applications. After the module is
discretized in the x and y directions but not along the z axis,
TEG performance is assumed uniform in each segment but
vary with temperature between segments. For system design
and fabrication, the advantage of modeling TEG modules in
thiswaywould be twofold: a)mitigating themodel complexity
and b) keeping the model precision from being affected by
simplifying the details inside the TEG modules. The module
parameters used in the current system are listed in Table 1.
The Thomson effect is neglected because the temperature
difference is relatively moderate in this case [31].
For each TEG segment, the corresponding energy balance is
described by the following equations:
_qh;TE
�i�¼ ðTh;TEðiÞ � Tc;TEðiÞÞ
�Rt;i þ aiTh;TE
�i�Ii � 0:5I2i Re;i; (1)
_qc;TE
�i�¼ ðTh;TEðiÞ � Tc;TEðiÞÞ
�Rt;i þ aiTc;TE
�i�Ii þ 0:5I2i Re;i; (2)
w�i�¼ _qh;TE
�i�� _qc;TE
�i�: (3)
All segments can either electrically work in series or in
standalone mode. In standalone mode, the external ohmic
resistance equals the internal when one segment reaches its
peak power output and the corresponding electric current is:
Ii ¼ 0:5ðaiÞðTh;TEðiÞ � Tc;TEðiÞÞ�Re;i: (4)
The total power output of the whole TEG assembly can be
summed up as:
PTEA ¼Xnx Xny
w�i�: (5)
2.2. Compact plate-fin heat exchanger
Choosing the best heat exchanger for heat recovery is
a common problem. In the current model, a lookup table is
integrated to alleviate this problem. The table contains 59
types of commercialized compact plate-fin heat exchangers.
All the heat exchanger geometry and relevant parameters in
the table are taken from [32]. Attempts towards numerical
prediction of heat exchanger performance easily fail in
matching experimental data. However the correlations and
parameter data herein were generated from experimental
work by Kays and London. These correlations and data have
found extensive application in industry, particularly in less-
critical designs. Compared to homemade heat exchanging
structures, modeling in this way can better fulfill the system
optimization and fabrication requests.
The governing equations to describe the heat transfer
between the TEG assembly and the hot/cold fluids in each
segment, respectively, are:
_qh;TE
�i�¼ _qgas
�i�¼ _mgas
�hgas;i � hgas;iþ1
�; (6)
_qgas
�i�¼ 3ctf
�i�_mgas
�hgas;i � hcw
gas;i
�; (7)
_qh;TE
�i�¼ UAhx
�i��Tgas
�i�� Th;TE
�i��;
Tgas
�i�¼
�Tgas
�i�þ Tgasðiþ 1Þ
��2:
(8)
The coefficients in the above functions are given as follows:
1=UAtotðiÞ ¼ 1=UAhxðiÞ þ 1=UATEðiÞ; (9)
3ctf�i�¼ 1� expð�NTUðiÞÞ;
NTU�i�¼ 2UAtot
�i�Tgas
�i��
_mgas
�hgas;i þ hgas;iþ1
�:
(10)
hgas is the enthalpy of the exhaust gas and hcwgas is the exhaust
gas enthalpy at the temperature of the coolantwater. They are
calculated on each segment from functions found in [30].
UAhx(i) is the heat exchanger conductance in each segment,
which describes both the air-exchanger heat convection and
the heat conduction in the exchanger body. It is determined by
the exchanger material and structure, the local fluid proper-
ties as well as the flow condition of the exhaust gas. In details,
the key functions are [32]:
Ahx
�i�¼ sðiÞHhxWhxdx=ny (11)
Co�i�¼ jhxugas
�hgas;i þ hgas;iþ1
��2Prð2=3Þi Tgas
�i�
(12)
ugas ¼ _mgas=Aff (13)
REi ¼ ugasDh=ngas;i (14)
Table 1 e TEG module parameters [26].
Properties Values
Type Melcor HT8
WTE$LTE (m2) 0.04001$0.04001
aTE (V/K) �0.0000438$Tav þ 0.05
RTE,e (U) 0.00638$Tav þ 2.00
RTE,t (K/W) 0.000284$Tav þ 1.54
Tav�(�C), the average temperature between the two sides of each
module.
i n t e rn a t i o n a l j o u r n a l o f h y d r o g e n en e r g y 3 7 ( 2 0 1 2 ) 8 4 9 0e8 4 9 88492

For any kind of heat exchanger, there is an operational
region of Reynolds number. This information is also available
in the lookup table.
In addition, the pressure drop through the heat exchanger
housing can be evaluated from the following function,
Dphx ¼�u2gas=
�2rgas;in
��h4fhxLhxrgas;in=
�Dhrgas
�
þ�1þ s2
���rgas;in=rgas;out
�� 1
�ið15Þ
The Colburn factor jhx and the Friction factor fhx of plate-fin
surfaces are also from the experimental source [32].
2.3. Solution methodology
The solution methodology of the numerical model is imple-
mented by using a discretized 3-NTU approach [33]. Input
parameters include the thermo-physical properties and elec-
trical connection style of TEG modules, configuration param-
eters of TEG modules and plate-fin heat exchangers as well as
the inlet exhaust gas parameters into the plate-fin heat
exchanger. Then the fluid properties, thermoelectric perfor-
mance and heat transfer process are updated on each
segment along the flow direction. Finally, results are exported.
The discretized 3-NTU harnessed here is to make sure the
model is better suited for both simulation-type and design-
type problems [34]. Algebraically, it is identical with the log-
mean temperature difference method (LMTD) [34].
3. Simulation results and discussion
In the following numerical simulation, the heat exchanger
type used is called ‘Strip-fin plate-fin, surface 1/4(s)-11.1’ [35].
It is characterized by a low pressure drop for high heat
exchanging capability [27]. More details of its specifications
can be found in [32]. The only exception is in Section 3.5,
where the performance of different heat exchangers is
compared.
3.1. Model validation
A check is carried out to balance the computational require-
ments and the result accuracy. There are 10 Melcor HT8
modules along and perpendicular to the flow direction, under
which case the system is oversized. All TEG segments during
the simulation run are in standalone mode. In other words,
each segment is assumed to be connected to a matched load
to maximize its power output. According to the 4th assump-
tion above, only the number of segments along the flow
direction can potentially affect the simulation results.
Therefore the segment number per TEGmodule is varied from
1 to 20 to observe its influence. The representative results of
the TEG hot side temperature and the system power output
are shown below.
In Fig. 3, it is clear that the effect of the number of segments
on the TEG hot side temperature distribution is not significant.
If this temperature distribution was studied independently,
there would be no need to pay attention on the number of
segments. On the other hand, it impacts the system power
output evidently. Fig. 4 illustrates the system power output
and its relative error versus the segment number. For a devi-
ation less than 0.5%, cutting each module into 6 segments in
the flow direction is the minimum requirement. It means it is
not necessary to discretize each module by the width of each
thermoelement or the distance between adjacent thermoele-
ments as in literature. In the following simulations, this
number is adjusted accordingly.
Simulations are then conducted to validate the system
model with experimental data. Firstly, the discretized TEG
model is compared with experimental results from [26].
Throughout the validation, three temperatures are respec-
tively set to the module hot side, while the cold side is kept
constant at 50 �C, to follow the experiment settings. Sorted by
the temperature difference, the module power outputs are
plotted in Fig. 5. The results show a perfect correspondence
between the discretized TEG model and the experiments.
Secondly, the performance of the heat exchanger part is
verified against the experimental results from [27]. The heat
exchanger type harnessed in the experiments was also the
one, ‘Strip-fin plate-fin, surface 1/4(s)-11.1’. For comparison,
the heat transferred and the pressure drop are used for
comparison. Results are shown in Fig. 6.
According to Fig. 6, it can be concluded that the simulation
results are in good agreement with the experimental results.
They also show similar trends. The difference relatively
observable only lies in the low flow rate region. The reason is
that some vital details are missing in the reference, such as
the exact temperature difference, the hot gas composition,
among others. As a whole, the deviation still falls inside a 10%
range. So it is concluded that the accuracy of the heat
exchanger model is acceptable.
The numerical model of the TEG exhaust heat recovery
system model is thus considered developed and validated.
Before conducting optimization on the system configuration,
a sensitivity analysis is essential to identify which parameters
have more significant impact on the system performance.
3.2. Sensitivity analysis
Amultiple parameter sensitivity analysis is carried out in this
section to determine the main variables of this system that
Fig. 3 e TEG hot side temperature distribution vs. the
segment number.
i n t e r n a t i o n a l j o u r n a l o f h y d r o g e n en e r g y 3 7 ( 2 0 1 2 ) 8 4 9 0e8 4 9 8 8493

affect the performance. An uncertainty propagation tool is
used to study the effects on system model output when the
independent parameters vary in given ranges [35]. This
method was initially designed for experiments to assess the
deviations in measurement of the calculated variables. As
described in [36], this calculation assumes the independent
variables are uncorrelated and random, i.e. neglecting
covariance between them; the uncertainty in the system
performance can be expressed as
Uh ¼ffiffiffiffiffiffiffiffiffiffiffiffiffiffiffiffiffiffiffiffiffiffiffiffiffiffiffiffiffiffiffiffiffiffiXi
ðvh=vXiÞ2U2Xi
r; where h ¼ fðX1;X2;.;XnÞ: (16)
Here factors that affect the system power output PTEA,max
and the heat exchanger pressure dropDphx are analyzed using
the uncertainty propagation. These factors can be distin-
guished into three categories: system structural parameters,
TEG properties and operating conditions. System structural
parameters further have two subcategories, namely system
dimensions and heat exchanger type. Results are listed in
Tables 2 and 3. Every input variable is set with a relative
uncertainty of 5.00%.
The results show that the system power output and the
pressure drop are affected by an uncertainty of 17.08% and
13.46%, respectively. The influences are rather significant,
which means that some of the input parameters should be
carefully treated in the simulation for higher model accuracy
as well as in practice for better system performance.
By observation it can be seen that the larger sources of the
power output uncertainty are five parameters. These are the
exhaust gas temperature, mass flow rate, specific heat, heat
resistance of each TEG module and the module’s Seebeck
coefficient. As verified by many literatures, the exhaust gas
temperature has extremely significant influence on the TEG
power output. The exhaust gas temperature, togetherwith the
mass flow rate and the specific heat, determines the capacity
of the heat source, which is available for TEGs to convert into
electricity. Similarly, the module heat resistance and the
Seebeck coefficient dominate the conversion efficiency of the
whole TEG assembly. If any of the above parameters becomes
larger, the system power output will increase and vice versa.
On the other hand some input parameters have negligible
effect on the system power output. These include the exhaust
gas pressure and most system structural parameters, such as
the number of modules crossing the flow direction, number of
modules along the flow direction and so on. The power output
insensitivity to these structural parameters actually indicates
that the current system is oversized. This insensitivity is also
the side effect of all TEG segments working in standalone
mode in the current system. The structural parameters will be
more thoroughly analyzed in the following sections. Another
parameter with little effect is the exhaust gas pressure. This
can have a positive effect on the system electrical efficiency
because little pressure boost is required for the recovery
system. This can also simplify the connection between the
recovery system and the fuel cell stack, because the feed gas
pressure also has a minor effect on the fuel cell performance.
As a whole, the system parasitic losses are decreased.
Parasitic losses and system pressure drops are roughly
proportional in the current system. From Table 3, it can be
concluded that almost all the uncertainty of the pressure drop
comes out of the systemstructural parameters and the exhaust
gas magnitude. Among them, the exhaust gas flow rate and
number of TEG modules perpendicular to the flow have the
most significant effect. The influence of the exhaust gas pres-
sure, the height of the heat exchanger and number of TEG
modules along the flow direction is also rather significant.
These influences have been clearly described by the above Eq.
Fig. 4 e System power output with segments from 1 to 20
per module.
Fig. 5 e Validation of the discretized TEG model.
Fig. 6 e Heat exchanger model validation by heat
transferred and pressure drop.
i n t e rn a t i o n a l j o u r n a l o f h y d r o g e n en e r g y 3 7 ( 2 0 1 2 ) 8 4 9 0e8 4 9 88494

(15). On the contrary, the effect of the exhaust gas temperature
and its specific heat is relatively moderate. It can be noticed
that, even in the current oversized system, the system struc-
tural parameters still have dramatic impact on the system
pressure drop. To lower the pressure drop, aswell asmaximize
the system net power output, the system dimensions and the
heat exchanger types need a more detailed analysis.
3.3. Influence of ncro
ThenumberofTEGmodulesperpendicular to theflowdirection
is varied to investigate the impact of the heat exchanger width
on the system power output and the pressure drop. All TEG
segments in this study worked in standalone mode. The
number of TEG modules along the flow direction was desig-
nated to 30. Under this condition the system was always over-
sized along the flow direction for every ncro. In the simulation,
ncro increased from the minimum value of 2. Under the above
settings, thesystempoweroutputwill reach itsupper limit inall
cases.
The simulation results are shown in Fig. 7. The width tends
to decrease the electric power generated and the pressure
drop simultaneously. The pressure drop falls sharply down in
the beginning. But after ncro reaches 8, the effect is rather
moderate. On the other hand the system power output drops
gradually all the way down with ncro increasing, although
a little bit faster in the first half range. The increasing width
increases the cross section area of the flow passage. The flow
speed then drops. In turn, it can be calculated by Eq. (15) that
the pressure drop will decrease. But with decreasing flow
speed, Reynolds number is also becoming smaller. As a result,
poorer convective heat transfer in the heat exchanger will
reduce the temperature difference on TEG modules and
reduce the power output.
Table 2 e Sensitivity study on system power output.
Input parameters and description Value Uncertainty contribution (%)
Afin\A Fin area/total area 0.756 �0.00ahx Heat transfer area/total volume (m2/m3) 915.6 1.35
Hhx Height of heat exchanger (m) 0.00635 0.71
finthk Thickness of fins (not applicable to pin-fin) (m) 0.000152 0.00
Cohx,av The exchanger average heat conductivity (W/m2-K) 80.58 1.30
ncro Number of modules cross the flow direction 10 0.01
nrun Number of modules along the flow direction 10 0.01
aTE Seebeck coefficient of each TEG module (V/K) 0.05 19.67
RTE,e Electric resistance of each TEG module (U) 2 �4.92RTE,t Heat resistance of each TEG module (K/W) 1.54 10.71_mgas The exhaust gas mass flow rate (kg/s) 0.01261 7.96
Cpgas Average exhaust gas specific heat (J/kg-�C) 1047 7.96
ugas Humidity Ratio 0.02076 �0.00pgas Gas pressure (Pa) 1 0.00
tgas Gas temperature (�C) 148.2 44.51
tcw Coolant water temperature (�C) 20 �0.89
Output Variable description Value Uncertainty (%)
PTEA,max Maximum power output of the system 24.10 (W) � 4.12 (W) (�17.08%)
Table 3 e Sensitivity study on the system pressure drop.
Input parameters and description Value Uncertainty contribution (%)
Afin\A Fin area/total area 0.756 0.00
ahx Heat transfer area/total volume (m2/m3) 915.6 �0.00Hhx Height of heat exchanger (m) 0.00635 �15.64finthk Thickness of fins (not applicable to pin-fin) (m) 0.000152 �0.00Cohx,av The exchanger average heat conductivity (W/m2-K) 80.58 �0.00ncro Number of modules cross the flow direction 10 �28.11nrun Number of modules along the flow direction 10 13.13
aTE Seebeck coefficient of each TEG module (V/K) 0.05 0.00
RTE,e Electric resistance of each TEG module (U) 2 0.00
RTE,t Heat resistance of each TEG module (K/W) 1.54 0.01_mgas The exhaust gas mass flow rate (kg/s) 0.01261 28.06
Cpgas Average exhaust gas specific heat (J/kg-�C) 1047 0.03
ugas Humidity Ratio 0.02076 �0.00pgas Gas pressure (Pa) 1 �13.80tgas Gas temperature (�C) 148.2 1.20
tcw Coolant water temperature (�C) 20 0.02
Output Variable description Value Uncertainty (%)
Dphx Pressure drop of the system 383.10 (Pa) � 51.58 (Pa) (�13.46%)
i n t e r n a t i o n a l j o u r n a l o f h y d r o g e n en e r g y 3 7 ( 2 0 1 2 ) 8 4 9 0e8 4 9 8 8495
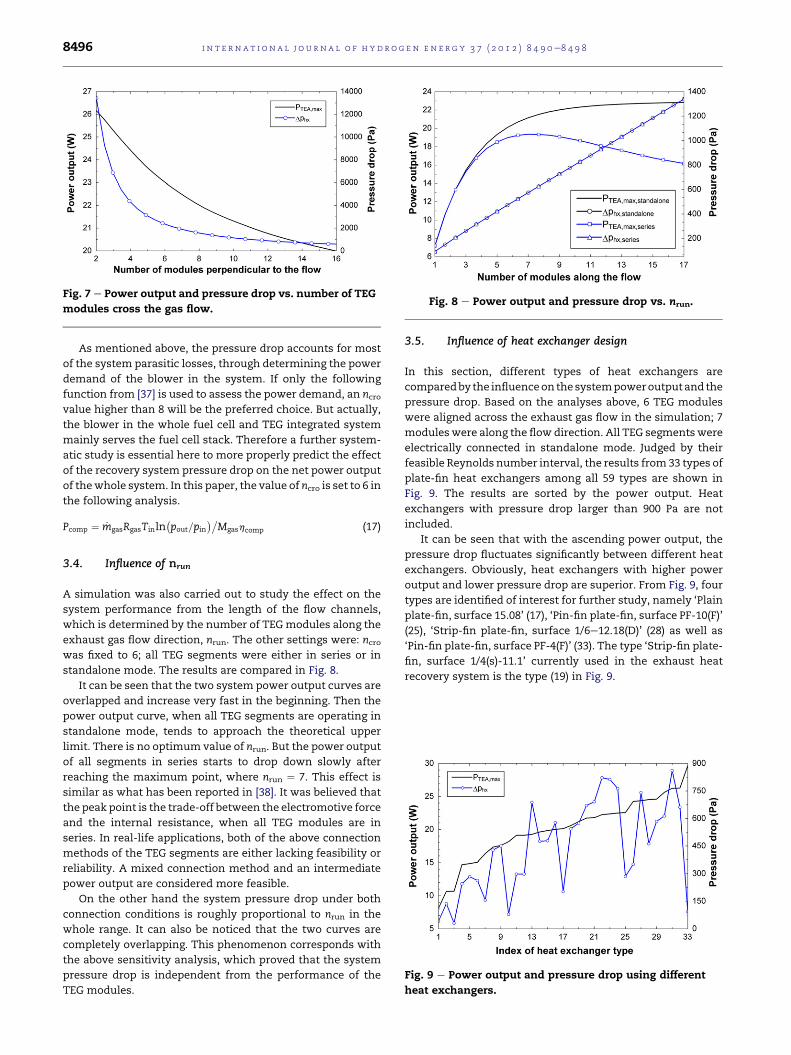
As mentioned above, the pressure drop accounts for most
of the system parasitic losses, through determining the power
demand of the blower in the system. If only the following
function from [37] is used to assess the power demand, an ncrovalue higher than 8 will be the preferred choice. But actually,
the blower in the whole fuel cell and TEG integrated system
mainly serves the fuel cell stack. Therefore a further system-
atic study is essential here to more properly predict the effect
of the recovery system pressure drop on the net power output
of thewhole system. In this paper, the value of ncro is set to 6 in
the following analysis.
Pcomp ¼ _mgasRgasTinln�pout=pin
��Mgashcomp (17)
3.4. Influence of nrun
A simulation was also carried out to study the effect on the
system performance from the length of the flow channels,
which is determined by the number of TEGmodules along the
exhaust gas flow direction, nrun. The other settings were: ncrowas fixed to 6; all TEG segments were either in series or in
standalone mode. The results are compared in Fig. 8.
It can be seen that the two system power output curves are
overlapped and increase very fast in the beginning. Then the
power output curve, when all TEG segments are operating in
standalone mode, tends to approach the theoretical upper
limit. There is no optimum value of nrun. But the power output
of all segments in series starts to drop down slowly after
reaching the maximum point, where nrun ¼ 7. This effect is
similar as what has been reported in [38]. It was believed that
the peak point is the trade-off between the electromotive force
and the internal resistance, when all TEG modules are in
series. In real-life applications, both of the above connection
methods of the TEG segments are either lacking feasibility or
reliability. A mixed connection method and an intermediate
power output are considered more feasible.
On the other hand the system pressure drop under both
connection conditions is roughly proportional to nrun in the
whole range. It can also be noticed that the two curves are
completely overlapping. This phenomenon corresponds with
the above sensitivity analysis, which proved that the system
pressure drop is independent from the performance of the
TEG modules.
3.5. Influence of heat exchanger design
In this section, different types of heat exchangers are
comparedby the influenceon the systempoweroutputand the
pressure drop. Based on the analyses above, 6 TEG modules
were aligned across the exhaust gas flow in the simulation; 7
moduleswere along the flow direction. All TEG segmentswere
electrically connected in standalone mode. Judged by their
feasible Reynolds number interval, the results from33 types of
plate-fin heat exchangers among all 59 types are shown in
Fig. 9. The results are sorted by the power output. Heat
exchangers with pressure drop larger than 900 Pa are not
included.
It can be seen that with the ascending power output, the
pressure drop fluctuates significantly between different heat
exchangers. Obviously, heat exchangers with higher power
output and lower pressure drop are superior. From Fig. 9, four
types are identified of interest for further study, namely ‘Plain
plate-fin, surface 15.08’ (17), ‘Pin-fin plate-fin, surface PF-10(F)’
(25), ‘Strip-fin plate-fin, surface 1/6e12.18(D)’ (28) as well as
‘Pin-fin plate-fin, surface PF-4(F)’ (33). The type ‘Strip-fin plate-
fin, surface 1/4(s)-11.1’ currently used in the exhaust heat
recovery system is the type (19) in Fig. 9.
Fig. 7 e Power output and pressure drop vs. number of TEG
modules cross the gas flow.Fig. 8 e Power output and pressure drop vs. nrun.
Fig. 9 e Power output and pressure drop using different
heat exchangers.
i n t e rn a t i o n a l j o u r n a l o f h y d r o g e n en e r g y 3 7 ( 2 0 1 2 ) 8 4 9 0e8 4 9 88496

4. Conclusions
A numerical model of a TEG heat recovery system for the
exhaust gas from a HTPEMFC stack was developed. It is based
on a finite-element approach with more precisely described
gas properties and heat transfer. For both design-type and
simulation-type problems, the versatility of the model is
enhanced by the integrated database of 59 types of plate-fin
heat exchangers and the discretized 3-NTU solution method.
In summary, the model can help optimize the system design
and operation with higher accuracy and flexibility. In turn,
this can benefit the system fabrication.
A sensitivity analysis was then carried out on the system
model. It is found that exhaust gas parameters and heat
exchanger structure have a significant effect on the system
power output and the pressure drop. Gas properties should be
precisely described. The configuration of the system should be
carefully optimized to maximize its performance.
Based on the model, the optimized system configuration of
the heat recovery system is finally depicted. There are 6 TEG
modules crossing the exhaust gas flow and 7modules along the
flow. In the system, the TEG module type is assumed to be the
MelcorHT8 type.Theyareall electrically connected inseries.The
heat exchanger, type ‘Strip-fin plate-fin, surface 1/4(s)-11.1’, is
implemented, which was also chosen by other researchers [27].
Screening thewhole database of different heat exchangers,
it turns out that the heat exchanger structure currently used
in the system is probably not the best choice; Four other types
are identified with superior performance and worthy of
further analysis.
Futurework is needed; Experiments are still needed to verify
the model accuracy. The heat transfer phenomena in the
coolantwater sideandwatervaporphasechange in theexhaust
gas could be included to improve the model robustness. In the
sensitivity analysis, uncertainty intervals of the input parame-
ters need further consideration to better reflect realistic condi-
tions. In comparing different heat exchangers, the system
dimensionswill be optimized for them respectively.More types
of heat exchangers can also be included in the database.
Acknowledgments
The authors gratefully acknowledge financial support from
Aalborg University and China Scholarship Council. The
authors would like to thank Alexandros Arsalis for reviewing.
r e f e r e n c e s
[1] Wang Y, Chen KS, Mishler J, Cho SC, Adroher XC. A review ofpolymer electrolyte membrane fuel cells: technology,applications, and needs on fundamental research. AppliedEnergy 2011;88(4):981e1007.
[2] Andreasen SJ, Ashwortha L, Remona INM, Kær SK. Directlyconnected series coupled HTPEM fuel cell stacks to a Li-ionbattery DC-bus for a fuel cell electrical vehicle.International Journal of Hydrogen Energy 2008;33(23):7137e45.
[3] Rowe DM. Thermoelectric generators as alternative sourcesof low power. Renewable Energy 1994;5(2):1470e8.
[4] Crane DT, LaGrandeur JW. Progress report on BSST-Led USdepartment of energy automotive waste heat recoveryprogram. Journal of Electronic Materials 2010;39(9):2142e248.
[5] Auckland DW, Shuttleworth R, Luff AC, Axcell BP,Rahman M. Design of a semiconductor thermoelectricgenerator for remote subsea wellheads. Electric PowerApplications, IEE Proceedings 1999;142(2):65e70.
[6] Yang J, Stabler FR. Automotive applications ofthermoelectric materials. Journal of Electronic Materials2009;38(7):1245e51.
[7] Chen M, Sasaki Y, Suzuki RO. Computational modeling ofthermoelectric generators in marine power plants. MaterialsTransactions 2011;52(8):1549e52.
[8] Snyder GJ, Toberer ES. Complex thermoelectric materials.Nature Materials 2008;7(2):105e14.
[9] Minnich AJ, Dresselhaus MS, Ren ZF, Chen G. Bulknanostructured thermoelectric materials: current researchand future prospects. Energy & Environmental Science 2009;2(5):466e79.
[10] Venkatasubramanian R, Siivola E, Colpitts T, O’Quinn B.Thin-film thermoelectric devices with high room-temperature figures of merit. Nature 2001;413(6856):597e602.
[11] Gao M, Rowe DM. Ring-structured thermoelectricmodule. Semiconductor Science and Technology 2007;22(8):880e3.
[12] Bell LE. Cooling, heating, generating power, and recoveringwaste heat with thermoelectric systems. Science 2008;321(5895):1457e61.
[13] Chen M, Lund H, Rosendahl L, Condra T. Energy efficiencyanalysis and impact evaluation of the application ofthermoelectric power cycle to today’s CHP systems. AppliedEnergy 2010;87(4):1231e8.
[14] Ioffe AF. Semiconductor thermoelements and thermoelectriccooling. London: Infoseach Limited; 1957.
[15] Rowe DM, Gao M. Evaluation of thermoelectric modules forpower generation. Journal of Power Sources 1998;73(2):193e8.
[16] Crane D, Bell LE. Progress towards maximizing theperformance of a thermoelectric power generator. In:Proceedings of International Conference on thermoelectrics,vol. 1; 2006. p. 11e6.
[17] Chen M, Rosendahl LA, Condra T. A three-dimensionalnumerical model of thermoelectric generators in fluid powersystems. International Journal of Heat and Mass Transfer2011;54(1e3):345e55.
[18] Hendricks TJ, Lustbader JA. Advanced thermoelectric powersystem investigations for light-duty and heavy dutyapplications: part II. In: Proceedings of the 21st InternationalConference on thermoelectrics, vol. 1; 2002. p. 381e94.
[19] Chen J, Wu C. Analysis on the performance ofa thermoelectric generator. Journal of Energy ResourcesTechnology 2000;122(2):61e3.
[20] Esartea J, Gao M, Rowe DM. Modelling heat exchangers forthermoelectric generators. Journal of Power Sources 2001;93(1e2):72e6.
[21] Pramanick AK, Das PK. Constructal design ofa thermoelectric device. International Journal of Heat andMass Transfer 2006;49(7e8):1420e9.
[22] Suzuki RO, Tanaka D. Mathematical simulation ofthermoelectric power generation with the multi-panels.Journal of Power Sources 2003;122(2):201e9.
[23] Suzuki RO, Tanaka D. Mathematic simulation onthermoelectric power generation with cylindrical multi-tubes. Journal of Power Sources 2003;124(1):293e8.
[24] Crane DT, Jackson GS. Optimization of cross flow heatexchangers for thermoelectric waste heat recovery. EnergyConversion and Management 2004;45(9e10):1565e82.
i n t e r n a t i o n a l j o u r n a l o f h y d r o g e n en e r g y 3 7 ( 2 0 1 2 ) 8 4 9 0e8 4 9 8 8497
[25] Yu J, Zhao H. A numerical model for thermoelectricgenerator with the parallel-plate heat exchanger. Journal ofPower Sources 2007;172(1):428e34.
[26] Smith KD. An investigation into the viability of heat sourcesfor thermoelectric power generation systems, [Master thesis].Rochester (NY): Rochester Institute of technology; 2009.
[27] Espinosa N, Lazard M, Aixala L, Scherrer H. Modelinga thermoelectric generator applied to diesel automotive heatrecovery. Journal of Electronic Materials 2010;39(9):1446e55.
[28] Chen M, Andreasen SJ, Rosendahl L, Kær SK, Condra T.System modeling and validation of a thermoelectric fluidicpower source: PEMFC-TEG. Journal of Electronic Materials2010;39(9):1593e600.
[29] Chen X, Pan Y, Chen J. Performance and evaluation of a fuelcell e thermoelectric generator hybrid system. Fuel Cells2010;10(6):1164e70.
[30] Hyland RW, Wexler A. Formulations for the thermodynamicproperties of the saturated phases of H2O from 173.15 K to473.15 K. ASHRAE Transactions 1983;89(2A):500e19.
[31] Lazard M, Fraisse G, Goupil C, Scherrer H. Thermal analysisof a thermoelectric: a way to non conventional design. In:Proceedings of the 6th European Conference onthermoelectrics, vol. 1; 2008. p. 2e15.
[32] Kays WM, London AL. Compact heat exchangers. 3rd ed.New York: McGraw Hill; 1984.
[33] Iu I, Weber NA, Bansal P, Fisher DE. Applying theeffectiveness-NTU method to elemental heat exchangermodels. ASHRAE Transactions 2007;113(1):504e13.
[34] Nellis G, Klein S. Heat transfer. New York: CambridgeUniversity Press; 2009.
[35] F-Chart Software. EES manual, www.fchart.com; 2010. v8.590Edition.
[36] Taylor BN, Kuyatt CE. Guidelines for evaluating andexpressing the uncertainty of NIST measurement results.National Institute of Standards and Technology; 1994[Technical Note 1297].
[37] Kolb G. Fuel processing: for fuel cells. Weinheim, Germany:Wiley-VCH; 2008.
[38] Mori M, Yamagami T, Oda N, Hattori M, Sorazawa M,Haraguchi T. Current possibilities of thermoelectrictechnology relative to fuel economy. Society of AutomotiveEngineering; 2009. 2009-2101e0170.
Nomenclature
Aff: minimum free flow area, m2
Ahx: total heat transfer area, m2
c: gas specific heat, J/kg-KDh: hydraulic diameter, mfhx: Friction factorh: exhaust gas enthalpy, kJ/kgH: component height, mI: electric current, Ajhx: Colburn factorL: component length, mnx: total number of segments along the flowny: total number of segments crossing the flowP: power output or consumption, WDp: pressure drop, Paq: heat transferred, WT, t: temperature, K, �Cugas: core mass velocity, Kg/s-m2
w: power output of each segment, WW: component width, m
Greek symbols
3ctf: the effectivenessn: kinematic viscosity, m2/sr: exhaust gas density, kg/m3
s: minimum free flow area/frontal areas: heat transfer area/exchanger volume, 1/m
Subscripts/Superscripts
c,TE: cold side of the TEG modulecw: coolant watere: electrical resistancegas: exhaust gash,TE: hot side of the TEG modulehx: heat exchangeri: segment indexmax: maximum valuet: thermal resistanceTEA: whole TEG assembly
Abbreviation
Co: exchanger heat conductivity, W/m2-KNTU: number of transfer unitsPr: Prandtl numberRE: Reynolds numberUA: heat exchanger conductance, W/KZT: nondimensional figure-of-merit of module
i n t e rn a t i o n a l j o u r n a l o f h y d r o g e n en e r g y 3 7 ( 2 0 1 2 ) 8 4 9 0e8 4 9 88498


109
Paper 3
Optimization of a Thermoelectric Generator Subsystem for High Temperature
PEM Fuel Cell Exhaust Heat Recovery
Gao, Xin; Andreasen, Søren Juhl; Kær, Søren Knudsen; Rosendahl, Lasse
Aistrup
International Journal of Hydrogen Energy, 2014; Doi:
10.1016/j.ijhydene.2014.01.193.


Optimization of a thermoelectric generatorsubsystem for high temperature PEM fuel cellexhaust heat recovery
Xin Gao*, Søren Juhl Andreasen, Søren Knudsen Kær*,Lasse Aistrup Rosendahl
Department of Energy Technology, Aalborg University, Pontoppidanstræde 101, Aalborg DK-9220, Denmark
a r t i c l e i n f o
Article history:
Received 17 September 2013
Received in revised form
26 January 2014
Accepted 27 January 2014
Available online xxx
Keywords:
TEG subsystem
Fuel cell
Heat recovery
Heat exchanger
Electrical connection
Optimization
a b s t r a c t
In previous work, a thermoelectric (TE) exhaust heat recovery subsystem for a high tem-
perature polymer electrolyte membrane (HT-PEM) fuel cell stack was developed and
modeled. Numerical simulations were conducted and have identified an optimized sub-
system configuration and 4 types of compact heat exchangers with superior performance
for further analysis.
In this work, the on-design performances of the 4 heat exchangers are more thoroughly
assessed on their corresponding optimized subsystem configurations. Afterward, their off-
design performances are compared on the whole working range of the fuel cell stack. All
through this study, different electrical connection styles of all the thermoelectric generator
(TEG) modules in the subsystem and their influences are also discussed. In the end, the
subsystem configuration is further optimized and a higher subsystem power output is
achieved. All TEG modules are now connected into branches. The procedures of designing
and optimizing this TE exhaust heat recovery subsystem are drawn out. The contribution
of TE exhaust heat recovery to the HT-PEM fuel cell power system is preliminarily
concluded. Its feasibility is also discussed.
Copyright ª 2014, Hydrogen Energy Publications, LLC. Published by Elsevier Ltd. All rights
reserved.
1. Introduction
Fuel cells are considered as a cornerstone of the approaching
hydrogen economy [1,2]. Among other fuel cell technologies,
high temperature polymer electrolyte membrane (HT-PEM)
fuel cells, operating around 160 �C, offers promising market
potential [3e5]. Thanks to the increased operating tempera-
ture, they have better fuel impurity tolerance and easier cool-
ing (greater temperature differences versus ambient air), in
turnmuchsimpler systemconfigurationandpossibility ofhigh
system efficiencies [6,7]. Yet another benefit of the relatively
high operating temperature, theHT-PEM fuel cell exhaust heat
is of higher quality and easier to utilize as process heat or
recycle. To recover the exhaust heat for electricity and further
boost the systemefficiency, a thermoelectric (TE) exhaust heat
recovery subsystem has already been introduced to the cath-
ode exhaust of the fuel cell stack in a previous work [8].
In the previous work [8], the subsystem architecture was
decided, model was made, and configuration was
* Corresponding authors. Tel.: þ45 21370579; fax: þ45 98151411.E-mail addresses: [email protected] (X. Gao), [email protected] (S.K. Kær).
Available online at www.sciencedirect.com
ScienceDirect
journal homepage: www.elsevier .com/locate/he
i n t e rn a t i o n a l j o u rn a l o f h y d r o g e n en e r g y x x x ( 2 0 1 4 ) 1e9
Please cite this article in press as: Gao X, et al., Optimization of a thermoelectric generator subsystem for high temperature PEMfuel cell exhaust heat recovery, International Journal of Hydrogen Energy (2014), http://dx.doi.org/10.1016/j.ijhydene.2014.01.193
0360-3199/$ e see front matter Copyright ª 2014, Hydrogen Energy Publications, LLC. Published by Elsevier Ltd. All rights reserved.http://dx.doi.org/10.1016/j.ijhydene.2014.01.193

preliminarily optimized. As illustrated in Fig. 1, the subsystem
is constructed in a way similar to a compact plate-fin
gaseliquid heat exchanger. Part No. 3 is the compact heat
exchanger housing for the fuel cell stack exhaust gas, which
works as the heat source. Part No. 1&4 are two aluminum
blocks with a liquid coolant circulating inside, as the heat
sink. The coolant is actually a methanolewater mixture,
which is stored in a tank primarily as fuel andwill be gradually
reformed into hydrogen for the fuel cell stack [9]. Thermo-
electric generator (TEG) modules, namely part No. 2, are
interposed between the aforementioned two parts. As a
whole, these parts form the sandwich structure subsystem.
The subsystem was then modeled using a finite-element
approach with higher precision and better versatility for
both design-type and simulation-type problems. Main equa-
tions are presented in Table 1. On the model, a sensitivity
analysis was carried out and has identified the subsystem
main variables. In the end, the subsystem configuration was
optimized. There were 6 TEG modules crossing the exhaust
gas flow by 7 modules along the flow. They together scale the
subsystem size. All the modules were electrically in series. On
this optimized configuration, 4 types of heat exchangers with
superior performance were also identified.
In this work, instead of keeping the subsystem size
invariant in all cases, it is adjusted correspondingly to each of
the 4 chosen heat exchangers to more properly assess their
performances. Besides the above on-design performance
optimization under the same fixed fuel cell stack operating
point as in the previous work, research is also carried out on
the whole working range of the stack. It is the off-design
performance optimization. Another factor that evidently af-
fects the subsystem performance, the electrical connection
styles of TEGmodules, is alsomore thoroughly investigated in
this work. Finally, the further optimized subsystem is depic-
ted; a more efficient and practical electrical connection sce-
nario of all the TEG modules is proposed; the procedures of
designing and optimizing the TEG subsystem are generalized.
At the end of this work, the contribution and perspectives of
the TE exhaust heat recovery to the HT-PEM fuel cell power
system are also discussed.
2. On-design performance optimization
In this paper, all simulation settings not explicitly given are
corresponding with the previous work [8] and ‘the subsystem
power output’ refers in particular to itsmaximumvalue. The 4
types of heat exchangers studied here were identified by their
outstandingly low pressure drop still with high heat transfer
performance. Table 2 lists their brief information. More details
can be found in Ref. [11].
In this section, the on-design performances of 4 different
subsystems denoted by their equipped heat exchangers are
analyzed. Theword “on-design” refers to the nominalworking
point of the HT-PEM fuel cell stack. The stack current density
is fixed to z0.67 A/cm2; the stack cathode stoichiometry is
assumed to be around 19 [12,13]. To this nominal working
condition, 4 subsystems are optimized respectively for
determining the final optimal subsystem configuration. Re-
sults are as follows.
2.1. Heat transfer process optimization
To enhance the heat transfer process, the size of the subsys-
tem needs to be optimized, which is scaled by the number of
TEGmodules crossing the exhaust gas flow and the number of
modules along the flow, ncro and nrun. Two steps are needed
here: 1) finding out the candidate ncro, and 2) choosing the
optimum ncro and nrun.
Before finding out the candidate ncro, an adequate nrun for
all the 4 heat exchangers needs to be identified. It requires,
under any ncro and any heat exchanger type, all possible
exhaust heat will be always recovered by the subsystem. The
minimum applicable ncro of 2 is used to pinpoint the adequate
nrun. For each heat exchanger, there is a smallest nrun when
the subsystem power output varies less than 0.5% between
nrun and nrun�1. Then the largest nrun among the four is the
adequate nrun, which equals 26 in this study. Afterward, this
nrun is kept invariant to identify the candidate ncro for each of
the 4 heat exchangers. Results are presented in the following
figures.
Table 1 e -Main equations [8,10].
Description Equations
TEG propertiesPnx;TE Pny;TE
ai ¼ aTE;Pnx;TE Pny;TE
Re;i ¼ RTE;e;Pnx;TE Pny;TE
Rt;i ¼ RTE;t
TEG power output Ii ¼ 0:5ðaiÞ � ðTh;TEðiÞTc;TEðiÞÞ=Re;i
wðiÞ ¼ aiIiðTh;TEðiÞ � Tc;TEðiÞÞ � I2i Re;i; PTEA ¼Pnx
nxPny
nywðiÞ
Heat transfer _qh;TEðiÞ ¼ _qgasðiÞ ¼ _mgasðhgas;i � hgas;iþ1Þ_qgasðiÞ ¼ 3ctf ðiÞ _mgasðhgas;i � hcw
gas;iÞ_qh;TEðiÞ ¼ UAhxðiÞðTgasðiÞ � Th;TEðiÞÞ; TgasðiÞ ¼ ðTgasðiÞ þ Tgasðiþ 1ÞÞ=2
Pressure drop Dphx ¼ ðu2gas=ð2rgas;inÞÞ½4fhxLhxrgas;in=ðDhrgasÞ þ ð1þ s2Þððrgas;in=rgas;outÞ � 1Þ�
Table 2 e The 4 types of heat exchangers [8].
Index Name Page no. in Ref. [11]
1 ‘Plain plate-fin, surface 15.08’ 229
2 ‘Pin-fin plate-fin, surface PF-10(F)’ 262
3 ‘Strip-fin plate-fin, surface 1/6-12.18(D)’ 250
4 ‘Pin-fin plate-fin, surface PF-4(F)’ 260
i n t e r n a t i o n a l j o u r n a l o f h y d r o g e n en e r g y x x x ( 2 0 1 4 ) 1e92
Please cite this article in press as: Gao X, et al., Optimization of a thermoelectric generator subsystem for high temperature PEMfuel cell exhaust heat recovery, International Journal of Hydrogen Energy (2014), http://dx.doi.org/10.1016/j.ijhydene.2014.01.193

Fig. 2 shows the subsystem power output and its pressure
drop changing with ncro on each of the 4 heat exchangers. On
the whole in all 4 cases, the subsystem power output drops
monotonically with ncro increasing and the trend becomes
moderate in the second half range. The exception is the rise
happening at the beginning in case 4. This is explained by the
possible whistle problems and should be avoided in practice
[11]. Considering the subsystem pressure drop in each case,
there is a steep decrease in the first half range and then the
effect of increasing ncro fades out. It is clear the candidate ncrois a tradeoff between the subsystem power output and its
pressure drop [8]. In this study, the subsystempressure drop is
not allowed to go above 900 Pa. Constrained by this, the
candidate ncro for each heat exchanger can only be selected
among 4, 6 and 8. The final choice is the result of the interplay
between ncro and nrun.
From Fig. 2, it can also be observed that the subsystem on
the 4th heat exchanger has the highest power output and
lowest pressure drop. It is also less sensitive to ncro, as illus-
trated by Fig. 3. It is clearly shown that changing ncro barely
influences the power output compared to the other 3 types.
This alsomeans possible higher off-design performance of the
4th type. In a word, heat exchanger type 4 is probably the best
choice. This will be more thoroughly examined in the
following sections.
With the candidate ncro prepared, the next step here is to
identify the optimum ncro and nrun for each heat exchanger.
Calculations are still carried out for the subsystem power
output and pressure drop on different heat exchangers, except
now not only versus ncro but also versus nrun. Results are
plotted in Fig. 4. The 900 Pa criterion is the grey dash-dot line
in each figure. It can be seen there is a peak power output for
each subsystem setup but the pressure drop is nearly pro-
portional to nrun on the whole range. Trends are quite similar
to [14,15]. Under each setup, there is an intersection between
the pressure drop curve and the 900 Pa line. It can be
concluded that the final optimal subsystem configuration for
each heat exchanger is the setup under which the subsystem
reaches its highest peak power output point provided that the
peak point comes before the intersection point. They are listed
in Table 3. As shown, the subsystem installed with the 4th
heat exchanger has the highest power output, the lowest
press drop and the least number of TEG modules. It is most
likely to be the final optimal subsystem configuration.
Following study is carried out on it.
Throughout deciding Table 3, all TEG segments (fragments
of the TEG modules from the finite-element discretization
[8,10]) in the subsystem were electrically in series. Under this
condition, the TEG subsystem has the lowest power output
Fig. 1 e The architecture of the subsystemmain body (1,4 e
Aluminum blocks; 2 e TEG module assembly; 3 e Compact
heat exchanger housing).
ΔΔp1
Δp3 Δp4
Δp2
Fig. 2 e Subsystem power output and pressure drop vs. ncro on different heat exchangers.
i n t e rn a t i o n a l j o u rn a l o f h y d r o g e n en e r g y x x x ( 2 0 1 4 ) 1e9 3
Please cite this article in press as: Gao X, et al., Optimization of a thermoelectric generator subsystem for high temperature PEMfuel cell exhaust heat recovery, International Journal of Hydrogen Energy (2014), http://dx.doi.org/10.1016/j.ijhydene.2014.01.193

and the worst reliability [16]. On the contrary, during deter-
mining the candidate ncro, all TEG segments were kept work-
ing in standalone mode, i.e., each TEG segment is assumed
connected with an external resistance equivalent to its in-
ternal. Under this condition, every TEG segment together with
the subsystem has its maximum power output. It is a
reasonable simplification in these calculations since it can
avoid this electrical connection effect from interfering with
deciding the candidate ncro. However, the standalone mode is
obviously lack of feasibility in practice. With the progress of
power conditioning techniques [17e19], it is apparently more
practical to divide all the TEG modules into branches. This
electrical connection style affects the system design and
performance.
2.2. Electrical power output enhancement
The demand of power conditioning for TEGs is based on two
simple facts: 1) their maximum power point drifts signifi-
cantly with their working temperature, as concluded by the
sensitivity analysis in Refs. [8]; 2) series connection of all the
TEGmodules has theworst performance and reliability [16], as
mentioned above. To alleviate these two issues, all the TEG
modules of the subsystem will be electrically divided into
branches. Since it is assumed that the subsystem perfor-
mance in the direction perpendicular to the exhaust gas flow
is identical [8], the TEG assembly will only evenly fall into
branches along the flow in the following study. Inside each
branch, all modules are electrically in series. Each branch is
connected with a dedicated power conditioning circuit, i.e.,
branches work standalone, electrically independent from
each other. The total number of branches nb affects the sub-
system performances. Analysis is carried out as follows.
Fig. 5 illustrates the effects of nb with nrun on the subsystem
power output on the 4th heat exchanger. Under every nb, the
subsystem power output overlaps and ascends fast initially,
reaches the peaks and then starts to drop gradually. With
larger nb, the dropping trend becomes dimmer, i.e., the power
output is less sensitive to nrun. The two curves of the stand-
alone mode and the serial mode give the upper and lower
bounds of the power output. It is notable from Fig. 5 that nbstimulates the subsystem power output significantly. How-
ever, when there are more branches this effect becomes less
significant. This phenomenon is illustrated quantitatively in
Fig. 3 e Normalized subsystem power output by the peak
value of each heat exchanger.
ΔΔp1Δp1Δp1
Δp3Δp3Δp3
Δp4Δp4Δp4
Δp2Δp2Δp2
Fig. 4 e Subsystem power output and pressure drop vs. both ncro and nrun.
i n t e r n a t i o n a l j o u r n a l o f h y d r o g e n en e r g y x x x ( 2 0 1 4 ) 1e94
Please cite this article in press as: Gao X, et al., Optimization of a thermoelectric generator subsystem for high temperature PEMfuel cell exhaust heat recovery, International Journal of Hydrogen Energy (2014), http://dx.doi.org/10.1016/j.ijhydene.2014.01.193

Table 4 by the normalized power output. As nb changing from
1 to 2, the power output increases by 8.4%. Then the increment
drops to 2.8% and 1.4%.
It can also be noticed that nb encourages a larger nrun from
Table 4 and Fig. 5. Balanced between the subsystem power
output and pressure drop, the 3-branch combination is chosen
as the final optimal configuration of the subsystem for the on-
design working condition. Compared to the in-series config-
uration, this configuration can boost the subsystem power
output by 12.9%. The improvement is then up to 40.6% over
the optimized configuration in the previous work [8]! Still, the
subsystem pressure drop is now 7.8% less.
3. Off-design performance optimization
In this section, the performances of the four configurations in
Table 3 and the final on-design optimal configuration are
assessed under off-design working conditions. “Off-design”
means the fuel cell stack working mode changes in the whole
operational range, off the abovementioned “on-design”
nominal spot. According to [12,13,20], the operational current
density range of the stack in this study is from 0 A/cm2 to1 A/
cm2. To avoid fast degradation of the stack [21], the exhaust
gas temperature is chosen as the control parameter and kept
at 155 �C invariant in this study.
3.1. Assessment of the subsystem configurations
Fig. 6 shows the off-design performances of the four config-
urations in Table 3. Limited by the Reynolds-number oper-
ating interval of each heat exchanger [11], subsystem
performance data are only available as presented in the
figures. Outside of these intervals, compact heat exchangers
will lose their advantages because their performances are no
better than ordinary smooth-passage heat exchangers [11]. It
can be seen that curves in Fig. 6 have similar trends as in Ref.
[8]. Among them, the 4th configuration has the highest sub-
system power output and lowest pressure drop on the whole
range. It has higher performance and a wider operating in-
terval. In other words, the 4th heat exchanger is still the ideal
choice for the off-design operations. In the above study, all TE
segments work in standalone mode.
3.2. The final optimal configuration
The effect of power conditioning on the final on-design
optimal configuration, the 4th combination in Table 3, under
off-design operating conditions is illustrated below.
It is clearly illustrated in Fig. 7 the benefits of power condi-
tioning for off-design operations. In the worst case, the final
subsystem in the serial mode (nb ¼ 1) can only produce
approximately 60% power as in the standalone mode. Under
the same working condition, electrically dividing all the mod-
ules into three branches (nb¼ 3) can improve the power output
to about 80%. It is then nearly 90%when nb ¼ 4, which is about
30% higher than the serial mode! Since the fuel cell system
mostlyworking in the second half operational range, balanced
between the performance and system complexity nb¼ 3 is still
the preferable final choice. In this half range, dividing into
three branches can guarantee no less than 96% power output.
On the contrary, in the whole range the subsystem power
output under the serial mode is typically less than 85%.
Furthermore, it can also be noticed in Fig. 7 that the
normalized power output curve of the serial mode is slightly
different from the others. It has milder power output drop at
the low current density end. This is questionable since the
curves are from the same subsystem configuration except
only with nb changed from 1 to 4. They should have similar
trends. Checking the exhaust gas temperature distribution
under two current densities i ¼ 0.25 A/cm2 and 0.67 A/cm2 as
shown in Fig. 8, it can be noticed that the downstream mod-
ules almost have no temperature difference on them under
0.25 A/cm2. Large non-uniform temperature distribution be-
tweenmodules happens in the current subsystem. Electrically
in series with the large non-uniformity, the downstream
modules become under-temperature. It is the condition these
TE modules working at much lower temperature differences
regarding their output electric current. Since TEGs and ther-
moelectric coolers (TECs) are inherently twinborn working
modes of a single TE module, these under-temperature
modules probably have already shifted to the TEC mode.
Then they act similarly as the TEC modules in the directly
Table 3 e The final optimal subsystem configurations.
Indexa ncro nrun Power output [W] Pressure drop [Pa]
1 4 11 22.12 545.95
2 6 7 23.83 337.43
3 6 7 25.27 520.72
4 4 8 30.01 238.17
a Corresponding to Table 2.
Fig. 5 e Effects of nb with nrun on the 4th heat exchanger.
i n t e rn a t i o n a l j o u rn a l o f h y d r o g e n en e r g y x x x ( 2 0 1 4 ) 1e9 5
Please cite this article in press as: Gao X, et al., Optimization of a thermoelectric generator subsystem for high temperature PEMfuel cell exhaust heat recovery, International Journal of Hydrogen Energy (2014), http://dx.doi.org/10.1016/j.ijhydene.2014.01.193

coupled TEGeTEC systems in Refs. [22,23]. Instead of gener-
ating electricity, thesemodules are actuallywasting it. Besides
this TEC power dissipation, the internal ohmic resistances of
these under-temperature modules can be counted as line loss
and jointly reduce the system net power output. Without
considering this shift possibility, the current subsystem
model seems having overestimated the power output at the
low current density end. Thanks to introducing power con-
ditioning, this deviation is mitigated temporally.
The above possible TEGeTEC shift was rarely considered in
TEG system-levelmodeling in literature. It seems TECworking
mode should also be included in modeling a TEG system,
especially when under-temperature phenomenon happens.
This TEG-TEC shift also raises another necessity of power
conditioning for TEG systems.
Fromall the above analyses, the final optimal configuration
of the subsystem on its whole working range can be finally
concluded. As shown in the following Fig. 9, there are 2 blocks,
each with 2 rows of 12 TEG modules in the subsystem. As a
total, there are 48 modules. They together decide the size of
the subsystem including the heat exchanger housing. The
type of the installed heat exchanger is ‘Pin-fin plate-fin, sur-
face PF-4(F)’. Its detailed geometry is given in Fig. 10. TEG
module type is Melcor HT8 [8]. All the modules are electrically
divided in 3 branches along the exhaust gas flow, as illustrated
in different colors in the figure.
4. Contribution of TE heat recovery to thefuel cell system
On the final optimized TEG subsystem, the contribution of the
TE heat recovery to the current 1 kW fuel cell power system is
assessed.
Assume that there is no power loss during power condi-
tioning, Fig. 11 shows the benefits of TE heat recovery to the
fuel cell system. It raises the system power output, i.e., the
system voltage or electric current is higher. From the
normalized system power output, it can be seen the gain is
around 3.5%. It should be mentioned that the figure of merit
(ZT) of the TEG modules being used is fairly low. It is only
around 0.50 [8,24]. Commonly, it can reach up to 0.8 to 1.1 in
practice by tuning the carrier concentration of the module’s
materials or changing them [25]. However, it is widely agreed
in the research community that for TEGs to be economically
viable inmost applications, ZTmust have values of 2 or higher
[26]. Refer to the achievements in the lab as shown in Refs.
[27], this seems soon achievable.
Substitute ZT ¼ 2 into the above calculation, the contri-
bution of the TE heat recovery can be expected as Fig. 12. Now
around 10% gain in the power output of the 1 kW fuel cell
system is realized. This is extra 90.20 W power under its
nominal operating condition, which is approximately 3 times
as the condition ZT¼ 0.50. It is already able to be easily used to
drive the auxiliaries, charge batteries, assist the system
startup/shutdown processes, etc. For further system level
study, the equations of the normalized power output (NPo) to
the fuel cell stack operating current density (i) are given below.
The unit of i is A/cm2.
NPo ¼�1:010þ 0:045$i� 0:011$i2; ZT ¼ 0:501:032þ 0:104$i� 0:020$i2; ZT ¼ 2:0
(1)
5. Conclusions
The configuration of the TEG exhaust heat recovery subsys-
tem is further optimized. There are 4 x 12 TEG modules in the
Table 4 e Effects of nb with nrun to the subsystem power output.
Connection Stylea nba nrun
a PTE,out [W] Normalized PTE,outb Pressure drop [Pa]
In series (1 branch) 4 8 30.01 0.87 238.17
2 branches 4 11 32.91 0.95 324.30
3 branches 4 12 33.88 0.98 353.24
4 branches 4 14 34.36 0.99 411.50
a The optimal subsystem configuration.b Normalized by the standalone style.
ΔΔp1Δp2Δp3Δp4
Fig. 6 e The off-design performances of the 4 configurations in Table 3.
i n t e r n a t i o n a l j o u r n a l o f h y d r o g e n en e r g y x x x ( 2 0 1 4 ) 1e96
Please cite this article in press as: Gao X, et al., Optimization of a thermoelectric generator subsystem for high temperature PEMfuel cell exhaust heat recovery, International Journal of Hydrogen Energy (2014), http://dx.doi.org/10.1016/j.ijhydene.2014.01.193

subsystem. Module type is Melcor HT8. All the TEG modules
are electrically divided into 3 branches along the exhaust gas
flow. The heat exchanger ‘Pin-fin plate-fin, surface PF-4(F)’ is
installed. This subsystem configuration is the optimal choice
for both on-design and off-design operating conditions. The
procedures of optimizing the TE exhaust heat recovery sub-
system are also clearly presented.
The electrical connection style of the TEG assembly is
analyzed. It affects the subsystem in various aspects: the
optimal size, the reliability and the performance, both on-
design and especially off-design. In the end, balanced be-
tween the subsystem performance and complexity, 3-branch
scenario is chosen. This increases the subsystem power
output by 12.9%.
Δp
Fig. 7 e The off-design performances of the final optimal configuration.
Fig. 8 e Exhaust gas temperature distribution under two different current densities.
Fig. 9 e The final optimal architecture of the TEG subsystem.
i n t e rn a t i o n a l j o u rn a l o f h y d r o g e n en e r g y x x x ( 2 0 1 4 ) 1e9 7
Please cite this article in press as: Gao X, et al., Optimization of a thermoelectric generator subsystem for high temperature PEMfuel cell exhaust heat recovery, International Journal of Hydrogen Energy (2014), http://dx.doi.org/10.1016/j.ijhydene.2014.01.193
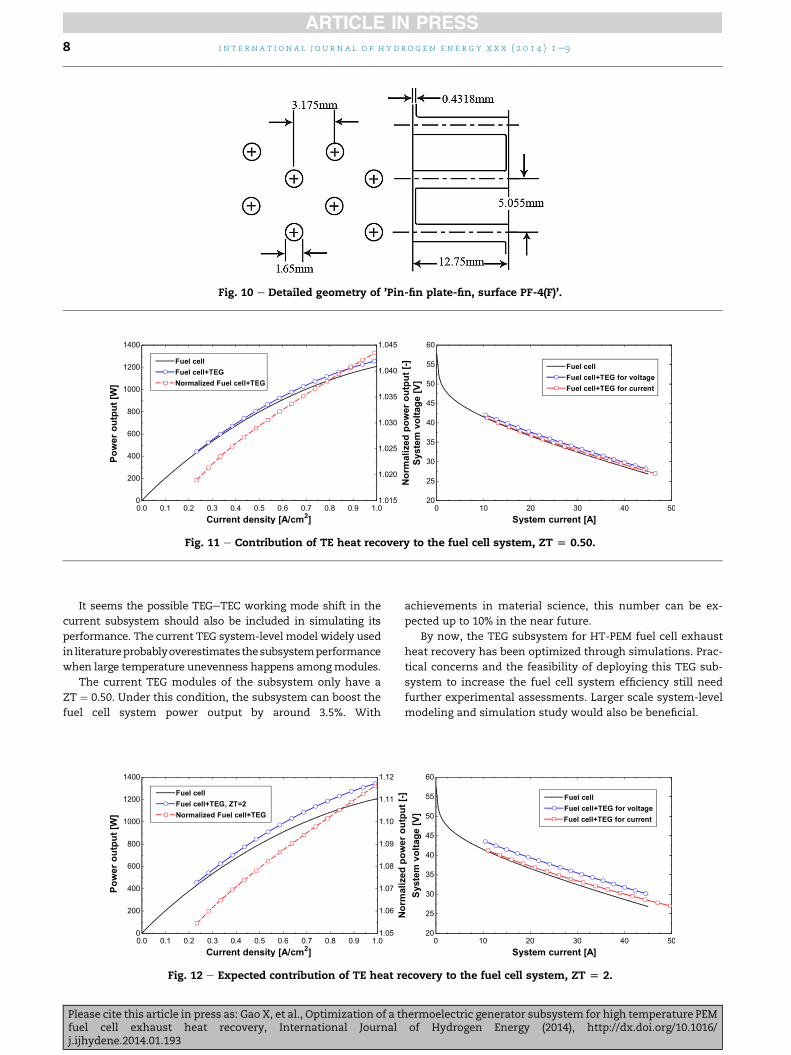
It seems the possible TEGeTEC working mode shift in the
current subsystem should also be included in simulating its
performance. The current TEG system-level model widely used
inliteratureprobablyoverestimatesthesubsystemperformance
when large temperature unevenness happens amongmodules.
The current TEG modules of the subsystem only have a
ZT ¼ 0.50. Under this condition, the subsystem can boost the
fuel cell system power output by around 3.5%. With
achievements in material science, this number can be ex-
pected up to 10% in the near future.
By now, the TEG subsystem for HT-PEM fuel cell exhaust
heat recovery has been optimized through simulations. Prac-
tical concerns and the feasibility of deploying this TEG sub-
system to increase the fuel cell system efficiency still need
further experimental assessments. Larger scale system-level
modeling and simulation study would also be beneficial.
Fig. 10 e Detailed geometry of ’Pin-fin plate-fin, surface PF-4(F)’.
Fig. 11 e Contribution of TE heat recovery to the fuel cell system, ZT [ 0.50.
Fig. 12 e Expected contribution of TE heat recovery to the fuel cell system, ZT [ 2.
i n t e r n a t i o n a l j o u r n a l o f h y d r o g e n en e r g y x x x ( 2 0 1 4 ) 1e98
Please cite this article in press as: Gao X, et al., Optimization of a thermoelectric generator subsystem for high temperature PEMfuel cell exhaust heat recovery, International Journal of Hydrogen Energy (2014), http://dx.doi.org/10.1016/j.ijhydene.2014.01.193

Acknowledgments
The authors gratefully acknowledge financial support from
Aalborg University and China Scholarship Council.
r e f e r e n c e s
[1] Cheddie Denver, Munroe Norman. Review and comparisonof approaches to proton exchange membrane fuel cellmodeling. J Power Sources 2005;147:72e84.
[2] Crabtree George W, Dresselhaus Mildred S,Buchanan Michelle V. The hydrogen economy. Phys Today2004;57(12):39. http://dx.doi.org/10.1063/1.1878333.
[3] Quartarone Eliana, Mustarelli Piercarlo. Polymer fuel cellsbased on polybenzimidazole/H3PO4. Energy Environ Sci2012;5:6436e44.
[4] Andreasen Søren Juhl, Ashworth Leanne, Menjon Remon IanNatanael, Rasmussen Peder Lund, Nielsen Mads Pagh.Modeling and implementation of a 1 kW, air cooled HTPEMfuel cell in a hybrid electrical vehicle. ECS Trans2008;12(1):639e50.
[5] Arsalis Alexandros, Nielsen Mads P, Kær Søren K.Application of an improved operational strategy on a PBI fuelcell-based residential system for Danish single-familyhouseholds. Appl Therm Eng 2013;50(1):704e13.
[6] Advantages of HTPEM fuel cells over LTPEM fuel cells. http://www.serenergy.com/htpem_technology.htm.
[7] Andreasen Søren Juhl, Vang Jakob Rabjerg, Kær SørenKnudsen. High temperature PEM fuel cell performancecharacterisation with CO and CO2 using electrochemicalimpedance spectroscopy. Int J Hydrogen Energy2011;36:9815e30.
[8] Gao Xin, Andreasen Søren Juhl, Chen Min, Kær SørenKnudsen. Numerical model of a thermoelectric generatorwith compact plate-fin heat exchanger for high temperaturePEM fuel cell exhaust heat recovery. Int J Hydrogen Energy2012;37:8490e8.
[9] Gao Xin, Chen Min, Snyder G Jeffrey, Andreasen Søren Juhl,Kær Søren Knudsen. Thermal management optimization of athermoelectric-integrated methanol evaporator using acompact CFD modeling approach. J Electron Mater2013;42(7):2035e42.
[10] Gao Xin, Chen Min, Andreasen Søren Juhl, Kær SørenKnudsen. Potential usage of thermoelectric devices in a high-temperature polymer electrolyte membrane (PEM) fuel cellsystem: two case studies. J Electron Mater2012;41(6):1838e44.
[11] Kays WM, London AL. Compact heat exchangers. 3rd ed.New York: McGraw Hill; 1984.
[12] Andreasen Søren Juhl, Ashworth Leanne, Menjon Remon IanNatanael, Kær Søren Knudsen. Directly connected series
coupled HTPEM fuel cell stacks to a Li-ion battery DC-bus fora fuel cell electrical vehicle. Int J Hydrogen Energy2008;33(23):7137e45.
[13] Serenus 166/390 AirC Datasheet. http://www.serenergy.com/Downloads.htm [accessed: 22.10.12].
[14] Suzuki RO, Tanaka D. Mathematical simulation ofthermoelectric power generation with the multi-panels. JPower Sources 2003;122(2):201e9.
[15] Suzuki RO, Tanaka D. Mathematic simulation onthermoelectric power generation with cylindricalmultitubes. J Power Sources 2003;124(1):293e8.
[16] Mori M, Yamagami T, Oda N, Hattori M, Sorazawa M,Haraguchi T. Current possibilities of thermoelectrictechnology relative to fuel economy. Society of AutomotiveEngineering; 2009. 2009-2101-0170.
[17] Yu Chuang, Chau KT. Thermoelectric automotive waste heatenergy recovery using maximum power point tracking.Energy Convers Manag 2009;50:1506e12.
[18] Jong-Pil Im, Se-WonWang, Seung-Tak Ryu, Gyu-Hyeong Cho.A 40 mV transformer-reuse self-startup boost converter withMPPTcontrol for thermoelectric energy harvesting. IEEEJournal of Solid-State Circuits 2012;47(12):3055e67.
[19] Chatzidakis Panagiotis G, Christidis Georgios C,Tatakis Emmanuel C. Comparative study of MPPT algorithmsfor thermoelectric generators. In: 2013 15th Europeanconference on power electronics and applications (EPE; 2013.http://dx.doi.org/10.1109/EPE.2013.6634607.
[20] Korsgaard Anders R, Refshauge Rasmus, Nielsen Mads P,Bang Mads, Kær Søren K. Experimental characterization andmodeling of commercial polybenzimidazole-based MEAperformance. J Power Sources 2006;162:239e45.
[21] Arsalis Alexandros, Nielsen Mads P, Kær Søren K. Modelingand off-design performance of a 1 kWe HT-PEMFC (hightemperature-proton exchange membrane fuel cell)-basedresidential micro-CHP (combined-heat-and-power) systemfor Danish single-family households. Energy2011;36:993e1002.
[22] Khattab NM, El Shenawy ET. Optimal operation ofthermoelectric cooler driven by solar thermoelectricgenerator. Energy Convers Manag 2006;47:407e26.
[23] Meng Fankai, Chen Lingen, Sun Fengrui. Performanceanalysis for two-stage TEC system driven by two-stage TEGobeying Newton’s heat transfer law. Math Comput Model2010;52:586e95.
[24] Smith KD. An investigation into the viability of heat sourcesfor thermoelectric power generation systems. Master thesis.Rochester (NY): Rochester Institute of technology; 2009.
[25] Snyder G Jeffrey, Toberer Eric S. Complex thermoelectricmaterials. Nat Mater 2008;7:105e14.
[26] Yang J, Stabler FR. Automotive applications of thermoelectricmaterials. J Electron Mater 2009;38(7):1245e51.
[27] Jovanovich V, Ghmaty S. Design, fabrication and testing ofenergy harvesting thermoelectric generator. In: Proc of SPIE,vol. 6173; 2006. pp. 1e8.
i n t e rn a t i o n a l j o u rn a l o f h y d r o g e n en e r g y x x x ( 2 0 1 4 ) 1e9 9
Please cite this article in press as: Gao X, et al., Optimization of a thermoelectric generator subsystem for high temperature PEMfuel cell exhaust heat recovery, International Journal of Hydrogen Energy (2014), http://dx.doi.org/10.1016/j.ijhydene.2014.01.193

121
Paper 4
Heat Exchanger Selection and Optimization of a Thermoelectric Generator
Subsystem for HT-PEM Fuel Cell Exhaust Heat Recovery
Gao, Xin; Andreasen, Søren Juhl; Kær, Søren Knudsen; Rosendahl, Lasse
Aistrup; Kolaei, Alireza Rezania
Under review by International Conference on Thermoelectrics, July 2014.


Heat exchanger selection and optimization of a thermoelectric generator subsystem
for HT‐PEM fuel cell exhaust heat recovery
Xin Gao1,2, Søren Juhl Andreasen1, Søren Knudsen Kær1, Lasse Aistrup Rosendahl1, Alireza Rezania Kolaei1
1‐ Department of Energy Technology, Aalborg University, Pontoppidanstraede 101, Aalborg, DK‐9220, Denmark
Abstract: A thermoelectric generator (TEG) subsystem is introduced to recover the exhaust heat from
a high temperature polymer electrolyte membrane (HT‐PEM) fuel cell stack. In optimizing the
subsystem performance, three key factors have been identified: heat exchanger surface type, its
housing dimensions and TEG power conditioning. Previous studies also reveal that their effects are
interlocked. However, the three factors were occasionally considered in sequence in previous studies.
This work reappraises the published heat exchanger selection and subsystem optimization approach.
The three factors are now combined and assessed simultaneously and globally. For each surface type,
its housing dimensions are optimized accordingly. Besides, TEG power conditioning is also adjusted in
detail. Moreover, the previous 900Pa pressure‐drop criterion is removed herein with the purpose to
have a more comprehensive heat exchanger selection and a more thorough understanding of the
interplay between the subsystem and the stack. In the current study, the selection is extended to a
prepared whole heat exchanger collection including the precluded surfaces previously. Finally, the
selection and optimization approach is refined and documented. The on‐ and off‐ design performance
of the subsystem is thoroughly optimized. The current work complements and also proves the validity
of the already published approach.
Keywords: fuel cell; TEG; heat recovery; heat exchanger; selection; power conditioning; optimization
1. Introduction
Thermoelectric generators (TEGs) have large advantages in low quality heat recovery among other
techniques [1]. To recover the exhaust heat for power and further boost the efficiency of a high
temperature polymer electrolyte membrane (HT‐PEM) fuel cell power system, a thermoelectric

exhaust heat recovery subsystem has already been designed, modeled and optimized in previous
studies [2,3,4,5].
Initially in [2], the potential contribution of TEG heat recovery to the HT‐PEM fuel cell power system
was preliminarily assessed. The design of the TEG subsystem was schemed and explained. Then in [3],
a finite‐element model of the subsystem was developed and presented. It is a model aiming to
answer both design and operation requests, in turn to benefit the subsystem fabrication. A library of
types of compact heat exchangers, therefore, is also integrated in the model. It includes 59 types of
plate‐fin heat exchanger surfaces, of which the performance data are highly trustworthy from
experiments [6]. The model was then solved by a discretized ɛ‐NTU method. In this way, the accuracy
and flexibility of the subsystem model can both be assured. Equations are listed in Table 1.
Table 1 ‐ Main equations [2,3].
Description Equations
TEG properties , , ,, , ,
, , , ,, , y TE y TE y TEx TE x TE x TEn n nn n n
i TE e i TE e t i TE tR R R R
TEG power output , , ,0.5( )( ( ) ( )) /i i h TE c TE e iI T i T i R
2, , ,( ) ( ) ( ) , ( )
yxnn
i i h TE c TE i e i TEAw i I T i T i I R P w i
Heat transfer , , , 1( ) ( )h TE gas gas gas i gas iq i q i m h h
, ,( ) ( ) cwgas ctf gas gas i gas iq i i m h h
, ,( ) ( )( ( ) ( )), ( ) ( ( ) ( 1)) 2h TE hx gas h TE gas gas gasq i UA i T i T i T i T i T i
1
( ) 1- (1- ( )), ( ) tanh( ) /
2 (2 ( ) / ( ))
Afin fin fin fin i i
i hx thk
i A n i n i ml ml
ml b sqrt h i k fin
Pressure drop 2 2, , , ,( (2 ))[4 1 1 ]
gashx gas in hx hx gas in h gas gas in gas outp u f L D
Pumping power [7] lncomp gas gas in out in gas compP m R T p p M
By the model, 4 heat exchanger surfaces were identified of promising performances under fixed heat
exchanger housing dimensions, which are directly decided by the subsystem size. Later on in [4],
studies were carried out on the 4 surfaces. The superior one was pinpointed. Accordingly, the optimal
subsystem size was figured out, which is mainly determined by the number of TEG modules crossing

the exhaust gas flow ( cron ) and the number of modules along the gas flow ( runn ). Afterwards, TEG
power conditioning was optimized to both on‐design and off‐design working conditions. Generally
speaking, TEG power conditioning for maximum subsystem power output includes 3 scenarios: 1)
Standalone mode: all TEG segments (fragments of the TEG modules in the finite‐element model [3,4])
in the subsystem electrically stay in their dedicated circuits; 2) In‐series mode: all TEG segments are
electrically in‐series; and 3) Maximum power point tracking technique (MPPT) mode: all TEG modules
are evenly divided into several electrical branches and there is an ideal MPPT unit per each branch.
Also, in this paper, the approach of choosing the heat exchanger type and optimizing the subsystem
was formed. In brief, it has three tasks: I) selecting heat exchanger surface, II) determining subsystem
size and III) power conditioning. In detail, there are the following 6 steps [3,4]:
1) Preliminary selection: pick out the promising heat exchanger surfaces among all the surfaces in the
prepared heat exchanger library. These surfaces should guarantee higher subsystem power output
and lower pressure drop than the rest. They are assessed under a fixed pre‐optimized subsystem
size. The criterion is that their subsystem pressure drop cannot exceed 900Pa. All TEG segments
are in standalone mode.
2) Identify an adequate runn for all the promising surfaces; all TEG segments are in standalone mode
in this step.
3) Figure out all the feasible candidates of cron for each surface, under the adequate runn ; all TEG
segments are still in standalone mode.
4) Choose the optimum cron for each surface under the adequate runn when all TEG segments are in
standalone mode, and then the corresponding optimum runn while all TEG segments are in‐series.
5) Identify the superior heat exchanger surface, with which the subsystem has the highest power
output and low pressure drop. The optimized subsystem size is also identified.
6) Power conditioning: all the TEG modules are set to work in MPPT mode. The MPPT mode is tuned
in detail. The optimum runn is further fine‐tuned in this step.
In this work, the above steps are rearranged. Preliminary selection is cancelled. TEG power
conditioning is reconsidered from the beginning of the entire heat exchanger selection and subsystem

optimization process. Additionally, the 900Pa criterion is removed and all the available plate‐fin heat
exchanger surfaces in the library are evaluated. The three key factors, heat exchanger surface type, its
housing dimensions and TEG power conditioning, are now freely combined. All the combinations are
assessed on the subsystem power output and pressure drop. Finally, the superior surface in the whole
library is found out. The corresponding subsystem configuration is optimized, thermally and
electrically. In the end, the approach of designing and optimizing the TEG subsystem is updated and
summarized.
2. Heat exchanger surface selection
The previous studies have emphasized the importance of heat exchanger surface selection. To assess
the performances of each plate‐fin surface, subsystem size should be specified beforehand, which is
determined by cron and runn . Then during the performance assessment, the subsystem size would be
either kept invariant as the way identifying the four promising heat exchanger surfaces in [3,4] which
saves the computational cost, or adjusted correspondingly which is of better theoretical integrity but
is much more time‐consuming. In this work, the latter method is used. Another factor re‐examined in
this study is the feasible ranges of cron and runn . Previously, there were no limits on them. However,
in practice the subsystem size is not recommended to exceed the fuel cell stack size, which is
approximately 178 mm x 159 mm x 523 mm [8]. Confined by this, cron can only be chosen among 2, 4,
6, and 8; runn is only available from 1 to 13. runn is further restrained in the range from 5 to 13
regarding its practical meaning. To pinpoint the heat exchanger surface with superior performances,
the whole library is then screened under all possible combinations of feasible cron and runn values.
Results are presented as follows.

Fig. 1 – Peak performances of all applicable heat exchanger surfaces in the whole library, 13runn .
Calculations on 13runn are taken as illustration. For each surface type, there is an efficient Reynolds‐
number interval [6]. Ruled out by this, there are 206 combinations left calculable. Among them, for
each surface only the combination with peak subsystem power output is kept. As a total, there are 52
combinations corresponding to 52 surfaces left to assess. The subsystem power output and pressure
drop for each combination are plotted in Fig. 1.
Data in Fig. 1 are sorted ascendingly by the subsystem power output. It can be seen the curves are
similar as in [3]. With the power output increasing gradually, the pressure drop fluctuates significantly
between heat exchanger surfaces. The largest difference is as high as 15610.9Pa! In principle, higher
pressure drop consumes more pumping power and they are proportional [7]. Moreover, in this case a
larger pressure drop from the TEG subsystem causes a higher back pressure of the fuel cell stack,
which has been proved of no observable profit to the stack performance [9]. So the superior heat
exchanger surface in the whole library must hold the highest subsystem power output and lowest
pressure drop. It is 'Pin‐fin plate‐fin, surface PF‐4(F)', No. 52 in Fig. 1. Details of it are given in Fig. 2
and [6]. The above conclusion is also corroborated by all the other runn values in its range.
By now, the aforementioned task I has been improved and conducted. It is heat exchanger surface
selection under correspondingly optimized TEG subsystem size. Throughout, all the TEG segments in
0 5 10 15 20 25 30 35 40 45 505
10
15
20
25
30
35
0
2000
4000
6000
8000
10000
12000
14000
16000
Index of heat exchanger type [-]
Po
wer
ou
tpu
t [W
]PTE,maxPTE,max
Pre
ssu
re d
rop
[P
a]
phxphx

the subsystem are electrically in standalone mode. This mode indicates the ideal maximum subsystem
power output, although it is lack of feasibility in practice.
Fig. 2 ‐ Detailed geometry of 'Pin‐fin plate‐fin, surface PF‐4(F)' [6].
3. Optimal subsystem size and power conditioning
This section covers the above‐mentioned task II and task III. It has already been proved in [4] that
power conditioning affects the optimal subsystem size; they are interwoven with each other. In this
section, the effects of power conditioning are combined and discussed throughout the optimization
process, instead of solely discussed afterwards as in [4]. In the following calculations, cron is further
confined among 4, 6, and 8, to avoid the possible whistle issues of 'Pin‐fin plate‐fin, surface PF‐4(F)'
when 2cron [4,6]. runn is still constantly available from 5 to 13.

Fig. 3 ‐ Subsystem performances under all possible subsystem sizes with all TEG segments in
standalone mode.
Fig. 4 ‐ Subsystem performances with all TEG modules in 4 branches.
0 4 8 12 16 20 24 2828
29
30
31
32
33
34
35
40
80
120
160
200
240
280
320
360
400
440
Index of combinations [-]
Po
wer
ou
pu
t [W
]
Pre
ssu
re d
rop
[P
a]
PTE,maxPTE,max
PTE,maxPTE,max
PTE,maxPTE,max
phx, ncro=4phx, ncro=4
phx, ncro=6phx, ncro=6
phx, ncro=8phx, ncro=8
0 4 8 12 16 20 24 2828
29
30
31
32
33
34
35
40
80
120
160
200
240
280
320
360
400
440
PTE,maxPTE,max
PTE,maxPTE,max
PTE,maxPTE,max
phx, ncro=4phx, ncro=4
phx, ncro=6phx, ncro=6
phx, ncro=8phx, ncro=8
Index of combinations [-]
Po
wer
ou
pu
t [W
]
Pre
ssu
re d
rop
[P
a]

Fig. 5 ‐ Subsystem performances with all TEG modules in 3 branches.
Fig. 6 ‐ Subsystem performances with all TEG modules in 2 branches.
0 4 8 12 16 20 24 2828
29
30
31
32
33
34
40
80
120
160
200
240
280
320
360
400
440
PTE,maxPTE,max
PTE,maxPTE,max
PTE,maxPTE,max
phx, ncro=4phx, ncro=4
phx, ncro=6phx, ncro=6
phx, ncro=8phx, ncro=8
Index of combinations [-]
Po
wer
ou
pu
t [W
]
Pre
ssu
re d
rop
[P
a]
0 4 8 12 16 20 24 2828
29
30
31
32
33
40
80
120
160
200
240
280
320
360
400
440
PP
PP
PP
phx, ncro=4phx, ncro=4
phx, ncro=6phx, ncro=6
phx, ncro=8phx, ncro=8
Index of combinations [-]
Po
wer
ou
pu
t [W
]
Pre
ssu
re d
rop
[P
a]
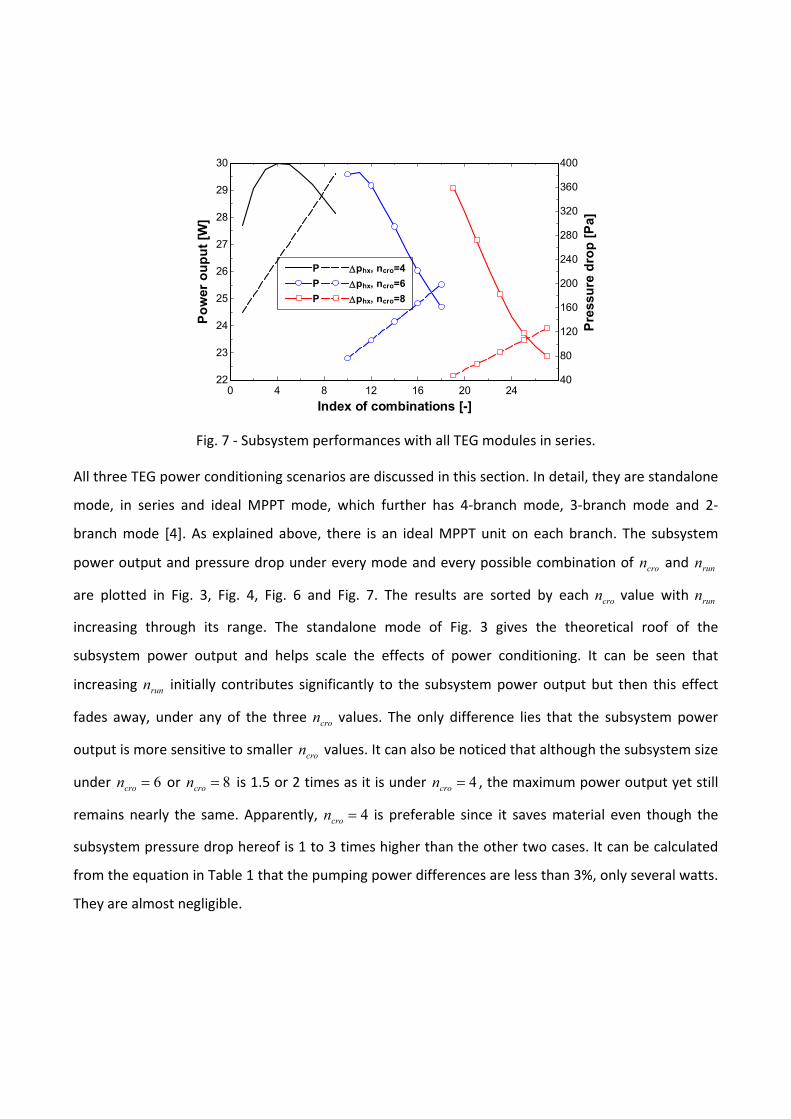
Fig. 7 ‐ Subsystem performances with all TEG modules in series.
All three TEG power conditioning scenarios are discussed in this section. In detail, they are standalone
mode, in series and ideal MPPT mode, which further has 4‐branch mode, 3‐branch mode and 2‐
branch mode [4]. As explained above, there is an ideal MPPT unit on each branch. The subsystem
power output and pressure drop under every mode and every possible combination of cron and runn
are plotted in Fig. 3, Fig. 4, Fig. 6 and Fig. 7. The results are sorted by each cron value with runn
increasing through its range. The standalone mode of Fig. 3 gives the theoretical roof of the
subsystem power output and helps scale the effects of power conditioning. It can be seen that
increasing runn initially contributes significantly to the subsystem power output but then this effect
fades away, under any of the three cron values. The only difference lies that the subsystem power
output is more sensitive to smaller cron values. It can also be noticed that although the subsystem size
under 6cron or 8cron is 1.5 or 2 times as it is under 4cron , the maximum power output yet still
remains nearly the same. Apparently, 4cron is preferable since it saves material even though the
subsystem pressure drop hereof is 1 to 3 times higher than the other two cases. It can be calculated
from the equation in Table 1 that the pumping power differences are less than 3%, only several watts.
They are almost negligible.
0 4 8 12 16 20 2422
23
24
25
26
27
28
29
30
40
80
120
160
200
240
280
320
360
400
PP
PP
PP
phx, ncro=4phx, ncro=4
phx, ncro=6phx, ncro=6
phx, ncro=8phx, ncro=8
Index of combinations [-]
Po
wer
ou
pu
t [W
]
Pre
ssu
re d
rop
[P
a]
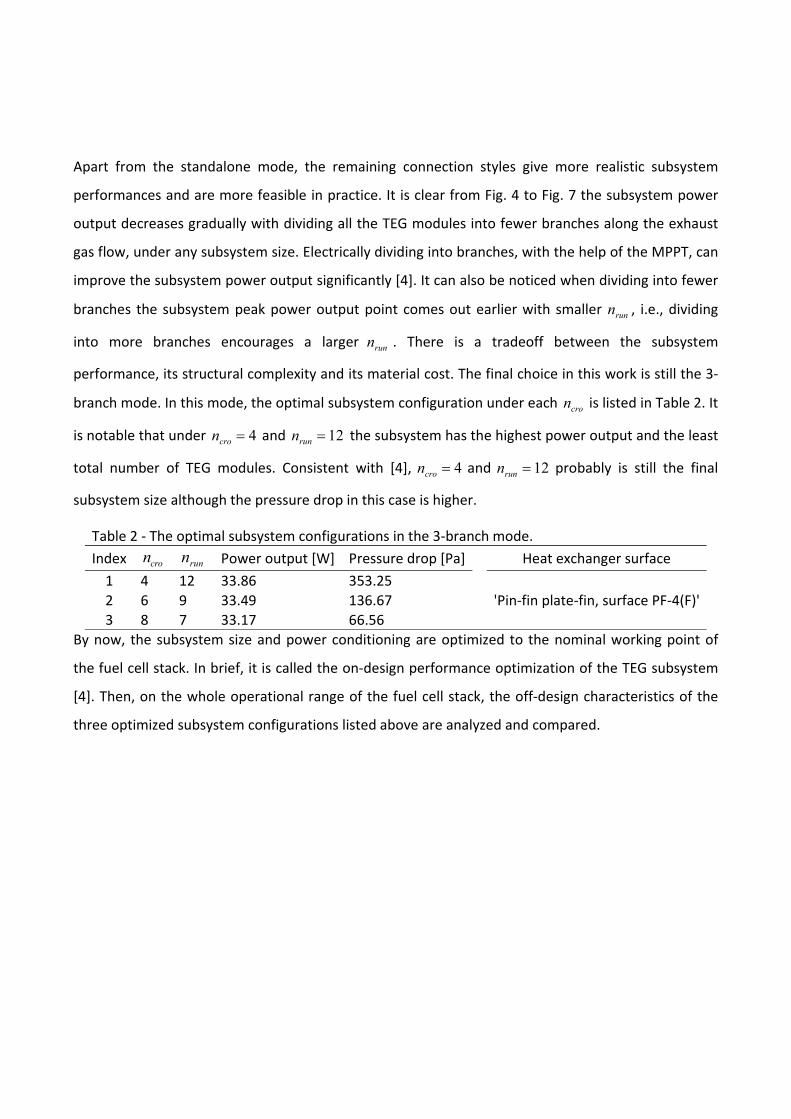
Apart from the standalone mode, the remaining connection styles give more realistic subsystem
performances and are more feasible in practice. It is clear from Fig. 4 to Fig. 7 the subsystem power
output decreases gradually with dividing all the TEG modules into fewer branches along the exhaust
gas flow, under any subsystem size. Electrically dividing into branches, with the help of the MPPT, can
improve the subsystem power output significantly [4]. It can also be noticed when dividing into fewer
branches the subsystem peak power output point comes out earlier with smaller runn , i.e., dividing
into more branches encourages a larger runn . There is a tradeoff between the subsystem
performance, its structural complexity and its material cost. The final choice in this work is still the 3‐
branch mode. In this mode, the optimal subsystem configuration under each cron is listed in Table 2. It
is notable that under 4cron and 12runn the subsystem has the highest power output and the least
total number of TEG modules. Consistent with [4], 4cron and 12runn probably is still the final
subsystem size although the pressure drop in this case is higher.
Table 2 ‐ The optimal subsystem configurations in the 3‐branch mode.
Index cron runn Power output [W] Pressure drop [Pa] Heat exchanger surface
1 4 12 33.86 353.25
'Pin‐fin plate‐fin, surface PF‐4(F)'2 6 9 33.49 136.67
3 8 7 33.17 66.56
By now, the subsystem size and power conditioning are optimized to the nominal working point of
the fuel cell stack. In brief, it is called the on‐design performance optimization of the TEG subsystem
[4]. Then, on the whole operational range of the fuel cell stack, the off‐design characteristics of the
three optimized subsystem configurations listed above are analyzed and compared.
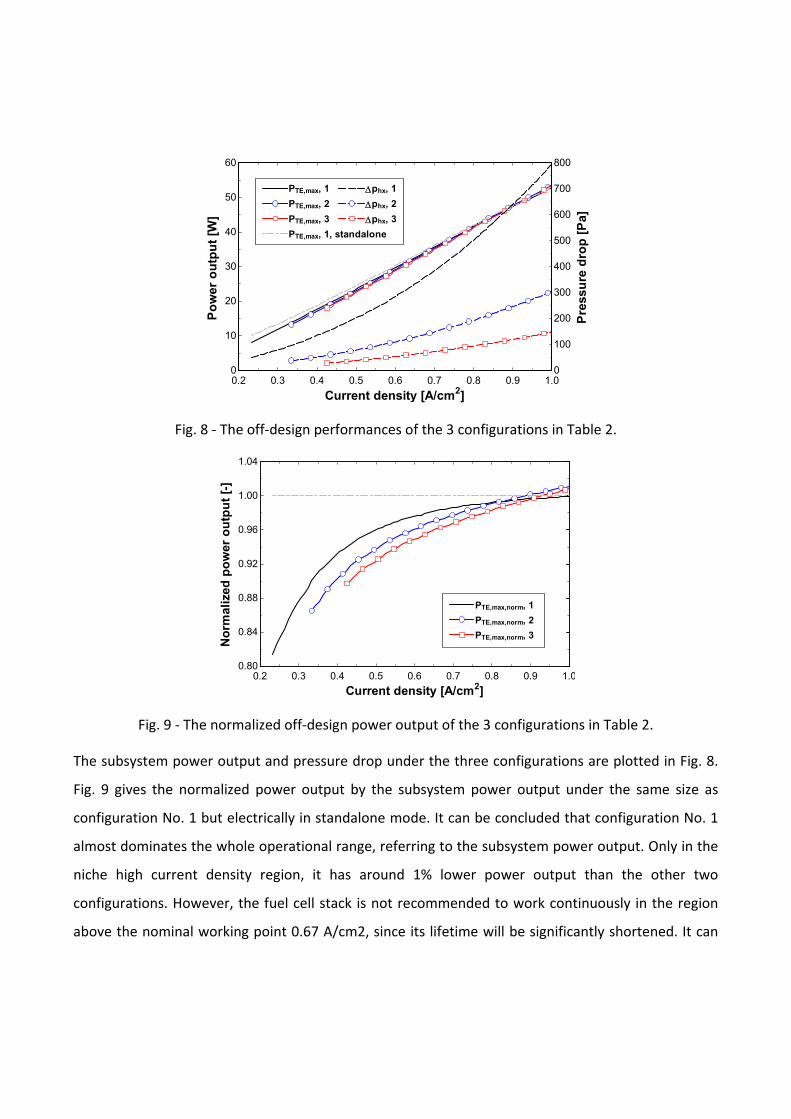
Fig. 8 ‐ The off‐design performances of the 3 configurations in Table 2.
Fig. 9 ‐ The normalized off‐design power output of the 3 configurations in Table 2.
The subsystem power output and pressure drop under the three configurations are plotted in Fig. 8.
Fig. 9 gives the normalized power output by the subsystem power output under the same size as
configuration No. 1 but electrically in standalone mode. It can be concluded that configuration No. 1
almost dominates the whole operational range, referring to the subsystem power output. Only in the
niche high current density region, it has around 1% lower power output than the other two
configurations. However, the fuel cell stack is not recommended to work continuously in the region
above the nominal working point 0.67 A/cm2, since its lifetime will be significantly shortened. It can
0.2 0.3 0.4 0.5 0.6 0.7 0.8 0.9 1.00
10
20
30
40
50
60
0
100
200
300
400
500
600
700
800
Current density [A/cm2]
Po
wer
ou
tpu
t [W
]
PTE,max, 1PTE,max, 1
PTE,max, 2PTE,max, 2
PTE,max, 3PTE,max, 3
PTE,max, 1, standalonePTE,max, 1, standalone
Pre
ssu
re d
rop
[P
a]
phx, 1phx, 1
phx, 2phx, 2
phx, 3phx, 3
0.2 0.3 0.4 0.5 0.6 0.7 0.8 0.9 1.00.80
0.84
0.88
0.92
0.96
1.00
1.04
Current density [A/cm2]
No
rmal
ized
po
wer
ou
tpu
t [-
]
PTE,max,norm, 1PTE,max,norm, 1
PTE,max,norm, 2PTE,max,norm, 2
PTE,max,norm, 3PTE,max,norm, 3

also be noticed that configuration No. 1 has a wider efficient Reynolds‐number range, which starts
from 0.23A/cm2, compared to 0.33 A/cm2 and 0.43 A/cm2 of the other two. In contrast, the
subsystem pressure drop under configuration No. 1 is much higher than the other two. However, the
differences are negligible for the same reason as analyzed above. In the end, it can be safely
concluded that configuration No. 1 is still the final optimal configuration of this TEG subsystem, on the
current whole compact heat exchanger library. The configuration is illustrated below in Fig. 10.
Fig. 10 ‐ The final optimal architecture of the TEG subsystem [4]. (1,5 ‐ Water jackets; 2,4 ‐ TEG
module assembly; 3 ‐ Compact heat exchanger housing; 6 ‐ Diffuser).
4. Conclusions
The superior heat exchanger surface for the TEG subsystem in the current entire compact plate‐fin
heat exchanger library is still 'Pin‐fin plate‐fin, surface PF‐4(F)', after the 900 Pa criterion is unsealed.
The optimal configuration of the TEG subsystem determined by the approach proposed in this work is
consistent with the previous studies. This work validates the already published approach and
complements the methodology of designing and optimizing a TEG subsystem.
From this work, another approach of selecting the right heat exchanger surface and optimizing the
TEG subsystem is as follows:
1) Heat exchanger selection under all possible combinations of cron and runn . All TEG segments are in
standalone mode.

2) Subsystem size and TEG power conditioning optimization: find out the optimum cron , runn and
power conditioning scenario, among all possible combinations of them.
5. Acknowledgements
The authors gratefully acknowledge financial support from Aalborg University and China Scholarship
Council. The authors would like to acknowledge the help from Vincenzo Liso.

References
[1] Rowe DM. Thermoelectric generators as alternative sources of low power. Renewable Energy
1994; 5(2):1470‐8.
[2] Xin Gao, Min Chen, Søren Juhl Andreasen, Søren Knudsen Kær. Potential Usage of Thermoelectric
Devices in a High‐Temperature Polymer Electrolyte Membrane (PEM) Fuel Cell System: Two Case
Studies. Journal of Electronic Materials 2012; 41(6): 1838‐1844.
[3] Xin Gao, Søren Juhl Andreasen, Min Chen, Søren Knudsen Kær. Numerical model of a
thermoelectric generator with compact plate‐fin heat exchanger for high temperature PEM fuel
cell exhaust heat recovery. International journal of Hydrogen Energy 2012; 37: 8490‐8498.
[4] Xin Gao, Søren Juhl Andreasen, Søren Knudsen Kær, Lasse Aistrup Rosendahl. Optimization of a
thermoelectric generator subsystem for high temperature PEM fuel cell exhaust heat recovery.
International Journal of Hydrogen Energy 2014. In press; DOI: 10.1016/j.ijhydene.2014.01.193.
[5] Xin Gao, Min Chen, G. Jeffrey Snyder, Søren Juhl Andreasen & Søren Knudsen Kær. Thermal
Management Optimization of a Thermoelectric‐Integrated Methanol Evaporator Using a Compact
CFD Modeling Approach. DOI: 10.1007/s11664‐013‐2514‐2.
[6] Kays WM, London AL. Compact heat exchangers. 3rd ed. New York: McGraw Hill; 1984.
[7] Kolb G. Fuel processing: for fuel cells. Weinheim, Germany: Wiley‐VCH; 2008.
[8] Serenus 166/390 AirC Datasheet. http://www.serenergy.com/Downloads.htm. [Accessed: 22‐Oct‐
2012].
[9] Alexandros Arsalis, Mads Pagh Nielsen, and Søren Knudsen Kær, Energy 36, 993 (2011).
137
Paper 5
Thermal Management Optimization of a Thermoelectric-Integrated Methanol
Evaporator Using a Compact CFD Modeling Approach
Gao, Xin; Chen, Min; Snyder, G. Jeffrey; Andreasen, Søren Juhl; Kær, Søren
Knudsen
Journal of Electronic Materials, 42(7), 2013, p. 2035-2042.
(Due to copyright, full manuscript is available upon request)