Embed Size (px)
Citation preview
Aalborg Universitet
On the use of A-weighted levels for prediction of loudness level
Møller, Henrik; Lydolf, Morten
Published in:Proceedings of the 8th International Meeting on Low Frequency Noise & Vibration, June 3-5, 1997,Gothenburg, Sweden
Publication date:1997
Link to publication from Aalborg University
Citation for published version (APA):Møller, H., & Lydolf, M. (1997). On the use of A-weighted levels for prediction of loudness level. In Proceedingsof the 8th International Meeting on Low Frequency Noise & Vibration, June 3-5, 1997, Gothenburg, Sweden (pp.197-206)
General rightsCopyright and moral rights for the publications made accessible in the public portal are retained by the authors and/or other copyright ownersand it is a condition of accessing publications that users recognise and abide by the legal requirements associated with these rights.
? Users may download and print one copy of any publication from the public portal for the purpose of private study or research. ? You may not further distribute the material or use it for any profit-making activity or commercial gain ? You may freely distribute the URL identifying the publication in the public portal ?
Take down policyIf you believe that this document breaches copyright please contact us at [email protected] providing details, and we will remove access tothe work immediately and investigate your claim.
Downloaded from vbn.aau.dk on: April 25, 2020
PROCEEDINGS of the
8th INTERNATIONAL MEETING
on
LOW FREQUENCY NOISE
&
VIBRATION
Gothenburg 3rd-5th June 1997
ON THE USE OF A-WEIGHTED LEVEL FOR PREDICTION OF LOUDNESS LEVEL
Henrik Meller and Morten Lydolf
Acoustics Laboratory, Aalborg University Fredrik Bajers Vej 7 B4, DK-9220 Aalborg 0 , Denmark.
0. Introduction
The most common descriptor of noise exposure is the A-weighted sound pressure level as specified in IEC 651 [1]. Unfortunately, it seems that the A-weighted sound pressure level does not always.reflect the annoyance perceived by the population. Therefore, corrections are sometimes added to the A-weighted level, such as for impulsive noise and for noise containing pure tones [2].
Another class of noise, for which the A-weighted level is considered insufficient, is noise with significant spectral components in the low frequency range. It seems to be a general understanding that A-weighted levels underestimate the annoyance in these cases. Examples are given for instance by Waye [3] and by Landstrom [4].
In Denmark the lack of coherence between A-weighted level and perceived annoyance is reflected in the rules for external industrial noise ([5], Clause 2.2.2, p. 17, authors' translation): "If the loudness of a noise is mainly determined by ve,y low frequency noise (frequencies below 50 Hz), then caution should be exercised, if the nuisances from the noise are assessed only from the A-weighted level, since this level does not constitute a satisfacto,y measure of the nuisances from low frequency noise. If, nevertheless, the A-weighted level is used, a too mild assessment of the nuisances will result. However, there is at present no generally approved method for assessment of nuisances from noise with pronounced low frequency character."
Corresponding rules in Norway suggest to use C-weighting in case of a high fraction of low frequency noise [6]. The wording of the document implies that in these cases the same limit should be used for the C-weighted level as would normally be used for the A-weighted level.
Swedish regulation of indoor noise from sanitary and other technical appliances [7] has a 50 dB limit for C-weighted levels in bedrooms along with a 30 dB limit for A-weighted levels.
In an attempt to explain the lack of coherence between A-weighted level and perceived annoyance, it would be rather natural to start the other way round and try to explain why anyone has ever expected a coherence. The basic idea of th is is that a given noise has a perceived magnitude, called loudness, and that the annoyance
197
from the sound is determined mainly or entirely by its loudness. Then, if the A-weighted level reflects the loudness, it would also reflect the annoyance. The present paper will examine the connection between loudness and A-weighted level.
The use of A-weighting to describe the sensitivity of the ear is discussed in Section 1. This discussion assumes that the equal loudness level contours described in ISO 226 [8] are correct. However, recent experiments seem to show that this may not be true, and Section 2 presents a similar discussion based on more recent data for equal loudness level contours.
The present study emphasizes the low audio frequency region, i. e. frequencies in the range 20-200 Hz. The discussion does not cover the infrasonic region, i. e. frequencies below 20 Hz. These are considered well described by the G-weighted level [9]. The level should preferable be below the threshold of perception in most cases, which means that the G-weighted level should be below approximately 95 dB for the average person and probably below approximately 85 dB for the most sensitive individuals.
1. ISO 226 equal loudness data
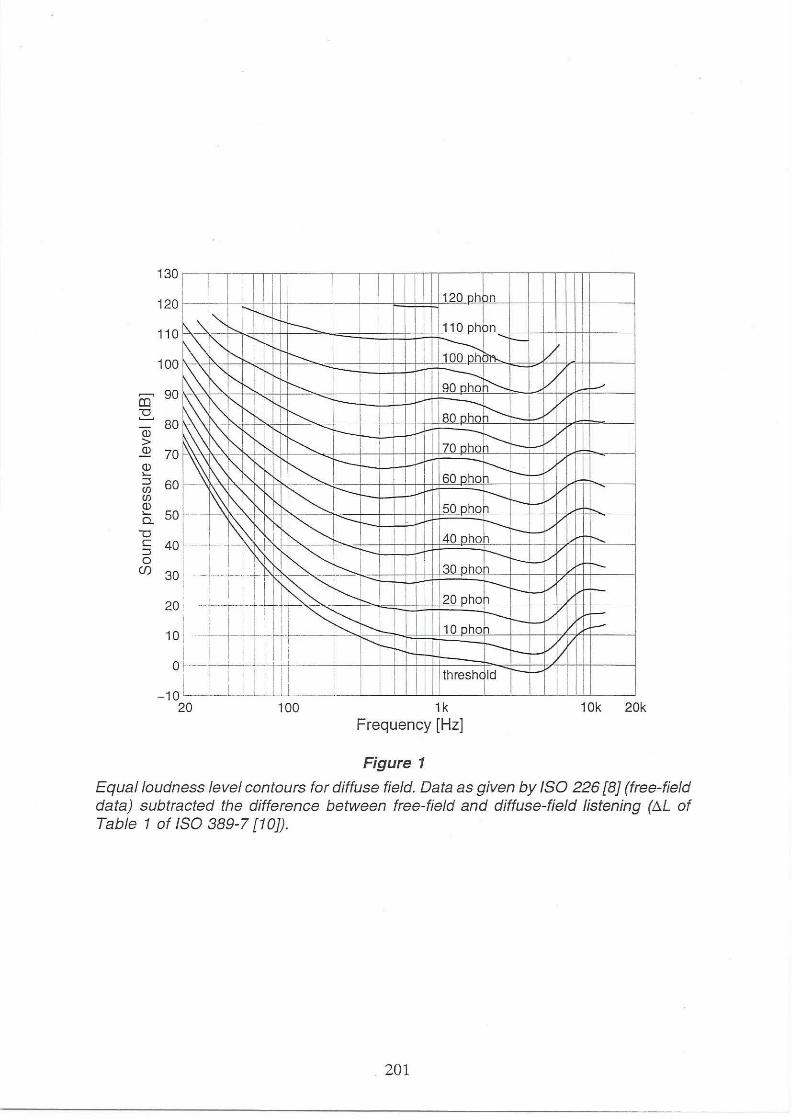
The pure tone free field sensitivity of the human ear is described in the international standard ISO 226 [8]. The standard presents contours of equal loudness levels (given in phon). The values are given for a free field with frontal sound incidence. However, most real life sound exposures are not free-field frontal, but more complex with a combination of sound waves with various angles of incidence. For the evaluation of the A-weighting curve it is therefore considered more appropriate to use equal loudness contours for a diffuse sound field. These are obtained by adjusting the contours of ISO 226 with the difference between free-field and diffuse-field listening as given in ISO 389-7 [1 O]. The resulting equal loudness contours for diffuse field are shown in Figure 1.
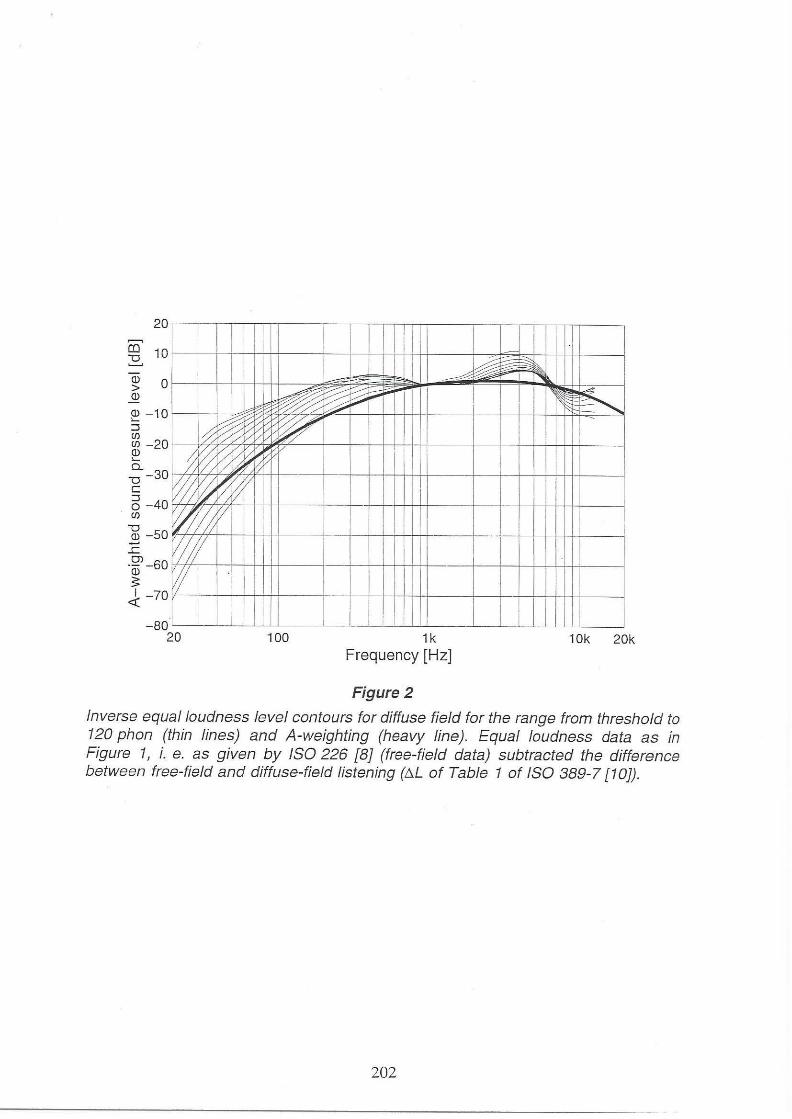
If the equal loudness level contours are inverted they describe "sensitivity curves" for the human hearing. A relevant weighting curve for loudness prediction should approximate the inverse equal loudness curves. Inverse equal loudness curves are shown in Figure 2 together with the A-weighting. It is seen that the inverse equal loudness curves vary substantially with loudness level. It is also seen that the A-weighting curve constitutes a rather poor approximation to the inverse equal loudness curves of any level.
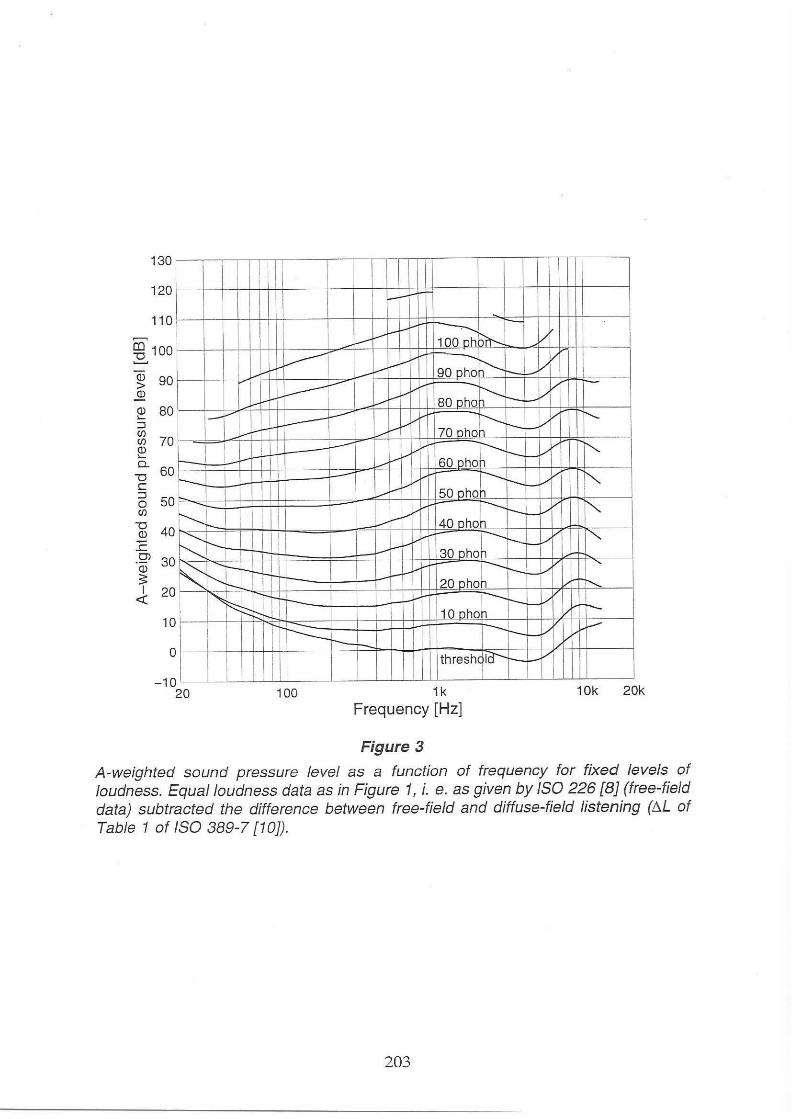
The problem can also be illustrated by plotting the A-weighted level for the equal loudness level contours rather than the usual un-weighted level. This is shown in Figure 3, which thus - for fixed levels of loudness level - gives the corresponding A-weighted level as a function of frequency.
If the A-weighted level were a good predictor of loudness level, the curves in Figure 3 would have been horizontal. This is in fact not the case. The A-weighted level is only close to the loudness level in a narrow frequency range around and somewhat above 1 kHz, and for very low levels in a wider range from approximately 100 Hz to several kilohertz. At high levels and low frequencies the A-weighted level is much lower than the loudness level, thus in this range the A-weighted level underestimates the loudness level substantially. At loudness levels around 30-50 phon the A-weighted
198
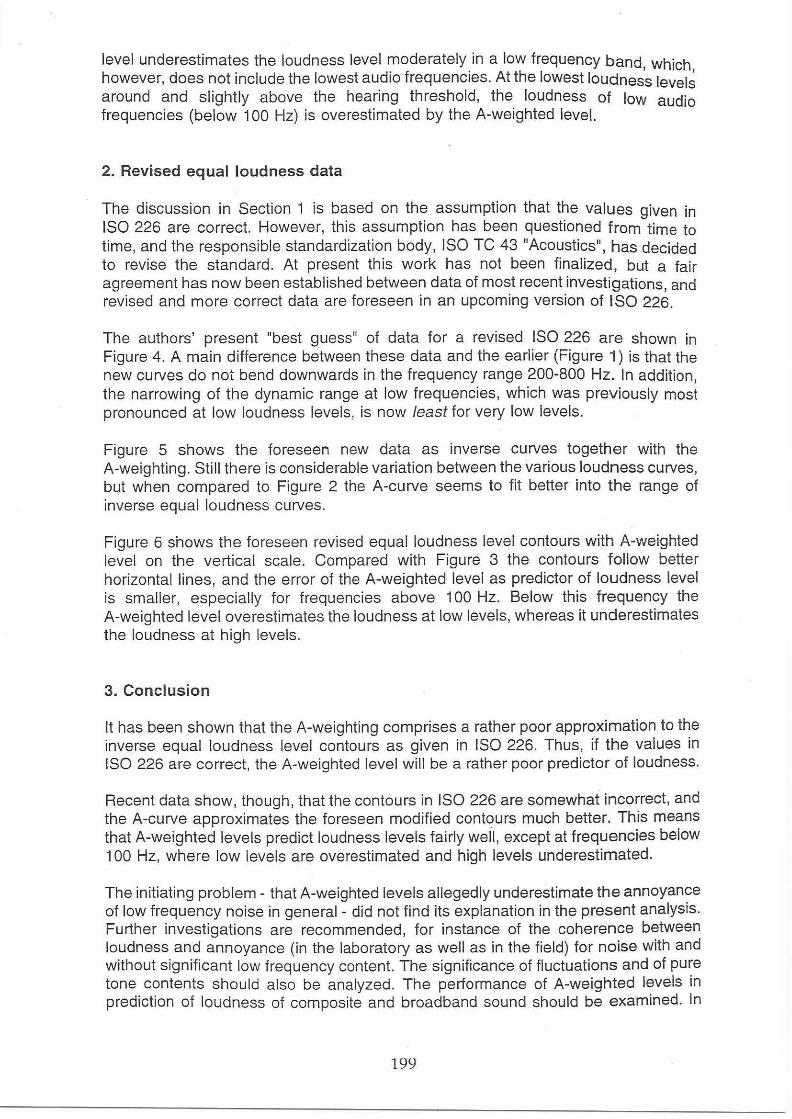
level underestimates the loudness level moderately in a low frequency band, which however, does not include the lowest audio frequencies. At the lowest loudness level~ around and slightly above the hearing threshold, the loudness of low audio frequencies (below 100 Hz) is overestimated by the A-weighted level.
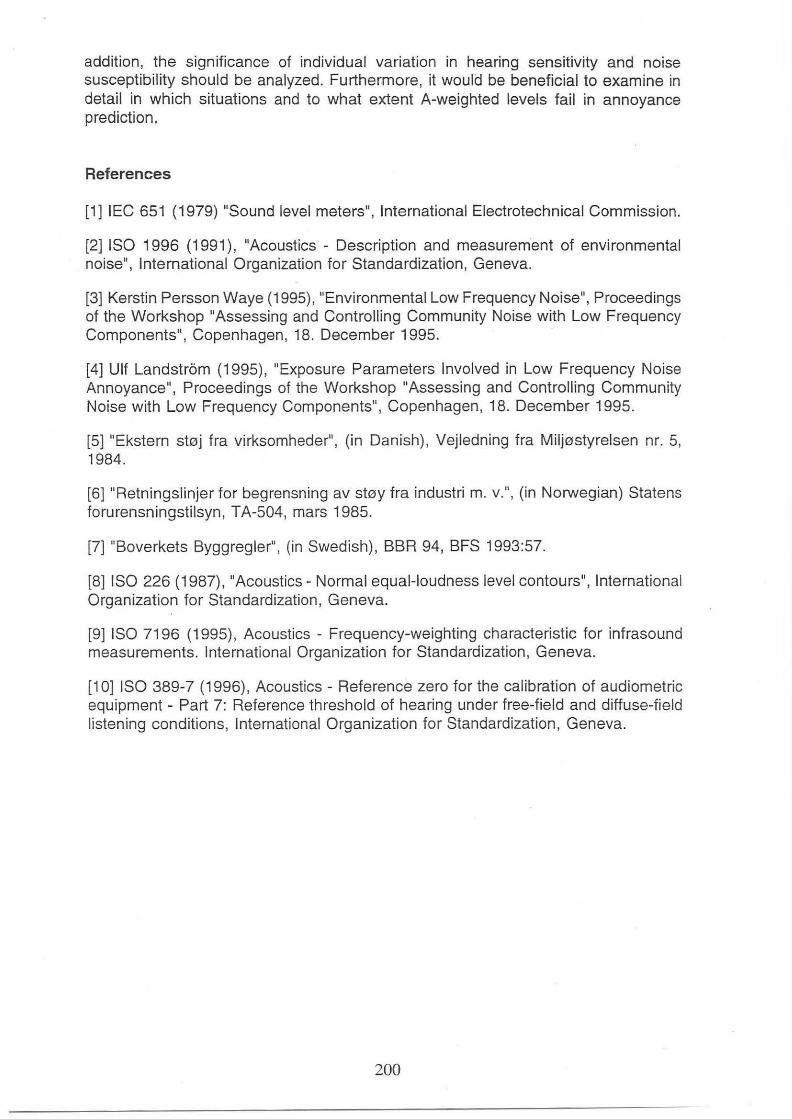
2. Revised equal loudness data
The discussion in Section 1 is based on the assumption that the values given in ISO 226 are correct. However, this assumption has been questioned from time to time, and the responsible standardization body, ISO TC 43 "Acoustics" , has decided to revise the standard. At present this work has not been finalized, but a fair agreement has now been established between data of most recent investigations, and revised and more correct data are foreseen in an upcoming version of ISO 226.
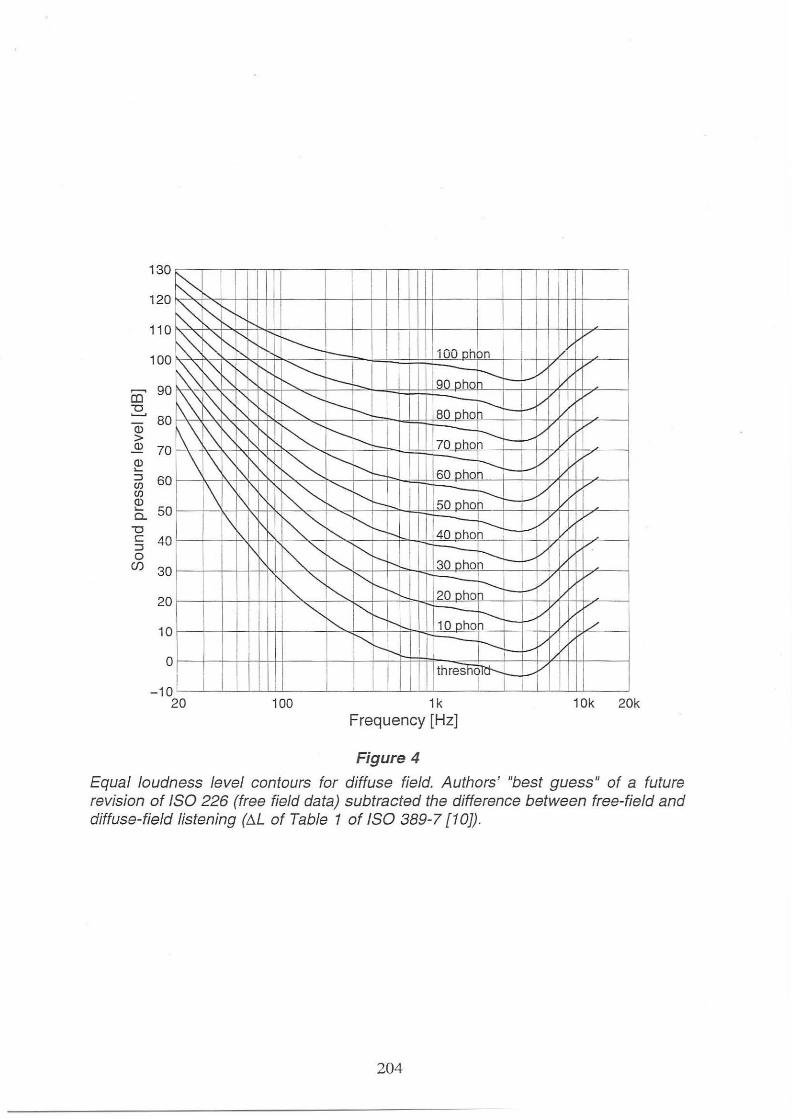
The authors' present "best guess" of data for a revised ISO 226 are shown in Figure 4. A main difference between these data and the earlier (Figure 1) is that the new curves do not bend downwards in the frequency range 200-800 Hz. In addition, the narrowing of the dynamic range at low frequencies, which was previously most pronounced at low loudness levels, is now /east for very low levels.
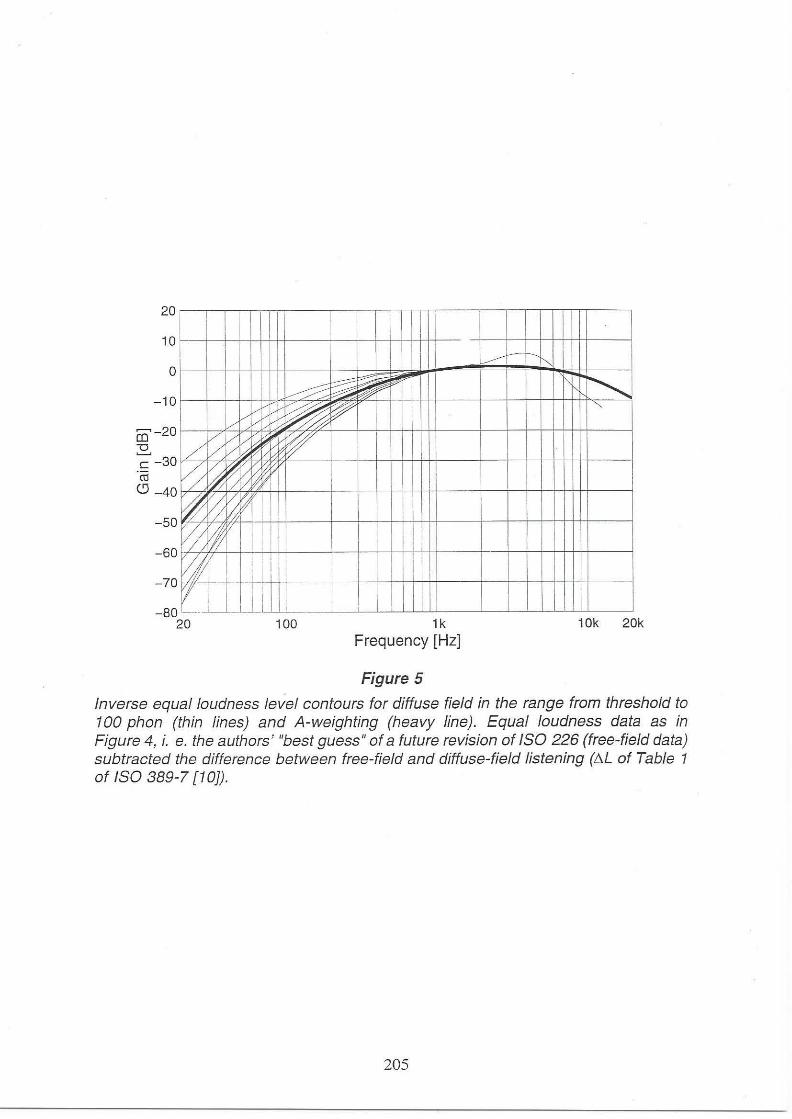
Figure 5 shows the foreseen new data as inverse curves together with the A-weighting. Still there is considerable variation between the various loudness curves, but when compared to Figure 2 the A-curve seems to fit better into the range of inverse equal loudness curves.
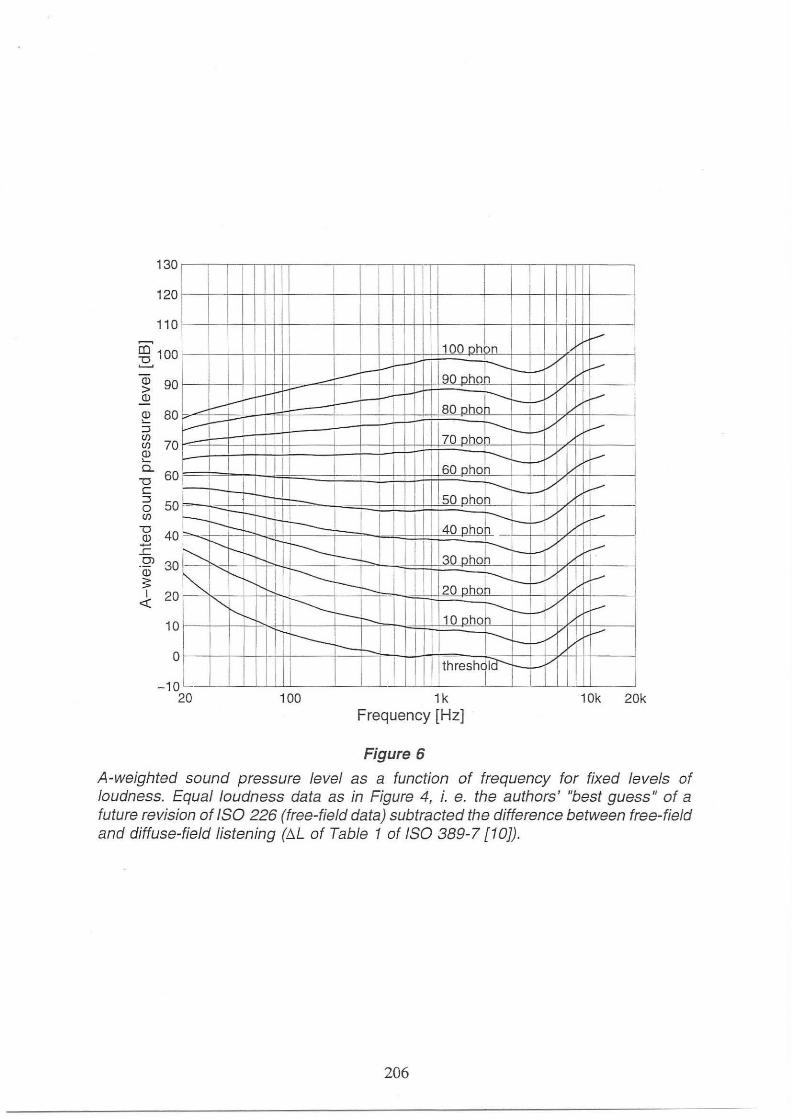
Figure 6 shows the foreseen revised equal loudness level contours with A-weighted level on the vertical scale. Compared with Figure 3 the contours follow better horizontal lines, and the error of the A-weighted level as predictor of loudness level is smaller, especially for frequencies above 100 Hz. Below this frequency the A-weighted level overestimates the loudness at low levels, whereas it underestimates the loudness at high levels.
3. Conclusion
It has been shown that the A-weighting comprises a rather poor approximation to the inverse equal loudness level contours as given in ISO 226. Thus, if the values in ISO 226 are correct, the A-weighted level will be a rather poor predictor of loudness.
Recent data show, though, that the contours in ISO 226 are somewhat incorrect, and the A-curve approximates the foreseen modified contours much better. This means that A-weighted levels predict loudness levels fairly weil , except at frequencies below 100 Hz, where low levels are overestimated and high levels underestimated.
The initiating problem - that A-weighted levels allegedly underestimate the annoyance of low frequency noise in general - did not find its explanation in the present analysis. Further investigations are recommended, for instance of the coherence between loudness and annoyance (in the laboratory as well as in the field) for noise with and without significant low frequency content. The significance of fluctuations and of pure tone contents should also be analyzed. The performance of A-weighted levels in prediction of loudness of composite and broadband sound should be examined. In
199
addition, the significance of individual variation in hearing sensitivity and noise susceptibility should be analyzed. Furthermore, it would be beneficial to examine in detail in which situations and to what extent A-weighted levels fail in annoyance prediction.
References
[1] IEC 651 (1979) "Sound level meters", International Electrotechnical Commission.
[2] ISO 1996 (1991 ), "Acoustics - Description and measurem.ent of environmental noise", International Organization for Standardization, Geneva.
[3] Kerstin Persson Waye (1995) , "Environmental Low Frequency Noise", Proceedings of the Workshop "Assessing and Controlling Community Noise with Low Frequency Components", Copenhagen, 18. December 1995.
[4] Ulf Landstrom (1995) , "Exposure Parameters Involved in Low Frequency Noise Annoyance", Proceedings of the Workshop "Assessing and Controlling Community Noise with Low Frequency Components" , Copenhagen, 18. December 1995.
[5] "Ekstern st0j fra virksomheder", (in Danish) , Vejledning fra Milj0styrelsen nr. 5, 1984.
[6] "Retningslinjer for begrensning av st0y fra industri m. v.", (in Norwegian) Statens forurensningstilsyn, TA-504, mars 1985.
[7] "Boverkets Byggregler", (in Swedish), BBR 94, BFS 1993:57.
[8] ISO 226 (1987), "Acoustics - Normal equal-loudness level contours" , International Organization for Standardization , Geneva.
[9] ISO 7196 (1995), Acoustics - Frequency-weighting characteristic for infrasound measurements. International Organization for Standardization, Geneva.
[10] ISO 389-7 (1996), Acoustics - Reference zero for the calibration of audiometric equipment - Part 7: Reference threshold of hearing under free-field and diffuse-field listening conditions, International Organization for Standardization, Geneva.
200
m 90 -
~ 80 -
Q)
> Q) 70 Q) ,._ ::J 60 Cf) Cf) Q) ,.__ 0..
"D c ::J 0
(f) 30
I I I
1k Frequency [Hz]
Figure 1
10k 20k
Equal loudness level contours for diffuse field. Data as given by ISO 226 [BJ (free-field data) subtracted the difference between free-field and diffuse-field listening (fl.L of Table 1 of ISO 389-7 [101).
. 201
20
co 10 ~ Q)
> Q)
0
~ -10 :J Cf)
I
I
I ,~ Cf) -20 Q) ,..__
o. -30 "O
~ ~ c :J o -40 Cf)
~ -50 ...... .c .Q'> _50 Q)
3: J -70
WI ~ VJ,!;
rf -80
20
~ ~ 1/
I
I I I
I I -~
~ f;;, E;:-t. S, r;i; j v ~ r ~~ / ~ . /
1 v '/ ~ / I
I/
. I
I 1 1 1
I I 11
~t~ ~ ~ ~n I
}.,
W I f::t /
;, /
;;;"' I I
I I
I I
100
I I I I
I I I
I
I I
I i I 1k
Frequency [Hz]
Figure 2
I - lli:J -~~-~ = , I
'? ~S:::-, I -
' I
I
I I
.. ··~ I
I I
10k 20k
Inverse equal loudness level contours for diffuse field for the range from threshold to 120 phon (thin lines) and A-weighting (heavy line). Equal loudness data as in Figure 1, i. e. as given by ISO 226 [BJ (free-field data) subtracted the difference between free-field and diffuse-field listening (t::,,L of Table 1 of ISO 389-7 [101).
202
......... 60 -- I I --- ,.....__ / , S I L;i..- ' -- ---..._v , ...., _....:.---1..., 50 ohon I o 50~'1::::::±=:t=l=~ti====F:::;:=f-4=tiitt:~~~::j---t-ii;tttt:::---------1 (/)
1 - , I , 1' , I [..,L.,, , --- ---... .// "'
-o '----t I i I t...---.-L--- 40 oho__b__ _ - ~
~ - ~ohoh -:E 40 ~~ 1 1 11 I !..- .......... i..- I , ............ ..__ _ ...,,v ""'
.iii 30 ~ 1.---- -- -- - I --r--·_vl.,, I "'" f I - 1 1 I 20 ohon I /-- r-,....__
<( 20 ; I ~=r-~-f-1 ~1:_+I ti:~r--- -+1-}-1 -+i +_-t_-t ..... -t±:cl 1~0~D~lh0~1;:::---....--r--f-_-t-J,,v?1/C-f,...Ti t--.:,,,__--j
10 I I I .._ ~ __J 11' 1 1 _ , // ..... -
_l I I ---'-,...___ I -- / .... o 1 I threshd1a---l/11
-10 1 I I 1k
Frequency [Hz] 20 100
Figure 3
10k 20k
A-weighted sound pressure level as a function of frequency for fixed levels of loudness. Equal loudness data as in Figure 1, i. e. as given by ISO 226 [BJ (free-field data) subtracted the difference between free-field and diffuse-field listening (6.L of Table 1 of ISO 389-7 [101).
203
130 c---,----r---,-,-~~~~~-.-~~~-,---,-~~-~-,---~l
120 ,.._.,.,~ ,..._.r-+-...........,.....,.._~--+-----<-->----+----+----+-+-i>--~--+-----+---+--.......... ---+-+~~~
CO 90 ~~~1"..-'-~ rt-~ ::-t-----ir-=-:-:"a;;;::::!:**=!::::::'.::---'-'-'"t'--J--t-lin-tTt;;-r-----i ~
CD >
80 !-"T"'t-'~j-----i'<dfk---"",,;;;;::t---j,-----------'="j-H='*l:::;::::=.,=...,..,~~---t---:-t7Tt-t--::;;-r------j
CD 70 ~--k4'-~-N--H'-.;;::----'""{;::~t-"l-==t~ =;=!::!::::::'.'.:~--'-'-'"t"'----t--t-li7ft--ti;:-/------j CD ,..._
~ 60 !----(/)
CD c.. 50 f-----+-~- f------1'-++'i~~--+-'"'-....~---t---r=~=l:::::!:::'~~"t-'--+--t-+-+7'H--t-+:,_,L-----,
"O c 40 >--~ -+-~ -+-+-•--::::i 0
(J) 30 f---+--I-H-~~H--"'°-+--~._.....+-+..=+--!-.!:::l~=-"'"t-'--+--,-+-'-*+--t-t:,_,L------j
-10 ~ ~ ~----+-~~~--~~----+-~ ~ ~ ~~--~~~~~ ~ 20 100 1k
Frequency [Hz]
Figure 4
10k 20k
Equal loudness level contours for diffuse field. Authors' "best guess" of a future revision of ISO 226 (free field data) subtracted the difference between free-field and diffuse-field listening (t::,,L of Table 1 of ISO 389-7 {101).
204
20~~~~~~1~~~~~~~~~
10 1
100 1k Frequency [Hz]
Figure 5
10k 20k
Inverse equal loudness level contours for diffuse field in the range from threshold to 100 phon (thin lines) and A-weighting (heavy line) . Equal loudness data as in Figure 4, i. e. the authors' "best guess" of a future revision of ISO 226 (free-field data) subtracted the difference between free-field and diffuse-field listening (!lL of Table 1 of ISO 389-7 [101).
205
100 1k Frequency [Hz]
Figure 6
10k 20k
A-weighted sound pressure level as a function of frequency for fixed levels of loudness. Equal loudness data as in Figure 4, i. e. the authors' "best guess" of a future revision of ISO 226 (free-field data) subtracted the difference between free-field and diffuse-field listening (t:,.L of Table 1 of ISO 389-7 [101).
206