Embed Size (px)
Citation preview

AAM/Insight Select Income Fund
Class A: CPUAXClass C: CPUCXClass I: CPUIX
An investment in the Fund is subject to risks and you could lose money on your investment in the Fund. The principal risks of investing in the Fund include, but are not limited to, fixed income risk, credit risk, liquidity risk, high yield (“junk”) bond risk, convertible securities risk, warrants risk, foreign investment risk, emerging market risk, currency risk, foreign sovereign risk, real estate investment trust risk, master limited partnership units risk, security lending risk, and management risk.
More information about these risks may be found in the Fund’s prospectus.
Updated for March 31, 2020
Advisors Asset Management Inc. (AAM) is a SEC registered investment advisor and member FINRA/SIPC.
235 West Galena Street I Milwaukee, WI 53212 I www.aamlive.com

1 “Insight” or “Insight Investment”, is the corporate brand for certain companies operated by Insight Investment Management Limited including, among others, Insight Investment Management (Global) Limited, Insight Investment International Limited and Insight North America LLC, each of which provides asset management services.
Overview
• Actively managed, diversified bond fund focused on total return and income generation by opportunistically blending all sectors of the fixed income universe
• Aims to add value through a credit-focused security selection process, and active management of duration, yield curve, and market allocations
• The AAM/Insight Select Income Fund was launched in 2013, supported by a 15 year institutional strategy track record, tested through a full market cycle against the Bloomberg Barclays U.S. Credit Index.
• Sub-advised by Insight Investment1, a global specialist asset manager with deep experience and resources in fixed income management
2
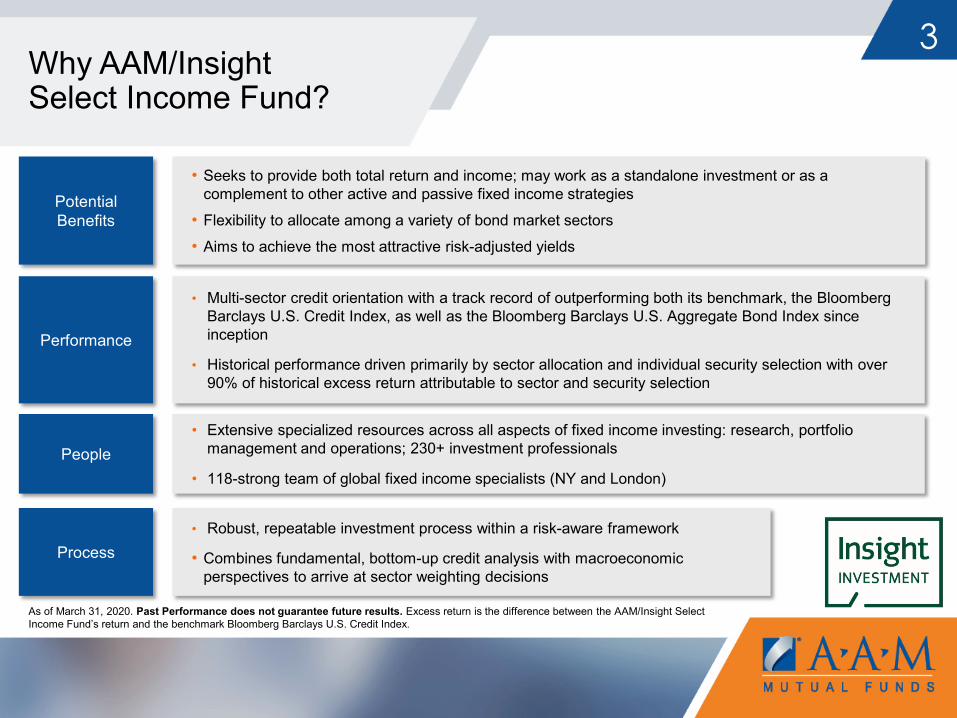
Why AAM/Insight Select Income Fund?
3
Performance
People
Process
• Multi-sector credit orientation with a track record of outperforming both its benchmark, the Bloomberg Barclays U.S. Credit Index, as well as the Bloomberg Barclays U.S. Aggregate Bond Index since inception
• Historical performance driven primarily by sector allocation and individual security selection with over 90% of historical excess return attributable to sector and security selection
• Extensive specialized resources across all aspects of fixed income investing: research, portfolio management and operations; 230+ investment professionals
• 118-strong team of global fixed income specialists (NY and London)
Potential Benefits
• Robust, repeatable investment process within a risk-aware framework
• Combines fundamental, bottom-up credit analysis with macroeconomic perspectives to arrive at sector weighting decisions
• Seeks to provide both total return and income; may work as a standalone investment or as a complement to other active and passive fixed income strategies
• Flexibility to allocate among a variety of bond market sectors
• Aims to achieve the most attractive risk-adjusted yields
As of March 31, 2020. Past Performance does not guarantee future results. Excess return is the difference between the AAM/Insight Select Income Fund’s return and the benchmark Bloomberg Barclays U.S. Credit Index.
AAM/Insight Select Income Fund• Investment Strategy• Investment Parameters

Investment Process
• Focuses on long-term outperformance by employing an opportunistic, active total return and income-oriented approach
• Seeks to capture “sustainable yield” by identifying attractive opportunities in the fixed income market through sector rotation and security selection
• Tactical management of duration and curve allocations consistent with market environment
- Over 90% of historical excess return has been attributable to sector allocation and security selection
• Actively allocates to credit and fixed income sectors, including asset backed securities, high yield and emerging markets, which seeks to diversify an investment grade portfolio.
• Relative value focused emphasis across full breadth of credit instruments
- Capital Structure: senior secured, senior, mezzanine, subordinate
5
As of March 31, 2020. Past Performance does not guarantee future results. Excess return is the difference between the AAM/Insight Select Income Fund’s return and the benchmark Bloomberg Barclays U.S. Credit Index.

Investment Parameters6
FOCUS ONUS investment grade credit
• All credit, interest rate and yield curve opportunity sets are utilized• Emphasizes relative value across U.S. fixed income sectors, sub-sectors, issuers and capital structures• Full derivative toolkit aims to isolate credit, interest rate and currency risk as well as selectively short certain credits,
while maintaining long bias
FLEXIBILITY TO INVEST INHigh yield, loans, asset backed securities, global bonds and emerging market debt
SELECTIVELY INGovernment bonds and currency
Typical Range
Allocations Investment grade credit 50% - 100%High yield bonds 0% - 25%Loans 0% - 25%Asset backed securities 0% - 50%Emerging market debt 0% - 30%Government bonds (including agency) 0% - 25%Currency +/- 2%
Duration Interest rate duration +/- 20%Index linked duration +/- 1 years
Issuer Credit Restrictions Non-corporate BBB/BB or below 3/2%Corporate AAA/AA/A/BBB/BB or below 5/5/5/6/2%
Expected Risk Tracking error relative to benchmark 0.5% - 4%

AAM/Insight Select Income Fund • CPUIX Performance Summary• Performance Attribution• Cumulative Growth of $1,000

Fund Facts
Share Class Ticker CUSIPMinimum Initial
Purchase AmountMinimum Subsequent
Purchase AmountExpense Ratios*
(Net / Gross)
Class A CPUAX 461 41P 883 $2,500 $500 0.84% / 1.17%
Class C CPUCX 461 41P 875 $2,500 $500 1.56% / 1.89%
Class I CPUIX 461 41P 867 $25,000 $5,000 0.53% / 0.86%
Fund Category Morningstar Corporate Bond
Objective Seeks current income
Inception date April 19, 2013
Benchmark Bloomberg Barclays U.S. Credit Bond Index
8
All share classes may not be available. Please consult with your financial advisor for more details.
*The Fund’s advisor has contractually agreed to waive certain fees/expenses until October 31, 2029 and may recoup previously waived expenses that it assumed during the previous three-year period.

CPUIX Performance Summary
9
Investment Summary
• Employs an opportunistic, income-oriented approach in seeking to identify opportunities with the overall goal of maintaining and increasing income for investors
• Opportunistically allocates to the most attractive sectors within the fixed income universe
• Risk mitigation embedded in the investment process
• Seeks to add value through credit focus, security selection, and active management of duration, yield curve, and market allocations
3-Year Statistics CPUIX
Return (%) 2.97
Standard Deviation 5.80
Sharpe Ratio 0.28
Three years ending 3/31/20.
CPUIX U.S. Credit Bond Index
U.S. Aggregate Bond Index
Alpha vs. -0.72 -0.74
Beta vs. 1.13 1.15
Upside Capture vs. (%) 98.78 123.37
Downside Capture vs. (%) 108.57 176.56
The performance data quoted represents past performance and is not a guarantee of future results. Investment return and principal value of an investment will fluctuate so that an investor's shares, when redeemed, may be worth more or less than their original cost. Current performance may be lower or higher than the performance information quoted. To obtain performance information current to the most recent month-end, call 888.966.9661.
Redemption fee if redeemed within 90 days of purchase 2.00%. Please see end of presentation for important information and disclosures.
Annualized Performance (%)
As of March 31, 2020
1.52
2.97 2.803.16
5.10
4.19
3.28 3.25
8.93
4.82
3.36 3.09
1-Year 3-Year 5-Year Since Inception(4/19/13)
CPUIX - Class I BB US Credit BB US Aggregate
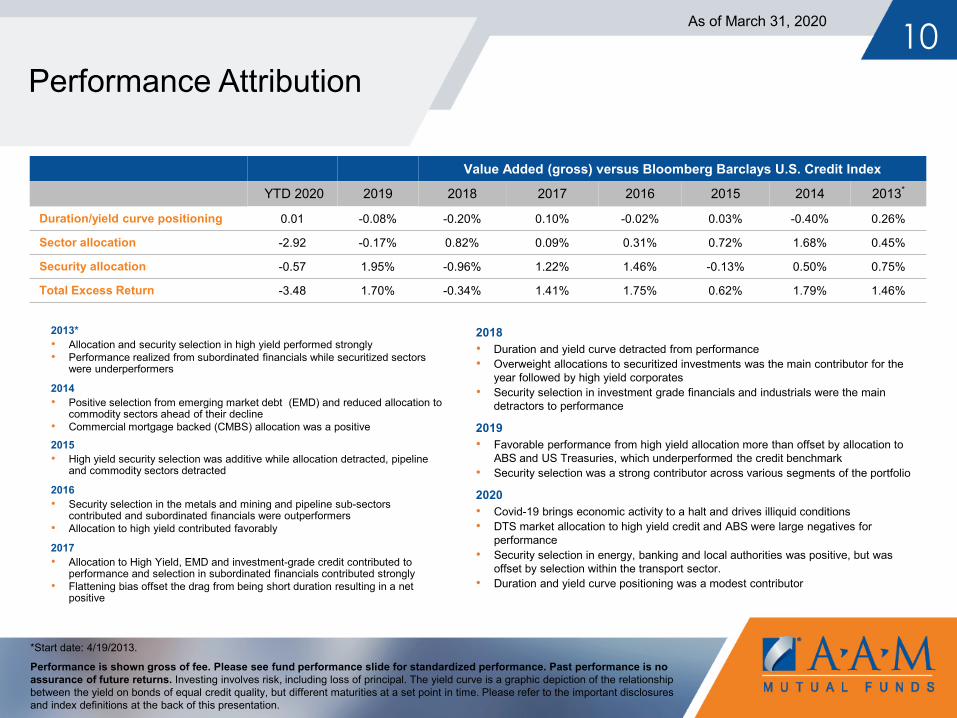
Value Added (gross) versus Bloomberg Barclays U.S. Credit Index
YTD 2020 2019 2018 2017 2016 2015 2014 2013*
Duration/yield curve positioning 0.01 -0.08% -0.20% 0.10% -0.02% 0.03% -0.40% 0.26%
Sector allocation -2.92 -0.17% 0.82% 0.09% 0.31% 0.72% 1.68% 0.45%
Security allocation -0.57 1.95% -0.96% 1.22% 1.46% -0.13% 0.50% 0.75%
Total Excess Return -3.48 1.70% -0.34% 1.41% 1.75% 0.62% 1.79% 1.46%
Performance Attribution
2013*• Allocation and security selection in high yield performed strongly• Performance realized from subordinated financials while securitized sectors
were underperformers
2014• Positive selection from emerging market debt (EMD) and reduced allocation to
commodity sectors ahead of their decline• Commercial mortgage backed (CMBS) allocation was a positive2015• High yield security selection was additive while allocation detracted, pipeline
and commodity sectors detracted
2016• Security selection in the metals and mining and pipeline sub-sectors
contributed and subordinated financials were outperformers• Allocation to high yield contributed favorably
2017• Allocation to High Yield, EMD and investment-grade credit contributed to
performance and selection in subordinated financials contributed strongly• Flattening bias offset the drag from being short duration resulting in a net
positive
10
*Start date: 4/19/2013.
Performance is shown gross of fee. Please see fund performance slide for standardized performance. Past performance is no assurance of future returns. Investing involves risk, including loss of principal. The yield curve is a graphic depiction of the relationship between the yield on bonds of equal credit quality, but different maturities at a set point in time. Please refer to the important disclosures and index definitions at the back of this presentation.
As of March 31, 2020
2018• Duration and yield curve detracted from performance• Overweight allocations to securitized investments was the main contributor for the
year followed by high yield corporates• Security selection in investment grade financials and industrials were the main
detractors to performance
2019• Favorable performance from high yield allocation more than offset by allocation to
ABS and US Treasuries, which underperformed the credit benchmark• Security selection was a strong contributor across various segments of the portfolio
2020• Covid-19 brings economic activity to a halt and drives illiquid conditions• DTS market allocation to high yield credit and ABS were large negatives for
performance• Security selection in energy, banking and local authorities was positive, but was
offset by selection within the transport sector.• Duration and yield curve positioning was a modest contributor

Hypothetical Growth of $10,000 (CPUIX)
11As of March 31, 2020
$12,416
$12,487
$12,355
4/19
/201
35/
31/2
013
7/31
/201
39/
30/2
013
11/3
0/20
131/
31/2
014
3/31
/201
45/
31/2
014
7/31
/201
49/
30/2
014
11/3
0/20
141/
31/2
015
3/31
/201
55/
31/2
015
7/31
/201
59/
30/2
015
11/3
0/20
151/
31/2
016
3/31
/201
65/
31/2
016
7/31
/201
69/
30/2
016
11/3
0/20
161/
31/2
017
3/31
/201
75/
31/2
017
7/31
/201
79/
30/2
017
11/3
0/20
171/
31/2
018
3/31
/201
85/
31/2
018
7/31
/201
89/
30/2
018
11/3
0/20
181/
31/2
019
3/31
/201
95/
31/2
019
7/31
/201
99/
30/2
019
11/3
0/20
191/
31/2
020
3/31
/202
0
AAM/Insight Select Income I BBgBarc US Agg Bond TR USD BBgBarc US Credit TR USD
Redemption fee if redeemed within 90 days of purchase 2.00%. Please see end of presentation for important information and disclosures.
The performance data quoted represents past performance and is not a guarantee of future results. Investment return and principal value of an investment will fluctuate so that an investor's shares, when redeemed, may be worth more or less than their original cost. Current performance may be lower or higher than the performance information quoted. To obtain performance information current to the most recent month-end, call 888.966.9661.

People• Insight’s Fixed Income Team

13Dedicated and Experienced Investment Team
As of March 31, 2020
GLOBAL INFLATIONDavid Hooker
EUROPEAN CREDITLucy Speake (+4)
CURRENCYFrancesca Fornasari (+2)
MONEY MARKETSChris Brown (+4)
RESPONSIBLE INVESTMENTJoshua Kendall (+3)
GLOBAL CREDITPeter Bentley (+8)
GLOBAL INTEREST RATESGareth Colesmith (+7)
SECURED FINANCE Shaheer Guirguis (+20)
CREDIT ANALYSISDavid Averre (+23)
INVESTMENT SPECIALISTSApril LaRusse (+7)
HIGH YIELDUlrich Gerhard
EMDColm McDonagh (+5)
BANK LOANSJoseph Nelson (+1)
FIXED INCOME GROUP MEETING STRUCTURE
INVESTMENT TEAM LEVERAGES THE RESOURCES OF INSIGHT’S BROADER INVESTMENT TEAM
ECONOMICSAdrian Grey – Global CIO
FIXED INCOME ALLOCATIONAlex Veroude – CIO (US)
CREDIT STRATEGYAlex Veroude – CIO (US)
Credit Research EMDGlobal Government Global Leveraged Finance
Portfolio Strategy Review
Currency Security Selection EM CorporatesSecured FinanceMoney Markets
DAILY MORNING MEETING
WEEKLY
MONTHLY
DAILY
Gautam Khanna, CFA, CPA26 Years’ Experience
Lead Portfolio Manager
Jason Celente, CFA 23 Years’ Experience
Portfolio Manager
Gerard Berrigan36 Years' Experience
Portfolio Manager
James DiChiaro 22 Years’ Experience
Portfolio Manager

Process• Insight Investment Philosophy• Insight Investment Process• Credit Cycle and Opportunity Set

Investment Philosophy
Insight aims to deliver consistent long-term outperformance by:
• Establishing a long-term view• Evaluating the broadest range of investment opportunities • Seeking to identify market inefficiencies at the sector and security level• Acknowledging uncertainty while actively focusing on managing risk and return
15
DiversificationPrecisionConsistent
Performance=+
• Bonds have many discrete risk components
• Research identifies mispricing
• Target risk that offers the right level of return
• Many uncorrelated sources of return
• Investment process tailored to each asset class
For illustrative purposes only. There can be no guarantee that any strategy (risk management or otherwise) will be successful. All investing involves risk, including potential loss of principal.
• Historically uncorrelated portfolio of desired risks
• Expectation of better participation in the upside, less on the downside

16Insight’s proprietary risk calibration framework combines inputs from both their top-down global macroeconomic analysis, credit and sector strategy and bottom-up individual security selection to construct the portfolio.
Investment Process
Five key drivers of return Key drivers are brought together by robust and repeatable investment process
Fixed Income Allocation Meeting
“Top-Down” Analysis
EconomicsMeeting
Security Selection
• Fundamental analysis
• Relative value analysis
Asset Allocation
Policy
• Asset allocation framework
• Implemented by portfolio managers
“Bottom-Up” Research
Government
EMDCurrency
Credit
Bond Portfolio
• Details portfolio construction
• Risk analysis
PRIM
ARY
DR
IVER
S
Duration and Yield Curve
Credit and Sector Strategy
Security Selection
Market Allocation
Currency Selection
Units of Risk®
For illustrative purposes only. There can be no guarantee that any strategy (risk management or otherwise) will be successful. All investing involves risk, including potential loss of principal.

17Facilitates risk calibration and position sizing for portfolio construction and provides a common language for specialists and portfolio managers to communicate views quickly and efficiently
Units of Risk® — Proprietary Risk Framework
Security Selection
Credit and Sector Strategy
Units of Risk
Diversification• Maximum three units per asset class• Multiple sources of return- Government/rates- Mortgage-backed securities- Corporates (investment grade and high yield)- Asset-backed and commercial
mortgage-backed securities- Bank loans/CLOs- Emerging market debt
Inve
stm
ent p
hilo
soph
y
Precision• Determine asset allocation for each
segment of the market- Valuation, macro and tactical
• Size positions- Tailor to excess return objective- Adjust for underlying asset volatility
and correlation
• Facilitate communication- Common language
Portfolio
For illustrative purposes only. There can be no guarantee that any strategy (risk management or otherwise) will be successful. All investing involves risk, including potential loss of principal.

As of April 8, 2020. For illustrative purposes only. Length of line represents Z-score of ratio of the sector’s spread to the market using 5-year history. A z-score indicates how many standard deviations an element is from the mean. If a Z-score is 0, it represents the score as identical to the mean score. Z-scores may be positive or negative, with a positive value indicating the score is above the mean and a negative score indicating it is below the mean. Positive and negative scores also reveal the number of standard deviations that the score is either above or below the mean.
The process dynamically allocates risk over time; therefore, Insight seeks value regardless of where we are in the credit cycle
Credit Cycle and Opportunity Set
18
Improving credit metrics
TechnologyTelecoms
Utilities
Food and BeverageBanks • Tobacco
Deteriorating credit metrics
Aerospace/DefenseAutos • Chemicals
Energy • MediaPharma • REITs
Retail
+2
+3
-2
-3
+1
-1
Banks REITs
Utilities
Autos
Pharma
Energy
Technology
Media
Tobacco Food & Bev
Retail
Telecoms
Chemicals
Aerospace/ Defense

Insight’s proprietary landmine checklist aims to identify the risks that can lead to a sharp deterioration in an issuer’s credit quality.
Security selection: landmine checklist
For illustrative purposes only. There can be no guarantee that any strategy (risk management or otherwise) will be successful. All investing involves risk, including potential loss of principal.
Each factor scored 1 (good) to 5 (bad)
Assuming no access to capital markets in the next 24 months, what is the impact on the issuer’s liquidity?
What is the magnitude of the issuer’s off-balance-sheet liabilities such as pension deficits, operating leases, etc.?
To what extent is the issuer’s industry subject to regulation and changes in regulation?
Does the management have an appetite for debt-financed M&A? Is the company’s share price underperforming?
Is the business likely to be subject to an approach from or a bid by private equity?
Is the issuer properly managing environmental, social and governance risks?
Factor Example
Liquidity
Contingent Liabilities
Regulatory Risk
Event Risk
LBO Risk
Environmental, Social, Governance (ESG)
Investment Process19

Appendix

Fund Performance21As of March 31, 2020
Please see back page for additional important disclosure information.
Performance for periods longer than one year is annualized. Redemption fee if redeemed within 90 days of purchase 2.00%. 1Sales charge fee for Class A 3.00%; maximum deferred sales charge 1.00%
The performance data quoted represents past performance and is not a guarantee of future results. Investment return and principal value of an investment will fluctuate so that an investor's shares, when redeemed, may be worth more or less than their original cost. Current performance may be lower or higher than the performance information quoted. To obtain performance information current to the most recent month-end, call 888.966.9661.
TRAILING PERFORMANCE AS OF 3/31/20 (%) QTR YTD 1-Year 3-Years 5-YearsSince Inception
(4/19/13)
Class A – CPUAX -6.73 -6.73 1.32 2.74 2.51 2.90
With sales charge1 -9.54 -9.54 -1.73 1.70 1.89 2.45
Class C – CPUCX -6.91 -6.91 0.59 1.94 1.76 2.14
Class I - CPUIX -6.75 -6.75 1.52 2.97 2.80 3.16
Bloomberg Barclays Credit Bond Index -3.14 -3.14 5.10 4.19 3.28 3.25
Bloomberg Barclays U.S. Aggregate Bond Index 3.15 3.15 8.93 4.82 3.36 3.09
CALENDAR YEARS (%) 2014 2015 2016 2017 2018 2019
Class A – CPUAX 8.27 -1.32 6.35 6.49 -3.11 14.35
With sales charge1 5.07 -4.29 3.12 3.25 -6.05 10.87
Class C – CPUCX 7.48 -1.98 5.56 5.82 -4.00 13.56
Class I - CPUIX 8.52 -0.89 6.58 6.86 -3.02 14.81
Bloomberg Barclays Credit Bond Index 7.53 -0.77 5.63 6.18 -2.11 13.80
Bloomberg Barclays U.S. Aggregate Bond Index 5.97 0.55 2.65 3.54 0.01 8.72

0.0
2.0
4.0
6.0
8.0
0.0 2.0 4.0 6.0 8.0
Ret
urn
(%)
Risk (Std. Deviation %)
Risk-Adjusted Returns (CPUIX)
22As of March 31, 2020
Risk / Reward Profile (3 Year)
Volatility (3 year as measured by the standard deviation)Excess Return (3 year - annualized)
Source: Morningstar. Past performance is no assurance of future returns. Standard deviation measures the volatility of the fund’s returns, calculated for the trailing 3 years. Higher deviation represents higher volatility. Excess return is the difference between the AAM/Insight Select Income Fund’s return and the index. Please refer to the important disclosures and index definitions at the back of this presentation.
AAM/Insight Select Income Fund
-0.72 -0.74-1.0-0.50.00.51.01.52.02.53.0
vs Bloomberg Barclays USCredit Index
vs Bloomberg Barclays USAggregate Index
Annu
al E
xces
s R
etur
n (%
)
5.804.96
2.91
01234567
AAM/Insight SelectIncome Fund
Bloomberg BarclaysUS Credit Index
Bloomberg BarclaysUS Aggregate Index
Stan
dard
dev
iatio
n (%
)

About the Fund23
Multiple sources of diversification by sector, credit quality, and issuer
Quality Distribution (excludes cash)
Characteristics Fund
Bloomberg Barclays
U.S. Credit Index
Bloomberg Barclays U.S. Agg
Index
Number of holdings 278 - -Number of issuers 157 1,164 1,249
Average price ($) 98.70 107.28 104.70
Effective duration (yrs) 7.78 7.68 6.05
Dividend frequency Monthly N/A N/A
US high yield corporates (%) 8.56 0.00 0.00
Portfolio Yield (%) Subsidized Unsubsidized30-day SEC Yield
Class A 2.88 2.74
Class C 2.22 2.07
Class I 3.26 3.12
Past performance is no assurance of future returns. Sector portfolio allocations reflect net exposure to each sector through direct investments in securities and credit default swap agreements. Credit default swaps are weighted using notional value. Negative sector weightings may result from the use of derivatives and from unsettled trade positions. The above sector allocations are only valid as of the date shown and should not be relied upon as a complete listing of the Fund’s past investment decisions. Sector allocations are subject to change without notice, may not represent current or future decisions and should not be construed as investment recommendations. Please refer to the important disclosures at the back of this presentation. Quality Distribution reflects net exposure to credit ratings by nationally recognized statistical rating organization (NRSRO) through direct investments in securities and credit default swap agreements, weighted based on notional value and assigned to lower rating of the underlying asset or counterparty. If there are multiple ratings for a security, the lowest rating is used unless ratings are provided by all three agencies, in which case the middle rating is used. AAA, AA, A, and BBB are investment grade ratings; BB, B, CCC/CC/C and D are below-investment grade ratings. U.S. Government and Agency securities are generally considered to be of the highest quality. Negative exposure may result from the use of derivatives or unsettled trade positions. Credit ratings are subject to change. Total may not add up to 100% due to rounding.
As of March 31, 2020
US Governments & AgenciesAaa/AAAAa/AAABaa/BBBBa/BBB or lowerUnrated
3.11
5.96 5.35
19.32
54.47
9.74
2.06

About the Fund24
• Multi sector approach provides diversification• Sector weightings vary based on fundamental
and valuation considerations
Sector Distribution
The above should not be relied upon as a complete listing of the fund’s past investment decisions. Asset allocations by sector are subject to change without notice, may not represent current or future decisions and should not be construed as investment recommendations. Please refer to the important disclosures at the back of this presentation
As of March 31, 2020
0.00%
10.00%
20.00%
30.00%
40.00%
50.00%
60.00%
70.00%
80.00%
90.00%
100.00%
Apr-1
3
Aug-1
3
Dec-1
3
Apr-1
4
Aug-1
4
Dec-1
4
Apr-1
5
Aug-1
5
Dec-1
5
Apr-1
6
Aug-1
6
Dec-1
6
Apr-1
7
Aug-1
7
Dec-1
7
Apr-1
8
Aug-1
8
Dec-1
8
Apr-1
9
Aug-1
9
Dec-1
9
Inds Fin Non U.S. Corp HY Corp ABS EMD Uts Gov CMBS Cash Muni MBS
Mar -
20
19.23
4.87
2.56
0
1.53
42.28
0
26.96
2.58
72.4
17.51
0
0
5.47
0
0
0
4.63
56.76
13.94
12.09
8.56
4.29
0
1.27
0.03
3.07
Investment Grade CorporateBonds
Non-US Developed
Other (ABS, CMBS, Non-USGovt)
High Yield Corporate Bonds
Emerging Markets
Government -Treasury
Cash Equivalents
Mortgage Backed Securities
Government - Agency
AAM/Insight Select Income FundBB U.S. Credit IndexBB U.S. Aggregate Bond Index

About the Fund25
Fund% Net Assets
U.S. Credit Index% Net Assets
0-1 Year 11.7 1.9
1-3 Year 13.9 21.6
3-5 Year 14.4 19.0
5-7 Year 16.2 15.4
7-10 Year 17.3 11.2
10-plus Years 26.5 31.0
Note: Top ten holdings does not include cash allocation. The above holdings are only valid as of the date shown and should not be relied upon as a complete listing of the Fund’s past investment decisions. Holdings are subject to change without notice, may not represent current or future decisions and should not be construed as investment recommendations. Please refer to the important disclosures at the back of this presentation.
TOP TEN HOLDINGS Fund (% Net Assets)
BHP BILLITON FIN USA LTD 2.18
CVS HEALTH CORP 2.19
BANK OF AMERICA CORP 2.17SOFI CONSUMER LOAN PROGRAM TRUST 1.82
CITGO PETROLEUM CORP 1.79
JPMORGAN CHASE & CO 1.72
BROADCOM INC 1.72
METLIFE INC 1.64
FORD MOTOR CREDIT CO LLC 1.62
ORACLE CORP 1.49
As of March 31, 2020
Duration Schedule
Fund% Net Assets
U.S. Credit Index% Net Assets
0-1 Year 4.39 0.5
1-3 Year 15.26 21.34
3-5 Year 11.52 17.18
5-7 Year 11.32 12.43
7-10 Year 23.53 14.53
10-plus Years 33.99 34.01
Maturity Schedule

Important Disclosures26
You should carefully consider the investment objectives, potential risks, management fees, and charges and expenses of the Fund priorto investing. The Fund’s prospectus and summary prospectus contains this and other information about the Fund, and should be readcarefully before investing. You may obtain a current copy of the Fund’s prospectus and summary prospectus by calling 888.966.9661.An investment in the Fund is subject to risks and you could lose money on your investment in the Fund. The Fund’s principal risks are outlined below. More information about these risks may be found in the Fund’sprospectus.Fixed income securities decrease in value if interest rates rise. The Fund may not be able to sell some or all of the investments that it holds, or may only be able to sell those investments at less than desired prices.High yield bonds (“junk bonds”) involve greater risks of default, downgrade, or price declines. Convertible securities and warrants are subject to potentially greater volatility than the general market. Foreignsecurities may be more volatile than the securities of U.S. issuers because of economic and other conditions. These risks are heightened in emerging markets. Investments denominated in foreign currencies aresubject to changes in value relative to the U.S. dollar. Real Estate Investment Trusts (REITs) are subject to risks similar to those associated with direct ownership of real estate, including losses from casualty orcondemnation, and changes in local and general economic conditions, supply and demand, interest rates, zoning laws, regulatory limitations on rents, property taxes and operating expenses. Master LimitedPartnership Units (MLPs) risk includes the risks associated with a similar investment in equity securities. Additional risks include cash flow risk, tax risk, risk associated with a potential conflict of interest between unitholders and the MLP’s general partner, and capital markets risk. Securities lending involves certain potential risks, primarily counterparty, market, liquidity and reinvestment risks. Additionally, the Fund may employhedging techniques that involve a variety of derivative transactions, including futures contracts, swaps, exchange-listed and over-the-counter put and call options on securities or on financial indices, and variousinterest rate and foreign-exchange transactions (collectively, “Hedging Instruments”). Hedging Instrument Risks involves certain potential risks, primarily counterparty, market, liquidity and reinvestment risks.Investing in an ETF will provide the Fund with exposure to the securities comprising the index on which the ETF is based and will expose the Fund to risks similar to those of investing directly in those securities. Anoutbreak of an infectious respiratory illness caused by a novel coronavirus known as COVID-19 has negatively affected the worldwide economy, as well as the economies of individual countries, the financial healthof individual companies and the market in general in significant and unforeseen ways. The future impact of COVID-19 is currently unknown, and it may exacerbate other risks that apply to the Fund. Any such impactcould adversely affect the Fund’s performance, the performance of the securities in which the Fund invests and may lead to losses on your investment in the Fund.Past performance is not a guide to future performance. The value of investments and any income from them will fluctuate and is not guaranteed (this may partly be due to exchange rate changes) and investorsmay not get back the amount invested. Transactions in foreign securities may be executed and settled in local markets. Performance comparisons will be affected by changes in interest rates. Investment returnsfluctuate due to changes in market conditions. Investment involves risk, including the possible loss of principal. No assurance can be given that the performance objectives of a given strategy will be achieved. Theinformation contained herein is for your reference only and is being provided in response to your specific request and has been obtained from sources believed to be reliable; however, no representation is maderegarding its accuracy or completeness. This document must not be used for the purpose of an offer or solicitation in any jurisdiction or in any circumstances in which such offer or solicitation is unlawful or otherwisenot permitted. This document should not be duplicated, amended, or forwarded to a third party without consent from Insight.
This material is not intended to be a recommendation or investment advice, does not constitute a solicitation to buy or sell securities, and is not provided in afiduciary capacity within the meaning of the Employee Retirement Income Security Act of 1974 (ERISA) and the Internal Revenue Code. The information provided doesnot take into account the specific objectives or circumstances of any particular investor, or suggest any specific course of action. Investment decisions should bemade based on an investor’s objectives and circumstances and in consultation with his or her advisers.

The investment adviser providing these advisory services is Insight North America LLC (INA), a registered investment adviser under the Investment Advisers Act of 1940 and regulated by the USSecurities and Exchange Commission. INA is part of 'Insight' or 'Insight Investment', the corporate brand for certain asset management companies operated by Insight Investment Management Limitedincluding, among others, Insight Investment Management (Global) Limited and Insight Investment International Limited.
Unless otherwise stated, the source of information is Insight. Any forecasts or opinions are Insight’s own at the date of this document (or as otherwise specified) and may change. Material in thispublication is for general information only and is not advice, investment advice, or the recommendation of any purchase or sale of any security. Insight makes no implied or expressed recommendationsconcerning the manner in which an account should or would be handled, as appropriate investment strategies depend upon specific investment guidelines and objectives and should not be construed tobe an assurance that any particular security in a strategy will remain in any fund, account, or strategy, or that a previously held security will not be repurchased. It should not be assumed that any of thesecurity transactions or holdings referenced herein have been or will prove to be profitable or that future investment decisions will be profitable or will equal or exceed the past investment performance ofthe securities listed.
Information about the index shown here is provided to allow for comparison of the performance of the strategy to that of a certain well-known and widely recognized index. There is no representation thatsuch index is an appropriate benchmark for such comparison. You cannot invest directly in an index and the index represented does not take into account trading commissions and/or other brokerage orcustodial costs. The volatility of the index may be materially different from that of the strategy. In addition, the strategy’s holdings may differ substantially from the securities that comprise the index shown.
Definitions: The Bloomberg Barclays U.S. Credit Bond Index measures the performance of investment grade corporate debt and agency bonds that are dollar denominated and have a remainingmaturity of greater than one year. It is not possible to invest directly in an index. The Bloomberg Barclays U.S. Aggregate Bond Index is an unmanaged, broad based index composed of U.S. dollardenominated, investment grade, fixed-rate taxable bonds with at least $250 million par amount outstanding and at least one year to final maturity. Duration is a measure of the sensitivity of the price of afixed income investment to changes in the general level of interest rates. Effective Duration considers that expected cash flows will fluctuate as interest rates change. Standard deviation measures thevolatility of the fund’s returns, calculated for the trailing 3 years. Higher deviation represents higher volatility. Sharpe ratio uses a fund’s standard deviation and its excess return (difference between thefund’s return and the risk free return of the 90-day Treasury Bills) to determine reward per unit of risk, calculated for the trailing 3 years. Upside/Downside Capture ratios measure a fund’s performancein up/down markets relative to the performance of the benchmark. An up market is defined as any period (month or quarter) where the market’s return is greater than zero. The higher the Upside Captureratio, the better the fund protected capital during a positive market. A down market is defined as any period (month or quarter) where the market’s return is less than zero. The lower the Downside Captureratio, the better the fund protected capital during a market decline. Alpha is the excess return over the index, calculated for the trailing 3 years. Beta is a measure of the volatility, or systematic risk, of aportfolio in comparison to the market as a whole. A beta of 1.00 is equal to that of the market; a beta lower than 1.00 indicates lower volatility than the market, while a beta greater than 1.00 indicateshigher volatility than the market.
Insight does not provide tax or legal advice to its clients and all investors are strongly urged to consult their tax and legal advisors regarding any potential strategy or investment.
© 2020 Insight Investment. All rights reserved. Distributed by IMST Distributors, LLC CRN: 2019-0416-7377 R Link 5924
Important Disclosures27
Insight and BNY Mellon Securities Corporation (BNYMSC) are subsidiaries of BNY Mellon. BNYMSC is a registered broker and FINRA member. BNY Mellon is the corporate brand of the Bank of New York Mellon Corporation and may also be used as a generic term to reference the Corporation as a whole or its various subsidiaries generally. Products and services may be provided under various brand names and in various countries by subsidiaries, affiliates and joint ventures of the Bank of New York Mellon Corporation where authorized and regulated as required within each jurisdiction. Unless you are notified to the contrary, the products and services mentioned are not insured by the FDIC (or by any government entity) and are not guaranteed by or obligations of the Bank of New York Mellon Corporation or any of its affiliates. The Bank of New York Mellon Corporation assumes no responsibility for the accuracy or completeness of the above data and disclaims all expressed or implied warranties in connection there with.