Embed Size (px)
Citation preview
AAPA Planning for Shifting TradePerspectives on Infrastructure Investment
Marianela Dengo - De ObaldíaManager, Strategic Relations
February 2017
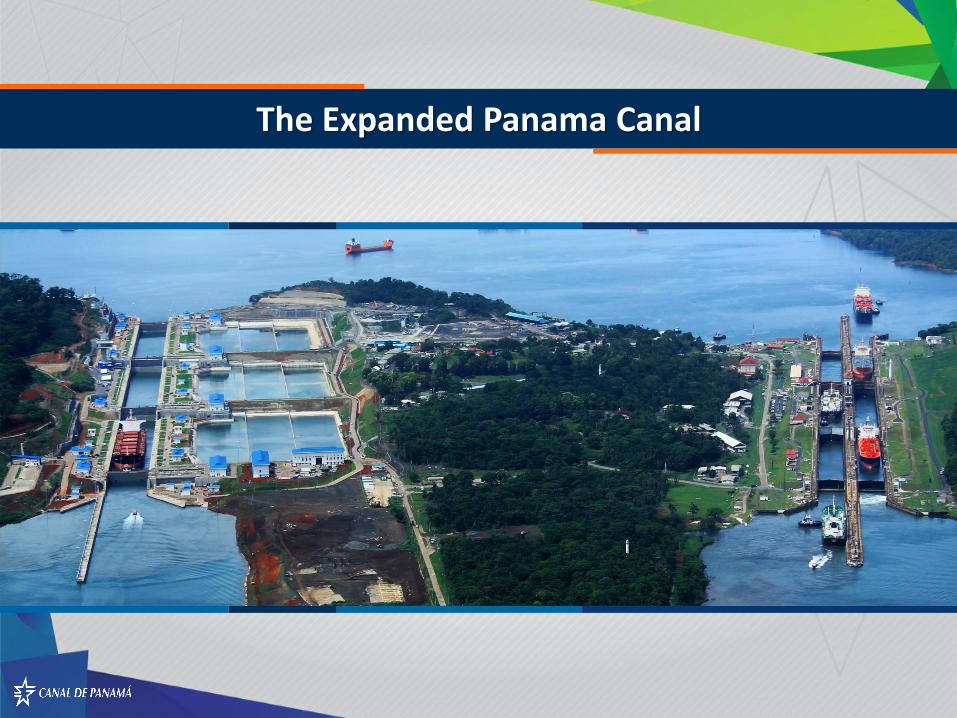
The Expanded Panama Canal
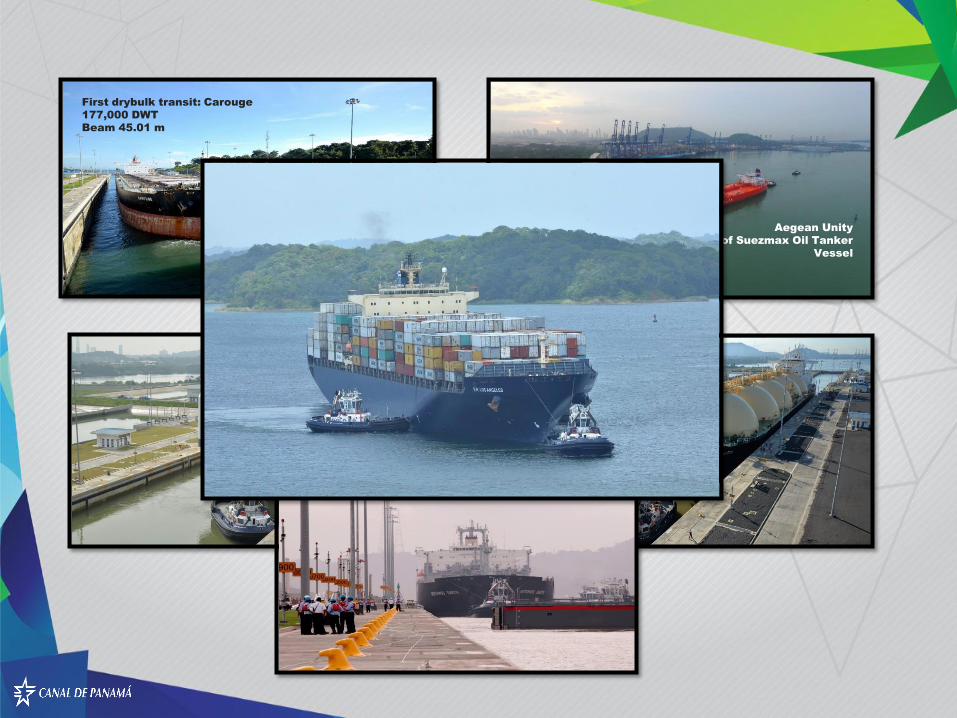
First drybulk transit: Carouge
177,000 DWT
Beam 45.01 m
Aegean Unity
First transit of Suezmax Oil Tanker
Vessel
0; 0.0%
0; 0.0%
0; 0.0%
0; 0.0%
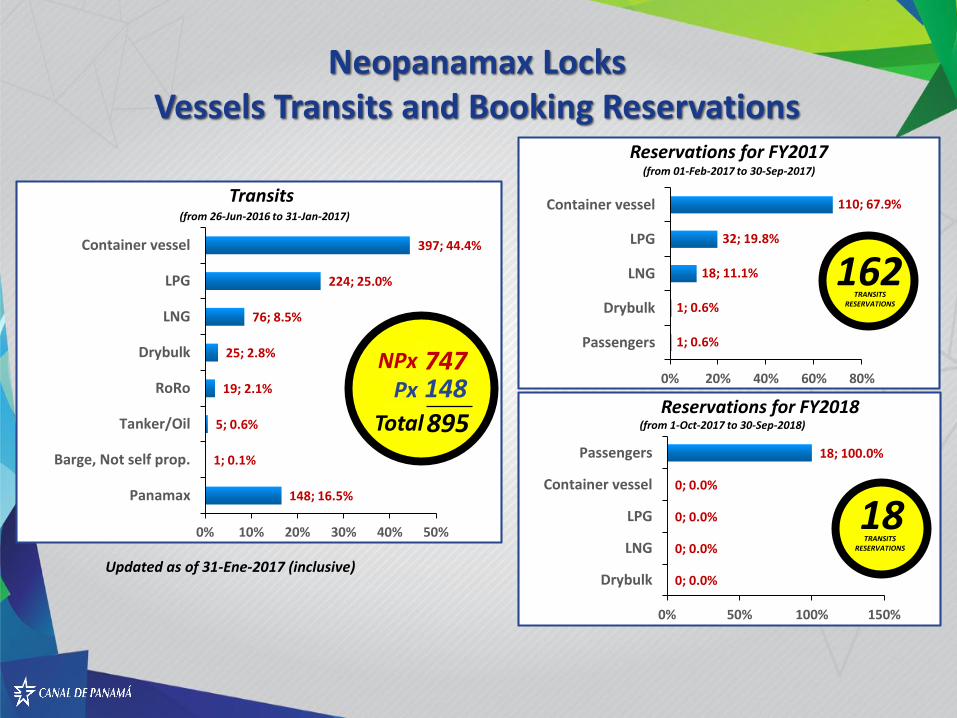
18; 100.0%
Drybulk
LNG
LPG
Container vessel
Passengers
0% 50% 100% 150%
1; 0.6%
1; 0.6%
18; 11.1%
32; 19.8%
110; 67.9%
Passengers
Drybulk
LNG
LPG
Container vessel
0% 20% 40% 60% 80%
148; 16.5%
1; 0.1%
5; 0.6%
19; 2.1%
25; 2.8%
76; 8.5%
224; 25.0%
397; 44.4%
Panamax
Barge, Not self prop.
Tanker/Oil
RoRo
Drybulk
LNG
LPG
Container vessel
0% 10% 20% 30% 40% 50%
(from 01-Feb-2017 to 30-Sep-2017)
(from 1-Oct-2017 to 30-Sep-2018)
Updated as of 31-Ene-2017 (inclusive)
(from 26-Jun-2016 to 31-Jan-2017)
162
18
TRANSITSRESERVATIONS
TRANSITSRESERVATIONS
Reservations for FY2017
Reservations for FY2018
Transits
NPxPx 148
747
895Total
Neopanamax Locks Vessels Transits and Booking Reservations
Shanghai
Hong Kong
Mobile
Busan
Singapore
Chiwan
Ningbo Houston
Jacksonville
Manzanillo
Manzanillo, MexKingston P. Caucedo
Manzanillo
Ensenada
Cartagena Port of Spain
Kingston
Halifax
Savannah
Norfolk
New York
Los AngelesOakland
Boston
Wilmington (NC)
Miami
Philadelphia
RotterdamTilbury
Le HavreDunkirk
Chalmers
MelbourneSydney
TaurangaNapier
Auckland
Southampton
Bremerhaven
VancouverSeattle
Long Beach
LeghornBarcelona
Genoa
Valencia Cagliari
Tanger Med
Sines
Callao
Mejillones
San Antonio
Guayaquil
Buenaventura
San VicenteCoronel
Balboa
Cristobal
Busan
Vostochniy
Papeete
Noumea
TokyoYokohama
NagoyaKobe
Commercial RouteNo. of
Services
Annual
Capacity in
one direction
No. of
Vessels
Average
Vessel
Size
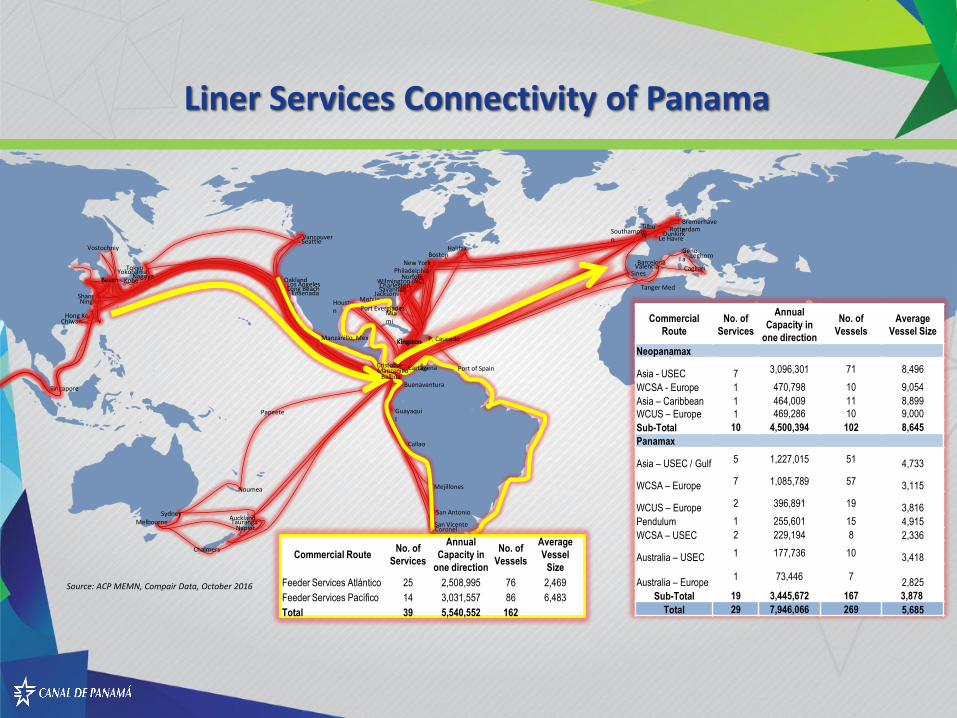
Feeder Services Atlántico 25 2,508,995 76 2,469
Feeder Services Pacífico 14 3,031,557 86 6,483
Total 39 5,540,552 162
Source: ACP MEMN, Compair Data, October 2016
Charleston
Port Everglades
Commercial
Route
No. of
Services
Annual
Capacity in
one direction
No. of
Vessels
Average
Vessel Size
Neopanamax
Asia - USEC 7 3,096,301 71 8,496
WCSA - Europe 1 470,798 10 9,054
Asia – Caribbean
WCUS – Europe
1
1
464,009
469,286
11
10
8,899
9,000
Sub-Total 10 4,500,394 102 8,645
Panamax
Asia – USEC / Gulf 5 1,227,015 51 4,733
WCSA – Europe 7 1,085,789 57 3,115
WCUS – Europe 2 396,891 19 3,816
Pendulum 1 255,601 15 4,915
WCSA – USEC 2 229,194 8 2,336
Australia – USEC 1 177,736 10 3,418
Australia – Europe1 73,446 7
2,825
Sub-Total 19 3,445,672 167 3,878
Total 29 7,946,066 269 5,685
Liner Services Connectivity of Panama
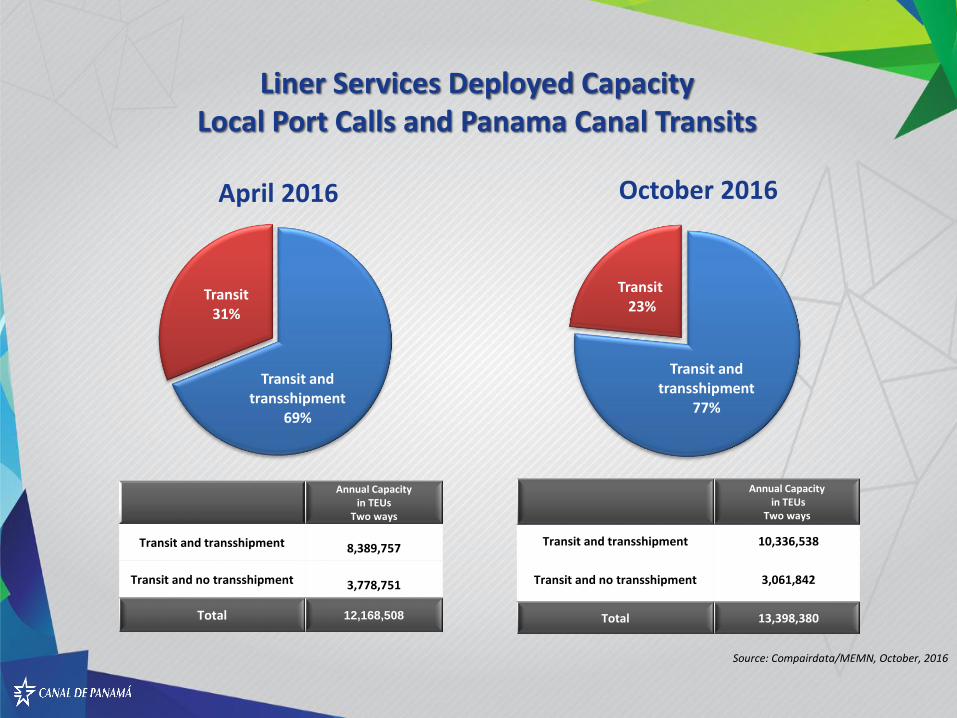
Transit and transshipment
69%
Transit31%
April 2016
Annual Capacity in TEUs
Two ways
Transit and transshipment 8,389,757
Transit and no transshipment 3,778,751
Total 12,168,508
Source: Compairdata/MEMN, October, 2016
Transit and transshipment
77%
Transit23%
October 2016
Annual Capacityin TEUs
Two ways
Transit and transshipment 10,336,538
Transit and no transshipment 3,061,842
Total 13,398,380
Liner Services Deployed Capacity Local Port Calls and Panama Canal Transits
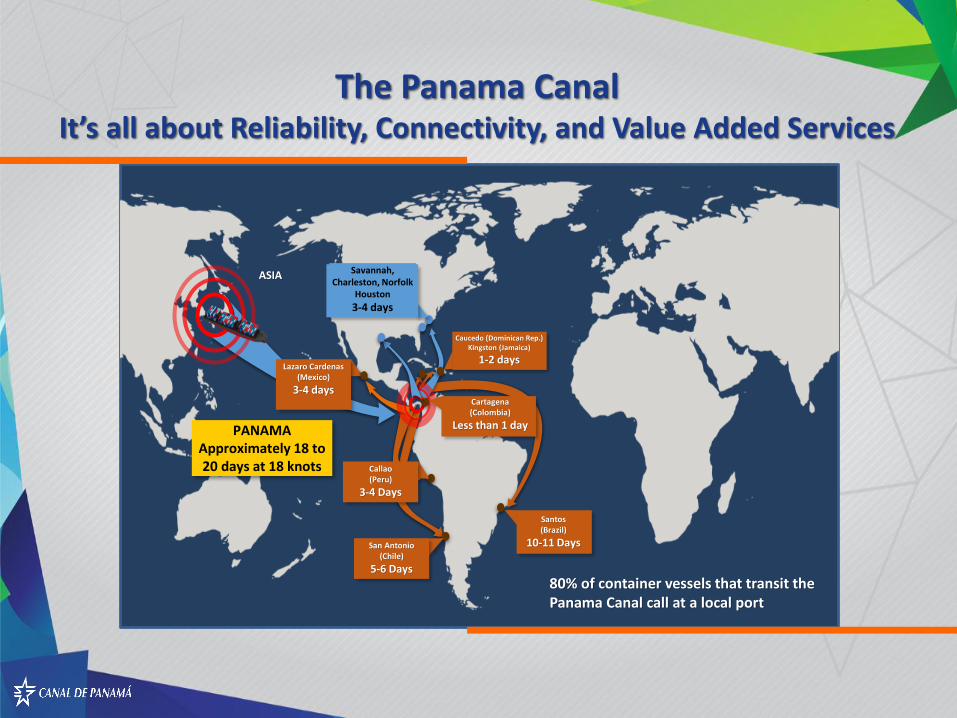
ASIA
PANAMA Approximately 18 to 20 days at 18 knots
Cartagena(Colombia)
Less than 1 day
Lazaro Cardenas (Mexico)
3-4 days
Caucedo (Dominican Rep.)Kingston (Jamaica)
1-2 days
Savannah, Charleston, Norfolk
Houston
3-4 days
Santos(Brazil)
10-11 Days
Callao(Peru)
3-4 Days
San Antonio(Chile)
5-6 Days
80% of container vessels that transit the Panama Canal call at a local port
The Panama CanalIt’s all about Reliability, Connectivity, and Value Added Services
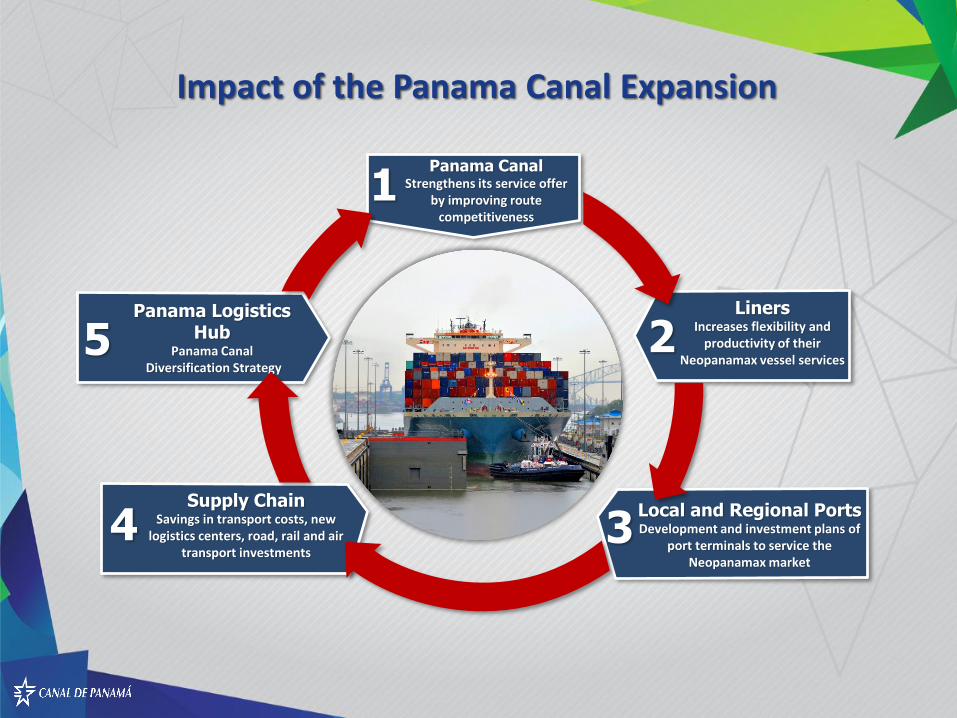
Panama Logistics Hub
Panama CanalDiversification Strategy
5Liners
Increases flexibility and productivity of their
Neopanamax vessel services2
Local and Regional Ports Development and investment plans of
port terminals to service the Neopanamax market
3Supply Chain
Savings in transport costs, new logistics centers, road, rail and air
transport investments 4
Panama CanalStrengthens its service offer
by improving route competitiveness
1
Impact of the Panama Canal Expansion
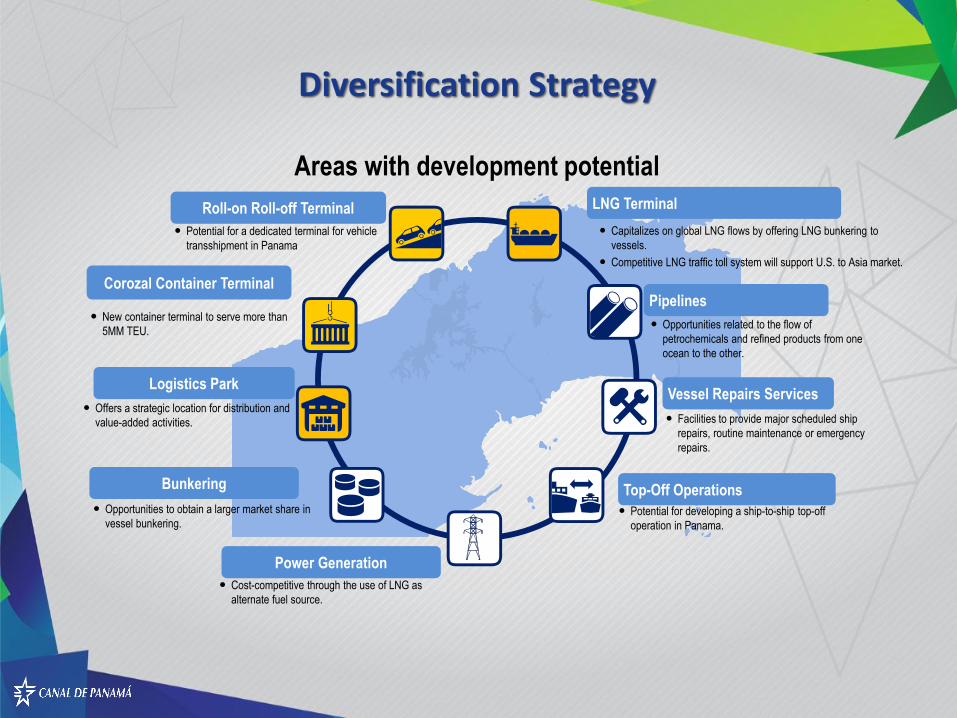
Corozal Container Terminal
New container terminal to serve more than
5MM TEU.
LNG Terminal
Capitalizes on global LNG flows by offering LNG bunkering to
vessels.
Competitive LNG traffic toll system will support U.S. to Asia market.
Pipelines
Opportunities related to the flow of
petrochemicals and refined products from one
ocean to the other.
Vessel Repairs Services
Facilities to provide major scheduled ship
repairs, routine maintenance or emergency
repairs.
Top-Off Operations
Potential for developing a ship-to-ship top-off
operation in Panama.
Power Generation
Cost-competitive through the use of LNG as
alternate fuel source.
Logistics Park
Offers a strategic location for distribution and
value-added activities.
Bunkering
Opportunities to obtain a larger market share in
vessel bunkering.
Roll-on Roll-off Terminal
Potential for a dedicated terminal for vehicle
transshipment in Panama
Areas with development potential
Diversification Strategy
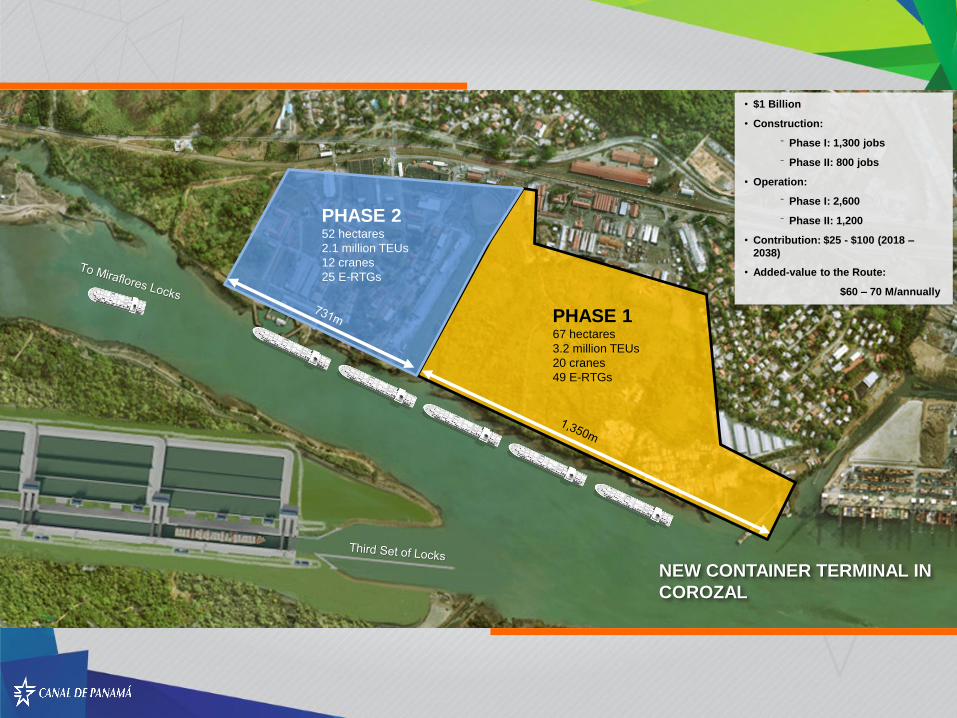
NEW CONTAINER TERMINAL IN
COROZAL
PHASE 167 hectares
3.2 million TEUs
20 cranes
49 E-RTGs
PHASE 252 hectares
2.1 million TEUs
12 cranes
25 E-RTGs
• $1 Billion
• Construction:
⁻ Phase I: 1,300 jobs
⁻ Phase II: 800 jobs
• Operation:
⁻ Phase I: 2,600
⁻ Phase II: 1,200
• Contribution: $25 - $100 (2018 –
2038)
• Added-value to the Route:
$60 – 70 M/annually
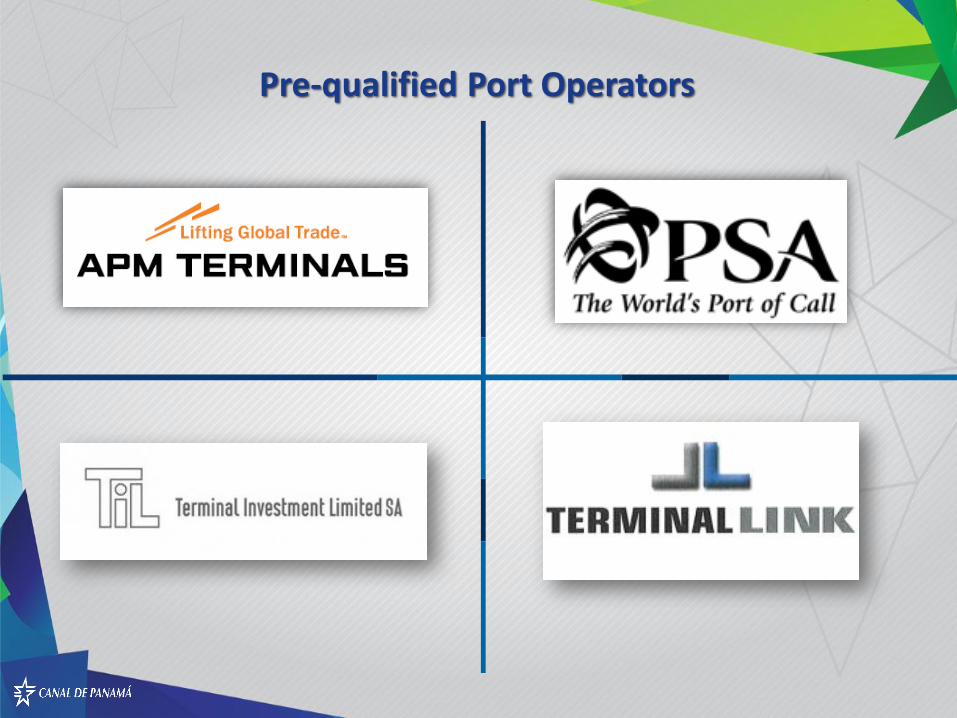
Pre-qualified Port Operators
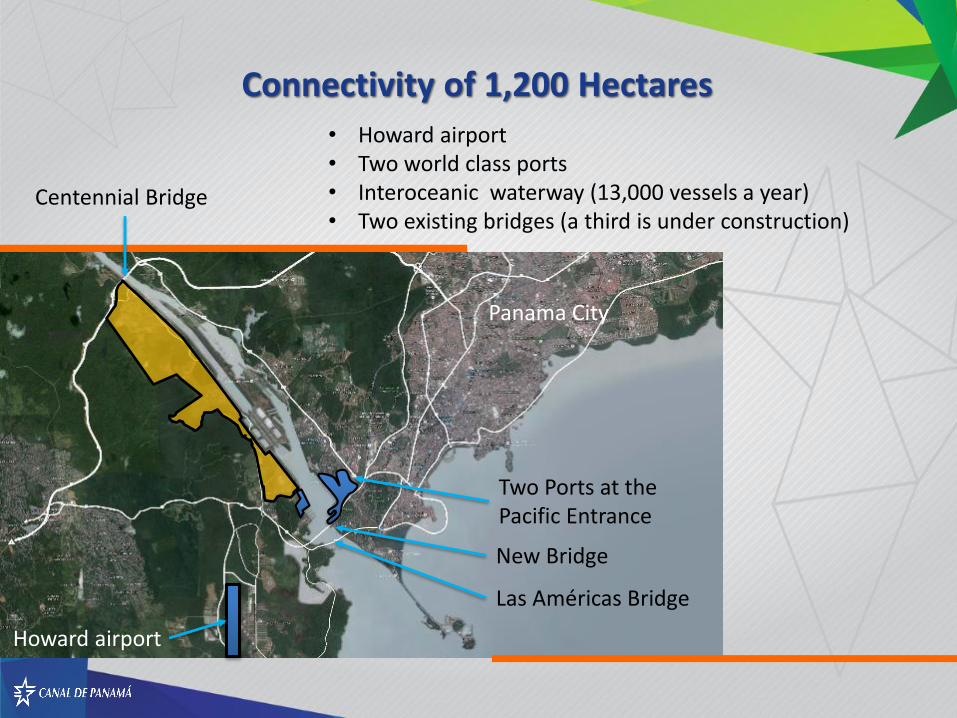
Las Américas Bridge
Centennial Bridge
Panama City
New Bridge
• Howard airport• Two world class ports• Interoceanic waterway (13,000 vessels a year)• Two existing bridges (a third is under construction)
Howard airport
Two Ports at the Pacific Entrance
Connectivity of 1,200 Hectares
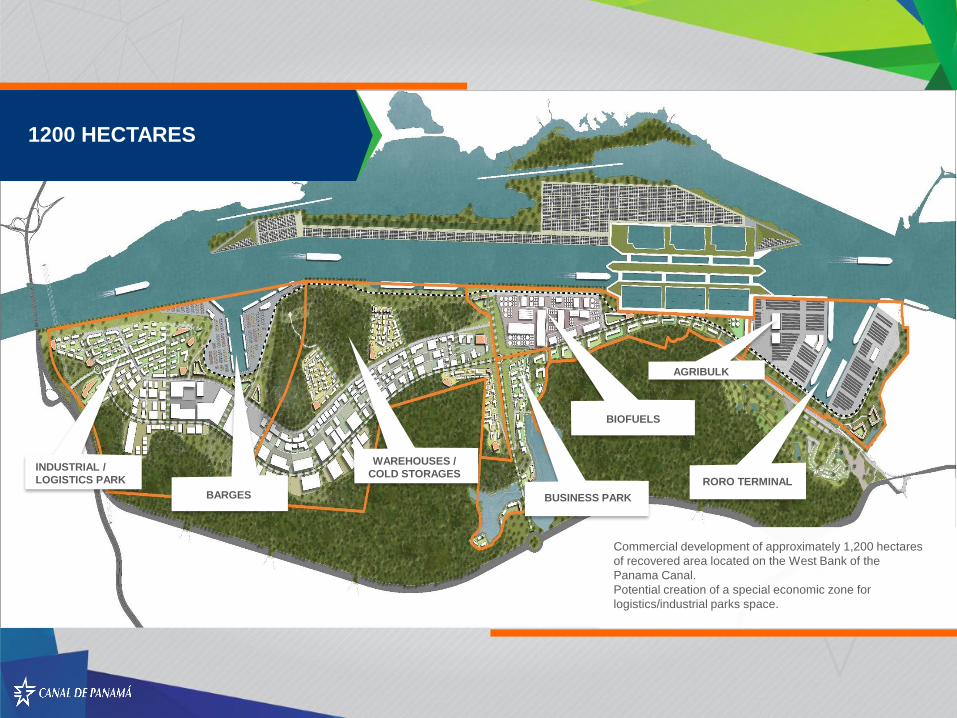
1200 HECTARES
Commercial development of approximately 1,200 hectares
of recovered area located on the West Bank of the
Panama Canal.
Potential creation of a special economic zone for
logistics/industrial parks space.
INDUSTRIAL /
LOGISTICS PARK
BARGES
WAREHOUSES /
COLD STORAGES
BIOFUELS
RORO TERMINAL
AGRIBULK
BUSINESS PARK
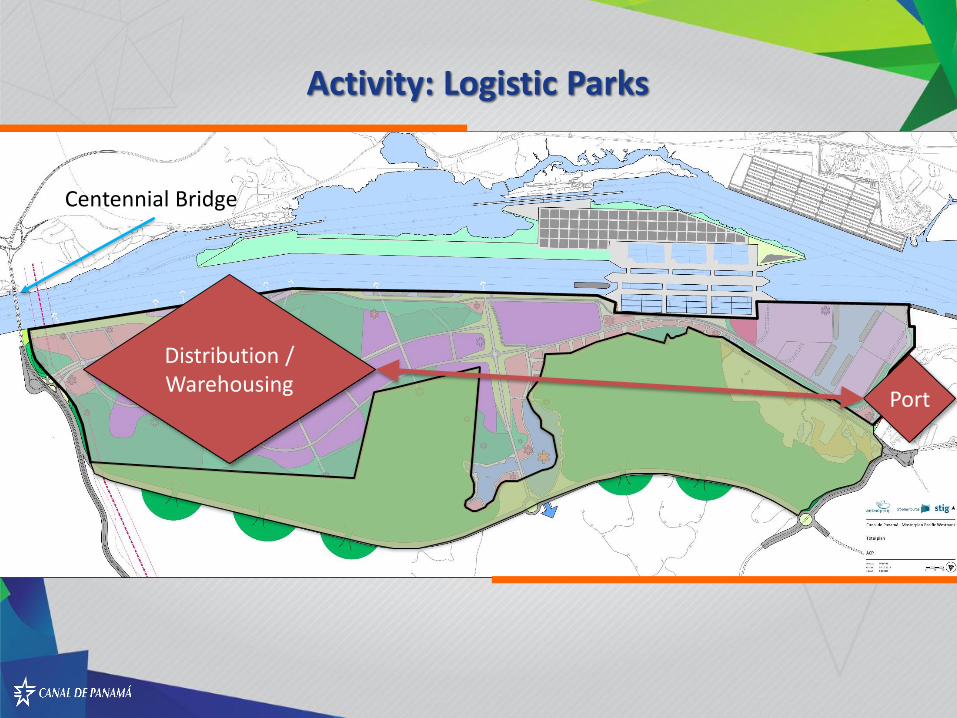
Activity: Logistic Parks
Distribution /Warehousing
Port
Centennial Bridge
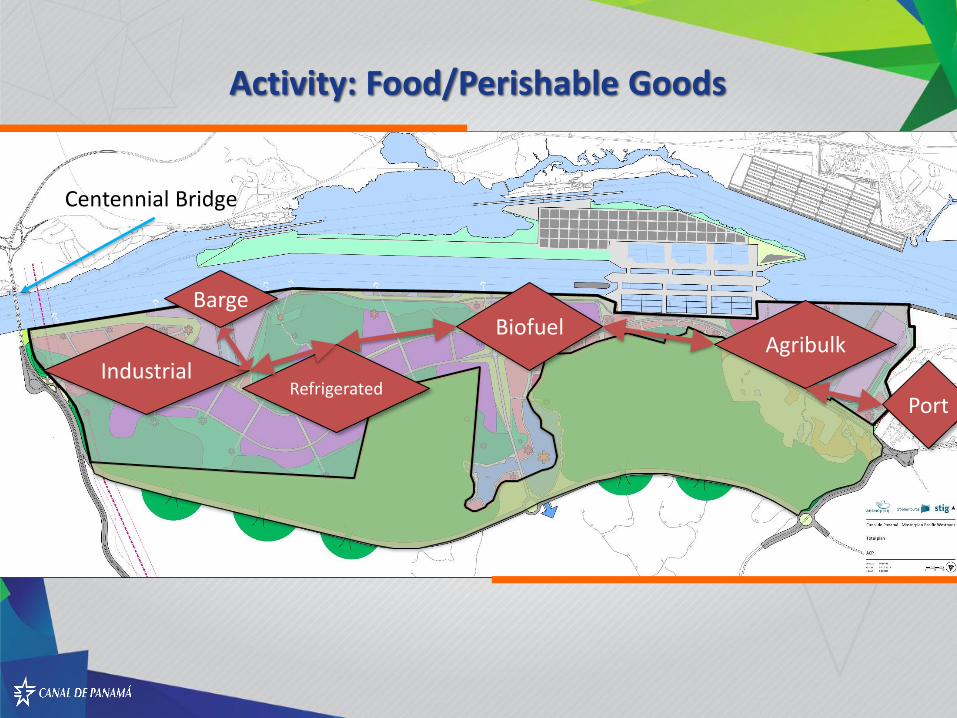
Industrial
BiofuelAgribulk
PortRefrigerated
Barge
Centennial Bridge
Activity: Food/Perishable Goods
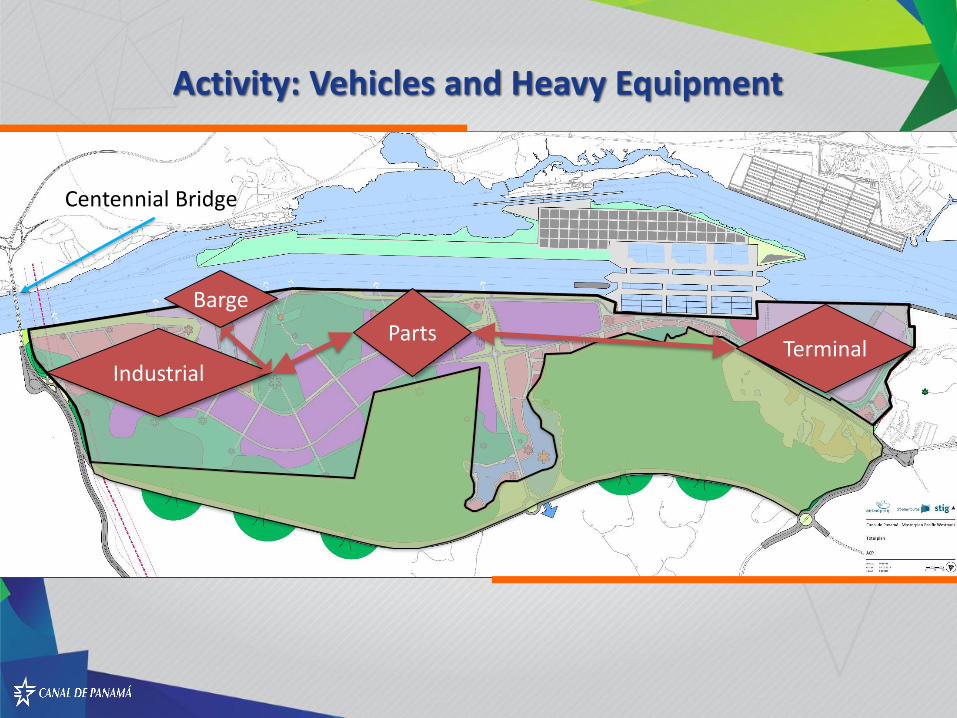
Industrial
PartsTerminal
Barge
Centennial Bridge
Activity: Vehicles and Heavy Equipment
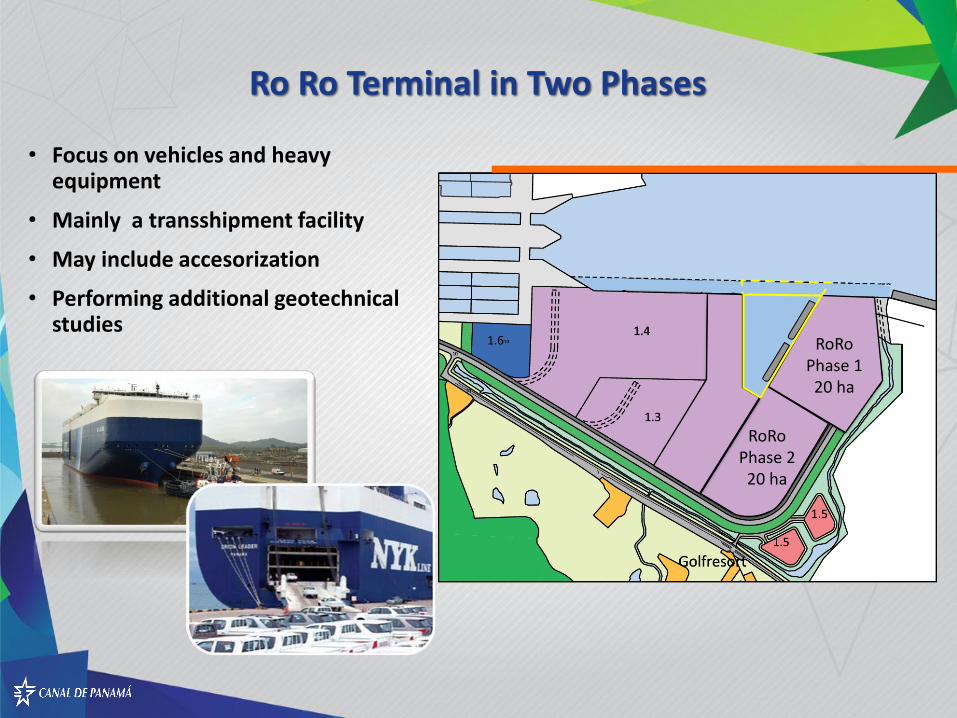
RoRoPhase 120 ha
RoRoPhase 220 ha
• Focus on vehicles and heavy equipment
• Mainly a transshipment facility
• May include accesorization
• Performing additional geotechnical studies
Ro Ro Terminal in Two Phases
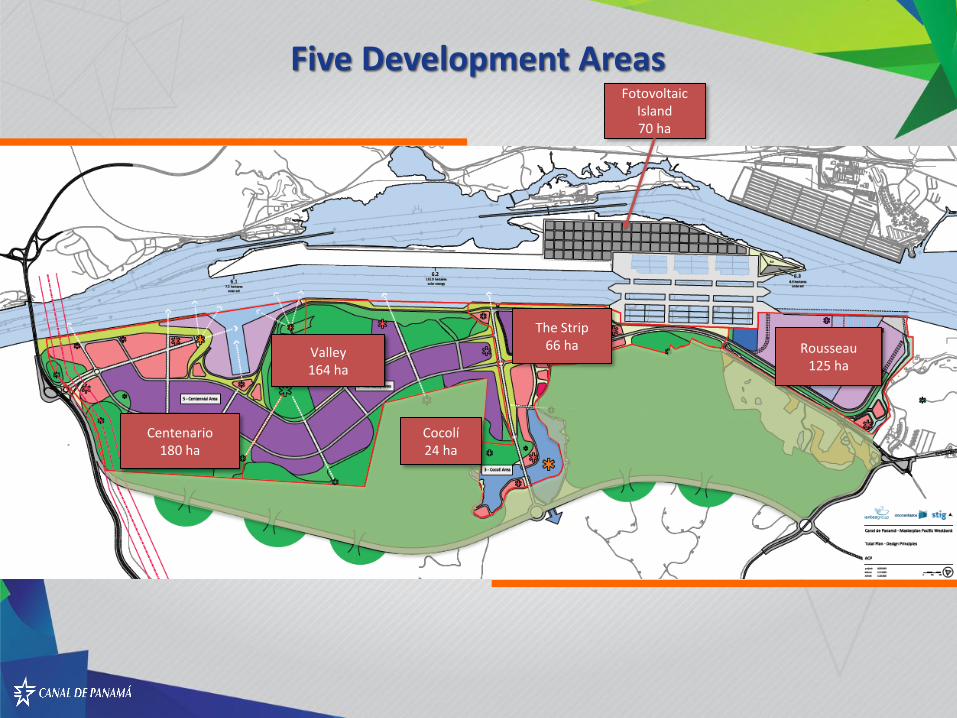
Cocolí24 ha
The Strip66 haValley
164 ha
Centenario180 ha
Rousseau125 ha
Fotovoltaic Island 70 ha
Five Development Areas
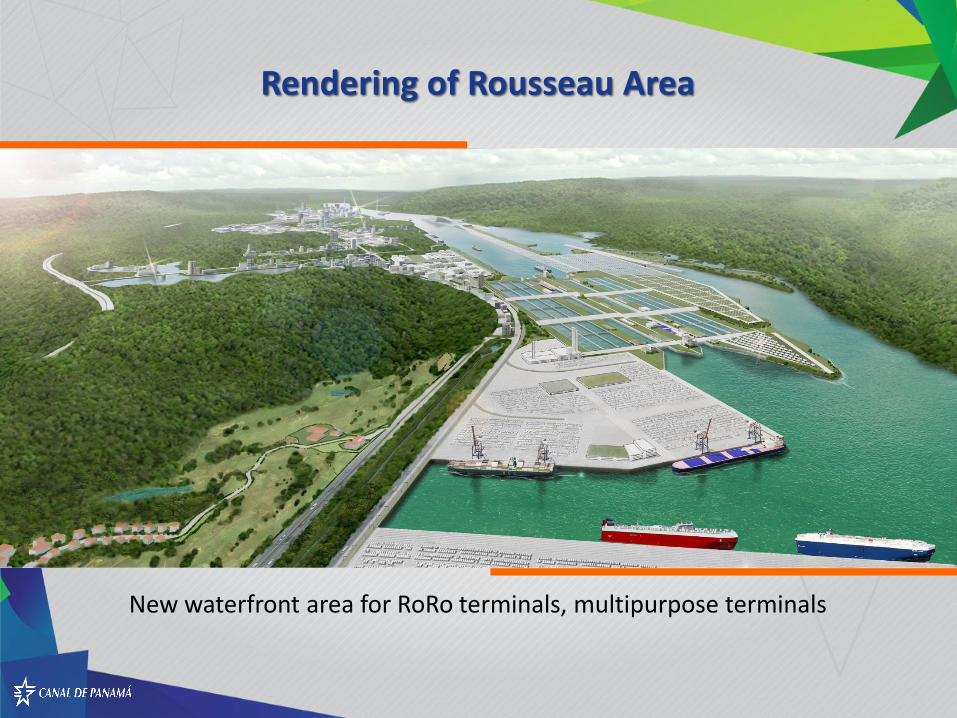
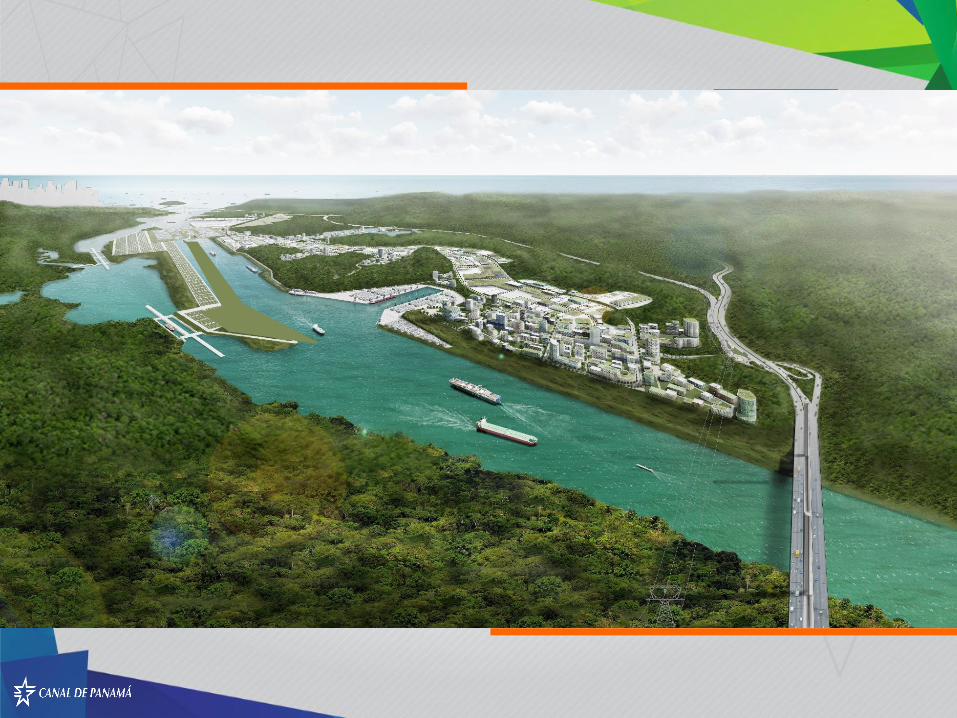
New waterfront area for RoRo terminals, multipurpose terminals
Rendering of Rousseau Area
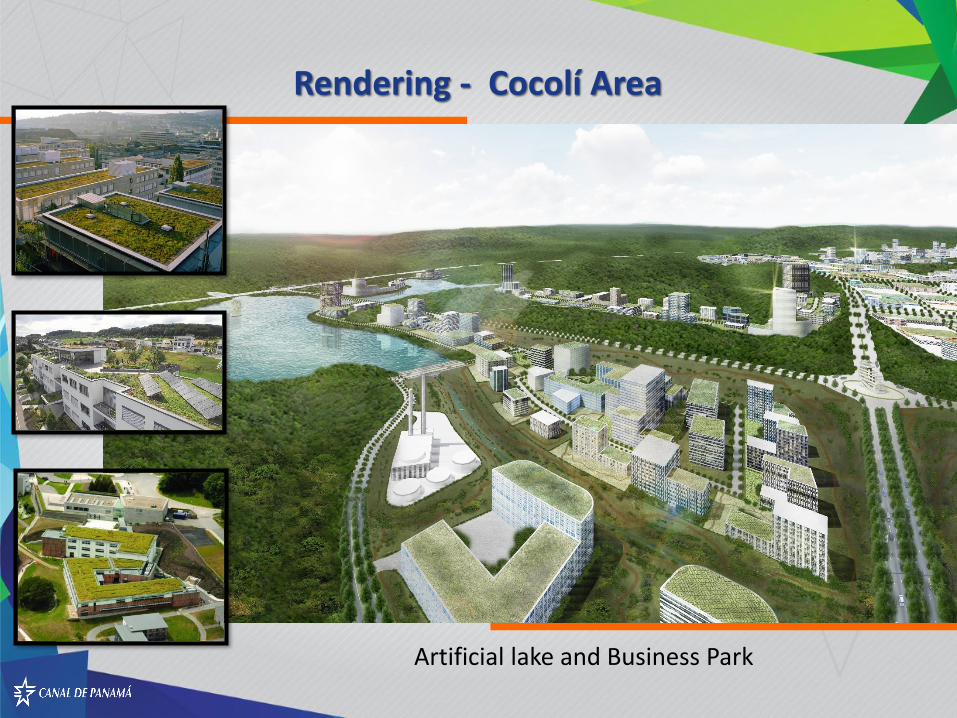
Artificial lake and Business Park
Rendering - Cocolí Area
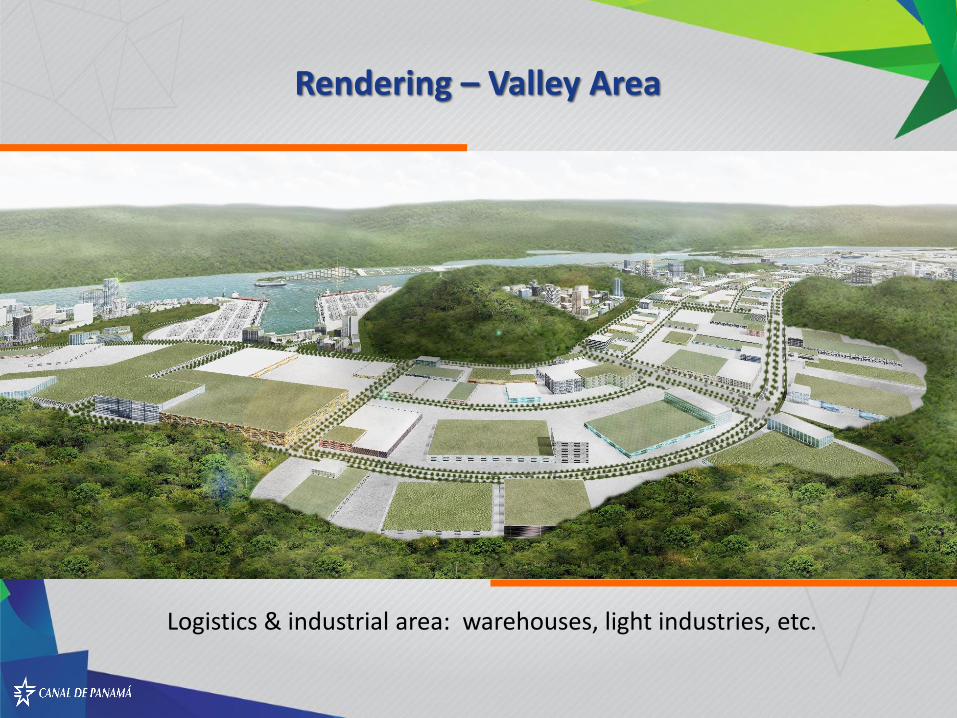
Logistics & industrial area: warehouses, light industries, etc.
Rendering – Valley Area
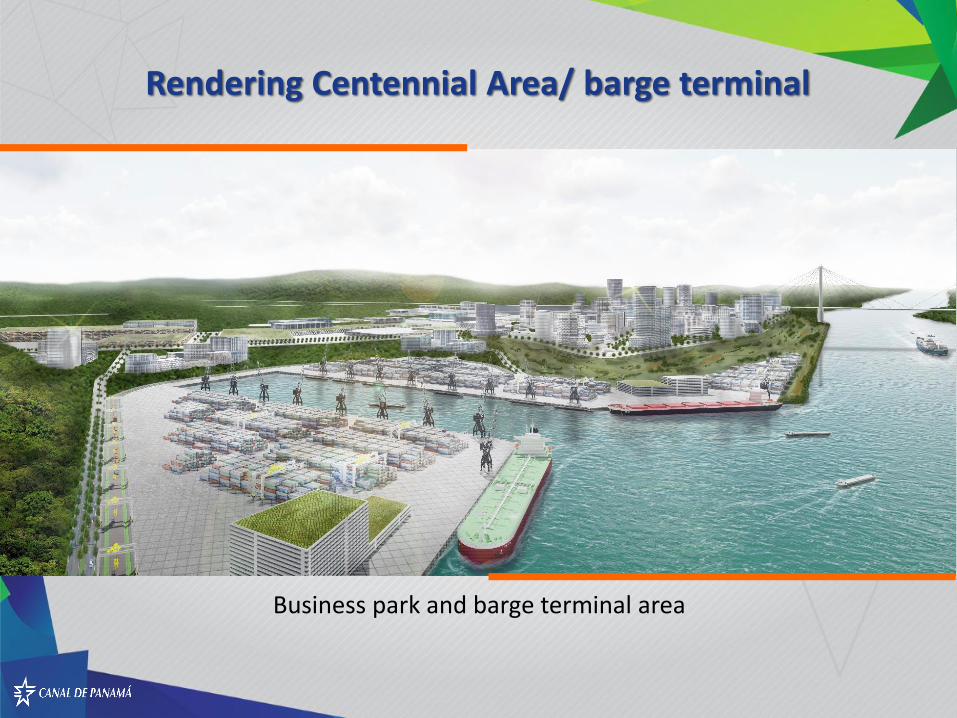
Business park and barge terminal area
Rendering Centennial Area/ barge terminal
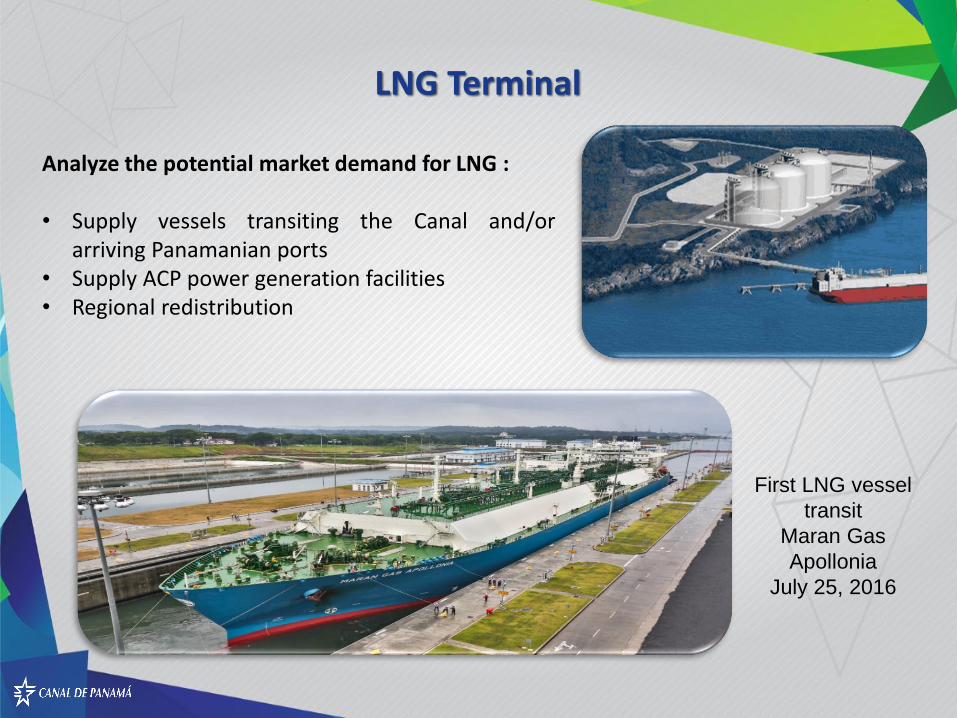
Analyze the potential market demand for LNG :
• Supply vessels transiting the Canal and/orarriving Panamanian ports
• Supply ACP power generation facilities• Regional redistribution
First LNG vessel
transit
Maran Gas
Apollonia
July 25, 2016
LNG Terminal
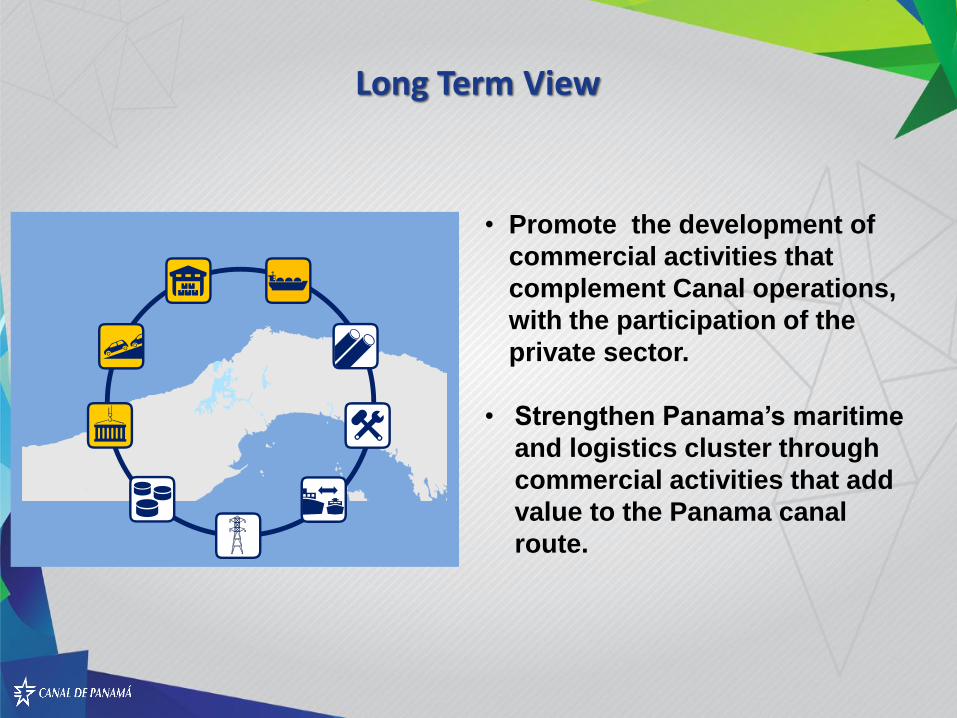
• Promote the development of
commercial activities that
complement Canal operations,
with the participation of the
private sector.
• Strengthen Panama’s maritime
and logistics cluster through
commercial activities that add
value to the Panama canal
route.
684910_1.WOR NY008RBR
Long Term View