Embed Size (px)
Citation preview
AARP Public Policy InstituteJanuary 27, 2009
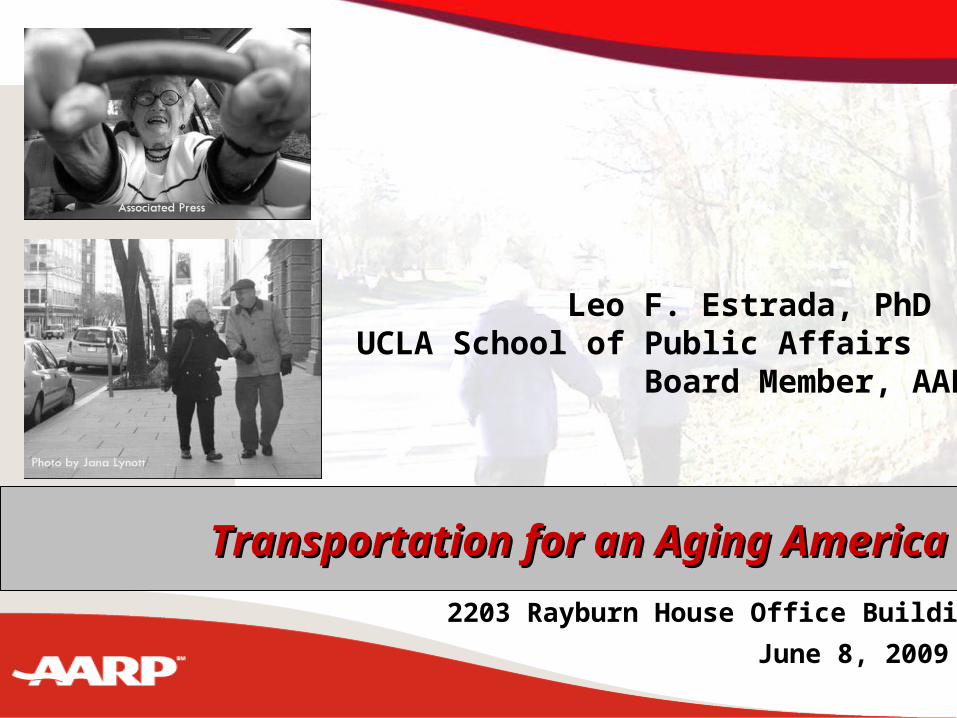
Transportation for an Aging AmericaTransportation for an Aging America
Leo F. Estrada, PhDUCLA School of Public Affairs Board Member, AARP
June 8, 2009
2203 Rayburn House Office Building
Livable Communities
A livable community is one that has affordable and appropriate housing, supportive community features and services, adequate mobility options, which together facilitate personal independence and the engagement of residents in civic and social life.
AARP’s Livable Communities Goal for Mobility
Americans 50+ are able to sustain mobility as they age
More communities increase affordable and accessible mobility and housing options and community services to meet the needs of the 50+ population through engagement and influence of local level decision makers
Mobility Matters
• Transportation connects individuals with economic, social, cultural and civic activities
• Essential to maintain independence, freedom and emotional well-being
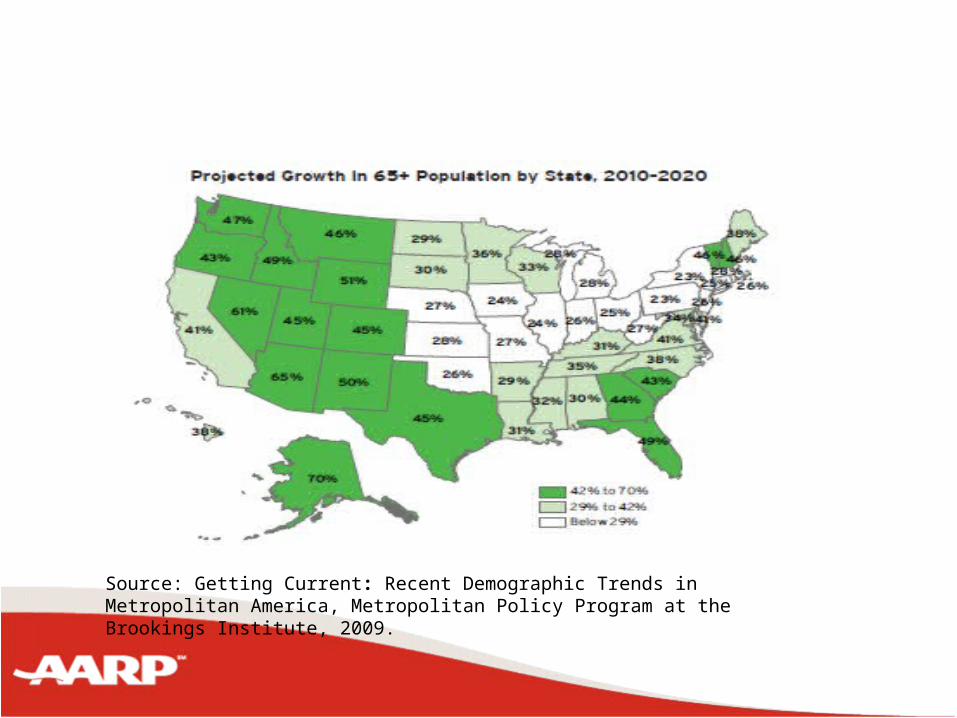
Source: Getting Current: Recent Demographic Trends in Metropolitan America, Metropolitan Policy Program at the Brookings Institute, 2009.
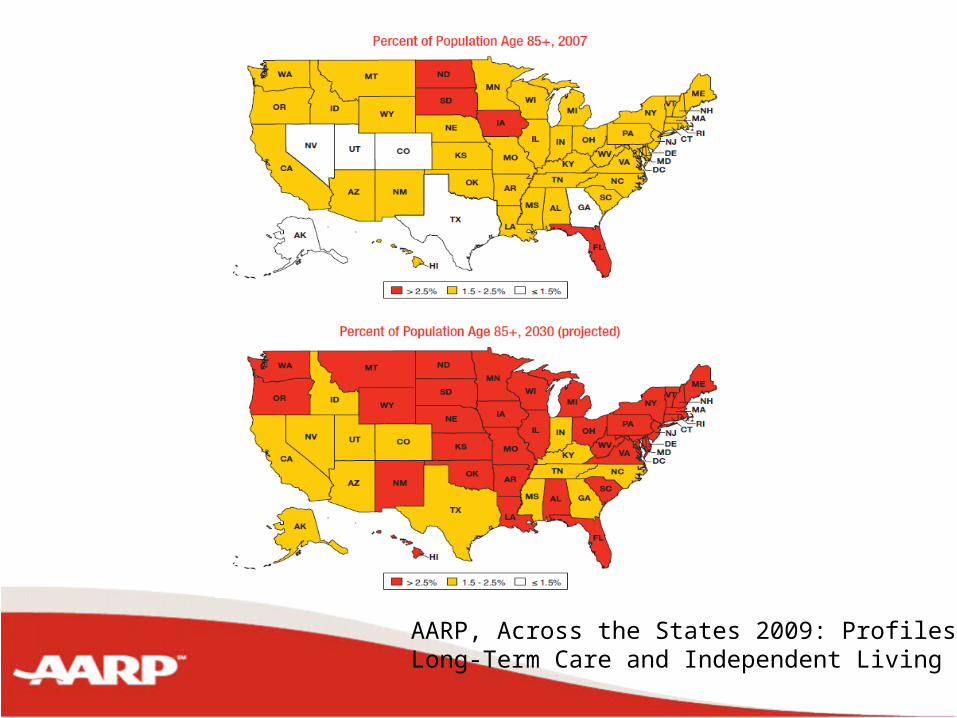
AARP, Across the States 2009: Profiles of Long-Term Care and Independent Living
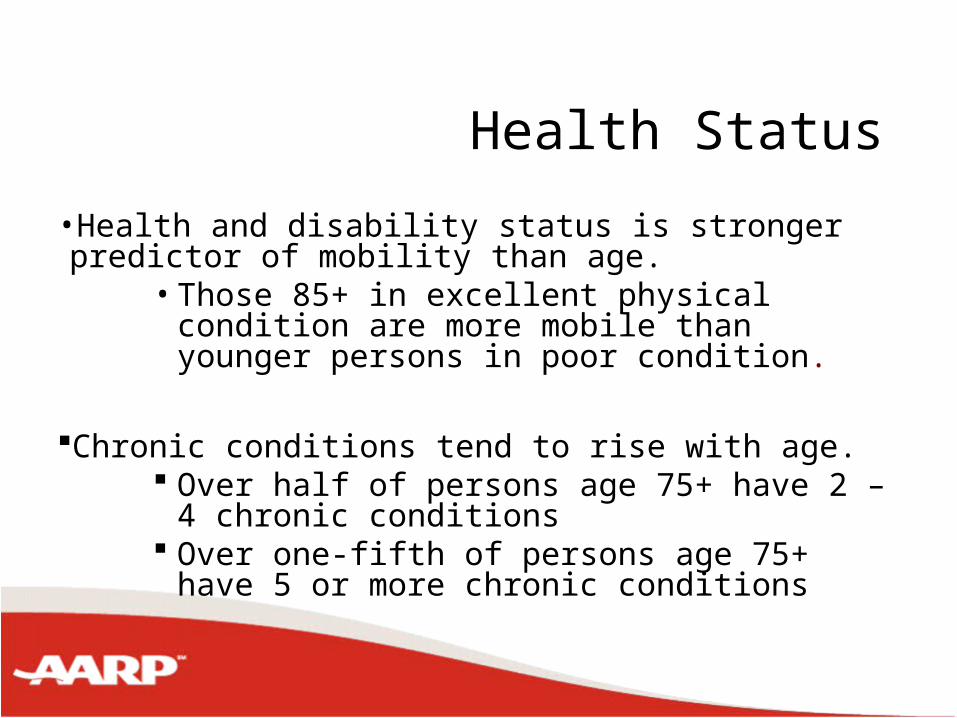
•Health and disability status is stronger predictor of mobility than age.
• Those 85+ in excellent physical condition are more mobile than younger persons in poor condition.
Chronic conditions tend to rise with age. Over half of persons age 75+ have 2 – 4 chronic
conditions Over one-fifth of persons age 75+ have 5 or more
chronic conditions
Health Status
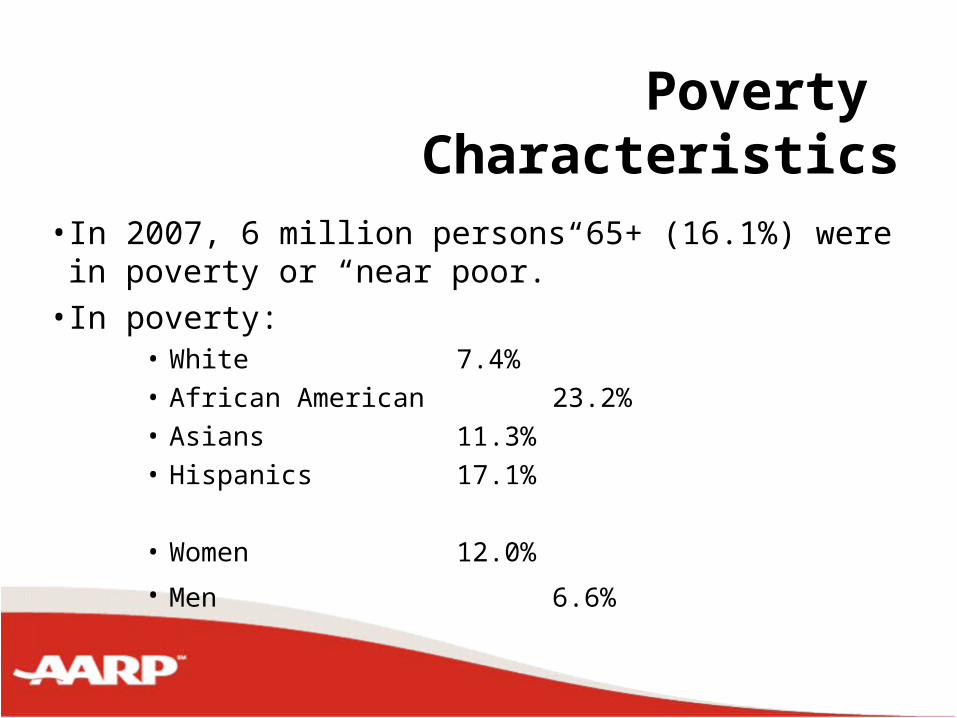
Poverty Characteristics
• In 2007, 6 million persons 65+ (16.1%) were in poverty or “near poor.”
• In poverty:• White 7.4% • African American 23.2%• Asians 11.3%• Hispanics 17.1%
• Women 12.0%
• Men 6.6%
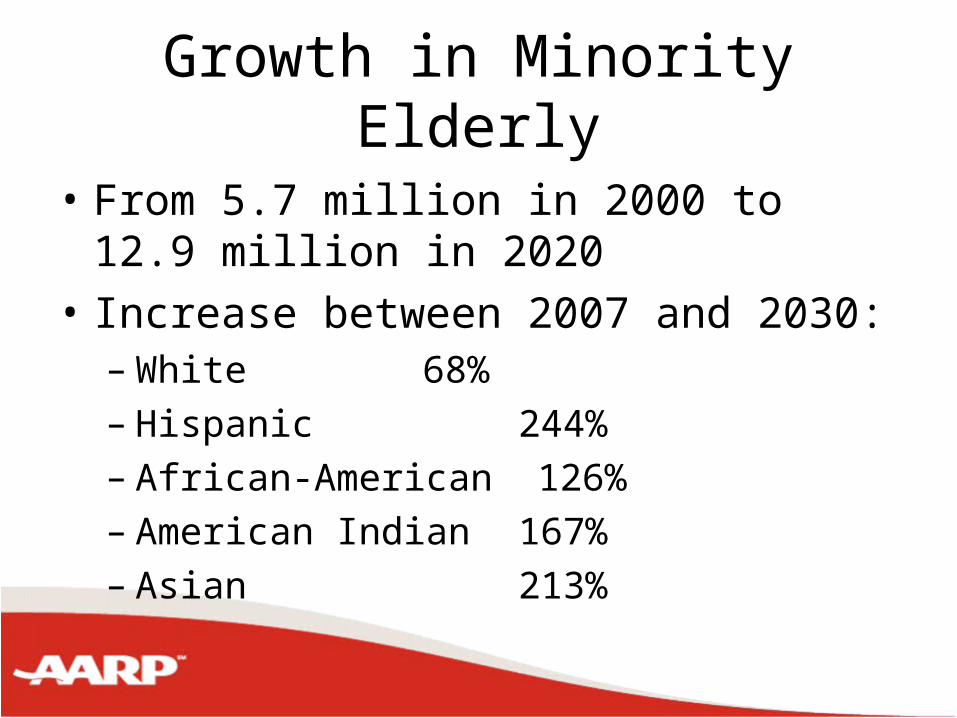
Growth in Minority Elderly
• From 5.7 million in 2000 to 12.9 million in 2020
• Increase between 2007 and 2030:– White 68%– Hispanic 244%– African-American 126%– American Indian 167%– Asian 213%
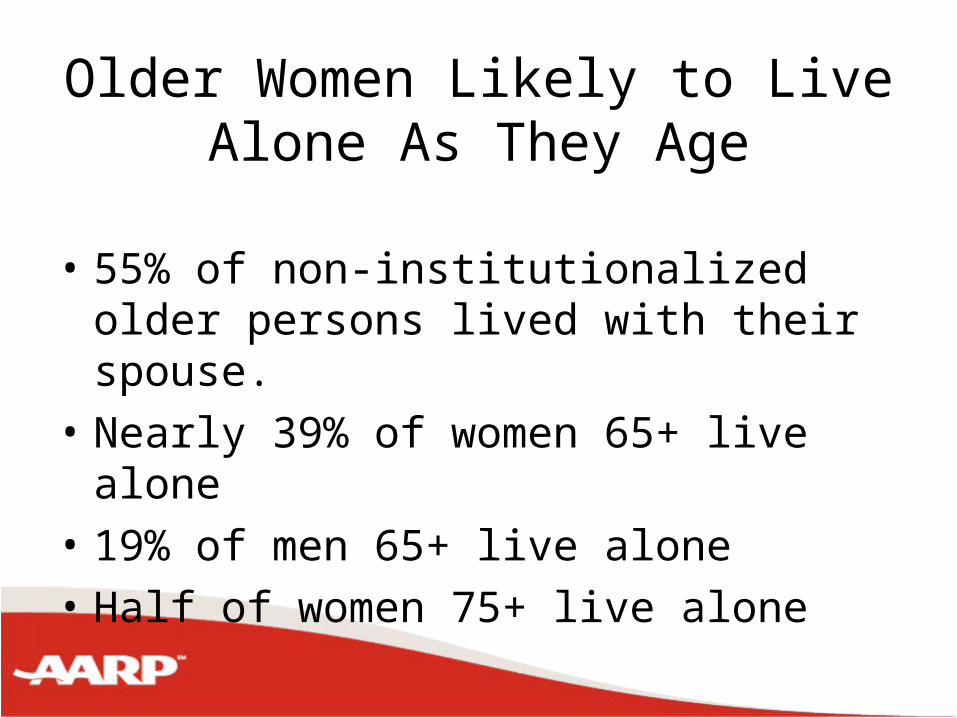
Older Women Likely to Live Alone As They Age
• 55% of non-institutionalized older persons lived with their spouse.
• Nearly 39% of women 65+ live alone
• 19% of men 65+ live alone
• Half of women 75+ live alone
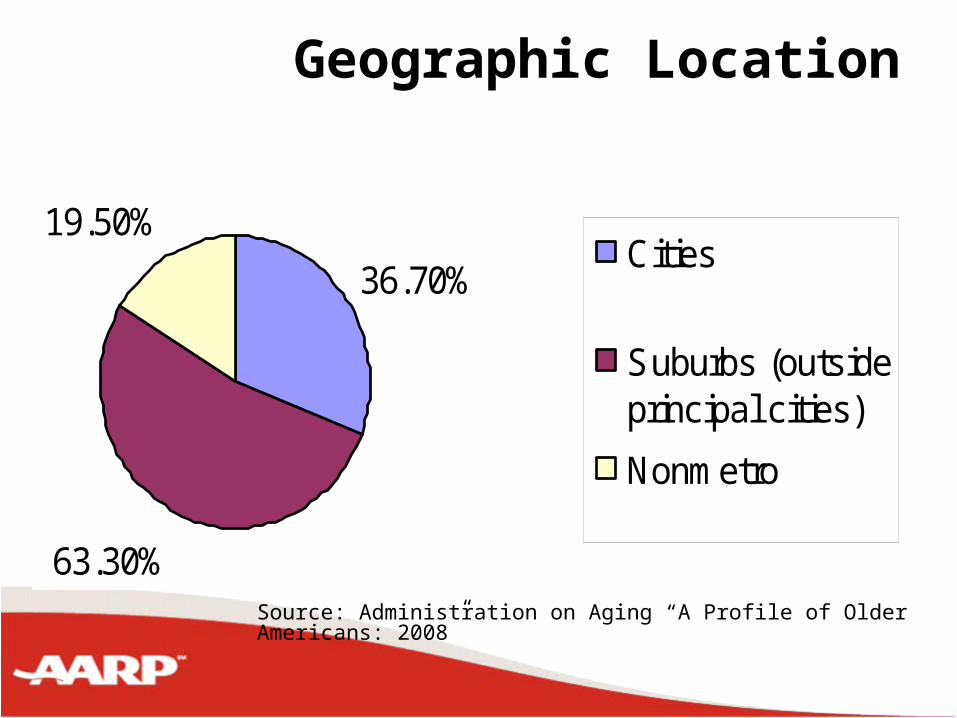
Geographic Location
Source: Administration on Aging “A Profile of Older Americans: 2008”
36.70%
63.30%
19.50%Cities
Suburbs (outsideprincipal cities)
Nonmetro
Suburban America• America is largely suburbanized• Evolved around trolley, rail and highway access• Housing tracts were once mini-communities but
eventually bedroom communities (housing without services)
• Dispersed housing (sprawl) led to the car-dependence
• What happens when you get older in a car dependent culture?
Growth of First Suburbs
• Home to nearly 20% of US population • Older population increased nearly twice as
fast in first suburbs as the nation as a whole from 1950 – 2000
• “Non-families,” including the elderly living alone, are most prevalent household type
• Highest % of elderly in Rust Belt• Highest # of elderly in NY, Boston,
Chicago and LA metro areas Source: One-Fifth of America, Brookings, 2006
Rural Challenges• Persons age 60 and older account for nearly
one-third of rural riders— far more than their 19% share of the rural population.
• Nearly 75% of households in rural areas do not have access to public transportation.
• Medical trips are a particular need.
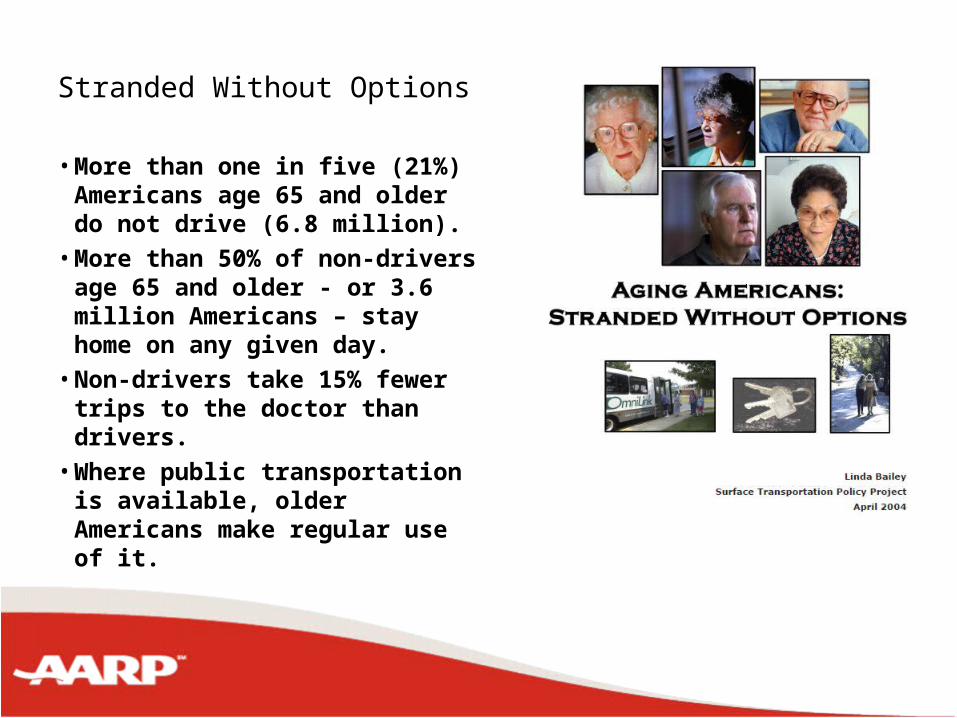
Stranded Without Options
• More than one in five (21%) Americans age 65 and older do not drive (6.8 million).
• More than 50% of non-drivers age 65 and older - or 3.6 million Americans – stay home on any given day.
• Non-drivers take 15% fewer trips to the doctor than drivers.
• Where public transportation is available, older Americans make regular use of it.
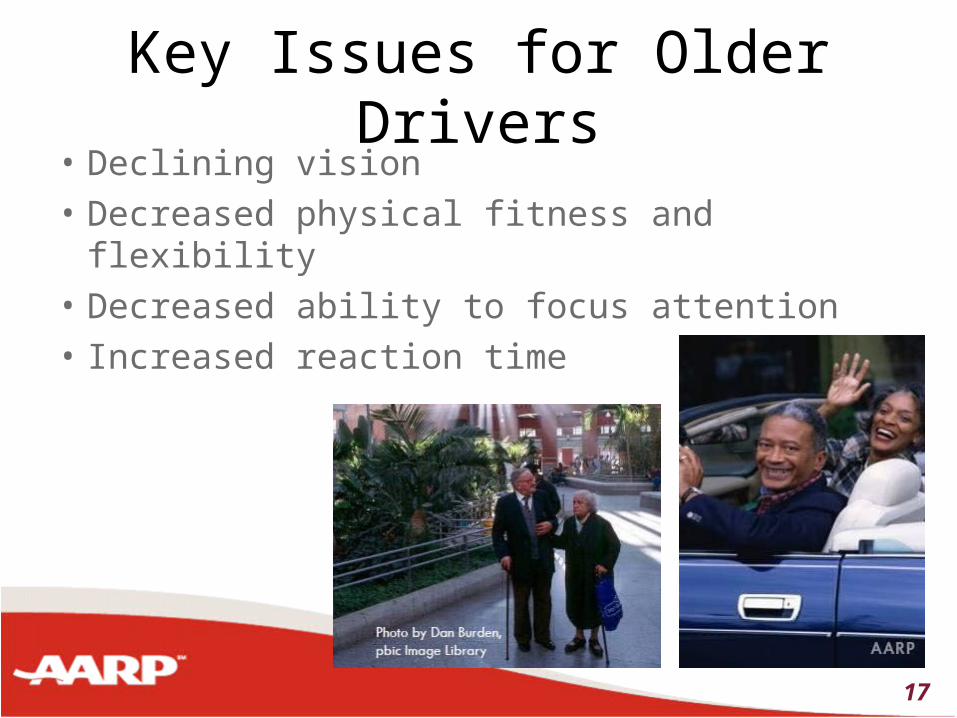
Key Issues for Older Drivers• Declining vision
• Decreased physical fitness and flexibility
• Decreased ability to focus attention
• Increased reaction time
17
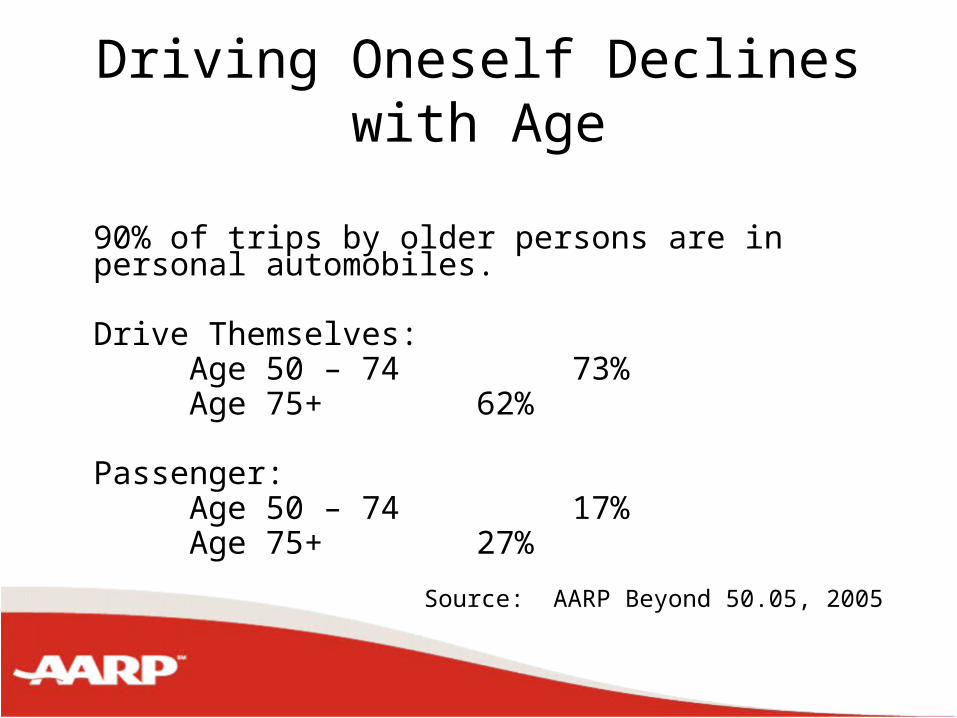
Driving Oneself Declines with Age
90% of trips by older persons are in personal automobiles.
Drive Themselves:Age 50 – 74 73%Age 75+ 62%
Passenger:Age 50 – 74 17%Age 75+ 27%
Source: AARP Beyond 50.05, 2005
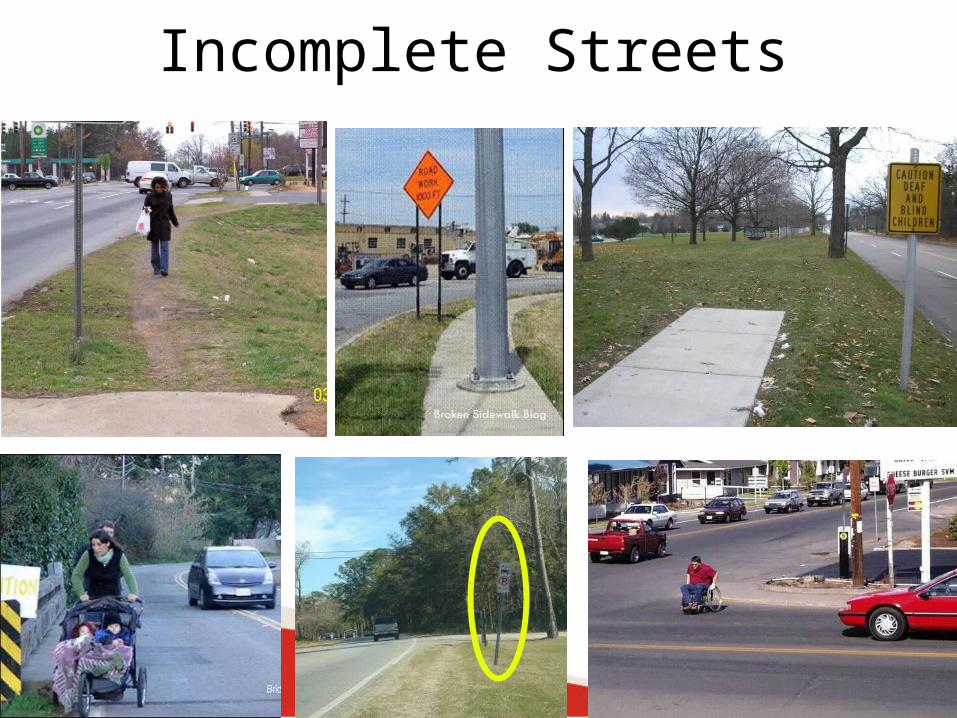
Incomplete Streets
Photograph from Edward Stollof
20
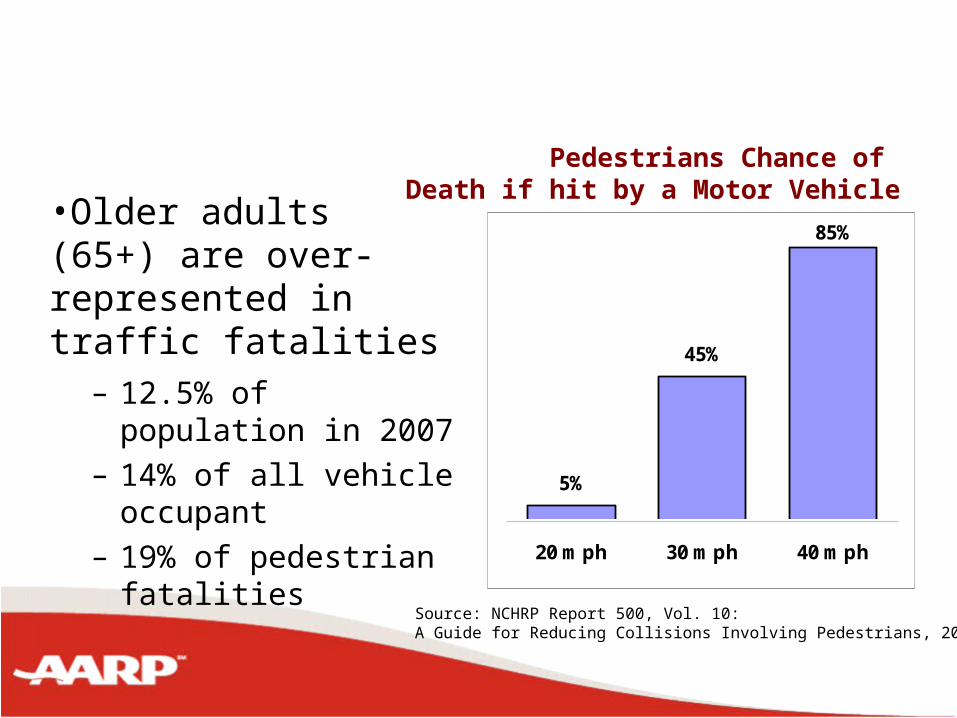
Pedestrians Chance of Death if hit by a Motor Vehicle
5%
45%
85%
20 mph 30 mph 40 mph
Source: NCHRP Report 500, Vol. 10: A Guide for Reducing Collisions Involving Pedestrians, 2004 .
•Older adults (65+) are over-represented in traffic fatalities
– 12.5% of population in 2007
– 14% of all vehicle occupant
– 19% of pedestrian fatalities
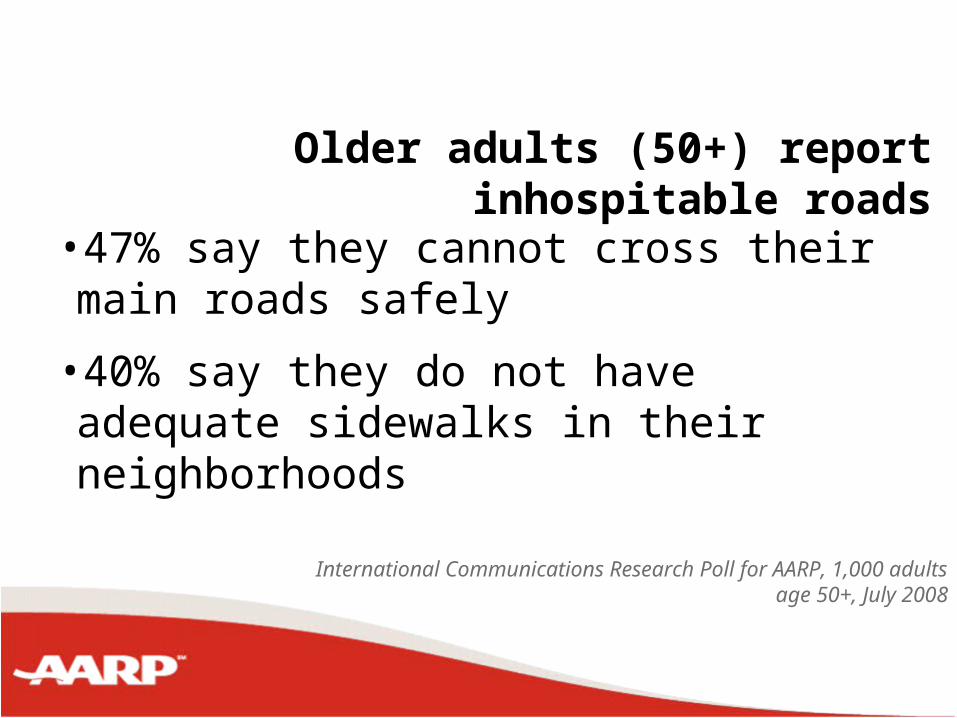
Older adults (50+) report inhospitable roads
•47% say they cannot cross their main roads safely
•40% say they do not have adequate sidewalks in their neighborhoods
International Communications Research Poll for AARP, 1,000 adults age 50+, July 2008
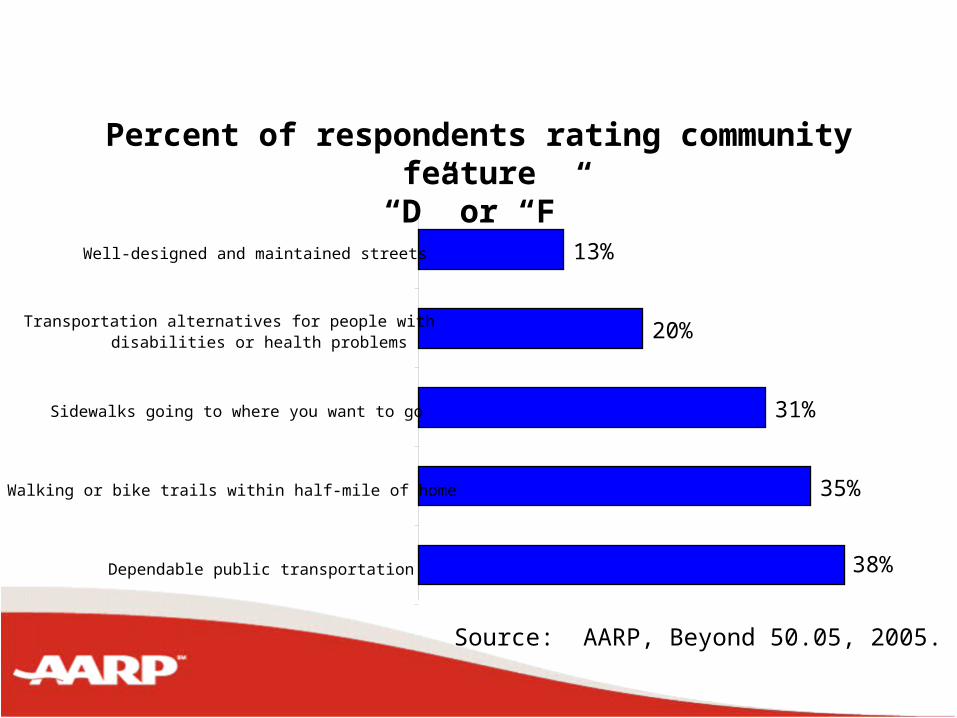
Percent of respondents rating community feature “D” or “F”
38%
35%
31%
20%
13%
Dependable public transportation
Walking or bike trails within half-mile of home
Sidewalks going to where you want to go
Transportation alternatives for people withdisabilities or health problems
Well-designed and maintained streets
Source: AARP, Beyond 50.05, 2005.
Our Communities are Unprepared
• 54%of American communities do not have the policies, program or services in place to promote quality of life, community engagement, and independent living of older adults (N4A survey of 10K local governments, 2006).
• 2/3 of planners and engineers have not yet begun considering the needs of older users in the multi-modal planning (AARP Public Policy Institute/ITE online survey of more than 1K planners & engineers, 2008).
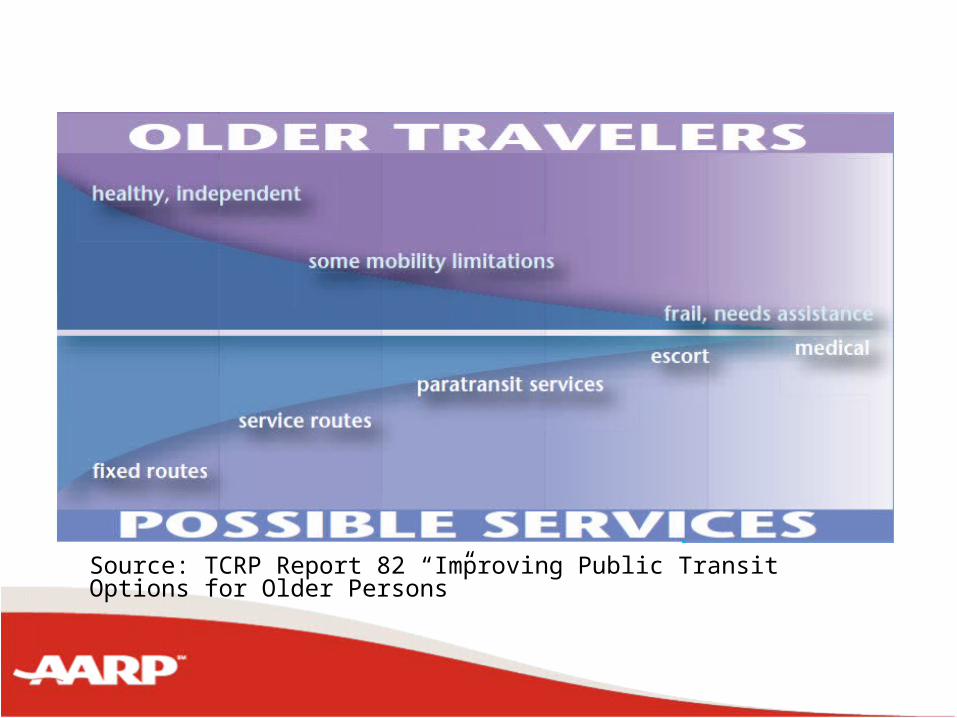
Source: TCRP Report 82 “Improving Public Transit Options for Older Persons”
Public Transportation Improvements
• Increased service reliability• Accessible vehicles, stations, and stops• Accessible service information• Travel training• Driver sensitivity training• Neighborhood circulators/service routes
Specialized Transportation
•A 2007 Promark Research poll found that 61% of Americans believe that our transportation system needs more “Dial a Ride” or other special forms of transportation for seniors and persons with disabilities.
– Respondents reported greater need for senior transportation than for roads, buses, bike trails, and sidewalks.
•Among those 65+, 71% believe that the transportation system needs more special forms of transportation for the seniors and persons with disabilities.
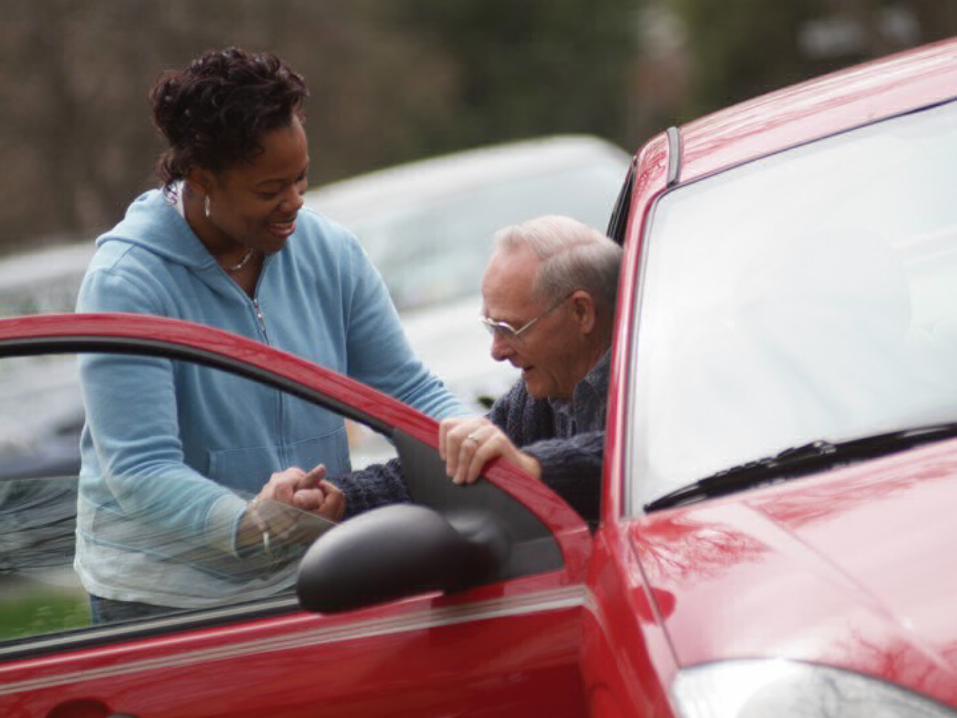
Volunteer Programs• As of 2007, there were at least 543 volunteer driver
programs.
• Benefits of volunteer driver programs• They operate where other services are not
available or not accessible by older adults• Generally less expensive• Provide services beyond what traditional
transportation services provide
Family of Travel Choices Are Needed
- Walking and Bicycling– Public Transportation – Paratransit– Human Services / Specialized Services– Non-emergency Medical Transportation– Volunteer Driver Programs − Safe Roads
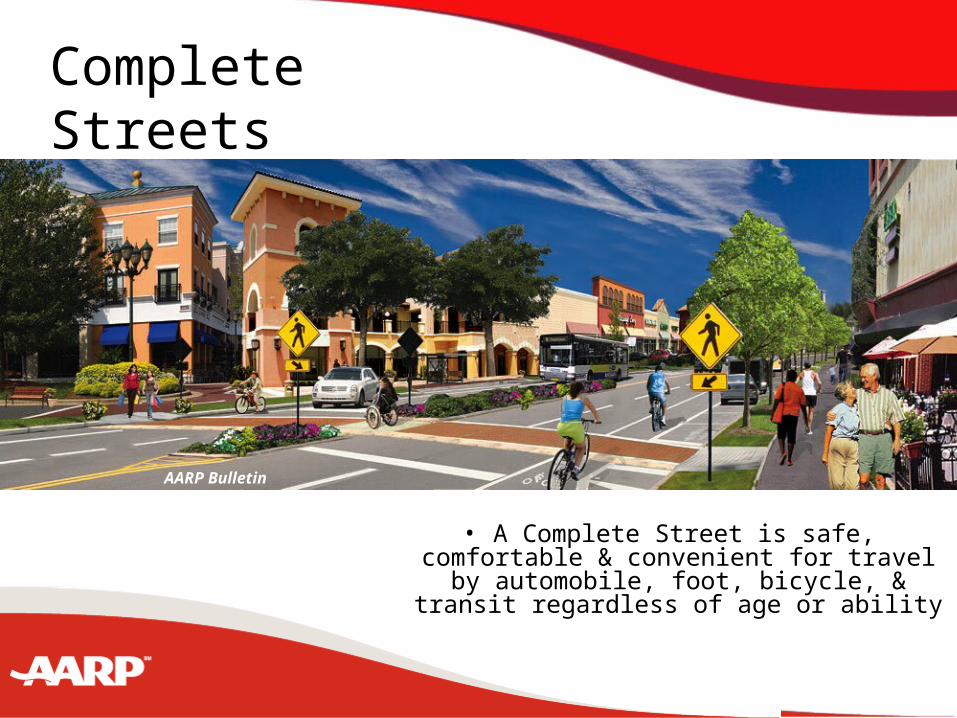
•A Complete Street is safe, comfortable & convenient for travel by
automobile, foot, bicycle, & transit regardless of age or ability
AARP Bulletin
Complete Streets
AARP Complete Streets Report Recommendations for FHWA Handbook
Update FHWA Handbook to:
• Provide greater focus on pedestrians
• Consider the effects of vehicle speed
• Acknowledge evolving state of the practice
• Address different land use contexts
AARP Bulletin
34
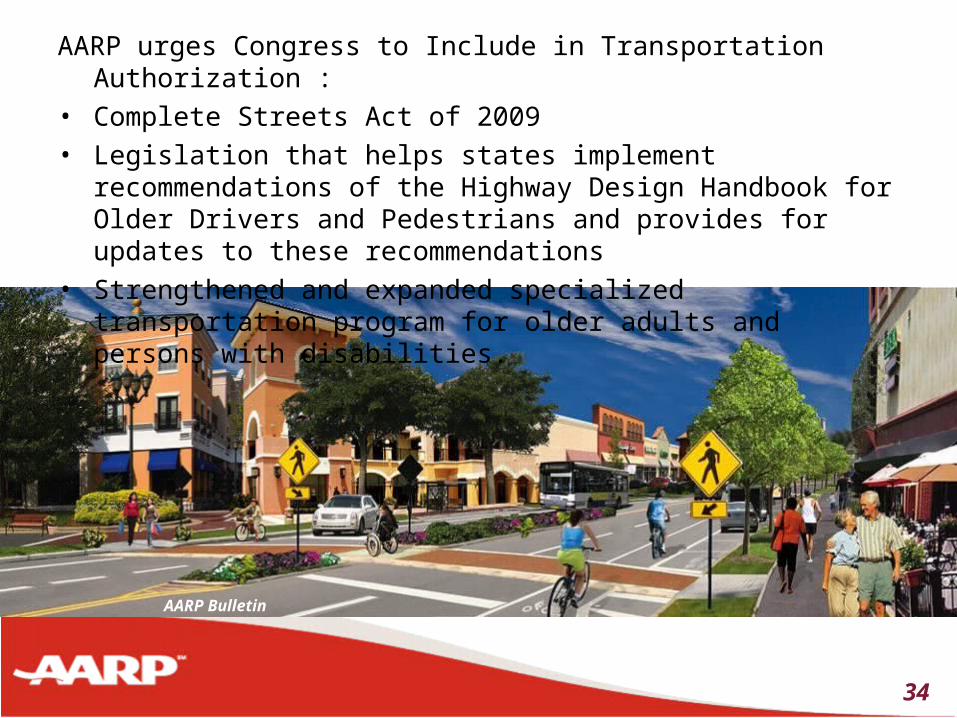
AARP urges Congress to Include in Transportation Authorization :• Complete Streets Act of 2009• Legislation that helps states implement recommendations of the
Highway Design Handbook for Older Drivers and Pedestrians and provides for updates to these recommendations
• Strengthened and expanded specialized transportation program for older adults and persons with disabilities.
Staff Contact:Debra AlvarezGovernment Relations(202) 434-3814