Embed Size (px)
Citation preview

AARP Survey onLifelong LearningAARP Survey onLifelong Learning
A Division of AARP
Conducted for AARP by Harris Interactive Inc. • New York, New York • July 19, 2000
AARP Survey on Lifelong Learning
Harris Interactive Inc. New York, New York
July 19, 2000

AARP Survey on Lifelong Learning
Conducted for AARP by: Harris Interactive Inc.
July 19, 2000
© 2000, AARP 601 E Street, NW, Washington, DC 20049
www.aarp.org All rights reserved.
Reprinting with permission only.
AARP is the nation’s leading organization of people age 50 and older. It serves their needs and interests through information and education, research, advocacy, and community services, which are provided by a network of local chapters and experienced volunteers throughout the country. The organization also offers members a wide range of special benefits and services, including Modern Maturity magazine and the monthly Bulletin.

For more information, contact:
AARP Research Group
Constance Swank, Ph.D., AARP Research Group, 202-434-6173 Albert R. Hollenbeck, Ph.D., AARP Research Group, 202-434-6280
Teresa Keenan, Ph.D., AARP Research Group, 202-434-6274 Linda Fisher, Ph.D., AARP Research Group, 202-434-6304
Acknowledgements:
The research was conducted for AARP by Harris Interactive Inc. David Krane, Senior Vice President; Michele Salomon, Senior Research Associate; and Diana Gravitch, Research Associate, had project responsibility for Harris Interactive, 1-800-575-4749.
Assistance in the preparation of this report came from Roslyn Tartaglione of the AARP Research Group and Annette Norsman, Ph.D., of the National Retired Teachers Association (NRTA), a division of AARP. AARP Research Group staff also assisting were Sonya Gross, Michelle Crepeau, Heather Nawrocki, and Barry Robinson. We would also like to acknowledge AARP staff peer reviewers Joel Reaser, Ph.D., Carol Keegan, Ph.D., Alfred Sommers, Ed.D., Betsy Sprouse, Ph.D., and Janet Erikson for their suggestions and support. The project was commissioned and sponsored by NRTA, the AARP Health and Wellness Strategic Activity Team, and the AARP Personal Enrichment Strategic Activity Team. Research Group management oversight was shared by Hugh O’Connor, Katharyn Marks, and Linda Fisher under the direction of Constance Swank.

AARP Survey on Lifelong Learning
i
Table of Contents Page #
Executive Summary……………………………………………………………………………….1 Introduction ....................................................................................................................................7 Chapter One: Overall Findings .................................................................................................11 How Adults Typically Learn...............................................................................................11 Best Ways to Learn ................................................................................................................13 Why Older Adults Want to Learn ......................................................................................15 Interest in Various Subjects ................................................................................................17 Preferred Learning Formats.................................................................................................19 Degree of Investment ...........................................................................................................21 Chapter Two: Demographic Variables ....................................................................................25 How Adults Typically Learn...............................................................................................25 Best Ways to Learn ................................................................................................................27 Why Adults Want to Learn ..................................................................................................28 When Adults Want to Use What They Learn...................................................................30 Interest in Various Subjects ................................................................................................31 Preferred Learning Formats.................................................................................................32 Investment of Time...............................................................................................................34 Financial Investment ............................................................................................................35 Chapter Three: Incidence and Impact of Major Life Events ..............................................37 Education and Income ..........................................................................................................38 Gender. ....................................................................................................................................39 Age............................................................................................................................................39 Chapter Four: Telephone versus Online Interviews.............................................................41 Ways Older Adults Typically Learn..................................................................................41 Best Ways to Learn ................................................................................................................42 Why Older Adults Want to Learn ......................................................................................42 When Older Adults Want to Use What They Learn .......................................................43 Interest in Various Subjects ................................................................................................43 Preferred Learning Formats.................................................................................................44 Investment of Time...............................................................................................................45 Financial Investment ............................................................................................................46 Appendix A: Tables ....................................................................................................................47 Appendix B: Methodology ......................................................................................................101 Methodology ........................................................................................................................103 Telephone Interviewing Procedures ...............................................................................103 Telephone Sample Design ................................................................................................103 Control of the Telephone Sample ....................................................................................104 Telephone Response Rate..................................................................................................104 Online Interviewing Procedures ......................................................................................105 Online Sample Selection ...................................................................................................106 Control of the Online Sample...........................................................................................107 Online Response Rate ........................................................................................................107 Data Processing....................................................................................................................108

AARP Survey on Lifelong Learning
ii
Data Complications ............................................................................................................ 109 Weighting ............................................................................................................................. 109 Editing and Cleaning the Data ......................................................................................... 110 Reliability of Survey Percentages.................................................................................... 110 Non-Sampling Error ........................................................................................................... 116 Appendix C ................................................................................................................................. 117 Annotated Questionnaires ................................................................................................ 117

AARP Survey on Lifelong Learning
iii
Index of Tables & Exhibits
Executive Summary .......................................................................................................................1 Introduction ....................................................................................................................................7 Chapter One: Overall Findings .................................................................................................11
EXHIBIT 1-1. WAYS OLDER ADULTS LEARN ......................................................................12 EXHIBIT 1-2. LEAST COMMON WAYS OLDER ADULTS LEARN .......................................13 EXHIBIT 1-3. BEST WAYS TO LEARN ....................................................................................14 EXHIBIT 1-4. REASONS FOR LEARNING...............................................................................16 EXHIBIT 1-5. SUBJECTS OF INTEREST...................................................................................18 EXHIBIT 1-6. WHEN TO USE NEW SKILLS ...........................................................................21 EXHIBIT 1-7. TIME INVESTMENT..........................................................................................22 EXHIBIT 1-8. FINANCIAL INVESTMENT ...............................................................................23
Chapter Two: Demographic Variables ....................................................................................25 Chapter Three: Incidence and Impact of Major Life Events ..............................................37 Chapter Four: Telephone versus Online Interviewing ........................................................41 Appendix A: Tables ....................................................................................................................47
TABLE A1 DEGREE OF INTEREST IN LEARNING VARIOUS SKILLS ...............................48 TABLE A2 PREFERRED FORMAT IN WHICH TO LEARN ABOUT DESIRED SKILLS........49 TABLE A3 PREFERENCE FOR GROUP VERSUS INDIVIDUAL LEARNING FORMATS .....51 TABLE A4 WAYS OLDER ADULTS LEARN BY EDUCATION AND INCOME....................53 TABLE A5 BEST WAYS TO LEARN BY EDUCATION AND INCOME .................................55 TABLE A6 WHY OLDER ADULTS WANT TO LEARN BY EDUCATION AND INCOME....56 TABLE A7 TIME INVESTMENT BY EDUCATION AND INCOME.......................................58 TABLE A8 FINANCIAL INVESTMENT BY EDUCATION AND INCOME ............................59 TABLE A9 WHEN OLDER ADULTS WANT TO USE WHAT THEY LEARN BY EDUCATION AND INCOME .....................................................................60 TABLE A10 STRONG INTEREST IN LEARNING VARIOUS SKILLS BY EDUCATION AND INCOME.................................................................................................61 TABLE A11 PREFER GROUP LEARNING FORMAT BY EDUCATION AND INCOME .........63 TABLE A12 PREFER INDIVIDUAL LEARNING FORMAT BY EDUCATION AND INCOME 65 TABLE A13 WAYS OLDER ADULTS LEARN BY GENDER AND AGE ................................67 TABLE A14 BEST WAYS TO LEARN BY GENDER AND AGE .............................................69 TABLE A15 WHY OLDER ADULTS WANT TO LEARN BY GENDER AND AGE ................70 TABLE A16 TIME INVESTMENT BY GENDER AND AGE ...................................................71 TABLE A17 WHEN OLDER ADULTS WANT TO USE WHAT THEY LEARN BY GENDER AND AGE .......................................................................................................72 TABLE A18 FINANCIAL INVESTMENT BY GENDER AND AGE .........................................73 TABLE A19 STRONG INTEREST IN LEARNING VARIOUS SKILLS BY GENDER AND AGE .......................................................................................................74 TABLE A20 PREFER INDIVIDUAL LEARNING BY GENDER AND AGE .............................76 TABLE A21 PREFER GROUP LEARNING FORMAT BY GENDER AND AGE ......................77 TABLE A22 INCIDENCE AND IMPACT OF MAJOR LIFE EVENTS......................................78

AARP Survey on Lifelong Learning
iv
TABLE A23 INCIDENCE AND IMPACT OF MAJOR LIFE EVENTS BY EDUCATION AND INCOME A. HAVING A DEATH IN YOUR IMMEDIATE FAMILY. ............................. 79 B. HAVING A CHILD GO TO COLLEGE .................................................... 79 TABLE A24 INCIDENCE AND IMPACT OF MAJOR LIFE EVENTS BY EDUCATION AND INCOME C. BECOMING A CAREGIVER FOR A PARENT OR ELDERLY FAMILY MEMBER. .............................................................................. 80 D. BECOMING A CAREGIVER FOR A CHILD OR GRANDCHILD............... 80 TABLE A25 INCIDENCE AND IMPACT OF MAJOR LIFE EVENTS BY EDUCATION AND INCOME E. HAVING YOUR LAST CHILD MOVE OUT OF YOUR HOME. ................. 81 F. HAVING AN ADULT CHILD MOVE BACK INTO YOUR HOME ............ 81 TABLE A26 INCIDENCE AND IMPACT OF MAJOR LIFE EVENTS BY EDUCATION AND INCOME G. MAKING A MAJOR CHANGE IN YOUR DIET OR LEVEL OF PHYSICAL ACTIVITY. .................................................................. 82 H. RETIRING FOR THE FIRST TIME ......................................................... 82 TABLE A27 INCIDENCE AND IMPACT OF MAJOR LIFE EVENTS BY EDUCATION AND INCOME I. BECOMING A GRANDPARENT. .......................................................... 83 J. HAVING A MAJOR ILLNESS IN YOUR IMMEDIATE FAMILY ............... 83 TABLE A28 INCIDENCE AND IMPACT OF MAJOR LIFE EVENTS BY EDUCATION AND INCOME K. YOU PERSONALLY HAVING A MAJOR ILLNESS................................. 84 L. GETTING A DEGREE, DIPLOMA, OR CERTIFICAITON (ONLINE ONLY)................................................................................. 84 TABLE A29 INCIDENCE AND IMPACT OF MAJOR LIFE EVENTS BY EDUCATION AND INCOME M. GOING BACK TO SCHOOL TO FINISH A DEGREE OR CERTIFICATION OR TO GET AN ADVANCED DEGREE OR CERTIFICATION. .............. 85 TABLE A30 INCIDENCE AND IMPACT OF MAJOR LIFE EVENTS BY GENDER AND AGE A. HAVING A DEATH IN YOUR IMMEDIATE FAMILY. ............................ 86 B. HAVING A CHILD GO TO COLLEGE. .................................................. 86 TABLE A31 INCIDENCE AND IMPACT OF MAJOR LIFE EVENTS BY GENDER AND AGE C. BECOMING A CAREGIVER FOR A PARENT OR ELDERLY FAMILY MEMBER ............................................................................. 87 D. BECOMING A CAREGIVER FOR A CHILD OR GRANDCHILD.............. 87 TABLE A32 INCIDENCE AND IMPACT OF MAJOR LIFE EVENTS BY GENDER AND AGE E. HAVING YOUR LAST CHILD MOVE OUT OF YOUR HOME ................. 88 F. HAVING AN ADULT CHILD MOVE BACK INTO YOUR HOME ............ 88

AARP Survey on Lifelong Learning
v
TABLE A33 INCIDENCE AND IMPACT OF MAJOR LIFE EVENTS BY GENDER AND AGE G. MAKING A MAJOR CHANGE IN YOUR DIET OR LEVEL OF PHYSICAL ACTIVITY.........................................................................89 H. RETIRING FOR THE FIRST TIME .........................................................89 TABLE A34 INCIDENCE AND IMPACT OF MAJOR LIFE EVENTS BY GENDER AND AGE I. BECOMING A GRANDPARENT ............................................................90 J. HAVING A MAJOR ILLNESS IN YOUR IMMEDIATE FAMILY ................90 TABLE A35 INCIDENCE AND IMPACT OF MAJOR LIFE EVENTS BY GENDER AND AGE K. YOU PERSONALLY HAVING A MAJOR ILLNESS.................................91 L. GETTING A DEGREE, DIPLOMA, OR CERTIFICATION (ONLINE ONLY) ...................................................................................91 TABLE A36 INCIDENCE AND IMPACT OF MAJOR LIFE EVENTS BY GENDER AND AGE M. GOING BACK TO SCHOOL TO FINISH A DEGREE OR CERTIFICATION OR TO GET AN ADVANCED DEGREE OR CERTIFICATION...............................................................................92 TABLE A37 WAYS OLDER ADULTS LEARN -TELEPHONE VERSUS ONLINE.................93 TABLE A38 BEST WAYS TO LEARN -TELEPHONE VERSUS ONLINE ..............................94 TABLE A39 WHY OLDER ADULTS WANT TO LEARN - TELEPHONE VERSUS ONLINE 95 TABLE A40 INTEREST IN LEARNING VARIOUS SKILLS - TELEPHONE VERSUS ONLINE ...........................................................................................................96 TABLE A41 PREFER GROUP LEARNING FORMAT-TELEPHONE VERSUS ONLINE .......97 TABLE A42 PREFER INDIVIDUAL LEARNING FORMAT - TELEPHONE VERSUS ONLINE ...........................................................................................................98 TABLE A43 TIME INVESTMENT-TELEPHONE VERSUS ONLINE.....................................99 TABLE A44 FINANCIAL INVESTMENT-TELEPHONE VERSUS ONLINE ........................100
Appendix B: Methodology ......................................................................................................101 TABLE B1 TELEPHONE SAMPLE DISPOSITION...........................................................105 TABLE B2 ONLINE SAMPLE DISPOSITION..................................................................108 TABLE B3 WEIGHTED/UNWEIGHTED DEMOGRAPHIC PERCENTAGES ...................112 TABLE B4. DEMOGRAPHIC VARIABLES (UNWEIGHTED/WEIGHTED PERCENTAGES)
BY SAMPLE (TELEPHONE, ONLINE) AND POPULATION TARGET PERCENTAGES ..............................................................................113 TABLE B5 APPROXIMATE SAMPLING TOLERANCES (AT 95% CONFIDENCE) TO
USE IN EVALUATING PERCENTAGE RESULTS APPEARING IN THIS REPORT.........................................................................................................114
TABLE B6 APPROXIMATE SAMPLING TOLERANCES (AT 95% CONFIDENCE) TO USE IN EVALUATING DIFFERENCES BETWEEN TWO PERCENTAGE RESULTS APPEARING IN SURVEY...............................................................................115
Appendix C: Annotated Questionnaires ...............................................................................117

AARP Survey on Lifelong Learning
vi
AARP Survey on Lifelong Learning
1
EXECUTIVE SUMMARY
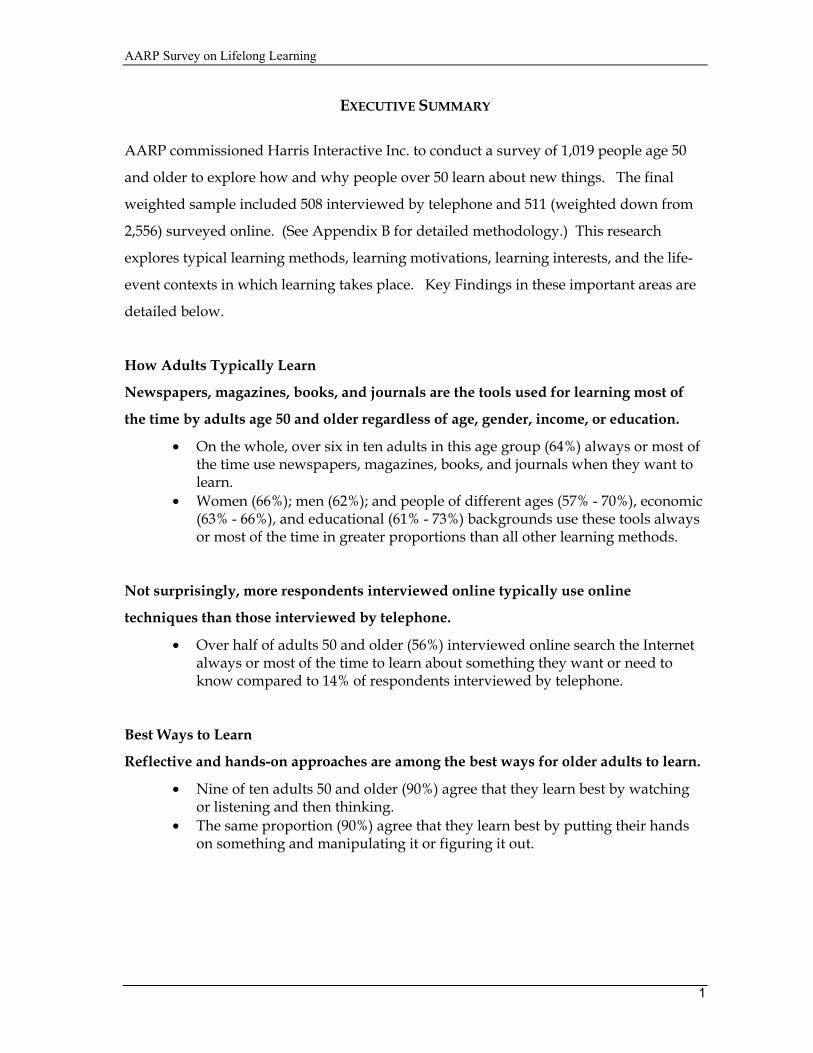
AARP commissioned Harris Interactive Inc. to conduct a survey of 1,019 people age 50
and older to explore how and why people over 50 learn about new things. The final
weighted sample included 508 interviewed by telephone and 511 (weighted down from
2,556) surveyed online. (See Appendix B for detailed methodology.) This research
explores typical learning methods, learning motivations, learning interests, and the life-
event contexts in which learning takes place. Key Findings in these important areas are
detailed below.
How Adults Typically Learn
Newspapers, magazines, books, and journals are the tools used for learning most of
the time by adults age 50 and older regardless of age, gender, income, or education.
• On the whole, over six in ten adults in this age group (64%) always or most of the time use newspapers, magazines, books, and journals when they want to learn.
• Women (66%); men (62%); and people of different ages (57% - 70%), economic (63% - 66%), and educational (61% - 73%) backgrounds use these tools always or most of the time in greater proportions than all other learning methods.
Not surprisingly, more respondents interviewed online typically use online
techniques than those interviewed by telephone.
• Over half of adults 50 and older (56%) interviewed online search the Internet always or most of the time to learn about something they want or need to know compared to 14% of respondents interviewed by telephone.
Best Ways to Learn
Reflective and hands-on approaches are among the best ways for older adults to learn.
• Nine of ten adults 50 and older (90%) agree that they learn best by watching or listening and then thinking.
• The same proportion (90%) agree that they learn best by putting their hands on something and manipulating it or figuring it out.

AARP Survey on Lifelong Learning
2
Why Older Adults Want to Learn
Older adults are interested in learning so that they can keep in touch with themselves,
their community, and the world.
• Over nine of ten adults age 50 and older agree that they want to learn: ◊ To keep up with what’s going on in the world (93%) ◊ For their own spiritual or personal growth (92%) ◊ For the simple joy of learning something new (91%)
• This level of agreement is seen across most demographic subgroups including education, income, gender, and age.
Interest in Various Subjects
Adults 50 and older are most interested in learning about subjects that would improve
the quality of their lives, build upon a current skill, or enable them to take better care
of their health. Six topics generate the greatest interest :
• A favorite hobby or pastime (62% extremely or very interested) • Advanced skills (52% extremely or very interested) • Getting more enjoyment or pleasure out of life (51% extremely or very
interested) • Having a healthy diet and nutrition (49% extremely or very interested) • Measuring personal health status (48% extremely or very interested) • Managing stress (46% extremely or very interested)
Preferred Learning Formats
Older adults’ preferred learning formats vary according to the topic under study.
However, for 11 of the 17 topics about which they were asked, respondents express
preferences for three of eight formats: learning in loosely-structured groups, in
workshop settings, or by teaching themselves.
Degree of Investment
Adults 50 and older are eager to use what they learn, want to have at least some control
over the learning process, and are typically willing to spend modest sums of money to
learn.
• Roughly half of adults 50 and older want to use what they learn immediately (55%). They are also willing to spend some time learning if they have control over when and how much time is spent (47%).

AARP Survey on Lifelong Learning
3
• Three in ten are willing to wait until some time in the future to use their new skills (28%) and are willing to spend all the time it takes to learn about something they really want to know (30%).
• On average, respondents are willing to spend a maximum of $101.
Incidence and Impact of Events
Older adult learners experience different life events at different ages. Respondents
between 50 and 59 are somewhat more likely than older ones to have experienced
these family-related events or new accomplishments:
• Become a caregiver for a child or grandchild (19% of those age 50 – 59 versus 14% of those age 60 – 74)
• Had a child go to college (18% of those age 50 – 59 versus 10% of those age 60 – 74 and 5% of those 75 or older)
• Had their last child move out of their home (15% of those age 50 – 59 versus 10% of those 60 – 74 and 7% of those age 75 or older)
• Had an adult child move back into their home (15% of those age 50 – 59 versus 9% of those age 60 – 74 and 6% of those age 75 or older)
Over half of adult learners surveyed (53%) say they experienced at least one event with a major impact in their life in the past 12 months. Of those experiencing a major event, health-related and caregiving events had the greatest reported impact on their everyday lives:
• having a major personal illness (61%) • having a major illness in the family (56%) • having a death in the family (56%) • becoming a caregiver to a parent or other elderly family member (50%)
Conclusions
Lifelong learning experiences that would likely hold the most appeal for mature adults
include subjects that are personally meaningful, taught in environments which provide a
direct learning experience, allow adults control over all aspects of the learning process,
and are not too expensive. Adults age 50 and older learn for the simple joy of learning, to
enhance their spiritual or personal growth, and to keep up with what is going on in the
world. These reasons are rather universal—large proportions of men, women, those
from different economic and educational backgrounds, and from different age groups
express agreement with these reasons for learning.

AARP Survey on Lifelong Learning
4
Mature adults prefer learning methods that are easy to access, that require small
investments of time and money to get started, and that allow learning to begin
immediately. Print media such as books, magazines, newspapers, and journals are the
learning tools used most frequently by adults regardless of differences in age, income,
education, or gender. Not surprisingly, adults interviewed via the Internet are more
likely than those interviewed by telephone to search the Internet or use computer-based
learning programs as a learning method.
The least common methods used to aid learning include techniques that require greater
investments of time, money, and effort as they serve to delay the learning process. Over
half of adults 50 and older report they never learn by buying or borrowing computer-
based teaching programs, or audio or video tapes, finding a tutor or professional,
enrolling in a college or community college class, or by getting involved in a community
group or volunteer organization.
The best way most older adults report they learn is through a direct, hands-on
experience. The two most common, best-learning methods engage three of the five
senses—seeing, hearing, and touching. Nearly all middle-age and older adults say they
learn best by putting their hands on something, playing with it, listening to it, watching
it, and finally thinking about it.
Adults 50 and older are interested in learning most about things that enrich their lives,
that help them stay healthy, and that bring them more enjoyment. Roughly half of adults
are interested in learning about favorite hobbies or pastimes, new advanced skills, how
to get more enjoyment out of life, and having a healthy diet and nutrition.
Mature adult learners (despite some differences in age, gender, income, and education)
prefer some type of group learning environment when it comes to such topics as
understanding others better, getting involved in their community, or finding out about
educational travel opportunities. However, these adults prefer some type of individual
setting to learn about topics that are of direct personal benefit. These topics include all
the health-related subjects and learning more about a favorite hobby or pastime.

AARP Survey on Lifelong Learning
5
A number of important factors should be considered when creating learning programs
for adults age 50 and over. These include the degree to which adult learners have control
over the learning process, how soon they can put into practice their new skills and ideas,
and not surprisingly, how much the programs cost. Adults are typically willing to spend
up to $101 to learn about something they always wanted to know about. Most adults 50+
want to use what they have learned right away or in the near future; very few are willing
to wait longer. While about half are willing to devote at least some time to developing
their new skills (if they can control when and how much), one-third are willing to take all
the time it takes to master their new ability.

AARP Survey on Lifelong Learning
6
AARP Survey on Lifelong Learning
7
INTRODUCTION
AARP commissioned Harris Interactive Inc. to conduct a survey of people age 50 and
older to explore how and why people over 50 learn about new things over their lifetime.
This research explores typical learning methods, learning motivations, learning interests,
and the life-event contexts in which learning takes place.
The survey has six objectives:
• Ways adults typically learn
• Why adults want to learn
• When adults want to use what they learn
• Time and money adults are willing to invest in learning
• What adults are interested in learning about, particularly for wellness and
personal enrichment topics
• How adults prefer to learn about topics of interest
Interviewing was conducted by telephone and via the Internet. In evaluating the results,
age, income, gender, and education as well as the incidence and impact of different life
events were considered. The results discussed in this report reflect the weighted totals of
the combined telephone and online samples. Where there are differences in results
between the online and telephone subgroups, these differences are noted.
The Survey Sample and Weighting
The Lifelong Learning Survey includes interviews with 1,019 adults age 50 or older: 508
interviewed by telephone and 511 (weighted down from 2,556) interviewed online. For
the telephone sample, adults age 50+ were selected randomly from a telephone database
of past Harris survey participants (who were originally identified through a random
digit dialing process) and contacted by telephone. For the online sample, email
invitations were sent to randomly selected members age 50+ of the Harris Interactive
online database. Interviews were conducted between August 27 and September 5, 1999,
and averaged approximately 15 minutes in length.

AARP Survey on Lifelong Learning
8
Using the 1999 Current Population Survey, the online and telephone interviews were
weighted by age, gender, race, ethnicity, education, and income.1 In addition, and for
purposes of comparing the telephone and online samples, the online interviews were
weighted down (from 2,556 to 511 respondents) so that, when weighted, online (511) and
telephone (508) samples are roughly equal in size.
Response Rates
The telephone response rate was calculated using the guidelines set forth by the
American Association for Public Opinion Research (AAPOR). More specifically, the
response rate for the telephone sample was 33%. In the absence of AAPOR guidelines, a
comparable formula was developed and a 34% response rate for the online sample was
calculated. The formulas and calculations are detailed in Appendix B.2
The methodology is presented in Appendix B. The survey questionnaire appears in
Appendix C , along with the response frequencies for each question for the combined
online and telephone samples and for each sample.
Notes on Reading Tables
The text of the report references Exhibits (for example, Exhibit 1-1, 1-2) and Tables (for
example, Table A1, A2). The Exhibits appear within the body of the report and the
Tables appear in Appendix A.
An asterisk (*) on a table signifies less than one-half percent (0.5%). A dash represents a
value of zero. Percentages may not always sum to 100% because of
computer rounding, the acceptance of multiple answers from respondents, or the
collapsing of data across subgroups. The base for each question is the total number of
respondents answering those questions. Note that in some cases, results may be based
1 The telephone interviews were also weighted by region. 2 Note that response rate calculations are based on the total beginning sample, including non-contact and refusals. Of those contacted in the telephone sample, for example, the completion rate for the interviews was 95%.

AARP Survey on Lifelong Learning
9
on small sample sizes. This is typically true for questions asked of subgroups less than
the total sample. Caution should be used in drawing any conclusions from the results
based on these small samples.
Project Responsibility and Acknowledgments
Harris Interactive Inc. would like to thank Albert Hollenbeck, Teresa Keenan, and Roslyn
Tartaglione from AARP for their valuable contribution to this project. The survey was
conducted by Harris Interactive Inc. under the direction of David Krane, Senior Vice
President; Michele Salomon, Senior Research Associate; and Diana Gravitch, Research
Associate.
Public Release of Survey Findings
All Harris Interactive Inc. surveys are designed to comply with the codes and standards
of the Council of American Survey Research Organizations (CASRO) and the code of the
National Council of Public Polls (NCPP). Because data from the survey may be released
to the public, release must stipulate that this complete report is also available.

AARP Survey on Lifelong Learning
10

AARP Survey on Lifelong Learning
11
CHAPTER ONE: OVERALL FINDINGS
Respondents favor learning methods that are easily accessible, that allow them to begin learning immediately, and that require minimal investments of time and money. Adults want to learn for various reasons, the most common of which are related to keeping in touch with themselves, their community, and their world. Most adults are interested in learning about topics that will help them enrich their lives.
How Adults Typically Learn
Adults age 50 and older use learning methods that are readily accessible. These
methods allow them to begin learning right away with a minimum investment of time or
money. Adults age 50 and older most commonly read newspaper and magazine articles,
books, or journals when they want or need to learn something new. Over six of ten
adults in this age group (64%) use this method always or most of the time, the only
method so used by more than half the sample (Exhibit 1-1).
Two other methods used by substantial numbers—over four out of ten respondents—are
also easily accessible and require relatively small amounts of time and money:
• Starting by doing what they want to learn about and learning from their mistakes and successes (44% say always or most of the time)
• Finding someone to teach them such as a friend, co-worker, or family member (41% say always or most of the time)
Other media outlets such as TV, radio, and the Internet are also relatively common
methods for learning. Over half (56%) of the online sample search the Internet, and three
in ten (29%) of the online sample look for educational or informational television or radio
programs always or most of the time. The online and telephone samples differ in two
ways on this measure. Sixty-eight percent of respondents from the online sample versus
60% from the telephone sample typically “read newspaper articles, magazine articles,
books, or journals” to learn. Fifty-six percent of online respondents versus 14% of
telephone respondents selected “search the Internet” as a common learning mode.

AARP Survey on Lifelong Learning
12
Exhibit 1-1. Ways Older Adults Learn (% Always or Most of the Time) When I want or need to learn something I …3
Q21. For each of the following ways adults learn, tell me whether you always learn this way, learn this way most of the time, learn this way some of the time, or you never learn this way. Base: All respondents (n=1019)
3 Note: For “search the Internet,” 14% of the telephone sample and 56% of the online sample (36% of the total sample) use this learning technique “always or most of the time.” Similarly, for “buy or borrow computer-based teaching programs,” 7% of the telephone sample and 16% of the online sample (12% of the total sample) use this learning technique.
5%
9%
13%
9%
13%
23%
7%
8%
7%
8%
8%
8%
12%
13%
17%
23%
33%
31%
41%
3%
4%
4%
3%
3%
2%
2%
0% 10% 20% 30% 40% 50% 60% 70% 80% 90% 100%
Buy, rent, or borrow audio or video tapes
Find an online chat group interested in the topic
Enroll in a college or community college to take classes
Find a tutor or professional to teach me
Get involved in a community group or volunteerorganization
Buy or borrow computer-based teaching programs
Find a public event, exposition or exhibition
Take classes or attend community seminars or workshops
Look for educational or informational television or radio
Search the Internet
Find someone to teach me
Start by doing what I want to learn about and learn from mymistakes and successes
Read newspaper articles, magazine articles, books, orjournals
Always Most of the time

AARP Survey on Lifelong Learning
13
Learning modes that require more effort and technology are the least-commonly used
methods adults use always or most of the time (Exhibit 1-2).
Exhibit 1-2. Least Common Ways Older Adults Learn (% Who Never Learn this Way) When I want or need to learn something I…(never)4
Q21. For each of the following ways adults learn, tell me whether you always learn this way, learn this way most of the time, learn this way some of the time, or you never learn this way. Base: All respondents (n=1019) Best Ways to Learn
The vast majority of adults 50 and older agree they learn best by putting their hands on
something and playing with it or figuring it out (89% agree, including 60% who strongly
4 Note: For “find an online or chat group interested in a topic,” 78% of the telephone sample and 52% of the online sample (65% of the total sample) “never” use this learning technique. Similarly, for “buy or borrow computer-based teaching programs,” 74% of the telephone sample and 40% of the online sample (57% of the total sample) never use this learning technique.
50%
51%
57%
57%
57%
65%
0% 25% 50% 75% 100%
Buy, rent , or borrow audio or video tapes
Get involved in a community group or volunteerorganization
Enroll in a college or community college
Find a tutor or professional to teach me
Buy or borrow computer-based teaching programs
Find an online or chat group interested in a topic

AARP Survey on Lifelong Learning
14
agree), by gathering as much information as I can find and then teaching myself (84%
agree, including 47% who strongly agree), or by watching or listening and then thinking
about it (90% agree, including 45% who strongly agree). It is worth noting that these
activities require little investment of money or time (Exhibit 1-3).
Exhibit 1-3. Best Ways to Learn (% Strongly or Somewhat Agree)
Q71. The next few statements focus on the best ways for you, personally, to learn. Please tell us if you strongly agree, somewhat agree, neither agree nor disagree, somewhat disagree, or strongly disagree with them. Base: All respondents (n=1019)
15%
30%
33%
40%
47%
60%
45%
38%
37%
36%
38%
37%
29%
45%
0% 20% 40% 60% 80% 100%
In a formal teacher-classroom situation
In a group where I can share with other learners
By finding self-study courses that let me set my ownobjectives and pace
When I have a guide, instructor, tutor, or mentorface-to-face
By gathering as much information as I can find andthen teaching myself
By putting my hands on something and playingwith it or figuring it out
By watching or listening and then thinking about it
Strongly Agree Somewhat Agree

AARP Survey on Lifelong Learning
15
Why Older Adults Want to Learn
The most common motivations for learning among mature adults relate to keeping in
touch with their environment and themselves and for the enjoyment learning brings.
Nine in ten adults age 50 and older agree (including 60% or more that strongly agree)
that they want to learn for three reasons:
• To keep up with what’s going on in the world (63% strongly agree) • For their own spiritual or personal growth (62% strongly agree) • For the simple joy of learning something new (60% strongly agree)
More than seven in ten adults age 50 or older also learn in order to enrich their lives by
better understanding themselves and others, managing their everyday life, enjoying their
hobbies better, and talking with their children and grandchildren.
Learning to advance one’s career or to improve job skills is somewhat less important to
mature adults. While a majority of adults (55%) agree that they want to learn to improve
their job skills, substantially fewer (30%) agree that a reason they want to learn is to earn
a degree or certification that will advance their career or help them to earn more money
(Exhibit 1-4). Responses to these two items did not differ by gender. However, younger
respondents are more likely than older ones to strongly or somewhat agree that they
learn to improve their job skills (74% for those age 50-59 vs. 45% for those age 60-74 and
33% for those age 75 and older) or earn a degree or certification (44% vs. 24% and 16%).

AARP Survey on Lifelong Learning
16
Exhibit 1-4. Reasons for Learning (% Strongly or Somewhat Agree)
Q51. These next statements describe why you want to learn. Tell us whether you strongly agree, somewhat agree, neither agree nor disagree, somewhat disagree, or strongly disagree with each one. Base: All respondents (n=1019)
14%
32%
39%
31%
40%
42%
48%
42%
50%
53%
60%
62%
63%
16%
23%
24%
34%
34%
36%
32%
40%
35%
34%
31%
30%
30%
0% 20% 40% 60% 80% 100%
To earn a degree or certification that will advance mycareer or help me earn more money
To improve my job skills to make work easier or to getahead
To know basic skills
To give something back to my community
To understand myself better
To understand and get along with others better
To talk about things with my children or grandchildren
To help other people
To manage my everyday life better
To enjoy my hobbies or recreational activities better
Simple joy of learning something new
Spiritual or personal gorwth
To keep up with what's going on in the world
Strongly Agree Somewhat Agree

AARP Survey on Lifelong Learning
17
Interest in Various Subjects
Interest in learning specific subjects varies by topic. The largest proportions of adults are
interested in learning about information of personal benefit. The smallest proportions
are interested in learning about activities that relate to their larger world (Table A1,
Appendix A).
The most popular topics (in which roughly half of adults are extremely or very
interested) include these six subjects (Exhibit 1-5):
• Learning about a favorite hobby or pastime (61%) • Mastering advanced skills (52%) • Getting more enjoyment or pleasure out of life (51%) • Having a healthy diet and nutrition (50%) • Managing stress (47%) • Measuring their personal health status (47%)

AARP Survey on Lifelong Learning
18
Exhibit 1-5. Subjects of Interest (% Extremely or Very Interested)
Q106. Please rate whether or not you would be extremely interested, very interested, somewhat interested, not very interested, or not at all interested in learning about... Base: All respondents (n=1019)
6%
9%
10%
8%
13%
13%
14%
15%
15%
19%
20%
19%
22%
22%
22%
24%
28%
11%
11%
11%
16%
17%
17%
17%
24%
24%
23%
23%
28%
25%
28%
29%
28%
33%
0% 10% 20% 30% 40% 50% 60% 70% 80% 90% 100%
Becoming a volunteer in community
Basic life skills
Getting ahead in career
Giving back/getting involved in local community
Arts, culture, or personal enrichment
Educational travel
Alternative medicine
Exercise and fitness
Understanding others
Weight control
Spiritual or personal growth
Measuring personal health status
Managing stress
Healthy diet and nutrition
More enjoyment, pleasure from life
Advanced skills
Favorite hobby or pastime
Extremely Interested Very Interested

AARP Survey on Lifelong Learning
19
Conversely, the four subjects for which respondents express the least enthusiasm are
giving back/getting involved in the local community, getting ahead in one’s career,
learning basic life skills, or becoming a community volunteer (Exhibit 1-5).
Preferred Learning Formats
Respondents were asked their preferred learning format—classroom, workshop, group,
tutor or pro, teaching yourself, self study course, Internet, something else—for each topic
in which they expressed an interest. The most preferred learning formats vary by topic
(Table A2, Appendix A). Mature adults prefer groups for topics and activities that relate
to their relationships with larger communities. Among those extremely or very
interested in these five topics, a plurality prefer a group format:
• Becoming a volunteer in their community (40%) • Giving back or getting involved with their local community (35%) • Getting along with others (34%) • Learning more about spiritual or personal growth (32%) • Getting more enjoyment or pleasure out of life (28%)
Pluralities prefer workshops to learn about fairly localized subjects with which one may
have some familiarity but would like more or different information such as:
• Giving back or getting involved with their local community (30%) • Becoming a volunteer in their community (27%) • How to get ahead in your job or career (23%)
Older adults prefer to teach themselves about issues over which they have some control
and that are largely personal:
• Having a healthy diet and nutrition (28%) • Learning about a favorite hobby or pastime (27%) • Learning about exercise and fitness (24%) • Learning about weight control (24%) • Managing stress (20%) • Measuring their own personal health status (19%)
Older adults prefer classrooms for subjects that require both instruction and practice to
master such as:
• Master an advanced skill such as using a computer, becoming fluent in a foreign language, or preparing taxes (23%)
• Learn basic life skills such as reading, writing, basic math, or learning to drive (23%)
AARP Survey on Lifelong Learning
20
Pluralities overall and far more online respondents than telephone respondents indicate
they prefer the Internet to learn about:
• Educational travel opportunities (25%, including 30% of those surveyed online vs. 15% of those surveyed by telephone)
• Alternative medicine or remedies such as acupuncture, medicinal herbs, or aroma therapy (17%, including 26% of those surveyed online vs. 4% of those surveyed by telephone)
These topics represent relatively new subject matters for most individuals; and the
Internet may represent the learning mode with the fastest adaptability to more avant-
garde topics.

AARP Survey on Lifelong Learning
21
Degree of Investment
Fully half of adults age 50 and older want to use what they learn immediately or very
soon after they learn it (55%), and nearly three in ten (28%) are willing to wait until some
time in the near future (Exhibit 1-6).
Exhibit 1-6. When to Use New Skills
Q60. Which of the following three statements best describes when you want to use what you learn? Base: All respondents (n=1019) Adults age 50 and older are willing to spend time to learn their new subject, but control
over this time is important. Nearly one-half (47%) will spend some time if they can
control when and how much of this time is devoted to learning. Three in ten (30%) will
spend all the time it takes to learn about something they really want to know (Exhibit 1-
7).
14%
28%
55%
0% 20% 40% 60% 80% 100%
I am willing to waitto use what I learnfor a long period of
time
I am willing to waitto use what I learnsome time in the
near future
I want to use what Ilearn immediatelyor very soon after I
learn it

AARP Survey on Lifelong Learning
22
Exhibit 1-7. Time Investment
Q200. Which of the following four statements best describes how much time you are willing to invest? Base: All respondents (n=1019)
Respondents are typically willing to spend, at most, $101 to learn about something they
are extremely interested in or have always wanted to learn about.5 Roughly half (47%) of
these learners are willing to spend between $1 and $499. Also worth noting is that 16
percent of respondents are not willing to make any financial investment to learn about
something they always wanted to learn; but 14 percent are willing to spend $500 or more
(Exhibit 1-8).
5 Note that the median is based on those giving a dollar figure. The percentage responding in each dollar range is based on the total sample, including those “not sure/refused.”
30%
47%
7%
7%
7%
0% 20% 40% 60% 80% 100%
It depends
I can't spend much time to learn aboutsomething I really want to know
I will spend some time, even if I cannotcontrol when and how much
I will spend some time, if I can controlwhen and how much
I will spend all the time it takes to learnabout something I really want to know

AARP Survey on Lifelong Learning
23
Exhibit 1-8. Financial Investment
Q205. How much would you be willing to pay, at most, to learn about something you are extremely interested in or have always wanted to learn more about? Base: All respondents (n=1019)
22%
4%
10%
24%
23%
16%
0% 20% 40% 60% 80% 100%
Not sure/ refused
$2,000 or more
$500 - $1,999
$100 - $499
$1 - $99
$0
Mean = $520Median = $101

AARP Survey on Lifelong Learning
24

AARP Survey on Lifelong Learning
25
CHAPTER TWO: DEMOGRAPHIC VARIABLES
Regardless of educational level, income, gender, or age, respondents report using similar methods of learning. The reasons they give for learning and the level of investment they are willing to commit are generally consistent across different populations. However, there are demographic differences in respondents’ preferences and motivations for learning, their levels of interest in various topics, and their preferred learning formats. This chapter details those differences.
How Adults Typically Learn
The most typical method for learning across all demographic groups is by reading
newspapers, magazines, books, or journals; but there are some notable differences by
education, income, gender, and age.
Education. College-educated adults age 50 and older are more likely (73%) to use the
print media always or most of the time than those with less than a college degree (65%)
or those with a high school education or less (61% Table A4, Appendix A).
Further, those who have at least some college are more likely than those who have a high
school education or less to use three learning methods:
• Take classes or attend community seminars or workshops (22% of those with some college and 27% of those with a college degree use this method always or most of the time vs. 13% of those with high school education or less)
• Enroll in a college or community college to take classes (13% of those with some college and 14% of those with a college degree vs. 7% of those with a high school or less education)
• Search the Internet for information (41% of those with a college degree and 37% of those with some college vs. 33% of those with a high school education or less)6
However, those respondents with a high school education or less are more likely than
those with some college or more to prefer to learn by finding someone to teach them who
6 In the telephone sample, 26% of those with a college degree vs. 11% of those with a high school education or less “search the Internet.”

AARP Survey on Lifelong Learning
26
knows about the topic (46% of those with high school or less education vs. 37% of those
with some college and 33% of those with college degree or higher (Table A4, Appendix
A).
Income. Those respondents with annual household incomes under $50,000 are more
likely than those with incomes of $75,000 or more to prefer to start learning by doing
something and then learning from their mistakes (48% vs. 36%). Respondents with
incomes under $50,000 are also more likely than those with incomes between $50,000 and
$75,000 to learn by buying, renting, or borrowing audio or video tapes (11% vs. 5%).
Finally, those with annual household incomes under $50,000 are more likely than those
in the higher income categories to prefer to learn by looking for educational or
informational television or radio programs (32% vs. 18% for those with incomes between
$50,000 and $75,000 and 14% for those with incomes of $75,000 or more).
Respondents with annual household incomes between $50,000 and $75,000 are twice as
likely as those with incomes of $75,000 or more to say they always or most of the time
learn by getting involved in a community group or volunteer organization (14% vs. 7%),
even though the overall percentages are lower than for most of the other methods of
learning. Also, the most affluent respondents—those with annual household incomes of
$75,000 or more—are more likely than respondents with incomes between $50,000 and
$75,000 to prefer to learn by finding an online or chat group interested in the topic (14%
vs. 6%).
Gender. For the most part, men and women report that they learn in similar ways (Table
A13, Appendix A). The only gender difference in ways of learning is that women are
more likely than men to say that they always or most of the time learn by looking for
educational or informational television or radio programs (31% vs. 21%).
Age. Respondents age 50 to 59 are more likely than those age 60 to 74 to say they always
or most of the time learn by finding someone to teach them about an interesting topic

AARP Survey on Lifelong Learning
27
(46% vs. 37%). They are also more likely than those age 75 or older to say they always or
most of the time learn by searching the Internet for information (38% vs. 24%).7
Those in the 60 to 74 age category are more likely than those age 75 or older to say they
always or most of the time learn by searching the Internet (37% vs. 24%).8 They are also
more likely than those age 50 to 59 to say that they always or most of the time learn by
reading newspaper or magazine articles, books, or journals on a subject of interest (70%
vs. 50%).
Finally, the oldest respondents, those age 75 or older, are more likely than those age 50 to
59 to say they always or most of the time learn by doing what they want and then
learning from their mistakes (52% vs. 41%) or finding a tutor or professional to teach
them (17% vs. 10%).
Best Ways to Learn
Respondents generally agree from descriptions of seven learning formats that the “best”
ways for them to learn personally are those that are informal and self-directed (Table A5,
Appendix A). Specifically, there is strong agreement that the “best” ways to learn are by
these methods:
• Putting one’s hands on something and playing with it or figuring it out ( 90%) • Watching or listening and then thinking about it (90%) • Gathering as much information and then teaching oneself (83%)
Overall, the fewest (53%) agree that a formal teacher-classroom situation is the “best”
approach for them to learn.
7 In the telephone sample, 19% of those age 50 to 59 vs. 7% of those age 75 or older “search the Internet” always or most of the time. 8 In the telephone sample, 13% of those age 60 to 74 vs. 7% of those age 75 or older “search the Internet” always or most of the time.

AARP Survey on Lifelong Learning
28
Education. Those with at least some college are more likely than those with a high
school education or less to say that such a formal setting is one of the best ways for them
to learn (57% of those with some college and 60% of college graduates vs. 49% of those
with a high school education or less). This preference for more formal learning
environments is not surprising given that those with at least a college degree are more
familiar with and have spent time in this type of setting.
Respondents with a high school education or less or those with some college are slightly
more likely than college graduates to strongly or somewhat agree that they learn “best”
by watching or listening and then thinking about it (92% of those with a high school
education or less and 91% of those with some college vs. 86% of college graduates).
Income. Only one income difference emerges in “best” ways of learning. Respondents
with annual household incomes less than $50,000 are more likely than those with
incomes of $75,000 or more to strongly or somewhat agree that they learn best by finding
self-study courses that let them set their own objectives and move at their own pace (74%
vs. 59%).
Gender and Age. There are few gender and age differences in respondents’ “best” ways
to learn (Table A14, Appendix A). Men are more likely than women to strongly or
somewhat agree that they learn best by putting their hands on something and playing
with it or figuring it out (93% vs. 87%) or by gathering as much information as they can
and teaching themselves (87% vs. 80%). Those age 50 to 74 are more likely than those age
75 or older to strongly or somewhat agree that they learn best in a group where they can
share with others (70% of those age 50-59 and 69% of those age 60-74 vs. 58% of those age
75 or older) or when they have a guide or mentor in a face-to-face situation (81% and 78%
vs. 67%).
Why Adults Want to Learn
As noted in Chapter One, the main reason adults age 50 and older give for learning new
things is to help them improve their lives by keeping up with what is going on in the

AARP Survey on Lifelong Learning
29
world. Specifically, more than nine out of ten adults strongly or somewhat agree that
these are the most common motivations to start learning ( Table A6, Appendix A).
Education. Not surprisingly, respondents with some college or less are more likely than
college graduates to agree that they want to learn to basic everyday skills such as
reading, writing, mathematics, or learning to drive (67% for those with a high school
education or less and 63% for those with some college vs. 52% for college graduates).
Moreover, those with a high school education or less are more likely than college
graduates to agree that they want to learn so that they can talk about things with their
children and grandchildren (82% vs. 74%).
In contrast, those with some college education or a degree are more likely than those
with a high school education or less to agree that they learn so they can:
• Improve their job skills to make work easier or to get ahead (59% for those with some college and 60% for college grads vs. 52% for those with a high school education or less)
• Earn a degree or certification that will advance their career and help them earn more money (37% and 35% vs. 27%)
• Give back something to their community (72% and 69% vs. 61%).
Finally, those with some college are more likely than those with a high school education
or less to strongly or somewhat agree that they learn so that they can help other people
(86% vs. 79%).
Income. More-affluent respondents are more likely than less-affluent ones to agree that
they learn to improve their job skills (67% for those with incomes between $50,000 and
$75,000 and 63% for those with incomes of $75,000 or more vs. 51% for those with
incomes less than $50,000 per year) or to earn a degree or certification (38% for those with
incomes of $75,000 or more vs. 28% for those with incomes of less than $50,000).
In contrast, less-affluent respondents are a little more likely than more-affluent ones to
agree that they learn so that they can talk with their children or grandchildren (84% for
those with incomes of less than $50,000 vs. 76% for those in the middle income category
and 75% for those with incomes of $75,000 or more) or for their own spiritual or personal

AARP Survey on Lifelong Learning
30
growth (93% for those with incomes less than $50,000 vs. 88% for those with incomes
between $50,000 and $75,000).
Gender and Age. There are few gender or age differences in respondents’ motivations
for learning (Table A15, Appendix A). Specifically, women are slightly more likely than
men to strongly or somewhat agree that they learn so they can understand themselves
better (76% vs. 70%), talk with their children and grandchildren (84% vs. 75%), or for
their own spiritual or personal growth (93% vs. 89%). Moreover, younger respondents
are more likely than older ones to strongly or somewhat agree that they learn to improve
their job skills (74% for those age 50-59 vs. 45% for those age 60-74 and 33% for those age
75 and older), earn a degree or certification (44% vs. 24% and 16%), or understand
themselves better (78% for those 50-59 vs. 70% for those 60-74).
When Adults Want to Use What They Learn
Although fully half (55%) of adults age 50 or older say they want to use what they have
learned immediately or very soon after they have learned it, there are some educational
and age differences.
Education. Adults with less formal education (high school or less) are more likely than
those with more formal education to say they want to use what they have learned
immediately or very soon after they learn it (57% vs. 48% for college graduates: Table A9,
Appendix A).
Age. Those age 50 to 74 are more likely to say they want to use what they have learned
immediately or very soon after having learned it (58% for those age 50-59 and 56% for
those age 60-74 vs. 40% for those age 75 or older) while those age 75 or older are more
likely to say they are willing to wait some time in the near future (41% for those age 75 or
older vs. 29% for those age 50-59 and 24% for those age 60 to 74: Table A17, Appendix A).
Finally, those age 60 or older are more likely than those age 50 to 59 to be willing to delay
learning gratification by waiting a long period of time to use what they have learned
(17% for those age 60-74 vs. 10% for those age 50-59).
AARP Survey on Lifelong Learning
31
Interest in Various Subjects
Respondents with the same backgrounds are generally interested in learning about the
same topics, and almost all deal with self-improvement ( Table A10, Appendix A).
Education. Those with at least some college education are more interested than those
with a high school education or less in subjects that involve improving their existing
skills or acquiring new ones:
• Mastering an advanced skill (56% of those with some college and 60% of college graduates vs. 48% of those with a high school education or less)
• Learning more about arts and culture (37% of those with some college and 47% of college graduates vs. 21% of those with a high school education or less)
• Finding out about educational travel opportunities (35% of those with some college and 43% of college graduates vs. 24% of those with a high school education or less)
• Learning more about a favorite hobby or pastime (66% of those with some college and 68% of college graduates vs. 58% of those with a high school education or less)
• Giving back to their local community (28% of those with some college and 28% of college graduates vs. 20% of those with a high school education or less).
Income. Since learning often requires a significant financial investment, it is not
surprising that those with higher incomes express greater interest in topics that would
seem to require greater monetary investments ( Table A10, Appendix A). For example,
those with annual household incomes of $75,000 or more are more likely than those with
incomes less than $50,000 per year to say they are extremely or very interested in
learning more about hobbies or favorite pastimes (70% for those with incomes of $75,000
or more vs. 60% for those with incomes less than $50,000) or arts and culture (39% vs.
27%).
Further, those with annual household incomes of $50,000 or more are more likely than
those with incomes below that figure to express high levels of interest in educational
travel opportunities (36% for those with incomes between $50,000 and $75,000 and 46%
for those with incomes of $75,000 or more vs. 25% for those with incomes of less than
$50,000).
AARP Survey on Lifelong Learning
32
Notably, while interest in various subjects is generally consistent, there are a few gender
and age differences which may be related to life stage and career patterns.
Gender. Women are more likely than men to say they are extremely or very interested in
four subjects (Table A19, Appendix A):
• Alternative medicine or remedies (36% of women vs. 26% of men) • Mastery of advanced skills (56% vs. 48%) • Arts and culture (34% vs. 25%) • Spiritual or personal growth (48% vs. 35%)
Age. Younger respondents are more likely than older ones to express high interest in
these topics:
• Weight control (44% of those age 50-59 and 45% of those age 60-74 vs. 27% of those age 75 or older)
• Stress management (51% of those age 50-59 vs. 35% of those age 75 or older) • Alternative medicines (32% of those age 50-59 and 35% of those age 60-74 vs.
18% of those age 75 or older) • Job advancement (34% of those age 50-59 vs. 13% of those age 60-74 and 8% of
those age 75 or older) • Mastery of advanced skills (56% of those age 50-59 vs. 40% of those age 75 or
older) • Basic life skills (24% of those age 50-59 vs. 17% of those age 60-74) • Hobbies (65% of those age 50-59 and 63% of those age 60-74 vs. 50% of those
age 75 or older) • Educational travel opportunities (33% of those age 60-74 vs. 21% of those age
75 or older) Preferred Learning Formats
Respondents across various demographic subgroups generally favor group formats
(classrooms, workshops, or group settings) for learning about their community, the arts
and culture, spiritual and personal growth, understanding others. They prefer to learn
about topics that seem more personal, such as their own health or their stress levels, on
an individual basis (with a tutor, teaching themselves, using self-study, or using the
Internet). Even though there are few demographic differences, they bear noting ( Table
A11 and Table A12, Appendix A).

AARP Survey on Lifelong Learning
33
Education. For 5 out of 17 topics, those with higher education levels prefer group
learning formats for highly personal topics—a pattern different from the general
preference for individualized formats for personal topics and group learning formats for
topics concerning relations with the larger community:
• Roughly four in ten respondents with at least some college (39% of those with
some college and 43% of college grads) express a preference for learning about having a healthy diet or nutrition in a group setting compared with slightly more than one-quarter (27%) of those with a high school education or less.
• Over half (52%) of the respondents who have a college degree say they prefer to learn about managing stress in a group setting compared with four in ten (39%) who have a high school education or less.
• Over half (55%) of the respondents who have a college degree prefer a group setting to learn about mastering an advanced skill compared with four in ten (41%) with a high school education or less.
• Respondents with some college are more likely than those with a college degree to prefer a group setting when learning more about educational travel opportunities (52% vs. 40%).
• Respondents with some college are more likely than those with a high school education or less to express a preference for learning more about understanding and getting along with others in a group setting (67% vs. 55%).
Income. For 2 of 17 topics, those at higher income levels prefer group learning formats
for personal topics—a pattern different from the general preference for individual
formats for personal topics and group learning formats for topics concerning relations
with the larger community:
• Over half (52%) of those in the highest income category ($75,000 or more)
prefer group learning formats when mastering an advanced skill. In contrast, over half of those with annual incomes less than $50,000 (55%) or with incomes between $50,000 and $75,000 (53%) prefer to learn about the same topic in an individualized setting.
• Half or more of those in the two lower-income groups prefer a group format when learning about educational travel opportunities (50% for those with incomes between $50,000 and $75,000 and 57% for those with incomes of $75,000 or more) compared to 35% of those with incomes less than $50,000).

AARP Survey on Lifelong Learning
34
Gender. Men and women are remarkably similar in their preferred learning formats
(Table A20 and Table A21, Appendix A). There are only three topics for which men and
women prefer different settings:
• Women are more likely than men to prefer a group setting (a classroom, workshop, or group) when learning about basic life skills (49% vs. 33%) or when learning about their hobbies or pastimes (48% vs. 31%).
• In contrast, men are more likely than women to prefer to learn about arts and culture in an individualized setting such as by teaching themselves or on the Internet (45% vs. 34%).
Age. Younger respondents express a different learning format preference than older
respondents for only two topics:
• Respondents age 50-59 are more likely than those age 60 – 74 to say they
would like to learn more about understanding and getting along better with others in a group setting (67% vs. 54%).
• When learning more about their spiritual or personal growth, respondents age 50-59 are more likely to prefer an individual setting than are those age 75 or older (48% vs. 27%).
Investment of Time
About one-half (47%) of all respondents say they are willing to invest some time to learn
if they can control when and how much (Table A7, Appendix A).
Education. Those with a high school education or less are more likely than those with
some college or with a college education or higher to say that they cannot spend much
time (9% vs. 6% for those with some college and 3% for college graduates).
Income. Likewise, those with incomes less than $50,000 are more likely than those with
incomes between $50,000 and $75,000 or $75,000 or more to say they cannot spend much
time to learn something (9% vs. 2% and 3%). Further, those with incomes of $75,000 or
more are more likely than those in the middle-income category ($50,000 to $75,000) to say
they will spend all the time it takes to learn about something they really want to know
(38% vs. 26%). Those with incomes of $50,000 to $75,000 are more likely than those with

AARP Survey on Lifelong Learning
35
incomes less than $50,000 to say they will spend some time, if they can control when and
how much (56% vs. 46%).
Gender. Men and women do not differ in regard to the time investment they will make
to learn about something (Table A16, Appendix A).
Age. Respondents age 75 or older are more likely than respondents in the other two age
categories to say they cannot spend much time to learn about something they really want
to know about (14% vs. 4% for those 50-59 and 8% for those 60-74).
Financial Investment
Education. Adults with a college or post-graduate education are willing to spend almost
twice as much money as those with less than a college degree to learn about something
they are extremely interested in or have always wanted to learn about (median
investment: $197 vs. $106 some college and $100 high school or less: Table A8, Appendix
A).
Income. Further, respondents with higher incomes are also willing to spend more
money on learning. The typical adult age 50 or older with an income of more than
$75,000 is willing to spend $170—more than one and one-half times the amount that
those with lower household incomes are willing to spend ($102: Table A8, Appendix A).
These findings are not surprising as education and income are closely related. Those
with higher levels of education are more likely to have higher incomes and are, therefore,
better able to make a larger financial investment in learning. Respondents show no
gender or age differences in the median financial investment they are willing to make
(Table A18, Appendix A).

AARP Survey on Lifelong Learning
36

AARP Survey on Lifelong Learning
37
CHAPTER THREE: INCIDENCE AND IMPACT OF MAJOR LIFE EVENTS
Adults age 50 and older were asked about a variety of different life events and how these events have affected their lives within the past 12 months. An objective of this study is to explore the relationship between life stage context and learning among older adults. This exploration assumes that within each stage of the life course, different environmental events influence both short- and long-term developmental processes and outcomes, such as learning, for adults. We describe here the reported incidence and impact of major life events.
In addition to questions about learning, respondents were asked if they had experienced
major life changes within the past 12 months. These events included going back to
school, experiencing a personal illness or illness in the family, making lifestyle changes,
and having a death in the immediate family. If respondents experienced these events,
they were asked to rate the effect on their life.
Four in ten adults age 50 and older report a change in diet or level of physical activity–
the most common of all events about which we asked. A sizable minority (40%) of those
who experienced this change say it had a major impact on their lives. Fewer people
experienced other events, but they reported those experiences had a greater impact on
their lives than dietary or physical activity changes (Table A22, Appendix A).
Three events touch roughly one-quarter to one-third of adults 50 and older and have a
major effect on at least half of the adults who experience them (Table A22, Appendix A).
• Having a major illness in the immediate family, but not including the respondent (34% of adults age 50 and older have experienced this, of which 56% report this event had a major effect on their lives)
• Having a death in the immediate family (26% of adults age 50 and older have experienced this, and 56% of those report this event had a major effect on their lives)
• Becoming a caregiver for a parent or elderly family member (18% have experienced this of which 50% report this experience had a major effect on their lives)

AARP Survey on Lifelong Learning
38
Events occurring still less frequently but with major impact include:
• Becoming a caregiver for a child or grandchild (16% of adults age 50 and older have experienced this, of which 42% report that it had a major effect on their lives)
• Retiring for the first time (14% experienced this, of which 42% report it had a major effect on them)
Education and Income. Those with less education and income are more likely to have
experienced three life events:
• Having a death in the immediate family (29% of those with a high school or less education and 25% of those with some college versus 19% of those with at least a college degree)(Table A23, Appendix A)
• Becoming a caregiver for a child or grandchild (18% of those with high school or less education and 15% of those with some college versus 10% of those with a college degree or higher)(Table A24, Appendix A)
• Becoming a grandparent (33% of those with the least education and 28% of those with some education versus 17% of those with a college degree or higher)(Table A27, Appendix A)
Those with higher educational status are more likely to have experienced three life
events:
• Had a child go to college (16% college graduates versus 12% with some college)(Table A23, Appendix A)
• Received a degree, diploma, or certification (12% of those with some college and 13% of those with a college or higher degree versus 5% of those with a high school or less education)(Table A28, Appendix A)
• Gone back to school to finish a degree or certification or to get an advanced degree or certification (10% of those with some college and those with at least a college degree versus 3% of those with a high school or less degree)(Table A29, Appendix A)
Those with lower incomes are more likely to have experienced three life events:
• Becoming a grandparent (34% of those with less than $50,000 in household income versus 25% of those with household incomes between $50,000 and $75,000 and 20% of those with incomes above $75,000)(Table A27, Appendix A)
• Having a death in the immediate family (29% of those with less than $50,000 in household income versus 20% of those with $75,000 or more in household income)(Table A23, Appendix A)
• Received a degree, diploma, or certification (11% of those with household incomes of $75,000 or more versus 6% of those with household incomes less than $50,000)(Table A28, Appendix A)

AARP Survey on Lifelong Learning
39
In contrast, those with higher income are more likely to have had a child go to college
(21% of those with $75,000 or more in household income versus 10% of those with less
than $50,000 in household income and 12% of those with household incomes between
$50,000 and $75,000)(Table A23, Appendix A).
These data for education and income suggest that individuals with less education and
income may experience certain events (such as caregiving or overcoming a death in the
family) as more stressful events than those with more education and income.
Gender. Women are more likely than men to have experienced a death in their
immediate family (31% versus 21%) and to have become a caregiver for a parent or
elderly family member (22% versus 14%). Men, on the other hand, are more likely to
report that they have had a child go to college (16% of men versus 9% of women)(Tables
A30 and A31, Appendix A).
Age. Adults age 50 – 59 are very involved with their families and continue to pursue
new accomplishments as evidenced by their life experiences relative to their older
counterparts. They are more likely to have:
• Become a caregiver for a child or grandchild (19% of those age 50 – 59 vs. 14% of those age 60 – 74 and 13% of those age 75 and older)(Table A31, Appendix A)
• Had a child go to college (18% of those age 50 – 59 vs. 10% of those age 60 – 74 and 5% of those who are 75 or older)(Table A30, Appendix A)
• Had their last child move out of their home (15% of those age 50 – 59 vs. 10% of those 60 – 74 and 7% of those age 75 or older)(Table A32, Appendix A)
• Had an adult child move back into their home (15% of those age 50 – 59 vs. 9% of those age 60 – 74 and 6% of those age 75 or older)(Table A32, Appendix A)
• Received a degree, diploma or certification (10% of respondents age 50 – 59 vs. 6% of respondents age 60 – 74)(Table A35, Appendix A)
• Gone back to school to finish a degree or certification or to get an advanced degree or certification (9% of those age 50 – 59 vs. 4% of those age 60 – 74 and 3% of those age 75 or older)(Table A36, Appendix A)
As one might expect, adults age 60 to 74 are more likely than those 50 to 59 years old to
have retired for the first time in the past year (19% versus 9%)(Table A33, Appendix A).

AARP Survey on Lifelong Learning
40

AARP Survey on Lifelong Learning
41
CHAPTER FOUR: TELEPHONE VERSUS ONLINE INTERVIEWING
Online respondents are more likely than those interviewed by telephone to use the Internet for searching for information about what they want to learn about. Both groups agree, however, that first-hand experience is the best way they learn about something. Knowing what is going on in the world around them is the primary motivation for learning for both telephone and online respondents. Online respondents more often prefer individual learning environments, are more likely to want to use their newly acquired skills, and are more eager to want to learn about their favorite hobby or an advanced skill immediately.
This chapter explores the similarities and differences between those who were
interviewed by telephone and those who were interviewed via the Internet. Since both
samples were balanced demographically to match the national population, any
remaining differences between them are probably not attributable to demographic
characteristics. Gaps that continue to exist may be the result of actual differences
between the two populations, differences in sampling, differences in interviewing
methods, or even some interaction between these things. Without additional analyses, it
is impossible to be certain.9
Ways Older Adults Typically Learn
Regardless of whether they were interviewed by telephone or via the Internet,
respondents express a strong preferences for learning by reading newspaper or magazine
articles, books, or journals (Table A37, Appendix A). However, adults interviewed via
the Internet are even more likely than those interviewed by telephone to say they learn
using these media always or most of the time (68% vs. 60%). Not surprisingly,
respondents who were interviewed over the Internet are also more likely than those
interviewed by phone to say that they always or most of the time learn by "searching the
Internet" (56% vs. 14%)" or "buying or borrowing computer-based tutorials" (16% vs.
7%). The 42% difference between Internet and phone samples on "searching the
Internet" is the largest difference noted between the two samples. The difference is even
9 Appendix C contains annotated questionnaires for the telephone and online data combined and separately.

AARP Survey on Lifelong Learning
42
more dramatic when we add the other positive response category “some of the time” to
the above percentage totals for each sample. When we do, 97% of the Internet sample
and 33% of the phone sample "search the Internet" to learn at least some of the time.
Best Ways to Learn
Respondents are uniform in their agreement that the two “best” ways to learn are by
putting their hands on something and figuring it out; or by watching, listening, and then
thinking. Roughly nine out of ten respondents mention both of these learning methods
(Table A38, Appendix A).
Telephone respondents are more likely than those who responded by Internet to strongly
or somewhat agree that they learn best when using four methods:
• In a group where they can share with other learners (74% of phone
respondents vs. 61% of online respondents) • With an instructor, guide, tutor, or mentor in a face-to-face situation (82% vs.
73%) • By watching, listening, and then thinking (93% vs. 88%) • In a formal teacher-classroom setting (59% vs. 48%)
Why Older Adults Want to Learn
Older adults overall, regardless of the interviewing method, overwhelmingly agree that
they want to learn for three reasons:
• To keep up with what’s going on in the world (94% of phone respondents and
93% of online respondents) • For the simple joy of learning something new (90% and 93%) • For their own spiritual or personal growth (93% and 89%)(Table A39,
Appendix A) However, respondents who were interviewed by telephone are more likely than those
who responded to the survey via the Internet to strongly or somewhat agree that they
want to learn for eight of the thirteen reasons about which they were asked. Telephone
respondents are more likely than online respondents to say they want to learn for these
reasons:

AARP Survey on Lifelong Learning
43
• To help other people (88% vs. 75%) • To better manage their everyday lives (88% vs. 81%) • To understand and get along better with others (86% vs. 70%) • To talk about things with their children and grandchildren (85% vs. 75%) • To understand themselves better (80% vs. 67%) • To give back something to their community (78% vs. 52%) • To know the basic skills they need everyday (68% vs. 58%) • To earn a degree or certification that will advance their career or allow them
to make more money (35% of phone respondents vs. 26% of online respondents)
Given the number and direction (the telephone sample always responding with higher
agreement than the online sample) of significant differences between telephone and
online respondents regarding their motivations to learn, it seems reasonable to assume
that some of these differences are attributable to differences in the interviewing method
rather than to real differences between the respondents themselves. Other mixed-mode
surveys also show this response pattern where telephone responders are more in
agreement with certain items than those responding to Internet and mail
questionnaires.10
When Older Adults Want to Use What They Learn
Adults age 50 and older who responded online are much more likely than those who
responded by telephone to say they would like to use what they have learned
immediately or very soon after they have learned it (64% vs. 45%).
Interest in Various Subjects
The largest percentage of older adults interviewed by telephone or via the Internet say
they are extremely or very interested in learning about their favorite hobby or pastime
(Table A40, Appendix A). Notably, however, respondents answering online are
considerably more likely to express this level of interest in this topic than are those
interviewed by telephone (72% vs. 51%).
The only other topic garnering this much interest among online respondents is how to
10 Dillman, D.A. (2000). Mailed and Internet Surveys: The Tailored Design Method, 2nd Edition. New York: Wiley.

AARP Survey on Lifelong Learning
44
master an advanced skill. Seven in ten online respondents (70%) say they are extremely
or very interested in using a computer, becoming fluent in a foreign language, or
preparing taxes. In sharp contrast, half as many telephone respondents note the same
level of interest in mastering such advanced skills (34%).
Adults interviewed via the Internet are also more likely than those interviewed by
telephone to say they are extremely or very interested in learning about five topics:
• Getting more enjoyment or pleasure out of life (55% of online respondents vs.
47% of telephone respondents) • Weight control (47% of online respondents vs. 37% of telephone respondents) • Educational travel opportunities (38% of online respondents vs. 23% of
telephone respondents) • Alternative medicines (38% of online respondents vs. 25% of telephone
respondents) • Arts and culture (35% of online respondents vs. 25% of telephone
respondents) One possible explanation for these differences is that adults who are online may not only
be generally more innovative in their learning tools but also more interested in learning
about new and different things rather than solidifying their current skill base.
Preferred Learning Formats
Generally, online respondents who express an interest in various topics are more apt
than are telephone respondents to say they prefer to learn it in an individual-based
environment. In contrast, telephone respondents generally express a preference for
learning in a group setting (Table A41 and Table A42, Appendix A).
Consistent with this pattern, telephone respondents are more likely than online
respondents to say they prefer a group setting, such as a classroom, workshop, or group,
to learn about five of the 17 surveyed topics:
• Spiritual or personal growth (59% of telephone respondents vs. 46% of online
respondents) • More enjoyment out of life (56% of telephone respondents vs. 45% of online
respondents) • Advanced skills (54% of telephone respondents vs. 42% of online
respondents)

AARP Survey on Lifelong Learning
45
• Weight control (46% of telephone respondents vs. 33% of online respondents) • Their health status (46% of telephone respondents vs. 31% of online
respondents) Further, the preference for individually-based learning environments among online
respondents is especially pronounced for ten of the subjects:
• Their health status (69% of online respondents vs. 50% of telephone
respondents) • Alternative medicines (65% of online respondents vs. 48% of telephone
respondent) • Weight control (64% of online respondents vs. 47% of telephone respondents) • Hobbies or pastimes (63% of online respondents vs. 48% of telephone
respondents) • Stress management (61% of online respondents vs. 47% of telephone
respondent) • Advanced skills (58% of online respondents vs. 45% of telephone
respondents) • Career advancement (57% of online respondents vs. 41% of telephone
respondents) • More enjoyment from life (52% of online respondents vs. 36% of telephone
respondents) • Spiritual or personal growth (51% of online respondents vs. 32% of telephone
respondents) • Arts and culture (45% of online respondents vs. 29% of telephone
respondents) One possible explanation for these findings may be that adults who are online and who
use a computer either have grown accustomed to—or were already inclined to opt for—
individually-based learning formats.
Investment of Time
Control over the amount of time learning takes is important to all adults. Roughly equal
proportions of those who were interviewed by either method say they would spend
some time learning if they could control when and how much (50% of phone
respondents and 45% of online respondents: Table A43, Appendix A). Adults who
responded online, however, are more likely than those who responded by phone to state
that they would spend all the time it takes to learn about something that they really want
to know (38% vs. 21%).
AARP Survey on Lifelong Learning
46
In contrast, those who responded by phone are more likely than those who responded
online to say they cannot spend much time in learning (12% vs. 2%), even though the
overall percentage is much lower than for the other response options.
Financial Investment
Respondents, whether interviewed by phone or via the Internet, are typically willing to
spend a maximum of $101 to learn about something in which they are extremely
interested or about which they have always wanted to learn more. However, those
interviewed via the Internet are more likely than those interviewed by phone to say they
are willing to spend between $1 and $99 (33% vs. 13%), between $100 and $499 (33% vs.
15%), or between $500 and $1999 (13% vs. 7%) (Table A44, Appendix A).11
11 Note that the median is based on those giving a dollar figure. The percentage responding in each dollar range is based on the total sample including those “not sure/refused.”

AARP Survey on Lifelong Learning
47
APPENDIX A TABLES
How to Read a Table: Table values represent percentages (%). Subscripts indicate column differences. For example, in Table A4 (Question 21B), 22A in column B indicates a percentage that is significantly (p < .05) higher than the percentage in column A. That is to say, 95 times out of 100, this difference would not have happened by chance.

AARP Survey on Lifelong Learning
48
Table A1 Degree of Interest in Learning Various Skills
Extremely
interested Very
interested Somewhat interested
Not very interested
Not at all interested
A. Having a healthy diet and nutrition % 22 28 34 9 7
B. Exercise and fitness % 15 24 37 14 10
C. Weight control % 19 23 31 13 13
D. How to manage stress % 22 25 29 15 9
E. How to measure your own personal health status
% 19 28 34 11 6
F. Alternative medicine or remedies such as acupuncture, medicinal herbs, or aroma therapy
% 14 17 30 19 19
G. How to get ahead in your job or career, or how to find a new one
% 10 11 21 21 35
H. How to master an advanced skill, such as using a computer, becoming fluent in a foreign language, or preparing taxes
% 24 28 24 9 14
I. Basic life skills, such as reading, writing, or basic math or learning to drive
% 9 11 22 24 32
J. Your favorite hobby or pastime % 28 33 26 7 5
K. How to give back or get involved in your local community
% 8 16 41 21 13
L. How to become a volunteer in your community
% 6 11 38 26 18
M. More about arts and culture, or other personal enrichment opportunities
% 13 17 35 22 12
N. How to get more enjoyment or pleasure out of life
% 22 29 32 11 6
O. Educational travel opportunities % 13 17 29 21 18
P. More about spiritual or personal growth
% 20 23 32 15 10
Q. More about understanding and getting along with others
% 15 24 41 13 7
Q106. Please rate whether or not you would be extremely interested, very interested, somewhat interested, not very interested, or not at all interested in learning about... Base: All respondents (n=1019)

AARP Survey on Lifelong Learning
49
Table A2 Preferred Format in Which to Learn about Desired Skills
Class-
room Work- shop
Group Tutor/ pro
Teaching yourself
Self study
Internet Some- thing else
A. Having a healthy diet and nutrition (n=503)
% 7 12 14 9 28 13 14 3
B. Exercise and fitness (n=399) % 7 11 22 14 24 10 8 3
C. Weight control (n=430) % 6 12 21 12 24 11 10 5
D. How to manage stress (n=470) % 7 16 19 10 20 13 11 4
E. How to measure your own personal health status (n=486)
% 7 16 16 16 19 11 14 2
F. Alternative medicine or remedies such as acupuncture, medicinal herbs, or aroma therapy (n=321)
% 10 14 15 14 13 14 17 3
G. How to get ahead in your job or career, or how to find a new one (n=214)
% 10 23 12 13 12 10 15 5
H. How to master an advanced skill, such as using a computer, becoming fluent in a foreign language, or preparing taxes (n=532)
% 23 17 6 21 14 9 10 1
I. Basic life skill, such as reading, writing, or basic math or learning to drive (n=205)
% 23 8 10 16 22 10 4 8
J. Your favorite hobby or pastime (n=630) % 5 20 14 10 27 9 11 4
K. How to give back or get involved in your local community (n=241)
% 4 30 35 3 8 7 5 7
L. How to become a volunteer in your community (n=172)
% 4 27 40 3 11 2 4 8
(Cont’d)

AARP Survey on Lifelong Learning
50
Table A2 (Cont'd) Preferred Format in Which to Learn about Desired Skills
Class- room
Work- shop
Group Tutor/ pro
Teaching yourself
Self study
Internet Some- thing else
M. More about arts and culture, or other personal enrichment opportunities (n=304)
% 12 24 20 4 14 7 12 6
N. How to get more enjoyment or pleasure out of life (n=522)
% 4 18 28 6 19 12 8 5
O. Educational travel opportunities (n=309)
% 8 19 19 7 11 8 25 3
P. More about spiritual or personal growth (n=432)
% 7 13 32 7 17 12 5 6
Q. More about understanding and getting along with others (n=388)
% 7 19 34 6 17 9 5 4
Q116. If you wanted to learn more about …, which of the following formats would you MOST PREFER to use to learn about it? Base: Extremely/very interested in topic

AARP Survey on Lifelong Learning
51
Table A3
Preference for Group versus Individual Learning Formats
Base Group Individual Gap A. Having a healthy diet and nutrition 503 % 33 64 +31
B. Exercise and fitness 399 % 41 56 +15
C. Weight control 430 % 39 56 +17
D. How to manage stress 470 % 41 54 +13
E. How to measure your own personal health status
486 % 38 60 +22
F. Alternative medicine or remedies, such as acupuncture, medicinal herbs, or aromatherapy
321 % 39 58 +19
G. How to get ahead in your job career, or how to find a new one
214 % 45 50 +5
H. How to master an advanced skill, such as using a computer, becoming fluent in a foreign language or preparing taxes
532 % 46 53 +7
I. Basic life skill, such as reading, writing, or basic math or leaning to drive
205 % 41 52 +11
J. Your favorite hobby or pastime 630 % 40 57 +17
K. How to give back or get involved in your local community
241 % 69 24 -45
L. How to become a volunteer in your community
172 % 71 21 -50
M. More about arts and culture, or other personal enrichment
304 % 56 38 -18
(Cont’d)

AARP Survey on Lifelong Learning
52
Table A3 (Cont'd)
Preference for Group versus Individual Learning Formats
Base Group Individual Gap N. How to get more enjoyment or pleasure out of life
522 % 50 45 -5
O. Educational travel opportunities 309 % 46 51 +5
P. More about spiritual or personal growth 432 % 53 41 -12
Q. More about understanding and getting along with others
388 % 60 37 -23
Q116. If you wanted to learn more about…. which of the following formats would you most prefer to use to learn about it. Base: Extremely/Very interested in topic Note: Group learning consists of those saying they preferred classroom, workshops or group. Individual consists of those saying they preferred tutor or professional, teaching yourself, self study courses, or the Internet.

AARP Survey on Lifelong Learning
53
Table A4 Ways Older Adults Learn by Education and Income
Always/Most of the Time (net)
Education Income
Total H.S. or less
Some college
College grad or higher
Less than $50
$50k to $75k
$75k or more
A B C D E F Base: 1019 586 213 213 552 145 197 % % % % % % % When I want or need to learn something I:
A. Find someone to teach me who knows about the topic, such as a friend, co-worker, family member
41 46BC 37 33 43F 41 39
B. Take classes or attend community seminars or workshops
18 13 22A 27A 17 18 22
C. Look for educational or informational television or radio programs
26 27 25 23 32EF 18 14
D. Read newspaper articles, magazine articles, books, or journals
64 61 65 73AB 65 66 63
E. Search the Internet for information
35 33 37 41A 35 39 41
F. Buy, rent, or borrow audio or video tapes
9 9 11 7 11E 5 7
G. Buy or borrow computer-based teaching programs (tutorials)
12 11 14 10 13 10 12
H. Start by doing what I want to learn about and learn from my mistakes and successes
44 44 45 39 48F 40 36
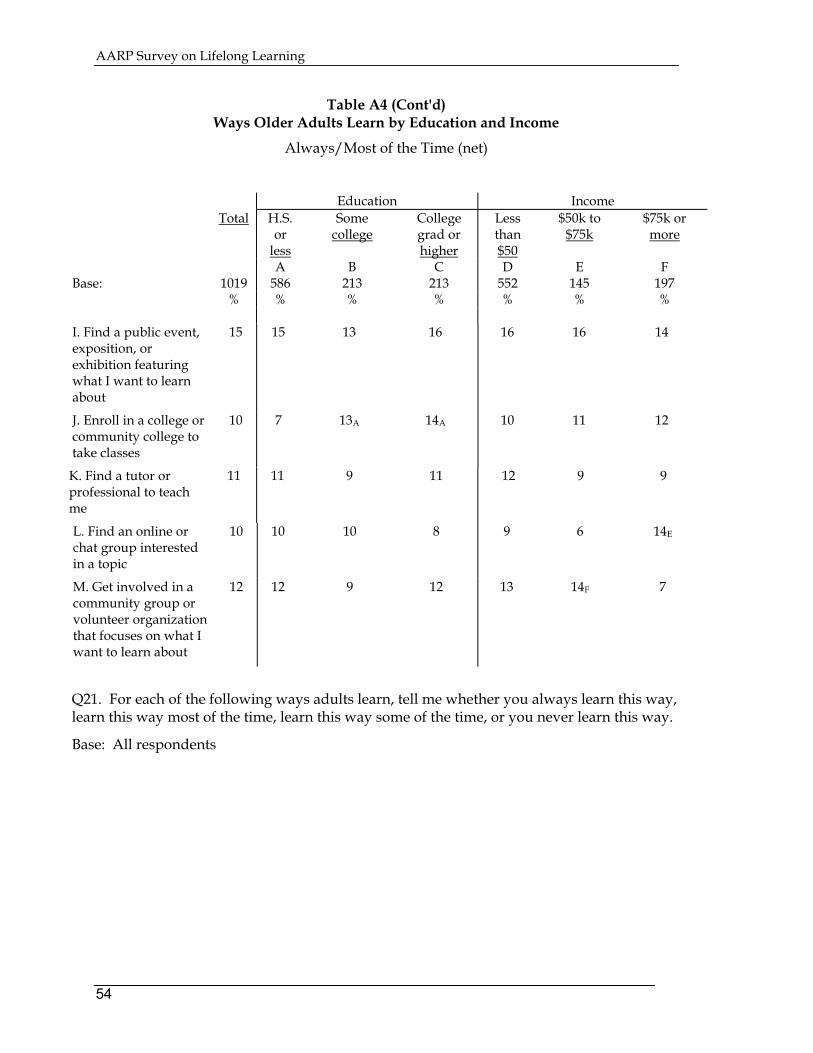
AARP Survey on Lifelong Learning
54
Table A4 (Cont'd) Ways Older Adults Learn by Education and Income
Always/Most of the Time (net)
Education Income
Total H.S. or
less
Some college
College grad or higher
Less than $50
$50k to $75k
$75k or more
A B C D E F Base: 1019 586 213 213 552 145 197 % % % % % % % I. Find a public event, exposition, or exhibition featuring what I want to learn about
15 15 13 16 16 16 14
J. Enroll in a college or community college to take classes
10 7 13A 14A 10 11 12
K. Find a tutor or professional to teach me
11 11 9 11 12 9 9
L. Find an online or chat group interested in a topic
10 10 10 8 9 6 14E
M. Get involved in a community group or volunteer organization that focuses on what I want to learn about
12 12 9 12 13 14F 7
Q21. For each of the following ways adults learn, tell me whether you always learn this way, learn this way most of the time, learn this way some of the time, or you never learn this way.
Base: All respondents

AARP Survey on Lifelong Learning
55
Table A5 Best Ways to Learn by Education and Income
Strongly Agree/Somewhat Agree (net)
Education Income Total H.S. or
less Some
college College grad or higher
Less than $50
$50k to $75k
$75k or more
A B C D E F Base: 1019 586 213 213 552 145 197 % % % % % % % I learn best…
A. In a group where I can share with other learners
68 68 69 64 67 64 68
B. When I have a guide, instructor, tutor, or mentor in a face-to-face situation
78 78 80 75 77 78 79
C. By putting my hands on something and playing with it or figuring it out
90 90 91 89 91 92 90
D. By watching or listening and then thinking about it
90 92C 91C 86 91 91 87
E. In a formal teacher-classroom situation
53 49 57A 60A 53 50 59
F. By gathering as much information as I can find and then teaching myself
83 85 83 81 86 79 82
G. By finding self-study courses that let me set my own objectives and then moving at my own pace
69 69 74C 63 74F 68 59
Q71. These next few statements focus on the best ways for you, personally, to learn. Please tell us if you strongly agree, somewhat agree, neither agree nor disagree, somewhat disagree, or strongly disagree with them. Base: All respondents

AARP Survey on Lifelong Learning
56
Table A6 Why Older Adults Want to Learn by Education and Income
Strongly Agree/Somewhat Agree (net)
Education Income Total H.S. or
less Some
college College grad or higher
Less than $50k
$50k to $75k
$75k or more
Base: 1019 586 213 213 552 145 197 A B C D E F % % % % % % % I want to learn…
A. So I can improve my job skills to make work easier or to get ahead
55 52 59A 60A 51 67D 63D
B. So I can earn a degree or certification that will advance my career to help me earn more money
31 27 37A 35A 28 35 38D
C. So I can enjoy my hobbies or recreational activities better
86 86 85 91B 85 91 89
D. So I can manage my everyday life better
84 84 87 84 86 88 83
E. So I know the basic skills I need every day, such as reading, writing, basic math, or learning how to drive
63 67C 63C 52 66 62 58
F. For the simple joy of learning something new
91 91 92 91 92 94 93
G. So I can give back something to my community
65 61 72A 69A 65 68 63
H. So I can understand myself better
73 74 75 70 76 70 73
I. So I can understand and get along with others better
78 78 82C 75 80 81 74
(Cont’d)

AARP Survey on Lifelong Learning
57
Table A6 (Cont'd) Why Older Adults Want to Learn by Education and Income
Strongly Agree/Somewhat Agree (net)
Education Income Total H.S. or
less Some
college College grad or higher
Less than $50k
$50k to $75k
$75k or more
Base: 1019 586 213 213 552 145 197 A B C D E F
J. So I can help other people
82 79 86A 83 83 80 81
K. So I can keep up with what's going on in the world
93 92 94 95 94 93 95
L. So I can talk about things with my children or grandchildren
80 82C 80 74 84EF 76 75
M. For my own spiritual or personal growth
91 91 92 92 93E 88 91
Q51. These next statements describe why you want to learn. Tell us whether you strongly agree, somewhat agree, neither agree nor disagree, somewhat disagree, or strongly disagree with each one. Base: All respondents

AARP Survey on Lifelong Learning
58
Table A7 Time Investment by Education and Income
Education Income
Total H.S. or less
Some college
College grad or higher
Less than $50k
$50k to $75k
$75k or more
A B C D E F
Base: 1019 586 213 213 552 145 197
% % % % % % %
I will spend all the time it takes to learn about something I really want to know
30 28 32 32 29 26 38E
I will spend some time, if I can control when and how much
47 45 49 53 46 56D 49
I will spend some time even if I cannot control when and how much
7 8 5 8 7 8 6
I can't spend much time to learn about something I really want to know
7 9C 6 3 9EF 2 3
It depends 7 8 7 4 7 6 4
Don't know 1 1 1 * 1 1 *
Refused 1 1 * * 1 * -
Q200. Which of the following four statements best describes how much time you are willing to invest? Base: All respondents NOTE: An asterisk (*) signifies a value of less than one-half percent (0.5%). A dash (-) represents a value of zero.

AARP Survey on Lifelong Learning
59
Table A8 Financial Investment by Education and Income
Education Income Total H.S. or
less Some
college College grad or higher
Less than $50K
$50K to $75K
$75K or more
A B C D E F
Base: 1019 586 213 213 552 145 197
% % % % % % %
$0 16 20BC 13C 7 18EF 10 9
$1-$99 23 26C 22 18 26 23 21
$100-$499 24 21 26 31A 24 30 27
$500-$1999 10 5 13A 19AB 6 16D 18D
$2000+ 4 2 4 10AB 3 3 10DE
Mean $520 $310 $460 $974AB $372 $399 $981E
Median $101 $100 $106A $197AB $102 $102D $170DE
Don't know 19 20 19 15 19 17 12
Refused 4 5C 3C * 4 2 2
Q205. How much would you be willing to pay, AT MOST, to learn about something you are extremely interested in or have always wanted to learn more about? Base: All respondents NOTE: An asterisk (*) signifies a value of less than one-half percent (0.5%). A dash (-) represents a value of zero.

AARP Survey on Lifelong Learning
60
Table A9 When Older Adults Want to Use What They Learn by Education and Income
Education Income Total H.S. or
less Some
college College grad or higher
Less than $50
$50k to $75k
$75k or more
A B C D E F Base: 1019 586 213 213 552 145 197 % % % % % % %
I want to use what I learn immediately or very soon after I learn it
55 57C 55 48 56 55 56
I am willing to wait to use what I learn some time in the near future
28 26 30 32 27 31 28
I am willing to wait to use what I learn for a long period of time
14 14 12 16 15 11 11
Don't know 3 2 2 4 2 2 4
Refused 1 1 1 * 1 - *
Q60. Which of the following statements best describes WHEN you want to use what you learn. Base: All respondents NOTE: An asterisk (*) signifies a value of less than one-half percent (0.5%). A dash (-) represents a value of zero.

AARP Survey on Lifelong Learning
61
Table A10 Strong Interest in Learning Various Skills by Education and Income
Extremely/Very Interested (Net)
Education Income
Total H.S. or less
Some college
College grad or higher
Less than $50
$50k to $75k
$75k or more
A B C D E F
Base: 1019 586 213 213 552 145 197
% % % % % % %
A. Having a healthy diet and nutrition
49 50 50 46AB 49 50 49
B. Exercise and fitness 39 37 37 46AB 39 43 44
C. Weight control 42 43 43 39 44 43 43
D. How to manage stress
46 49C 44 40 48 45 46
E. How to measure your own personal health status
48 48 49 47 48 52 47
F. Alternative medicine or remedies, such as acupuncture, medicinal herbs, or aromatherapy
32 31 36C 28 35 31 27
G. How to get ahead in your job or career, or how to find a new one
21 20 22 22 19 23 25
H. How to master an advanced skill, such as using a computer, becoming fluent in a foreign language, or preparing taxes
52 48 56A 60A 51 57 60
(Cont’d)

AARP Survey on Lifelong Learning
62
Table A10 (Cont'd)
Strong Interest in Learning Various Skills by Education and Income
Extremely/Very Interested (Net) Education Income
Total H.S. or less
Some college
College grad or higher
Less than $50
$50k to $75k
$75k or more
A B C D E F
I. Basic life skills, such as reading, writing, or basic math or learning to drive
20 22 18 16 21 19 19
J. Your favorite hobby or pastime
62 58 66A 68A 60 63 70D
K. How to give back or get involved in your local community
24 20 28A 28A 23 22 25
L. How to become a volunteer in your community
17 15 19 20 17 20 17
M. More about arts and culture, or other personal enrichment
30 21 37A 47AB 27 31 39D
N. How to get more enjoyment or pleasure out of life
51 51 52 52 50 56 55
O. Educational travel opportunities
30 24 35A 43AB 25 36 D 46 D
P. More about spiritual or personal growth
42 41 45 43 43 45 37
Q. More about understanding and getting along with others
38 38 41 34 40 38 35
Q106. Please rate whether or not you would be extremely interested, very interested, somewhat interested, not very interested, or not at all interested in learning about… Base: All respondents

AARP Survey on Lifelong Learning
63
Table A11 Prefer Group Learning Format by Education and Income
(% saying classroom, workshops, or group)
Education Income
Total H.S. or less
Some college
College grad or higher
Less than $50
$50k to $75k
$75k or more
A B C D E F
% % % % % % %
A. Having a healthy diet and nutrition (n=503)
33 27 39A 43A 33 38 32
B. Exercise and fitness (n=399)
41 37 42 47 40 45 39
C. Weight control (n=430) 39 40 35 40 41 35 37
D. How to manage stress (n=470)
41 39 38 52AB 40 40 39
E. How to measure your own personal health status (n=486)
38 40 37 37 39 39 34
F. Alternative medicine or remedies, such as acupuncture, medicinal herbs, or aromatherapy (n=321)
39 35 42 47 41 48F 27
G. How to get ahead in your job or career, or how to find a new one (n=214)
45 42 55 42 43 53 39
H. How to master an advanced skill, such as using a computer, becoming fluent in a foreign language or preparing taxes (n=532)
46 41 48 55A 44 47 52
I. Basic life skill, such as reading, writing, or basic math or learning to drive (n=205)
41 37 45 53 42 46 45
J. Your favorite hobby or pastime (n=630)
40 37 44 42 38 38 42
K. How to give back or get involved in your local community (n=241)
69 65 75 73 67 74 69
(Cont’d)

AARP Survey on Lifelong Learning
64
Table A11 (Cont'd)
Prefer Group Learning Format by Education and Income
(% saying classroom, workshops, or group) Education Income
Total H.S. or less
Some college
College grad or higher
Less than $50
$50k to $75k
$75k or more
A B C D E F
L. How to become a volunteer in your community (n=172)
71 69 75 71 66 77 78
M. More about arts and culture, or other personal enrichment (n=304)
56 55 59 56 61 56 52
N. How to get more enjoyment or pleasure out of life (n=522)
50 47 54 53 49 50 53
O. Educational travel opportunities (n=309)
46 46 52C 40 50F 57F 35
P. More about spiritual or personal growth (n=432)
53 50 57 55 51 58 52
Q. More about understanding and getting along with others (n=388)
60 55 67A 65 60 65 60
Q116. If you wanted to learn more about… which of the following formats would you most prefer to use to learn about it.
Base: Extremely/Very interested in topic
NOTE: Number of cases for total sample are given beside each item.

AARP Survey on Lifelong Learning
65
Table A12 Prefer Individual Learning Format by Education and Income
(% saying tutor, teaching yourself, self-study, or Internet)
Education Income
Total H.S. or less
Some college
College grad or higher
Less than $50
$50k to $75k
$75k or more
A B C D E F
% % % % % % %
A. Having a healthy diet and nutrition (n=503)
64 69BC 58 56 64 59 68
B. Exercise and fitness (n=399)
56 59 54 51 56 48 60
C. Weight control (n=430) 56 55 58 59 54 57 62
D. How to manage stress (n=470)
54 55 60C 47 56 56 60
E. How to measure your own personal health status (n=486)
60 58 59 62 59 58 66
F. Alternative medicine or remedies, such as acupuncture, medicinal herbs, or aromatherapy (n=321)
58 60 57 52 56 51 73DE
G. How to get ahead in your job or career, or how to find a new one (n=214)
50 52 44 55 49 47 60
H. How to master an advanced skill, such as using a computer, becoming fluent in a foreign language or preparing taxes (n=532)
53 58C 51 45 55 53 48
I. Basic life skill, such as reading, writing, or basic math or learning to drive (n=205)
52 56 49 37 50 51 49
J. Your favorite hobby or pastime (n=630)
57 58 54 57 59 59 56
K. How to give back or get involved in your local community (n=241)
24 26 23 18 26 22 22
(Cont’d)

AARP Survey on Lifelong Learning
66
Table A12 (Cont'd)
Prefer Individual Learning Format by Education and Income
(% saying tutor, teaching yourself, self-study or Internet)
Education Income
Total H.S. or less
Some college
College grad or higher
Less than $50
$50k to $75k
$75k or more
A B C D E F
% % % % % % %
L. How to become a volunteer in your community. (n=172)
21 21 23 22 23 20 19
M. More about arts and culture, or other personal enrichment. (n=304)
38 40 37 37 35 38 42
N. How to get more enjoyment or pleasure out of life. (n=522)
45 46 44 45 47 49 43
O. Educational travel opportunities. (n=309)
51 52 46 54 48 43 60E
P. More about spiritual or personal growth. (n=432)
41 42 39 42 43 39 46
Q. More about understanding and getting along with others. (n=388)
37 40 31 34 36 35 40
Q116. If you wanted to learn more about which of the following formats would you most prefer to use to learn about it. Base: Extremely/Very interested in topic
NOTE: Number of cases for total sample are given beside each item.

AARP Survey on Lifelong Learning
67
Table A13 Ways Older Adults Learn by Gender and Age
Always/Most of the Time (net)
Gender Age
Total Male Female 50 - 59 60-74 75+
A B C D E
Base: 1019 464 555 410 465 142
% % % % % %
When I want or need to learn something I:
A. Find someone to teach me who knows about the topic, such as a friend, co-worker, family member
41 41 42 46D 37 41
B. Take classes or attend community seminars or workshops
18 17 19 19 17 18
C. Look for educational or informational television or radio programs
26 21 31A 23 29 27
D. Read newspaper articles, magazine articles, books, or journals
64 62 66 57 70C 65
E. Search the Internet for information 35 36 35 38E 37E 24
F. Buy, rent, or borrow audio or video tapes 9 9 9 8 11 5
G. Buy or borrow computer-based teaching programs (tutorials)
12 13 10 11 12 11
H. Start by doing what I want to learn about and learn from my mistakes and successes
44 44 44 41 44 52C
I. Find a public event, exposition, or exhibition featuring what I want to learn about
15 15 16 16 15 14
(Cont’d)
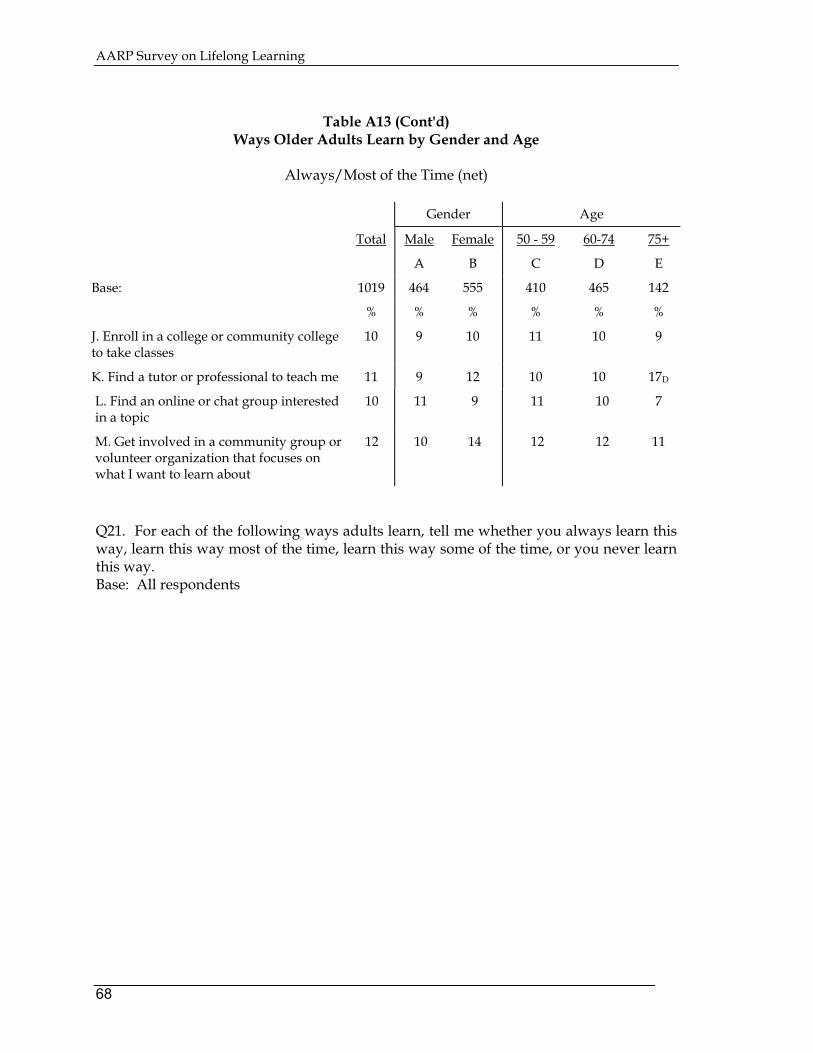
AARP Survey on Lifelong Learning
68
Table A13 (Cont'd)
Ways Older Adults Learn by Gender and Age
Always/Most of the Time (net)
Gender Age
Total Male Female 50 - 59 60-74 75+
A B C D E
Base: 1019 464 555 410 465 142
% % % % % %
J. Enroll in a college or community college to take classes
10 9 10 11 10 9
K. Find a tutor or professional to teach me 11 9 12 10 10 17D
L. Find an online or chat group interested in a topic
10 11 9 11 10 7
M. Get involved in a community group or volunteer organization that focuses on what I want to learn about
12 10 14 12 12 11
Q21. For each of the following ways adults learn, tell me whether you always learn this way, learn this way most of the time, learn this way some of the time, or you never learn this way. Base: All respondents

AARP Survey on Lifelong Learning
69
Table A14
Best Ways to Learn by Gender and Age
Strongly Agree/Somewhat Agree (net)
Gender Age Total Male Female 50 - 59 60-74 75+ A B C D E Base: 1019 464 555 410 465 142 I learn best…
% % % % % %
A. In a group where I can share with other learners
68 64 70 70E 69E 58
B. When I have a guide, instructor, tutor, or mentor in a face-to-face situation
78 77 78 81E 78E 67
C. By putting my hands on something and playing with it or figuring it out
90 93B 87 90 90 89
D. By watching or listening and then thinking about it
90 91 90 90 90 93
E. In a formal teacher-classroom situation
53 52 55 57 51 52
F. By gathering as much information as I can find and then teaching myself
83 87B 80 83 84 84
G. By finding self-study courses that let me set my own objectives and then moving at my own pace
69 68 70 68 70 67
Q71. These next few statements focus on the best ways for you, personally, to learn. Please tell us if you strongly agree, somewhat agree, neither agree nor disagree, somewhat disagree, or strongly disagree with them. Base: All respondents

AARP Survey on Lifelong Learning
70
Table A15 Why Older Adults Want to Learn by Gender and Age
Strongly Agree/Somewhat Agree (net) Gender Age
Total Male Female 50-59 60-74 75+
A B C D E
Base: 1019 464 555 410 465 142
I want to learn… % % % % % %
A. So I can improve my job skills to make work easier or to get ahead
55 58 52 74DE 45E 33
B. So I can earn a degree or certification that will advance my career to help me earn more money
31 30 31 44DE 24 16
C. So I can enjoy my hobbies or recreational activities better
86 88 85 89 86 82
D. So I can manage my everyday life better
84 83 86 85 82 88
E. So I know the basic skills I need every day, such as reading, writing, basic math, or learning how to drive
63 66 61 63 62 67
F. For the simple joy of learning something new
91 90 92 92 92 88
G. So I can give back something to my community
65 63 67 68 63 62
H. So I can understand myself better 73 70 76A 78D 70 74
I. So I can understand and get along with others better
78 76 80 80 76 82
J. So I can help other people 82 81 82 85 79 79
K. So I can keep up with what's going on in the world
93 94 92 92 95 92
L. So I can talk about things with my children or grandchildren
80 75 84A 78 82 79
M. For my own spiritual or personal growth
91 89 93A 91 91 95
Q51. These next statements describe why you want to learn. Tell us whether you strongly agree, somewhat agree, neither agree nor disagree, somewhat disagree, or strongly disagree with each one. Base: All respondents

AARP Survey on Lifelong Learning
71
Table A16 Time Investment by Gender and Age
Gender Age Total Male Female 50 - 59 60-74 75+ A B C D E Base: 1019 464 555 410 465 142 % % % % % %
I will spend all the time it takes to learn about something I really want to know
30 32 27 31 30 25
I will spent some time, if I can control when and how much
47 48 47 50 47 41
I will spend some time even if I cannot control when and how
7 6 9 7 8 6
I can't spend much time to learn about something I really want to know
7 6 8 4 8C 14CD
It depends 7 7 7 7 6 11D
Don't know 1 * 2 A 1 1 2
Refused 1 1 * * 1 1
Q200. Which of the following four statements best describes how much time you are willing to invest? Base: All respondents NOTE: An asterisk (*) signifies a value of less than one-half (0.5%). A dash (-) represents a value of zero.

AARP Survey on Lifelong Learning
72
Table A17 When Older Adults Want to Use What They Learn by Gender and Age
Gender Age Total Male Female 50 - 59 60-74 75+ A B C D E Base: 1019 464 555 410 465 142 % % % % % % I want to use what I learn immediately or very soon after I learn it
55 53 56 58E 56E 40
I am willing to wait to use what I learn some time in the near future
28 31 26 29 24 41CD
I am willing to wait to use what I learn for a long period of time
14 14 14 10 17C 17C
Don't know 3 3 3 3 3 1
Refused 1 1 1 * 1 1
Q60. Which of the following statements best describes WHEN you want to use what you learn. Base: All respondents NOTE: An asterisk (*) signifies a value of less than one-half (0.5%). A dash (-) represents a value of zero.

AARP Survey on Lifelong Learning
73
Table A18 Financial Investment by Gender and Age
Gender Age Total Male Female 50 - 59 60-74 75+ A B C D E Base: 1019 464 555 410 465 142 % % % % % %
$0 16 14 18 8 20C 26C
$1-$99 23 19 27A 26E 23 15
$100-$499 24 26 23 25 25 19
$500-$1999 10 13B 7 13E 9 5
$2000+ 4 5 3 6DE 3 1
Mean $520 $643B $411 $658 $424 $297
Median $101 $105 $100 $103 $101 $105
Don't know 19 20 18 18 17 27D
Refused 4 3 4 2 4 6
Q205. How much would you be willing to pay, AT MOST, to learn about something you are extremely interested in or have always wanted to learn more about? Base: All respondents

AARP Survey on Lifelong Learning
74
Table A19 Strong Interest in Learning Various Skills by Gender and Age
Extremely/Very Interested (Net)
Gender Age
Total Male Female 50-59 60-74 75+
A B C D E
Base: 1019 464 555 410 465 142
% % % % % %
A. Having a healthy diet and nutrition
49 47 52 50 51 43
B. Exercise and fitness 39 37 41 42 39 32
C. Weight control 42 39 45 44E 45E 27
D. How to manage stress
46 43 48 51E 45 35
E. How to measure your own personal health status
48 46 49 48 49 42
F. Alternative medicine or remedies, such as acupuncture, medicinal herbs, or aromatherapy
32 26 36A 32E 35E 18
G. How to get ahead in your job or career, or how to find a new one
21 20 22 34DE 13 8
H. How to master an advanced skill, such as using a computer, becoming fluent in a foreign language, or preparing taxes
52 48 56A 56E 52E 40
(Cont’d)

AARP Survey on Lifelong Learning
75
Table A19 (Cont'd) Strong Interest in Learning Various Skills by Gender and Age
Extremely/Very Interested (Net)
Gender Age
Total Male Female 50-59 60-74 75+
A B C D E
Base: 1019 464 555 410 465 142
% % % % % %
I. Basic life skill, such as reading, writing, or basic math or learning to drive
20 23B 18 24D 17 19
J. Your favorite hobby or pastime
62 64 60 65E 63E 50
K. How to give back or get involved in your local community
24 23 24 21 26 22
L. How to become a volunteer in your community
17 16 18 15 19 16
M. More about arts and culture, or other personal enrichment
30 25 34A 28 32 28
N. How to get more enjoyment or pleasure out of life
51 50 52 51 54 45
O. Educational travel opportunities
30 30 31 31 33E 21
P. More about spiritual or personal growth
42 35 48A 42 44 40
Q. More about understanding and getting along with others
38 37 39 37 38 40
Q106. Please rate whether or not you would be extremely interested, very interested, somewhat interested, not very interested, or not at all interested in learning about… Base: All respondents

AARP Survey on Lifelong Learning
76
Table A20 Prefer Individual Learning by Gender and Age
(% saying tutor, teaching yourself, self-study, or Internet)
Gender Age Total Male Female 50 to 59 60 to 74 75+ A B C D E % % % % % % A. Having a healthy diet and nutrition (n=503)
64 66 63 64 64 65
B. Exercise and fitness (n=399) 56 59 53 57 54 61 C. Weight control (n=430) 56 60 54 58 56 54 D. How to manage stress (n=470) 54 53 55 56 51 62 E. How to measure your own personal health status (n=486)
60 61 58 57 61 63
F. Alternative medicine or remedies, such as acupuncture, medicinal herbs, or aromatherapy (n=321)
58 53 61 58 59 53
G. How to get ahead in your job career, or how to find a new one (n=214)
50 49 51 51 48 53
H. How to master an advanced skill, such as using a computer, becoming fluent in a foreign language or preparing taxes (n=532)
53 53 54 50 55 59
I. Basic life skill, such as reading, writing, or basic math or learning to drive (n=205)
52 57 45 52 52 50
J. Your favorite hobby or pastime (n=630)
57 64B 50 60 54 56
K. How to give back or get involved in your local community (n=241)
24 24 23 24 23 28
L. How to become a volunteer in your community (n=172)
21 23 20 22 16 39
M. More about arts and culture, or other personal enrichment (n=304)
38 45B 34 37 39 36
N. How to get more enjoyment or pleasure out of life (n=522)
45 47 43 48 43 42
O. Educational travel opportunities (n=309)
51 50 51 53 48 56
P. More about spiritual or personal growth (n=432)
41 41 42 48E 40 27
Q. More about understanding and getting along with others (n=388)
37 35 37 31 42 33
Q116. If you wanted to learn more about which of the following formats would you most prefer to use to learn about it. Base: Extremely/Very interested in topic
NOTE: Number of cases for total sample are beside each item.

AARP Survey on Lifelong Learning
77
Table A21 Prefer Group Learning Format by Gender and Age
(% saying classroom, workshop, or group)
Gender Age Total
Male
Female 50 - 59 60 - 74 75 +
A B C D E % % % % % % A. Having a healthy diet and nutrition (n=503)
33 30 35 34 32 30
B. Exercise and fitness (n=399) 41 35 45 42 43 29 C. Weight control (n=430) 39 35 42 40 40 28 D. How to manage stress. (n=470) 41 43 40 43 42 30 E. How to measure your own personal health status (n=486)
38 36 40 42 36 32
F. Alternative medicine or remedies, such as acupuncture, medicinal herbs, or aromatherapy.(n=321)
39 41 37 42 38 32
G. How to get ahead in your job career, or how to find a new one (n=214)
45 41 48 44 46 47
H. How to master an advanced skill, such as using a computer, becoming fluent in a foreign language or preparing taxes (n=532)
46 47 45 50 43 40
I. Basic life skill, such as reading, writing, or basic math or leaning to drive (n=205)
41 33 49A 43 38 39
J. Your favorite hobby or pastime (n=630) 40 31 48A 38 42 35 K. How to give back or get involved in your local community (n=241)
69 68 69 68 69 70
L. How to become a volunteer in your community (n=172)
71 67 74 73 74 55
M. More about arts and culture, or other personal enrichment (n=304)
56 50 60 57 55 61
N. How to get more enjoyment or pleasure out of life (n=522)
50 46 54 47 52 54
O. Educational travel opportunities (n=309)
46 47 45 46 48 40
P. More about spiritual or personal growth (n=432)
53 49 55 50 54 56
Q. More about understanding and getting along with others (n=388)
60 60 59 67D 54 60
Q116. If you wanted to learn more about which of the following formats would you most prefer to use to learn about it. Base: Extremely/Very interested in topic
NOTE: Number of cases for total sample are beside each item.

AARP Survey on Lifelong Learning
78
Table A22 Incidence and Impact of Major Life Events
Incidence Impact Yes, has
happened Base Major
effect Moderate
effect Very little effect
No effect at
all % % % % % G. Making a major change
in your diet or level of physical activity
40 410 40 39 17 3
J. Having a major illness in your immediate family (not including yourself)
34 344 56 31 7 4
I. Becoming a grandparent
29 292 32 26 14 10
A. Having a death in your immediate family
26 270 56 32 5 6
K. You personally having a major illness
23 232 61 26 8 4
C. Becoming a caregiver for a parent or elderly family member
18 185 50 29 12 7
D. Becoming a caregiver for a child or grandchild
16 161 42 25 17 14
H. Retiring for the first time
14 143 42 25 19 12
I. Having a child go to college
12 126 20 36 18 22
B. Having your last child move out of your home
12 119 23 36 24 16
F. Having an adult child move back into your home
11 112 27 37 25 7
M. Going back to school to finish a degree or certification or to get an advanced degree or certification
6 59 14 27 17 2
L. Getting a degree, diploma, or certification (online only)
4 41 24 39 18 11
Q81. Please tell us which of the following has happened to you, personally, during the past 12 months.
Q91 How would you rate the effect this event had on you life? Would you say it had no effect at all, very little effect, a moderate effect, or a major effect on your life?
Base: All respondents NOTE: An asterisk (*) signifies a value of less than one-half (0.5%). A dash (-) represents a value of zero.

AARP Survey on Lifelong Learning
79
Table A23 Incidence and Impact of Major Life Events by Education and Income
A. Having a death in your immediate family
Education Income Total High
school or less
Some college
College grad or higher
Less than $50k
$50k to $75k
$75k or more
A B C D E F Base: All respondents 1019 586 213 213 552 145 197 % % % % % % %
Has happened 26 29C 25C 19 29F 28 20
Base: Major change 270 172 53 40 163 40 40 % % % % % % % A moderate effect/A major effect (net)
88 90 81 91 89 86 93
No effect at all/Very little effect (net)
11 9 18 9 11 11 7
B. Having a child go to college
Education Income Total High
school or less
Some college
College grad or higher
Less than $50k
$50k to $75k
$75k or more
A B C D E F Base: All respondents 1019 586 213 213 552 145 197 % % % % % % %
Has happened 12 11 12 16A 10 12 21DE
Base: Major change 126 63 26 35 53 18 42 % % %` % % % % A moderate effect/A major effect (net)
56 44 66 70 50 56 62
No effect at all/Very little effect (net)
40 49 34 29 44 39 38
Q81. Please tell us which of the following has happened to you, personally, during the past 12 months. Q91. How would you rate the effect this event had on your life? Would you say it had no effect at all, very little effect, a moderate effect, or a major effect on your life? Base: All respondents NOTE: An asterisk (*) signifies a value of less than one-half (0.5%). A dash (-) represents a value of zero.

AARP Survey on Lifelong Learning
80
Table A24 Incidence and Impact of Major Life Events by Education and Income
C. Becoming a caregiver for a parent or elderly family member Education Income Total High
school or less
Some college
College grad or higher
Less than $50k
$50k to $75k
$75k or more
A B C D E F Base: All respondents 1019 586 213 213 552 145 197 % % % % % % %
Has happened 18 18 21C 15 20 17 14
Base: Major change 185 107 44 31 111 25 28 % % % % % % % A moderate effect/A major effect (net)
78 70 87A 94A 72 94 87
No effect at all/Very little effect (net)
18 26C 12 4 24 6 11
D. Becoming a caregiver for a child or grandchild
Education Income Total High
school or less
Some college
College grad or higher
Less than $50k
$50k to $75k
$75k or more
A B C D E F Base: All respondents 1019 586 213 213 552 145 197 % % % % % % %
Has happened 16 18C 15C 10 17 14 16
Base: Major change 161 106 33 21 94 20 31 % % % % % % % A moderate effect/A major effect (net)
67 61 76 77 64 81 59
No effect at all/Very little effect (net)
31 36 21 21 32 19 40
Q81. Please tell us which of the following has happened to you, personally, during the past 12 months. Q91. How would you rate the effect this event had on your life? Would you say it had no effect at all, very little effect, a moderate effect, or a major effect on your life? Base: All respondents
NOTE: An asterisk (*) signifies a value of less than one-half (0.5%). A dash (-) represents a value of zero.

AARP Survey on Lifelong Learning
81
Table A25 Incidence and Impact of Major Life Events by Education and Income
E. Having your last child move out of your home Education Income Total High
school or less
Some college
College grad or higher
Less than $50k
$50k to $75k
$75k or more
A B C D E F Base: All respondents 1019 586 213 213 552 145 197 % % % % % % %
Has happened 12 12 11 12 13 11 12
Base: Major change 119 69 23 25 69 17 24 % % % % % % % A moderate effect/A major effect (net)
59 51 64 77 51 74 75
No effect at all/Very little effect (net)
40 48 36 21 48 24 24
F. Having an adult child move back into your home
Education Income
Total High school or less
Some college
College grad or higher
Less than $50k
$50k to $75k
$75k or more
A B C D E F Base: All respondents 1019 586 213 213 552 145 197 % % % % % % %
Has happened 11 10 12 13 11 10 14
Base: Major change 112 58 25 27 59 15 27 % % % % % % % A moderate effect/A major effect (net)
65 62 73 64 67 62 57
No effect at all/Very little effect (net)
32 34 25 35 30 36 41
Q81. Please tell us which of the following has happened to you, personally, during the past 12 months. Q91. How would you rate the effect this event had on your life? Would you say it had no effect at all, very little effect, a moderate effect, or a major effect on your life? Base: All respondents NOTE: An asterisk (*) signifies a value of less than one-half (0.5%). A dash (-) represents a value of zero.

AARP Survey on Lifelong Learning
82
Table A26 Incidence and Impact of Major Life Events by Education and Income
G. Making a major change in your diet or level of physical activity
Education Income Total High
school or less
Some college
College grad or higher
Less than $50k
$50k to $75k
$75k or more
A B C D E F Base: All respondents 1019 586 213 213 552 145 197 % % % % % % %
Has happened 40 39 44 39 43 36 41
Base: Major change 410 230 93 83 236 52 81 % % % % % % % A moderate effect/A major effect (net)
79 75 83 87A 77 88D 78
No effect at all/Very little effect (net)
20 24C 15 12 21 11 21
H. Retiring for the first time
Education Income Total High
school or less
Some college
College grad or higher
Less than $50k
$50k to $75k
$75k or more
A B C D E F Base: All respondents 1019 586 213 213 552 145 197 % % % % % % %
Has happened 14 15 13 12 15 14 11
Base: Major change 143 88 27 25 83 20 22 % % % % % % %
A moderate effect/A major effect (net)
68 62 77 78 69 65 65
No effect at all/Very little effect (net)
31 38C 20 21 30 35 34
Q81. Please tell us which of the following has happened to you, personally, during the past 12 months. Q91. How would you rate the effect this event had on your life? Would you say it had no effect at all, very little effect, a moderate effect, or a major effect on your life? Base: All respondents NOTE: An asterisk (*) signifies a value of less than one-half (0.5%). A dash (-) represents a value of zero.

AARP Survey on Lifelong Learning
83
Table A27 Incidence and Impact of Major Life Events by Education and Income
I. Becoming a grandparent
Education Income Total High
school or less
Some college
College grad or higher
Less than $50k
$50k to $75k
$75k or more
A B C D E F Base: All respondents 1019 586 213 213 552 145 197 % % % % % % %
Has happened 29 33C 28C 17 34EF 25 20
Base: Major change 292 193 60 37 190 36 40 % % % % % % % A moderate effect/A major effect (net)
57 61 51 51 58 66 54
No effect at all/Very little effect (net)
24 26 21 21 25 20 20
J. Having a major illness in your immediate family (not including yourself)
Education Income Total High
school or less
Some college
College grad or higher
Less than $50k
$50k to $75k
$75k or more
A B C D E F Base: All respondents 1019 586 213 213 552 145 197 % % % % % % %
Has happened 34 34 35 31 36 36 27
Base: Major change 344 201 74 65 200 52 54 % % % % % % % A moderate effect/A major effect (net)
87 87 86 89 89 86 80
No effect at all/Very little effect (net)
12 11 13 11 9 14 18
Q81. Please tell us which of the following has happened to you, personally, during the past 12 months. Q91. How would you rate the effect this event had on your life? Would you say it had no effect at all, very little effect, a moderate effect, or a major effect on your life? Base: All respondents NOTE: An asterisk (*) signifies a value of less than one-half (0.5%). A dash (-) represents a value of zero.

AARP Survey on Lifelong Learning
84
Table A28
Incidence and Impact of Major Life Events by Education and Income
K. You personally having a major illness Education Income Total High
school or less
Some college
College grad or higher
Less than $50k
$50k to $75k
$75k or more
A B C D E F Base: All respondents 1019 586 213 213 552 145 197 % % % % % % %
Has happened 23 24 21 20 25F 21 16
Base: Major change 232 142 45 42 137 31 32 % % % % % % % A moderate effect/A major effect (net)
86 87 83 87 86 93 81
No effect at all/Very little effect (net)
12 11 15 13 12 7 18
L. Getting a degree, diploma, or certification (online only)
Education Income Total High
school or less
Some college
College grad or higher
Less than $50k
$50k to $75k
$75k or more
Base: All respondents 511 292 107 107 288 76 103 % % % % % % %
Has happened 8 5 12A 13A 6 10 11D
Base: Major change 41 14 13 14 18 8 12 % % % % % % % A moderate effect/A major effect (net)
63 50 66 75A 65 65 69
No effect at all/Very little effect (net)
29 34 29 25 22 35 31
Q81. Please tell us which of the following has happened to you, personally, during the past 12 months. Q91. How would you rate the effect this event had on your life? Would you say it had no effect at all, very little effect, a moderate effect, or a major effect on your life? Base: All respondents NOTE: An asterisk (*) signifies a value of less than one-half (0.5%). A dash (-) represents a value of zero.

AARP Survey on Lifelong Learning
85
Table A29 Incidence and Impact of Major Life Events by Education and Income
M. Going back to school to finish a degree or certification or to get an advanced degree
or certification Education Income Total High
school or less
Some college
College grad or higher
Less than $50k
$50k to $75k
$75k or more
A B C D E F Base: All respondents 1019 586 213 213 552 145 197 % % % % % % %
Has happened 6 3 10A 10A 5 5 9
Base: Major change 59 15 21 22 29 8 17 % % % % % % % A moderate effect/A major effect (net)
41 31 46 45 47 41 35
No effect at all/Very little effect (net)
18 43 5 15 10 35 16
Don't know 14 - 24 16 15 - 25 Q81. Please tell us which of the following has happened to you, personally, during the past 12 months. Q91. How would you rate the effect this event had on your life? Would you say it had no effect at all, very little effect, a moderate effect, or a major effect on your life? Base: All respondents NOTE: An asterisk (*) signifies a value of less than one-half (0.5%). A dash (-) represents a value of zero.

AARP Survey on Lifelong Learning
86
Table A30 Incidence and Impact of Major Life Events by Gender and Age
A. Having a death in your immediate family
Gender Age Total Male Female 50 to 59 60 to 74 75 or
older A B C D E Base: All respondents 1019 464 555 410 465 142 % % % % % %
Has happened 26 21 31A 27 26 27
Base: Major change 270 98 172 110 121 38 % % % % % % A moderate effect/A major effect (net)
88 77 95A 85 91 90
No effect at all/Very little effect (net)
11 22B 4 14 8 10
B. Having a child go to college
Gender Age Total Male Female 50 to 59 60 to 74 75 or
older A B C D E Base: All respondents 1019 464 555 410 465 142 % % % % % % Has happened 12 16B 9 18DE 10 5
Base: Major change 126 74 51 74 45 7 % % % % % % A moderate effect/A major effect (net)
56 49 66 59 51 57
No effect at all/Very little effect (net)
40 48 29 40 43 22
Q81. Please tell us which of the following has happened to you, personally, during the past 12 months. Q91. How would you rate the effect this event had on your life? Would you say it had no effect at all, very little effect, a moderate effect, or a major effect on your life? Base: All respondents NOTE: An asterisk (*) signifies a value of less than one-half (0.5%). A dash (-) represents a value of zero.

AARP Survey on Lifelong Learning
87
Table A31 Incidence and Impact of Major Life Events by Gender and Age
C. Becoming a caregiver for a parent or elderly family member
Gender Age Total Male Female 50 to 59 60 to 74 75 or
older A B C D E Base: All respondents 1019 464 555 410 465 142 % % % % % %
Has happened 18 14 22A 18 18 18
Base: Major change 185 63 122 75 84 25 % % % % % %
A moderate effect/A major effect (net)
78 73 81 84 74 76
No effect at all/Very little effect (net)
18 23 16 15 24 11
D. Becoming a caregiver for a child or grandchild
Gender Age Total Male Female 50 to 59 60 to 74 75 or
older A B C D E Base: All respondents 1019 464 555 410 465 142 % % % % % %
Has happened 16 13 18 19D 14 13
Base: Major change 161 62 99 79 64 18 % % % % % %
A moderate effect/A major effect (net)
67 60 71 64 67 78
No effect at all/Very little effect (net)
31 39 26 36 28 20
Q81. Please tell us which of the following has happened to you, personally, during the past 12 months. Q91. How would you rate the effect this event had on your life? Would you say it had no effect at all, very little effect, a moderate effect, or a major effect on your life? Base: All respondents NOTE: An asterisk (*) signifies a value of less than one-half (0.5%). A dash (-) represents a value of zero.

AARP Survey on Lifelong Learning
88
Table A32 Incidence and Impact of Major Life Events by Gender and Age
E. Having your last child move out of your home
Gender Age Total Male Female 50 to 59 60 to 74 75 or
older A B C D E Base: All respondents 1019 464 555 410 465 142 % % % % % %
Has happened 12 11 13 15DE 10 7
Base: Major change 119 49 70 63 46 10 % % % % % %
A moderate effect/A major effect (net)
59 46 68 65 56 32
No effect at all/Very little effect (net)
40 53 31 34 43 65
F. Having an adult child move back into your home
Gender Age Total Male Female 50 to 59 60 to 74 75 or
older A B C D E
Base: All respondents 1019 464 555 410 465 142 % % % % % %
Has happened 11 11 11 15DE 9 6
Base: Major change 112 53 59 62 41 9 % % % % % %
A moderate effect/A major effect (net)
65 59 70 62 68 70
No effect at all/Very little effect (net)
32 38 27 37 29 11
Q81. Please tell us which of the following has happened to you, personally, during the past 12 months. Q91. How would you rate the effect this event had on your life? Would you say it had no effect at all, very little effect, a moderate effect, or a major effect on your life? Base: All respondents
NOTE: An asterisk (*) signifies a value of less than one-half (0.5%). A dash (-) represents a value of zero.

AARP Survey on Lifelong Learning
89
Table A33 Incidence and Impact of Major Life Events by Gender and Age
G. Making a major change in your diet or level of physical activity
Gender Age Total Male Female 50 to 59 60 to 74 75 or
older A B C D E Base: All respondents 1019 464 555 410 465 142 % % % % % %
Has happened 40 41 40 42 40 36
Base: Major change 410 188 222 174 186 50 % % % % % %
A moderate effect/A major effect (net)
79 78 80 80 81 69
No effect at all/Very little effect (net)
20 21 18 18 18 30
H. Retiring for the first time
Gender Age Total Male Female 50 to 59 60 to 74 75 or
older A B C D E Base: All respondents 1019 464 555 410 465 142 % % % % % %
Has happened 14 16 12 9 19C 14
Base: Major change 143 74 69 35 89 19 % % % % % %
A moderate effect/A major effect (net)
68 65 70 77 65 61
No effect at all/Very little effect (net)
31 33 29 21 34 36
Q81. Please tell us which of the following has happened to you, personally, during the past 12 months. Q91. How would you rate the effect this event had on your life? Would you say it had no effect at all, very little effect, a moderate effect, or a major effect on your life? Base: All respondents NOTE: An asterisk (*) signifies a value of less than one-half (0.5%). A dash (-) represents a value of zero.

AARP Survey on Lifelong Learning
90
Table A34
Incidence and Impact of Major Life Events by Gender and Age
I. Becoming a grandparent
Gender Age Total Male Female 50 to 59 60 to 74 75 or
older A B C D E Base: All respondents 1019 464 555 410 465 142 % % % % % %
Has happened 29 27 30 27 29 35
Base: Major change 292 123 169 109 134 49 % % % % % %
A moderate effect/A major effect (net)
57 53 60 62 55 56
No effect at all/Very little effect (net)
24 26 23 24 27 19
J. Having a major illness in your immediate family (not including yourself)
Gender Age Total Male Female 50 to 59 60 to 74 75 or
older A B C D E Base: All respondents 1019 464 555 410 465 142 % % % % % %
Has happened 34 26 40A 33 33 37
Base: Major change 344 119 225 136 154 53 % % % % % %
A moderate effect/A major effect (net)
87 80 91A 89 84 91
No effect at all/Very little effect (net)
12 18B 8 9 14 9
Q81. Please tell us which of the following has happened to you, personally, during the past 12 months. Q91. How would you rate the effect this event had on your life? Would you say it had no effect at all, very little effect, a moderate effect, or a major effect on your life? Base: All respondents
NOTE: An asterisk (*) signifies a value of less than one-half (0.5%). A dash (-) represents a value of zero.

AARP Survey on Lifelong Learning
91
Table A35 Incidence and Impact of Major Life Events by Gender and Age
K. You personally having a major illness
Gender Age Total Male Female 50 to 59 60 to 74 75 or
older A B C D E Base: All respondents 1019 464 555 410 465 142 % % % % % %
Has happened 23 25 21 21 24 25
Base: Major change 232 116 116 86 111 35
% % % % % %
A moderate effect/A major effect (net)
86 85 88 88 87 81
No effect at all/Very little effect (net)
12 14 11 10 12 18
L. Getting a degree, diploma, or certification (online only)
Gender Age Total Male Female 50 to 59 60 to 74 75 or
older
A B C D E Base: All respondents (Online only)
511 233 278 205 255 48
% % % % % %
Has happened 8 10 7 10D 6 8
Base: Major change 41 22 18 21 16 4
% % % % % %
A moderate effect/A major effect (net)
63 65 62 66 60 60
No effect at all/very little effect (net)
29 31 28 30 28 32
Q81. Please tell us which of the following has happened to you, personally, during the past 12 months. Q91. How would you rate the effect this event had on your life? Would you say it had no effect at all, very little effect, a moderate effect, or a major effect on your life? Base: All respondents
NOTE: An asterisk (*) signifies a value of less than one-half (0.5%). A dash (-) represents a value of zero.

AARP Survey on Lifelong Learning
92
Table A36
Incidence and Impact of Major Life Events by Gender and Age
M. Going back to school to finish a degree or certification or to get an advanced degree or certification
Gender Age Total Male Female 50 to 59 60 to 74 75 or
older A B C D E Base: All respondents 1019 464 555 410 465 142 % % % % % %
Has happened 6 6 5 9DE 4 3
Base: Major change 59 29 30 37 17 4
% % % % % %
A moderate effect/A major effect (net)
41 38 43 41 37 51
No effect at all/Very little effect (net)
18 18 19 14 24 35
Q81. Please tell us which of the following has happened to you, personally, during the past 12 months. Q91. How would you rate the effect this event had on your life? Would you say it had no effect at all, very little effect, a moderate effect, or a major effect on your life? Base: All respondents NOTE: An asterisk (*) signifies a value of less than one-half (0.5%). A dash (-) represents a value of zero.

AARP Survey on Lifelong Learning
93
Table A37 Ways Older Adults Learn Telephone versus Online
Always/Most of the time (net)
Total Phone Online Gap A B C Base: 1019 508 511 % % % When I want or need to learn something I:
A. Find someone to teach me who knows about the topic, such as a friend, co-worker, family member
41 44 39 -5
B. Take classes or attend community seminars or workshops
18 19 17 -2
C. Look for educational or informational television or radio programs
26 23 29 +6
D. Read newspaper articles, magazine articles, books, or journals
64 60 68B +8
E. Search the Internet for information 35B 14 56AB +42
F. Buy, rent, or borrow audio or video tapes 9 9 9 —
G. Buy or borrow computer-based teaching programs (tutorials)
12 7 16AB +9
H. Start by doing what I want to learn about and learn from my mistakes and successes
44 46 41 -5
I. Find a public event, exposition, or exhibition featuring what I want to learn about
15 15 15 —
J. Enroll in a college or community college to take classes
10 9 11 +2
K. Find a tutor or professional to teach me 11 12 9 -3
L. Find an online or chat group interested in a topic 10 8 12 +4
M. Get involved in a community group or volunteer organization that focuses on what I want to learn about
12 14 10 -4
Q21. For each of the following ways adults learn, tell me whether you always learn this way, learn this way most of the time, learn this way some of the time, or you never learn this way. Base: All respondents

AARP Survey on Lifelong Learning
94
Table A38 Best Ways to Learn
Telephone versus Online
Agree Agree Neutral Disagree Total Telephone Online Telephone Online Telephone Online Base: 1019 508 511 508 511 508 511 % % % % % % % A B C D E F G A. In a group where I can share with other learners
68 74AC 61 8 25AD 18 13
B. When I have a guide, instructor, tutor, or mentor in a face-to-face situation
78 82C 73 6 19AD 11 7
C. By putting my hands on something and playing with it or figuring it out
90 88 91 5 5 6G 3
D. By watching or listening and then thinking about it
90 93C 88 1 9AD 6 3
E. In a formal teacher-classroom situation
53C 59C 48 10 31AD 31G 21
F. By gathering as much information as I can find and then teaching myself
83 84 83 5 11AD 11G 6
G. By finding self-study courses that let me set my own objectives and then moving at my own pace
69 68 70 11 18D 20G 11
Q71. These next few statements focus on the BEST WAYS for you, personally, to learn. Base: All respondents
Note: Agree includes those responding “agree strongly” or “agree somewhat.” Disagree includes those respondents saying “disagree somewhat” or “disagree strongly.”
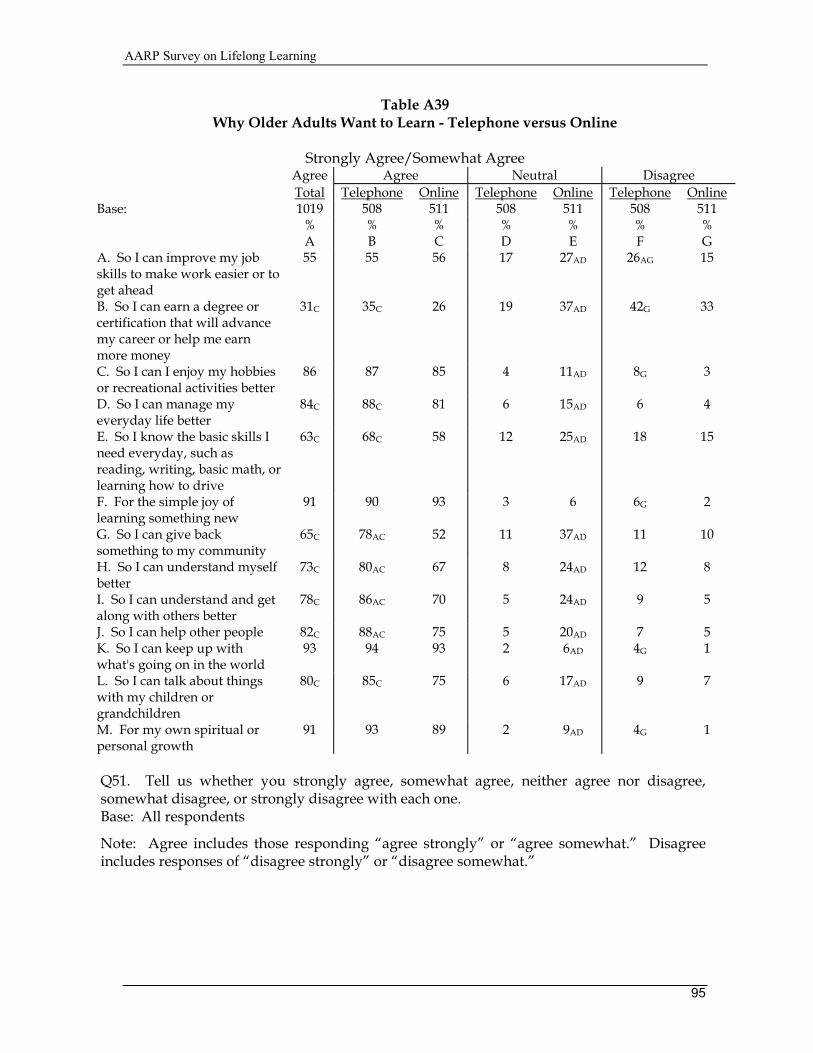
AARP Survey on Lifelong Learning
95
Table A39 Why Older Adults Want to Learn - Telephone versus Online
Strongly Agree/Somewhat Agree
Agree Agree Neutral Disagree Total Telephone Online Telephone Online Telephone Online Base: 1019 508 511 508 511 508 511 % % % % % % % A B C D E F G A. So I can improve my job skills to make work easier or to get ahead
55 55 56 17 27AD 26AG 15
B. So I can earn a degree or certification that will advance my career or help me earn more money
31C 35C 26 19 37AD 42G 33
C. So I can I enjoy my hobbies or recreational activities better
86 87 85 4 11AD 8G 3
D. So I can manage my everyday life better
84C 88C 81 6 15AD 6 4
E. So I know the basic skills I need everyday, such as reading, writing, basic math, or learning how to drive
63C 68C 58 12 25AD 18 15
F. For the simple joy of learning something new
91 90 93 3 6 6G 2
G. So I can give back something to my community
65C 78AC 52 11 37AD 11 10
H. So I can understand myself better
73C 80AC 67 8 24AD 12 8
I. So I can understand and get along with others better
78C 86AC 70 5 24AD 9 5
J. So I can help other people 82C 88AC 75 5 20AD 7 5 K. So I can keep up with what's going on in the world
93 94 93 2 6AD 4G 1
L. So I can talk about things with my children or grandchildren
80C 85C 75 6 17AD 9 7
M. For my own spiritual or personal growth
91 93 89 2 9AD 4G 1
Q51. Tell us whether you strongly agree, somewhat agree, neither agree nor disagree, somewhat disagree, or strongly disagree with each one. Base: All respondents
Note: Agree includes those responding “agree strongly” or “agree somewhat.” Disagree includes responses of “disagree strongly” or “disagree somewhat.”

AARP Survey on Lifelong Learning
96
Table A40 Interest in Learning Various Skills - Telephone versus Online
Extremely/Very Interested (net)
Total Phone Online Gap
A B C Base: 1019 508 511 % % % A. Having a healthy diet and nutrition 49 47 51 +4 B. Exercise and fitness 39 37 41 +4 C. Weight control 42 37 47AB +10 D. How to manage stress 46 46 47 +1 E. How to measure your own personal health status
48 46 49 +3
F. Alternative medicine or remedies, such as acupuncture, medicinal herbs, or aroma therapy
32 25 38AB +13
G. How to get ahead in your job or career, or how to find a new one
21 18 24 +6
H. How to master an advanced skill, such as using a computer, becoming fluent in a foreign language, or preparing taxes
52B 34 70AB +36
I. Basic life skills, such as reading, writing, or basic math or learning to drive
20C 25C 16 -9
J. Your favorite hobby or pastime 62B 51 72AB +21 K. How to give back or get involved in your local community
24 22 26 +4
L. How to become a volunteer in your community
17 16 18 +2
M. More about arts and culture, or other personal enrichment opportunities
30 25 35AB +10
N. How to get more enjoyment or pleasure out of life
51 47 55B +8
O. Educational travel opportunities 30 23 38AB +15 P. More about spiritual or personal growth 42 43 42 -1 Q. More about understanding and getting along with others
38 39 37 -2
Q106. Please rate whether or not you would be extremely interested, very interested, somewhat interested, not very interested, or not at all interested in learning about… Base: All respondents

AARP Survey on Lifelong Learning
97
Table A41
Prefer Group Learning Format Telephone versus Online
(% responding classroom, workshop, or group)
Total Phone Online Gap % % % A. Having a healthy diet and nutrition (p= 241 /o= 262)
33 35 30 -5
B. Exercise and fitness (p= 189/ o= 211) 41 42 40 -2 C. Weight control (p= 189/ o= 241) 39 46C 33 -13 D. How to manage stress (p= 232/ o= 238) 41 45 38 -7 E. How to measure your own personal health status (p= 234/ o= 252)
38 46C 31 -15
F. Alternative medicine or remedies such as acupuncture, medicinal herbs, or aroma therapy (p= 129/ o= 192)
39 45 34 -11
G. How to get ahead in your job or career, or how to find a new one (p= 93/ o= 121)
45 51 41 -10
H. How to master an advanced skill, such as using a computer, becoming fluent in a foreign language, or preparing taxes (p= 174/ o= 358)
46 54C 42 -12
I. Basic life skill, such as reading, writing, or basic math or learning to drive (p= 125/ o= 80)
41 44 35 -9
J. Your favorite hobby or pastime (p= 260/o= 370)
40 44 37 -7
K. How to give back or get involved in your local community (p= 111/ o= 131)
69 70 68 -2
L. How to become a volunteer in your community (p= 82/ o= 90)
71 78 65 -13
M. More about arts and culture, or other personal enrichment opportunities (p= 127/ o= 178)
56 59 54 -5
N. How to get more enjoyment or pleasure out of life (p= 241/ o= 281)
50 56C 45 -11
O. Educational travel opportunities (p= 117/ o= 192)
46 51 43 -8
P. More about spiritual or personal growth (p= 218/ o= 214)
53 59C 46 -13
Q. More about understanding and getting along with others (p=199/ o= 189)
60 61 58 -3
Q116. If you wanted to learn more about, which of the following formats would you MOST PREFER to use to learn about it? Base: Extremely/very interested in topic
NOTE: Number of cases for phone (p) and online (o) are given beside each item.

AARP Survey on Lifelong Learning
98
Table A42
Prefer Individual Learning Format - Telephone versus Online
(% responding tutor, self-teaching, self-study, or Internet) Total Phone Online Gap A B C % % % A. Having a healthy diet and nutrition (p= 241 /o= 262)
64 59 68 +9
B. Exercise and fitness (p= 189/ o= 211) 56 52 59 +7 C. Weight control (p= 189/ o= 241) 56 47 64AB +17 D. How to manage stress (p= 232/ o= 238) 54 47 61B +14 E. How to measure your own personal health status (p= 234/ o= 252)
60 50 69AB +19
F. Alternative medicine or remedies such as acupuncture, medicinal herbs, or aroma therapy (p= 129/ o= 192)
58 48 65B +17
G. How to get ahead in your job or career, or how to find a new one (p= 93/ o= 121)
50 41 57B +16
H. How to master an advanced skill, such as using a computer, becoming fluent in a foreign language, or preparing taxes (p= 174/ o= 358)
53 45 58B +13
I. Basic life skill, such as reading, writing, or basic math or learning to drive (p= 125/ o= 80)
52 46 60 +14
J. Your favorite hobby or pastime (p= 260/o= 370)
57 48 63AB +15
K. How to give back or get involved in your local community (p= 111/ o= 131)
24 20 27 +7
L. How to become a volunteer in your community (p= 82/ o= 90)
21 16 26 +10
M. More about arts and culture, or other personal enrichment opportunities (p= 127/ o= 178)
38 29 45B +16
N. How to get more enjoyment or pleasure out of life (p= 241/ o= 281)
45 36 52AB +16
O. Educational travel opportunities (p= 117/ o= 192)
51 46 54 +8
P. More about spiritual or personal growth (p= 218/ o= 214)
41B 32 51AB +19
Q. More about understanding and getting along with others (p=199/ o= 189)
37 32 42 +10
Q116. If you wanted to learn more about, which of the following formats would you MOST PREFER to use to learn about it? Base: Extremely/very interested in topic
NOTE: Number of cases for phone (p) and online (o) are given beside each item.

AARP Survey on Lifelong Learning
99
Table A43 Time Investment
Telephone versus Online
Total Phone Online Gap A B C Base: 1019 508 511 % % %
I will spend all the time it takes to learn about something I really want to know
30B 21 38AB +17
I will spent some time, if I can control when and how much
47 50 45 -5
I will spend some time even if I cannot control when and how much
7 9 6 -3
I can't spend much time to learn about something I really want to know
7C 12AC 2 -10
It depends 7 7 7 —
Don't know 1 * 2 +2
Refused 1 * 1 +1
Q200. Which of the following four statements best describes how much time you are willing to invest? Base: All respondents
NOTE: An asterisk (*) signifies a value of less than one-half percent (0.5%). A dash (-) represents a value of zero.

AARP Survey on Lifelong Learning
100
Table A44 Financial Investment
Telephone versus Online
Total Phone Online A B C Base: 1019 508 511 % % % $0 16 15 17
$1-99 23B 13 33AB
$100-499 24B 15 33AB
$500-1999 10 7 13AB
$2000+ 4 5C 3
Mean 520C 878AC 347
Median $101 $101 $102
Don’t know 19 38AC -
Refused 4C 7AC *
Q205. How much would you be willing to pay, AT MOST, to learn about something you are extremely interested in or have always wanted to learn more about? Base: All respondents
NOTE: An asterisk (*) signifies a value of less than one-half percent (0.5%). A dash (-) represents a value of zero.

AARP Survey on Lifelong Learning
101
APPENDIX B METHODOLOGY

AARP Survey on Lifelong Learning
102

AARP Survey on Lifelong Learning
103
METHODOLOGY
The AARP Survey on Lifelong Learning was conducted by telephone and online using the
same survey instrument with a weighted, nationally representative sample of 1,019
adults age 50 or older. The sample included 511 respondents answering via the Internet
and 508 interviewed by telephone. Bases and percentages reported are based on
combined weighted data. The survey averaged about 15 minutes in length and was
conducted August 27 - September 5, 1999.
Telephone Interviewing Procedures
The sample for the telephone survey was developed using a three-stage process. First,
Harris identified previous survey research projects conducted by their firm that utilized a
random digit dial methodology and included national samples of adults 18 and older as
the target population. Second, they identified and selected those respondents from these
studies who identified themselves as being aged 50 or older. Third, these people were
pooled into a single database and formed the pre-screened list used for interviewing on
this AARP project. During the interviewing process, respondents were re-screened to
determine their eligibility; and if they qualified as age 50 and older, they were
interviewed. This process made respondent selection as efficient as possible.
All telephone data collection was conducted from the telephone research centers of
Harris Interactive, Inc., located in Binghamton, NY; Rochester, NY; and Youngstown,
OH. Screening and interviewing for the study was conducted by Harris' professional
interviewing staff. Harris supervisory field staff regularly monitored interviewing
quality. The computerized telephone switching system independently recorded the
outcome of every call. In addition, the computer-assisted telephone interviewing (CATI)
system permitted online data entry and online data editing of the telephone interviews.
Telephone Sample Design
The telephone sample for this study was selected from age-appropriate respondents from
previously conducted Harris telephone surveys. Each of the prior studies was based on
a stratified random sampling process designed to produce representative samples of

AARP Survey on Lifelong Learning
104
persons in telephone households in the 48 contiguous United States (excluding Alaska
and Hawaii). These earlier telephone samples used random digit selection procedures
that assure equal representation of persons in both households which are "listed" in
telephone directories as well as persons in households which are "unlisted." These
samples are explicitly designed to ensure proper representation of households in
different regions of the country and in central city, suburban, and rural areas.
Control of the Telephone Sample
Each telephone number selected in the sample is given every opportunity to be included
in the study. Each number is called a minimum of three times on three separate days and
times. Numbers that initially refuse are called again for refusal conversation. Callbacks
are made at the respondent's convenience.
Telephone Response Rate
The response rate was calculated using the guidelines set forth by the American
Association for Public Opinion Research. More specifically, response rate one was used
and a response rate of 33% was achieved. The following formula was employed:
Response Rate = I/((I + P) + (R + NC + O) + (UH + UO)) = 33%
Table B1 is a summary of the final disposition codes and the number of pieces of sample
in each category:

AARP Survey on Lifelong Learning
105
Table B1
Telephone Sample Disposition
Disposition code Completed interview 508 Partial interview 90 Refusal and break off 79 Non-contact 420 Other 171 Unknown, if HH occupied 273 Unknown, other 0
Total sample used 1541
Response rate 33%
Online Interviewing Procedures
Online interviewing was employed as a second sample frame for this study for two
reasons. First, AARP anticipates future online programmatic efforts and wanted to learn
more about this emerging population. Second, with both telephone and online samples
included, we can further explore the differences between traditional methodologies, such
as telephone interviewing, and online surveys. Harris' proprietary online-interviewing
capability utilizes three components:
1. The Harris Poll Online (HPOL) database of over 5.3 million cooperative respondents who have opted to receive invitations to take part in online surveys
2. Harris' proprietary technology for e-mailing to large groups of respondents and enabling large numbers of respondents to simultaneously complete the survey online
3. Advanced survey interviewing techniques adapted to the online environment, including password protection, skip patterns, and visually appealing fonts and formatting

AARP Survey on Lifelong Learning
106
Interviews are conducted using a self-administered online questionnaire via Harris'
proprietary, web-assisted interviewing software. The Harris Online interviewing system
permits online data entry by the respondents.
Online Sample Selection
Samples for the Harris Poll Online (HPOL) surveys are drawn from the HPOL database
of approximately over 5.3 million households who are registered as participants in
Harris' online database. E-mail addresses for respondents in the database are obtained
from participation in the following sources: Harris Poll Online registration, the
Harris/Excite Poll, Harris Poll Online banner advertisements, Excite product
registrations, and Matchlogic sweepstakes.
A systematic approach was used to select the subset of database members who would be
invited to participate in this survey. First, all members of the HPOL database aged 50
and older were identified. At the same time, data from the 1998 U.S. Census Current
Population Survey (CPS)12 were used to develop a demographic profile of the 50 and
older population based on age, gender, education, income, race, and ethnicity. Second,
members of the HPOL database were selected as potential participants in proportion to
pre-determined targets for age and gender and were emailed invitations. During the
data collection phase, gender, age, education, income, race, and ethnicity were tracked to
their respective CPS targets for this population. Tracking revealed lower representation
among certain groups that are presently underrepresented in the HPOL database
including women, African-Americans, Hispanics, and those with lower incomes and
lower educational status. Third, a second email invitation was sent to the identified
sample targeting people meeting one or more of these particular demographic
characteristics in an attempt to achieve as close to a representative sample of the over-50
population as possible.
12 The Current Population Survey (CPS) is a nationally representative sample of the civilian, non-institutional population. The survey has been done on a monthly basis in about 50,000 households by the Census Bureau for more than 50 years and is the primary source of current demographic characteristics of the United States Population. The 1998 data were available when the survey was designed.

AARP Survey on Lifelong Learning
107
Control of the Online Sample
To maintain the reliability and integrity in the sample, Harris uses a password protection
procedure. Each invitation contains a password unique to that email address. A
respondent must enter the password at the beginning of the survey to gain access to the
survey. Password protection ensures that a respondent completes the survey only one
time and that any other non-invited respondent cannot use the URL.
Online Response Rate
The final sample disposition for the online portion of the survey is shown in Table M2.
The response rate is 34%. We calculated the response rate by dividing the number of
completes by the sum of the number of completes plus an estimate of the number of
eligible non-responders plus suspended interviews.
Response Rate = Completes/E (Non-responders) + Completes + Suspended Interviews
Where E= Estimated proportion of cases of unknown eligibility that are eligible. These
values, with reference to Table B2 are as follows:
Response rate = I = 34% (I/H) * [(C-(G+H)] + (I +G)

AARP Survey on Lifelong Learning
108
Table B2 Online Sample Disposition
Invitations A. First invitations mailed 15000 B. First invitations "bounced back" 3300 C. First invitations reaching destinations
11700
D. Second invitations mailed 10000 E. Second invitations "bounced back"
2000
F. Second invitations reaching destination
8000
G. Suspended interviews 1155 Interviews H. Total number of completed interviews
4235
I. Number of qualified respondents
2556
J. Number of screen-outs13 1679
Data Processing
Telephone and online questionnaires are programmed with the following checks:
1. Question and response series 2. Skip patterns 3. Question rotation 4. Range checks 5. Mathematical checks 6. Consistency checks 7. Special edit procedures
For questions with pre-coded responses, the system only permits answers within a
specified range; for example, if a question has three possible answer choices ("Agree,"
"Disagree," "Not Sure"), the system will only accept coded responses to these choices. All
data are tabulated, checked for internal consistency, and processed by computer. A
series of computer-generated tables is then produced for each of the key sample groups
showing the results of each survey question, both by the total number of respondents
and by the key subgroups.
13 Adults younger than 50 years.

AARP Survey on Lifelong Learning
109
Data Complications
Question 81 response option L, Getting a degree, diploma or certification, was inadvertently
omitted from the telephone survey items. Harris attempted to contact respondents to
complete the missing item, but the response rate was too low to justify including this
response category in the telephone sample. Only responses from the online sample are
reported and so noted.
Weighting
Almost all surveys of these types require some degree of weighting to ensure that the
sample represents the actual proportions in the population. This study was no different.
The data were weighted through a three-step process. The first step involved
independently weighting the telephone and online samples to be representative of all
adults 50 or older using the following demographic targets set forth in the 1999 Current
Population Survey: age, sex, race, ethnicity, education, and income. 14 These variables
are often used in the weighting of surveys. Telephone interviews were also weighted by
region. Harris Interactive, Inc., has observed that telephone interview data, uncorrected
by region, tends to be slightly skewed. Unfortunately, regional information for the
online interviews was not collected.
The second step attempted to equalize the sample sizes achieved by telephone and
online. The online sample, being five times as large as the telephone sample, was
weighted down to one-fifth to achieve parity with the telephone sample and to carry
roughly equal weight once the data were combined.
The third step combined the telephone and online samples into one database. Table B3
displays weighted and unweighted percentages within demographic categories.
14 The Current Population Survey (CPS) is a nationally representative sample of the civilian, non-institutional population. The survey has been done on a monthly basis in about 50,000 households by the Census Bureau for more than 50 years and is the primary source of current demographic characteristics of the United States Population. At the time of data analysis the 1999 CPS data was available.

AARP Survey on Lifelong Learning
110
Data were weighted using a rim weighting algorithm based on Deming and Stephan’s
(1940)15 classic work. Rim weighting allows for multiple weighting variables to be
applied at the same time, with the computer balancing each respondent’s characteristics
until a weight is calculated for each respondent. The computer algorithm processes the
data in several iterative steps before arriving at the best compromise for each respondent
that comes closest to overall target percentages. Rim weighting is used when, as in this
case, a number of characteristics are to be weighted but the relation of the intersection of
those characteristics is unknown. Table B4 compares the final weighted demographic
variables for the telephone (508) and online (511) samples to the CPS population target
parameters. Based on the results of these weightings, Harris judged that the marginal
differences between the telephone and online samples were no greater than the
differences between each sample and the population target on the demographic
variables. The two samples were then combined for analysis.
Editing and Cleaning the Data
The data processing staff performs machine edits and additional cleaning for the entire
data set. Harris edit programs act as a verification of the skip instructions and other data
checks that are written into the program. The edit programs list any errors by case and
type. These are then resolved by senior EDP personnel who inspect the original file and
make appropriate corrections. Complete records are kept of all such procedures.
Reliability of Survey Percentages
The results from any sample survey are subject to sampling variation. The magnitude of
this variation is measurable and is affected both by the number of interviews involved
and by the level of percentages expressed in the results.
Table B5 shows the range of sampling variation that applies to percentage results for this
survey. The chances are 95 in 100 that the survey results do not vary, plus or minus, by
more than the indicated number of percentage points from the results that would have
15 Deming, W.E. & Stephens, F.F. (1940). On a least squares adjustment of a sampled frequency table when the expected marginal totals are known. Annals of Mathematical Statistics. Vol. 11.

AARP Survey on Lifelong Learning
111
been obtained had interviews been conducted with all persons in the universe
represented by the sample. For example, if the response for a sample size of 1,000 is 30%,
then in 95 out of 100 samples, the response of the total population would be between 27%
and 33%. Note that survey results based on subgroups of a small size can be subject to
large sampling error.
Sampling tolerances are also involved in the comparison of results from different parts of
a sample (subgroup analysis) or from different surveys. Table B6 shows the percentage
difference that must be obtained before a difference can be considered statistically
significant. These figures, too, represent the 95% confidence interval.

AARP Survey on Lifelong Learning
112
Table B3
Weighted/Unweighted Demographic Percentages Number in
sample weighted
Unweighted Weighted
(1019) % % Age:
50-59 410 48 40
60-74 465 46 46
75 or Older 142 6 14
Gender:
Male 464 56 46
Female 555 44 54
Education:
High school or less 586 34 57
Some college 213 33 21
College graduate or higher
213 32 21
Income:
$50,000 or less 552 42 54
$50,000-$75,000 145 24 14
$75,000 or more 197 24 19
Race:
White (not Hispanic) 822 87 81
Non-white 174 11 17

AARP Survey on Lifelong Learning
113
Table B4. Demographic Variables (Unweighted/Weighted Percentages) by Sample (Telephone, Online) and Population Target Percentages
Highest level of education Telephone Online Population Unweighted/
Weighted Unweighted/
Weighted
High school graduate or less 31/57 35/57 61.39 Some college 36/18 33/18 19.28 College graduate (4-year degree) 13/13 20/13 11.52 Graduate or advanced degree 19/8 12/8 7.82
Age Telephone -
Years (Mean) Online –
Years (Mean)
Population --Years (Mean)
Unweighted/ Weighted
Unweighted/ Weighted
65.2/64.0 60.0/62.6 63
Income Telephone Online Population Unweighted/
Weighted Unweighted/ Weighted
$15,000 or less 15/15 6/17 18.15 Between $15,001 and $25,000 18/13 10/14 15.7 Between $25,001 and $35,000 20/11 11/12 13.03 Between $35,001 and $50,000 16/12 16/14 14.79 Between $50,001 and $75,000 17/14 28/15 16.26 Between $75,001 and $100,000 8/8 15/9 9.4 $100,001 or greater 5/11 11/12 12.66
Race/Ethnicity Telephone Online Population Unweighted/
Weighted Unweighted/ Weighted
White (non-Hispanic) 89/85 86/86 84.23 Non-white 10/9 11/8 9.19
Gender Telephone Online Population Unweighted/
Weighted Unweighted/ Weighted
Male 45/46 50/46 45.51 Female 55/54 42/54 54.49
Overall base unweighted: Total = 3,064, Telephone = 508, Online = 2,556 Overall base weighted: Total = 1,019, Telephone = 508, Online = 511 Population targets: 1999 Current Population Survey

AARP Survey on Lifelong Learning
114
Table B5 Approximate Sampling Tolerances (at 95% Confidence) To
Use in Evaluating Percentage Results Appearing in This Report
Number of people asked question on
which survey result is based
Survey
percentage result at 10%
or 90%
Survey
percentage result at 20%
or 80%
Survey
percentage result at
30% or 70%
Survey
percentage result at 40%
or 60%
Survey
percentage result at
50%
1,500 2 2 2 3 3
1,000 2 2 3 3 3
900 2 3 3 3 3
800 2 3 3 3 3
700 2 3 3 4 4
600 2 3 4 4 4
500 3 4 4 4 4
400 3 4 4 5 5
300 3 5 5 6 6
200 4 6 6 7 7
100 6 8 9 10 10
50 8 11 13 14 14
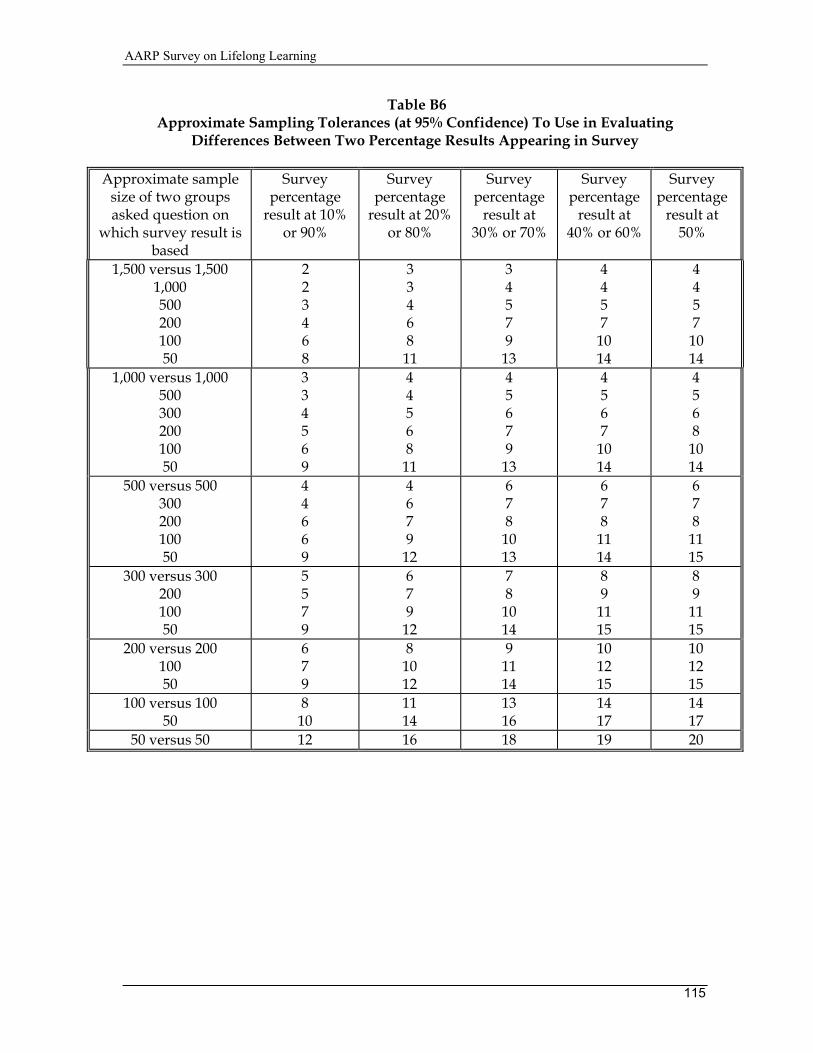
AARP Survey on Lifelong Learning
115
Table B6 Approximate Sampling Tolerances (at 95% Confidence) To Use in Evaluating
Differences Between Two Percentage Results Appearing in Survey
Approximate sample size of two groups asked question on
which survey result is based
Survey percentage
result at 10% or 90%
Survey percentage
result at 20% or 80%
Survey percentage
result at 30% or 70%
Survey percentage
result at 40% or 60%
Survey percentage
result at 50%
1,500 versus 1,500 1,000 500 200 100 50
2 2 3 4 6 8
3 3 4 6 8
11
3 4 5 7 9
13
4 4 5 7
10 14
4 4 5 7
10 14
1,000 versus 1,000 500 300 200 100 50
3 3 4 5 6 9
4 4 5 6 8
11
4 5 6 7 9
13
4 5 6 7
10 14
4 5 6 8
10 14
500 versus 500 300 200 100 50
4 4 6 6 9
4 6 7 9
12
6 7 8
10 13
6 7 8
11 14
6 7 8
11 15
300 versus 300 200 100 50
5 5 7 9
6 7 9
12
7 8
10 14
8 9
11 15
8 9
11 15
200 versus 200 100 50
6 7 9
8 10 12
9 11 14
10 12 15
10 12 15
100 versus 100 50
8 10
11 14
13 16
14 17
14 17
50 versus 50 12 16 18 19 20

AARP Survey on Lifelong Learning
116
Non-Sampling Error
Sampling error is only one way in which survey findings may vary from the findings
that would result from interviewing every member of the relevant population. Survey
research is susceptible to human and mechanical errors as well, such as respondent
recording errors, and to errors resulting from the experimental nature of current Internet
research. The procedures used by Harris Interactive, Inc., however, including the
sampling and interviewing systems described earlier, seek to keep these types of errors to
a minimum.

AARP Survey on Lifelong Learning
117
APPENDIX C ANNOTATED QUESTIONNAIRES

AARP Survey on Lifelong Learning
118
1. Annotated Questionnaire for Telephone and Online Samples Combined
HARRIS INTERACTIVE INC. FOR OFFICE USE ONLY: 111 FIFTH AVENUE NEW YORK, NEW YORK 10003 Questionnaire No.:________ (1-6) Study No. 11287 Card Number: ___________ (7-8) September 7, 1999 SAMPLE SET NO. (660,662) Field Period: August 27 - September 5, 1999 URL: Interviewer: Date: Area Code: Telephone No.: NOTE: Unless otherwise indicated figures shown are percentages. Online Introduction The survey should only take about 15 to 20 minutes. The information you provide will be kept strictly confidential, and your individual answers will never be shared with anyone. These first few questions focus on how adults learn. For example adults can enroll in a school and earn a degree, diploma, or certificate; get on-the-job training; participate in groups; go to workshops or seminars, learn one-on-one from another person, or learn by teaching themselves. For each of the following ways adults learn, tell us whether you always learn this way, learn this way most of the time, learn this way some of the time, or, you never learn this way. E-mail Invitation Subject: Harris Poll Online LifeLong Learning Survey. What motivates you to learn? Is it to get ahead in life, just for the simple joy of learning, or some other reason? Do you like to learn new things in a classroom, on your own, or some other way? The Harris Poll Online is conducting this national survey for AARP (American Association of Retired Persons) about how adults 50 YEARS AND OLDER learn. Your responses and opinions will help provide important and valuable information for developing new opportunities for life-long learning. If you are interested in finding out what other survey respondents thought, we will be posting some of the results of the survey to our website shortly following completion of this project.

AARP Survey on Lifelong Learning
119
To begin the survey, please proceed to: http://www.harrispollonline.com/surveys/aarp1 Please enter the password below when prompted at the beginning of the survey. This password ensures that you and only you can enter the survey. Password You have received this invitation from the Harris Poll Online because your e-mail address was selected at random from the Harris Poll Online’s registry of members. You (or someone using your e-mail address) may have become a member of the Harris Poll Online in one of several ways: (a) Registering directly with us; (b) Entering a sweepstakes sponsored by Matchlogic (which includes DeliverE and
Preferences.com) and, in doing so, opting in to participate in the Harris Poll Online; or (c) Signing up for free products and services from Excite or Netscape and, in doing so, opting in
to participate in the Harris Poll Online. If you wish to be excluded from the Harris Poll Online mailings, please reply to this message with “unsubscribe” written in the subject heading. If you have any other concerns or questions, please e-mail our webmaster at [email protected]. Reminder E-mail Subject: Harris Poll Online LifeLong Learning Survey. Hello! There is still time to tell us about your experiences with lifelong learning. If you have not yet been able to participate in our survey, we invite you to share your views with us. If you have already completed our survey, thank you very much for your participation and cooperation. What motivates you to learn? Is it to get ahead in life, just for the simple joy of learning, or some other reason? Do you like to learn new things in a classroom, on your own, or some other way? The Harris Poll Online is conducting this national survey for AARP about how adults 50 YEARS AND OLDER learn. Your responses and opinions will help provide important and valuable information for developing new opportunities for life-long learning. If you are interested in finding out what other survey respondents thought, we will be posting some of the results of the survey to our website shortly following completion of this project. To begin the survey, please proceed to: http://www.harrispollonline.com/surveys/aarp1 Please enter the password below when prompted at the beginning of the survey. This password ensures that you and only you can enter the survey.

AARP Survey on Lifelong Learning
120
Password You have received this invitation from the Harris Poll Online because your e-mail address was selected at random from the Harris Poll Online’s registry of members. You (or someone using your e-mail address) may have become a member of the Harris Poll Online in one of several ways: (d) Registering directly with us; (e) Entering a sweepstakes sponsored by Matchlogic (which includes DeliverE and
Preferences.com) and, in doing so, opting in to participate in the Harris Poll Online; or (f) Signing up for free products and services from Excite or Netscape and, in doing so, opting in
to participate in the Harris Poll Online. If you wish to be excluded from the Harris Poll Online mailings, please reply to this message with “unsubscribe” written in the subject heading. If you have any other concerns or questions, please e-mail our webmaster at [email protected]. Telephone Introduction Hello, I’m _______________________ from Harris Interactive in New York, the people who conduct the Harris Poll. We are conducting a survey for AARP and would like to speak to the oldest (male/female) adult in the household who is at home now. Would that be you or someone else? Respondent Continue Someone else Go to Callback screen Don’t know Go to Callback screen Refused Go to Callback screen

AARP Survey on Lifelong Learning
121
TELEPHONE SCREENING QUESTIONS: BASE: ALL RESPONDENTS Q10. Overall, how satisfied are you with your life these days – very satisfied, somewhat satisfied,
not very satisfied or not at all satisfied? (TELEPHONE ONLY) TOTAL Very satisfied .....................................................................…59 Somewhat satisfied ...............................................................35 Not very satisfied....................................................................3 Not at all satisfied ...................................................................2 Don’t know .............................................................................. * Refused.....................................................................................1 BASE: ALL RESPONDENTS Q11. Which of the following age groups best represents your age – 18-29, 30-49, 50-65 or 65 and
older? (TELEPHONE ONLY) TOTAL 18-29......................................................................................... - Screen out 30-49 ......................................................................................... - Screen out 50-64 .......................................................................................52 Ask Q15 65+ ..........................................................................................48 Ask Q15 Don’t know ............................................................................. - Screen out Refused .................................................................................... - Screen out

AARP Survey on Lifelong Learning
122
BASE: ALL RESPONDENTS Q21. (Telephone: For each of the following ways adults learn, tell me whether you always learn this
way, learn this way most of the time, learn this way some of the time, or you never learn this way.) When I want or need to learn something I (telephone: READ EACH ITEM)…
[RANDOMLY ROTATE ITEMS] Always
Most of the time
Some of the time Never
Don’tKnow
Re-fused
A) find someone to teach me who knows about the topic, such as a friend, co-worker, family member
9 33 48 10 1 *
B) take classes or attend community seminars or workshops about what I want to learn
5 13 39 41 1 *
C) look for educational or informational television or radio programs about what I want to learn
9 17 46 26 1 *
D) read newspapers articles, magazine articles, books, or journals on the topic I want to learn about
23 41 32 4 * *
E) search the Internet for information about what I want to learn
13 23 30 34 * *
F) buy, rent, or borrow audio or video tapes about what I want to learn
2 7 40 50 1 *
G) buy or borrow computer-based teaching programs (tutorials) about what I want to learn
4 8 30 57 1 1
H) start by doing what I want to learn about and learn from my mistakes and successes
13 31 48 8 1 *
I) find a public event, exposition, or exhibition featuring what I want to learn about
3 12 52 31 1 *
J) enroll in a college or community college to take classes about what I want to learn
3 7 31 57 1 *
K) find a tutor or professional to teach me what I want to learn about
3 8 30 57 1 *
L) find an online or chat group interested in a topic I want to learn about
2 8 23 65 2 *
M) get involved in a community group or volunteer organization that focuses on what I want to learn about
4 8 35 51 2 *
BASE: ALL RESPONDENTS Q45. What other ways do you typically use to learn about things you want to know? [telephone
probe: Can you think of any other special way you learn about things? Telephone: RECORD RESPONSE VERBATIM]
[TEXT ONLY]

AARP Survey on Lifelong Learning
123
BASE: ALL RESPONDENTS Q51. These next statements describe why you want to learn. Tell us whether you strongly agree,
somewhat agree, neither agree nor disagree, somewhat disagree, or strongly disagree with each one.
[TELEPHONE: READ EACH ITEM]. Do you strongly agree, somewhat agree, neither disagree, somewhat disagree, or strongly disagree?
[RANDOMLY ROTATE ITEMS]
I want to learn…
Strongly Agree
Somewhat Agree
Neither Agree
nor Disagree
Some-what
Disagree Strongly Disagree
Don't know
Re-fused
A) so I can improve my job skills to make work easier or to get ahead
32 23 22 9 12 1 1
B) so I can earn a degree or certification that will advance my career or help me earn more money
14 16 28 17 20 2 2
C) so I can I enjoy my hobbies or recreational activities better
53 34 7 2 3 * *
D) so I can manage my everyday life better
50 35 10 2 3 * *
E) so I know the basic skills I need every day, such as reading, writing, basic math, or learning how to drive
39 24 18 7 10 2 *
F) for the simple joy of learning something new
60 31 4 2 2 * *
G) so I can give back something to my community
31 34 24 6 4 1 *
H) so I can understand myself better 40 34 16 5 5 1 * I) so I can understand and get
along with others better 42 36 15 4 3 * *
J) so I can help other people 42 40 12 4 2 * * K) so I can keep up with what’s
going on in the world 63 30 4 1 1 * *
L) so I can talk about things with my children or grandchildren
48 32 11 4 4 1 1
M) for my own spiritual or personal growth
62 30 6 1 1 * *

AARP Survey on Lifelong Learning
124
BASE: ALL RESPONDENTS Q60. Which of the following three statements best describes when you want to use what you learn [ALLOW ONLY ONE ACCEPT] TOTAL
I want to use what I learn immediately or very soon after I learn it
55
I am willing to wait to use what I learn some time in the near future
28
I am willing to wait to use what I learn for a long period of time
14
Don't know 3 Refused 1
BASE: ALL RESPONDENTS Q71. These next few statements focus on the best ways for you, personally, to learn. Please tell
us if you strongly agree, somewhat agree, neither agree nor disagree, somewhat disagree, or strongly disagree with them.
[RANDOMLY ROTATE ITEMS] I learn best…
Strongly Agree
Some-what Agree
Neither Agree
nor Disagree
Some-what
Disagree Strongly Disagree
Don't know
Re-fused
A) in a group where I can share with other learners
30 37 17 10 6 * *
B) when I have a guide, instructor, tutor, or mentor in a face-to-face situation
40 38 13 6 3 1 *
C) by putting my hands on something and playing with it or figuring it out
60 29 5 3 1 * *
D) by watching or listening and then thinking about it
45 45 5 3 2 - *
E) in a formal teacher-classroom situation
15 38 20 16 10 1 *
F) by gathering as much information as I can find and then teaching myself
47 37 8 6 3 * *
G) by finding self-study courses that let me set my own objectives and then moving at my own pace.
33 36 15 10 5 1 *

AARP Survey on Lifelong Learning
125
This next section is a bit different. We’d like to know how interested you might be in learning about the following topics.
BASE: ALL RESPONDENTS Q106. Please rate whether or not your would be extremely interested, very interested, somewhat
interested, not very interested, or not at all interested in learning about…[TELEPHONE: READ EACH ITEM]
[RANDOMLY ROTATE ITEMS]
Ex-tremely Very
Some-what
Not Very
Not at all
Don't know
Re-fused
A) having a healthy diet and nutrition
22 28 34 9 7 * *
B) exercise and fitness 15 24 37 14 10 * * C) weight control 19 23 31 13 13 * * D) how to manage stress 22 25 29 15 9 * * E) how to measure your own
personal health status 19 28 34 11 6 1 *
F) alternative medicine or remedies, such as acupuncture, medicinal herbs, or aroma therapy
14 17 30 19 19 1 *
G) how to get ahead in your job or career, or how to find a new one
10 11 21 21 35 1 2
H) how to master an advanced skill, such as using a computer, becoming fluent in a foreign language, or preparing taxes
24 28 24 9 14 * *
I) basic life skills, such as reading, writing, or basic math or learning to drive
9 11 22 24 32 1 1
J) your favorite hobby or pastime 28 33 26 7 5 1 * K) how to give back or get involved
in your local community 8 16 41 21 13 * 1
L) how to become a volunteer in your community
6 11 38 26 18 1 1
M) more about arts and culture, or other personal enrichment opportunities
13 17 35 22 12 1 1
N) how to get more enjoyment or pleasure out of life
22 29 32 11 6 * *
O) educational travel opportunities 13 17 29 21 18 1 1 P) more about spiritual or personal
growth 20 23 32 15 10 * *
Q) more about understanding and getting along with others
15 24 41 13 7 * 1
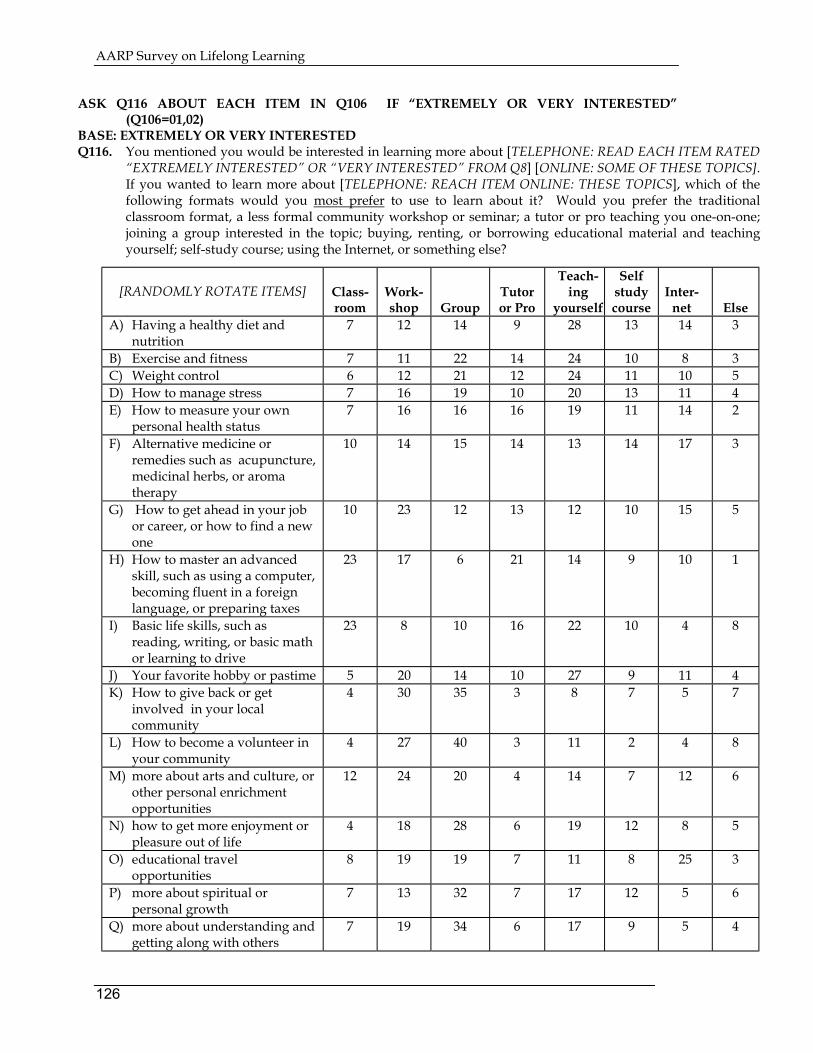
AARP Survey on Lifelong Learning
126
ASK Q116 ABOUT EACH ITEM IN Q106 IF “EXTREMELY OR VERY INTERESTED” (Q106=01,02)
BASE: EXTREMELY OR VERY INTERESTED
Q116. You mentioned you would be interested in learning more about [TELEPHONE: READ EACH ITEM RATED “EXTREMELY INTERESTED” OR “VERY INTERESTED” FROM Q8] [ONLINE: SOME OF THESE TOPICS]. If you wanted to learn more about [TELEPHONE: REACH ITEM ONLINE: THESE TOPICS], which of the following formats would you most prefer to use to learn about it? Would you prefer the traditional classroom format, a less formal community workshop or seminar; a tutor or pro teaching you one-on-one; joining a group interested in the topic; buying, renting, or borrowing educational material and teaching yourself; self-study course; using the Internet, or something else?
[RANDOMLY ROTATE ITEMS] Class-
room Work-shop Group
Tutor or Pro
Teach-ing
yourself
Self study course
Inter-net Else
A) Having a healthy diet and nutrition
7 12 14 9 28 13 14 3
B) Exercise and fitness 7 11 22 14 24 10 8 3 C) Weight control 6 12 21 12 24 11 10 5 D) How to manage stress 7 16 19 10 20 13 11 4 E) How to measure your own
personal health status 7 16 16 16 19 11 14 2
F) Alternative medicine or remedies such as acupuncture, medicinal herbs, or aroma therapy
10 14 15 14 13 14 17 3
G) How to get ahead in your job or career, or how to find a new one
10 23 12 13 12 10 15 5
H) How to master an advanced skill, such as using a computer, becoming fluent in a foreign language, or preparing taxes
23 17 6 21 14 9 10 1
I) Basic life skills, such as reading, writing, or basic math or learning to drive
23 8 10 16 22 10 4 8
J) Your favorite hobby or pastime 5 20 14 10 27 9 11 4 K) How to give back or get
involved in your local community
4 30 35 3 8 7 5 7
L) How to become a volunteer in your community
4 27 40 3 11 2 4 8
M) more about arts and culture, or other personal enrichment opportunities
12 24 20 4 14 7 12 6
N) how to get more enjoyment or pleasure out of life
4 18 28 6 19 12 8 5
O) educational travel opportunities
8 19 19 7 11 8 25 3
P) more about spiritual or personal growth
7 13 32 7 17 12 5 6
Q) more about understanding and getting along with others
7 19 34 6 17 9 5 4

AARP Survey on Lifelong Learning
127
BASE: ALL RESPONDENTS Q200. These next questions are about how much you are willing to personally invest in learning
about something you always wanted to learn about. By investing we mean how much time you are willing to take or how much you might be willing to pay to learn about this one thing you really want to know.
Which of the following four statements best describes how much time you are willing to invest?
TOTAL
I will spend all the time it takes to learn about something I really want to know about.
30
I will spend some time, if I can control when and how much.
47
I will spend some time, even if I cannot control when and how much.
7
I can’t spend much time to learn about something I really want to know
7
It depends
7
Don't know
1
Refused 1
BASE: ALL RESPONDENTS Q205. How much would you be willing to pay, at most, to learn about something you are
extremely interested in or have always wanted to learn more about. [ENTER DOLLAR AMOUNT, DO NOT ACCEPT RANGE]
WOULD NOT BE WILLING TO PAY TOTAL I would be willing to pay at most $519.80 (Mean)
$101.00 (Median)
Not sure[DO NOT READ] 19 Refused[DO NOT READ] 4

AARP Survey on Lifelong Learning
128
BASE: ALL RESPONDENTS Q81. People experience major changes at different periods during their lifetimes. Please tell us
which of the following has happened to you, personally, during the past 12 months.
[RANDOMLY ROTATE ITEMS]
Has Happened
Has Not Happened
Don't know Refused
A) Having a death in your immediate family
26 73 * 1
B) Having a child go to college 12 87 * 1 C) Becoming a caregiver for a parent or
elderly family member 18 80 1 1
D) Becoming a caregiver for a child or grandchild
16 83 1 1
E) Having your last child move out of your home
12 87 * 1
F) Having an adult child move back into your home
11 88 * 1
G) Making a major change in your diet or level of physical activity
40 59 * *
H) Retiring for the first time 14 85 1 1 I) Becoming a grandparent 29 71 * 1 J) Having a major illness in your
immediate family (not including yourself)
34 65 * 1
K) You personally having a major illness 23 75 1 1 L) Online only: Getting a degree,
diploma, or certification 4 45 * 1
M) Going back to school to finish a degree or certification or to get an advanced degree or certification
6 93 * 1

AARP Survey on Lifelong Learning
129
ASK Q91 FOR ANY “HAS HAPPENED” IN Q81– OTHERS SKIP TO Q300 BASE: MAJOR CHANGE HAS HAPPENED (Q 81 any items 1-13=01) Q91. How would you rate the effect this event had on your life? Would you say it had no effect at
all; very little effect, a moderate effect, or a major effect on your life?
[RANDOMLY ROTATE ITEMS] No effect
at all
Very little effect
A mod-erate effect
A major effect
Don't know
Re-fused
A) Having a death in your immediate family
6 5 32 56 1 *
B) Having a child go to college 22 18 36 20 2 1 C) Becoming a caregiver for a parent
or elderly family member 7 12 29 50 3 *
D) Becoming a caregiver for a child or grandchild
14 17 25 42 1 1
E) Having your last child move out of your home
16 24 36 23 * 1
F) Having an adult child move back into your home
7 25 37 27 2 1
G) Making a major change in your diet or level of physical activity
3 17 39 40 1 *
H) Retiring for the first time 12 19 25 42 1 * I) Becoming a grandparent 10 14 26 32 * * J) Having a major illness in your
immediate family (not including yourself)
4 7 31 56 1 1
K) You, personally, having a major illness
4 8 26 61 * 1
L) Online only: Getting a degree, diploma, or professional certification
11 18 39 24 5 3
M) Going back to school to finish a degree or certification program or to get an advanced degree or certification.
2 17 27 14 14 1

AARP Survey on Lifelong Learning
130
BASE: ALL RESPONDENTS Only a few questions to go. This information is completely anonymous and is never reported on an individual level. We use this information to find out if people taking this survey are similar or different from the population as a whole.
Q300. What is your marital status? TOTAL Never married 5 Married 62 Separated or divorced 14 Widowed 18 Other *
Q305. Are there any children or grandchildren under the age of 18 living at your home?
Yes 11 No 89
Q310. Does a parent, in-law, or other adult relative live with you at your home?
Yes 15 No 84
Q320. Are one or both of your parents still living? Yes 29 No 71
Q325. Are you or your spouse currently a member of AARP or NRTA? Yes 61 No 38 Don’t Know 1
Q330. What is your current employment status? Employed full time 27 Employed part time (not retired) 5 Retired, working part time 8 Retired, not working at all 45 Unemployed (looking for work) 2 Self-employed 6 Other 7
Q335. What is the highest level of education you have completed? TOTAL Some high school or less 10
High school graduate 48 Technical or vocational school 3 Some college 14 College graduate (2-year degree) 4 College graduate (4-year degree) 13 Graduate or advanced degree 8

AARP Survey on Lifelong Learning
131
Q340. What is your age? Years (Mean)
63.4 Q350. What was your approximate family income before taxes in 19? This is
income from for all household members from all sources including earnings, wages, Social Security, pensions, interest and dividends on investment
$15,000 or less 16 Between $15,001 and $25,000 14 Between $25,001 and $35,000 11 Between $35,001 and $50,000 13 Between $50,001 and $75,000 14 Between $75,001 and $100,000 8 Between $100,001 and $120,000 4 Between $120,001 and $150,000 4 $150,001 or more 3 Don’t Know 4 Refused 9
Q355. Which of the following best describes you? White or Caucasian 85 Black or African American 9 American Indian, Aleut, or Eskimo 1 Asian or Pacific Islander 1 Other 2
Q360. Are you of Hispanic or Spanish ethnicity or descent?
Yes 6 No 92
Don’t Know * Refused 1 Q365. Are you male or female?
Male 46 Female 54

AARP Survey on Lifelong Learning
132

AARP Survey on Lifelong Learning
133
2. Annotated Questionnaire for Telephone and Online Samples Compared
HARRIS INTERACTIVE INC. FOR OFFICE USE ONLY: 111 FIFTH AVENUE NEW YORK, NEW YORK 10003 Questionnaire No.:________ (1-6) Study No. 11287 Card Number: ___________ (7-8) September 7, 1999 SAMPLE SET NO. (660,662) 1-083 Field Period: August 27 - September 5, 1999 URL: Interviewer: Date: Area Code: Telephone No.: NOTE: Unless otherwise indicated figures shown are percentages. Online Introduction The survey should only take about 15 to 20 minutes. The information you provide will be kept strictly confidential, and your individual answers will never be shared with anyone. These first few questions focus on how adults learn. For example adults can enroll in a school and earn a degree, diploma, or certificate; get on-the-job training; participate in groups; go to workshops or seminars, learn one-on-one from another person, or learn by teaching themselves. For each of the following ways adults learn, tell us whether you always learn this way, learn this way most of the time, learn this way some of the time, or, you never learn this way. E-mail Invitation Subject: Harris Poll Online LifeLong Learning Survey. What motivates you to learn? Is it to get ahead in life, just for the simple joy of learning, or some other reason? Do you like to learn new things in a classroom, on your own, or some other way? The Harris Poll Online is conducting this national survey for AARP (American Association of Retired Persons) about how adults 50 YEARS AND OLDER learn. Your responses and opinions will help provide important and valuable information for developing new opportunities for life-long learning. If you are interested in finding out what other survey respondents thought, we

AARP Survey on Lifelong Learning
134
will be posting some of the results of the survey to our website shortly following completion of this project. To begin the survey, please proceed to: http://www.harrispollonline.com/surveys/aarp1 Please enter the password below when prompted at the beginning of the survey. This password ensures that you and only you can enter the survey. Password You have received this invitation from the Harris Poll Online because your e-mail address was selected at random from the Harris Poll Online’s registry of members. You (or someone using your e-mail address) may have become a member of the Harris Poll Online in one of several ways: (a) Registering directly with us; (b) Entering a sweepstakes sponsored by Matchlogic (which includes DeliverE and
Preferences.com) and, in doing so, opting in to participate in the Harris Poll Online; or (c) Signing up for free products and services from Excite or Netscape and, in doing so, opting in
to participate in the Harris Poll Online. If you wish to be excluded from the Harris Poll Online mailings, please reply to this message with “unsubscribe” written in the subject heading. If you have any other concerns or questions, please e-mail our webmaster at [email protected]. Reminder E-mail Subject: Harris Poll Online LifeLong Learning Survey. Hello! There is still time to tell us about your experiences with lifelong learning. If you have not yet been able to participate in our survey, we invite you to share your views with us. If you have already completed our survey, thank you very much for your participation and cooperation. What motivates you to learn? Is it to get ahead in life, just for the simple joy of learning, or some other reason? Do you like to learn new things in a classroom, on your own, or some other way? The Harris Poll Online is conducting this national survey for AARP about how adults 50 YEARS AND OLDER learn. Your responses and opinions will help provide important and valuable information for developing new opportunities for life-long learning. If you are interested in finding out what other survey respondents thought, we will be posting some of the results of the survey to our website shortly following completion of this project. To begin the survey, please proceed to: http://www.harrispollonline.com/surveys/aarp1

AARP Survey on Lifelong Learning
135
Please enter the password below when prompted at the beginning of the survey. This password ensures that you and only you can enter the survey. Password You have received this invitation from the Harris Poll Online because your e-mail address was selected at random from the Harris Poll Online’s registry of members. You (or someone using your e-mail address) may have become a member of the Harris Poll Online in one of several ways: (d) Registering directly with us; (e) Entering a sweepstakes sponsored by Matchlogic (which includes DeliverE and
Preferences.com) and, in doing so, opting in to participate in the Harris Poll Online; or (f) Signing up for free products and services from Excite or Netscape and, in doing so, opting in
to participate in the Harris Poll Online. If you wish to be excluded from the Harris Poll Online mailings, please reply to this message with “unsubscribe” written in the subject heading. If you have any other concerns or questions, please e-mail our webmaster at [email protected]. Telephone Introduction Hello, I’m _______________________ from Harris Interactive in New York, the people who conduct the Harris Poll. We are conducting a survey for AARP and would like to speak to the oldest (male/female) adult in the household who is at home now. Would that be you or someone else? Respondent Continue Someone else Go to Callback screen Don’t know Go to Callback screen Refused Go to Callback screen

AARP Survey on Lifelong Learning
136
TELEPHONE SCREENING QUESTIONS: BASE: ALL RESPONDENTS Q10. Overall, how satisfied are you with your life these days – very satisfied, somewhat satisfied,
not very satisfied or not at all satisfied? (TELEPHONE ONLY) TEL ONL Very satisfied......................................................................... 59 - Somewhat satisfied............................................................... 35 - Not very satisfied ................................................................... 3 - Not at all satisfied................................................................... 2 - Don’t know...............................................................................* - Refused .................................................................................... 1 - BASE: ALL RESPONDENTS Q11. Which of the following age groups best represents your age – 18-29, 30-49, 50-65 or 65 and
older? (TELEPHONE ONLY) TEL ONL 18-29 ......................................................................................... - - Screen out 30-49 .........................................................................................- - Screen out 50-64 ...................................................................................... 52 - Ask Q15 65+ ......................................................................................... 48 - Ask Q15 Don’t know ..............................................................................- - Screen out Refused ....................................................................................- - Screen out

AARP Survey on Lifelong Learning
137
NOTE: In the following questions this format is used to show results:
TELEPHONE / ONLINE 11 7
BASE: ALL RESPONDENTS Q21 .(Telephone: For each of the following ways adults learn, tell me whether you always learn this
way, learn this way most of the time, learn this way some of the time, or you never learn this way.) When I want or need to learn something I (telephone: READ EACH ITEM)
[RANDOMLY ROTATE ITEMS] Always Most of the time
Some of the time Never
Don’t Know
Re- fused
A) find someone to teach me who knows about the topic, such as a friend, co-worker, family member
10/7 34/32 46/49 10/10 -/1 -/*
B) take classes or attend community seminars or workshops about what I want to learn
7/4 12/13 34/45 47/36 */1 -/1
C) look for educational or informational television or radio programs about what I want to learn
8/10 15/19 44/49 33/20 -/2 */*
D) read newspapers articles, magazine articles, books, or journals on the topic I want to learn about
20/27 40/42 35/30 5/2 -/* -/*
E) search the Internet for information about what I want to learn
5/20 9/36 19/41 67/2 */* */*
F) buy, rent, or borrow audio or video tapes about what I want to learn
3/2 6/8 32/47 59/42 */1 -/1
G) buy or borrow computer-based teaching programs (tutorials) about what I want to learn
4/4 4/12 17/42 74/40 */2 1/1
H) start by doing what I want to learn about and learn from my mistakes and successes
16/10 31/31 46/50 8/8 */1 -/*
I) find a public event, exposition, or exhibition featuring what I want to learn about
4/2 11/13 50/55 34/28 -/1 */1
J) enroll in a college or community college to take classes about what I want to learn
5/2 4/9 28/34 63/51 */2 -/1
K) find a tutor or professional to teach me what I want to learn about
5/2 7/8 29/31 59/56 -/3 -/1
L) find an online or chat group interested in a topic I want to learn about
2/2 6/9 13/32 78/52 1/3 -/1
M) get involved in a community group or volunteer organization that focuses on what I want to learn about
5/2 8/8 38/33 49/53 -/3 -/1
BASE: ALL RESPONDENTS Q45. What other ways do you typically use to learn about things you want to know? [telephone probe:
Can you think of any other special way you learn about things? Telephone: RECORD RESPONSE VERBATIM
[TEXT ONLY]

AARP Survey on Lifelong Learning
138
BASE: ALL RESPONDENTS Q51. These next statements describe why you want to learn. Tell us whether you strongly agree,
somewhat agree, neither agree nor disagree, somewhat disagree, or strongly disagree with each one. [TELEPHONE: READ EACH ITEM]. Do you strongly agree, somewhat agree, neither disagree, somewhat disagree, or strongly disagree?
[RANDOMLY ROTATE ITEMS]
I want to learn…
Strongly Agree
Some-what Agree
Neither Agree
nor Disagree
Some-what Dis-
agree Strongly Disagree
Don't know
Re-fused
A) so I can improve my job skills to make work easier or to get ahead
36/28 19/27 17/27 12/6 14/9 1/1 1/1
B) so I can earn a degree or certification that will advance my career or help me earn more money
18/11 18/15 19/37 22/12 20/21 1/2 2/2
C) so I can I enjoy my hobbies or recreational activities better
57/48 31/37 4/11 4/1 5/2 -/* -/*
D) so I can manage my everyday life better
59/41 29/40 6/15 2/2 4/2 -/* -/*
E) so I know the basic skills I need every day, such as reading, writing, basic math, or learning how to drive
43/34 25/23 12/25 7/6 11/9 3/1 -/1
F) for the simple joy of learning something new
59/61 31/31 3/6 3/1 3/* */- -/*
G) so I can give back something to my community
43/19 35/33 11/37 5/6 5/3 */1 */*
H) so I can understand myself better
48/31 32/35 8/24 5/5 6/4 */1 */*
I) so I can understand and get along with others better
53/32 34/38 5/24 6/3 3/2 -/* -/*
J) so I can help other people 51/32 37/43 5/20 4/3 3/1 -/1 -/* K) so I can keep up with what’s
going on in the world 66/61 27/32 2/6 2/1 2/* */* */*
L) so I can talk about things with my children or grandchildren
58/38 26/37 6/17 4/3 5/4 1/1 */1
M) for my own spiritual or personal growth
66/58 27/32 2/9 2/1 3/* -/* -/*

AARP Survey on Lifelong Learning
139
BASE: ALL RESPONDENTS Q60. Which of the following three statements best describes when you want to use what you
learn [ALLOW ONLY ONE ACCEPT ]. TOTAL
I want to use what I learn immediately or very soon after I learn it
45/64
I am willing to wait to use what I learn some time in the near future
35/21
I am willing to wait to use what I learn for a long period of time
18/10
Don't know 2/3 Refused */1
BASE: ALL RESPONDENTS Q71. These next few statements focus on the best ways for you, personally, to learn. Please tell
us if you strongly agree, somewhat agree, neither agree nor disagree, somewhat disagree, or strongly disagree with them.
[RANDOMLY ROTATE ITEMS]
I learn best… Strongly
Agree
Some-what Agree
Neither Agree
nor Disagree
Some-what
Disagree Strongly Disagree
Don't know
Re-fused
A) in a group where I can share with other learners
39/21 35/40 8/25 10/9 8/3 */1 */*
B) when I have a guide, instructor, tutor, or mentor in a face-to-face situation
45/35 37/38 6/19 7/5 4/2 */1 */*
C) by putting my hands on something and playing with it or figuring it out
60/61 28/30 5/5 4/2 2/* */* -/*
D) by watching or listening and then thinking about it
50/41 43/47 1/9 3/3 3/1 -/- -/*
E) in a formal teacher-classroom situation
19/12 40/36 10/31 20/12 11/8 1/1 -/*
F) by gathering as much information as I can find and then teaching myself
49/45 35/38 5/11 7/4 4/1 */* -/*
G) by finding self-study courses that let me set my own objectives and then moving at my own pace.
33/32 34/38 11/18 13/7 7/3 1/1 */*

AARP Survey on Lifelong Learning
140
This next section is a bit different. We’d like to know how interested you might be in learning about the following topics. BASE: ALL RESPONDENTS Q106. Please rate whether or not your would be extremely interested, very interested, somewhat
interested, not very interested, or not at all interested in learning about…[TELEPHONE: READ EACH ITEM]
[RANDOMLY ROTATE ITEMS] Extremely Very
Some-what
Not Very
Not at all
Don't know Refused
A) having a healthy diet and nutrition
21/23 27/29 36/33 8/10 8/6 1/* -/*
B) exercise and fitness 13/17 24/25 39/34 11/17 13/7 */* -/* C) weight control 16/22 21/25 32/30 13/13 18/9 -/* -/* D) how to manage stress 22/21 24/25 30/29 12/17 11/7 1/* 1/* E) how to measure your own
personal health status 18/20 28/29 35/32 9/13 8/4 */1 */*
F) alternative medicine or remedies, such as acupuncture, medicinal herbs, or aroma therapy
13/16 13/22 30/29 18/20 26/12 */1 */*
G) how to get ahead in your job or career, or how to find a new one
9/11 9/13 18/25 20/22 43/26 */1 1/3
H) how to master an advanced skill, such as using a computer, becoming fluent in a foreign language, or preparing taxes
14/34 20/36 27/21 13/6 25/3 -/* -/*
I) basic life skills, such as reading, writing, or basic math or learning to drive
12/6 13/10 18/25 20/28 36/28 1/1 */2
J) your favorite hobby or pastime 21/35 30/37 30/22 10/3 7/3 1/* -/* K) how to give back or get involved
in your local community 8/7 14/18 43/40 21/22 15/11 */1 -/1
L) how to become a volunteer in your community
6/5 10/12 38/37 23/29 22/14 1/1 -/1
M) more about arts and culture, or other personal enrichment opportunities
10/15 14/20 35/35 23/20 16/9 1/* */1
N) how to get more enjoyment or pleasure out of life
21/23 26/32 32/31 12/9 8/5 */* */*
O) educational travel opportunities 10/16 13/22 30/28 20/21 25/12 1/1 */1 P) more about spiritual or personal
growth 20/20 23/22 31/32 14/16 12/9 */* -/*
Q) more about understanding and getting along with others
18/11 21/26 42/39 11/16 8/6 */* -/1

AARP Survey on Lifelong Learning
141
ASK Q116 ABOUT EACH ITEM IN Q106 IF “EXTREMELY OR VERY INTERESTED” (Q106=01,02) BASE: EXTREMELY OR VERY INTERESTED Q116. You mentioned you would be interested in learning more about [TELEPHONE: READ EACH ITEM
RATED “EXTREMELY INTERESTED” OR “VERY INTERESTED” FROM Q8] [ONLINE: SOME OF THESE TOPICS]. If you wanted to learn more about [TELEPHONE: REACH ITEM ONLINE: THESE TOPICS], which of the following formats would you most prefer to use to learn about it? Would you prefer the traditional classroom format, a less formal community workshop or seminar; a tutor or pro teaching you one-on-one; joining a group interested in the topic; buying, renting, or borrowing educational material and teaching yourself; self-study course; using the Internet, or something else?
[RANDOMLY ROTATE ITEMS] Class-room
Work-shop Group
Tutor or Pro
Teaching yourself
Self study course
Inter-net Else
A) Having a healthy diet and nutrition
10/4 9/15 16/11 12/6 31/25 12/14 4/23 6/2
B) Exercise and fitness 10/5 9/13 23/22 13/15 28/20 8/11 3/13 6/1 C) Weight control 10/3 10/14 26/17 16/9 20/26 9/12 2/17 7/3 D) How to manage stress 10/4 15/17 20/17 13/7 20/21 12/14 3/19 8/1 E) How to measure your own
personal health status 11/3 14/17 21/11 22/11 16/22 7/14 5/22 4/1
F) Alternative medicine or remedies such as acupuncture, medicinal herbs, or aroma therapy
15/7 7/18 23/9 19/10 12/14 14/14 4/26 6/1
G) How to get ahead in your job or career, or how to find a new one
12/8 17/28 22/4 13/13 11/13 5/13 11/18 8/2
H) How to master an advanced skill, such as using a computer, becoming fluent in a foreign language, or preparing taxes
32/18 16/18 6/6 26/18 11/16 4/11 4/12 2/*
I) Basic life skills, such as reading, writing, or basic math or learning to drive
27/17 7/11 11/7 18/11 22/22 6/17 */9 10/5
J) Your favorite hobby or pastime
6/4 18/22 20/11 11/10 26/28 7/9 4/15 8/1
K) How to give back or get involved in your local community
4/3 28/33 38/32 4/3 7/9 8/6 1/8 10/5
L) How to become a volunteer in your community
6/3 22/32 50/31 1/5 13/9 1/4 1/8 6/9
M) more about arts and culture, or other personal enrichment opportunities
15/9 21/27 23/18 4/4 14/14 6/8 4/19 12/1
N) how to get more enjoyment or pleasure out of life
6/2 17/19 33/24 8/4 14/23 12/13 3/13 8/2
O) educational travel opportunities
13/6 15/22 23/16 12/4 9/13 11/7 15/30 3/3
P) more about spiritual or personal growth
7/7 12/14 39/25 10/5 12/21 9/15 -/11 10/2
Q) more about understanding and getting along with others
9/5 16/23 37/30 9/3 16/18 7/10 */10 7/1

AARP Survey on Lifelong Learning
142
BASE: ALL RESPONDENTS Q200. These next questions are about how much you are willing to personally invest in learning
about something you always wanted to learn about. By investing we mean how much time you are willing to take or how much you might be willing to pay to learn about this one thing you really want to know.
Which of the following four statements best describes how much time you are willing to invest?
Telephone Online
I will spend all the time it takes to learn about something I really want to know about.
21 38
I will spend some time, if I can control when and how much.
50 45
I will spend some time, even if I cannot control when and how much.
9 6
I can’t spend much time to learn about something I really want to know
12 2
It depends
7 7
Don't know
* 2
Refused * 1
BASE: ALL RESPONDENTS Q205. How much would you be willing to pay, at most, to learn about something you are
extremely interested in or have always wanted to learn more about. [ENTER DOLLAR AMOUNT, DO NOT ACCEPT RANGE]
WOULD NOT BE WILLING TO PAY Telephone Online I would be willing to pay at most $ 878.30 (Mean)
$101 (Median)
$ 347.10 (Mean) $102 (Median)
Not sure[DO NOT READ] 38 - Refused[DO NOT READ] 7 *

AARP Survey on Lifelong Learning
143
BASE: ALL RESPONDENTS Q81. People experience major changes at different periods during their lifetimes. Please tell us
which of the following has happened to you, personally, during the past 12 months.
[RANDOMLY ROTATE ITEMS]
Has Happened
Has Not Happened
Don't know Refused
A) Having a death in your immediate family
28/25 72/74 -/* -/1
B) Having a child go to college 11/13 88/85 -/* */1 C) Becoming a caregiver for a parent or
elderly family member 19/17 81/80 -/1 -/1
D) Becoming a caregiver for a child or grandchild
18/14 82/83 -/1 -/2
E) Having your last child move out of your home
10/13 90/85 */* -/2
F) Having an adult child move back into your home
9/13 91/86 -/* -/1
G) Making a major change in your diet or level of physical activity
35/45 65/53 -/1 -/1
H) Retiring for the first time 8/20 92/77 */1 -/2 I) Becoming a grandparent 26/31 74/68 -/* -/1 J) Having a major illness in your
immediate family (not including yourself)
32/36 68/62 -/1 -/1
K) You personally having a major illness 23/22 76/74 */1 */2 L) Online only: Getting a degree,
diploma, or certification -/8 -/90 -/* -/1
M) Going back to school to finish a degree or certification or to get an advanced degree or certification
5/6 95/91 -/1 -/1

AARP Survey on Lifelong Learning
144
ASK Q91 FOR ANY “HAS HAPPENED” IN Q81– OTHERS SKIP TO Q300 BASE: MAJOR CHANGE HAS HAPPENED (Q 81 any items 1-13=01) Q91. How would you rate the effect this event had on your life? Would you say it had no effect
at all; very little effect, a moderate effect, or a major effect on your life?
[RANDOMLY ROTATE ITEMS]
No effect at all
Very little effect
A mod-erate effect
A major effect
Don't know
Re-fused
A) Having a death in your immediate family
9/2 5/5 31/34 55/57 -/1 -/1
B) Having a child go to college 37/9 6/28 30/41 24/17 2/2 -/3 C) Becoming a caregiver for a parent or
elderly family member 10/3 15/8 33/23 38/62 3/3 -/1
D) Becoming a caregiver for a child or grandchild
19/9 18/15 22/29 41/42 -/2 -/3
E) Having your last child move out of your home
16/17 21/26 34/38 29/18 -/1 -/1
F) Having an adult child move back into your home
9/5 26/25 37/38 25/30 3/2 -/1
G) Making a major change in your diet or level of physical activity
3/3 17/16 35/42 44/37 1/1 -/1
H) Retiring for the first time 12/13 16/20 28/25 44/41 -/1 -/* I) Becoming a grandparent 13/8 17/11 28/24 42/23 -/* -/1 J) Having a major illness in your
immediate family (not including yourself)
3/5 9/6 27/34 61/52 -/2 -/1
K) You, personally, having a major illness 4/4 7/9 23/28 65/56 -/1 -/2 L) Online only: Getting a degree, diploma,
or professional certification -/11 -/18 -/39 -/24 -/5 -/3
M) Going back to school to finish a degree or certification program or to get an advanced degree or certification.
-/3 26/9 32/23 9/18 33/- 1/2

AARP Survey on Lifelong Learning
145
BASE: ALL RESPONDENTS Only a few questions to go. This information is completely anonymous and is never reported on an individual level. We use this information to find out if people taking this survey are similar or different from the population as a whole.
Q300. What is your marital status? Telephone Online Never married 6 3 Married 62 63 Separated or divorced 11 18 Widowed 21 14 Other *
Q305. Are there any children or grandchildren
under the age of 18 living at your home?
Yes 9 13 No 91 87
Q310. Does a parent, in-law, or other adult relative live with you at your home?
Yes 14 17 No 86 81
Q320. Are one or both of your parents still living?
Yes 28 30 No 72 69
Q325. Are you or your spouse currently a member of AARP or NRTA?
Yes 56 65 No 43 33 Don’t Know 1 1
Q330. What is your current employment status?
Employed full time 27 27 Employed part time (not retired) 6 4 Retired, working part time 6 11 Retired, not working at all 48 41 Unemployed (looking for work) 2 2 Self-employed 5 7 Other 7 7
Q335. What is the highest level of education you have completed?
Some high school or less 12 7 High school graduate 45 50 Technical or vocational school 3 3 Some college 14 14 College graduate (2-year degree) 4 4 College graduate (4-year degree) 13 13 Graduate or advanced degree 8 8

AARP Survey on Lifelong Learning
146
Q340. What is your age? Telephone - Years
(Mean) Online - Years
(Mean) 64.0
62.7
Q350. What was your approximate family income before taxes in 1998? This is income from for all household members from all sources including earnings, wages, Social Security, pensions, interest and dividends on investment?
Telephone Online
$15,000 or less 15 17 Between $15,001 and $25,000 13 14
Between $25,001 and $35,000 11 12 Between $35,001 and $50,000 12 14 Between $50,001 and $75,000 14 15 Between $75,001 and $100,000 8 9 Between $100,001 and $120,000 2 6 Between $120,001 and $150,000 5 3 $150,001 or more 4 3 Don’t Know 7 * Refused 9 9
Q355. Which of the following best describes
you?
White or Caucasian 85 86 Black or African American 9 9 American Indian, Aleut, or Eskimo 1 * Asian or Pacific Islander 1 * Other 3 1
Q360. Are you of Hispanic or Spanish ethnicity or descent?
Yes 7 6 No 93 91
Don’t Know * * Refused * 2 Q365. Are you male or female?
Male 46 46 Female 54 54

AARP Survey on Lifelong Learning
147