Embed Size (px)
DESCRIPTION
it' s helpful for you
Citation preview
AAS, GFAAS, ICP or ICP-MS? Which technique should I use?An elementary overview of elemental analysis.
1069 primer reprint 11/29/01 2:41 PM Page 3
Start here.If your laboratory is performing elementalanalysis on solutions, there are a number ofmature, effective spectrometric techniques youcould use, including flame and furnace AA(Atomic Absorption), ICP (Inductively CoupledPlasma), and ICP-MS (ICP Mass Spectrometry).
Selecting the most appropriate tool for the jobcan sometimes appear to be a daunting task,especially since there is considerable overlap ofcapabilities. In fact, all of the techniques maybe able to perform your particular analysis atacceptable levels of accuracy and precision.
However, by evaluating the relative strengthsand weaknesses of each of the techniques, particularly as they may apply to the practicaland performance requirements of your analysis,it is possible to establish a rational basis fordecision making. In other words, it needn’t beall that difficult.
Even if you’re new to elemental analysis, this booklet will get you well on your way to selecting the best technique (or techniques) to meet your lab’s needs.
Understanding how each technique works.While it isn’t necessary to grasp all of the complex technological details of each of thevarious elemental analysis instruments, forcomparison purposes it is helpful to have a general understanding of basic principles. Let’sstart at the beginning, with atomic absorption.
2
1069 primer reprint 11/29/01 2:41 PM Page 4
19
Short-term stabilityThe ability of the instrument to read back the value youspecified as the value of the standard after one hour’s drift,usually around 2%.
SpectrometerMeter = to measure. Spectro = Spectrum. For optical spec-trometers this is a series of colored bands dispersed fromwhite light by means of a refracting material (prism) or bymeans of a diffractive device (grating). Detectors can beplaced at exact locations in the spectrum to measure thepresence of the desired element.
A mass spectrometer spectrum is a series of signals registeringon the detector with increasing mass-to-charge ratio, eachanalyte having a distinct peak at a given mass-to-chargeratio.
Spray chamberThe nebulizer sprays a fine mist of the sample into the spraychamber. The spray chamber removes the large droplets fromthe mist that are highly variable in supply from one moment tothe next. The spray chamber, therefore, must select only thetiniest of the droplets and all the large droplets must bepumped away. Only 3% of the droplets are allowed to reachthe plasma and 97% of the sample goes to the waste container.
TorchA very hot flame. A source of bright light. The quartz or glasstubes that make up a plasma torch. The outside tube is thetorch coolant tube which typically has a flow of 15 to 20 lpmof Ar gas. This flow keeps the torch below its melting point.The middle tube is the auxiliary gas tube. The gas flow throughthis tube is typically between 0 and 3 lpm of Ar gas. This gaspushes the plasma higher in the coil and is used to keep theplasma away from the sample injector tube. The innermosttube is the sample injector tube which injects the very smalldroplets of sample into the base of the plasma fireball. Thesedroplets come from the spray chamber. The droplets rise in thetorch where they are dried, and the various steps of moleculardecomposition and elemental excitation take place.
WavelengthThe distance between two peaks of a wave. When ThermoElemental refers to wavelengths we usually are speaking ofwavelengths of light.
Wavelength flexibilityThe ability of an instrument to “see,” or measure any wave-length without having to change any hardware.
Percent Relative Standard Deviation (% RSD)The standard deviation expressed as a percentage of the total.
ppbAn abbreviation for parts per billion. 1 part in 1,000,000,000or one microgram per liter.
ppmAn abbreviation for parts per million. 1 part in 1,000,000 or one milligram per liter.
pptAn abbreviation for parts per trillion. 1 part in1,000,000,000,000 or one nanogram per liter.
PlasmaA very high-temperature ionized gas composed of electronsand positively charged ions.
PrecisionA measure of the spread of a series of repeat measurementsabout their mean value. This is normally expressed as thestandard deviation or percent relative standard deviation. It is important to note that a small spread (that is, a lowstandard deviation) does NOT give any information on theaccuracy of the result. It is possible for a result to displayexcellent precision, yet be inaccurate.
ReproducibilityThe ability to read back (repeat) a standard or known solutionas an unknown sample and obtain the value that you specified.Reasons that you don’t get the same value back as you told theinstrument include: drift, calibration fit, or noise in the data.
Resolution (Optical Spectrometer)The width of an analytical peak at half its height expressedin nanometers. A measure of the instrument’s ability to sepa-rate two overlapping peaks. At the point of resolution, twopeaks of equal height are said to be resolved if you can see a1/2 height or greater dip between the tops of the two peaks.
Resolution (Mass Spectrometer)The width of an analyte’s mass peak at 5% of its peak height– for a quadrupole ICP-MS this is usually <0.8 mass units.
Sample and skimmer coneIn ICP-MS, ions are sampled from the bulk plasma initiallythrough an orifice in the sample cone into the expansionchamber, then by a second orifice in the skimmer cone intothe ion lens region of the mass spectrometer.
Sample introduction systemThe apparatus used to turn the sample into an ultra-fineaerosol that can be introduced into the atomizer without over-whelming it with either too much sample or particles whichare too large, either of which will extinguish the plasma orflame by taking too much thermal energy from it.
Sample throughputThe rate at which samples can be analyzed and the resultsprinted. Usually measured as samples per hour.
1069 primer reprint 11/29/01 2:42 PM Page 5
GlossaryAccuracyThe degree of agreement between the measured result and the accepted or known value. If quantified, this may beexpressed as a percentage difference. It is important to notethat this is NOT the same as precision. It is possible for a resultto be accurate but not precise, or very precise but not accurate.
AerosolAn extremely fine mist generated by a nebulizer. This is theform in which the sample solution is presented to the flame orplasma for volatilization and subsequent measurement.
AnalyteThe element whose concentration is being determined. Theatomic spectroscopy techniques discussed in this primer deter-mine the concentration of an analyte element by comparing theinstrumental response for the sample to that of a series of stan-dard solutions containing the analyte element of interest.
Atomic absorptionA method that measures the concentration of atoms of an element by passing light, emitted by a hollow cathode lamp of that element, through a cloud of atoms from a sample. Onlythose atoms that are the same as those in the lamp will absorbthe light from the lamp. A reduction in the amount of lightreaching the detector is seen as a measure of the concentrationof that element in the original sample.
Atomic emissionA method that measures the concentration of atoms or ions of an element in a sample, using the light those atoms emit whenheated to very high temperatures. Since the intensity of thelight that is emitted by these atoms or ions is proportional totheir concentration in the original sample, this technique iscapable of providing quantitative, as well as qualitative infor-mation about the sample.
CalibrationThe process of analyzing a series of known concentrations asstandards to determine the instrumental response to changesin concentration. Typically, a blank and one or more standardsolutions of known and increasing concentration are analyzed.The instrument software then constructs an equation ofresponse vs. concentration. This is then used to calculate theconcentration of analyte elements based on the instrumentresponse when the unknown samples are analyzed.
Detection limitsThe lowest concentration that can be measured. Usuallydefined as a signal that is at least three times the standarddeviation of the background variation. The measurement ofany signal is not perfect; there is always a certain amount ofnoise in the signal. The magnitude of three standard deviationsis a range, which, in a large number of measurements, would be expected to include 99% of all the measurements.Therefore, if a signal is three times the standard deviation ofthe background, we can be 99% certain that it is real and notsimply a “spike” in the background noise.
DilutionTo reduce the concentration of a sample solution by theaddition of an appropriate acid or organic solvent. This maybe done to reduce the concentration of an analyte so that itfalls within the dynamic range of the instrument or to reducethe total dissolved salt concentration of an aqueous solutionor viscosity of an organic solution so that it can be nebulized.
Dynamic rangeThe concentration range over which the instrument continuesto read a higher signal for an increase in the concentration ofthe measured material and can be calibrated.
Hydride generation accessoryAn accessory designed to generate free hydrogen that is allowedto bubble through the sample liquid. Certain elements reactwith the hydrogen gas to form hydrides of those elements.Elemental hydrides are in the form of a gas so it is easy to sepa-rate them from the liquid. These gases are allowed to enter thesample cell where they are atomized. Because all of the elementin the gas is exposed to the source, the signal is much largerthan if it were introduced as a liquid using a nebulizer (onlyabout 5-10% efficiency). Therefore, much lower concentrationsof the element (such as As, Se, Sb and Pb) can be detected.
IonsAn atom which has lost one or more electrons becoming posi-tively charged due to the fact that it now has more protonsthan it has electrons. Normally atoms are neutral in charge,electrons = protons, but if an atom loses an electron it becomesan ion and can be directed by electromagnetic fields.
Laser accessoryAn accessory designed to use a UV laser to ablate (erode away)the surface of conductive or non-conductive materials. Theablated materials are in the form of a fine particulate aerosolwhich is carried into the plasma through the sample tube. Thisaccessory is very good at sampling difficult to digest materialssuch as biological materials, rocks, glasses and ceramics.
Linear rangeThe range of concentrations of a sample which produces adetector signal that increases linearly (a straight line) with acorresponding linear increase in concentration. If the concen-tration of the sample doubles, the detector signal doubles.
Long-term stabilityUsually measured as the amount of drift an instrumentexhibits, per hour, as a percentage of the calibrated value. Ifyou calibrate at a value of 10 ppm and after an hour the instru-ment reads back a value of 10.4 ppm the drift is 0.4 ppm /houror 4%/hr.
MassIn mass spectrometry (ICP-MS) “mass” refers to atomic mass-charge ratio and to the element being measured. Each elementhas a characteristic mass(es) in the spectrum.
NebulizerA device that is used to convert the sample solution into anaerosol or mist of tiny droplets. The nebulizer may producethis aerosol by means of gas pressure or the use of an ultrasonictransducer. This latter produces much more aerosol from agiven volume of sample; so large an amount that it must besubjected to additional drying steps prior to introduction intothe plasma. (Ultrasonic nebulization is not used with AAS.)
18
1069 primer reprint 11/29/01 2:42 PM Page 6
Strengths Limitations
• Easy to use • Moderate detection limits
• Very fast • Element limitations
• Lowest capital cost • 1-10 elements per determination
• Relatively few interferences • No screening ability
• Very compact instrument
• Good performance
• Robust interface
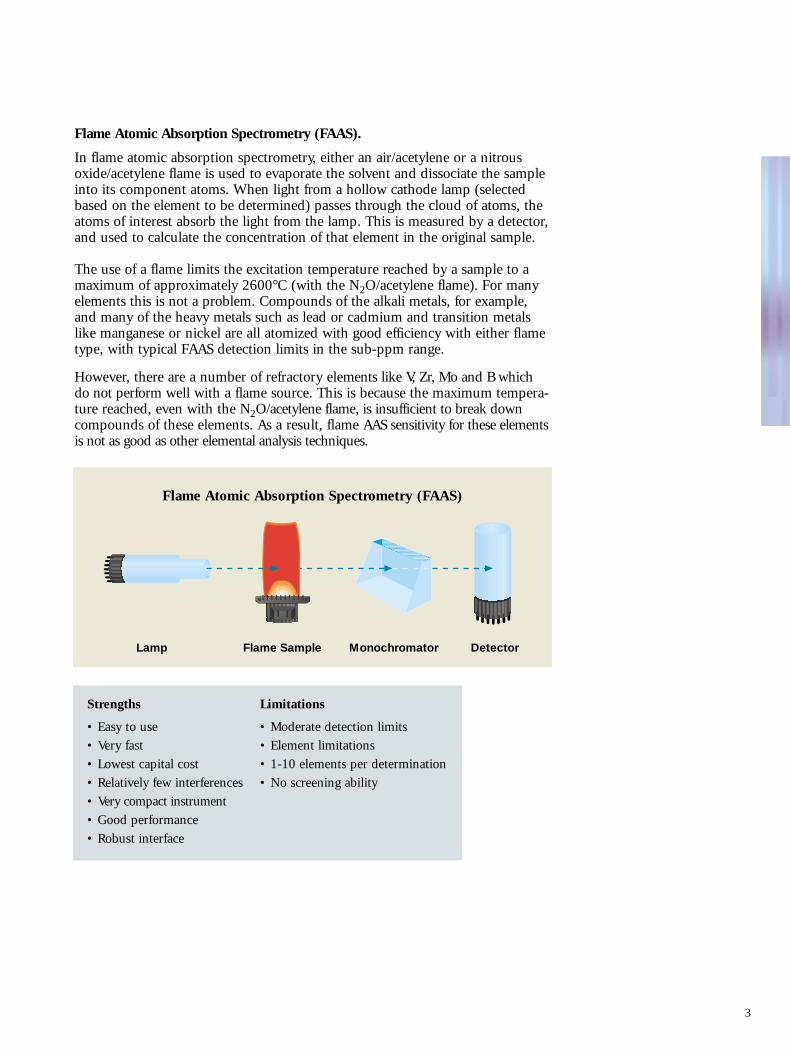
Flame Atomic Absorption Spectrometry (FAAS).
In flame atomic absorption spectrometry, either an air/acetylene or a nitrousoxide/acetylene flame is used to evaporate the solvent and dissociate the sampleinto its component atoms. When light from a hollow cathode lamp (selectedbased on the element to be determined) passes through the cloud of atoms, theatoms of interest absorb the light from the lamp. This is measured by a detector,and used to calculate the concentration of that element in the original sample.
The use of a flame limits the excitation temperature reached by a sample to amaximum of approximately 2600°C (with the N2O/acetylene flame). For manyelements this is not a problem. Compounds of the alkali metals, for example,and many of the heavy metals such as lead or cadmium and transition metalslike manganese or nickel are all atomized with good efficiency with either flametype, with typical FAAS detection limits in the sub-ppm range.
However, there are a number of refractory elements like V, Zr, Mo and B whichdo not perform well with a flame source. This is because the maximum tempera-ture reached, even with the N2O/acetylene flame, is insufficient to break downcompounds of these elements. As a result, flame AAS sensitivity for these elementsis not as good as other elemental analysis techniques.
Lamp Flame Sample Monochromator Detector
Flame Atomic Absorption Spectrometry (FAAS)
3
1069 primer reprint 11/29/01 2:42 PM Page 7
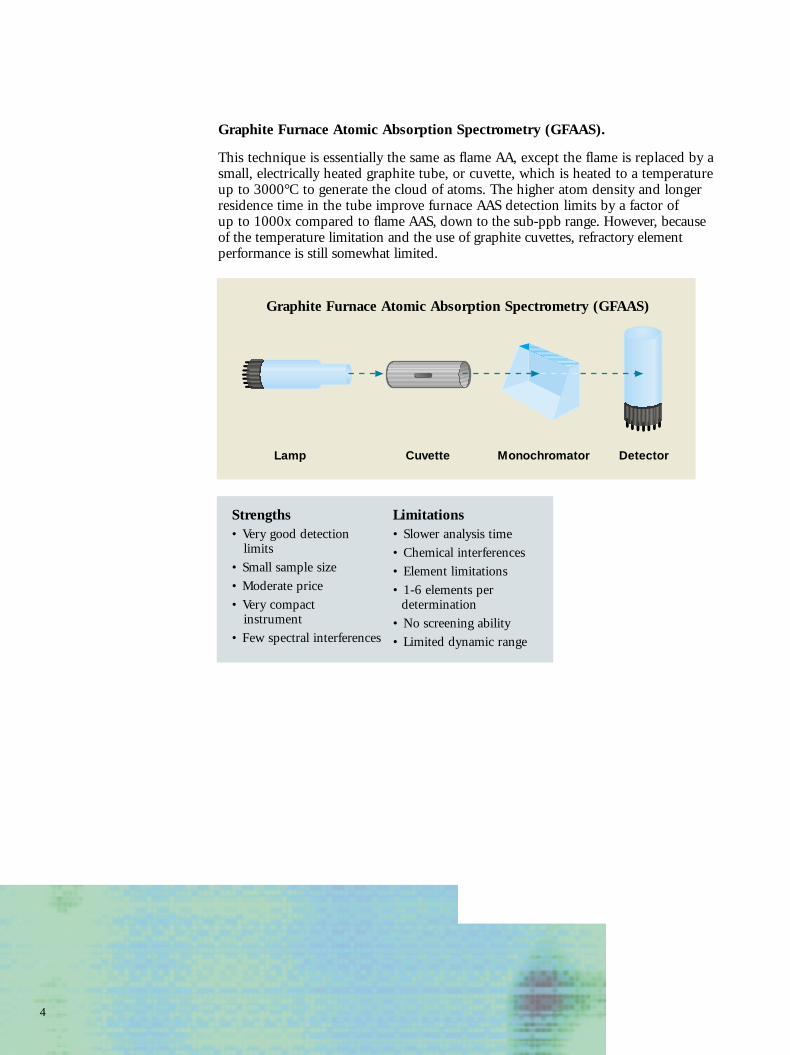
Graphite Furnace Atomic Absorption Spectrometry (GFAAS).
This technique is essentially the same as flame AA, except the flame is replaced by asmall, electrically heated graphite tube, or cuvette, which is heated to a temperatureup to 3000°C to generate the cloud of atoms. The higher atom density and longerresidence time in the tube improve furnace AAS detection limits by a factor of up to 1000x compared to flame AAS, down to the sub-ppb range. However, becauseof the temperature limitation and the use of graphite cuvettes, refractory element performance is still somewhat limited.
Graphite Furnace Atomic Absorption Spectrometry (GFAAS)
Lamp Cuvette Monochromator Detector
4
Strengths• Very good detection
limits
• Small sample size
• Moderate price
• Very compactinstrument
• Few spectral interferences
Limitations• Slower analysis time
• Chemical interferences
• Element limitations
• 1-6 elements perdetermination
• No screening ability
• Limited dynamic range
1069 primer reprint 11/29/01 2:43 PM Page 8
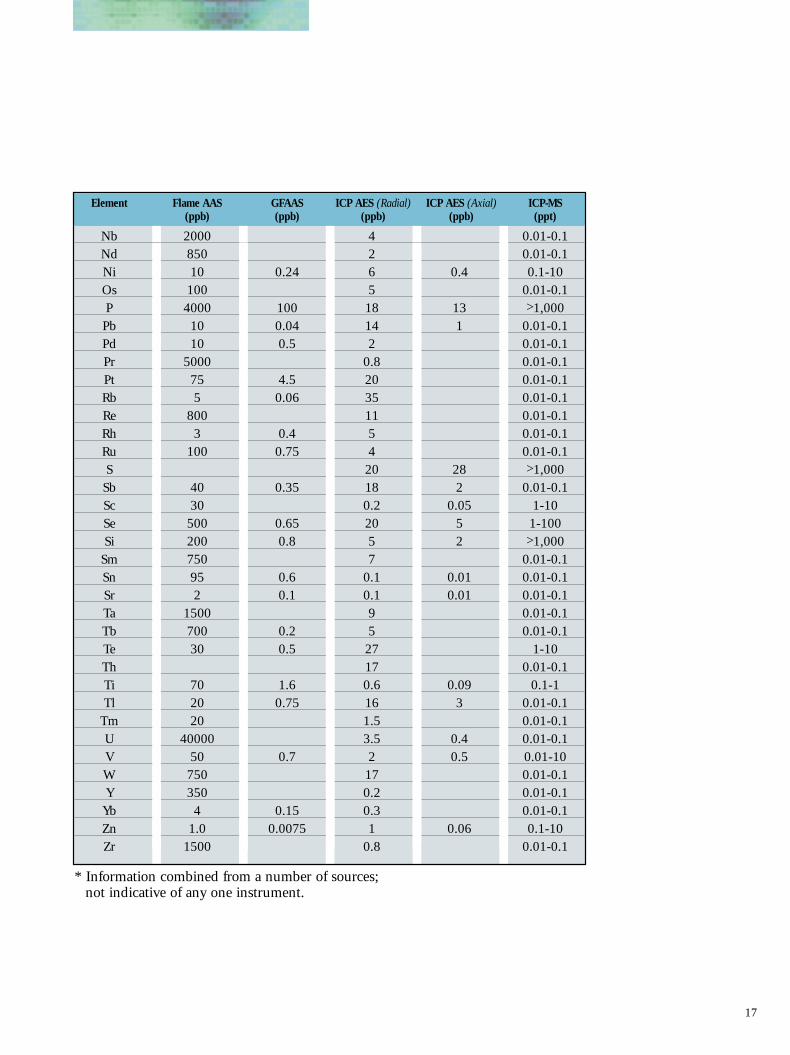
Element Flame AAS GFAAS ICP AES (Radial) ICP AES (Axial) ICP-MS(ppb) (ppb) (ppb) (ppb) (ppt)
Nb 2000 4 0.01-0.1Nd 850 2 0.01-0.1Ni 10 0.24 6 0.4 0.1-10Os 100 5 0.01-0.1P 4000 100 18 13 >1,000Pb 10 0.04 14 1 0.01-0.1Pd 10 0.5 2 0.01-0.1Pr 5000 0.8 0.01-0.1Pt 75 4.5 20 0.01-0.1Rb 5 0.06 35 0.01-0.1Re 800 11 0.01-0.1Rh 3 0.4 5 0.01-0.1Ru 100 0.75 4 0.01-0.1S 20 28 >1,000Sb 40 0.35 18 2 0.01-0.1Sc 30 0.2 0.05 1-10Se 500 0.65 20 5 1-100Si 200 0.8 5 2 >1,000
Sm 750 7 0.01-0.1Sn 95 0.6 0.1 0.01 0.01-0.1Sr 2 0.1 0.1 0.01 0.01-0.1Ta 1500 9 0.01-0.1Tb 700 0.2 5 0.01-0.1Te 30 0.5 27 1-10Th 17 0.01-0.1Ti 70 1.6 0.6 0.09 0.1-1Tl 20 0.75 16 3 0.01-0.1
Tm 20 1.5 0.01-0.1U 40000 3.5 0.4 0.01-0.1V 50 0.7 2 0.5 0.01-10W 750 17 0.01-0.1Y 350 0.2 0.01-0.1Yb 4 0.15 0.3 0.01-0.1Zn 1.0 0.0075 1 0.06 0.1-10Zr 1500 0.8 0.01-0.1
17
* Information combined from a number of sources;not indicative of any one instrument.
1069 primer reprint 11/29/01 2:43 PM Page 9
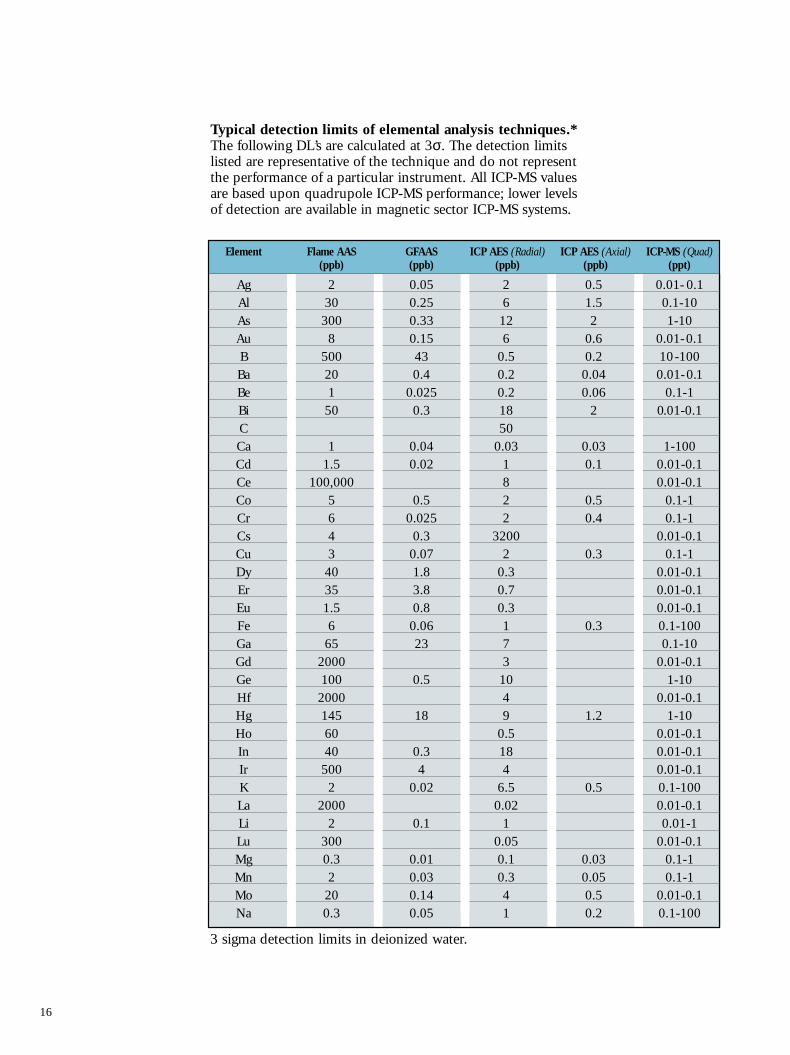
Element Flame AAS GFAAS ICP AES (Radial) ICP AES (Axial) ICP-MS (Quad)(ppb) (ppb) (ppb) (ppb) (ppt)
Ag 2 0.05 2 0.5 0.01- 0.1Al 30 0.25 6 1.5 0.1-10As 300 0.33 12 2 1-10Au 8 0.15 6 0.6 0.01-0.1B 500 43 0.5 0.2 10-100Ba 20 0.4 0.2 0.04 0.01-0.1Be 1 0.025 0.2 0.06 0.1-1Bi 50 0.3 18 2 0.01-0.1C 50Ca 1 0.04 0.03 0.03 1-100Cd 1.5 0.02 1 0.1 0.01-0.1Ce 100,000 8 0.01-0.1Co 5 0.5 2 0.5 0.1-1Cr 6 0.025 2 0.4 0.1-1Cs 4 0.3 3200 0.01-0.1Cu 3 0.07 2 0.3 0.1-1Dy 40 1.8 0.3 0.01-0.1Er 35 3.8 0.7 0.01-0.1Eu 1.5 0.8 0.3 0.01-0.1Fe 6 0.06 1 0.3 0.1-100Ga 65 23 7 0.1-10Gd 2000 3 0.01-0.1Ge 100 0.5 10 1-10Hf 2000 4 0.01-0.1Hg 145 18 9 1.2 1-10Ho 60 0.5 0.01-0.1In 40 0.3 18 0.01-0.1Ir 500 4 4 0.01-0.1K 2 0.02 6.5 0.5 0.1-100La 2000 0.02 0.01-0.1Li 2 0.1 1 0.01-1Lu 300 0.05 0.01-0.1Mg 0.3 0.01 0.1 0.03 0.1-1Mn 2 0.03 0.3 0.05 0.1-1Mo 20 0.14 4 0.5 0.01-0.1Na 0.3 0.05 1 0.2 0.1-100
Typical detection limits of elemental analysis techniques.*The following DL’s are calculated at 3σ. The detection limitslisted are representative of the technique and do not representthe performance of a particular instrument. All ICP-MS valuesare based upon quadrupole ICP-MS performance; lower levelsof detection are available in magnetic sector ICP-MS systems.
16
3 sigma detection limits in deionized water.
1069 primer reprint 11/29/01 2:43 PM Page 10
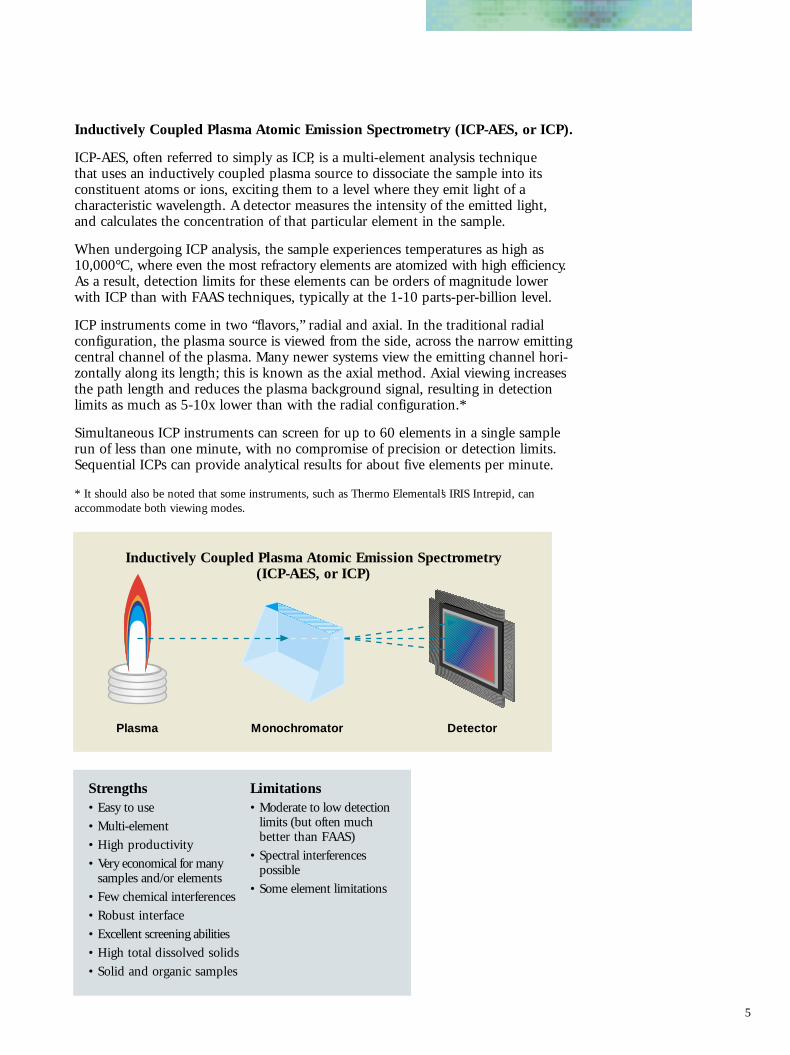
Inductively Coupled Plasma Atomic Emission Spectrometry (ICP-AES, or ICP).
ICP-AES, often referred to simply as ICP, is a multi-element analysis technique that uses an inductively coupled plasma source to dissociate the sample into its constituent atoms or ions, exciting them to a level where they emit light of a characteristic wavelength. A detector measures the intensity of the emitted light, and calculates the concentration of that particular element in the sample.
When undergoing ICP analysis, the sample experiences temperatures as high as 10,000°C, where even the most refractory elements are atomized with high efficiency.As a result, detection limits for these elements can be orders of magnitude lowerwith ICP than with FAAS techniques, typically at the 1-10 parts-per-billion level.
ICP instruments come in two “flavors,” radial and axial. In the traditional radialconfiguration, the plasma source is viewed from the side, across the narrow emittingcentral channel of the plasma. Many newer systems view the emitting channel hori-zontally along its length; this is known as the axial method. Axial viewing increasesthe path length and reduces the plasma background signal, resulting in detectionlimits as much as 5-10x lower than with the radial configuration.*
Simultaneous ICP instruments can screen for up to 60 elements in a single samplerun of less than one minute, with no compromise of precision or detection limits.Sequential ICPs can provide analytical results for about five elements per minute.
* It should also be noted that some instruments, such as Thermo Elemental’s IRIS Intrepid, can accommodate both viewing modes.
Inductively Coupled Plasma Atomic Emission Spectrometry (ICP-AES, or ICP)
Plasma Monochromator Detector
5
Strengths• Easy to use
• Multi-element
• High productivity
• Very economical for manysamples and/or elements
• Few chemical interferences
• Robust interface
• Excellent screening abilities
• High total dissolved solids
• Solid and organic samples
Limitations• Moderate to low detection
limits (but often muchbetter than FAAS)
• Spectral interferencespossible
• Some element limitations
1069 primer reprint 11/29/01 2:43 PM Page 11
Strengths• Excellent detection limits
• Multi-element
• High productivity
• Very economical for manysamples and/or elements
• Wide dynamic range
• Isotopic measurements
• Fast semiquantitativescreening
• Hybrid techniques
LA-ICP-MS (solids)*
LC-ICP-MS (speciation)*
• Easily interpreted spectra
Plasma QuadrupoleAnalyzer
Detector
Inductively Coupled Plasma Mass Spectrometry (ICP-MS)
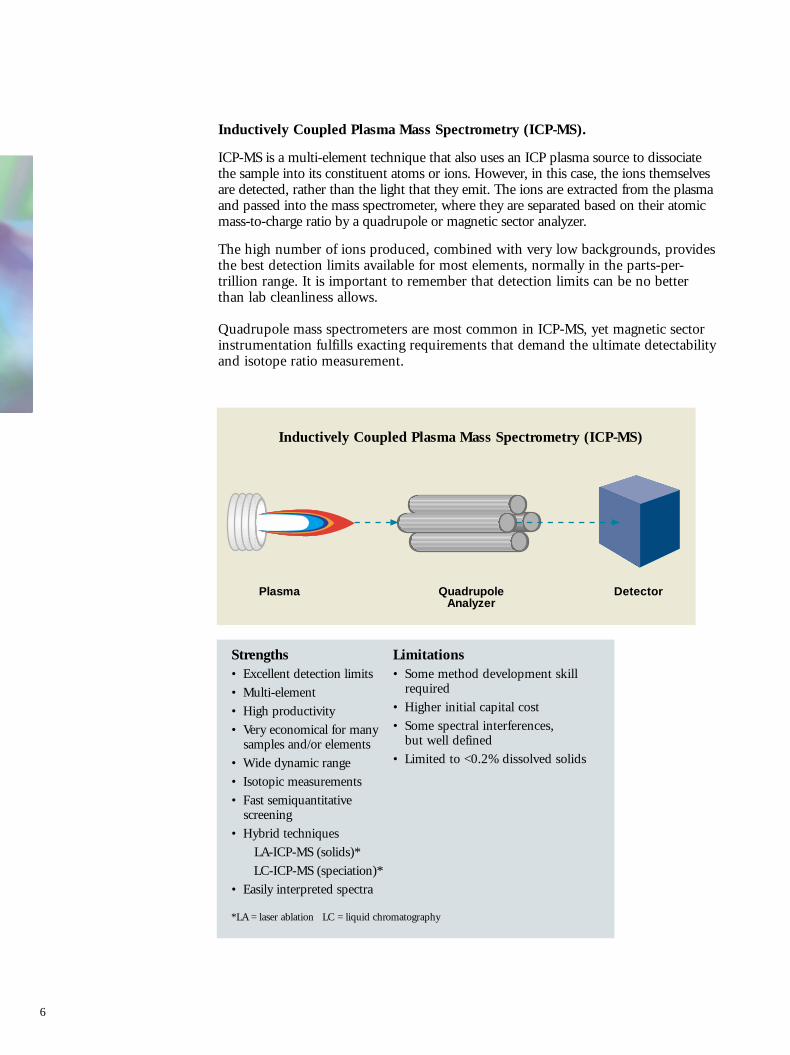
Inductively Coupled Plasma Mass Spectrometry (ICP-MS).
ICP-MS is a multi-element technique that also uses an ICP plasma source to dissociatethe sample into its constituent atoms or ions. However, in this case, the ions themselvesare detected, rather than the light that they emit. The ions are extracted from the plasmaand passed into the mass spectrometer, where they are separated based on their atomicmass-to-charge ratio by a quadrupole or magnetic sector analyzer.
The high number of ions produced, combined with very low backgrounds, providesthe best detection limits available for most elements, normally in the parts-per-trillion range. It is important to remember that detection limits can be no betterthan lab cleanliness allows.
Quadrupole mass spectrometers are most common in ICP-MS, yet magnetic sectorinstrumentation fulfills exacting requirements that demand the ultimate detectabilityand isotope ratio measurement.
6
Limitations• Some method development skill
required
• Higher initial capital cost
• Some spectral interferences, but well defined
• Limited to <0.2% dissolved solids
*LA = laser ablation LC = liquid chromatography
1069 primer reprint 11/29/01 2:43 PM Page 12
Summary of elemental analysis techniquesFlame AAS GFAAS ICP-AES ICP-MS
Detection limits Very good for Excellent for Very good for Excellent forsome elements some elements most elements most elements
Sample throughput 10-15 secs per 3-4 mins per 1-60 elements/ All elements inelement element minute <1 minute
Dynamic range 103 102 106 108
Precisionshort term 0.1-1.0% 0.5-5% 0.1-2% 0.5-2%long term 2-beam 1-2% 1-10% 1-5% 2-4%
1-beam < 10% (tube lifetime)
InterferencesSpectral Very few Very few Many FewChemical (matrix) Many Very many Very few SomePhysical (matrix) Some Very few Very few Some
Dissolved solids in solution 0.5-5% > 20% (slurries) 0-20% 0.1-0.4%
Elements applicable to 68+ 50+ 73 82
Sample volumes required Large Very small Medium Very small to medium
Semiquantitative analysis No No Yes Yes
Isotopic analysis No No No Yes
Ease of use Very easy Moderately easy Easy Moderately easy
Method development Easy Difficult Moderately easy Difficult
Unattended operation No Yes Yes Yes
Capital costs Low Medium to high High Very high
Running costs Low Medium High High
Cost per elemental analysisHigh volume – few elements Low High Medium Medium
High volume – many elements Medium High Low-Medium Low-Medium
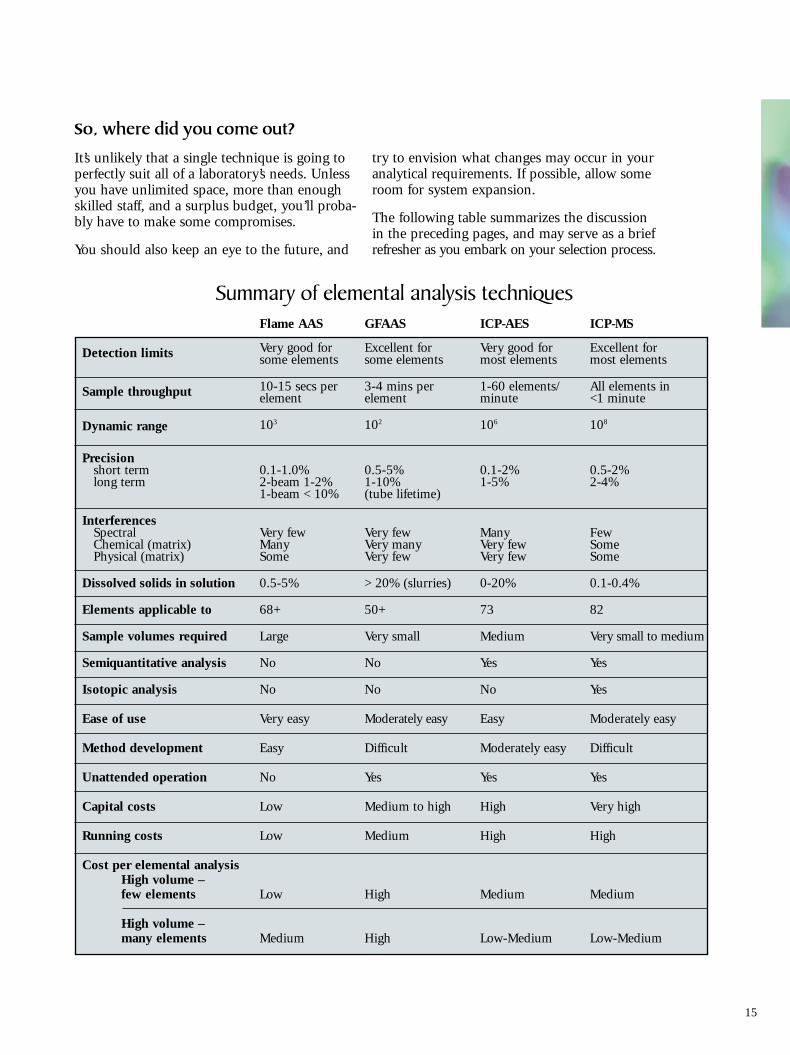
So, where did you come out?
It’s unlikely that a single technique is going toperfectly suit all of a laboratory’s needs. Unlessyou have unlimited space, more than enoughskilled staff, and a surplus budget, you’ll proba-bly have to make some compromises.
You should also keep an eye to the future, and
try to envision what changes may occur in your analytical requirements. If possible, allow someroom for system expansion.
The following table summarizes the discussionin the preceding pages, and may serve as a briefrefresher as you embark on your selection process.
15
1069 primer reprint 11/29/01 2:43 PM Page 13
Cost.Finally, there’s the budget – not just the initialcost of the capital equipment, but the true costof ownership, which includes getting the labready for the instrument, and the actual cost ofrunning samples. The purchase cost is verystraightforward and usually well-understood,but the other two are often forgotten or under-estimated.
Capital costsObviously, because there are many instrumentsavailable from a number of manufacturers, andbecause so many options and configurations arepossible, it is difficult to put absolute values oncapital costs. However, the table below canserve as a starting point. Remember, though,that accessories or options may add consider-ably to the purchase price.
Roughly, you can expect to pay from around$15-20,000 for a base configuration flame AA system, and compute the other costs from there.
Relative System CostsFlame AAS 1xFurnace AAS 2xSequential ICP-AES 4-5xSimultaneous ICP-AES 5-7xICP-MS 10-20x
Installation costsYour laboratory may require significant changesbefore adding an elemental analysis instrument.For example, all these systems require fumeextraction. ICP-MS or GFAAS sometimesrequire clean room conditions (Class 100 orbetter) to operate at the ppt level. ICP-basedsystems (ICP-AES or ICP-MS) require high-volume gas installations.
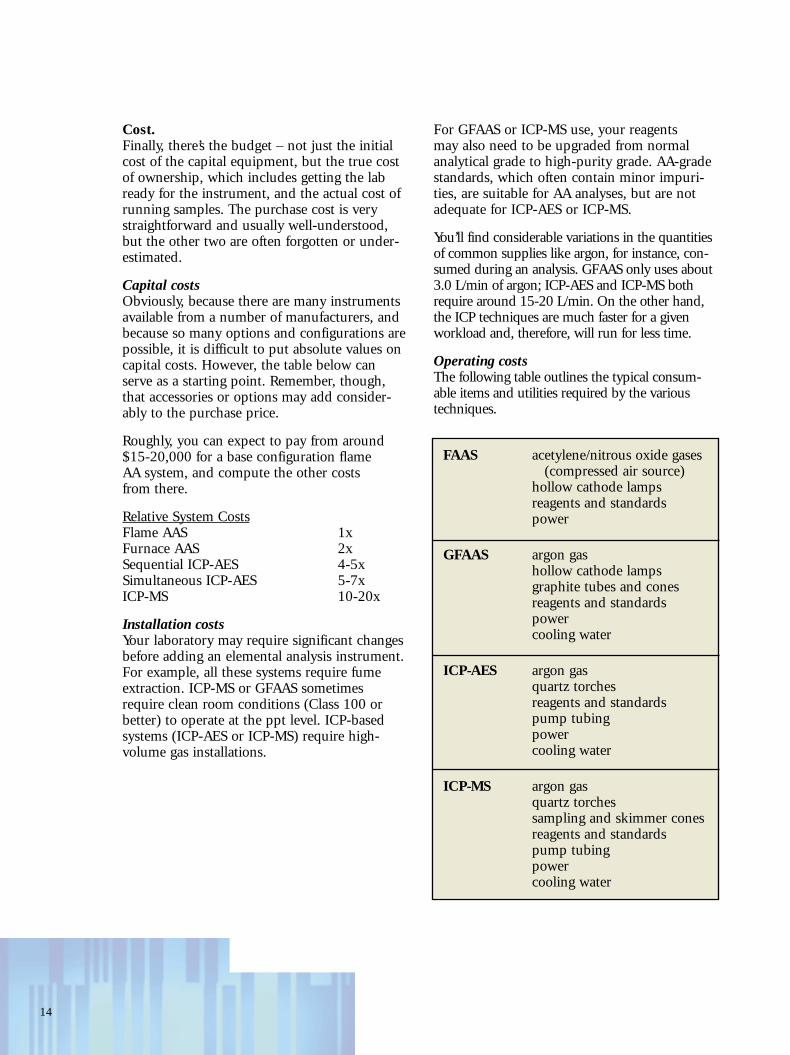
FAAS acetylene/nitrous oxide gases(compressed air source)
hollow cathode lampsreagents and standardspower
GFAAS argon gashollow cathode lampsgraphite tubes and conesreagents and standardspowercooling water
ICP-AES argon gasquartz torchesreagents and standardspump tubingpowercooling water
ICP-MS argon gasquartz torchessampling and skimmer conesreagents and standardspump tubingpowercooling water
For GFAAS or ICP-MS use, your reagents may also need to be upgraded from normalanalytical grade to high-purity grade. AA-gradestandards, which often contain minor impuri-ties, are suitable for AA analyses, but are notadequate for ICP-AES or ICP-MS.
You’ll find considerable variations in the quantitiesof common supplies like argon, for instance, con-sumed during an analysis. GFAAS only uses about3.0 L/min of argon; ICP-AES and ICP-MS bothrequire around 15-20 L/min. On the other hand,the ICP techniques are much faster for a givenworkload and, therefore, will run for less time.
Operating costsThe following table outlines the typical consum-able items and utilities required by the varioustechniques.
14
1069 primer reprint 11/29/01 2:43 PM Page 14
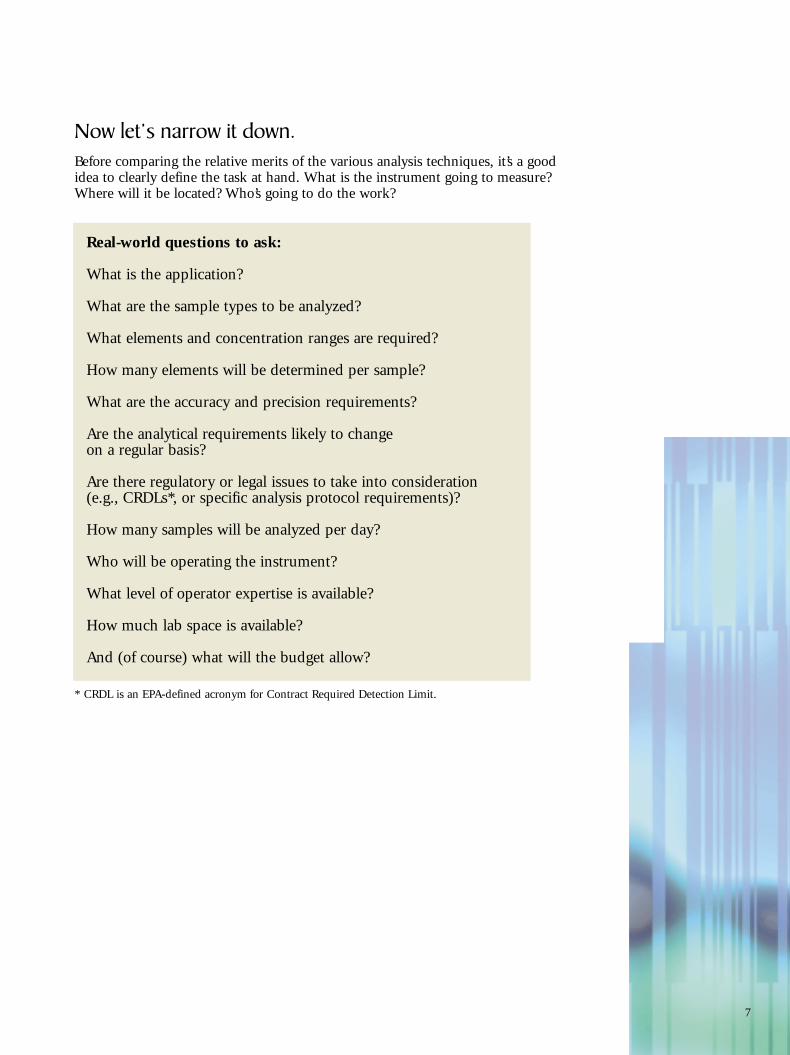
Now let’s narrow it down.Before comparing the relative merits of the various analysis techniques, it’s a goodidea to clearly define the task at hand. What is the instrument going to measure?Where will it be located? Who’s going to do the work?
* CRDL is an EPA-defined acronym for Contract Required Detection Limit.
7
Real-world questions to ask:
What is the application?
What are the sample types to be analyzed?
What elements and concentration ranges are required?
How many elements will be determined per sample?
What are the accuracy and precision requirements?
Are the analytical requirements likely to change on a regular basis?
Are there regulatory or legal issues to take into consideration (e.g., CRDLs*, or specific analysis protocol requirements)?
How many samples will be analyzed per day?
Who will be operating the instrument?
What level of operator expertise is available?
How much lab space is available?
And (of course) what will the budget allow?
1069 primer reprint 11/29/01 2:44 PM Page 15
1
H1.008
3
Li6.941
4
Be1.008
11
Na22.99
12
Mg24.31
19
K39.10
20
Ca40.08
21
Sc44.96
22
Ti47.88
23
V50.94
24
Cr52.00
25
Mn54.94
26
Fe55.85
27
Co58.47
28
Ni58.69
29
Cu63.55
30
Zn65.39
31
Ga69.72
13
Al26.98
5
B10.81
37
Rb85.47
38
Sr87.62
39
Y88.91
40
Zr91.22
41
Nb92.91
42
Mo95.94
43
Tc(98)
44
Ru101.1
45
Rh102.9
46
Pd106.4
47
Ag107.9
48
Cd112.4
49
In114.8
55
Cs132.9
87
Fr(223)
56
Ba137.3
88
Ra(226)
57
La138.9
89
Ac(227)
72
Hf178.5
73
Ta180.9
74
W183.9
75
Re186.2
76
Os190.2
77
Ir190.2
78
Pt195.1
79
Au197.0
80
Hg200.5
81
Tl204.4
58
Ce140.1
59
Pr140.9
60
Nd144.2
61
Pm(147)
62
Sm150.4
63
Eu152.0
64
Gd157.3
65
Tb158.9
66
Dy162.5
90
Th232.0
91
Pa(231)
92
U(238)
93
Np(237)
94
Pu(242)
95
Am(243)
96
Cm(247)
97
Bk(247)
98
Cf(249)
ICP/ICP-MS/AA ICP-MS
ICP/ICP-MS ICP
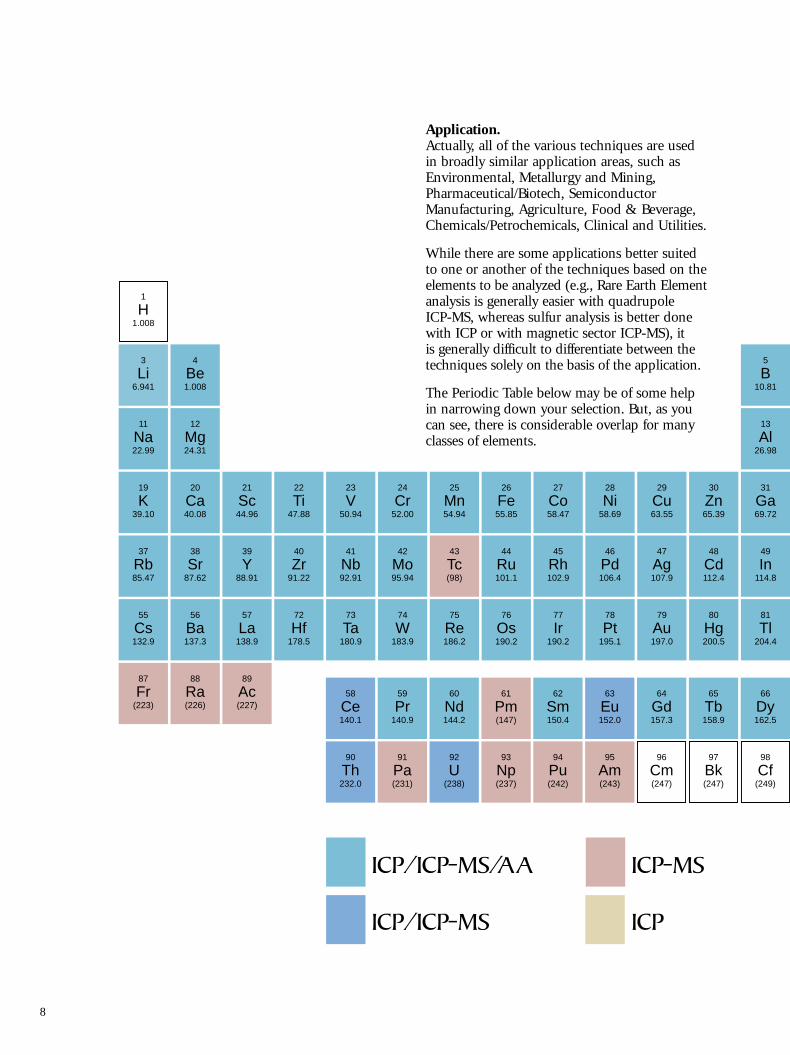
Application.Actually, all of the various techniques are usedin broadly similar application areas, such asEnvironmental, Metallurgy and Mining,Pharmaceutical/Biotech, SemiconductorManufacturing, Agriculture, Food & Beverage,Chemicals/Petrochemicals, Clinical and Utilities.
While there are some applications better suitedto one or another of the techniques based on theelements to be analyzed (e.g., Rare Earth Elementanalysis is generally easier with quadrupole ICP-MS, whereas sulfur analysis is better donewith ICP or with magnetic sector ICP-MS), it is generally difficult to differentiate between thetechniques solely on the basis of the application.
The Periodic Table below may be of some helpin narrowing down your selection. But, as youcan see, there is considerable overlap for manyclasses of elements.
8
1069 primer reprint 11/29/01 2:44 PM Page 16
Speed of Measurement.How many samples can a particular techniqueanalyze in a given time? How many elements canbe determined? For each sample, the measure-ment cycle consists of three steps:
An equilibration period in which sample is takenfrom the sample container, transported to the atomcell, and the analytical signal reaches stability.
ICP-MS and ICP-AES systems have similar new-sample delay times, which may be up to 60 seconds long. FAAS is much quicker, typicallyonly about 5 seconds. GFAAS systems can takeup to 2 minutes to dry and ash the sample priorto measurement.
A measurement period during which the signal ismeasured for the element(s) and, if necessary,their background points.
A rinse-out period during which the sample isremoved from the source. This step may be car-ried out concurrently with the first; i.e. the nextsample may be used to rinse out the previous one.For AAS and sequential ICP-AES systems, there isa further period while the next element line isselected.
ICP-MS and simultaneous ICP-AES systems makethe fastest measurements; all analytes in a samplecan be measured in about 2-5 minutes. SequentialICP-AES systems take about 10 seconds peranalyte line, including the time taken to selectthe line. The sequence is to measure all the ana-lytes in a sample, one after another, then go tothe next sample and measure all the lines again.
FAAS generally requires about 4 seconds permeasurement, but the sequence is different. All samples are measured at a single analyteline, then the next lamp is selected and all samples are measured again.
GFAAS measurement time is less than 5 secondsfor a single result at a single analyte line. However,several repeats per sample may be necessary withGFAAS to obtain satisfactory precision.
Overall the speeds are typically as follows:ICP-MS: All elements in
2-5 minutes
ICP-AES (Simultaneous): All elements in 2-5 minutes
ICP-AES (Sequential): 5-6 elements per minute
FAAS: 4 seconds per element
GFAAS: 2-3 minutes per element
Clearly, the total analysis time taken by the different techniques will depend on the numberof elements to be measured per sample. As aresult, the speed parameter provides a relativelysolid base for deciding on one technique overanother (all other factors being equal):
• For less than 5 elements per sample, FAAS is often the quickest technique, depending on the total number of samples.
• For 5-15 elements, sequential ICP-AES is theoptimum choice.
• Above 15 elements, either ICP-MS or simulta-neous ICP-AES is the best choice.
• GFAAS will always be the slowest of the tech-niques (however, it may still be the method ofchoice for other reasons).
13
1069 primer reprint 11/29/01 2:44 PM Page 17
Ease of Use.FAAS systems are usually very easy to set upand run. They are capable of some degree ofautomation but should not be run unattended,due to the flammable gas risk. Method develop-ment is easy and a vast library of methodsexists.
GFAAS systems are somewhat more difficult toset up because of the accuracy of sample injec-tion required to achieve the best results. Also,the limited working lifetime of the graphitetubes requires more frequent set up. Furnacemethod development can be difficult, and mayrequire considerable expertise. Fortunately, asubstantial methods library exists. Furnace AAsystems are capable of a high degree of automa-tion; because they only use inert argon gas, theycan safely run unattended.
ICP-AES systems are easy to set up and have tobe adjusted relatively infrequently. If there aremajor spectral interferences, method develop-ment can be complicated; however, the use ofhigh-resolution spectrometers can minimize thisproblem. In general, though, method develop-ment is moderately easy, although the library ofmethods is less than for the AAS and GFAAStechniques. ICPs are capable of a high degree ofautomation, and can run unattended.
ICP-MS systems are getting easier to set up forroutine analysis. Some parts of the system (e.g.,the interface cones) may need regular attentionto preserve performance. Method developmentcan be more involved than with the other tech-niques and requires a higher level of expertise.ICP-MS systems can be fully automated, andcan run unattended.
Operator Skill.Not every technique requires a trained scientistfor everyday operation. In fact, there is anincreasing trend in many industries to use lessskilled technicians for routine analysis tasks.
Although today’s “point and click” software hasgreatly simplified the operation of even themost complicated equipment, software can’tsubstitute for understanding. It is important to consider the technical level of laboratory personnel who are going to be operating theinstrument, and to allow for additional training –or possibly even additional staff – if required.
Generally speaking, flame AAS is quite easy toset up and to use, and requires minimal opera-tor skill. Furnace AA can be considerably moredifficult to operate, calling for a relatively highlevel of knowledge and ability.
ICP-AES falls between these two, particularlyfor production-type applications, and is a biteasier to master than GFAAS, both in view ofmodern software capabilities, and the consider-able body of literature available.
ICP-MS is a newer technique. Its applicationlibrary, while growing rapidly, is not as com-plete as for the other methods. To consistentlyachieve superior results and reliable, high-qualitydata, you will probably need a somewhat moreskilled person in charge of the instrument,although setting up the machine to run predesigned methods is a simple process.
12
1069 primer reprint 11/29/01 2:44 PM Page 18
14
Si28.09
15
P30.97
16
S32.07
17
Cl35.45
18
Ar39.95
6
C12.01
7
N14.01
8
O16.00
9
F19.00
10
Ne20.18
2
He4.003
32
Ge72.59
33
As74.92
34
Se78.96
35
Br79.90
36
Kr83.80
50
Sn118.7
51
Sb121.8
52
Te127.6
53
I126.9
54
Xe131.3
82
Pb207.2
83
Bi209.0
84
Po(210)
85
At(210)
86
Rn(222)
9
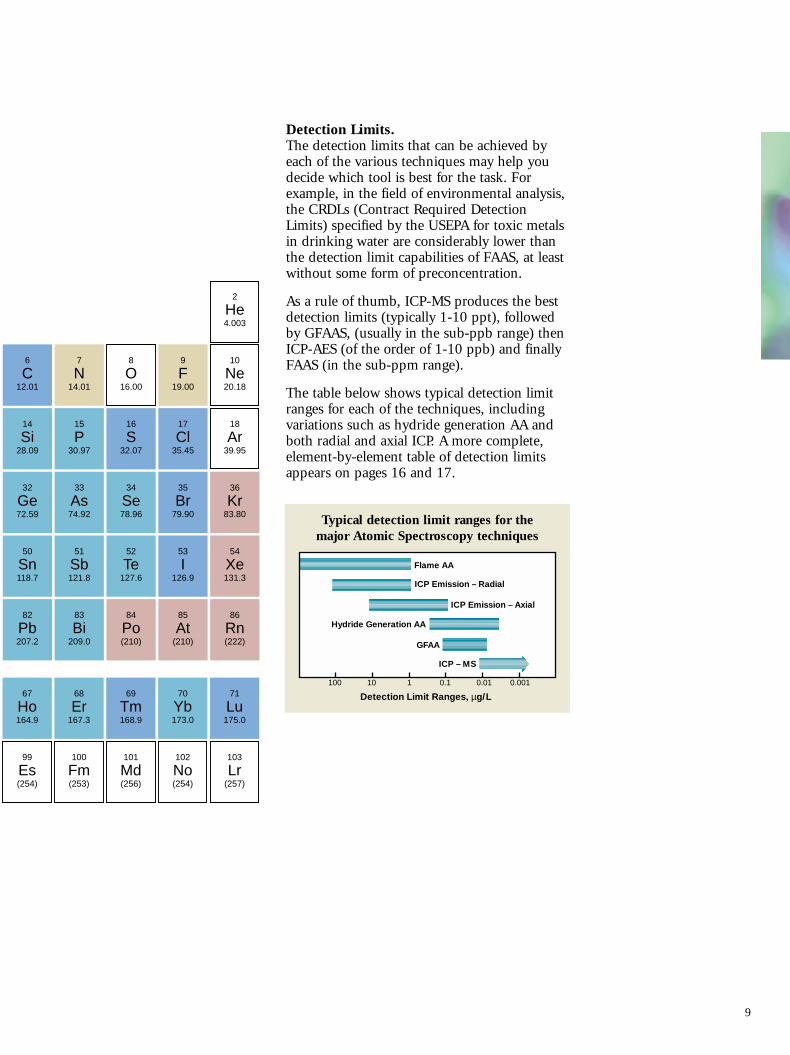
Detection Limits.The detection limits that can be achieved byeach of the various techniques may help youdecide which tool is best for the task. Forexample, in the field of environmental analysis,the CRDLs (Contract Required DetectionLimits) specified by the USEPA for toxic metalsin drinking water are considerably lower thanthe detection limit capabilities of FAAS, at leastwithout some form of preconcentration.
As a rule of thumb, ICP-MS produces the bestdetection limits (typically 1-10 ppt), followedby GFAAS, (usually in the sub-ppb range) thenICP-AES (of the order of 1-10 ppb) and finallyFAAS (in the sub-ppm range).
The table below shows typical detection limitranges for each of the techniques, includingvariations such as hydride generation AA andboth radial and axial ICP. A more complete, element-by-element table of detection limitsappears on pages 16 and 17.
Detection Limit Ranges, µg/L
100 10 1 0.1 0.01 0.001
Flame AA
ICP Emission – Radial
ICP Emission – Axial
Hydride Generation AA
GFAA
ICP – MS
Typical detection limit ranges for the major Atomic Spectroscopy techniques
67
Ho164.9
68
Er167.3
69
Tm168.9
70
Yb173.0
71
Lu175.0
99
Es(254)
100
Fm(253)
101
Md(256)
102
No(254)
103
Lr(257)
1069 primer reprint 11/29/01 2:45 PM Page 19
Precision.“Precision” is a measure of the confidenceyou can have in your measured results. The lower the % RSD (Relative StandardDeviation) of the results, the higher the confidence.
Short-term precision generally refers to measurements made over a period of 5-10minutes; long-term precision is generallymeasured over several hours of operation.
For FAAS, short-term precision is in therange of 0.1-1.0%. The long-term precisiondepends on the spectrometer optics; double-beam types are capable of long-term preci-sion of 1-2%, where single-beam optics aretypically in the 5% range.
Primarily because of difficulties in injectingvery small volumes, GFAAS short-term precisionis generally in the range of 0.5-5%. Long-termprecision is highly dependent on the tube typeand condition.
ICP-AES short-term precision is reasonablygood, around 0.1-2%, and even over periods of several hours, should be no worse than 1-5%.Simultaneous spectrometers (where all the ana-lyte measurements for a sample are made at thesame time) generally have superior short- andlong-term precision compared to sequential systems (where measurements for each analyteare made one after the other). Use of internalstandardization can significantly improve precision for simultaneous instruments.
Short-term for ICP-MS is in the range 0.5-2%,with long-term precision around the 4% level.Use of internal standardization or the morecostly method of isotope dilution can signifi-cantly improve precision.
Long-term precision in any of the techniquescan be improved by more frequent instrument calibration or drift correction techniques.
Generally samples with higher matrix levels willexhibit worse short- and long-term precision.The use of internal standards and drift correc-tion in ICP and ICP-MS will dramaticallyimprove results.
Dynamic Range.Dynamic range of the various techniques isimportant, because it directly affects the amountof dilution necessary in preparing solutions. A wider linear range means fewer standards are needed.
FAAS and GFAAS have limited dynamic ranges, ofthe order of only 102-103; therefore solutionsmust be held in a narrow range of concentrations.
ICP-AES has a considerably wider dynamic range,up to 106, making it a more suitable techniquefor highly concentrated samples, or sampleswith widely varying concentrations of analyteelements. It can be considered a techniquecapable of measuring from trace to percent levels.
ICP-MS typically operates at much lower con-centration levels so that linear ranges up to 108
can be achieved for some analytes. In standardpractice, however, ICP-MS is a technique forultra-trace to trace levels to ppm levels.
10
1069 primer reprint 11/29/01 2:45 PM Page 20
Elemental Interferences and Other Problems.All of these elemental analysis techniques sufferfrom various interference effects. The severity ofthese effects can make a big difference in resultsfor real samples. Broadly speaking, interferencescan be classed as (a) Spectral – due to atomic or molecular fine structure in the spectrum; (b) Background – due to broad features or electronic baseline; (c) Matrix effects – primarilydue to physical or chemical influences.
Flame AAS(a) Spectral – There are virtually no spectralinterferences of any significance in flame AAS. (b) Background – Background effects do existand have to be compensated for by using someform of background correction. A deuterium-based lamp is commonly used for this purpose.(c) Matrix effects – These are more serious,although use of the hotter N2O/acetylene flamecan minimize many of the chemical effects.Ionization becomes a problem when the hotterflames are used; ionization buffers are required.Viscosity/surface tension effects in the spraychamber/nebulizer can require the use ofmatched standards.
Graphite furnace AAS(a) Spectral – There are virtually no spectralinterferences in graphite furnace AAS. (b) Background – Background effects do exist on a major scale and have to be compensatedfor by using deuterium or Zeeman backgroundcorrection. The background usually arises fromvaporized matrix components which are beingatomized at the same time as the analyte.(c) Matrix effects – These can be very serious andgenerally occur in the vapor phase; various chem-ical modifiers and platforms within the graphitetube are used to control these interferences. Inaddition, injection of samples into the tube issubject to viscosity/surface tension problems.
ICP-AES(a) Spectral – Spectral interference problems are fairly common in this technique due to theline-rich spectra produced by the hot plasmasource. They can be minimized by using high-resolution spectrometers or using inter-elementcorrection factors. The simplest cure is to moveto an alternative analyte line (although this maycause a loss of sensitivity).
(b) Background – Background effects do exist inICP-AES and require the use of off-line back-ground correction techniques, or, increasingly,sophisticated chemometrics. Molecular species(such as OH from the water solvent) can causepeak or band structures. It may be possible to minimize them by careful selection of plasma conditions or moving to an unaffected analyte line.(c) Matrix effects – Chemical matrix effects areminimal, but physical effects such as viscosityand surface tension effects in the spray chamber/nebulizer mean that matched standards may be required. Use of an internal standard is acommon way of overcoming this problem.
ICP-MS(a) Spectral – Spectral interference problems inICP-MS are relatively few and well-documented.They occur when species (which may be mole-cules or doubly-charged ions) have the same or very similar mass as the analyte. They areknown as isobaric interferences and cannot be resolved at resolutions typically found incommon quadrupole mass spectrometers.
Inter-element correction factors can be used(similar in principle to inter-element correction factors in ICP-AES) or other, lower abundance isotopes must be selected with a resulting loss of sensitivity.
Many of the interferences can now beovercome using cool plasma or collision celltechnology to break up the molecules or byusing high-resolution magnetic sector ICP-MS.(b) Background – No broad background speciesexist for MS as can be found with optical tech-niques. Electronic background is low, but is a factorthat can differentiate some ICP-MS systems. ManyICP-MS determinations are said to be “backgroundlimited,” which is a term that signifies that the contamination in the blank or memory effects whichlimit the detection limit. At the part-per-trillionlevel, this can be significant. (c) Matrix effects – Chemical matrix effects canbe a problem in ICP-MS, resulting in impairedaccuracy if not addressed. They result from thepresence of the argon plasma gas and also the solvents/acids used in preparing the samples.For this reason care should be taken whenchoosing the acids for dilution, nitric acid being the preferred choice.
In addition, physical effects (such as viscosity and surface tension effects in the spraychamber/nebulizer) may require the use ofmatched standards. As with ICP-AES, use of aninternal standard can overcome this problem.
11
1069 primer reprint 11/29/01 2:45 PM Page 21
A word about Thermo Elemental. Elemental analysis to the power of 3.
Thermo Elemental brings together all of Thermo Electron’s elemental analysisbusinesses. One call – or a visit to our e-commerce-enabled website – gives youaccess to robust, best-of-breed solutions across the full technology spectrum,including the innovative SOLAAR M Series Dual Flame/Furnace AA, the IRISIntrepid ICP and the industry-leading VG PQ ExCell ICP-MS.
At Thermo Elemental, we share a company-wide commitment to helping cus-tomers realize maximum value for their investment in our products throughresponsive, accessible service and support. It means being there when you needus, wherever you happen to be. It means giving you the information you needto face today’s challenges with confidence.
We hope this booklet has been informative, and that it helps you select the bestpossible elemental analysis system for your laboratory. Needless to say, we alsohope you’ll consider our products when making your decision.
To find out more about the elemental analysis solutions from Thermo Elemental call 800-229-4087, 508-520-1880, 44 (0) 1606 548100 or visit us on the webat www.thermoelemental.com.
27 Forge Parkway, Franklin, MA 02038(800) 229-4087 (508) 520-1880
Ion Path, Road Three, WinsfordCheshire CW7 3BX United Kingdom44 (0) 1606 548100
www.thermoelemental.com
© 2001 Thermo Elemental. All rights reserved. Printed in U.S.A.S002B Rev 02/01
A Thermo Electron business
1069 primer reprint 11/29/01 2:40 PM Page 2


![[SHIMADZU] 島津製作所 · cc-ms cv-aas, cv-afs, icp-oes, icp-ms, aas pbb/pbde cr(vl) pb/cd icp-oes. icp-ms icp-oes. icp-ms, icp-oes, icp-ms, cc-ms aas cv-aas aas : aas . - icp-oes](https://img.pdfslide.net/doc/110x75/602bef1d6551697710154f3f/shimadzu-eoe-cc-ms-cv-aas-cv-afs-icp-oes-icp-ms-aas-pbbpbde-crvl.jpg)