Embed Size (px)
Citation preview

AAS Statistics and the “60% Cohort”
Kevin B. Marvel
Deputy Executive Officer
American Astronomical Society
1973 AAS Membership Distribution
0
10
20
30
40
50
60
70
80
90
100
18 23 28 33 38 43 48 53 58 63 68 73 78 83
Age (5 year bins)
Percent
1973 Men 1973 Women
1990 AAS Membership Distribution
0
10
20
30
40
50
60
70
80
90
100
1 2 3 4 5 6 7 8 9 10 11 12 13 14
Age (5 year bins)
Percent
1990 Men 1990 Women
1995 AAS Membership Distribution
0
10
20
30
40
50
60
70
80
90
100
18 23 28 33 38 43 48 53 58 63 68 73 78 83
Age (5 year bins)
Percent
1995 - Men 1995 - Women

Topics
• Becoming part of the workforce
• Trends in employment openings
• Where do astronomers work?
• The changing AAS

Rule Number 1
• Only YOU, the job seeker, is responsible for finding a job, not me, not “the world,” not your mom…YOU!– Resume databases provide a false sense of
active searching– Passive application is useless– You must stand out to get hired– Customize everything job by job

The AAS is here to help
• Job Centers at every meeting
• Career workshops at winter meetings
• Sessions and speakers on career issues
• Networking opportunities galore
• Newsletter articles on employment issues
• Non-academic career information
• Advocates on career issues

Recent Job Center Statistics
0
20
40
60
80
100
120
Atlanta Rochester San Diego Pasadena Washington ABQ Seattle
Job Seekers
Employers

Job Register Statistics
0
50
100
150
200
250
300
350
Jan Feb Mar Apr May Jun
Jobs YTD
2000 2001 2002 '2003 '2004

Job Register StatisticsJob Register
0
20
40
60
80
100
120
1 2 3 4 5 6 7 8 9 10 11 12
Month
Jobs/Month
'00 '01 '02 '03' '04
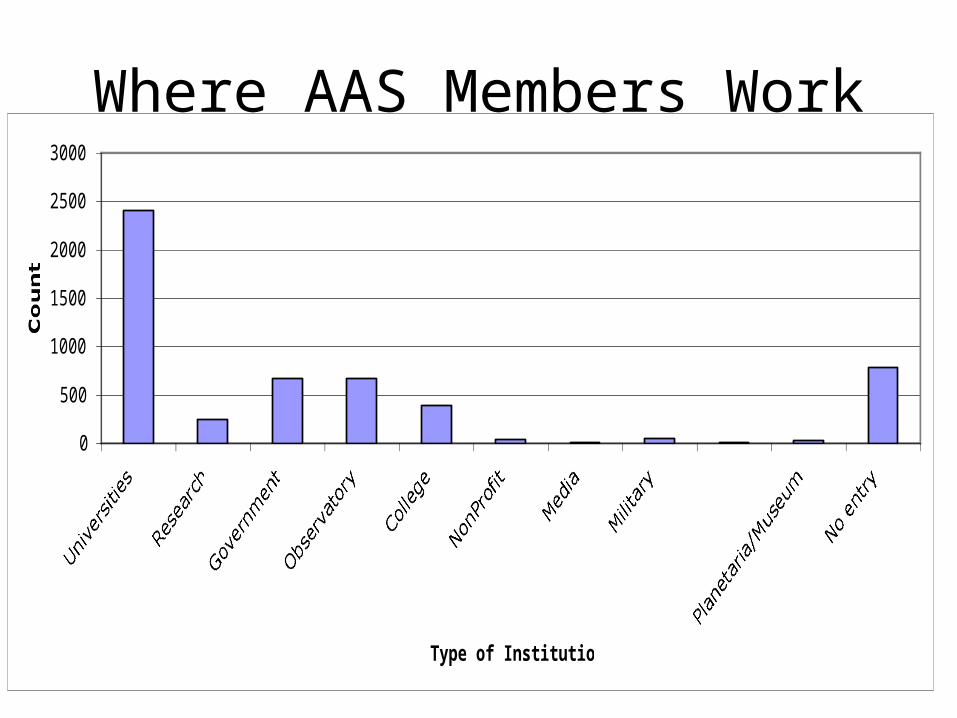
Where AAS Members Work
0
500
1000
1500
2000
2500
3000
UniversitiesResearch
GovernmentObservatory
CollegeNonProfit
Media MilitaryOther
Planetaria/Museum
No entry
Type of Institution
Count

The changing AAS - 1973
• Initial survey of membership• First action by Working Group on the Status of
Women in Astronomy, established August 1972• 2,800 sample size, 27% response rate• Overall female membership was only 8%• Evidence for ‘youth peak’ for women• Women prize winners and AAS leadership
numbers low relative to % membership

Demographics - 19731973 AAS Membership Distribution
0
10
20
30
40
50
60
70
80
90
100
18 23 28 33 38 43 48 53 58 63 68 73 78 83
Age (5 year bins)
Percent
1973 Men 1973 Women

Demographics - 19731973 AAS Membership - Age Distribution
Difference by Gender
0
5
10
15
20
25
30
35
18 23 28 33 38 43 48 53 58 63 68 73 78 83
Age (5 year bins)
Percent of Gender at Age
Men Women

The AAS - 1990
• Complete membership survey– Expensive ~ $25,000 in 1990 dollars
• Response rate good : 42%– Implies reliability of +/- 1.6%
• Overall female membership increased since 1973– 12.6% vs. 8%
• More young female members than male– Peak of age distribution ~ 30 vs. 45

Demographics – 19901990 AAS Membership Distribution
0
10
20
30
40
50
60
70
80
90
100
18 23 28 33 38 43 48 53 58 63 68 73 78 83
Age (5 year bins)
Percent
1990 Men 1990 Women
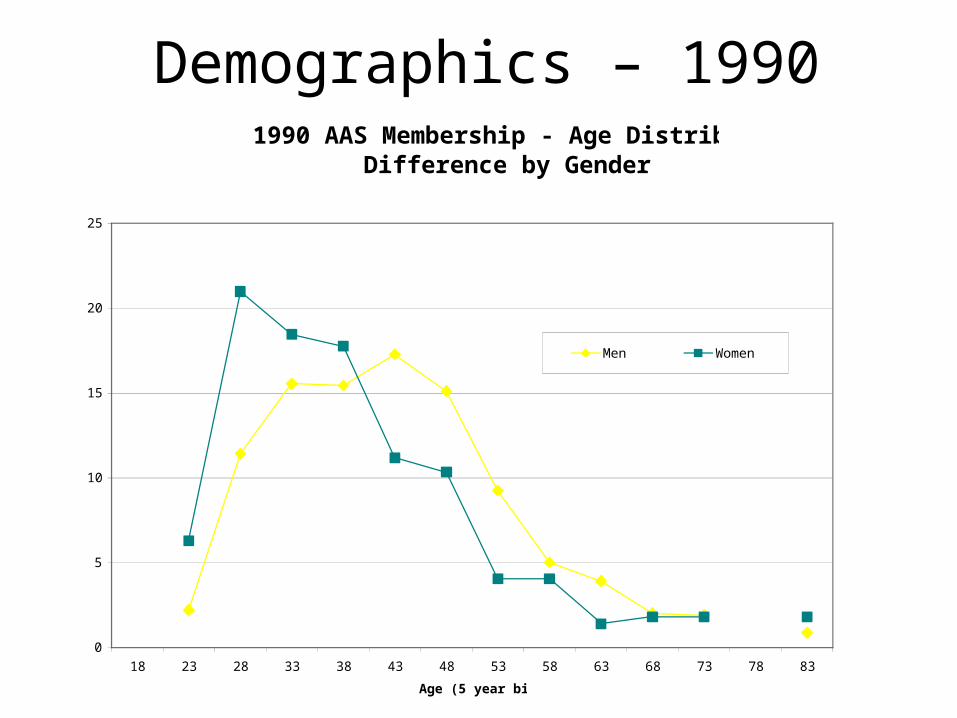
Demographics – 19901990 AAS Membership - Age Distribution
Difference by Gender
0
5
10
15
20
25
18 23 28 33 38 43 48 53 58 63 68 73 78 83
Age (5 year bins)
Percent of Gender at Age
Men Women

The AAS - 1995
• Partial Membership Survey– 30% response rate, ~1,000 member sample
• Overall female membership increased– 16.5% vs. 12.6% (1990 Membership Survey)
• Number of women shows episodic growth– Causes?

Demographics - 19951995 AAS Membership Distribution
0
10
20
30
40
50
60
70
80
90
100
18 23 28 33 38 43 48 53 58 63 68 73 78 83
Age (5 year bins)
Percent
1995 - Men 1995 - Women

Demographics - 19951995 AAS Membership - Age Distribution
Difference by Gender
0
5
10
15
20
25
18 23 28 33 38 43 48 53 58 63 68 73 78 83
Age (5 year bins)
Percent of Gender at Age
Men Women

Demographics - 1995An accelerating demographic
1995 Data
0.0
5.0
10.0
15.0
20.0
25.0
30.0
35.0
3040506070
Upper limit for age bin (cumulative)
Percent

Demographics 2003
• Snapshot of AAS membership database as of 6/23/03
• Includes all US member types except publisher affiliates: Lifetime, Emeritus, Full, Associate, Junior, Division, Division Affiliates
• Birth date is optional information provided at time of joining => total sample is 5,962

Demographics 2003AAS Membership Distribution
0.0
10.0
20.0
30.0
40.0
50.0
60.0
70.0
80.0
90.0
100.0
18 23 28 33 38 43 48 53 58 63 68 73 78 83
Age (5 year bins)
Percent
2003 - Men 2003 - Women

Demographics 20032003 AAS Membership - Age Distribution
Difference by Gender
0.0
2.0
4.0
6.0
8.0
10.0
12.0
14.0
16.0
18.0
20.0
18 23 28 33 38 43 48 53 58 63 68 73 78 83
Age (5 year bins)
Percent of Gender at Age
Men Women

Demographics - 2003An accelerating demographic
2003 Data
0.0
5.0
10.0
15.0
20.0
25.0
30.0
35.0
40.0
304050607080
Upper limit for age bin (cumulative)
Percent

Demographics 2004
• Snapshot of membership database last week as of 5/29/04
• Includes all US member types except publisher affiliates: Lifetime, Emeritus, Full, Associate, Junior, Division
• Birth date is optional information provided at time of joining => total sample is 5,312

Demographics 2004AAS Membership Distribution
00.10.20.30.40.50.60.70.80.9
1
18 23 28 33 38 43 48 53 58 63 68 73 78 83
Age Bins (lower bin edge)
Fraction of age bin
2004 - Men 2004 - Women

Conclusions
• Winter meetings best for job searching• Jobs available, slight downturn in JR
advertising recently, recovering• AAS demographics changing dramatically• Overall gender parity in 15 years• Ongoing data gathering
– Demographics– Job advertisements– Job centers


![· K]01enqe-l pape]luooqns UOII!PUOO Isa 1 pape'luooqns uompuoa 8 Xiptlõddv L aas 9 x!puaddv aas g X!puaddv aas xvpuaddv aas X!puaddv aas x !puoddv aas 1 xvpuoddv aas llnsa8 uo!taas](https://img.pdfslide.net/doc/110x75/5fd8f48630ab410c3c31d136/k01enqe-l-papeluooqns-uoiipuoo-isa-1-papeluooqns-uompuoa-8-xiptlddv-l-aas.jpg)