Embed Size (px)
Citation preview

SalarySurvey
2 0 2 1

2Find out more at aat.org.uk/salary
Introduction
3Salary by AAT membership level
5Bonus by AAT membership level
6Salary by region
8Salary and bonus by age
9Salary and bonus by gender
11
Salary and bonus by industry
12Company benefits by industry
14Salary and bonus by job level
15Salary and bonus by company size
16Career intentions in the next 12 months
18Job satisfaction
19
Job security
20Average annual income of AAT Licensed Accountants
22Job satisfaction of AAT Licensed Accountants
23Job security of AAT Licensed Accountants
24Effects of Covid-19
27Methodology
29
Contents—
AAT Salary Survey 2021

3Find out more at aat.org.uk/salary
AAT is the world’s leading professional body for accounting technicians. We work across the globe with around 125,000 members in 100 countries.
Our members are represented at every level of the finance and accounting world, including:
• students – those who are studying our accounting qualifications
• affiliates – those who have completed the AAT Professional Diploma in Accounting and have yet to become AAT professional members
• MAATs – those who have achieved the AAT Professional Diploma in Accounting and have been approved as AAT full members
• FMAATs – those who have gained AAT fellow member status, following at least five years of MAAT status
• AAT Licensed Accountants – these are MAATs and FMAATs who hold an AAT licence allowing them to provide self-employed accountancy and bookkeeping services.
The AAT Salary Survey 2021 not only provides us with an in-depth knowledge of our members’ remuneration package, but it also gives us a good indication of the overall economy, as well as revealing other key factors that matter to our members at different stages of their working lives.
This year’s survey also takes into consideration the impact that coronavirus (Covid-19) has had on our members and examines how it has affected their income, as well as their work/life balance.
AAT bookkeeping members and AAT Licensed Bookkeepers are not included in this survey.
The last survey was conducted in 2019.
Introduction—
AAT Salary Survey 2021
3Find out more at aat.org.uk/salary

4Find out more at aat.org.uk/salary
2021 RESULTS
AAT Salary Survey 2021

Throughout the survey we’ll refer to AAT members, this is the combination of our student, affiliate, MAAT and FMAAT members. AAT Licensed Accountants, which are members who run their own practice, are featured in the next section. We can see clear evidence of an increase in salary as AAT members progress through the different stages of their membership journey. Student salaries are up 10%, affiliate salaries are up 4% and MAAT and FMAAT salaries are up 9% compared to 2019.
The greatest increase from one level to the next is from MAAT to FMAAT with a 33% increase in salary from £30,000 at MAAT level to £40,000 at FMAAT level.
Average basic salary for each level of AAT membership—
Average* basic salary for each level of AAT membership
How have salaries changed since 2019?
* Median salary = The exact mid-point salary from all those who responded. These salaries are for AAT members working full-time.
Base AAT members (non-AAT Licensed Accountants) – 13,926
£37,200
£40,000
£30,000
£28,000
£24,500
£23,500
£22,000
£20,000
2021 2019
FMAA
TM
AAT
A�lia
teSt
uden
t
£24,500£30,000£40,000
£23,400£21,000£21,000
Professional student (Level 4)
Advanced student (Level 3)
Foundation student (Level 2)
Affiliate
MAAT FMAAT
AAT Salary Survey 2021
5Find out more at aat.org.uk/salary

32% of respondents received a bonus this year, down 1% on 2019.
These bonuses represent the average (median) for AAT members working full-time.Base
13,169
Within the last year, 32% of AAT members received a bonus. This is down 1% from 33% in 2019 and is the same as 2017. Average bonuses represent 2% of the overall salary for students and affiliates, then 3% and 5% respectively for MAATs and FMAATs.
Despite the average salary increasing across all stages of the membership journey, the average bonus figures are the same or down compared with 2019.
Average bonus received within the last year—
Average full-time bonus by membership level
These diagrams show the percentage of members who received a bonus – 29% of students, 33% of affiliates, 35% of MAATs and 38% of FMAATs.
Affiliate FMAAT
£500
Student
£600
Affiliate
£2,000£1,000
MAAT and
FMAAT
Student MAAT
AAT Salary Survey 2021
6Find out more at aat.org.uk/salary

7Find out more at aat.org.uk/salary
80% OF MEMBERS THAT HAVE COMPLETED AN AAT ACCOUNTING QUALIFICATION AGREE IT HAS INCREASED THEIR EARNING POTENTIAL.
AAT Salary Survey 2021

London remains the top paying region in the UK across all membership levels.On average, there is a 32% difference in salaries between the highest paying region, London, and the lowest paying regions in the North East and North West.
Salary by region—
The North East and North West are the lowest paying regions for students and professional members. Wales is the lowest paying region for affiliates. London remains the top paying region at all levels.
Average salary by region
BaseStudents – 6,795
Affiliates – 567MAATs and FMAATs – 3,723
These salaries represent the average (median) salaries for AAT members working full-time.Northern Ireland has not been included due to very low base numbers (27 respondents in total).*Low base of less than 30 respondents.
MAAT and FMAATA�liateStudent
Yorkshire andthe Humber
North East £23,000*
£20,000
£28,000
Wales £21,400*
£21,000
£29,000
£22,000
£20,500
£30,000
North West £23,000
£20,000
£30,000
West Midlands £24,000
£21,000
£30,000
East Midlands £24,000
£21,000
£30,000
South West £24,000
£21,600
£30,000
East of England £26,000
£22,000
£31,800
Scotland £25,300
£22,000
£32,000
South East £25,700
£23,000
£33,861
London £30,000
£26,000
£38,200
AAT Salary Survey 2021
8Find out more at aat.org.uk/salary

Following the trend in previous years, average salaries and bonuses show progression by age except for the bonuses received by those aged 55+. Compared to 2019, salaries for those aged 45 to 54 have not changed. All other bands have seen an increase.
Salary and bonus by age—
Average salary by age
Bonuses represent 2–3% of remuneration up to age 34, and 3–4% for those over 35.
Average bonus by age
These salaries and bonuses represent the average (median) for AAT members working full-time.Base
13,926
55+ £34,400
45–54 £30,000
35–44 £27,500
25–34 £24,491
19–24 £19,000
16–18 £11,725
£1,000£1,082£1,000£750£500£200
35–44 45–54 55+ 25–34 19–24 16–18
AAT Salary Survey 2021
9Find out more at aat.org.uk/salary

10Find out more at aat.org.uk/salary
THERE IS A 32% DIFFERENCE IN SALARIES BETWEEN THE HIGHEST PAYING REGION, LONDON, AND THE LOWEST PAYING REGIONS IN THE NORTH EAST AND THE NORTH WEST.
AAT Salary Survey 2021

Among professional members (MAATs and FMAATs), we continue to see the gender pay gap widen, with men earning 8% more than women. This compares with a 5% gap in 2019.At student and affiliate levels, the reverse is true, and we see women with a higher average salary.
The gender pay gap is also evident when looking at those who have seen a salary increase this year compared to last: 54% of men working full-time have seen an increase compared with 48% of women.
Salary and bonus by gender—
Men at MAAT and FMAAT levels are likely to earn 8% more than women.
Average salary by gender
Average bonus by gender
BaseMales – 3,950
Females – 9,976
£1,000£1,000 £2,500£1,700£500£550 £750£500
Student FMAAT Affiliate MAAT
£1,000£1,000 £2,500£1,700£500£550 £750£500
Student FMAAT Affiliate MAAT
£37,000
£43,000
£30,000
£31,365
£25,000
£23,540
£22,000
£21,000
Female
Male
Female
Male
Female
Male
Female
Male
AAT Salary Survey 2021
11Find out more at aat.org.uk/salary

Continuing the trend from the previous years, AAT members working in the not-for-profit sector come out on top in terms of the highest average full-time salary by industry sector.However, the private sector (non-accountancy practices) remains the top bonus payer. Those in the private sector are also much more likely to receive a bonus and be on a bonus scheme compared to other sectors.
Salary and bonus by industry—
Average salary by industry
Average bonus by industry
Those in the not-for-profit sector earn the highest average salaries, while those in the private sector (non-practice) receive higher bonuses.
These salaries and bonuses represent the average (median) for AAT members working full-time.Base
13,169
Public sectorPrivate sector (non-practice)Not-for-profit Private sector (practice) Other
£500 £1,000 £600 £500 £800
Not-for-profit £26,000
Private sector – non-practice £25,000
Public sector £23,500
Private sector – practice £22,000
Other £23,000
AAT Salary Survey 2021
12Find out more at aat.org.uk/salary

13Find out more at aat.org.uk/salary
54% OF MALE AAT MEMBERS WORKING FULL-TIME HAVE SEEN AN INCREASE IN SALARY COMPARED WITH 48% OF WOMEN.
AAT Salary Survey 2021

Members were asked to select their top five preferences from a list of 13 potential company benefits.Flexi-time remains the most desired company benefit: 60% put it in their top five, followed by 55% for private health care and 52% paid time off to study.
This year shows a significant increase in the proportion of members who don’t receive any company benefits – 19% compared with only 7% in 2019.
Company benefits by industry—
Base13,169
Desired benefits (top five)
Benefits currently received Difference
Flexi-time 60% 26% 34%
Private health care 55% 21% 35%
Paid time off to study 52% 26% 26%
Pays for AAT annual membership 52% 48% 4%
Pays/paid for AAT studies 44% 45% -1%
Life assurance 36% 17% 19%
Incentive for completing the AAT Accounting Qualification 36% 7% 28%
Pays for events and short training courses 34% 26% 8%
Travel allowance and/or company car 32% 8% 24%
Incentive for becoming an AAT professional member (F/MAAT and/or AATQB) 31% 3% 28%
Family-friendly policies 31% 12% 19%
A maternity package offering more than the statutory package 21% 10% 12%
Stock options 15% 4% 12%
AAT Salary Survey 2021
14Find out more at aat.org.uk/salary
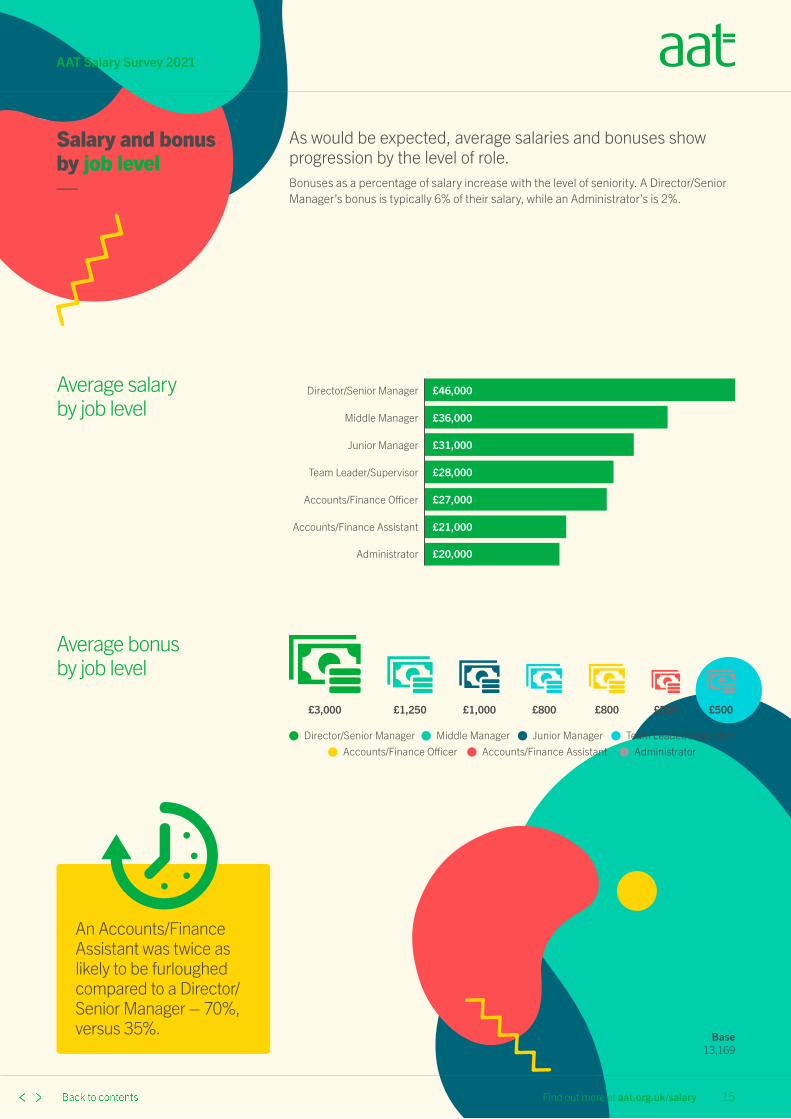
As would be expected, average salaries and bonuses show progression by the level of role. Bonuses as a percentage of salary increase with the level of seniority. A Director/Senior Manager’s bonus is typically 6% of their salary, while an Administrator’s is 2%.
Salary and bonus by job level—
An Accounts/Finance Assistant was twice as likely to be furloughed compared to a Director/Senior Manager – 70%, versus 35%.
Average salary by job level
Average bonus by job level
Base13,169
Director/Senior Manager £46,000
Middle Manager £36,000
Junior Manager £31,000
Team Leader/Supervisor £28,000
Accounts/Finance O�cer £27,000
Accounts/Finance Assistant
Administrator
£21,000
£20,000
Junior ManagerMiddle ManagerDirector/Senior Manager Team Leader/Supervisor Accounts/Finance O�cer Accounts/Finance Assistant Administrator
£3,000 £1,250 £1,000 £800 £800 £500 £500
AAT Salary Survey 2021
15Find out more at aat.org.uk/salary

Following the trend of previous years, we see significantly better average salaries and bonuses in larger organisations. MAATs and FMAATs in large organisations earn on average 20% more than those working in micro companies. The difference for bonuses is also significantly greater.Micro companies have however seen the biggest increase in average salary since 2019 – up 12%.
Salary and bonus by company size—
BaseStudents – 6,740
Affiliates – 561MAATs – 1,256FMAATs – 199
Average salary by company size
Average bonus by company size
£750
£1,500
£500
£500
£1,120
£3,000
£761
£700
£900
£1,500
£500
£500
£1,000
£2,000
£600
£600
Micro1–10 employees
Large>250 employees
Small11–50 employees
Medium51–250 employees
Student FMAAT Affiliate MAAT
Micro (1–10 employees)£24,500
£20,000
£27,300
£33,500
Small (11–50 employees)£23,500
£21,500
£29,250
£38,000
Medium (51–250 employees)£25,000
£22,000
£30,000
£40,000
Large (>250 employees)£25,563
£22,000
£32,040
£43,680
AAT Salary Survey 2021
16Find out more at aat.org.uk/salary

STUDENTS ON APPRENTICESHIPS ARE 11% MORE SATISFIED THAN STUDENTS NOT ON APPRENTICESHIPS – 83% VS 72%.
17Find out more at aat.org.uk/salary
AAT Salary Survey 2021

Members’ career plans this year are similar to previous years with 55% planning to stay in the same job with the same employer in the next year. 78% plan to stay with their current employer, either in the same job or seeking promotion.As expected, the likelihood of a member planning to stay with their current employer in the same role increases by membership level (50% of Foundation students versus 72% of FMAATs).
Career intentions in the next 12 months—
Base2021 – 13,1692019 – 13,198
2017 – 6,015 2015 – 3,0102013 – 4,124
Members’ career intentions 2013–2021
Only 9% of members intend to move to a different employer within the same industry, down 2% since 2019.
Seek promotion with current employerRemain with current employer in same jobMove to di�erent employer within current industryMove to di�erent employer outside current industryOther
24% 51% 11% 12%
2019
23% 52% 12% 11%
2017
21% 53% 12% 11%
2015
20% 52% 13% 13%
2013
2%
2%
3%
3%
23% 55% 9% 11%
2021 2%
AAT Salary Survey 2021
18Find out more at aat.org.uk/salary

—76% of members say they are very or quite satisfied with their current job, which is the same outcome as last year. As we’ve seen in previous years, the greatest job satisfaction can be seen for those who are in more senior roles.
The youngest (16–18) and oldest bands (55+) have the highest feelings of job satisfaction – 86% and 82% respectively.
Job satisfaction —
BaseEmployed work (non-AAT Licensed Accountants) – 13,169
Although London is top for salary and the North East is bottom, it is the opposite for job satisfaction with 79% in the North East versus 62% in London.
Job satisfaction by level
Satisfied Not satisfied Undecided
Dire
ctor
/Sen
ior M
anag
er
87%
12%
1%
Mid
dle
Man
ager
82%
17%
Juni
or M
anag
er81%
18%
Team
Lea
der/S
uper
viso
r
72%
26%
2%
Acco
unts
/Fin
ance
O�
cer
80%
18%Ac
coun
ts/F
inan
ce A
ssis
tant
76%
22%
Adm
inis
trat
or
60%
38%
Oth
er
57%
39%
4%1% 1% 2% 2% 2%
AAT Salary Survey 2021
19Find out more at aat.org.uk/salary

—Feelings of job security are very similar to 2019.85% of members working with UK companies say they feel very or quite secure in their job.
Job security—
73% of members who were placed on furlough feel very or quite secure in their role.
Job security by level
Base13,169
Not secure Undecided
Middle Manager
Director/Senior Manager 1%
2%
90% 9%
88% 11%
Team Leader/Supervisor
Junior Manager 1%
1%
89% 10%
86% 13%
Accounts/Finance O�cer 2%87% 11%
Administrator
Accounts/Finance Assistant 2%
2%
85% 13%
76% 22%
Very and quite secure
AAT Salary Survey 2021
20Find out more at aat.org.uk/salary

21Find out more at aat.org.uk/salary
2021 RESULTSAAT LICENSED ACCOUNTANTS
AAT Salary Survey 2021

Employed and self-employed AAT
Licensed Accountants base282
(those working full-time)
Fee income by practice size base
840 (AAT Licensed Accountants
working full-time who are purely self-employed)
Purely self-employed AAT Licensed Accountants base
2021 – 5582019 – 269 2017 – 1982015 – 2622013 – 235
AAT Licensed Accountants are members who run their own practice.
The practice fee income of AAT Licensed Accountants who are purely self-employed and work full-time has decreased by 4%. 34% of AAT Licensed Accountants have their own practice but are also still employed. 58% of these spend less than a quarter of their working time on their practice work.
For AAT Licensed Accountants, as is always the case, the greater number of clients, the higher the fee income for individual AAT Licensed Accountants.
Average annual income of AAT Licensed Accountants who are purely self-employed
Average full-time salary, bonus and fee income for AAT Licensed Accountants who also have an employed role
AAT Licensed Accountant fee income by practice size
Average annual income of AAT Licensed Accountants—
£54,000
£49,500
£47,750
£42,000
2021
2019
2017
2015
2013
£52,000
£1,200£8,000£30,000
Bonus Fee incomeSalary
>100 clients £100,000
51–100 clients £46,549
25–50 clients £36,433
1–25 clients £30,000
AAT Salary Survey 2021
22Find out more at aat.org.uk/salary

Job satisfaction of AAT Licensed Accountants—
Job satisfaction levels for AAT Licensed Accountants who are purely self-employed show the highest levels amongst all members.AAT Licensed Accountants who are both employed and self-employed show greater dissatisfaction with their employed work than their practice work (12% difference), but their satisfaction level is very similar to non-AAT Licensed Accountants.
Job satisfaction of AAT Licensed Accountants
41% of AAT Licensed Accountants have taken on more clients since March 2020 versus 17% who lost clients.
Base2021 – 8402019 – 5492017 – 3582015 – 4942013 – 468
2013 85%
94%
68%
2015 88%
95%
80%
2017 88%
93%
80%
2019 89%
92%
75%
Employed work (bothemployed and self-employed)
Practice work (both employed and self-employed)
Practice work only(purely self-employed)
2021 85%
90%
73%
AAT Salary Survey 2021
23Find out more at aat.org.uk/salary

Job security of AAT Licensed Accountants—
91% of AAT Licensed Accountants who are purely self-employed said they feel secure in their current job. Perception of job security is similar to 2019, except for AAT Licensed Accountants who are also employed – 77% feel secure in their employed work compared to 84% two years ago.
Job security of AAT Licensed Accountants in 2021
Job security of AAT Licensed Accountants in 2019
AAT Licensed Accountants who are both employed and self-employed feel more secure in their self-employed work (81%) than in their employed work (77%).
Base2021 – 8402019 – 5412011 – 328
84%82%92%
77%81%91%
Employed work (bothemployed and self-employed)
Practice work (both employed and self-employed)
Practice work only(purely self-employed)
AAT Salary Survey 2021
24Find out more at aat.org.uk/salary

EVEN THOUGH MALES WHO RUN THEIR OWN FULL-TIME PRACTICE MAKE 91% MORE THAN FEMALES AND ARE MORE LIKELY TO HAVE MORE THAN 100 CLIENTS (64% VS 36%), FEMALES ARE MORE SATISFIED THAN MALES (91% VS 88%).
25Find out more at aat.org.uk/salary
AAT Salary Survey 2021

26Find out more at aat.org.uk/salary
2021 RESULTSEFFECTS OF COVID-19
AAT Salary Survey 2021

Members whose working hours and/or salary have been affected during the pandemic are 9% less satisfied that those who’s have not, 69% versus 78%.
How members have been affected by Covid-19 —
As with nearly every industry, the pandemic has had a significant effect on all our members, across all aspects of their life. In order to measure this impact, we included a number of new questions relating to the effects that Covid-19 has had on their work lives.
Have your working hours and/or salary been affected at any point during the pandemic?
How have you been affected?
Base13,169
Effects of Covid-19 on AAT members
Cut to working hours Other FurloughedPay cut
17% 61% 21% 20%
24%
76%
NoYes
AAT Salary Survey 2021
27Find out more at aat.org.uk/salary

24% of AAT Licensed Accountants have reported an increase in client spend since March 2020, versus 11% who reported a decrease. Base
840
How have your working hours been affected by the pandemic?
How is your current work/life balance compared to before the pandemic?
Effects of Covid-19 on AAT Licensed Accountants
In comparison with 2019, AAT Licensed Accountants are the audience most affected by the pandemic with fee income and satisfaction levels both down.
How AAT Licensed Accountants have been affected by Covid-19 —
Worse Undecided The sameBetter
25% 31% 42% 2%
Work less hours Undecided Hours have stayed the sameWork more hours
40% 42% 16% 2%
AAT Salary Survey 2021
28Find out more at aat.org.uk/salary
29Find out more at aat.org.uk/salary
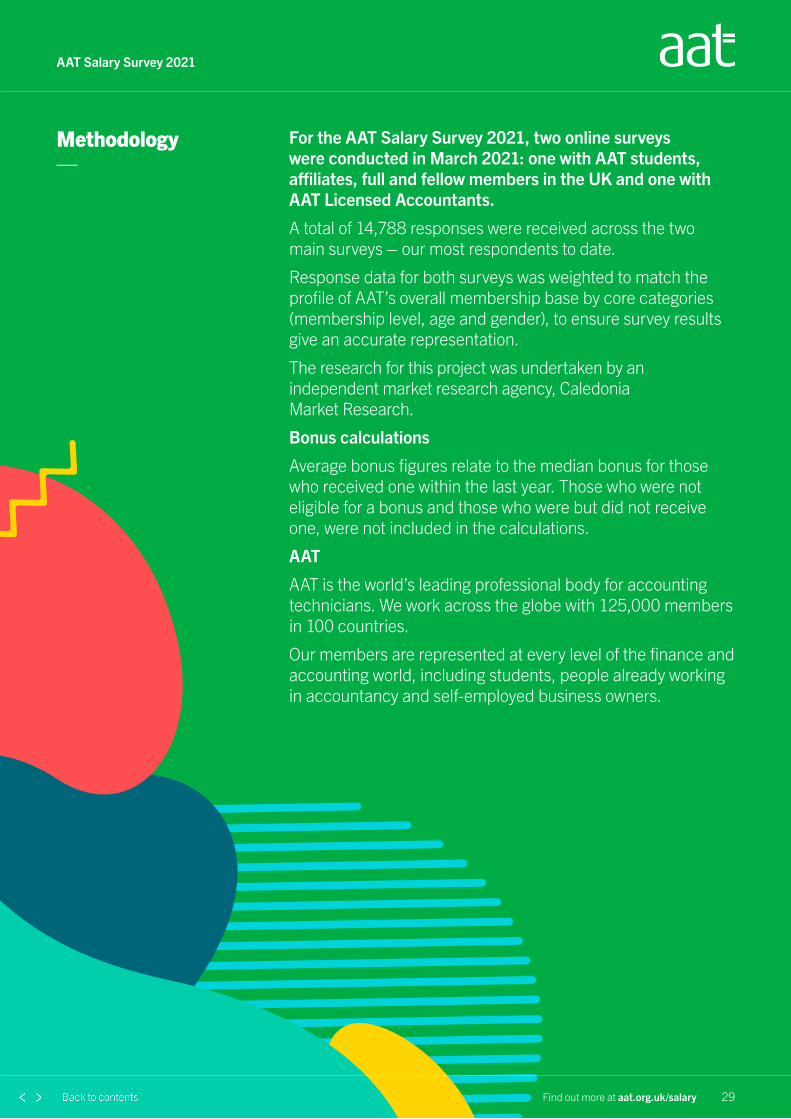
For the AAT Salary Survey 2021, two online surveys were conducted in March 2021: one with AAT students, affiliates, full and fellow members in the UK and one with AAT Licensed Accountants.
A total of 14,788 responses were received across the two main surveys – our most respondents to date.
Response data for both surveys was weighted to match the profile of AAT’s overall membership base by core categories (membership level, age and gender), to ensure survey results give an accurate representation.
The research for this project was undertaken by an independent market research agency, Caledonia Market Research.
Bonus calculations
Average bonus figures relate to the median bonus for those who received one within the last year. Those who were not eligible for a bonus and those who were but did not receive one, were not included in the calculations.
AAT
AAT is the world’s leading professional body for accounting technicians. We work across the globe with 125,000 members in 100 countries.
Our members are represented at every level of the finance and accounting world, including students, people already working in accountancy and self-employed business owners.
Methodology—
AAT Salary Survey 2021

Find out more at aat.org.uk/salary
If you’d like to know more about AAT and our qualifications, please get in touch with us.Call us on +44 (0)20 3735 2434.
Lines are open Monday to Friday from 09.00 to 17.00 (UK time).
Visit aat.org.uk
Any questions?—
Association of Accounting Technicians 140 Aldersgate Street London EC1A 4HY
Registered charity no. 1050724
/YourAAT
@StudyAAT
forums.aat.org.uk
/AAT
/yourbigfutureAAT
BC
8890
721
– P
DF