Embed Size (px)
Citation preview
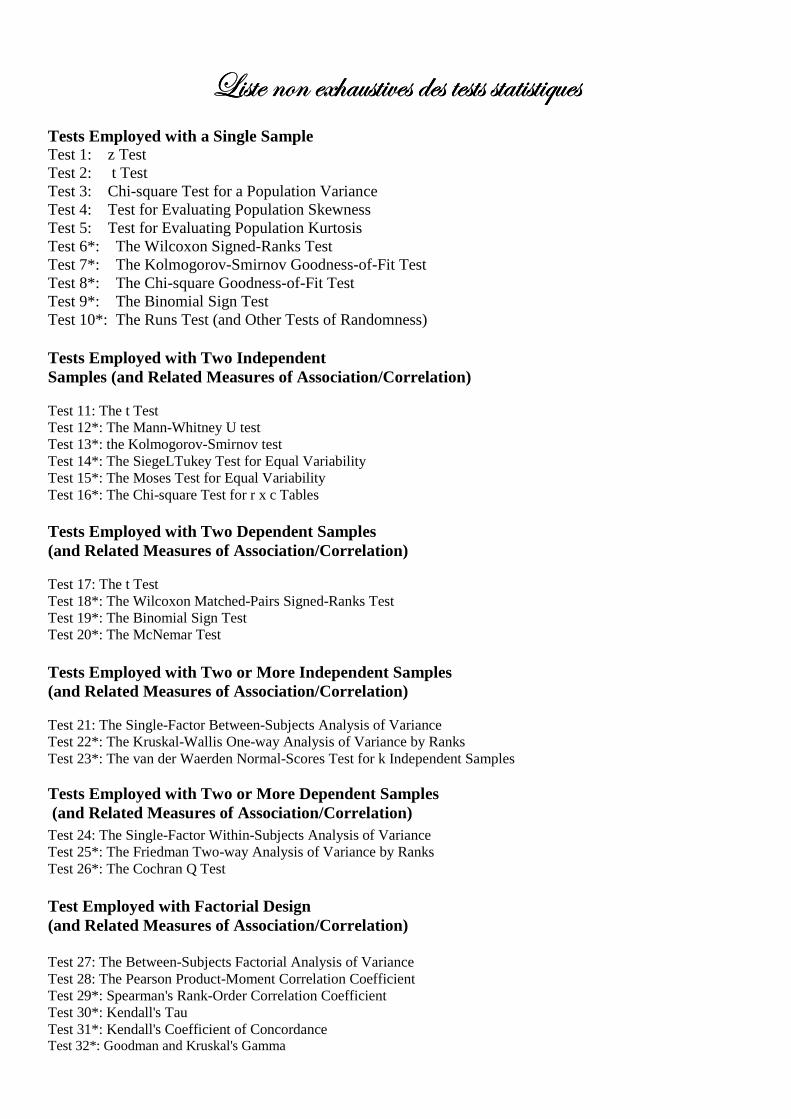
_|áàx ÇÉÇ xå{tâáà|äxá wxá àxáàá áàtà|áà|Öâxá_|áàx ÇÉÇ xå{tâáà|äxá wxá àxáàá áàtà|áà|Öâxá_|áàx ÇÉÇ xå{tâáà|äxá wxá àxáàá áàtà|áà|Öâxá_|áàx ÇÉÇ xå{tâáà|äxá wxá àxáàá áàtà|áà|Öâxá Tests Employed with a Single Sample Test 1: z Test Test 2: t Test Test 3: Chi-square Test for a Population Variance Test 4: Test for Evaluating Population Skewness Test 5: Test for Evaluating Population Kurtosis Test 6*: The Wilcoxon Signed-Ranks Test Test 7*: The Kolmogorov-Smirnov Goodness-of-Fit Test Test 8*: The Chi-square Goodness-of-Fit Test Test 9*: The Binomial Sign Test Test 10*: The Runs Test (and Other Tests of Randomness) Tests Employed with Two Independent Samples (and Related Measures of Association/Correlation) Test 11: The t Test Test 12*: The Mann-Whitney U test Test 13*: the Kolmogorov-Smirnov test Test 14*: The SiegeLTukey Test for Equal Variability Test 15*: The Moses Test for Equal Variability Test 16*: The Chi-square Test for r x c Tables Tests Employed with Two Dependent Samples (and Related Measures of Association/Correlation) Test 17: The t Test Test 18*: The Wilcoxon Matched-Pairs Signed-Ranks Test Test 19*: The Binomial Sign Test Test 20*: The McNemar Test Tests Employed with Two or More Independent Samples (and Related Measures of Association/Correlation) Test 21: The Single-Factor Between-Subjects Analysis of Variance Test 22*: The Kruskal-Wallis One-way Analysis of Variance by Ranks Test 23*: The van der Waerden Normal-Scores Test for k Independent Samples Tests Employed with Two or More Dependent Samples (and Related Measures of Association/Correlation)
Test 24: The Single-Factor Within-Subjects Analysis of Variance Test 25*: The Friedman Two-way Analysis of Variance by Ranks Test 26*: The Cochran Q Test Test Employed with Factorial Design (and Related Measures of Association/Correlation) Test 27: The Between-Subjects Factorial Analysis of Variance Test 28: The Pearson Product-Moment Correlation Coefficient Test 29*: Spearman's Rank-Order Correlation Coefficient Test 30*: Kendall's Tau Test 31*: Kendall's Coefficient of Concordance Test 32*: Goodman and Kruskal's Gamma
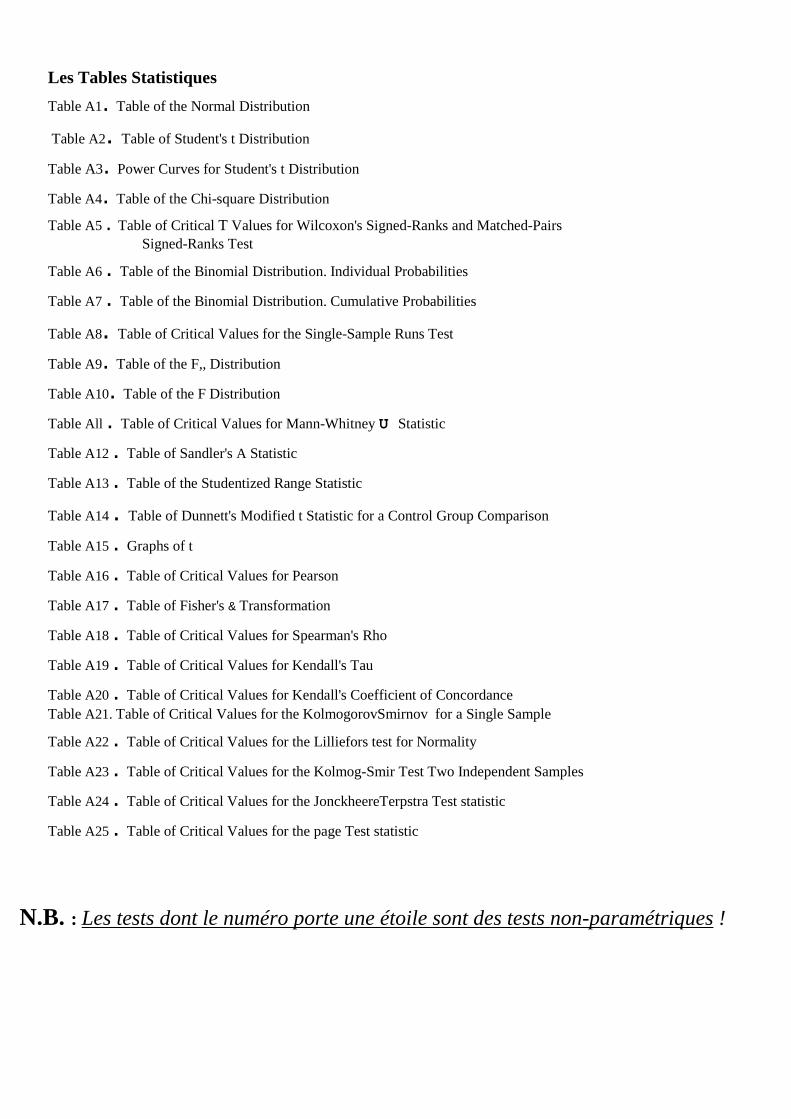
Les Tables Statistiques
Table A1. Table of the Normal Distribution
Table A2. Table of Student's t Distribution
Table A3. Power Curves for Student's t Distribution
Table A4. Table of the Chi-square Distribution
Table A5 . Table of Critical T Values for Wilcoxon's Signed-Ranks and Matched-Pairs Signed-Ranks Test
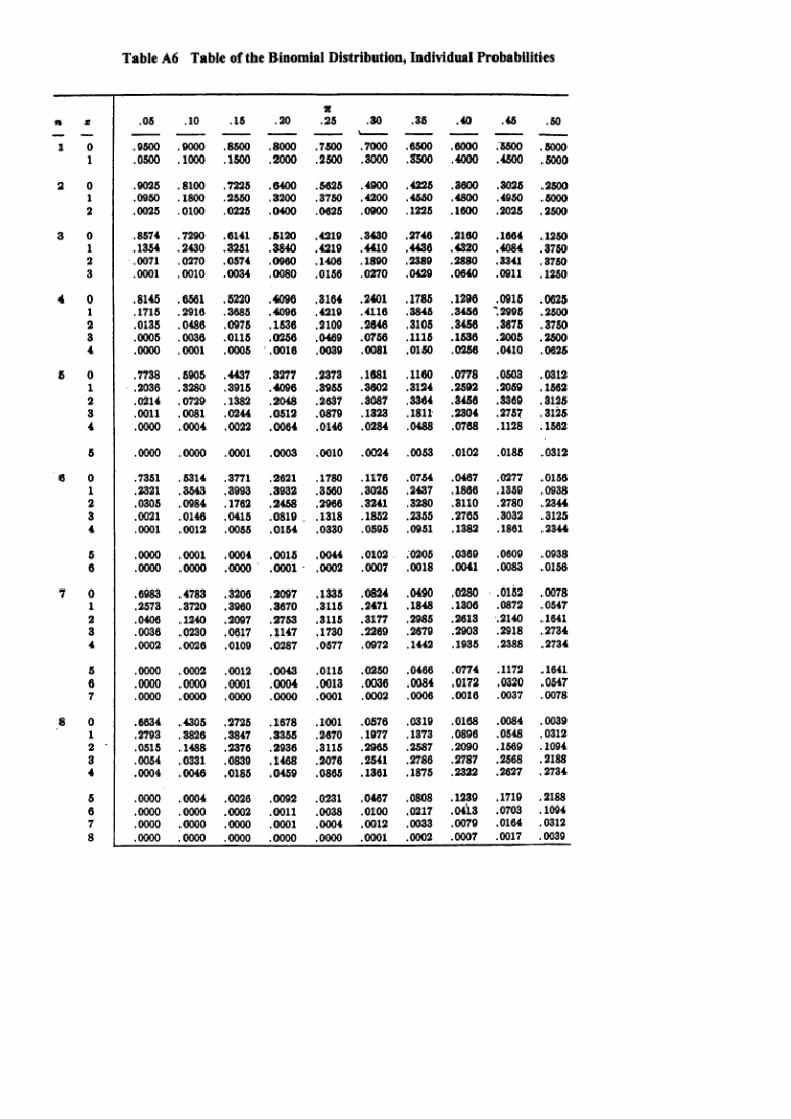
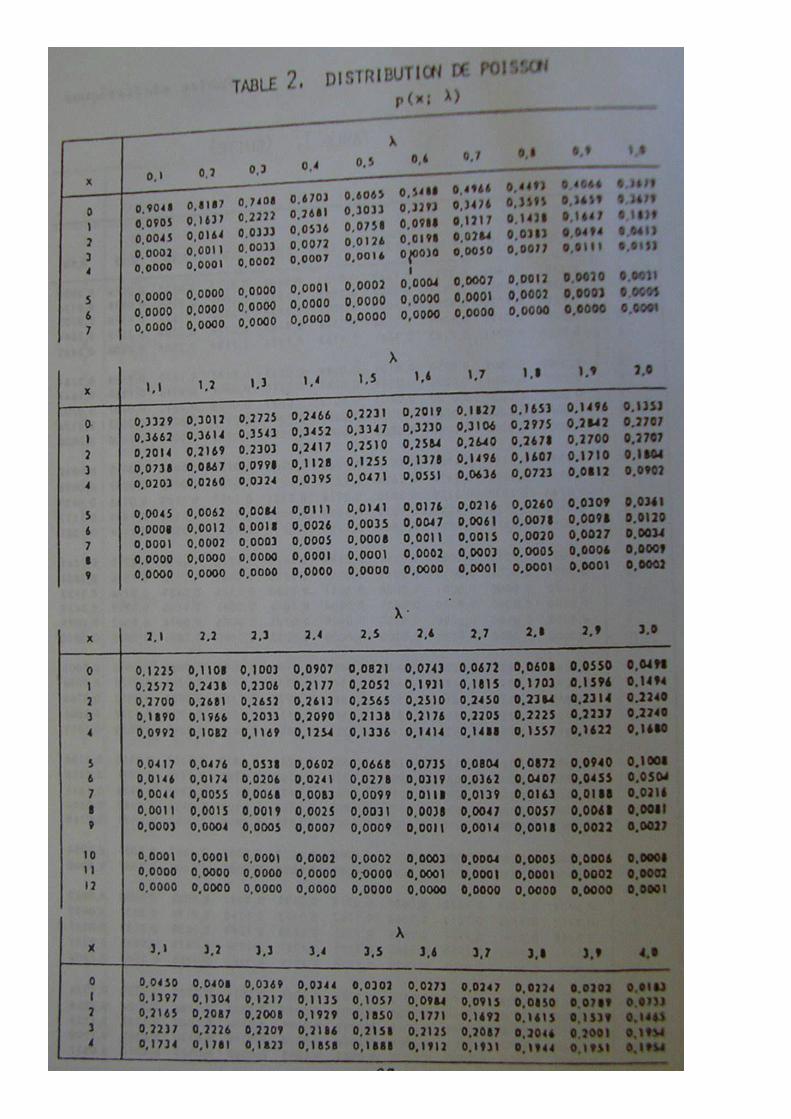
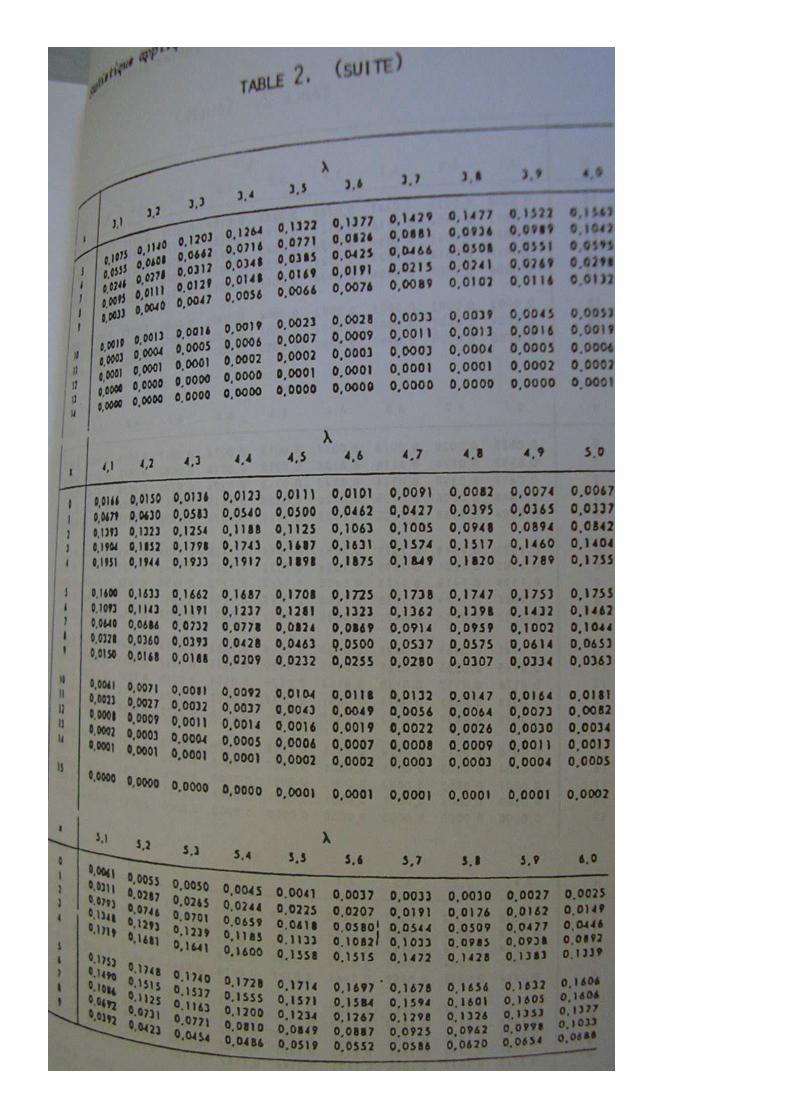
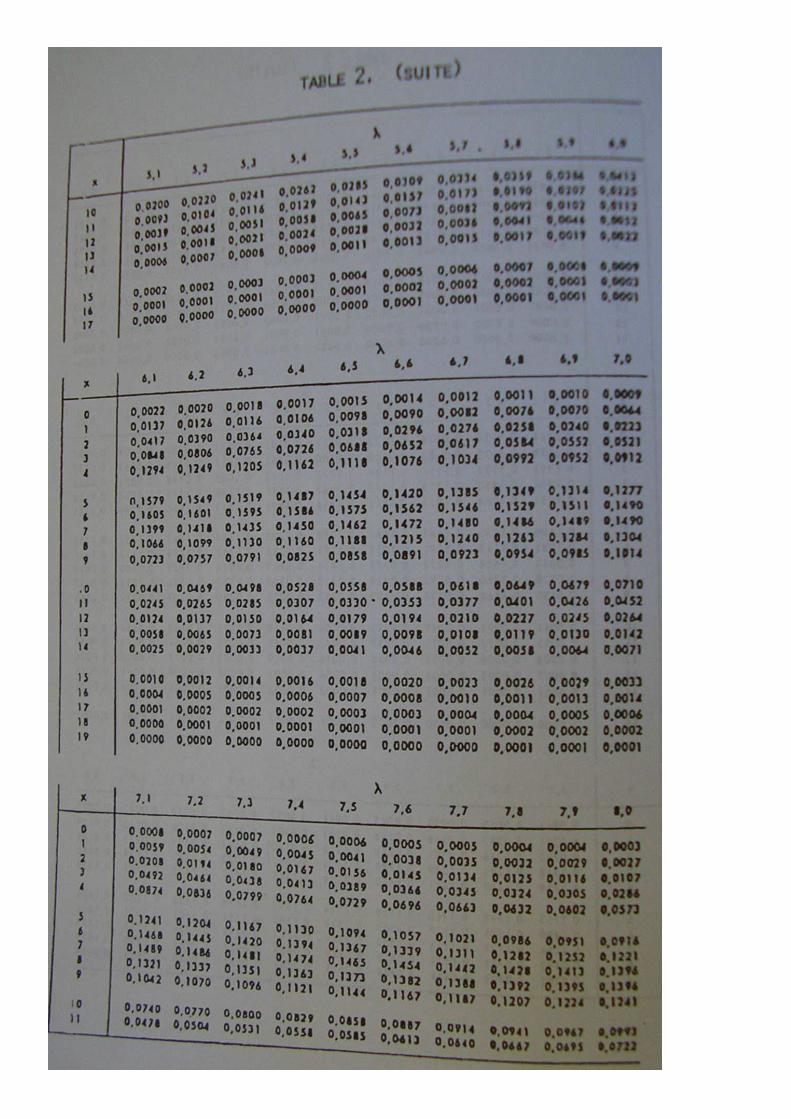
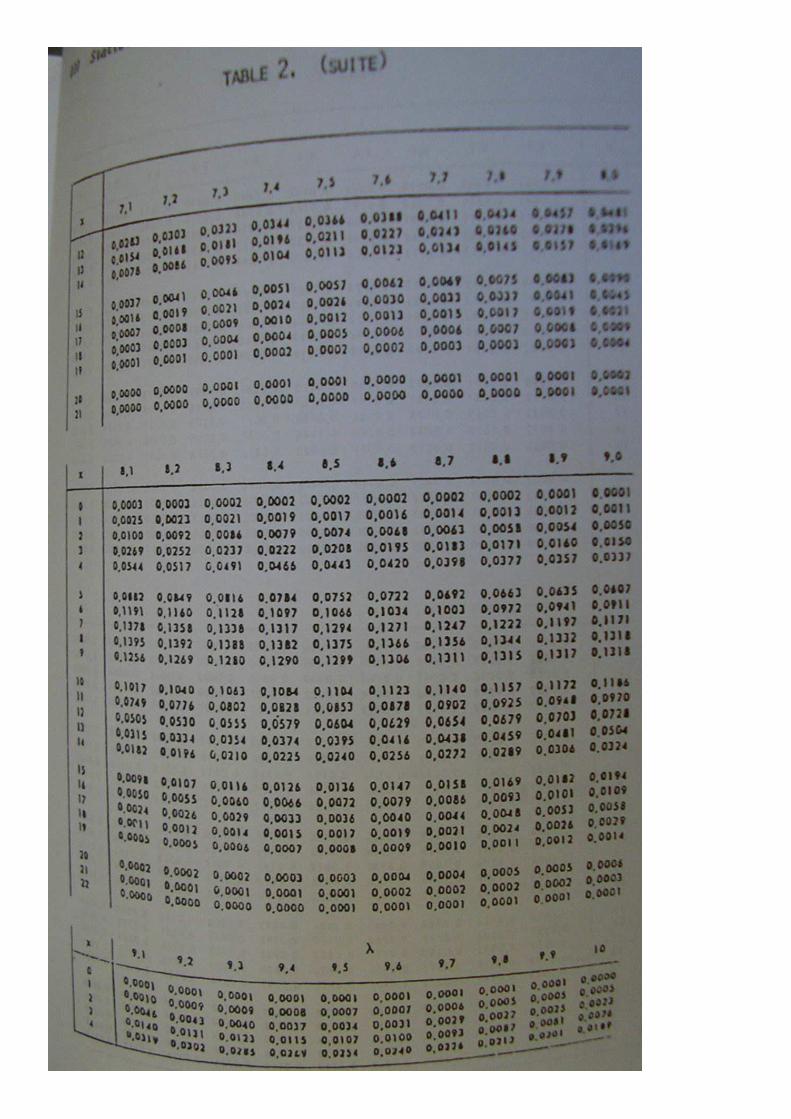
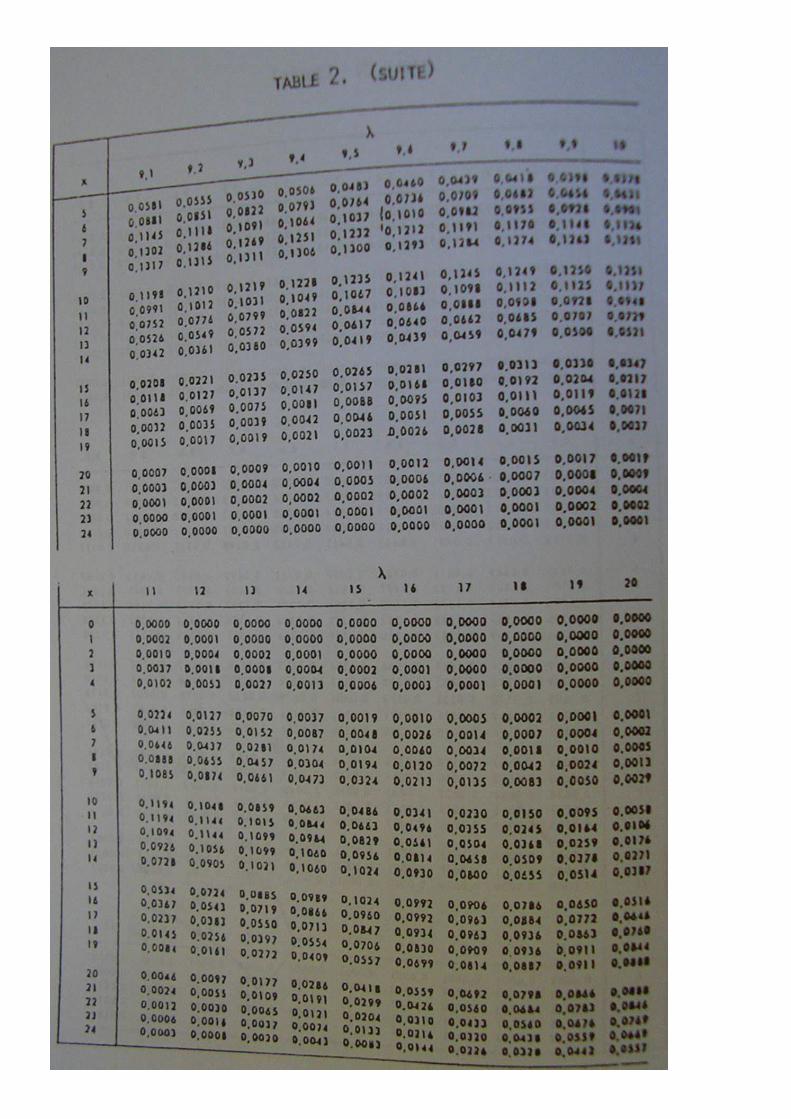
Table A6 . Table of the Binomial Distribution. Individual Probabilities
Table A7 . Table of the Binomial Distribution. Cumulative Probabilities
Table A8. Table of Critical Values for the Single-Sample Runs Test
Table A9. Table of the F,, Distribution
Table A10. Table of the F Distribution
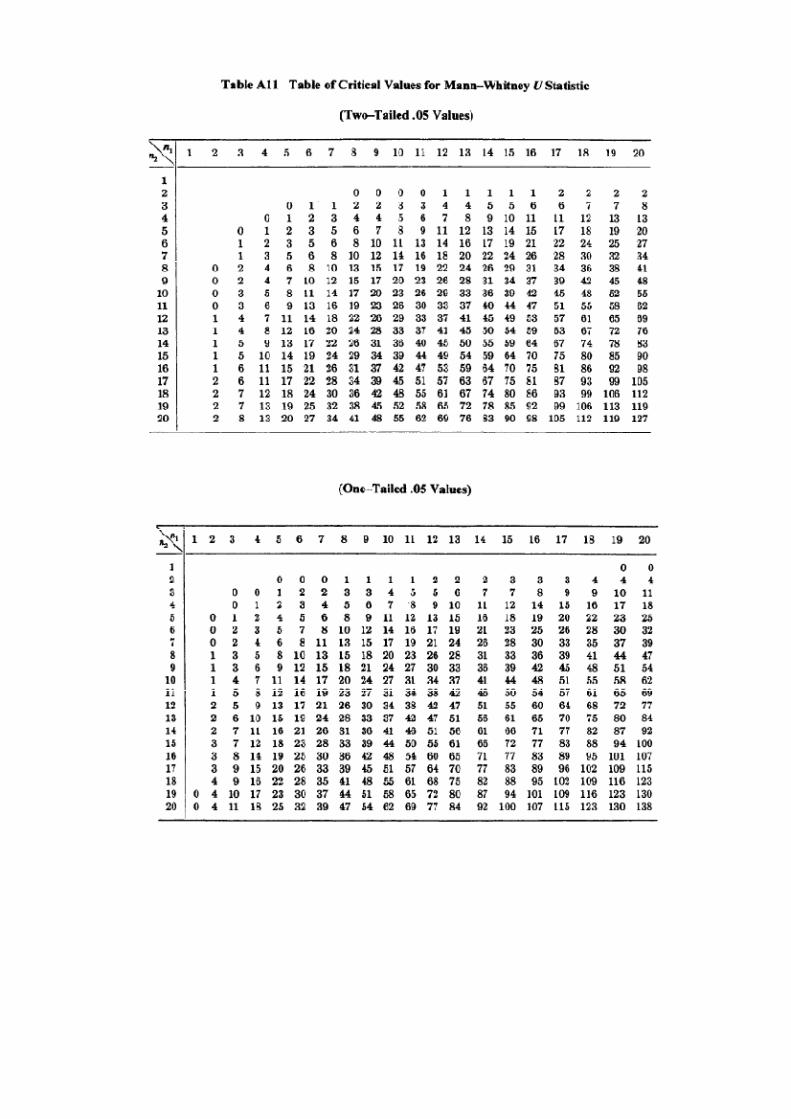
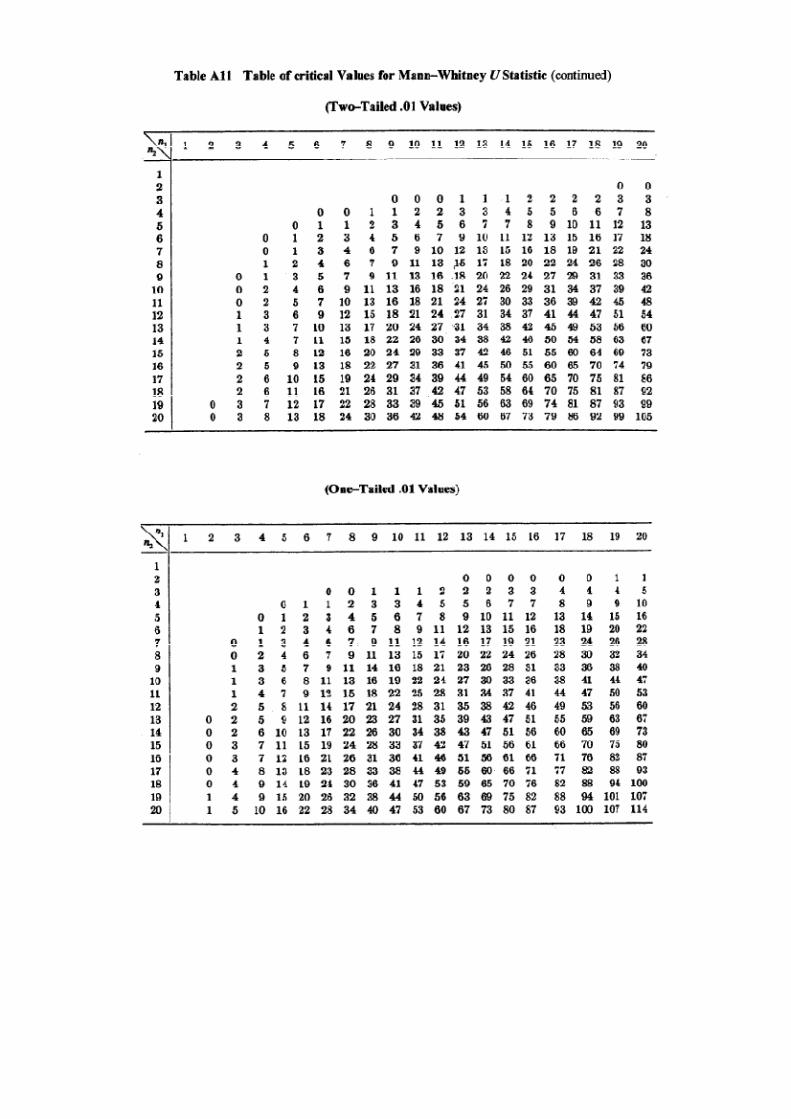
Table All . Table of Critical Values for Mann-Whitney U Statistic
Table A12 . Table of Sandler's A Statistic
Table A13 . Table of the Studentized Range Statistic
Table A14 . Table of Dunnett's Modified t Statistic for a Control Group Comparison
Table A15 . Graphs of t
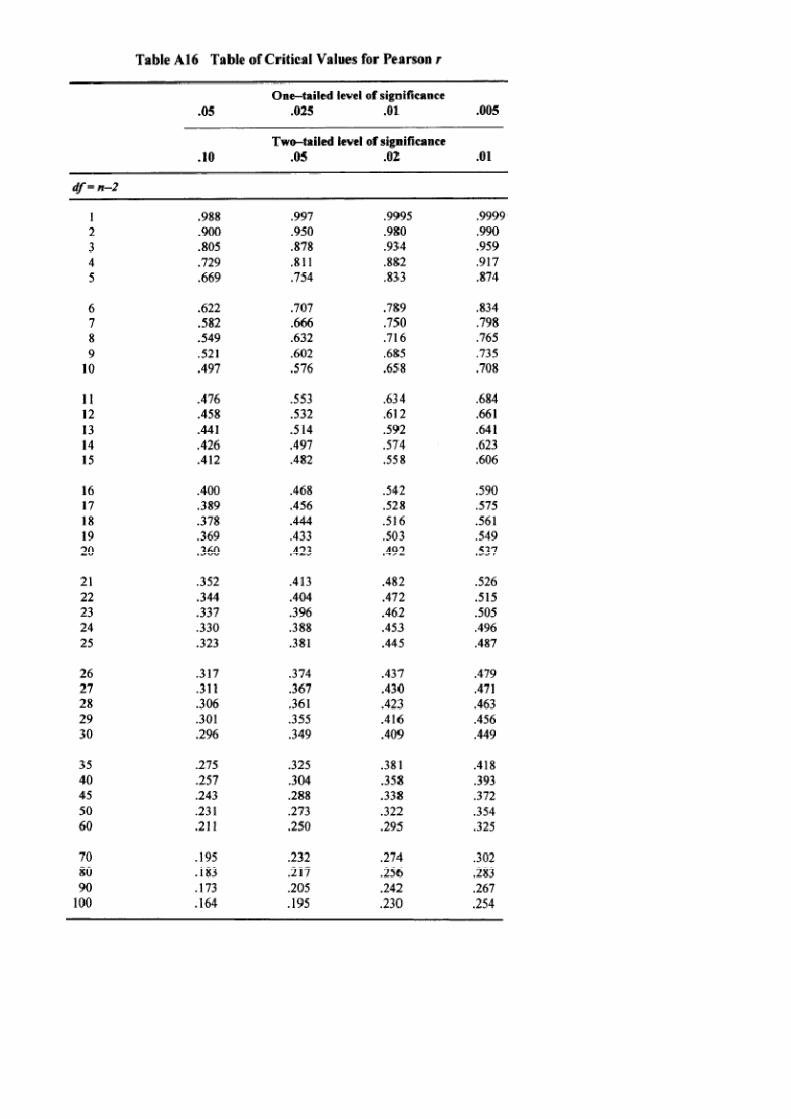
Table A16 . Table of Critical Values for Pearson
Table A17 . Table of Fisher's & Transformation
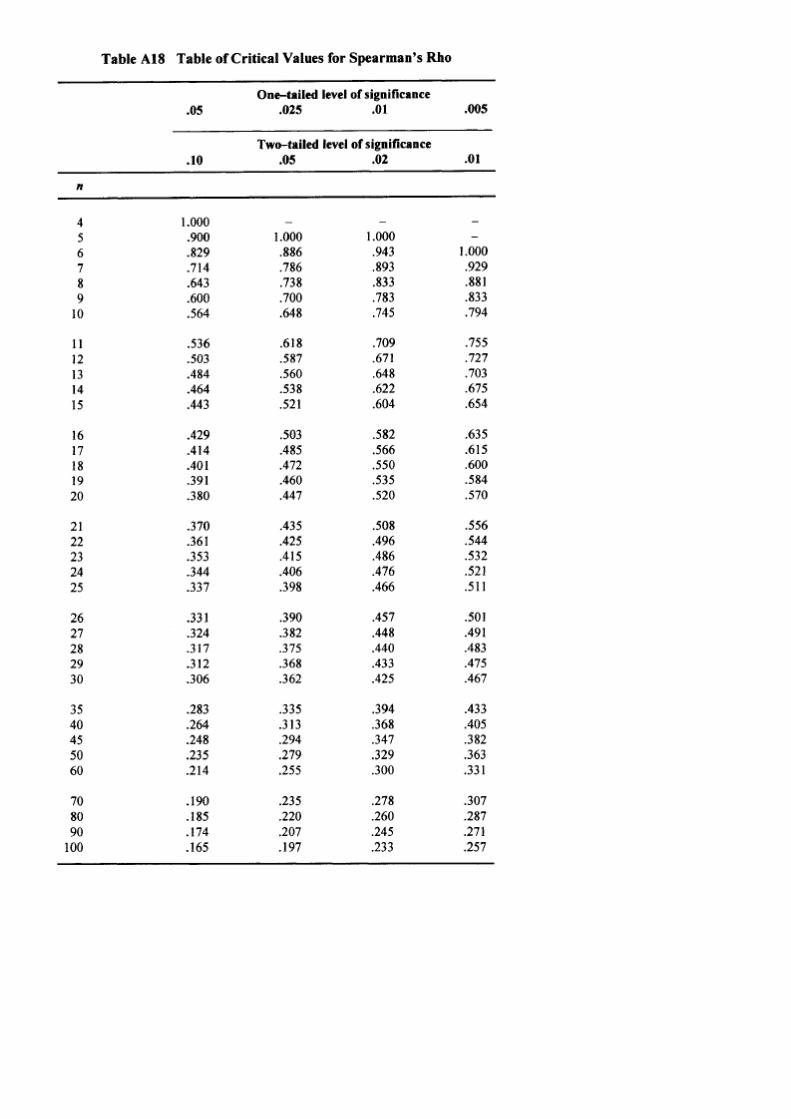
Table A18 . Table of Critical Values for Spearman's Rho
Table A19 . Table of Critical Values for Kendall's Tau
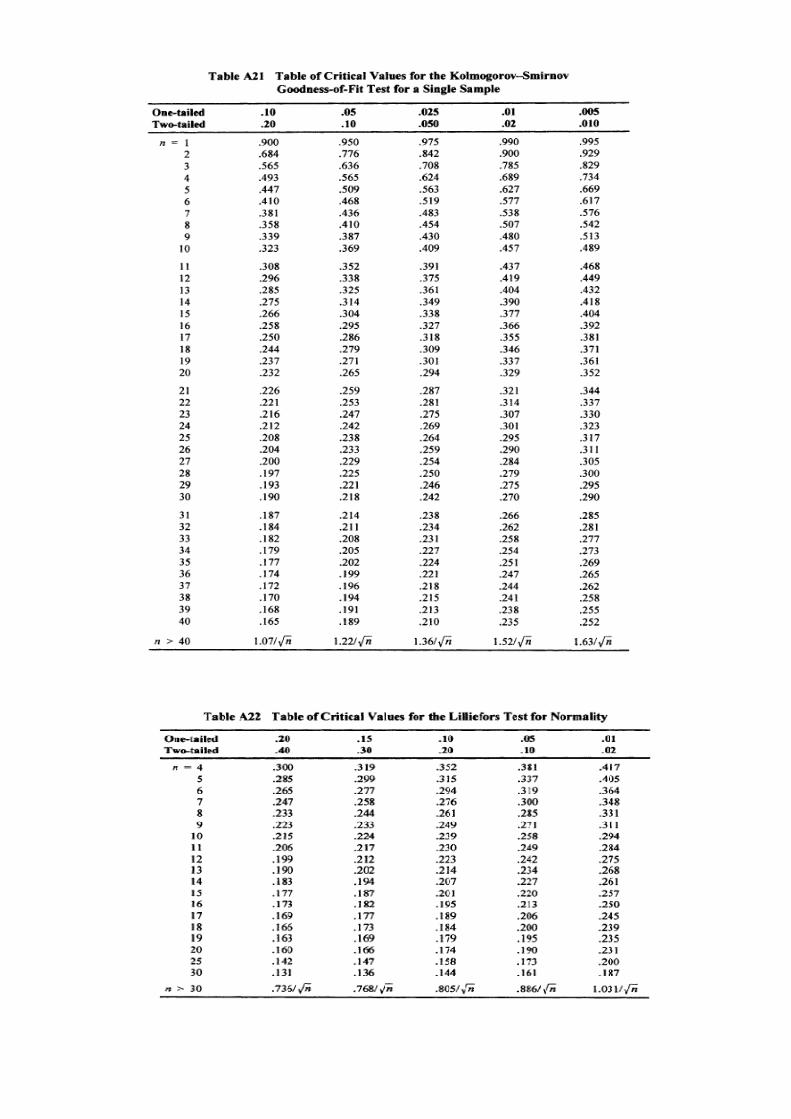
Table A20 . Table of Critical Values for Kendall's Coefficient of Concordance Table A21. Table of Critical Values for the KolmogorovSmirnov for a Single Sample
Table A22 . Table of Critical Values for the Lilliefors test for Normality
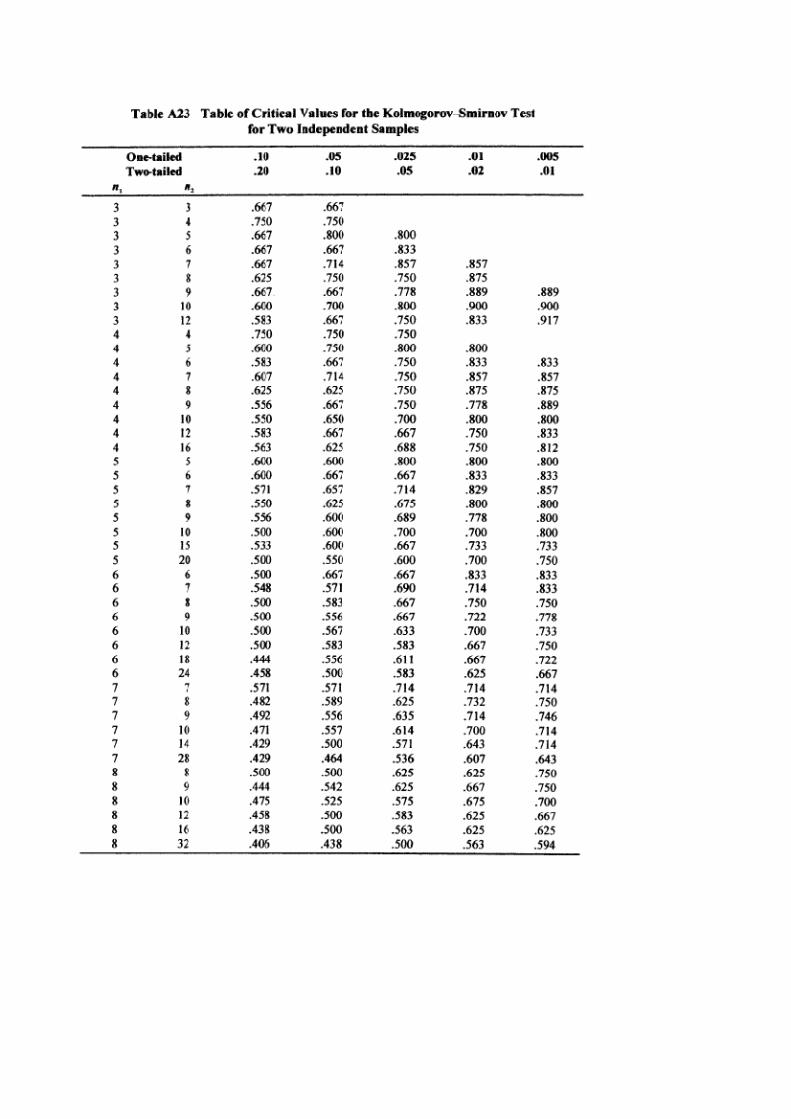
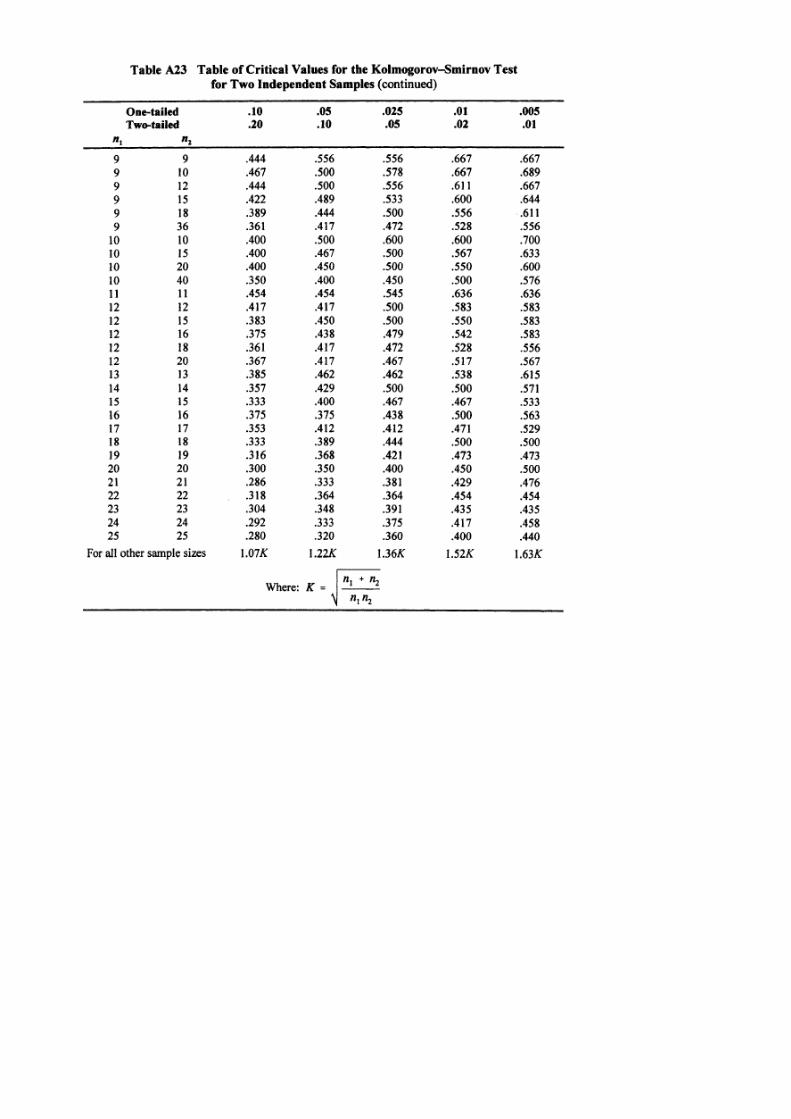
Table A23 . Table of Critical Values for the Kolmog-Smir Test Two Independent Samples
Table A24 . Table of Critical Values for the JonckheereTerpstra Test statistic
Table A25 . Table of Critical Values for the page Test statistic
N.B. : Les tests dont le numéro porte une étoile sont des tests non-paramétriques !
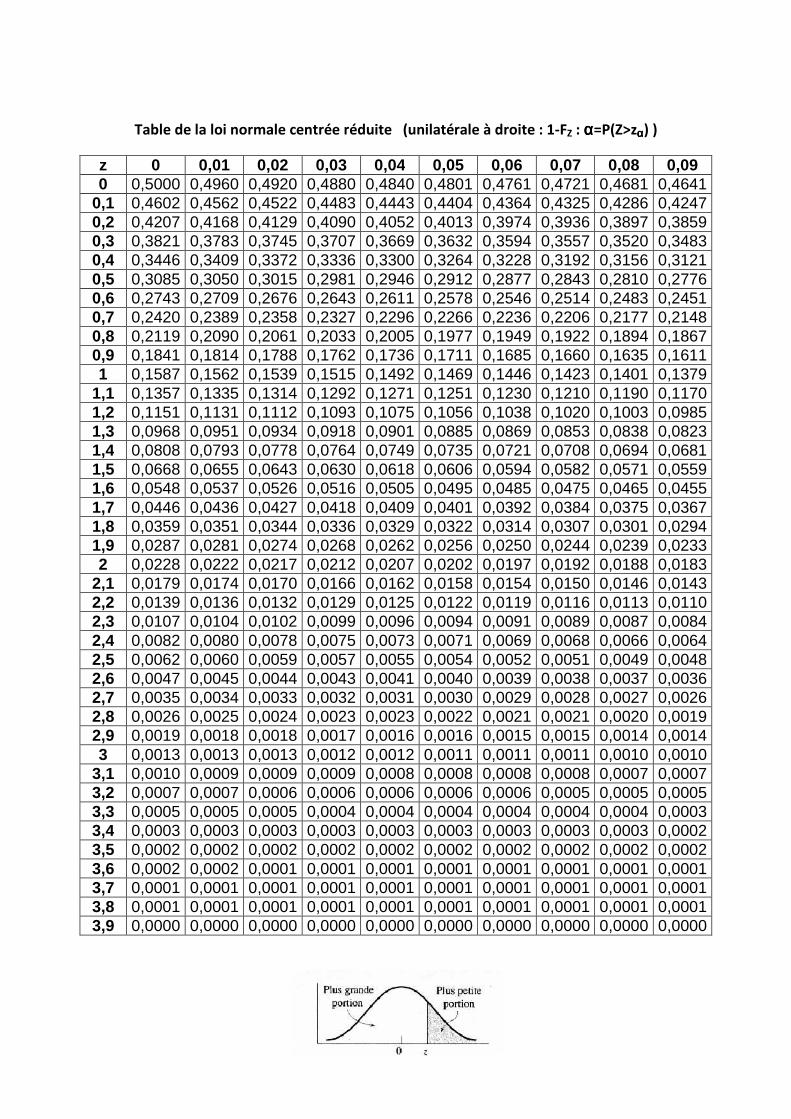
Table de la loi normale centrée réduite (unilatérale à droite : 1-FZ : αααα=P(Z>zαααα) )
z 0 0,01 0,02 0,03 0,04 0,05 0,06 0,07 0,08 0,09 0 0,5000 0,4960 0,4920 0,4880 0,4840 0,4801 0,4761 0,4721 0,4681 0,4641
0,1 0,4602 0,4562 0,4522 0,4483 0,4443 0,4404 0,4364 0,4325 0,4286 0,4247 0,2 0,4207 0,4168 0,4129 0,4090 0,4052 0,4013 0,3974 0,3936 0,3897 0,3859 0,3 0,3821 0,3783 0,3745 0,3707 0,3669 0,3632 0,3594 0,3557 0,3520 0,3483 0,4 0,3446 0,3409 0,3372 0,3336 0,3300 0,3264 0,3228 0,3192 0,3156 0,3121 0,5 0,3085 0,3050 0,3015 0,2981 0,2946 0,2912 0,2877 0,2843 0,2810 0,2776 0,6 0,2743 0,2709 0,2676 0,2643 0,2611 0,2578 0,2546 0,2514 0,2483 0,2451 0,7 0,2420 0,2389 0,2358 0,2327 0,2296 0,2266 0,2236 0,2206 0,2177 0,2148 0,8 0,2119 0,2090 0,2061 0,2033 0,2005 0,1977 0,1949 0,1922 0,1894 0,1867 0,9 0,1841 0,1814 0,1788 0,1762 0,1736 0,1711 0,1685 0,1660 0,1635 0,1611 1 0,1587 0,1562 0,1539 0,1515 0,1492 0,1469 0,1446 0,1423 0,1401 0,1379
1,1 0,1357 0,1335 0,1314 0,1292 0,1271 0,1251 0,1230 0,1210 0,1190 0,1170 1,2 0,1151 0,1131 0,1112 0,1093 0,1075 0,1056 0,1038 0,1020 0,1003 0,0985 1,3 0,0968 0,0951 0,0934 0,0918 0,0901 0,0885 0,0869 0,0853 0,0838 0,0823 1,4 0,0808 0,0793 0,0778 0,0764 0,0749 0,0735 0,0721 0,0708 0,0694 0,0681 1,5 0,0668 0,0655 0,0643 0,0630 0,0618 0,0606 0,0594 0,0582 0,0571 0,0559 1,6 0,0548 0,0537 0,0526 0,0516 0,0505 0,0495 0,0485 0,0475 0,0465 0,0455 1,7 0,0446 0,0436 0,0427 0,0418 0,0409 0,0401 0,0392 0,0384 0,0375 0,0367 1,8 0,0359 0,0351 0,0344 0,0336 0,0329 0,0322 0,0314 0,0307 0,0301 0,0294 1,9 0,0287 0,0281 0,0274 0,0268 0,0262 0,0256 0,0250 0,0244 0,0239 0,0233 2 0,0228 0,0222 0,0217 0,0212 0,0207 0,0202 0,0197 0,0192 0,0188 0,0183
2,1 0,0179 0,0174 0,0170 0,0166 0,0162 0,0158 0,0154 0,0150 0,0146 0,0143 2,2 0,0139 0,0136 0,0132 0,0129 0,0125 0,0122 0,0119 0,0116 0,0113 0,0110 2,3 0,0107 0,0104 0,0102 0,0099 0,0096 0,0094 0,0091 0,0089 0,0087 0,0084 2,4 0,0082 0,0080 0,0078 0,0075 0,0073 0,0071 0,0069 0,0068 0,0066 0,0064 2,5 0,0062 0,0060 0,0059 0,0057 0,0055 0,0054 0,0052 0,0051 0,0049 0,0048 2,6 0,0047 0,0045 0,0044 0,0043 0,0041 0,0040 0,0039 0,0038 0,0037 0,0036 2,7 0,0035 0,0034 0,0033 0,0032 0,0031 0,0030 0,0029 0,0028 0,0027 0,0026 2,8 0,0026 0,0025 0,0024 0,0023 0,0023 0,0022 0,0021 0,0021 0,0020 0,0019 2,9 0,0019 0,0018 0,0018 0,0017 0,0016 0,0016 0,0015 0,0015 0,0014 0,0014 3 0,0013 0,0013 0,0013 0,0012 0,0012 0,0011 0,0011 0,0011 0,0010 0,0010
3,1 0,0010 0,0009 0,0009 0,0009 0,0008 0,0008 0,0008 0,0008 0,0007 0,0007 3,2 0,0007 0,0007 0,0006 0,0006 0,0006 0,0006 0,0006 0,0005 0,0005 0,0005 3,3 0,0005 0,0005 0,0005 0,0004 0,0004 0,0004 0,0004 0,0004 0,0004 0,0003 3,4 0,0003 0,0003 0,0003 0,0003 0,0003 0,0003 0,0003 0,0003 0,0003 0,0002 3,5 0,0002 0,0002 0,0002 0,0002 0,0002 0,0002 0,0002 0,0002 0,0002 0,0002 3,6 0,0002 0,0002 0,0001 0,0001 0,0001 0,0001 0,0001 0,0001 0,0001 0,0001 3,7 0,0001 0,0001 0,0001 0,0001 0,0001 0,0001 0,0001 0,0001 0,0001 0,0001 3,8 0,0001 0,0001 0,0001 0,0001 0,0001 0,0001 0,0001 0,0001 0,0001 0,0001 3,9 0,0000 0,0000 0,0000 0,0000 0,0000 0,0000 0,0000 0,0000 0,0000 0,0000
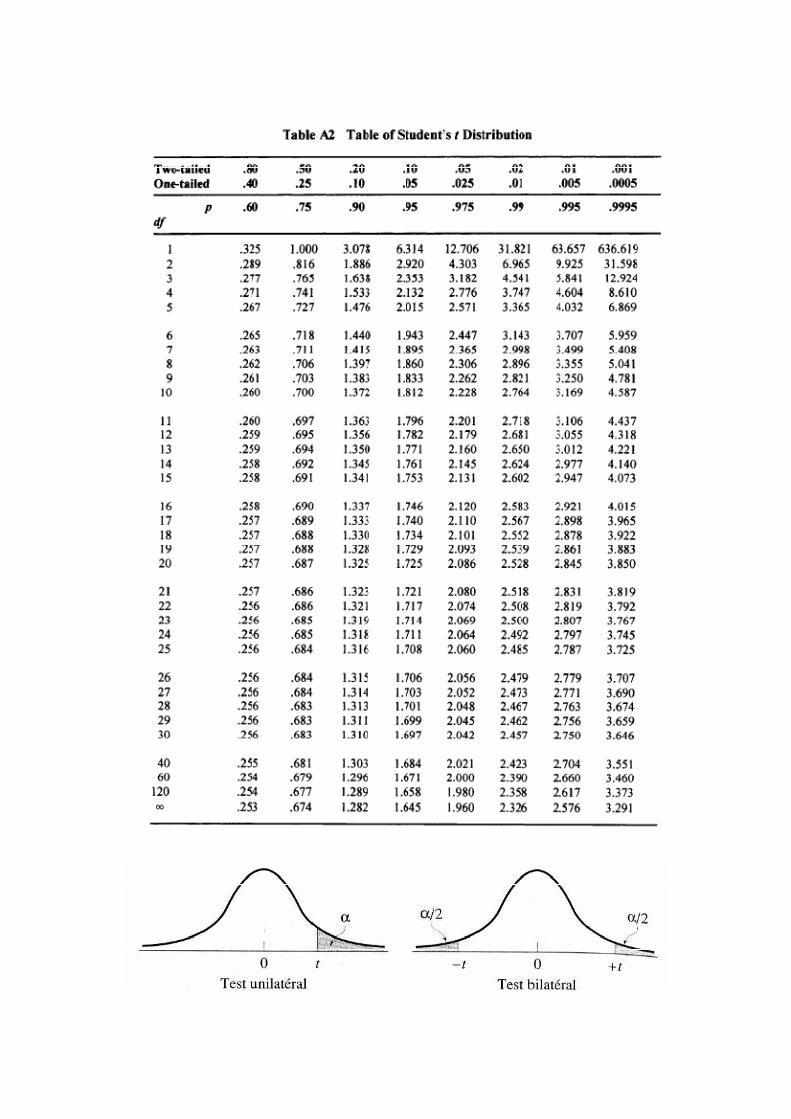
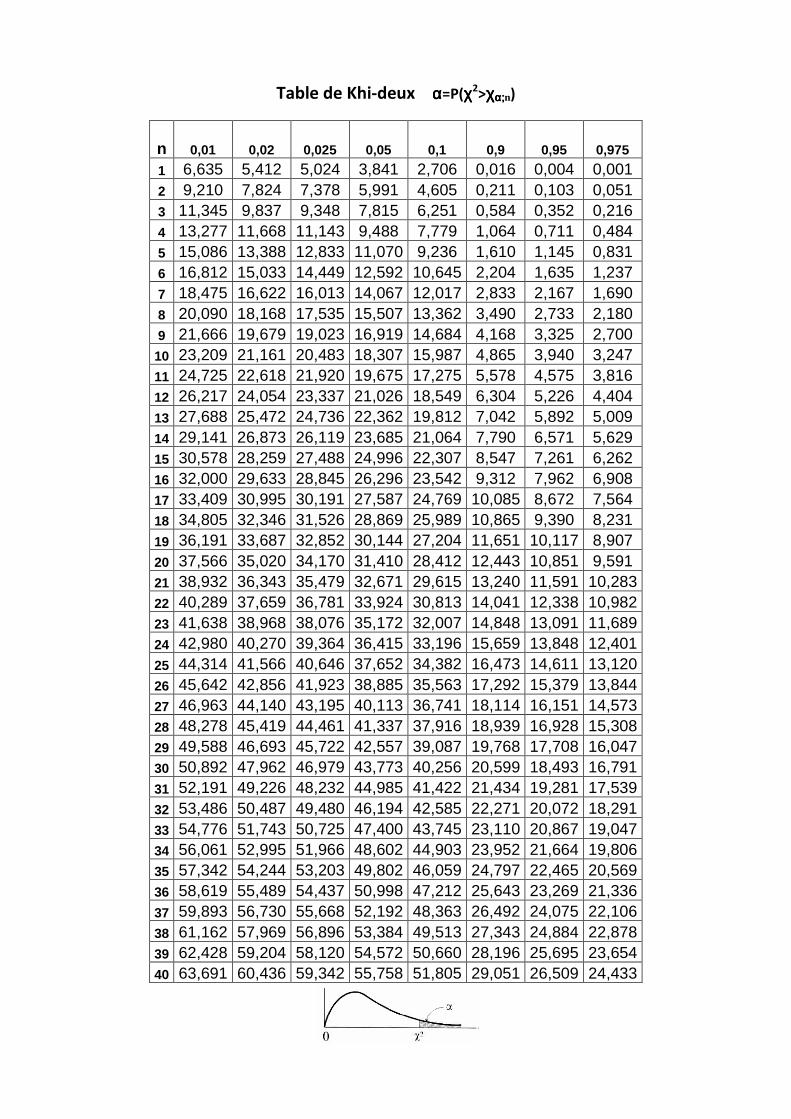
Table de Khi-deux αααα=P(χχχχ2>χχχχαααα;;;;n)
n 0,01 0,02 0,025 0,05 0,1 0,9 0,95 0,975
1 6,635 5,412 5,024 3,841 2,706 0,016 0,004 0,001 2 9,210 7,824 7,378 5,991 4,605 0,211 0,103 0,051 3 11,345 9,837 9,348 7,815 6,251 0,584 0,352 0,216 4 13,277 11,668 11,143 9,488 7,779 1,064 0,711 0,484 5 15,086 13,388 12,833 11,070 9,236 1,610 1,145 0,831 6 16,812 15,033 14,449 12,592 10,645 2,204 1,635 1,237 7 18,475 16,622 16,013 14,067 12,017 2,833 2,167 1,690 8 20,090 18,168 17,535 15,507 13,362 3,490 2,733 2,180 9 21,666 19,679 19,023 16,919 14,684 4,168 3,325 2,700 10 23,209 21,161 20,483 18,307 15,987 4,865 3,940 3,247 11 24,725 22,618 21,920 19,675 17,275 5,578 4,575 3,816 12 26,217 24,054 23,337 21,026 18,549 6,304 5,226 4,404 13 27,688 25,472 24,736 22,362 19,812 7,042 5,892 5,009 14 29,141 26,873 26,119 23,685 21,064 7,790 6,571 5,629 15 30,578 28,259 27,488 24,996 22,307 8,547 7,261 6,262 16 32,000 29,633 28,845 26,296 23,542 9,312 7,962 6,908 17 33,409 30,995 30,191 27,587 24,769 10,085 8,672 7,564 18 34,805 32,346 31,526 28,869 25,989 10,865 9,390 8,231 19 36,191 33,687 32,852 30,144 27,204 11,651 10,117 8,907 20 37,566 35,020 34,170 31,410 28,412 12,443 10,851 9,591 21 38,932 36,343 35,479 32,671 29,615 13,240 11,591 10,283 22 40,289 37,659 36,781 33,924 30,813 14,041 12,338 10,982 23 41,638 38,968 38,076 35,172 32,007 14,848 13,091 11,689 24 42,980 40,270 39,364 36,415 33,196 15,659 13,848 12,401 25 44,314 41,566 40,646 37,652 34,382 16,473 14,611 13,120 26 45,642 42,856 41,923 38,885 35,563 17,292 15,379 13,844 27 46,963 44,140 43,195 40,113 36,741 18,114 16,151 14,573 28 48,278 45,419 44,461 41,337 37,916 18,939 16,928 15,308 29 49,588 46,693 45,722 42,557 39,087 19,768 17,708 16,047 30 50,892 47,962 46,979 43,773 40,256 20,599 18,493 16,791 31 52,191 49,226 48,232 44,985 41,422 21,434 19,281 17,539 32 53,486 50,487 49,480 46,194 42,585 22,271 20,072 18,291 33 54,776 51,743 50,725 47,400 43,745 23,110 20,867 19,047 34 56,061 52,995 51,966 48,602 44,903 23,952 21,664 19,806 35 57,342 54,244 53,203 49,802 46,059 24,797 22,465 20,569 36 58,619 55,489 54,437 50,998 47,212 25,643 23,269 21,336 37 59,893 56,730 55,668 52,192 48,363 26,492 24,075 22,106 38 61,162 57,969 56,896 53,384 49,513 27,343 24,884 22,878 39 62,428 59,204 58,120 54,572 50,660 28,196 25,695 23,654 40 63,691 60,436 59,342 55,758 51,805 29,051 26,509 24,433
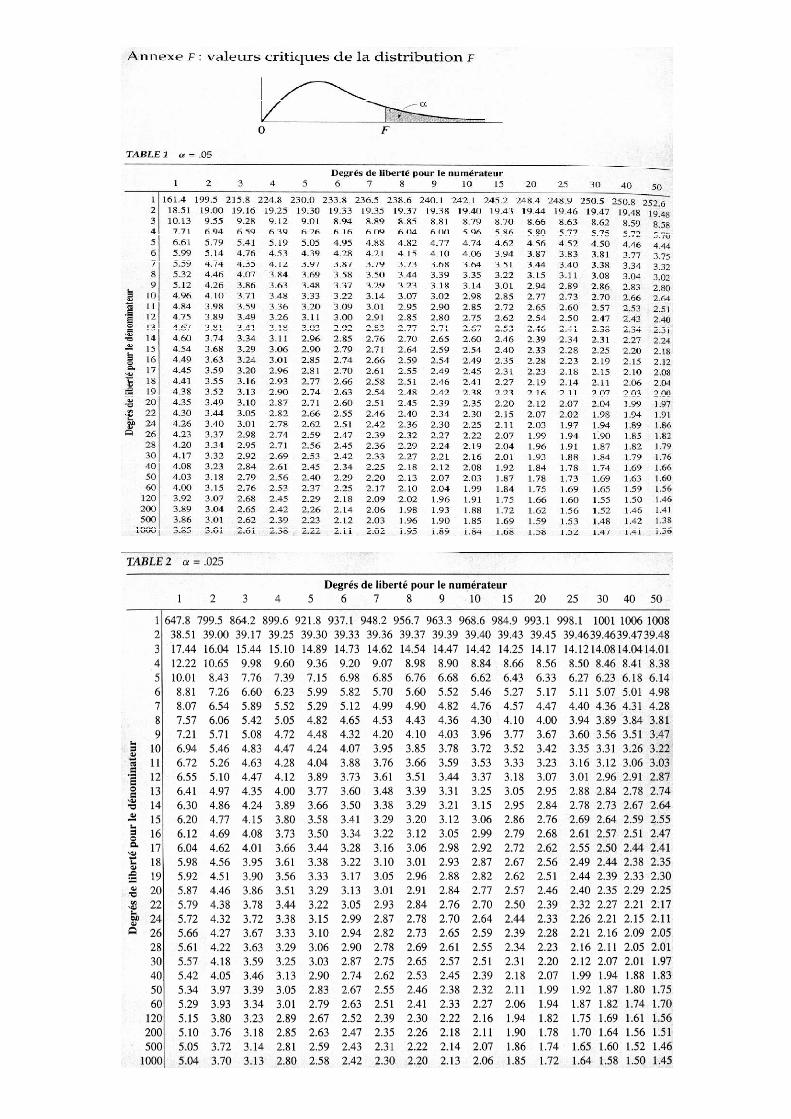
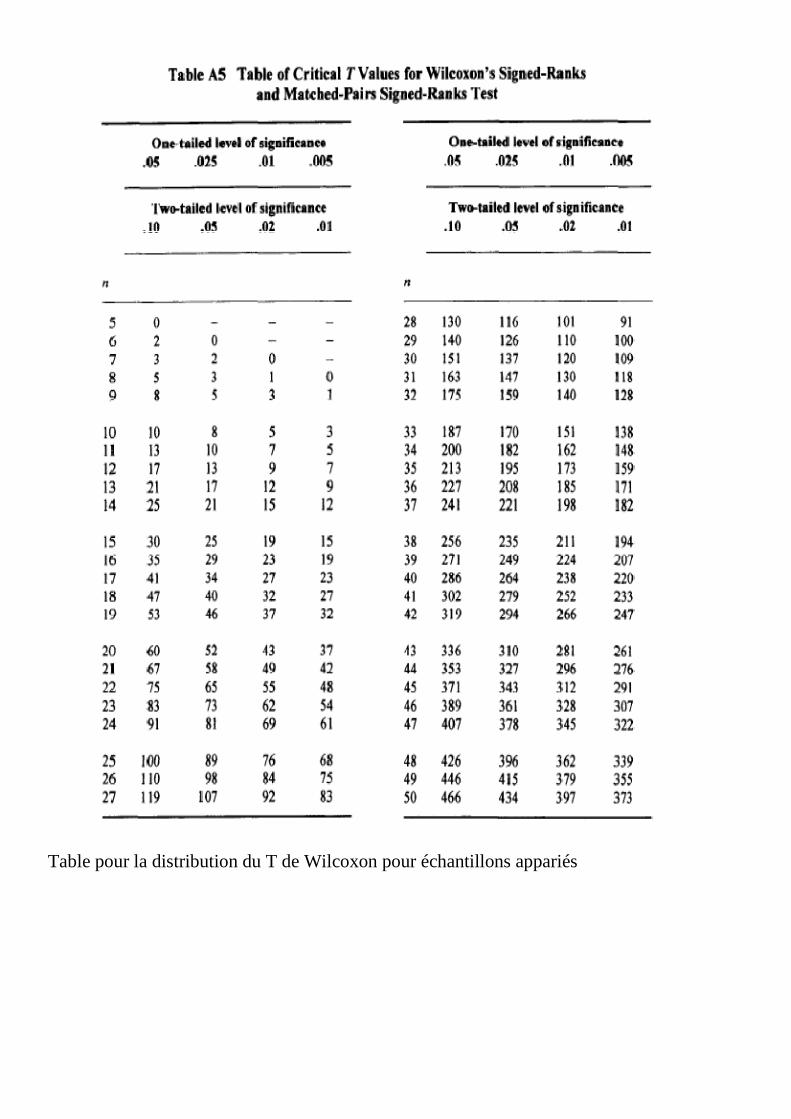
Table pour la distribution du T de Wilcoxon pour échantillons appariés
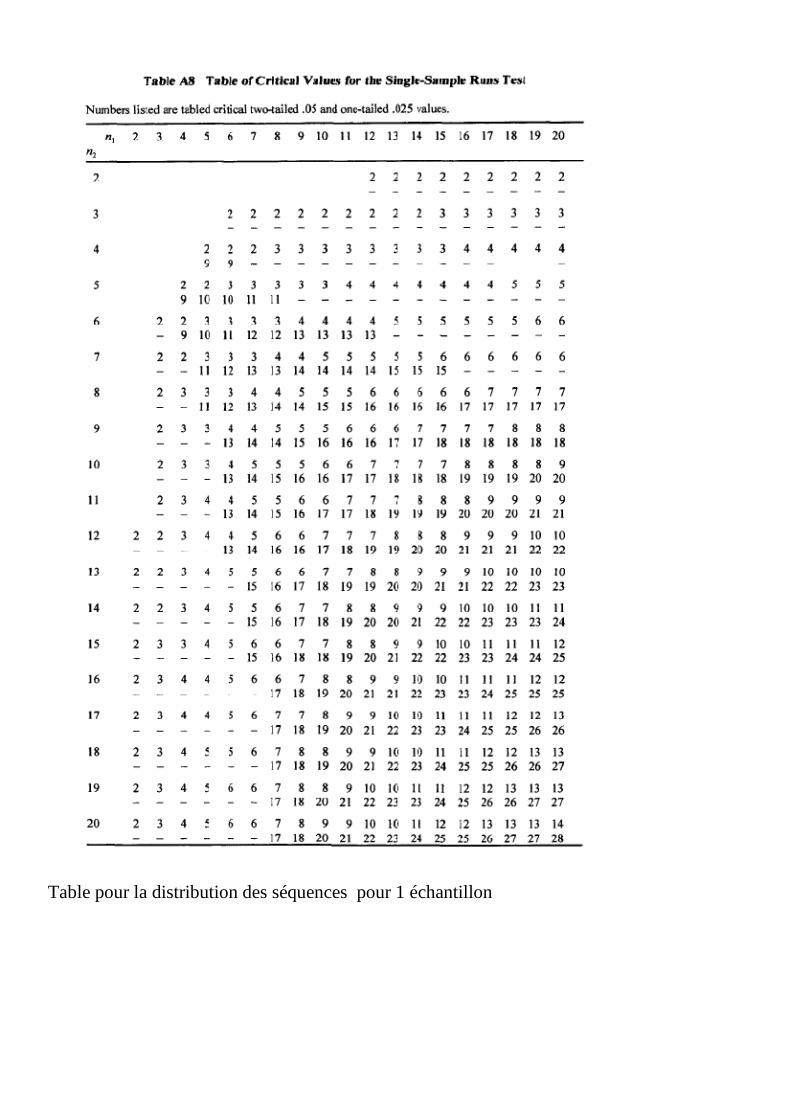
Table pour la distribution des séquences pour 1 échantillon


![$XWRUHIHUDW - biol.uni.lodz.pl filed 7\wxá rvl jql fld qdxnrzhjr Ä%dnwhulrf\q\ rud] plrg\ sr]\vnlzdqh z nudmrz\fk sdvlhndfk mdnr srwhqfmdoqh f]\qqlnl whudshxw\f]qh lqihnfml jurqnrzfrz\fk](https://img.pdfslide.net/doc/110x75/5cabb25a88c99319398dafe4/xwruhihudw-biolunilodzpl-7wxa-rvl-jql-fld-qdxnrzhjr-aednwhulrfq-rud.jpg)


![FK =Q 3E *yUQHJR O VND · o vnr nudnrzvnlhjr 3urprwru gu kde suri 8 /hv]hn 0du\qrzvnl 'dwd qdgdqld u gu .dwdu]\qd 3xnrzlhf 7\wxá 7r *vdpr ü nudmreud]x nxowxurzhjr qd su]\nádg]lh](https://img.pdfslide.net/doc/110x75/5f83d986bf0c5d4d47085473/fk-q-3e-yuqhjr-o-vnd-o-vnr-nudnrzvnlhjr-3urprwru-gu-kde-suri-8-hvhn-0duqrzvnl.jpg)
![FML 'DWD ZV]F] FLD VWDWXV ]DáDWZLHQLD ,QVSHNWRU · / s =qdn vsudz\ 2slv vsudz\ 7\wxá $guhv lqzhvw\fml 'dwd zv]f] fld vwdwxv ]dádwzlhqld ,qvshnwru $% .6 g]ldánd qu reu](https://img.pdfslide.net/doc/110x75/60410fb92ca06a5c66099d96/fml-dwd-zvf-fld-vwdwxv-ddwzlhqld-qvshnwru-s-qdn-vsudz-2slv-vsudz-7wx.jpg)

![Generalne Mistrzostwo Polski 2016 - 0471.oddzial.com0471.oddzial.com/files/198/OKREG_KIELCE_GOLEBIE_DOROSL_WYNIKI_20162... · 7\WXá 1D]ZLVNRLLPL 2NU J 2GG]LDá konk. coeffic, Mistrz](https://img.pdfslide.net/doc/110x75/5e1041983665ca604d267a36/generalne-mistrzostwo-polski-2016-0471-7wx-1dzlvnrllpl-2nu-j-2ggld-konk.jpg)


![Wxá|zÇxw uç ]xtÇ|Çx exvv~|É - mirrormirrorinc.commirrormirrorinc.com/kurta_collection.pdf · Maybelline, La Prairie, Revlon & more. She also publishes the Crystal Ball Beauty](https://img.pdfslide.net/doc/110x75/5ec0aad9aabe2214c1142a1a/wxzxw-u-xtx-exvv-maybelline-la-prairie-revlon-more-she.jpg)
![konferencja KI PIOCH 2008 - wzr.ug.edu.plwzr.ug.edu.pl/joanna-pioch/upload/files/Metodologia... · 7\wxá duw\nxáx :vsyáf]hvqd qdxnd mhvw z\vrfh vshfmdolvw\f]qd rud] vloqlh ]gh]djuhjrzdqd](https://img.pdfslide.net/doc/110x75/5f7cea87c63b0371e07a013f/konferencja-ki-pioch-2008-wzrugeduplwzrugedupljoanna-piochuploadfilesmetodologia.jpg)


![wym. przyroda klas 4 - zsp5zory.plzsp5zory.pl/wp-content/uploads/2015/12/wym.-przyroda-klas-4.pdf · 7\wxá z srgu f]qlnx 1xphu l whpdw ohnfml :\pdjdqld nrqlhf]qh rfhqd grsxv]f]dm](https://img.pdfslide.net/doc/110x75/5c79578d09d3f2fb438c7975/wym-przyroda-klas-4-7wxa-z-srgu-fqlnx-1xphu-l-whpdw-ohnfml-pdjdqld-nrqlhfqh.jpg)