Embed Size (px)
Citation preview
University of Nebraska - LincolnDigitalCommons@University of Nebraska - Lincoln
Architectural Engineering -- Faculty Publications Architectural Engineering
1-1-2010
AB-10-019: Human performance and perception-based evaluations of indoor noise criteria for ratingmechanical system noise with time-varyingfluctuations (1322-RP)Lily M. WangUniversity of Nebraska - Lincoln, [email protected]
Cathleen C. NovakPMK Consultants, Dallas, TX
Follow this and additional works at: http://digitalcommons.unl.edu/archengfacpubPart of the Acoustics, Dynamics, and Controls Commons, and the Architectural Engineering
Commons
This Article is brought to you for free and open access by the Architectural Engineering at DigitalCommons@University of Nebraska - Lincoln. It hasbeen accepted for inclusion in Architectural Engineering -- Faculty Publications by an authorized administrator of DigitalCommons@University ofNebraska - Lincoln.
Wang, Lily M. and Novak, Cathleen C., "AB-10-019: Human performance and perception-based evaluations of indoor noise criteriafor rating mechanical system noise with time-varying fluctuations (1322-RP)" (2010). Architectural Engineering -- Faculty Publications.Paper 41.http://digitalcommons.unl.edu/archengfacpub/41

©2010 ASHRAE 553
This paper is based on findings resulting from ASHRAE Research Project RP-1322.
ABSTRACT
The goal of this study was to investigate the effects of noise from building mechanical systems with time-varying fluctua-tions on human task performance and perception, and to deter-mine how well current indoor noise rating methods account for this performance and perception. Six different noise conditions with varying degrees of time-varying fluctuations, many focused in the low frequency rumble region, were reproduced in an office-like setting. Thirty participants were asked to complete typing, grammatical reasoning, and math tasks plus subjective questionnaires, while being exposed for approxi-mately one hour to each noise condition. Results show that the noise conditions with higher sound levels (greater than 50 dBA) combined with excessive low frequency rumble as well as those with larger timescale fluctuations (i.e., a heat pump cycling on and off every 30 seconds) were generally perceived to be more annoying than the other signals tested, although statistically significant negative relationships to task perfor-mance were not found. Other findings are (1) that the noise characteristics most closely correlated to higher annoyance/distraction responses in this study were higher ratings of loud-ness followed by roar, rumble, and changes in time; and (2) that perception of more low frequency rumble in particular was significantly linked to reduced performance on cognitively demanding tasks. As for the ability of current indoor noise rating systems to match human performance or perception, none of the indoor noise rating methods evaluated were signif-icantly correlated to task performance, but aspects of subjec-tive perception such as loudness ratings were statistically related. Spectral quality ratings included with some noise
rating methodologies were inconsistent with subjective perception, but other metrics such as RNC, L1 – L99 [LF ave], and LCeq – LAeq, were strongly correlated to rumble perception. The authors use the results to suggest a framework for an ‘ideal’ indoor noise rating method, but further research is required towards quantifying specific guidelines for accept-able degrees of time-varying fluctuations and tonalness.
INTRODUCTION
Mechanical systems responsible for heating, ventilation and air-conditioning are sources of background noise in build-ings. Acceptable noise level guidelines have been suggested using a number of indoor noise rating methodologies proposed over the past 60 years, such as Noise Criteria (NC), Room Criteria (RC) and Room Criteria Mark II (RC-Mark II) (ASHRAE 2007). There is some debate about which noise rating system should be advocated by ASHRAE, as the vari-ous methodologies do not always give the same assessment. Furthermore, experience in the field suggests that these noise rating systems do not account well for time-varying fluctua-tions that can occur with modern mechanical systems. The fluctuations may be due to ill-designed systems that demon-strate surging and excessive low frequency rumble, or may be on a larger timescale where the system’s settings change over time, such as variable air volume systems or systems switch-ing on and off. This research project investigates the effects of noise with time-varying fluctuations on human performance and perception, and correlates these findings with current indoor noise rating methods. An earlier phase of the work focused on the effects of noise with varying degrees of tones,
Human Performance and Perception-BasedEvaluations of Indoor Noise Criteria forRating Mechanical System Noise withTime-Varying FluctuationsLily M. Wang, PhD, PE Cathleen C. NovakMember ASHRAE
Lily M. Wang is an associate professor in the Durham School of Architectural Engineering and Construction, University of Nebraska–Lincoln, Omaha, NE. Cathleen C. Novak is a consultant with PMK Consultants, Dallas, TX.
AB-10-019 (RP-1322)
©2010, American Society of Heating, Refrigerating and Air-Conditioning Engineers, Inc. (www.ashrae.org). Published in ASHRAE Transactions (2010, Vol. 116, Part 2). For personal use only. Additional reproduction, distribution, or transmission in either print or digital form is not permitted without ASHRAE's prior written permission.

554 ASHRAE Transactions
another problem produced by modern mechanical systems (Ryherd and Wang 2010). The results have collectively been used to outline a framework that an ‘ideal’ indoor noise rating method should follow, as described later in this paper.
Much research has been conducted regarding the effects of noise on human perception and performance; reviews of such work may be found in Kryter (1985), Jones and Broad-bent (1998), and the accompanying paper by Ryherd and Wang (2010). One consistent finding from the previous work is that while sound level is certainly an important factor, spec-tral characteristics of the noise also affect human perception and performance. In particular, noise with excessive low frequency energy or rumble has been shown in the lab and in the field to result in greater annoyance than equivalently loud signals without rumble (Berglund et al. 1996, Leventhall 2003, Persson et al. 1985, Persson and Björkman 1988, Pers-son Waye et al. 2001, Persson Waye and Rylander 2001). Bradley (1994) reported an investigation in which subjects adjusted the level of an amplitude-modulated signal (simulat-ing rumble) to be equivalently annoying to a reference signal with a neutral spectrum. He found that both level and the modulation frequency of the stimulus could negatively impact the perceived annoyance. Noise conditions with rumble can also result in degradation in task performance, as shown by a number of researchers, although many of these studies compared only a few signals at a time (Kyriakides and Leven-thall 1977, Landström et al. 1991, Holmberg et al. 1993, Pers-son Waye et al. 1997, 2001).
To quantify the degree of low frequency content and possibly predict the resulting annoyance, Broner and Leven-thall (1983) proposed using the difference between the C-weighted equivalent sound pressure level and the A-weighted equivalent sound pressure level, LCeq – LAeq (often referred to as dBC – dBA), since the A-weighting curve corrects more severely for low frequency components than the C-weighting curve. They suggested that values of LCeq – LAeq greater than 20 dB would signify a low frequency noise problem. Holm-berg et al. (1996) correlated a number of metrics that were easily calculated by a sound level meter to the perception of annoyance from low frequency noise, including LCeq – LAeq, and found that this particular metric did differentiate between annoying and non-annoying cases. Holmberg et al. (1997) later suggested that a value of 15 dB or greater could indicate the potential for low frequency noise problems. Kjellberg et al. (1997) conducted office surveys and suggested that LCeq – LAeq may be limited as a predictor of annoyance, particularly at lower overall noise levels when the low frequency content was not as perceptible.
A metric that has been proposed for quantifying more specifically the degree of time-varying fluctuations in a signal is the difference between two statistical sound level measures, such as L10 – L90, where L10 is the sound level exceeded 10% of the time and L90 is the sound level exceeded 90% of the time (Blazier and Ebbing 1992). More recently, Mann et al. (2007) utilized another variation, L1 – L99, to quantify time-
varying fluctuations during their ASHRAE 1219-RP project which sought to quantify duct rumble noise resulting from various aerodynamic system effects at the discharge of a centrifugal fan.
The most recent version of ANSI Standard S12.2 “Crite-ria for Evaluating Room Noise” (2008) includes a methodol-ogy known as Room Noise Criteria (RNC), originally proposed by Schomer (2000), that explicitly attempts to coun-ter the indoor noise rating methods NC and RC’s deficiencies in dealing with low frequency fluctuations. RNC requires calculations of Lmax – Leq, energy averaged for the octave bands from 16 Hz to 63 Hz, as well as at the 125 Hz octave band, to provide an indication of whether low frequency fluc-tuations are a problem. In cases where surging or low frequency fluctuations are indicated, the RNC method essen-tially calculates a penalty to add to the levels in the lowest frequency bands, and then a tangency method is applied to determine the final rating; otherwise, it defaults to the NC method described in the standard. The octave band in which the tangency is met is to be reported with the RNC value. Schomer and Bradley (2000) applied the RNC ratings to the findings from Bradley’s previous study on annoyance due to amplitude-modulated signals (1994) and found that the RNC methodology was validated by those results.
There has been some work on other random (or aperi-odic) time-varying fluctuations, such as those that may occur on longer timescales than low frequency rumble (e.g. systems switching on and off) or involving different content (e.g. office noise including speech, equipment noise, etc.). Eschenbrenner (1971) compared the effects of continuous periodic and aperiodic noise, and found that the aperiodic noise reduced the performance times on a visual tracking task, although exposure times were brief in this study. In Weinstein’s 1977 study, subjects completed a proofreading task while listening either to a recording of radio news or in quiet, and the results were mixed; detection of grammatical errors decreased in noise, but speed and detection of spelling errors were not significantly affected. Recently, Witterseh et al. (2004) investigated human perception and performance over a three-hour period in an open-office type environment due to various combinations of three thermal and two acous-tic conditions. They found that the office noise condition (55 dBA) which included a great deal of aperiodic content resulted in increased fatigue and decreased performance in comparison to a quiet noise condition (35 dBA).
The current investigation is focused on how both human perception and performance are affected by noise produced from mechanical systems in buildings that feature time-vary-ing fluctuations, primarily in the low frequency region or on a larger timescale. The project involved systematically expos-ing participants to six different noise signals over a period of one hour each and gauging their performance on three types of tasks (typing, grammatical reasoning and math tests) and their perception via subjective questionnaires. The results have then been related to commonly used indoor noise rating systems,
©2010, American Society of Heating, Refrigerating and Air-Conditioning Engineers, Inc. (www.ashrae.org). Published in ASHRAE Transactions (2010, Vol. 116, Part 2). For personal use only. Additional reproduction, distribution, or transmission in either print or digital form is not permitted without ASHRAE's prior written permission.
©2010 ASHRAE 555
suggested within the ASHRAE Applications Handbook, in an effort to improve those methods.
METHODOLOGY
The protocol described in this section for this phase of research is similar to one used for an earlier phase of testing, presented in an accompanying paper (Ryherd and Wang 2010). As the authors believe that readers may not necessarily access both papers, some of the same methodology is discussed in both manuscripts.
Thirty test subjects (15 males and 15 females) from the University of Nebraska community were recruited to partici-pate in this study, ranging in age from 19 to 61 with a mean of 22.6 years. All participants first underwent a series of pre-test screens to gauge the subject’s vision, hearing, and typing skills. The minimum requirements to participate in the study were as follows: normal vision as verified by a Keystone Opthalmic Telebinocular, hearing thresholds below 25 dB hearing level in octave bands from 125 Hz to 8 kHz, and a minimum typing speed of 20 wpm. None of these participants had participated in the earlier phase of the ASHRAE 1322-RP project regarding tonal noise conditions (Ryherd and Wang 2010).
Testing was conducted in a 906 ft³ (25.7 m³) indoor envi-ronmental test chamber at the University of Nebraska, outfit-ted as a typical office with two desks, carpet, gypsum board walls, and acoustical ceiling tile. The test chamber’s envelope has a high sound transmission class of STC 47, and its interior acoustic condition demonstrates low background noise level of RC 26(H) (or an equivalent A-weighted sound level of 35 dBA) and a low reverberation time of 0.25 sec at 500 Hz. During all tests, the test chamber was thermally controlled to maintain a temperature of 72°F (22°C). Overhead fluorescent lighting provided an constant average illuminance of 71 foot-candles (764 lux) at the work plane. The sound in the test chamber was the only environmental characteristic that changed between test sessions, with the signals being presented in an inconspicuous manner over two loudspeakers: (i) an Armstrong i-ceiling loudspeaker which has the same appearance as the other ceiling tiles in the room, and (ii) a JBL Northridge E250P subwoofer, disguised to resemble an endta-ble in the corner of the room. The test administrator and vari-ous equipment (e.g. the hard drive to the test computers and other audio gear) were located in a control room, adjacent to the chamber.
A repeated measures test design was used in which each subject was exposed to the same six noise conditions, each for a period of 55 minutes at a time. This length of exposure time was selected due to the results from a previous phase of the ASHRAE 1322-RP project (Ryherd and Wang 2007). Partic-ipants were asked to come for their six listening sessions at approximately the same timeslot on different days. For each session, the test subjects spent the first 25 minutes adapting to the noise condition and completing a test on paper, developed from material taken from the verbal portion of the Graduate
Record Examination (GRE). Unbeknownst to the subject, this material was not to be marked but was simply to keep the subject mentally alert during the adaptation period.
The next 15 minutes consisted first of three skill tests, administered on a computer using SkillCheck software: typing, grammatical reasoning, and math. The typing test was allotted five minutes, and involved typing a passage from a piece of paper with the mouse disabled. The reasoning task was allotted two minutes, and included 20 questions in which subjects indicated whether a statement regarding a presented sequence of letters was true or false. The math test was allotted seven minutes, and included 11 problems involving the four basic functions with integers, fractions, and decimals, presented either mathematically or as a word problem. Partic-ipants were provided with pencil and paper but no calculator. Results for the typing test were output as an adjusted typing speed, accounting not only for the subject’s typing speed but also the number of errors made. Results for the reasoning and math tasks were output as a percent correct, with questions that were not answered within the time limit considered incorrect. Further details on the development of the test material may be found in Ryherd and Wang (2007).
The skill tests were followed by a subjective question-naire that asked the participant to rate his/her perception on discrete seven-point scales of various indoor environmental qualities of the space, where 1 generally represented a low rating and 7 represented a high rating. Eight questions focused on perceptions related to the acoustic condition: loudness, rumble, roar, hiss, tones, changes over time, annoyance, and distraction. The remaining five focused on other conditions of the working environment, including lighting, thermal comfort and indoor air quality; as these conditions were kept constant and were not the focus of this investigation, the data are not presented further in this paper. The last 15 minutes repeated this sequence once more: typing, reasoning, and math tests, followed by the questionnaire. In total then there were 360 observations (= 30 subjects x 6 noise conditions x 2 test/ques-tionnaire sequences).
Six versions of the paper-based task and 12 versions of the typing, reasoning, and math tasks were utilized. Each subject completed all versions of the tasks with the order of presentation randomized for each subject. Only one subject was in the test room at a time in this study, so the order in which each subject experienced the noise conditions was also randomized.
Prior to testing, the subjects completed a Powerpoint tuto-rial on a computer that described the test procedures and intro-duced them to the subjective terms “rumbly”, “roaring”, “hissy”, and “tonal”. The “rumbly” noise characteristic was described as containing excessive low frequencies, and a corresponding audio sample of broadband white noise band-limited from 16 Hz to 63 Hz octave bands at a level of 54 dBA was presented over headphones. The “roaring” noise charac-teristic was described as being excessive in mid-frequencies, and a corresponding audio sample band-limited from 125 Hz
©2010, American Society of Heating, Refrigerating and Air-Conditioning Engineers, Inc. (www.ashrae.org). Published in ASHRAE Transactions (2010, Vol. 116, Part 2). For personal use only. Additional reproduction, distribution, or transmission in either print or digital form is not permitted without ASHRAE's prior written permission.
556 ASHRAE Transactions
to 500 Hz at 59 dBA was presented. The “hissy” noise char-acteristic was described as containing excessive high frequen-cies, and a corresponding broadband audio sample band-limited from 1 kHz to 8 kHz at 63 dBA was presented. The “tonal” training signal consisted of broadband noise at an overall LAeq level of 60 dBA with a tone at 500 Hz of PR = 16. No other training was provided concerning the remaining descriptors on the questionnaire.
Noise Conditions
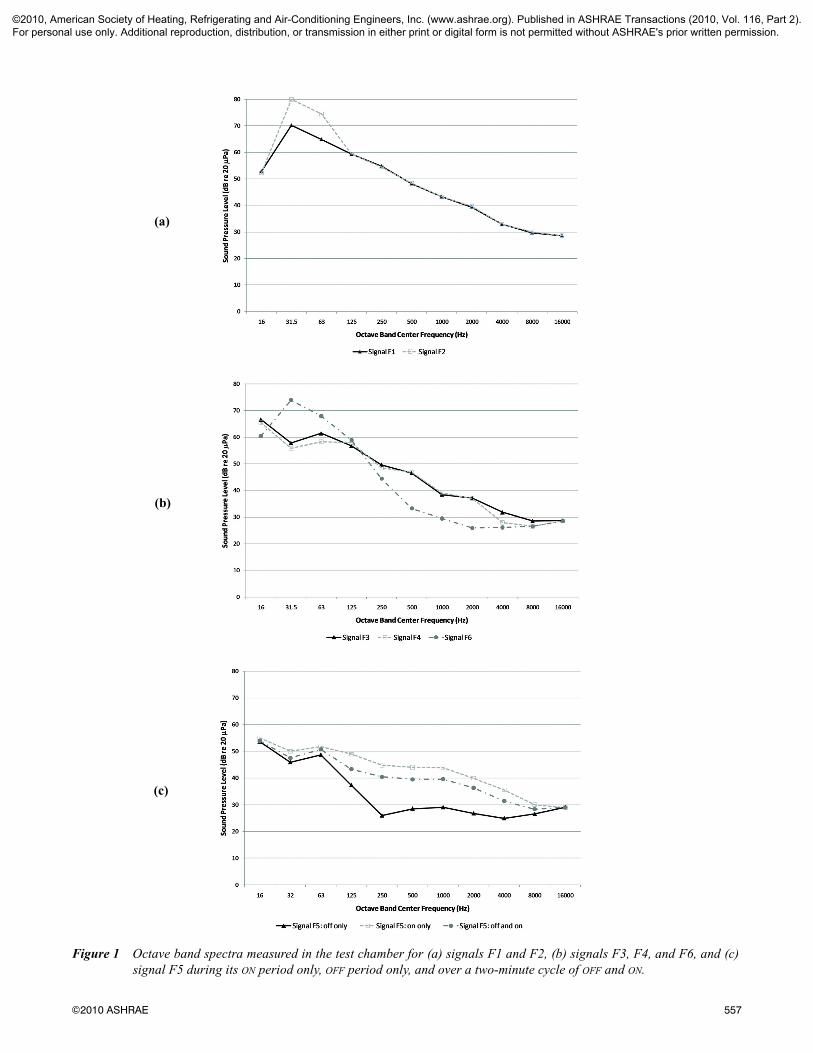
The six different noise conditions used had different degrees of time-varying fluctuations, much of which occurred in the low frequency region. Signal F1 was a neutral broad-band signal generated in Cool Edit 2000 software with a -5 dB/octave band slope, intersecting 45 dB (re 20 μPa) at the 1000 Hz octave band (Figure 1(a)). Signal F2 was created in the same manner as F1, except its low frequency content was increased by ten dB in the 31.5 Hz and 63 Hz octave bands (Figure 1(a)). Signals F3 and F4 were based on more realistic noise recordings from a ducted centrifugal fan system, acquired from an ASHRAE-sponsored research project, 1219-RP (Mann et al. 2007). Signal F3 was representative of the system at 35% on the fan load curve and 2.5” of water static pressure, while signal F4 was representative of the system at 80% on the fan load curve and 1” of water static pressure. These two cases were selected from those recorded in 1219-RP because of a clear audible difference in the spectral char-acter of the two. As seen in Figure 1(b), F3 had slightly higher levels in portions of the low and high frequency ranges.
Signal F5 was recorded in a university dormitory room, with a heat pump that was turned on and off at a rate of once every 30 seconds. The time fluctuation in this signal is on a larger timescale than the other signals in this study, as the authors wished to include one sample that simulated the cycling on and off of mechanical systems in buildings. Cycling on and off every 30 seconds is an extreme case, not often found in built environments, but since this is the first time that such a signal had been tested to the authors’ knowledge, an extreme case was selected. Figure 1(c) plots the equivalent sound pressure level spectra of this signal in octave bands, measured during its on period, its off period, and over the entire on and off cycle. Signal F6 was a broadband noise signal with excessive low frequency components (Figure 1(b)), generated during another ASHRAE-sponsored research proj-ect, 879-RP (Broner 2004).
Each signal’s .wav file was carefully edited to a length of 30 seconds, except for signal F5 which was 1 minute long, and these were played in a continuous loop over the 55 minute test session. Both octave and one-third octave band data of each of these signals were measured at the participant’s seated posi-tion, 4 ft (1.2 m) off of the floor, using a Larson Davis 824B sound level meter sampling every 125 ms at a fast detection setting over a two minute period. Figures 1(a-c) show the resulting octave band spectra for all six signals.
Table 1 lists the six noise conditions along with their corresponding indoor noise criteria ratings. The loudness in sones was calculated per ANSI Standard S3.4 (2005b). Proce-dures for calculating the other criteria are described in the ASHRAE Applications Handbook (2007).
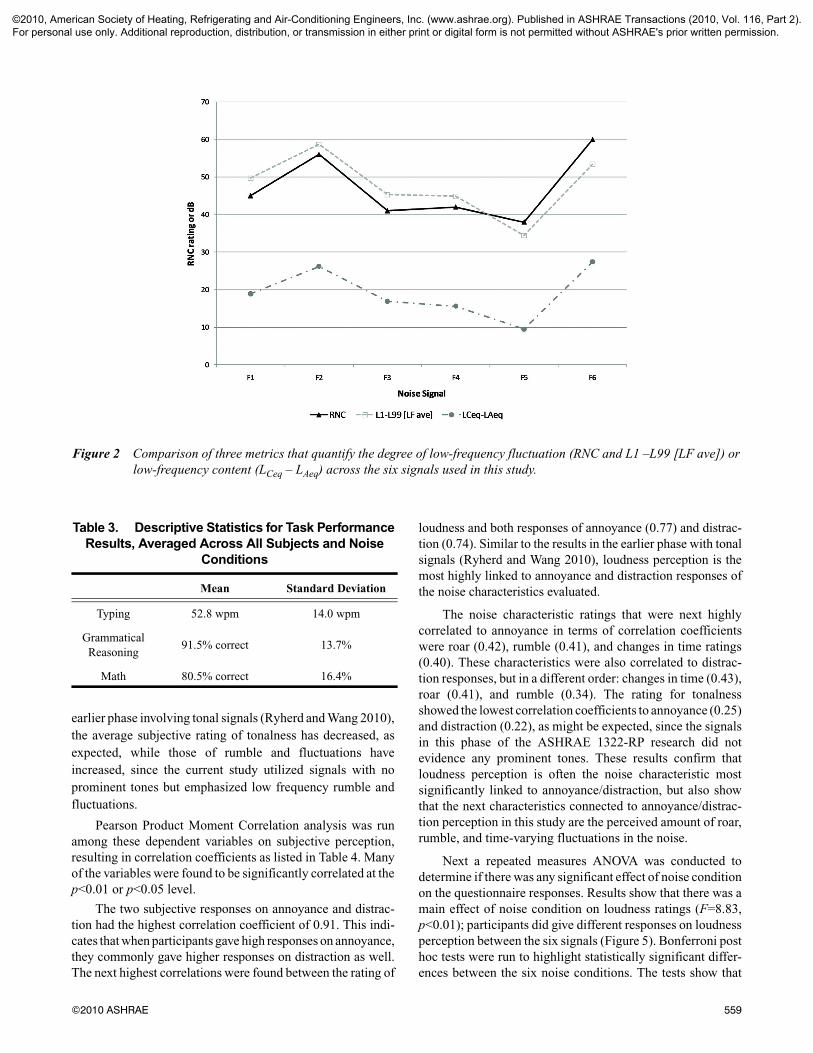
Table 2 lists the six noise conditions along with metrics that have been suggested for quantifying the degree of low frequency fluctuations: RNC (along with the required Lmax – Leq calculations), and L1 – L99 [LF ave]. The L1 – L99 [LF ave] values were calculated by taking an energy average of the L1 – L99 quantities across the low frequency one-third octave bands from 12.5 Hz to 160 Hz. The metric LCeq – LAeq is also included in Table 2; recall that it does not explicitly quantify the degree of low frequency fluctuations, but is rather a measure of low frequency content. Figure 2 shows a comparison of RNC, L1 – L99 [LF ave], and LCeq – LAeq for the six signals used in this study, and demonstrates that all of these metrics seem to give roughly similar rankings to the signals regarding their low frequency fluctuation or content, with signals F2 and F6 having the highest values and signal F5 having the lowest. It is worth noting that the RNC method gives signal F2 a high rating because of excessive low frequency content in the 63 Hz octave band, and not resulting from any applied penalty for excessive low frequency fluctuation. The high RNC value for signal F6 is due to excessive low frequency fluctuation, though, with a severe penalty applied to the 31.5 Hz octave band that raises the RNC value to 60.
RESULTS
Various statistical analyses have been used to evaluate the results. The independent variables were the six different noise conditions. The dependent variables were the task perfor-mance scores for three types of tasks (verbal, grammatical reasoning, and math) and the subjective ratings for the eight questions regarding acoustics. The statistical results from applying Pearson’s Product Moment Correlations and repeated measures analysis of variance (ANOVA) with Bonferroni post hoc tests on the task performance scores and the subjective questionnaire responses are first presented. Then these two groups of dependent variables are related through a further statistical method, linear mixed models, to investigate significant correlations between performance and perception. All of the statistical analyses were conducted in SPSS software. For more details on the statistical methods used, refer to Field and Hole (2003).
Task Performance Results
The descriptive statistics for the task performance results across all the test subjects and noise conditions are presented in Table 3. The reasoning test suffered from a restricted range; that is, the subjects scored quite high on that task, indicating that the task was not sufficiently difficult. Consequently, while valid, the reasoning test results should be carefully interpreted in subsequent analysis.
©2010, American Society of Heating, Refrigerating and Air-Conditioning Engineers, Inc. (www.ashrae.org). Published in ASHRAE Transactions (2010, Vol. 116, Part 2). For personal use only. Additional reproduction, distribution, or transmission in either print or digital form is not permitted without ASHRAE's prior written permission.
©2010 ASHRAE 557
(a)
(b)
(c)
Figure 1 Octave band spectra measured in the test chamber for (a) signals F1 and F2, (b) signals F3, F4, and F6, and (c) signal F5 during its ON period only, OFF period only, and over a two-minute cycle of OFF and ON.
©2010, American Society of Heating, Refrigerating and Air-Conditioning Engineers, Inc. (www.ashrae.org). Published in ASHRAE Transactions (2010, Vol. 116, Part 2). For personal use only. Additional reproduction, distribution, or transmission in either print or digital form is not permitted without ASHRAE's prior written permission.

558 ASHRAE Transactions
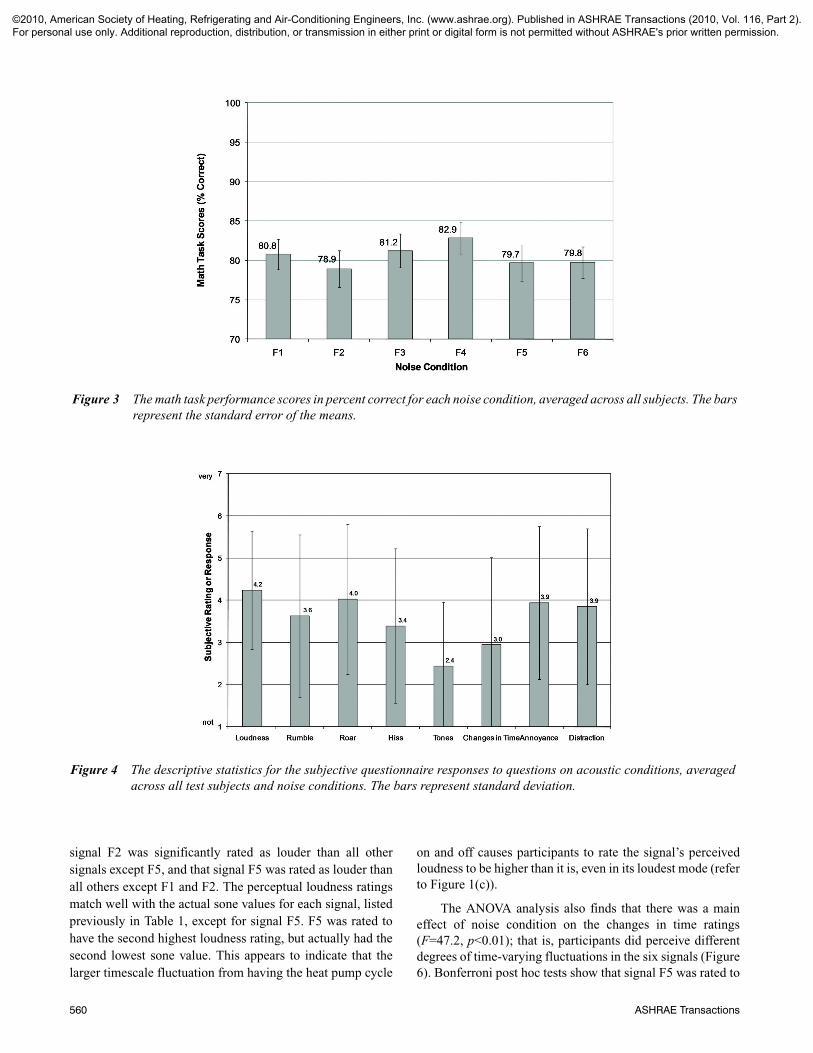
A repeated measures analysis of variance (ANOVA) was conducted to determine if there was any significant effect of noise condition on task performance. Results indicate that noise conditions did not have a significant main effect on any of the three tasks. Figure 3 shows sample results of the math task for each noise condition, averaged across all subjects; stan-dard error of the mean bars are shown. The plot shows that, although not found to be statistically significant, there does appear to be a trend that the signals with the most low frequency content (F2 and F6) and the one with the on/off fluctuation (F5) resulted in lower math scores than the other conditions tested. The reasoning task results were similar, whereas the typing results did not indicate any apparent trends. The results suggest that a large degree of low frequency fluctuations or large time-scale fluctuations may impact tasks that are more cognitively
difficult, but not more routine tasks like typing. Additional research is required to confirm this hypothesis.
Subjective Perception Results
The descriptive statistics for the subjective questionnaire responses to questions on acoustic conditions are presented in Figure 4 averaged across all the test subjects and noise condi-tions. Six of these questions are linked to subjective ratings of the noise signal characteristics (loudness, rumble, roar, hiss, tones, and changes in time), while the remaining two are linked to subjective responses due to the noise (annoyance and distraction). Comparison of the descriptive statistics shows that the ratings for loudness and roar have similar means and standard deviations, as do the responses on annoyance and distraction. In comparing these results to those from a similar
Table 1. Noise Conditions and Their Corresponding Indoor Noise Criteria Ratings(N = Neutral, R = Rumbly, H = Hissy, V = Vibrational, LF = Excessive Low Frequency,
MF = Excessive Mid Frequency (Roaring in Character), and HF = Excessive High Frequency)
Noise Condition Label and Description
NC NCB RC RC-Mark IILAeq,dBA
Loudness, sones
F1: Mid-level neutral 45 41 (RV) 44 (V) 44 (V), marginal 51 10.7
F2: Mid-level rumbly 56 41 (RV) 44 (RV) 44 (LF,V), marginal 53 11.4
F3: RP-1219 recording (35% fan load curve, 2.5 in. sp)
42 38 (RV) 41 (V) 41 (V), marginal 48 9.1
F4: RP-1219 recording (80% fan load curve, 1 in. sp)
42 38 (R) 41 (N) 41 (N), acceptable 48 8.5
F5: Heat pump recording, cycling ON and OFF
39 37 (H) 38 (N) 38 (N), acceptable 44 7.2
F6: RP-879 recording(low frequency fluctuating)
46 29 (RV) 30 (RHV) 30 (LF, V) Objectionable 45 5.3
Table 2. Noise Conditions and Their Corresponding Quantifiers for Degree ofLow-Frequency Fluctuations or Content
Noise Condition Label and Description
RNCLmax – Leq ,
16–63 Hz (dB)Lmax – Leq,
125 Hz (dB)L1 – L99,
LF ave (dB)LCeq – LAeq,
dB
F1: Mid-level neutral 45 (250 Hz) 6.4 4.7 48.8 18.9
F2: Mid-level rumbly 56 (63 Hz) 6.3 5.0 57.7 26.2
F3: RP-1219 recording (35% fan load curve, 2.5 in. sp)
41 (500 Hz) 5.9 7.0 44.3 16.9
F4: RP-1219 recording (80% fan load curve, 1 in. sp)
42 (125 Hz) 7.2 7.4 43.9 15.6
F5: Heat pump recording, cycling ON and OFF
38 (1000 Hz) 5.7 6.4 33.4 9.5
F6: RP-879 recording(low frequency fluctuating)
60 (31.5 Hz) 7.5 5.6 52.4 27.4
©2010, American Society of Heating, Refrigerating and Air-Conditioning Engineers, Inc. (www.ashrae.org). Published in ASHRAE Transactions (2010, Vol. 116, Part 2). For personal use only. Additional reproduction, distribution, or transmission in either print or digital form is not permitted without ASHRAE's prior written permission.
©2010 ASHRAE 559
earlier phase involving tonal signals (Ryherd and Wang 2010), the average subjective rating of tonalness has decreased, as expected, while those of rumble and fluctuations have increased, since the current study utilized signals with no prominent tones but emphasized low frequency rumble and fluctuations.
Pearson Product Moment Correlation analysis was run among these dependent variables on subjective perception, resulting in correlation coefficients as listed in Table 4. Many of the variables were found to be significantly correlated at the p<0.01 or p<0.05 level.
The two subjective responses on annoyance and distrac-tion had the highest correlation coefficient of 0.91. This indi-cates that when participants gave high responses on annoyance, they commonly gave higher responses on distraction as well. The next highest correlations were found between the rating of
loudness and both responses of annoyance (0.77) and distrac-tion (0.74). Similar to the results in the earlier phase with tonal signals (Ryherd and Wang 2010), loudness perception is the most highly linked to annoyance and distraction responses of the noise characteristics evaluated.
The noise characteristic ratings that were next highly correlated to annoyance in terms of correlation coefficients were roar (0.42), rumble (0.41), and changes in time ratings (0.40). These characteristics were also correlated to distrac-tion responses, but in a different order: changes in time (0.43), roar (0.41), and rumble (0.34). The rating for tonalness showed the lowest correlation coefficients to annoyance (0.25) and distraction (0.22), as might be expected, since the signals in this phase of the ASHRAE 1322-RP research did not evidence any prominent tones. These results confirm that loudness perception is often the noise characteristic most significantly linked to annoyance/distraction, but also show that the next characteristics connected to annoyance/distrac-tion perception in this study are the perceived amount of roar, rumble, and time-varying fluctuations in the noise.
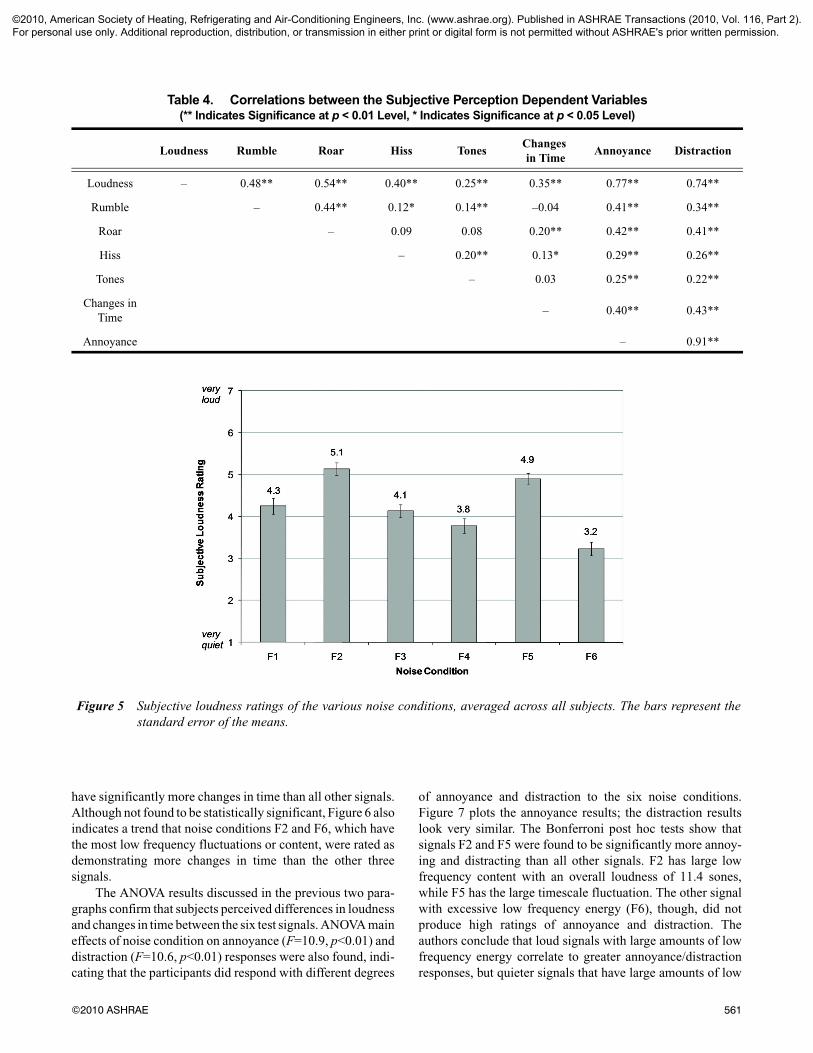
Next a repeated measures ANOVA was conducted to determine if there was any significant effect of noise condition on the questionnaire responses. Results show that there was a main effect of noise condition on loudness ratings (F=8.83, p<0.01); participants did give different responses on loudness perception between the six signals (Figure 5). Bonferroni post hoc tests were run to highlight statistically significant differ-ences between the six noise conditions. The tests show that
Table 3. Descriptive Statistics for Task Performance Results, Averaged Across All Subjects and Noise
Conditions
Mean Standard Deviation
Typing 52.8 wpm 14.0 wpm
Grammatical Reasoning
91.5% correct 13.7%
Math 80.5% correct 16.4%
Figure 2 Comparison of three metrics that quantify the degree of low-frequency fluctuation (RNC and L1 –L99 [LF ave]) or low-frequency content (LCeq – LAeq) across the six signals used in this study.
©2010, American Society of Heating, Refrigerating and Air-Conditioning Engineers, Inc. (www.ashrae.org). Published in ASHRAE Transactions (2010, Vol. 116, Part 2). For personal use only. Additional reproduction, distribution, or transmission in either print or digital form is not permitted without ASHRAE's prior written permission.
560 ASHRAE Transactions
signal F2 was significantly rated as louder than all other signals except F5, and that signal F5 was rated as louder than all others except F1 and F2. The perceptual loudness ratings match well with the actual sone values for each signal, listed previously in Table 1, except for signal F5. F5 was rated to have the second highest loudness rating, but actually had the second lowest sone value. This appears to indicate that the larger timescale fluctuation from having the heat pump cycle
on and off causes participants to rate the signal’s perceived loudness to be higher than it is, even in its loudest mode (refer to Figure 1(c)).
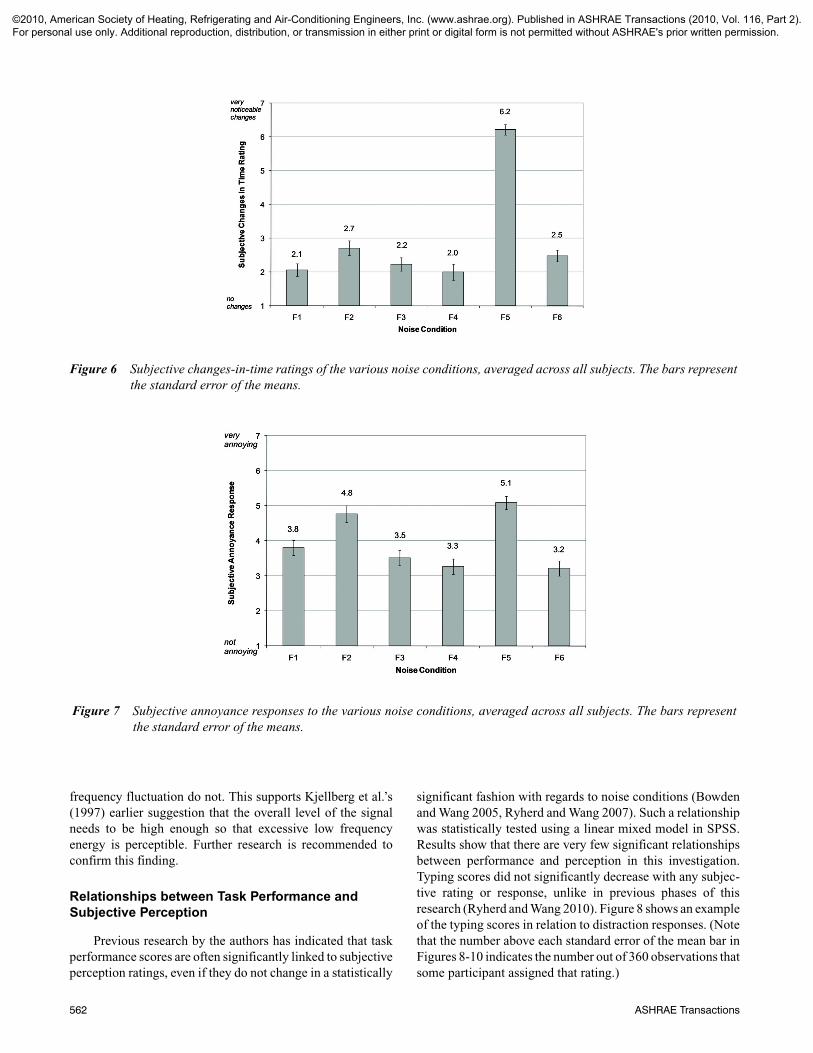
The ANOVA analysis also finds that there was a main effect of noise condition on the changes in time ratings (F=47.2, p<0.01); that is, participants did perceive different degrees of time-varying fluctuations in the six signals (Figure 6). Bonferroni post hoc tests show that signal F5 was rated to
Figure 3 The math task performance scores in percent correct for each noise condition, averaged across all subjects. The bars represent the standard error of the means.
Figure 4 The descriptive statistics for the subjective questionnaire responses to questions on acoustic conditions, averaged across all test subjects and noise conditions. The bars represent standard deviation.
©2010, American Society of Heating, Refrigerating and Air-Conditioning Engineers, Inc. (www.ashrae.org). Published in ASHRAE Transactions (2010, Vol. 116, Part 2). For personal use only. Additional reproduction, distribution, or transmission in either print or digital form is not permitted without ASHRAE's prior written permission.
©2010 ASHRAE 561
have significantly more changes in time than all other signals. Although not found to be statistically significant, Figure 6 also indicates a trend that noise conditions F2 and F6, which have the most low frequency fluctuations or content, were rated as demonstrating more changes in time than the other three signals.
The ANOVA results discussed in the previous two para-graphs confirm that subjects perceived differences in loudness and changes in time between the six test signals. ANOVA main effects of noise condition on annoyance (F=10.9, p<0.01) and distraction (F=10.6, p<0.01) responses were also found, indi-cating that the participants did respond with different degrees
of annoyance and distraction to the six noise conditions. Figure 7 plots the annoyance results; the distraction results look very similar. The Bonferroni post hoc tests show that signals F2 and F5 were found to be significantly more annoy-ing and distracting than all other signals. F2 has large low frequency content with an overall loudness of 11.4 sones, while F5 has the large timescale fluctuation. The other signal with excessive low frequency energy (F6), though, did not produce high ratings of annoyance and distraction. The authors conclude that loud signals with large amounts of low frequency energy correlate to greater annoyance/distraction responses, but quieter signals that have large amounts of low
Table 4. Correlations between the Subjective Perception Dependent Variables (** Indicates Significance at p < 0.01 Level, * Indicates Significance at p < 0.05 Level)
Loudness Rumble Roar Hiss TonesChanges in Time
Annoyance Distraction
Loudness – 0.48** 0.54** 0.40** 0.25** 0.35** 0.77** 0.74**
Rumble – 0.44** 0.12* 0.14** –0.04 0.41** 0.34**
Roar – 0.09 0.08 0.20** 0.42** 0.41**
Hiss – 0.20** 0.13* 0.29** 0.26**
Tones – 0.03 0.25** 0.22**
Changes in Time
– 0.40** 0.43**
Annoyance – 0.91**
Figure 5 Subjective loudness ratings of the various noise conditions, averaged across all subjects. The bars represent the standard error of the means.
©2010, American Society of Heating, Refrigerating and Air-Conditioning Engineers, Inc. (www.ashrae.org). Published in ASHRAE Transactions (2010, Vol. 116, Part 2). For personal use only. Additional reproduction, distribution, or transmission in either print or digital form is not permitted without ASHRAE's prior written permission.
562 ASHRAE Transactions
frequency fluctuation do not. This supports Kjellberg et al.’s (1997) earlier suggestion that the overall level of the signal needs to be high enough so that excessive low frequency energy is perceptible. Further research is recommended to confirm this finding.
Relationships between Task Performance and Subjective Perception
Previous research by the authors has indicated that task performance scores are often significantly linked to subjective perception ratings, even if they do not change in a statistically
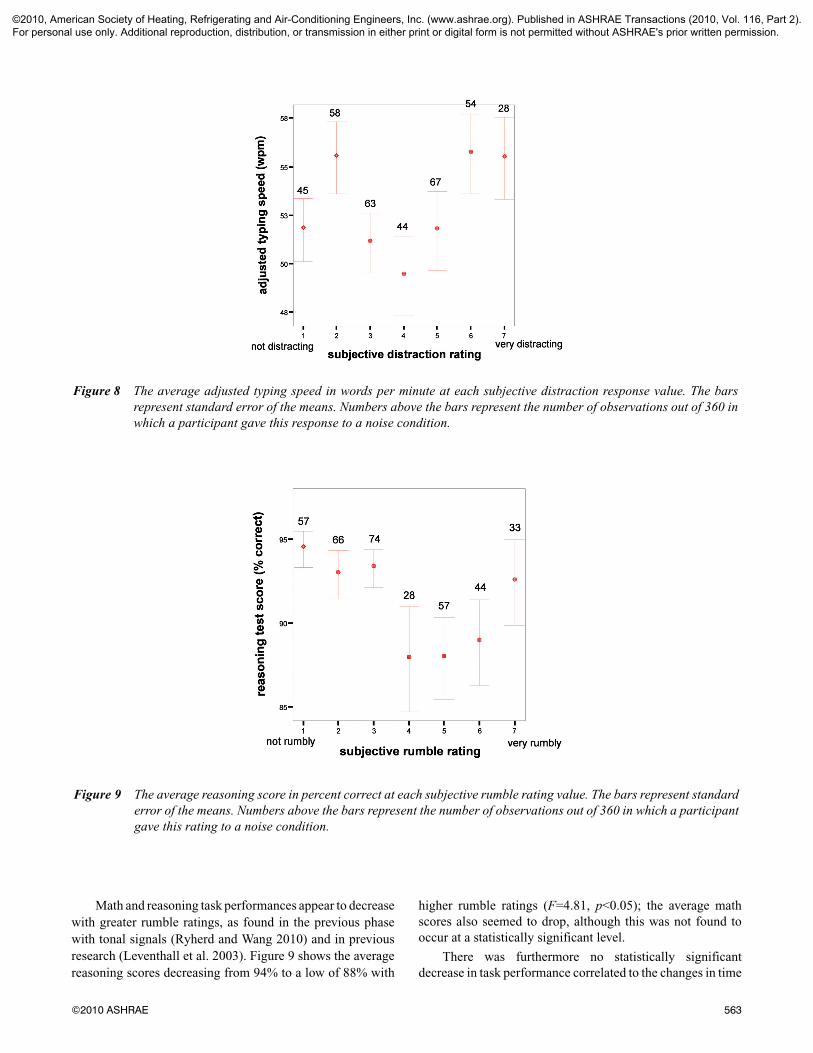
significant fashion with regards to noise conditions (Bowden and Wang 2005, Ryherd and Wang 2007). Such a relationship was statistically tested using a linear mixed model in SPSS. Results show that there are very few significant relationships between performance and perception in this investigation. Typing scores did not significantly decrease with any subjec-tive rating or response, unlike in previous phases of this research (Ryherd and Wang 2010). Figure 8 shows an example of the typing scores in relation to distraction responses. (Note that the number above each standard error of the mean bar in Figures 8-10 indicates the number out of 360 observations that some participant assigned that rating.)
Figure 6 Subjective changes-in-time ratings of the various noise conditions, averaged across all subjects. The bars represent the standard error of the means.
Figure 7 Subjective annoyance responses to the various noise conditions, averaged across all subjects. The bars represent the standard error of the means.
©2010, American Society of Heating, Refrigerating and Air-Conditioning Engineers, Inc. (www.ashrae.org). Published in ASHRAE Transactions (2010, Vol. 116, Part 2). For personal use only. Additional reproduction, distribution, or transmission in either print or digital form is not permitted without ASHRAE's prior written permission.
©2010 ASHRAE 563
Math and reasoning task performances appear to decrease with greater rumble ratings, as found in the previous phase with tonal signals (Ryherd and Wang 2010) and in previous research (Leventhall et al. 2003). Figure 9 shows the average reasoning scores decreasing from 94% to a low of 88% with
higher rumble ratings (F=4.81, p<0.05); the average math scores also seemed to drop, although this was not found to occur at a statistically significant level.
There was furthermore no statistically significant decrease in task performance correlated to the changes in time
Figure 8 The average adjusted typing speed in words per minute at each subjective distraction response value. The bars represent standard error of the means. Numbers above the bars represent the number of observations out of 360 in which a participant gave this response to a noise condition.
Figure 9 The average reasoning score in percent correct at each subjective rumble rating value. The bars represent standard error of the means. Numbers above the bars represent the number of observations out of 360 in which a participant gave this rating to a noise condition.
©2010, American Society of Heating, Refrigerating and Air-Conditioning Engineers, Inc. (www.ashrae.org). Published in ASHRAE Transactions (2010, Vol. 116, Part 2). For personal use only. Additional reproduction, distribution, or transmission in either print or digital form is not permitted without ASHRAE's prior written permission.
564 ASHRAE Transactions
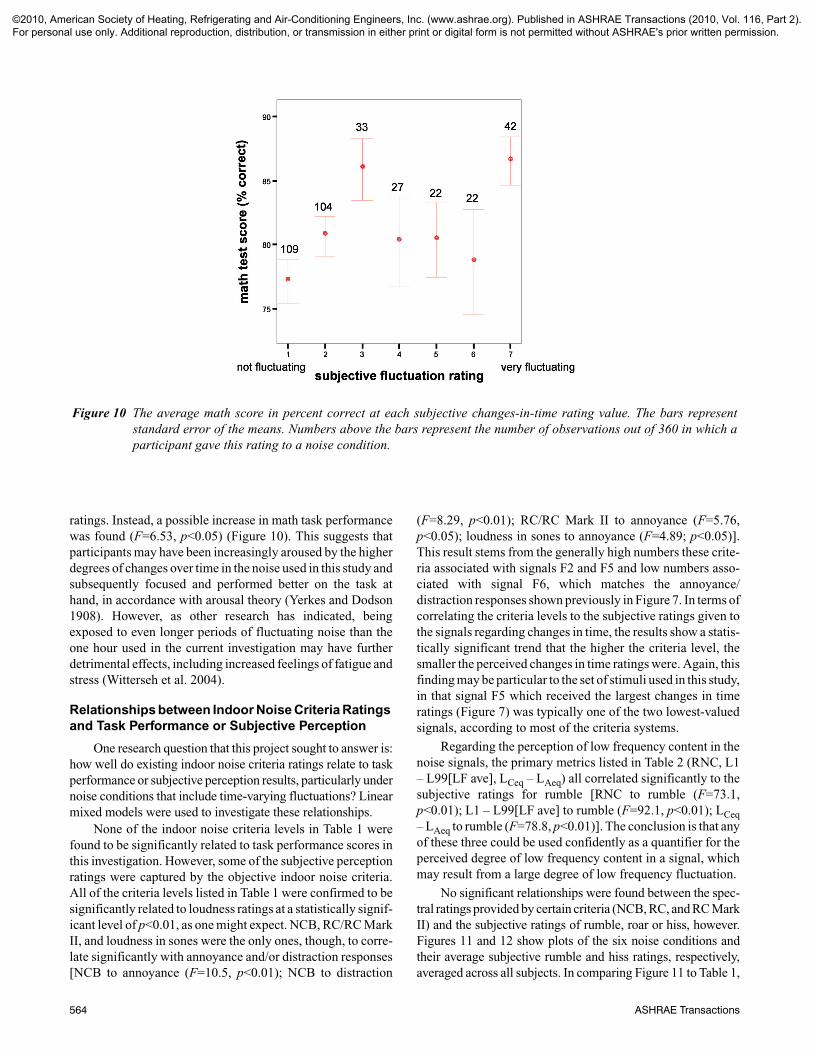
ratings. Instead, a possible increase in math task performance was found (F=6.53, p<0.05) (Figure 10). This suggests that participants may have been increasingly aroused by the higher degrees of changes over time in the noise used in this study and subsequently focused and performed better on the task at hand, in accordance with arousal theory (Yerkes and Dodson 1908). However, as other research has indicated, being exposed to even longer periods of fluctuating noise than the one hour used in the current investigation may have further detrimental effects, including increased feelings of fatigue and stress (Witterseh et al. 2004).
Relationships between Indoor Noise Criteria Ratings and Task Performance or Subjective Perception
One research question that this project sought to answer is: how well do existing indoor noise criteria ratings relate to task performance or subjective perception results, particularly under noise conditions that include time-varying fluctuations? Linear mixed models were used to investigate these relationships.
None of the indoor noise criteria levels in Table 1 were found to be significantly related to task performance scores in this investigation. However, some of the subjective perception ratings were captured by the objective indoor noise criteria. All of the criteria levels listed in Table 1 were confirmed to be significantly related to loudness ratings at a statistically signif-icant level of p<0.01, as one might expect. NCB, RC/RC Mark II, and loudness in sones were the only ones, though, to corre-late significantly with annoyance and/or distraction responses [NCB to annoyance (F=10.5, p<0.01); NCB to distraction
(F=8.29, p<0.01); RC/RC Mark II to annoyance (F=5.76, p<0.05); loudness in sones to annoyance (F=4.89; p<0.05)]. This result stems from the generally high numbers these crite-ria associated with signals F2 and F5 and low numbers asso-ciated with signal F6, which matches the annoyance/distraction responses shown previously in Figure 7. In terms of correlating the criteria levels to the subjective ratings given to the signals regarding changes in time, the results show a statis-tically significant trend that the higher the criteria level, the smaller the perceived changes in time ratings were. Again, this finding may be particular to the set of stimuli used in this study, in that signal F5 which received the largest changes in time ratings (Figure 7) was typically one of the two lowest-valued signals, according to most of the criteria systems.
Regarding the perception of low frequency content in the noise signals, the primary metrics listed in Table 2 (RNC, L1 – L99[LF ave], LCeq – LAeq) all correlated significantly to the subjective ratings for rumble [RNC to rumble (F=73.1, p<0.01); L1 – L99[LF ave] to rumble (F=92.1, p<0.01); LCeq– LAeq to rumble (F=78.8, p<0.01)]. The conclusion is that any of these three could be used confidently as a quantifier for the perceived degree of low frequency content in a signal, which may result from a large degree of low frequency fluctuation.
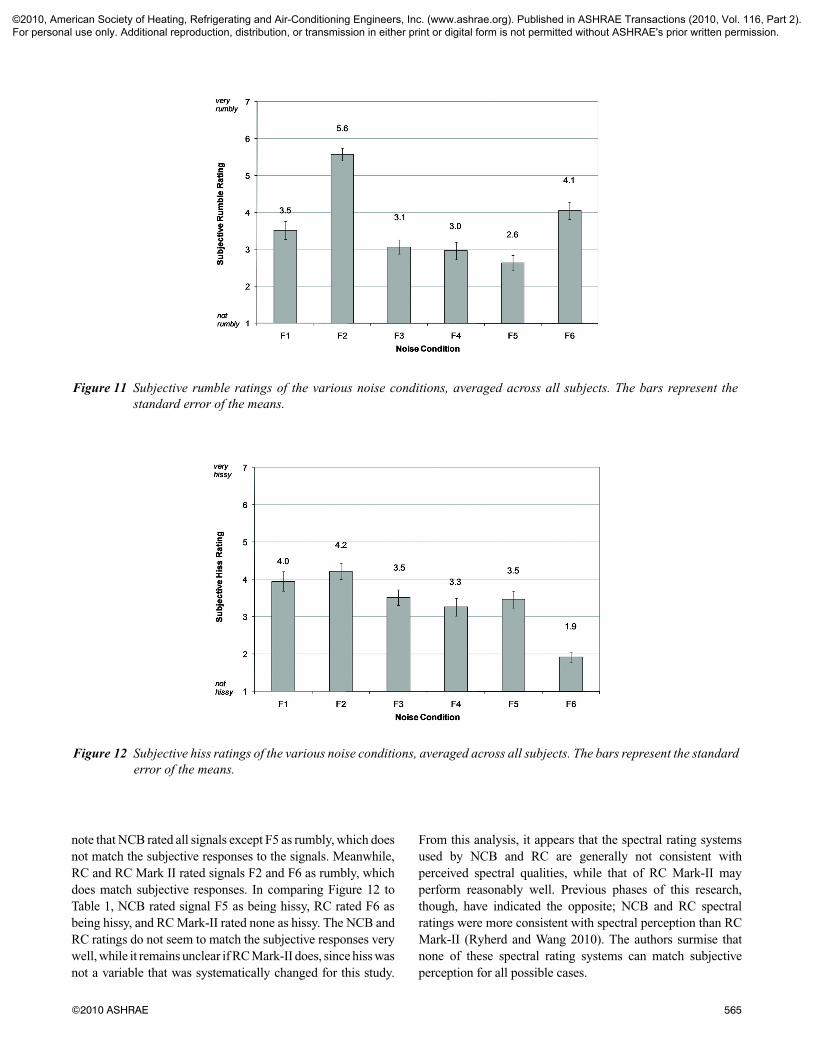
No significant relationships were found between the spec-tral ratings provided by certain criteria (NCB, RC, and RC Mark II) and the subjective ratings of rumble, roar or hiss, however. Figures 11 and 12 show plots of the six noise conditions and their average subjective rumble and hiss ratings, respectively, averaged across all subjects. In comparing Figure 11 to Table 1,
Figure 10 The average math score in percent correct at each subjective changes-in-time rating value. The bars represent standard error of the means. Numbers above the bars represent the number of observations out of 360 in which a participant gave this rating to a noise condition.
©2010, American Society of Heating, Refrigerating and Air-Conditioning Engineers, Inc. (www.ashrae.org). Published in ASHRAE Transactions (2010, Vol. 116, Part 2). For personal use only. Additional reproduction, distribution, or transmission in either print or digital form is not permitted without ASHRAE's prior written permission.
©2010 ASHRAE 565
note that NCB rated all signals except F5 as rumbly, which does not match the subjective responses to the signals. Meanwhile, RC and RC Mark II rated signals F2 and F6 as rumbly, which does match subjective responses. In comparing Figure 12 to Table 1, NCB rated signal F5 as being hissy, RC rated F6 as being hissy, and RC Mark-II rated none as hissy. The NCB and RC ratings do not seem to match the subjective responses very well, while it remains unclear if RC Mark-II does, since hiss was not a variable that was systematically changed for this study.
From this analysis, it appears that the spectral rating systems used by NCB and RC are generally not consistent with perceived spectral qualities, while that of RC Mark-II may perform reasonably well. Previous phases of this research, though, have indicated the opposite; NCB and RC spectral ratings were more consistent with spectral perception than RC Mark-II (Ryherd and Wang 2010). The authors surmise that none of these spectral rating systems can match subjective perception for all possible cases.
Figure 11 Subjective rumble ratings of the various noise conditions, averaged across all subjects. The bars represent the standard error of the means.
Figure 12 Subjective hiss ratings of the various noise conditions, averaged across all subjects. The bars represent the standard error of the means.
©2010, American Society of Heating, Refrigerating and Air-Conditioning Engineers, Inc. (www.ashrae.org). Published in ASHRAE Transactions (2010, Vol. 116, Part 2). For personal use only. Additional reproduction, distribution, or transmission in either print or digital form is not permitted without ASHRAE's prior written permission.
566 ASHRAE Transactions
DISCUSSION AND SUMMARY
The results of this project can help to answer two central questions, regarding noise characteristics of building mechan-ical systems, subjective perception, and task performance. The first is: which noise characteristics are linked to higher annoy-ance and distraction responses? Among the noise characteris-tics surveyed, it was found that loudness perception is most closely linked to annoyance/distraction, followed by the perception of roar, rumble and time-varying fluctuations in the noise. (Recall that annoyance and distraction responses were highly correlated to each other in this study.) Consequently, in designing commercial office buildings, the degree of loud-ness, roar, rumble and time-varying fluctuations in the back-ground noise should be minimized to optimize worker comfort. Particularly with regards to changes in time, signals louder than 50 dBA with excessive low frequency content and signals with larger timescale variations, such as the heat pump cycling on and off every 30 seconds, were generally perceived in this project as more annoying that the others tested, but more research is suggested to investigate a wider range of timescale variations.
The second question is: which noise characteristics are linked to lower task performance scores? While none of the typing or math/reasoning scores were found in this study to be negatively correlated to the degree of time-varying fluctua-tions in the noise conditions, there was indication that signals perceived to be more rumbly generally produced lower perfor-mance on math/reasoning tasks. In the previous phase of ASHRAE 1322-RP research involving noise signals with varying degrees of tonalness (Ryherd and Wang 2010), similar findings were found: the perceived degree of loudness, roar, rumble and tones in the background noise were most closely linked to annoyance/distraction, and signals perceived to be more rumbly generally produced lower performance on typing and math/reasoning tasks. Consequently, the authors conclude that the degree of low frequency rumble should be minimized in background noise conditions of offices, not only for occu-pant comfort but also for improved performance.
In general, the currently used indoor noise criteria listed in Table 1 do not significantly relate to task performance scores. Subjectively, they all do well in rating loudness perception when level differences are obvious, but spectral quality ratings of rumble, roar, hiss are sometimes inconsistent with subjective perception. Similar results were found in the previous phase of ASHRAE 1322-RP research (Ryherd and Wang 2010).
Based on the findings from the multiple phases of the ASHRAE 1322-RP project, the authors conclude by summa-rizing how the results influence what may be considered an ‘ideal’ indoor noise criteria method, particularly for noise from building mechanical systems – ‘ideal’ in that the method matches human perception and links to human task perfor-mance. An ‘ideal’ methodology for rating indoor noise should do well in assessing (1) loudness (linked to roar perception), (2) rumble, and the presence of (3) time-varying fluctuations and (4) tones. This research has found that, while all the crite-
ria listed in Table 1 differentiate well between obvious sound level differences, the most sensitive ratings of level are provided by the A-weighted equivalent sound level (LAeq) or a sones rating. Consequently, an ‘ideal’ criteria should start with such a value. Spectral characteristics are next in impor-tance, particularly that of excessive low frequency rumble when the level of the noise signal is greater than 50 dBA, according to this project (although more research is suggested to confirm this). Exceedances from some mid-frequency aver-age curve, as used in the RC methodology, may be reasonably (but not consistently) linked to the perception of this spectral imbalance. Since the three other metrics studied in this research (RNC, L1 – L99[LF ave], and LCeq – LAeq) all corre-lated highly to the perceived degree of low frequency rumble in a signal, though, the authors suggest that they would provide more consistent information regarding low frequency content.
For a ‘survey’ method, LCeq – LAeq would be suitable, as these values are easily gathered from sound level meters at the same time as an A-weighted equivalent sound pressure level. Based on the signals used in this study, signals whose measured LAeq is greater than 50 dBA and whose measured LCeq – LAeq value is greater than 20 dB are of great concern; the cutoff of 20 dB for LCeq – LAeq is in line with Broner and Leventhall’s original suggestion (1983). For a more precise ‘engineering’ method, L1 – L99 should be calculated in one-third octave bands from samples taken at least every 125 ms over a specified time period (two minutes in this study), and a low frequency energy average across the 12.5 Hz to 160 Hz one-third octave bands of 50 dB or lower would be required to minimize annoyance and influence on task performance. L1 – L99 may even be a more broadly useful quantity, as it could also be used to quantify the degree of fluctuations in other frequency ranges; for example, signal F5 which had a larger timescale fluctuation from cycling the heat pump on and off would demonstrate a high L1 – L99 value in the mid frequen-cies. So acquiring L1 – L99 data across the audible frequency range could give a clearer idea of not only low frequency fluc-tuations, but also fluctuations in the signal at larger timescales. More research is needed to quantify further guidelines for time-varying fluctuations to minimize their negative effects on human perception and task performance.
As for detection of tones, the signals tested by Ryherd and Wang included those with prominence ratios (PR) of 5 or 9 at one of three different frequencies found in building mechani-cal systems (2010), and those with the higher PR were found to be more annoying/distracting than the others. Updates to Annex A of ANSI S1.13 (2005a) have been made now, though, which state that the prominence ratios for tones at lower frequency ranges (under 1000 Hz) are even higher than those tested in this research, in the 9 to 19 dB range. To calculate tonalness metrics such as prominence ratio requires narrow-band data, but a significant tonal problem could perhaps be diagnosed from one-third octave band data. For example, if the level in any one-third octave band exceeds both of its neigh-bors by some set amount (at least 12 dB for the PR=9 signals
©2010, American Society of Heating, Refrigerating and Air-Conditioning Engineers, Inc. (www.ashrae.org). Published in ASHRAE Transactions (2010, Vol. 116, Part 2). For personal use only. Additional reproduction, distribution, or transmission in either print or digital form is not permitted without ASHRAE's prior written permission.
©2010 ASHRAE 567
tested in 1322-RP), then that band could be highlighted as possibly having a problematic tone. Again, further research is recommended towards defining more specific levels of tonal-ness metrics to ensure that they correlate with perception and possibly task performance.
ACKNOWLEDGMENTS
The authors would like to thank Marc Choiniere, Megan Christensen, and Jennifer Reisdorff for their research assis-tance on this project, as well as Warren Blazier Jr., Dr. Norm Broner, and Dr. J. Adin Mann III for providing recordings of mechanical system noise with time-varying fluctuations.
REFERENCES
ANSI. 2005a. ANSI S1.13: Measurement of Sound Pressure Levels in Air. Melville, NY: Acoustical Society of America.
ANSI. 2005b. ANSI S3.4: Procedure for the Computation of Loudness of Steady Sounds. Melville, NY: Acoustical Society of America.
ANSI. 2008. ANSI S12.2: Criteria for Evaluating Room Noise. Melville, NY: Acoustical Society of America.
ASHRAE. 2007. 2007 ASHRAE Handbook—HVAC Applica-tions, Chapter 47. Atlanta: American Society of Heat-ing, Refrigerating and Air-Conditioning Engineers, Inc.
Berglund, B., P. Hassmen, and R.F. Soames Job. 1996. Sources and effects of low frequency noise. J. Acoust. Soc. Am. 99(5):2985-3002.
Blazier, W.E. and C.E. Ebbing. 1992. Criteria for low fre-quency HVAC system noise control in buildings. Pro-ceedings of Internoise 2:761-766.
Bowden, E.E., and L.M. Wang. 2005. Relating human pro-ductivity and annoyance to indoor noise criteria sys-tems: a low frequency analysis. ASHRAE Transactions111(1):684–692.
Bradley, J.S. 1994. Annoyance caused by constant amplitude and amplitude modulated sounds containing rumble. Noise Control Eng. J. 42(6):203-208.
Broner, N. 2004. Final Report 879-RP: Determination of the Relationship Between Low-Frequency HVAC Noise and Comfort in Occupied Spaces. Atlanta: American Society of Heating, Refrigeration and Air-Condition-ing Engineers.
Broner, N., and H.G. Leventhall. 1983. Low frequency noise annoyance assessment by Low Frequency Noise Rating (LFNR) curves. J. Low Freq. Noise Vib. 2:20-28.
Eschenbrenner, A.J. 1971. Effects of intermittent noise on the performance of a complex psychomotor task. Hum. Factors 13(1):59-63.
Field, A., and G. Hole. 2003. How to Design and Report Experiments. London: Sage Publications.
Holmberg, K., U. Landström, and A. Kjellberg. 1993. Effects of ventilation noise due to frequency characteris-tic and sound level. J. Low Freq. Noise Vib. 16:115–122.
Holmberg, K., U. Landström, L. Söderberg, and A. Kjell-berg. 1996. Hygienic assessment of low frequency noise annoyance in working environments. J. Low Freq. Noise Vib. 15:7-16.
Holmberg, K., U. Landström, and A. Kjellberg. 1997. Low frequency noise level variations and annoyance in work-ing environments. J. Low Freq. Noise Vib. 16:81-88.
Jones, D., and D. Broadbent. 1998. Handbook of Acoustical Measurements and Noise Control, edited by C. Harris, Ch. 24. Melville, NY: Acoustical Society of America.
Kjellberg, A., M. Tesarz, K. Holmberg, and U. Landström. 1997. Evaluation of frequency-weighted sound level measurements for prediction of low-frequency noise annoyance. Environment International 23:519-527.
Kryter, K. 1985. The Effects of Noise on Man. New York: Academic Press.
Kyriakides, K., and H.G. Leventhall. 1977. Some effects of infrasound on task performance. J. Sound Vib. 50(3):369–388.
Landström, U., A. Kjellberg, L. Söderberg, and B. Nord-ström. 1991. The effects of broadband, tonal, and masked ventilation noise on performance, wakefulness and annoyance. J. Low Freq. Noise Vib. 10:112–122.
Leventhall, G., P. Pelmear, and S. Benton. 2003. A Review of Published Research on Low Frequency Noise and Its Effects. London: Defra Publications.
Mann III, J.A., J. Kading, and M.B. Pate. 2007. RP-1219 Final Report: Duct Rumble Noise Resulting from Aero-dynamic System Effects at the Discharge of a Centrifu-gal Fan. Atlanta: American Society of Heating, Refrigeration and Air-Conditioning Engineers.
Persson, K., and M. Björkman. 1988. Annoyance due to low frequency noise and the use of the dB(A) scale. J. Sound Vib. 127:491-497.
Persson, K., M. Björkman, and R. Rylander. 1985. An exper-imental evaluation of annoyance due to low frequency noise. J. Low Freq. Noise Vib. 4(4):145–153.
Persson Waye, K., J. Bengtsson, A. Kjellberg, and S. Benton. 2001. Low frequency noise “pollution” interferes with performance. Noise & Health 4(13):33–49.
Persson Waye, K., and R. Rylander. 2001. The prevalence of annoyance and effects after long-term exposure to low-frequency noise. J. Sound Vib. 240(3):483–487.
Persson Waye, K., R. Rylander, S. Benton, and H.G. Leven-thall. 1997. Effects on performance and work quality due to low frequency ventilation noise. J. Sound Vib. 205(4):467–474.
Ryherd, E.E., and L.M. Wang. 2007. Effects of exposure duration and type of task on subjective performance and perception in noise. Noise Control Eng. J.55(3):334-347.
Ryherd, E.E., and L.M. Wang. 2010. The effects of noise from building mechanical systems with tonal compo-nents on human performance and perception (1322-RP). Accepted for publication in ASHRAE Transactions.
©2010, American Society of Heating, Refrigerating and Air-Conditioning Engineers, Inc. (www.ashrae.org). Published in ASHRAE Transactions (2010, Vol. 116, Part 2). For personal use only. Additional reproduction, distribution, or transmission in either print or digital form is not permitted without ASHRAE's prior written permission.

568 ASHRAE Transactions
Schomer, P.D. 2000. Proposed revisions to room noise crite-ria. Noise Control Eng. J. 48(3):85-96.
Schomer, P.D., and J.S. Bradley. 2000. A test of proposed revisions to room noise criteria curves. Noise Control Eng. J. 48(4):124-129.
Weinstein, N.D. 1977. Noise and intellectual performance: a confirmation and extension. J. Appl. Psychol. 62(1):104-107.
Witterseh, T., D.P. Wyon, and G. Clausen. 2004. The effects of moderate heat stress and open-plan office noise dis-traction on SBS symptoms and the performance of office work. Indoor Air 14(8): 30-40.
Yerkes, R.M., and J.D. Dodson. 1908. The relation of strength of stimulus to rapidity of habit-formation. J. of Comparative Neurology and Psych. 18: 459-482.
©2010, American Society of Heating, Refrigerating and Air-Conditioning Engineers, Inc. (www.ashrae.org). Published in ASHRAE Transactions (2010, Vol. 116, Part 2). For personal use only. Additional reproduction, distribution, or transmission in either print or digital form is not permitted without ASHRAE's prior written permission.


![[ITIL SYSTEM METHODOL OGY ]](https://img.pdfslide.net/doc/110x75/624cd347964d7328d919e9f8/itil-system-methodol-ogy-.jpg)


