Embed Size (px)
Citation preview
1
Investigation of the binding of cis/trans-[MCl4(1H-indazole)(NO)] (M = Ru, Os) complexes
to human serum albumin
Orsolya Dömötöra,b, Anna Rathgebc, Paul-Steffen Kuhnc, Ana Popović-Bijelićd,*, Goran Bačićd,
Eva Anna Enyedya,*, Vladimir B. Arionc,*
aDepartment of Inorganic and Analytical Chemistry, University of Szeged, Dóm tér 7, H-6720
Szeged, Hungary
bMTA-SZTE Bioinorganic Chemistry Research Group, University of Szeged, Dóm tér 7, H-6720
Szeged, Hungary
cUniversity of Vienna, Institute of Inorganic Chemistry, Währinger Strasse 42, A-1090 Vienna,
Austria
dEPR laboratory, Faculty of Physical Chemistry, University of Belgrade, Studentski trg 12-16,
11158 Belgrade, Serbia
Keywords: Nitrosyl; Antitumor activity; Albumin binding; Fluorometry; EPR spin labeling
ABSTRACT
Overall binding affinity of sodium or indazolium cis/trans-[MCl4(1H-indazole)(NO)] (M = Ru,
Os) complexes towards human serum albumin (HSA) and high molecular mass components of
the blood serum was monitored by ultrafiltration. HSA was found to be mainly responsible for
the binding of the studied ruthenium and osmium complexes. In other words, this protein can
provide a depot for the compounds and can affect their biodistribution and transport processes. In
order to elucidate the HSA binding sites tryptophan fluorescence quenching studies and
displacement reactions with the established site markers warfarin and dansylglycine were
performed. Conditional stability constants for the binding to sites I and II on HSA were computed
showing that the studied ruthenium and osmium complexes are able to bind into both sites with
moderately strong affinity (logK’ = 4.4‒5.1). Site I is slightly more favored over site II for all
complexes. No significant differences in the HSA binding properties were found for these metal
complexes demonstrating negligible influence of the type of counter ion (sodium vs. indazolium),
the metal ion center identity (Ru vs. Os) or the position of the nitrosyl group on the binding
2
event. Electron paramagnetic resonance spin labeling of HSA revealed that indazolium trans-
[RuCl4(1H-indazole)(NO)] and long-chain fatty acids show competitive binding to HSA.
Moreover, this complex has a higher affinity for site I, but when present in excess, it is able to
bind to site II as well, and displace fatty acids.
* Corresponding Authors.
E-mail addresses: [email protected] (A. Popović-Bijelić), [email protected] (E.A. Enyedy);
[email protected] (V.B. Arion)
3
1. Introduction
The compound cis-[PtCl2(NH3)2] (cisplatin) is still recognized as the most prominent
metal-based drug in treatment of various types of cancer and is used nowadays mostly in
combination chemotherapy. Although the importance of cisplatin and the other two platinum(II)-
based worldwide approved oncology drugs, carboplatin and oxaliplatin, in this area is
indisputable, the observed adverse effects and sensitivity to resistance mechanisms strongly
motivate the investigation of complexes of other metals, and, in particular, ruthenium, osmium,
gallium, copper, iron etc. which exhibit marked antitumor activity, with the hope to overcome the
encountered limitations [1,2]. Numerous metal complexes have been synthesized and tested as
potential anticancer or antimetastatic agents. Some of them have entered phase I or II clinical
trials, namely indazolium trans-[tetrachloridobis(1H-indazole)ruthenate(III)] (KP1019) [3] and
its sodium salt (NKP-1339/IT-139) with an increased water solubility [4], imidazolium trans-
[tetrachloride-dimethylsulfoxide-imidazole-ruthenate(III)] (NAMI-A) [5] or [tris(8-
quinolinolato)gallium(III)] (KP46) [6]. While the organometallic ruthenium(II)-arene complex
[Ru(η6-p-cymene)Cl2(pta)] (pta = 1,3,5-triaza-7-phosphatricyclo-[3.3.1.1]decane) shows anti-
metastatic properties and it is a promising compound for translation to clinical evaluation [7].
Interaction of anticancer metallodrugs with proteins is of considerable interest as it might
have strong influence on processes that are crucial for the biodistribution, the toxicity and the
mechanism of action. Among the blood proteins, human serum albumin (HSA) is the most
abundant (~630 mM) and can serve as a transport vehicle for various compounds including fatty
acids (FAs), bilirubin, steroids, metal ions, and various pharmaceuticals [8]. There are seven
distinct binding sites on HSA for long-chain FAs (FA1 – FA7) distributed throughout the protein
in an asymmetric way [8], of which FA2, FA4, and FA5 are the highest affinity sites, as indicated
by crystallographic studies [9]. The principal regions of exogenous drug binding sites are located
in hydrophobic pockets in subdomains IIA and IIIA (site I and site II, respectively according to
the conventional view based on Sudlow’s classification) [8,10], and in the recently identified
binding pocket within subdomain IB (site III) which is considered as the third major binding site
[11]. Three of the seven FA binding sites overlap with the two main drug binding sites, namely
FA3 and FA4 overlap with site II, and FA7 with site I [8,12]. Therefore, competition between the
drugs and FAs for the same binding sites is possible, although cooperativity, or even lack of
competition have been observed in some cases [13].
4
On the other hand, binding of a drug to HSA not merely affects the biodistribution, but
can be an operative way of selective tumor targeting. Since HSA and HSA-bound drugs can
accumulate in malignant and inflamed tissues such as solid tumors, due to the enhanced
permeability and retention effect originated from the leaky capillaries combined with absent or
defective lymphatic drainage system [14]. Therefore, interaction with albumin can be exploited
for tumor targeting as well.
Detailed studies on the interaction of the ruthenium(III) complexes KP1019 and its
sodium analogue (KP1339) with HSA were reported previously [15]. Both metallodrugs were
found to bind into sites I and II with moderately strong affinity and this binding event is rather
fast, taking place within several minutes. Data also indicated that there is no preference for either
binding site, and that the counterion has only little effect on the binding event.
Ruthenium- and osmium-nitrosyl complexes with azole heterocycles were recently
reported to show striking differences in their antiproliferative activity. The ruthenium compounds
were found 9–18 times more active in vitro compared to their osmium analogues, showing IC50
values in the low micromolar concentration range [16]. Substitution of the non-innocent nitric
oxide ligand by a carbon monoxide one was also realized in the case of ruthenium azole
complexes [17]. However, ruthenium-carbonyl complexes displayed a markedly reduced
antiproliferative activity in vitro. The observed differences and elucidation of the underlying
mechanisms responsible for them have attracted our attention prompting us to investigate first
their interaction with HSA.
Herein we report on the studies of the hydrolytic stability of mononitrosyl and
monocarbonyl complexes cis/trans-[MCl4(1H-indazole)(NO)]‒ (M = Ru, Os) and trans-
[RuCl4(1H-indazole)(CO)]‒ (Chart 1, complexes 16) and the interaction of these mononitrosyl
compounds with HSA by fluorescence spectroscopy and separation methods, as well as by
electron paramagnetic resonance (EPR) spectroscopy using a spin labeled fatty acid (SLFA). This
is an efficient and widely used method for studying the binding of FAs to albumin [18‒23], as
well as the competition between FAs and other compounds although its application for metal
complexes is fairly rare in the literature [24]. Furthermore, displacement experiments with well-
established markers for sites I and II, namely warfarin (WF) and dansylglycine (DG),
respectively, were also performed and the data is discussed.
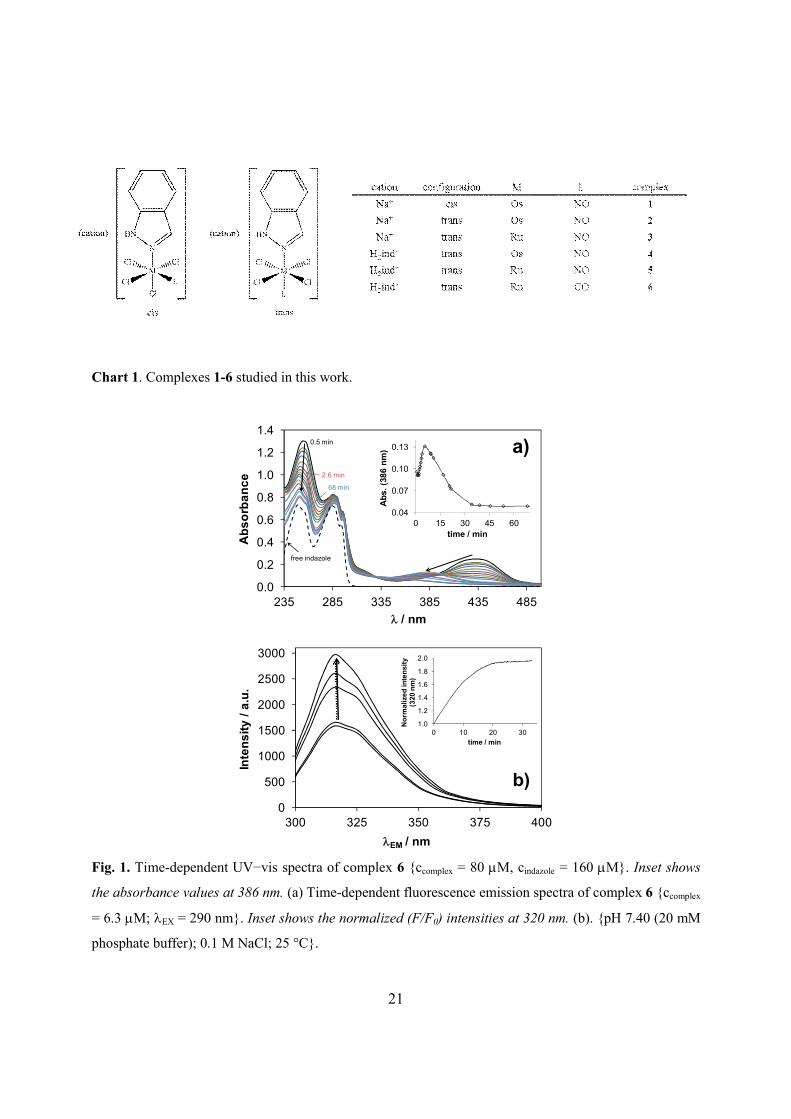
Chart 1
5
2. Experimental
2.1. Chemicals
Racemic WF, DG, HSA (as lyophilized powder with fatty acids, A1653 and defatted HSA
used for the EPR spin labeling experiments, A3782) and serum (from human male AB plasma,
H4522), 2,2’-dithiodipyridine (2,2’-DTDP), NaH2PO4, Na2HPO4, NaCl and dimethylsulfoxide
(DMSO) were obtained from Sigma-Aldrich in puriss quality. Doubly distilled Milli-Q water was
used for sample preparations. HSA solution was freshly prepared before the experiments and its
concentration was estimated from its UV absorption: 280 nm(HSA) = 36850 M−1cm−1 [25].
Solutions of WF and DG were prepared prior to the analyses with one equivalent of NaOH and
their concentrations were calculated on the basis of their UVvisible (UV‒vis) spectra: 308
nm(WF) = 14475 M−1cm−1, 327 nm(DG) = 5068 M−1cm−1 [15]. All samples were prepared at 25 °C
in 20 mM phosphate buffer (pH 7.40) containing 0.10 M NaCl. Complexes 1, 2, 4, 5 and 6 were
prepared as described recently [16,17].
2.2. Synthesis of sodium trans-[RuCl4(1H-indazole)(NO)]∙2.5H2O (3)
Indazolium trans-[RuCl4(1H-indazole)(NO)] (complex 5) [16] (100 mg, 0.20 mmol) was
dissolved in water (15 mL) and stirred with preconditioned (30 min) Dowex Marathon C
exchange resin (2 g) in water (20 mL) for 2 h. Then the resin was filtered off and the product was
lyophilised. Yield: 80%. Anal. Calcd for C7H11Cl4NaN3O3.5Ru (M = 459.05 g/mol): C, 18.31; H,
2.42; N, 9.15. Found: C, 18.25; H, 1.98; N, 8.91. ESI-MS in MeOH (negative): m/z 391
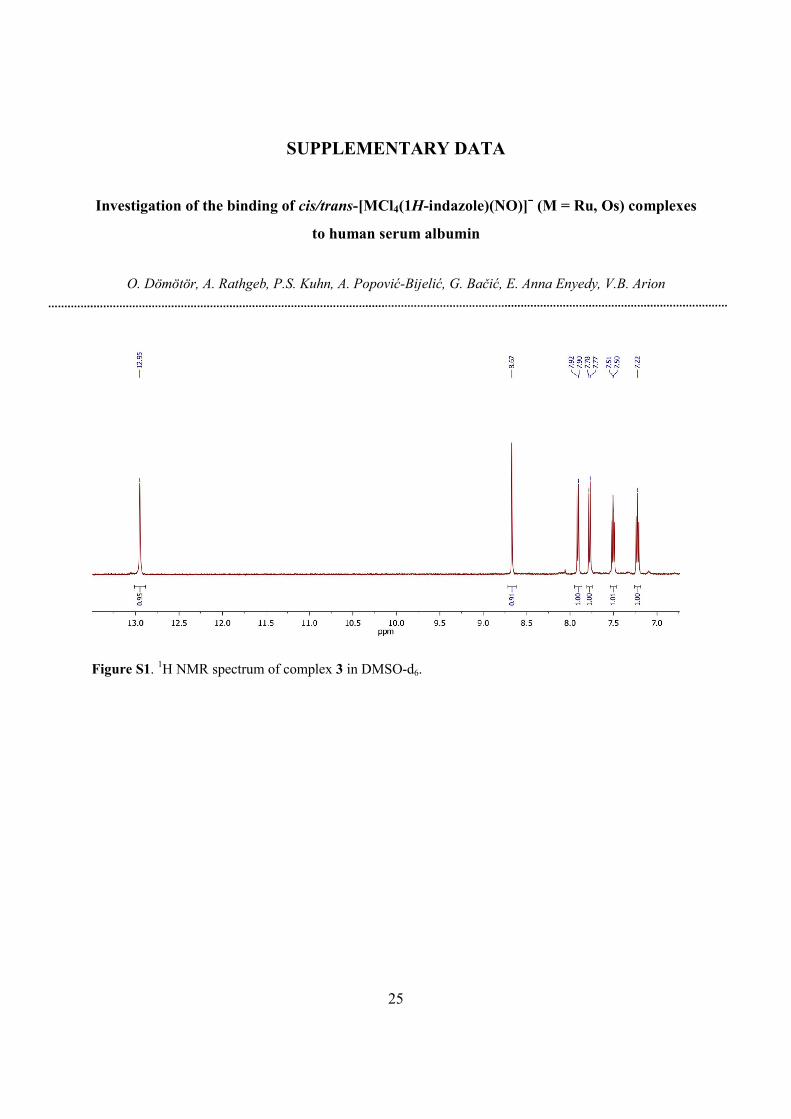
[RuCl4(NO)(Hind)]‒. 1H NMR (DMSO-d6, 500.26 MHz): δ 7.22 (t, 1H, J = 8 Hz),
7.51 (t, 1H, J = 8 Hz), 7.78 (d, 1H, J = 9 Hz), 7.91 (d, 1H, J = 9 Hz), 8.67 (s, 1H), 12.95 (s, 1H)
ppm (Fig. S1).
2.3. Spectrophotometric and spectrofluorometric measurements
Stability of the complexes was followed using UV‒vis spectrophotometry. Complexes
1‒6 were dissolved in 1% (v/v) DMSO/H2O at 100 mM concentration in 20 mM phosphate buffer
at pH 7.40 containing 0.10 M NaCl, and followed up over 24 h. A Hewlett Packard 8452A
spectrophotometer was used to record the spectra in the region of 200‒800 nm using 1 cm path
length at 25 °C.
6
Fluorescence spectra were recorded on a Hitachi-F4500 fluorometer in 1 cm quartz cell at
25 °C. All solutions were prepared in 20 mM phosphate buffer (pH 7.40) containing 0.10 M
NaCl and were incubated for 2 h. Samples always contained 1 mM HSA and various HSA-to-
metal complex 1‒5 ratios (from 1:0 to 1:20) were used. In the site marker displacement
experiments the HSA-to-site marker (WF or DG) ratio was always 1:1 and the concentration of
the metal complexes was varied (from 1 to 30 equiv). The excitation wavelengths were 295, 310
or 335 nm for quenching, WF and DG displacement experiments, respectively. Emission
intensities were detected in the range of 300‒600 nm according to the given system using 5 nm/5
nm slit width. The conditional binding constants were calculated based on the equilibrium
processes and mass-balance equations for the components detailed in the Supplementary data
using PSEQUAD software [26]. Three-dimensional spectra were recorded at 210‒350 nm
excitation and 230-450 nm emission wavelengths.
A correction for inner filter effect and self-absorbance was necessary since fluorescence is
significantly absorbed by the metal complexes at higher concentrations. The correction was
carried out according to the equation (1) [27]:
Fcorrected = Fmeasured × 10(A(EX) + A(EM)) / 2 (1)
where Fcorrected and Fmeasured are the corrected and measured fluorescence intensities, and A(EX)
and A(EM) are the absorptivities at the excitation and emission wavelengths in the samples,
respectively.
2.4. Membrane ultrafiltration−UVvis measurements
Serum or HSA containing samples (0.50 mL) were separated by ultrafiltration through 10
kDa membrane filters (Microcon YM-10 centrifugal filter unit, Millipore) into low molecular
mass (LMM) and high molecular mass (HMM) fractions by using a temperature controlled
centrifuge (Sanyo, 10000/s, 5-10 min). The human blood serum was diluted 1:4 with the
incubation buffer (20 mM phosphate buffer, pH 7.4, 0.1 M NaCl). In these diluted serum samples
the concentration of HSA and the metal complex was ~160 mM and 80 mM, respectively.
Samples contained 0, 50, 160 or 630 mM HSA and 50‒320 mM metal complexes dissolved in the
incubation buffer, and various HSA-to-complex ratios were applied (see Table 1). All samples
7
were incubated for 2 h prior to the separation at 25 °C. The LMM fractions containing the
unbound metal complex were separated from HSA (or serum proteins in case of serum) and
adducts [HSA‒metal complex] (or [protein‒metal complexes]) in the HMM fractions. The LMM
fractions were diluted to 0.50 mL and the concentration of the unbound complex was determined
by UV‒vis spectrophotometry. The UV‒vis spectra of the LMM fractions were compared with
the reference spectra of the samples containing metal complex without the protein at the
concentration equal to that in the ultrafiltered samples. A Hewlett Packard 8452A
spectrophotometer was used to record the spectra in the region of 200‒700 nm at 25 °C and a
path length of 1 cm.
2.5. Interaction with Cys34 SH-group on HSA
The accessible thiol content of HSA was determined according to the 2,2’-DTDP protocol
described in our previous work in details [28]. Samples containing 100 mM HSA and 5‒120 mM
2,2’-DTDP in 0.10 M phosphate buffer (pH 7.00 at 25 °C) were incubated for 40 min prior to the
UV‒vis measurements. Thiol content of 100 mM HSA was calculated in the presence of
complexes 2 or 5 (1‒50 mM concentrations) in 20 mM phosphate buffer (pH 7.40) containing
0.10 M NaCl. Samples were incubated for 2.5 h at 25 °C prior to the addition of 78 mM 2,2’-
DTDP, and the UV‒vis spectra were recorded after 40 min.
2.6. Sample preparation for EPR measurements and EPR spectroscopy
Fatty-acid free, globulin-free HSA and 16-doxyl stearic acid (16DS) were obtained from
Sigma-Aldrich. HSA was dissolved in 0.9% NaCl, pH 7.40 phosphate-buffered saline (PBS) to a
final concentration of 160 µM. Complex 5 was dissolved in deionized water. The binding of the
complex to HSA was examined at HSA-to-complex ratios of 1:1 and 1:6. Appropriate amounts of
10 or 25 mM ethanol stock solution of 16DS were applied to the walls of Eppendorf sample tubes
and allowed to dry, as described previously [21]. A volume of 15 µL of a solution containing
HSA and complex 5, incubated for 2 h at 25 °C, was added to the sample tubes containing 16DS,
gently mixed, and after 30 min drawn into 5 cm long gas-permeable Teflon tubes (Zeus
industries, Raritan, NJ) for the EPR measurements. The samples used for calibration contained
80, 160, 240, 320, or 400 µM of 16DS in 0.9% NaCl, pH 7.40 PBS (Supplementary data).
Ethanol stock solution of 16DS (5, 10 or 25 mM) was applied to the walls of Eppendorf sample
8
tubes, allowed to dry and 15 µL of 0.9% NaCl, pH 7.40 PBS was subsequently added. Three
independent samples were prepared for each 16DS concentration.
The 9.5 GHz EPR spectra were recorded at room temperature on a Bruker Elexsys-II EPR
spectrometer. The experimental conditions were: microwave power 10 mW, modulation
amplitude 2 G, modulation frequency 100 kHz, and conversion time 240 ms. Spectra were
recorded and analyzed using Bruker Xepr software.
3. Results and Discussion
3.1. Preparation of the complexes 1−6
Synthesis of complexes 1, 2 and 4−6 was reported [16,17], while complex 3 was obtained
from 5 by metathesis reaction with sodium cation exchange resin (see Experimental section). The
complexes were prepared in order to investigate the effect of metal ion identity (Ru or Os), the
complex configuration (cis or trans), the type of counterion (Na+ or indazolium (H2ind+)) and the
effect of the “redox active” nitrosyl and “redox inert” carbonyl ligands on the hydrolytic stability
and interaction with HSA which may contribute to the understanding of the differences in their
bioactivity and underlying mechanisms responsible for it.
3.2. Hydrolytic stability of the complexes 15
It is well known that the structural analogues of the studied ruthenium and osmium
complexes, the ruthenium(III) containing KP1019 and KP1339 can undergo hydrolysis in
aqueous solutions with reaction kinetics depending on the pH, concentrations of hydrogen
carbonate and chloride ions in the incubation medium [29,30]. Therefore, the hydrolytic stability
of the nitrosyl complexes 15 was checked prior to the HSA binding studies. Taking into account
the concentration of chloride ions in human blood serum, our investigation was directed on the
hydrolytic processes at pH 7.40 in the presence of 0.10 M NaCl. The applied concentration of the
chloride ions corresponds to that of the human blood serum. The hydrolytic stability
measurements for complexes 1‒5 were done at 25 °C and for complexes 2 and 5 at 37 °C as well,
since the actual temperature may have an influence on the hydrolysis rate. The complexes studied
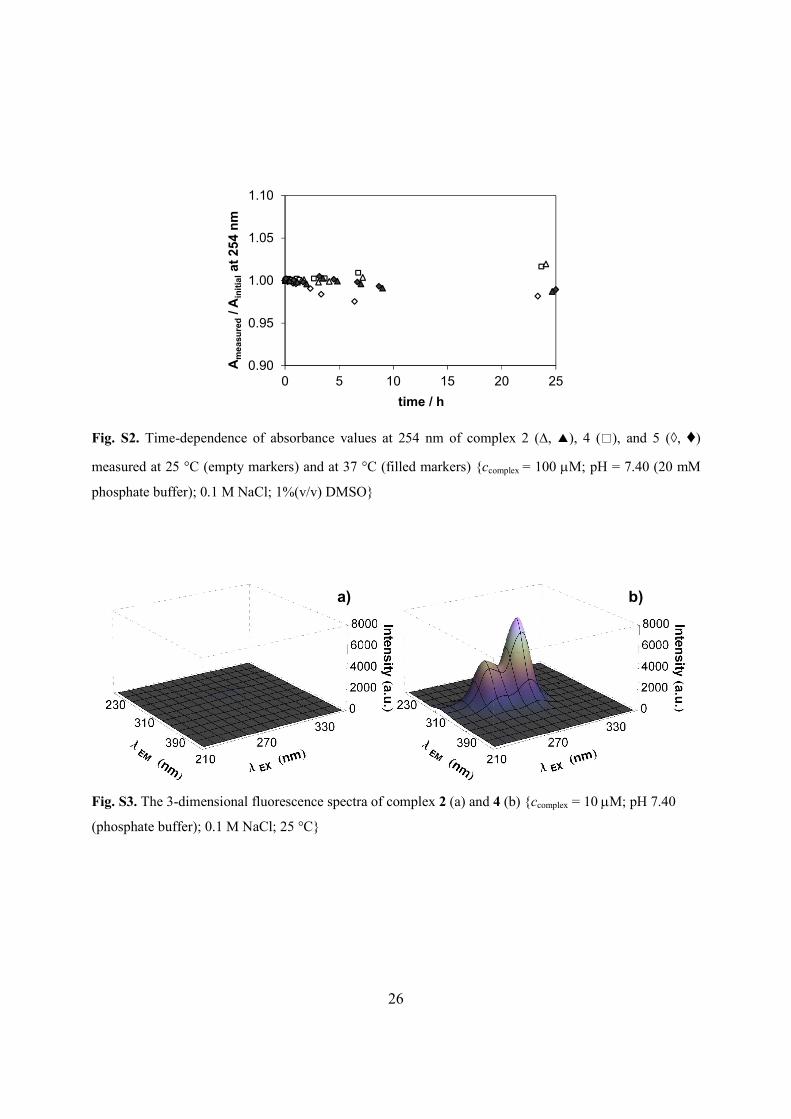
by UV−vis spectrophotometry were found to be stable for at least 24 h in the presence of 1%
(v/v) DMSO at both temperatures (Fig. S2). The generally easily hydrolyzing chlorido ligands in
the first coordination sphere of ruthenium or osmium seemed not to be exchanged by water
9
molecules (or hydroxides) within the given time frame. Most probably this behavior is due to the
presence of the coordinated nitrosyl group, the high inertness of the metal centers, especially in
case of the osmium complexes, and the hydrolysis suppressing effect of excess chloride ions
present.
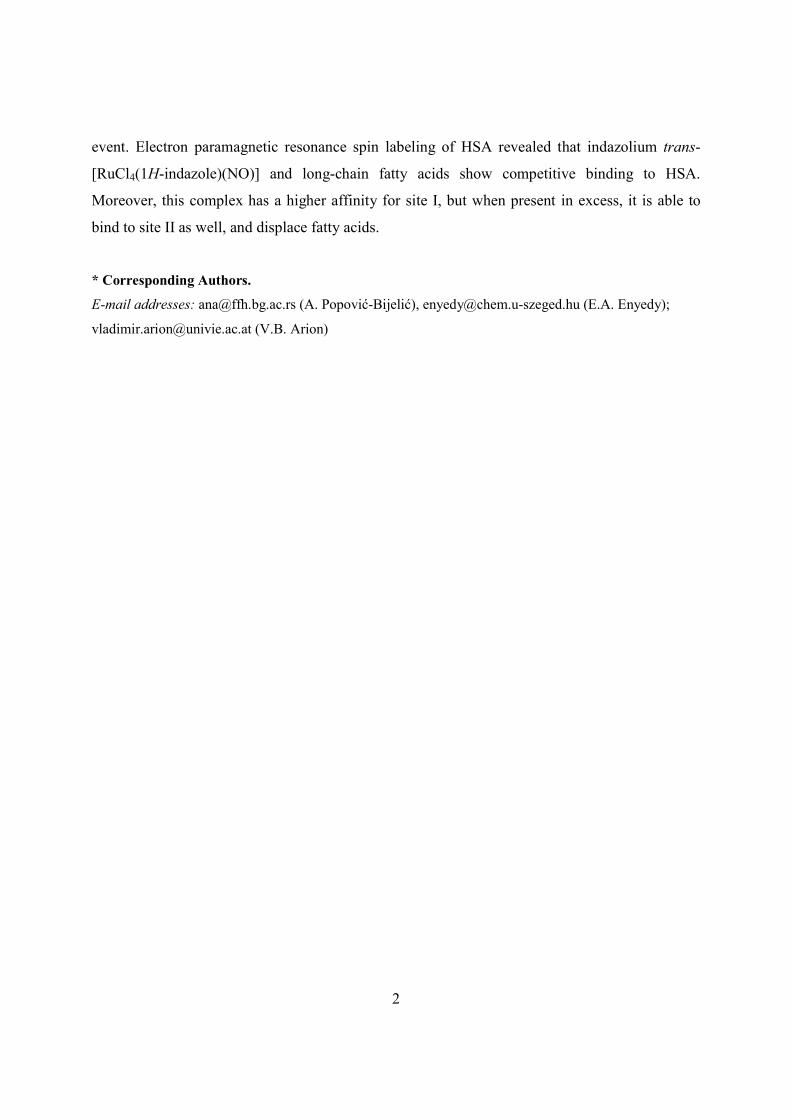
3.3. Hydrolytic stability of 6
Although this complex is structurally closely related to 1–5, the exchange of the nitrosyl
ligand by a carbonyl one affects dramatically its hydrolytic stability in aqueous media. In
particular, the time-dependent UVvis spectra indicate that this carbonyl compound starts to
decompose in non-buffered aqueous solution (pH ~ 3.8) slowly, while the spectral changes are
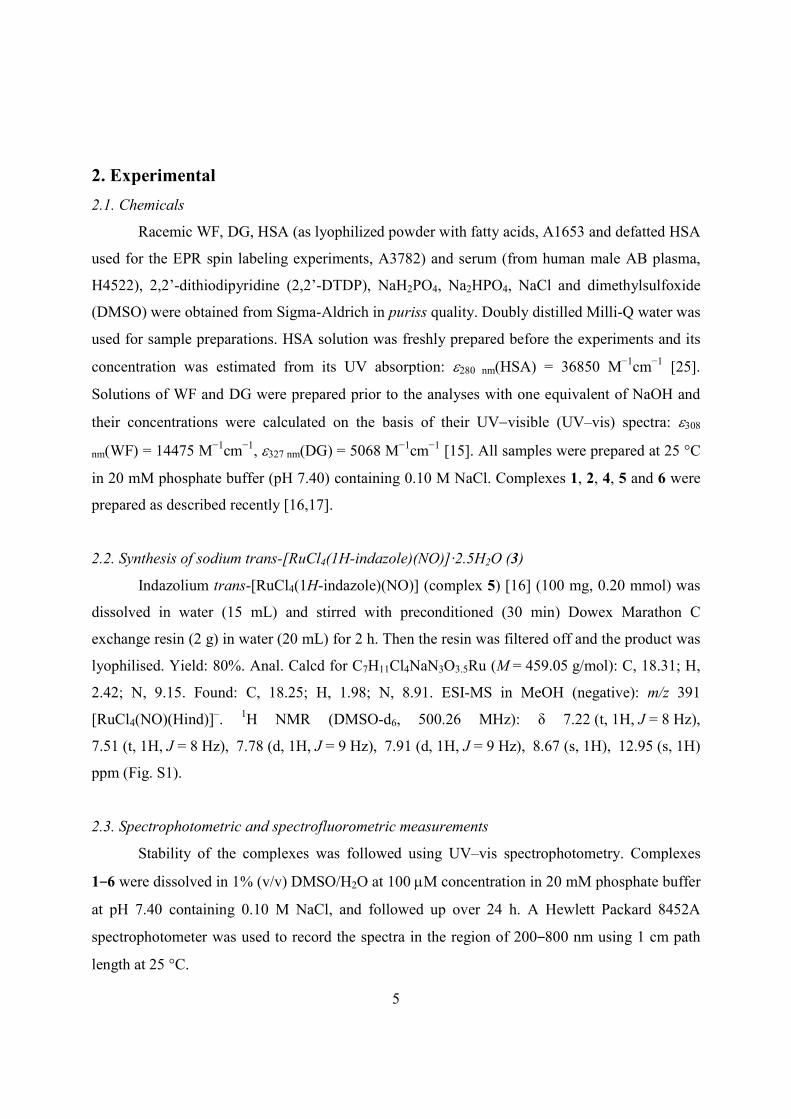
much faster at pH 7.40 (phosphate buffer) in the presence of 0.10 M NaCl (Fig. 1a). Absorbance
changes detected at 386 nm clearly indicate the multiple nature of the hydrolytic processes,
namely three different reaction steps are observed. Notably, the final spectrum resembles that of
the free indazole under the employed conditions. On the other hand, parallel to these changes a
significant increase of the fluorescence emission was detected (Fig. 1b). The initial intensity of
the signal, which is originated from the indazolium counter ion, was increased by a factor of 2
indicating the liberation of the coordinated indazole ligand. All these findings strongly suggest
the relatively fast (~30 min) decomposition of 6 in aqueous solution at physiological pH. The
carbonyl ligand as strong -acceptor compared to nitrosyl presumably has a kinetic labilizing
trans-effect on trans-standing indazole ligand. The trans-influence of CO when compared to NO
could be also observed in closely related complexes. A lengthening of trans Ru‒N(azole) bond
trans to Ru‒CO is evident when comparing the same bond trans to Ru‒NO. The Ru‒N(indazole)
bond in nBu4N[trans-RuCl4(1H-indazole)(CO)] and [(1H-indazole)H][trans-RuCl4(1H-
indazole)(CO)] is of 2.1313(13) and 2.1248(17) Å, respectively, [17] compared to 2.104(3) in
H2ind[trans-RuCl4(NO)(1H-indazole)] [16]. The same trend is observed when comparing the
Ru‒N(azole) bond of 2.126(6) and 2.091(2) Å in (1-methylimidazole)H[trans-RuCl4(NO)(1H-
indazole)] [31] and [(1H-imidazole)2H][trans-RuCl4(NO)(1H-imidazole)] [32]. The much lower
solution stability of this compound compared to that of the analogous complex 5 may be
responsible for its strongly reduced antiproliferative activity. IC50 values of 180−205 mM and 1−8
mM have been found for complexes 6 and 5, respectively, in human cancer cell lines [16,17].
Therefore, the HSA binding studies were performed only with the nitrosyl complexes 15.
10
Fig. 1.
3.4. Interaction with albumin and blood serum: ultrafiltration study
Interaction between HSA and the biologically most active complex 5 and its closely
related derivatives 1−4 (Chart 1) possessing lower antiproliferative activity was studied by
ultrafiltration, fluorescence and UVvis studies. Additionally EPR spin labeling method was used
in the case of complex 5. Since the studied compounds show hydrolytic decomposition at neither
25 nor 37 °C (see section 3.2), and the conditional binding constants of the applied site marker
probes towards HSA were found to be fairy similar at both temperature values in our former
work [15]; here the measurements with the protein were conducted at 25 °C.
One of the most efficient approaches to investigate the direct interaction between HSA
and any low molecular mass (LMM) organic molecule or metal complex is the ultrafiltration
coupled with an appropriate analytical method such as UV−vis, inductively coupled plasma (ICP)
mass spectrometry or ICP− atomic emission spectroscopy. This technique enables a separation of
the high molecular mass (HMM) fraction (such as the protein and the protein-bound LMM
compounds) from the LMM fraction containing the unbound molecules (such as the protein-free
compounds). The concentration of the metal complexes in the LMM fraction was determined by
UV−vis spectroscopic detection after the separation and their spectra were compared with
reference spectra yielding the ratios of the unbound and total amount of the complexes. Notably,
in this part of the work lyophilized HSA with fatty acids was used.
Prior to the measurements of HSA-metal complex containing adducts the compounds 15
without the protein were filtered in order to avoid the possible errors resulting from the retention
on the filter. All trans-isomers 25 passed through the filter with 94100% efficacy, while
approximately 50% of the cis-configured complex 1 was stacked on the filter. Therefore, only
complexes 25 were used to follow interactions with HSA by ultrafiltration-UVvis, and
constant HSA-to-complex ratios, namely 1:0.5 and 1:1 were used. HSA concentration was chosen
at (i) 630 mM to mimic physiological conditions, (ii) 160 mM to get comparison with 4-fold
diluted serum samples and (iii) 50 mM to collect data at more diluted conditions. Our preliminary
UV−vis spectrophotometric measurements revealed that 2 h incubation time was enough to reach
equilibrium in the HSA-complex containing samples in the given concentration range. The
obtained values for the bound metal complex fractions after separation and analysis are presented
11
in Table 1 together with data related to KP1019 for comparison. These binding data show
unambiguously that complexes 25 were mostly bound to HSA (92−94%) at physiological HSA
concentration (630 mM). No significant differences could be observed in the binding affinity
among these metal complexes to HSA. It is worth noting that the indazolium counterion was in
excess in the LMM fraction after separation compared to the metal complexes in case of 4 and 5.
(Molar absorbance spectra of metal complexes and indazole were used for the deconvolution of
the spectra recorded for the LMM fractions to obtain the concentrations of the unbound
compounds.) This phenomenon can be explained by the weaker binding affinity of indazole,
compared to the metal complex, for HSA, taking place only at site II in subdomain IIIA [15].
Table 1
At a lower (160 mM) HSA content, the bound amount of metal complexes 2−5 was slightly
smaller compared to that in experiments at physiological HSA concentration (630 mM), however
>80% of the complex is still bound to this serum protein. The differences between the binding
affinity of the certain complexes remained within the uncertainty of the method. Further decrease
in the HSA concentrations favors unambiguously the dissociation of each formed adduct. At the
same time HSA at 50 mM was able to bind 64 and 70% of 5 and 2, respectively, at 1:1 protein-to-
complex ratio. Complexes 3 and 4 are still bound to HSA in outstanding 7779% quantity. In
order to obtain a general view about the possible interactions with the HMM serum components,
further measurements were carried out using human blood serum. The protein bound fraction of
complexes 3 and 5 displayed similar trends as found for HSA-metal complex experiments at 160
mM HSA concentration which is comparable to the presumed albumin content in 4-fold diluted
serum samples. The similarity in the binding properties between the serum, and the HSA-only
containing samples provides strong evidence that, among the HMM components, HSA is
responsible for the majority of the binding of the studied complexes. Moreover, the considerably
high albumin bound portion is comparable with the binding ability of KP1019 towards HSA (see
Table 1).
3.5. Exploring possible binding sites on albumin: fluorescence and UVvis studies
In addition to the knowledge of the overall binding level of the studied complexes to
HSA, the location of the possible protein binding sites at which the interaction takes place is also
an important issue. Therefore spectrofluorometric quenching and site marker displacement
12
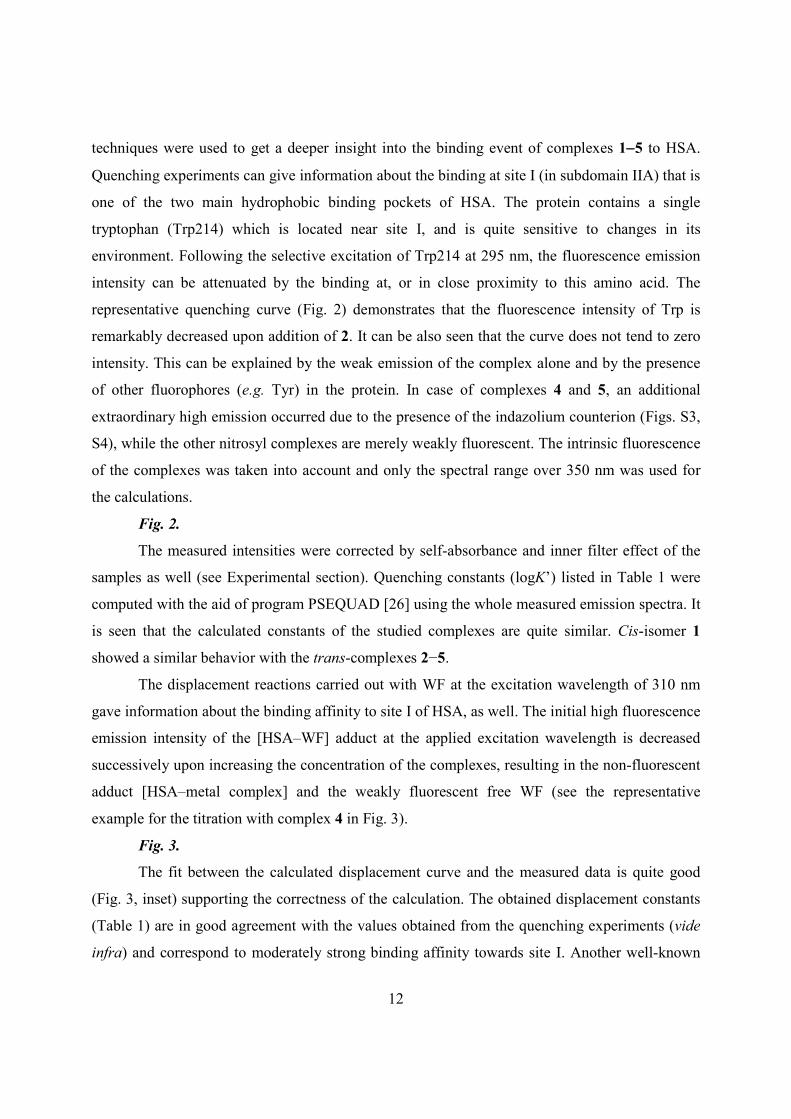
techniques were used to get a deeper insight into the binding event of complexes 15 to HSA.
Quenching experiments can give information about the binding at site I (in subdomain IIA) that is
one of the two main hydrophobic binding pockets of HSA. The protein contains a single
tryptophan (Trp214) which is located near site I, and is quite sensitive to changes in its
environment. Following the selective excitation of Trp214 at 295 nm, the fluorescence emission
intensity can be attenuated by the binding at, or in close proximity to this amino acid. The
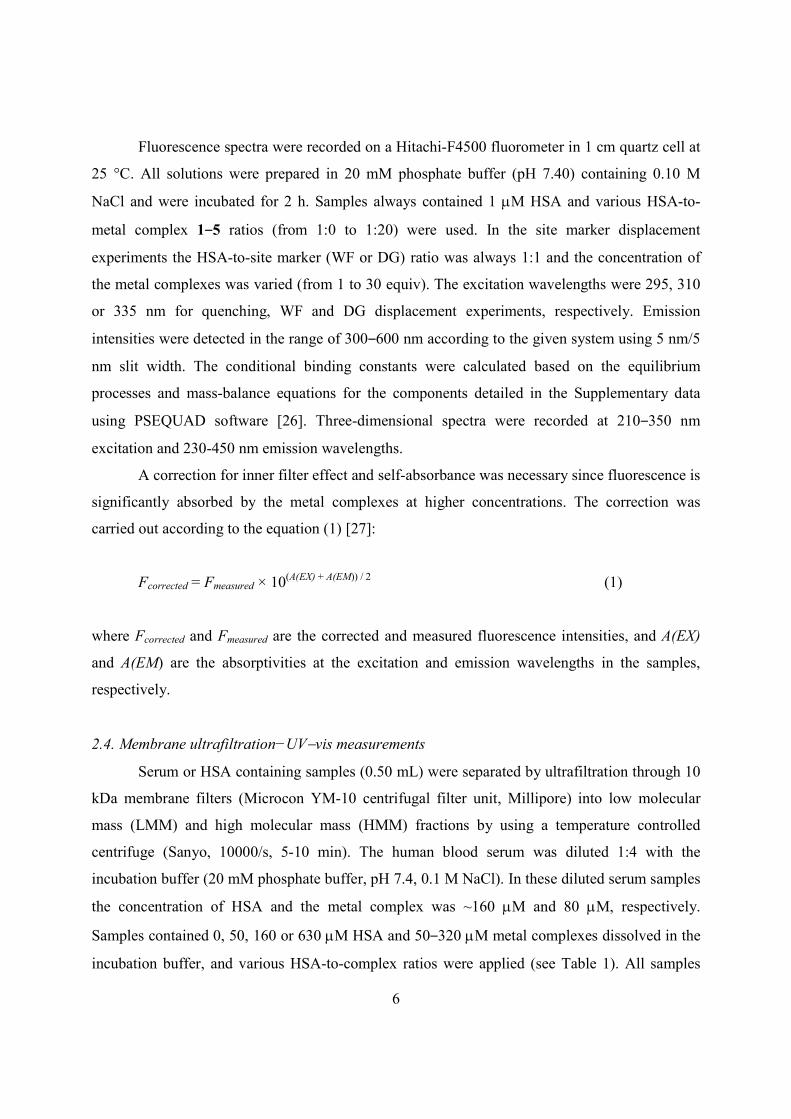
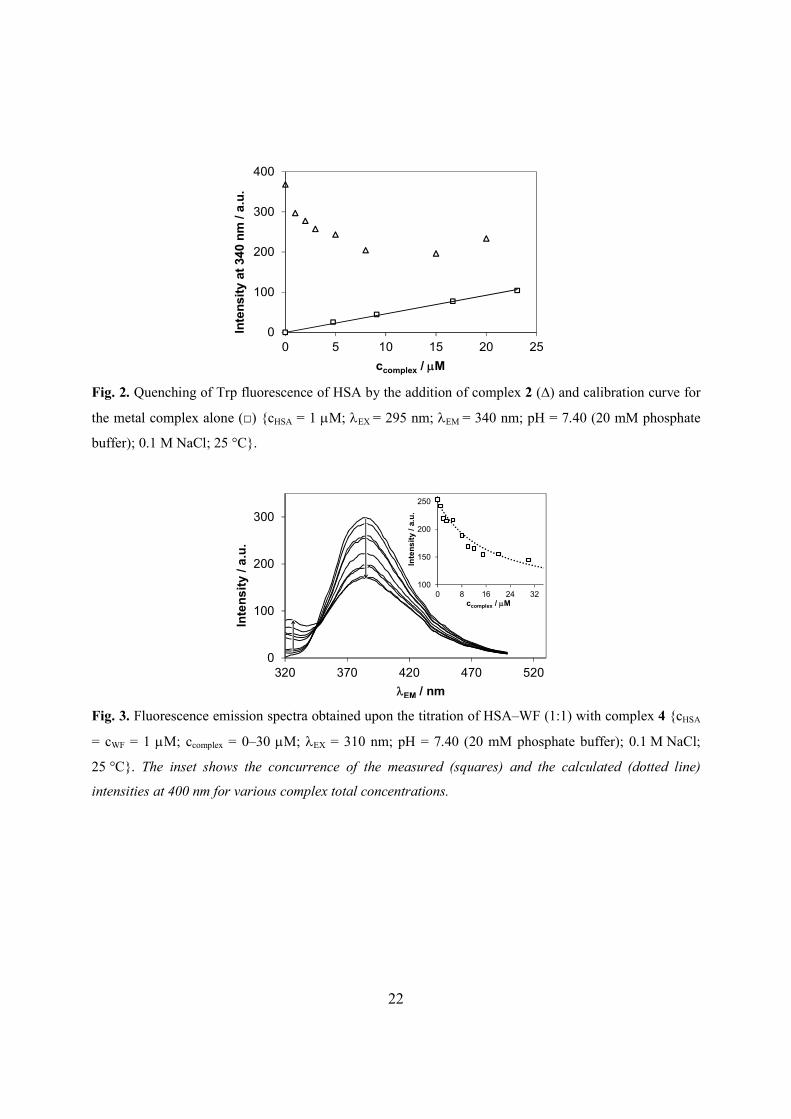
representative quenching curve (Fig. 2) demonstrates that the fluorescence intensity of Trp is
remarkably decreased upon addition of 2. It can be also seen that the curve does not tend to zero
intensity. This can be explained by the weak emission of the complex alone and by the presence
of other fluorophores (e.g. Tyr) in the protein. In case of complexes 4 and 5, an additional
extraordinary high emission occurred due to the presence of the indazolium counterion (Figs. S3,
S4), while the other nitrosyl complexes are merely weakly fluorescent. The intrinsic fluorescence
of the complexes was taken into account and only the spectral range over 350 nm was used for
the calculations.
Fig. 2.
The measured intensities were corrected by self-absorbance and inner filter effect of the
samples as well (see Experimental section). Quenching constants (logK’) listed in Table 1 were
computed with the aid of program PSEQUAD [26] using the whole measured emission spectra. It
is seen that the calculated constants of the studied complexes are quite similar. Cis-isomer 1
showed a similar behavior with the trans-complexes 2−5.
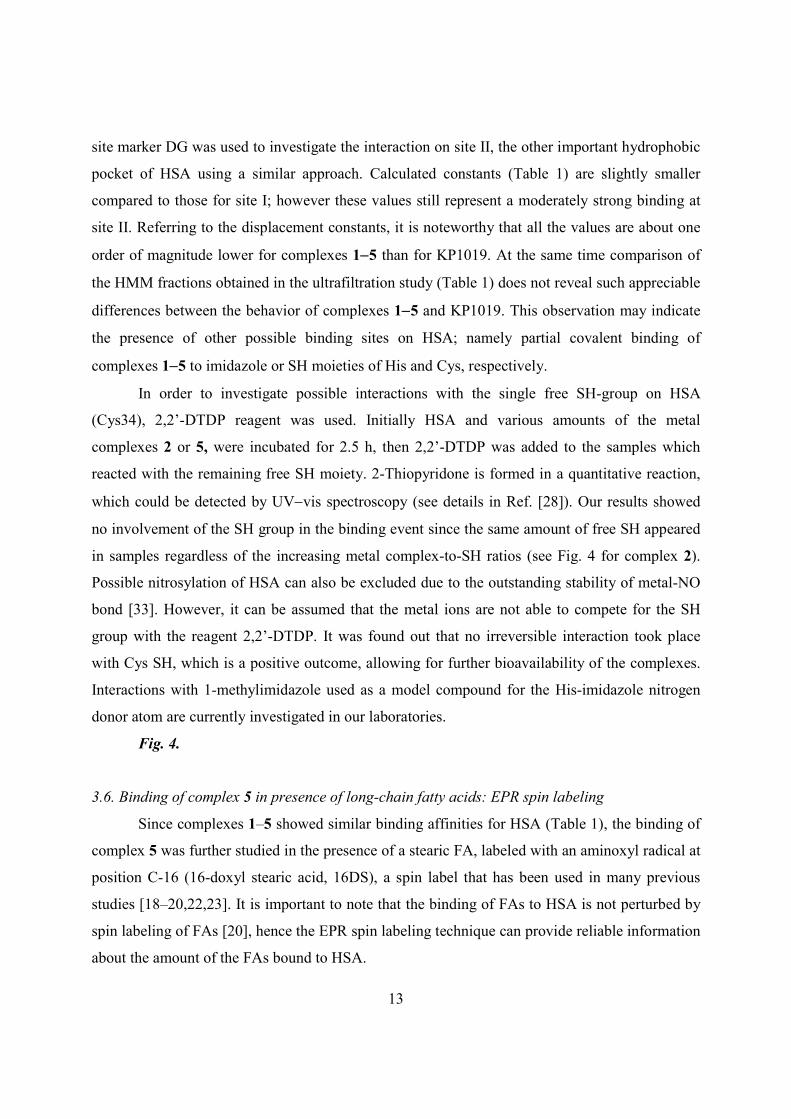
The displacement reactions carried out with WF at the excitation wavelength of 310 nm
gave information about the binding affinity to site I of HSA, as well. The initial high fluorescence
emission intensity of the [HSA–WF] adduct at the applied excitation wavelength is decreased
successively upon increasing the concentration of the complexes, resulting in the non-fluorescent
adduct [HSA–metal complex] and the weakly fluorescent free WF (see the representative
example for the titration with complex 4 in Fig. 3).
Fig. 3.
The fit between the calculated displacement curve and the measured data is quite good
(Fig. 3, inset) supporting the correctness of the calculation. The obtained displacement constants
(Table 1) are in good agreement with the values obtained from the quenching experiments (vide
infra) and correspond to moderately strong binding affinity towards site I. Another well-known
13
site marker DG was used to investigate the interaction on site II, the other important hydrophobic
pocket of HSA using a similar approach. Calculated constants (Table 1) are slightly smaller
compared to those for site I; however these values still represent a moderately strong binding at
site II. Referring to the displacement constants, it is noteworthy that all the values are about one
order of magnitude lower for complexes 15 than for KP1019. At the same time comparison of
the HMM fractions obtained in the ultrafiltration study (Table 1) does not reveal such appreciable
differences between the behavior of complexes 15 and KP1019. This observation may indicate
the presence of other possible binding sites on HSA; namely partial covalent binding of
complexes 15 to imidazole or SH moieties of His and Cys, respectively.
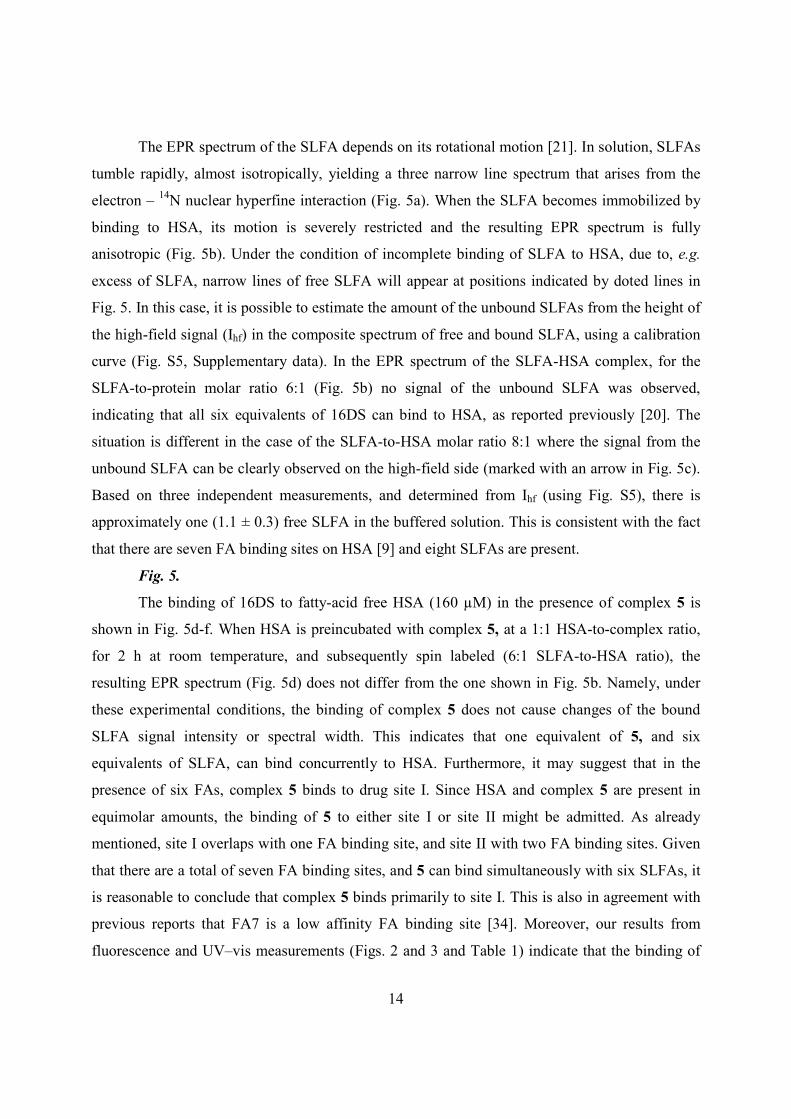
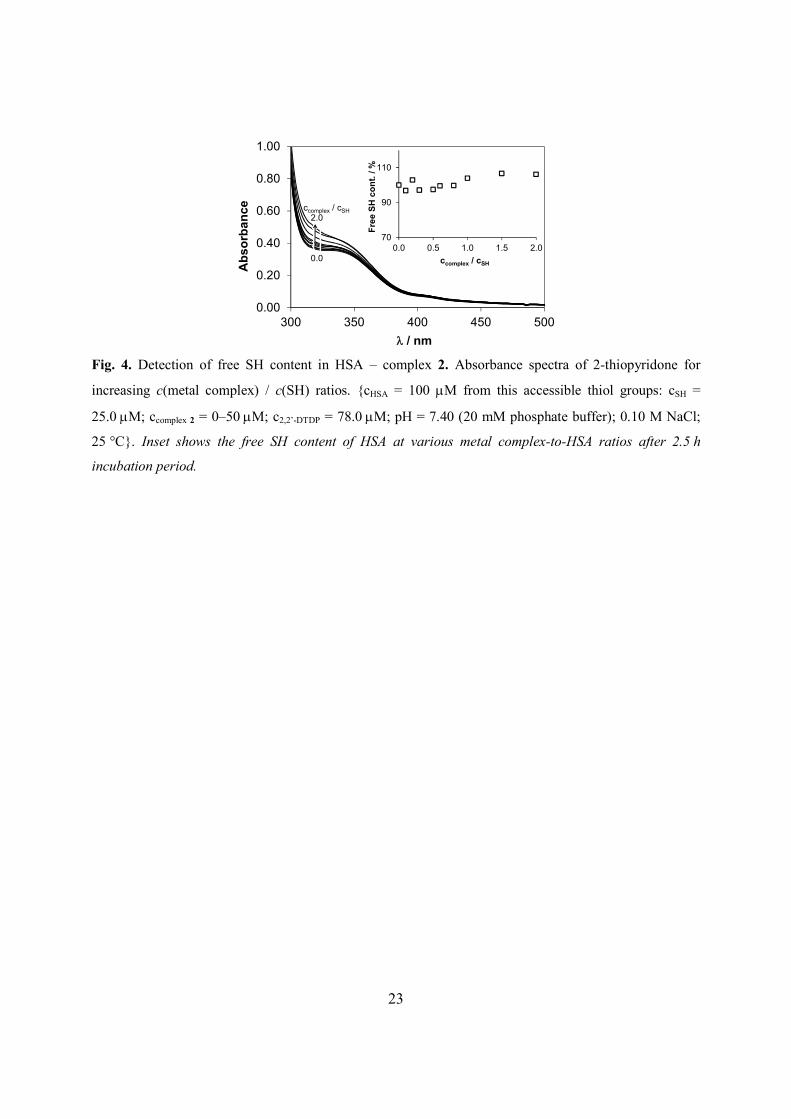
In order to investigate possible interactions with the single free SH-group on HSA
(Cys34), 2,2’-DTDP reagent was used. Initially HSA and various amounts of the metal
complexes 2 or 5, were incubated for 2.5 h, then 2,2’-DTDP was added to the samples which
reacted with the remaining free SH moiety. 2-Thiopyridone is formed in a quantitative reaction,
which could be detected by UVvis spectroscopy (see details in Ref. [28]). Our results showed
no involvement of the SH group in the binding event since the same amount of free SH appeared
in samples regardless of the increasing metal complex-to-SH ratios (see Fig. 4 for complex 2).
Possible nitrosylation of HSA can also be excluded due to the outstanding stability of metal-NO
bond [33]. However, it can be assumed that the metal ions are not able to compete for the SH
group with the reagent 2,2’-DTDP. It was found out that no irreversible interaction took place
with Cys SH, which is a positive outcome, allowing for further bioavailability of the complexes.
Interactions with 1-methylimidazole used as a model compound for the His-imidazole nitrogen
donor atom are currently investigated in our laboratories.
Fig. 4.
3.6. Binding of complex 5 in presence of long-chain fatty acids: EPR spin labeling
Since complexes 1–5 showed similar binding affinities for HSA (Table 1), the binding of
complex 5 was further studied in the presence of a stearic FA, labeled with an aminoxyl radical at
position C-16 (16-doxyl stearic acid, 16DS), a spin label that has been used in many previous
studies [18‒20,22,23]. It is important to note that the binding of FAs to HSA is not perturbed by
spin labeling of FAs [20], hence the EPR spin labeling technique can provide reliable information
about the amount of the FAs bound to HSA.
14
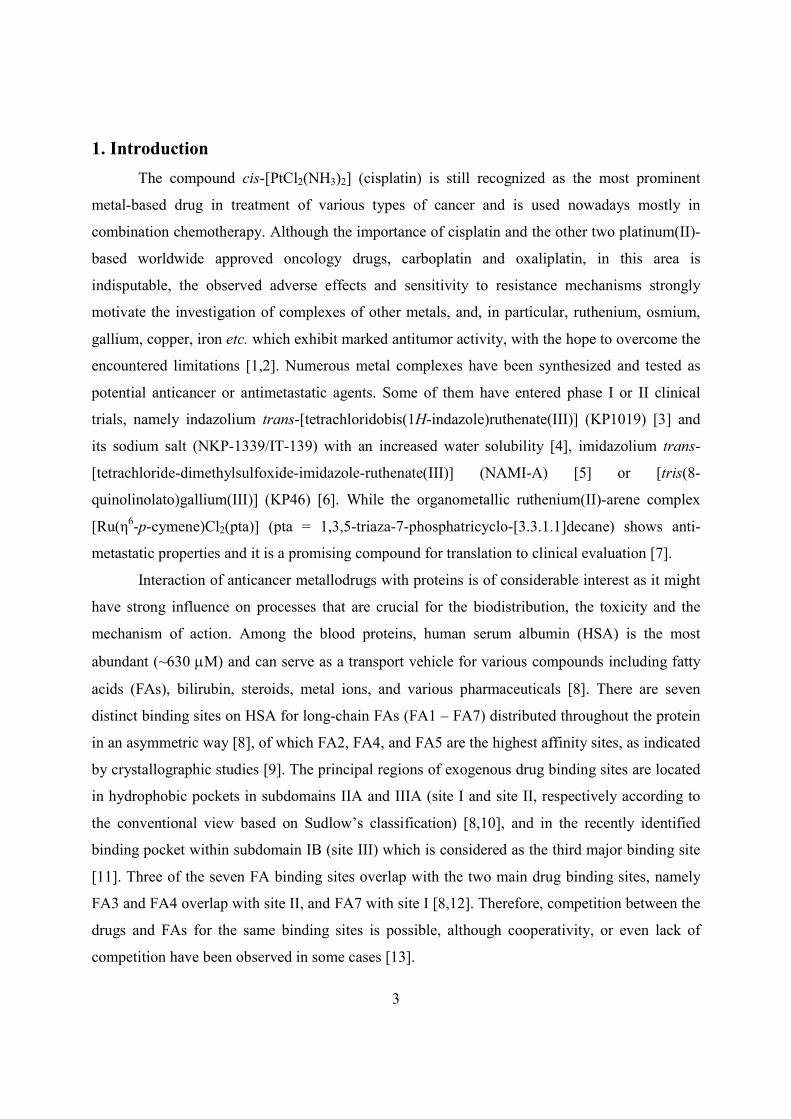
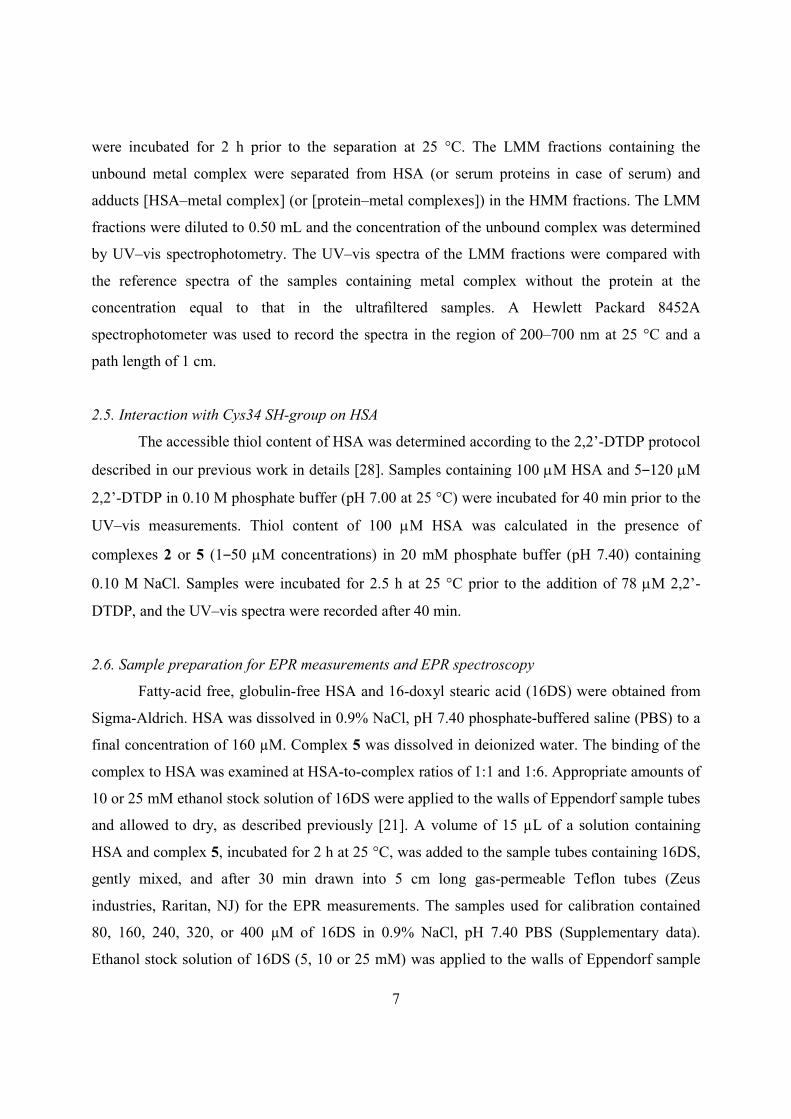
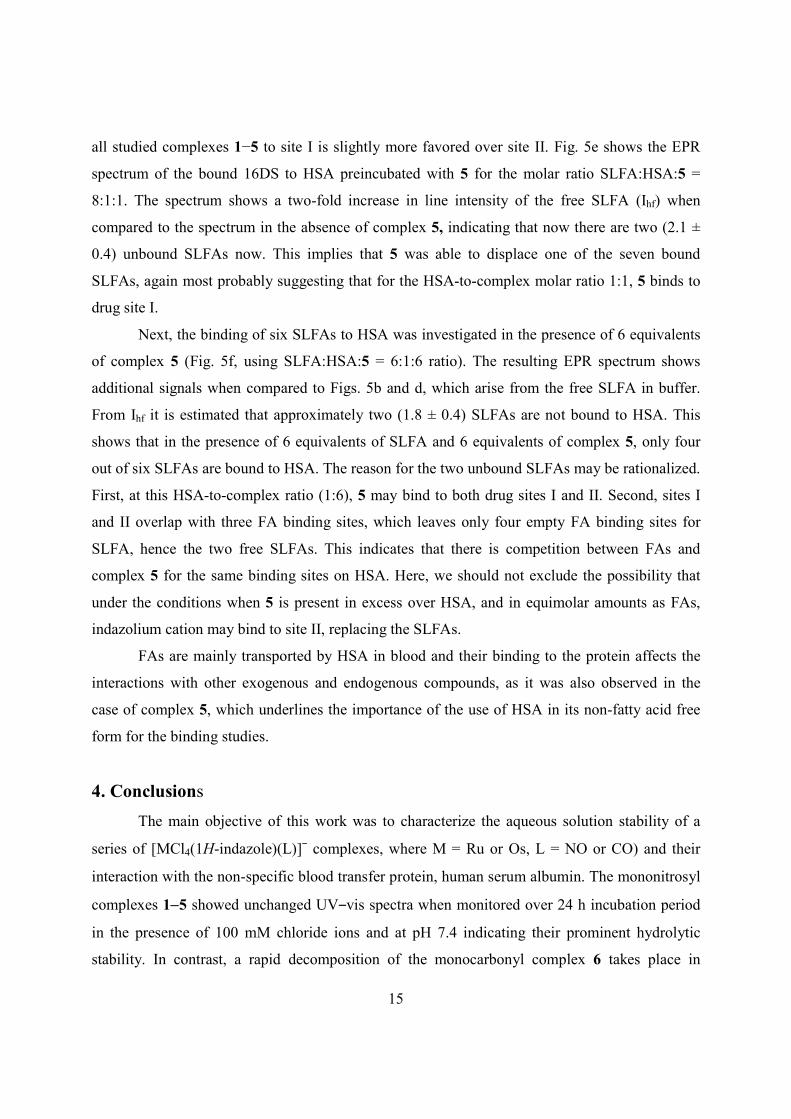
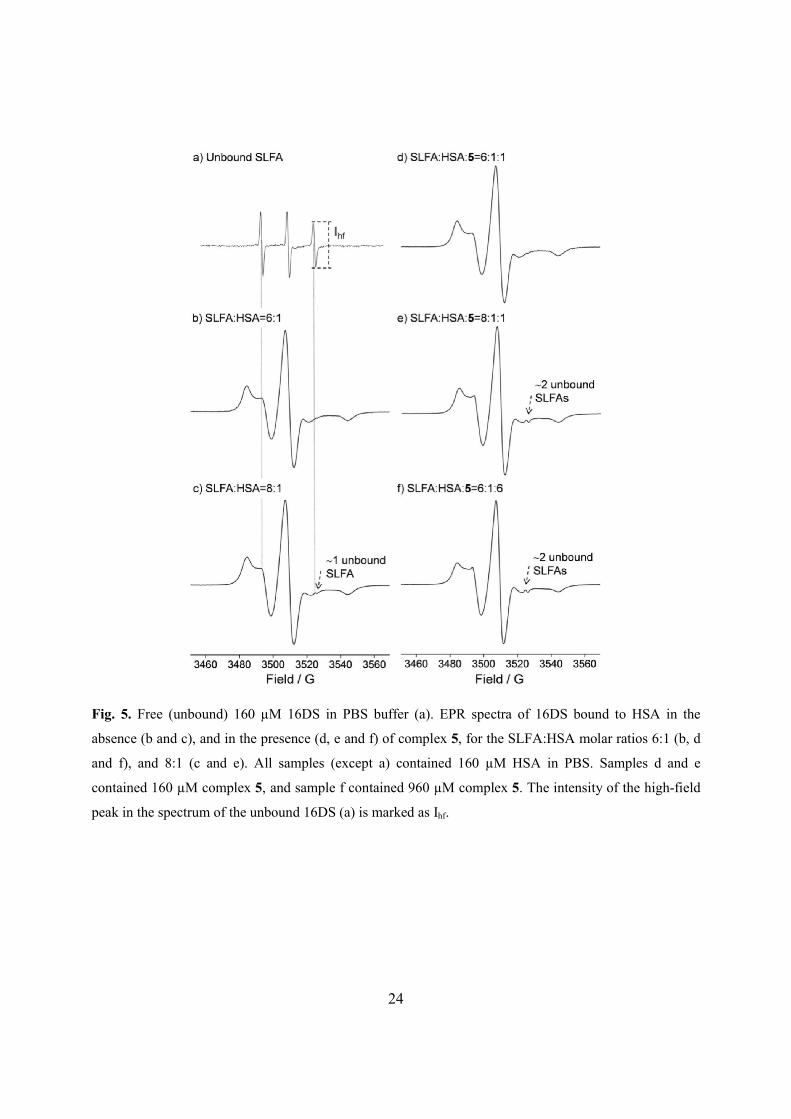
The EPR spectrum of the SLFA depends on its rotational motion [21]. In solution, SLFAs
tumble rapidly, almost isotropically, yielding a three narrow line spectrum that arises from the
electron – 14N nuclear hyperfine interaction (Fig. 5a). When the SLFA becomes immobilized by
binding to HSA, its motion is severely restricted and the resulting EPR spectrum is fully
anisotropic (Fig. 5b). Under the condition of incomplete binding of SLFA to HSA, due to, e.g.
excess of SLFA, narrow lines of free SLFA will appear at positions indicated by doted lines in
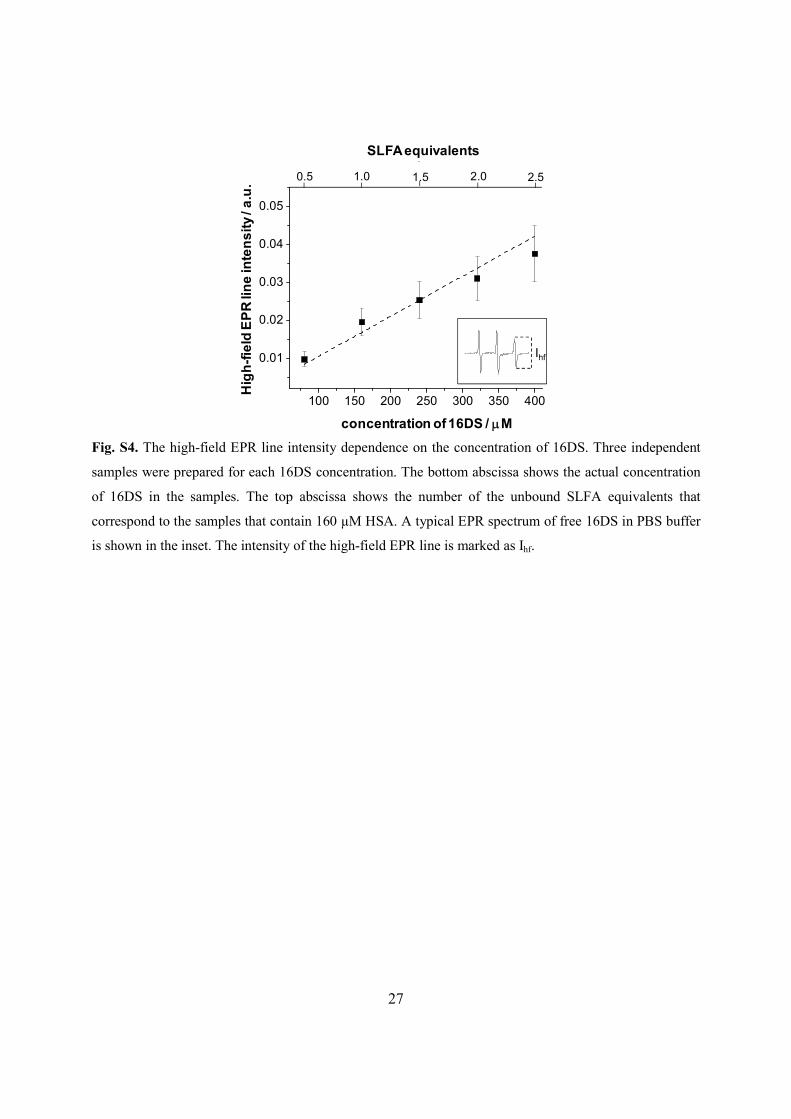
Fig. 5. In this case, it is possible to estimate the amount of the unbound SLFAs from the height of
the high-field signal (Ihf) in the composite spectrum of free and bound SLFA, using a calibration
curve (Fig. S5, Supplementary data). In the EPR spectrum of the SLFA-HSA complex, for the
SLFA-to-protein molar ratio 6:1 (Fig. 5b) no signal of the unbound SLFA was observed,
indicating that all six equivalents of 16DS can bind to HSA, as reported previously [20]. The
situation is different in the case of the SLFA-to-HSA molar ratio 8:1 where the signal from the
unbound SLFA can be clearly observed on the high-field side (marked with an arrow in Fig. 5c).
Based on three independent measurements, and determined from Ihf (using Fig. S5), there is
approximately one (1.1 ± 0.3) free SLFA in the buffered solution. This is consistent with the fact
that there are seven FA binding sites on HSA [9] and eight SLFAs are present.
Fig. 5.
The binding of 16DS to fatty-acid free HSA (160 µM) in the presence of complex 5 is
shown in Fig. 5d-f. When HSA is preincubated with complex 5, at a 1:1 HSA-to-complex ratio,
for 2 h at room temperature, and subsequently spin labeled (6:1 SLFA-to-HSA ratio), the
resulting EPR spectrum (Fig. 5d) does not differ from the one shown in Fig. 5b. Namely, under
these experimental conditions, the binding of complex 5 does not cause changes of the bound
SLFA signal intensity or spectral width. This indicates that one equivalent of 5, and six
equivalents of SLFA, can bind concurrently to HSA. Furthermore, it may suggest that in the
presence of six FAs, complex 5 binds to drug site I. Since HSA and complex 5 are present in
equimolar amounts, the binding of 5 to either site I or site II might be admitted. As already
mentioned, site I overlaps with one FA binding site, and site II with two FA binding sites. Given
that there are a total of seven FA binding sites, and 5 can bind simultaneously with six SLFAs, it
is reasonable to conclude that complex 5 binds primarily to site I. This is also in agreement with
previous reports that FA7 is a low affinity FA binding site [34]. Moreover, our results from
fluorescence and UV–vis measurements (Figs. 2 and 3 and Table 1) indicate that the binding of
15
all studied complexes 1−5 to site I is slightly more favored over site II. Fig. 5e shows the EPR
spectrum of the bound 16DS to HSA preincubated with 5 for the molar ratio SLFA:HSA:5 =
8:1:1. The spectrum shows a two-fold increase in line intensity of the free SLFA (Ihf) when
compared to the spectrum in the absence of complex 5, indicating that now there are two (2.1 ±
0.4) unbound SLFAs now. This implies that 5 was able to displace one of the seven bound
SLFAs, again most probably suggesting that for the HSA-to-complex molar ratio 1:1, 5 binds to
drug site I.
Next, the binding of six SLFAs to HSA was investigated in the presence of 6 equivalents
of complex 5 (Fig. 5f, using SLFA:HSA:5 = 6:1:6 ratio). The resulting EPR spectrum shows
additional signals when compared to Figs. 5b and d, which arise from the free SLFA in buffer.
From Ihf it is estimated that approximately two (1.8 ± 0.4) SLFAs are not bound to HSA. This
shows that in the presence of 6 equivalents of SLFA and 6 equivalents of complex 5, only four
out of six SLFAs are bound to HSA. The reason for the two unbound SLFAs may be rationalized.
First, at this HSA-to-complex ratio (1:6), 5 may bind to both drug sites I and II. Second, sites I
and II overlap with three FA binding sites, which leaves only four empty FA binding sites for
SLFA, hence the two free SLFAs. This indicates that there is competition between FAs and
complex 5 for the same binding sites on HSA. Here, we should not exclude the possibility that
under the conditions when 5 is present in excess over HSA, and in equimolar amounts as FAs,
indazolium cation may bind to site II, replacing the SLFAs.
FAs are mainly transported by HSA in blood and their binding to the protein affects the
interactions with other exogenous and endogenous compounds, as it was also observed in the
case of complex 5, which underlines the importance of the use of HSA in its non-fatty acid free
form for the binding studies.
4. Conclusions
The main objective of this work was to characterize the aqueous solution stability of a
series of [MCl4(1H-indazole)(L)]‒ complexes, where M = Ru or Os, L = NO or CO) and their
interaction with the non-specific blood transfer protein, human serum albumin. The mononitrosyl
complexes 15 showed unchanged UV‒vis spectra when monitored over 24 h incubation period
in the presence of 100 mM chloride ions and at pH 7.4 indicating their prominent hydrolytic
stability. In contrast, a rapid decomposition of the monocarbonyl complex 6 takes place in
16
solution accompanied by the loss of the coordinated indazole ligand. Binding of antitumor
metallodrugs to HSA is of considerable interest as it has a profound effect on the biodistribution
in serum, and the interaction of the mononitrosyl complexes 15 with this protein was studied by
spectrofluorometry involving Trp quenching and competition studies with well-established site
markers (WF, DG), as well as by EPR spin labeling. Ultrafiltration-UV‒vis method was applied
to monitor the overall binding towards HSA and HMM serum components. When 630 mM of
HSA was loaded with 0.5 equiv of the compounds, it was found that the protein is able to bind
92-94% of the complexes without significant effects exerted by the type of the counterion
(sodium or indazolium), the metal center (Ru or Os) and the cis- or trans-configuration. The
observed binding level is similar to that of the reference compound, KP1019 under similar
conditions. Based on the experiments performed on the serum samples, HSA was found to be the
main binding protein for the studied complexes among the serum components. The
spectrofluorimetric studies indicate that the studied mononitrosyl complexes are able to bind into
both sites, I and II, with moderately strong affinity, although site I is somewhat more favored.
LogK’ values of 4.95.1 were obtained for site I, and 4.44.7 for site II. According to the EPR
spin labeling studies, indazolium trans-[RuCl4(1H-indazole)(NO)] can bind to HSA in the
presence of long-chain FAs, however a competition is observed between the two binders, due to
the overlapping binding sites. At 1:1 HSA-to-complex ratio, the ruthenium compound 5 binds at
site I in addition to the binding of up to six FAs at the same time. When 5 is present in excess
over HSA, it binds to both sites, I and II, and up to four FAs can bind simultaneously.
Abbreviations
cisplatin cis-[PtCl2(NH3)2]
DG dansylglycine
DMSO dimethylsulfoxide
16DS 16-doxyl stearic acid
2,2’-DTDP 2,2’-dithiodipyridine
EPR electron paramagnetic resonance
FAs fatty acids
HMM high molecular mass
HSA human serum albumin
17
H2ind+ indazolium
ICP inductively coupled plasma
KP1019 indazolium trans-[tetrachloridobis(1H-indazole)ruthenate(III)]
LMM low molecular mass
lEM fluorescence emission wavelength
lEX fluorescence excitation wavelength
PBS phosphate buffered saline
SLFA spin labeled fatty acid
UV‒vis UV‒visible
WF warfarin
Acknowledgments
This work was supported by the Hungarian Research Foundation OTKA project PD103905 and the János
Bolyai Research Scholarship of the Hungarian Academy of Sciences. A.P.-B. and G.B. acknowledge the
support from the Serbian Ministry for education, science and technological development (grant no.
III41005).
Appendix A. Supplementary data
Supplementary data to this article can be found online at …
References
[1] Y. Jung, S.J. Lippard, Chem. Rev. 107 (2007) 1387–1407.
[2] F. Bacher, V.B. Arion, in: Reedijk, J. (Ed.) Ruthenium Compounds as Antitumor Agents:
New Developments, Elsevier Reference Module in Chemistry, Molecular Sciences and
Chemical Engineering. Waltham, MA: Elsevier, 2014, doi: 10.1016/B978-0-12-409547-
2.11353-8
[3] C.G. Hartinger, M.A. Jakupec, S. Zorbas-Seifried, M. Groessl, A. Egger, W. Berger, H.
Zorbas, P.J. Dyson, B.K. Keppler, Chem. Biodiversity 5 (2008) 2140–2155.
[4] N.R. Dickson, S.F. Jones, H.A. Burris, R.K. Ramanathan, G.J. Weiss, J.R. Infante, J.C.
Bendell, W. McCulloch, D.D. Von Hoff, J. Clin. Oncol. 29 (2011) 2607 (suppl., abstr.).
18
[5] E. Alessio, G. Mestroni, A. Bergamo, G. Sava, Curr. Top. Med. Chem. 4 (2004) 1525–
1535.
[6] M.A. Jakupec, B.K. Keppler, Curr. Top. Med. Chem. 4 (2004) 1575–1583.
[7] A. Weiss, R.H. Berndsen, M. Dubois, C. Müller, R. Schibli, A.W. Griffioen, P.J. Dyson,
P. Nowak-Sliwinska, Chem. Sci. 5 (2014) 4742–4748.
[8] G. Fanali, A. di Masi, V. Trezza, M. Marino, M. Fasano, P. Ascenzi, Mol. Aspects. Med.
33 (2012) 209–290.
[9] S. Curry, H. Mandelkow, P. Brick, N. Franks, Nat. Struct. Mol. Biol. 5 (1998) 827−835.
[10] X.M. He, D.C. Carter, Nature 358 (1992) 209–215.
[11] F. Zsila, Mol. Pharm. 10 (2013) 1668−1682.
[12] J.R. Simard, P.A. Zunszain, J.A. Hamilton, S.J, Curry, Mol. Biol. 361 (2006) 336−351.
[13] G. Colmenarejo, Med. Res. Rev. 23 (2003) 275–301.
[14] F. Kratz, Control. Release 132 (2008) 171–183.
[15] O. Dömötör, C.G. Hartinger, A.K. Bytzek, T. Kiss, B.K. Keppler, É.A. Enyedy, J. Biol.
Inorg. Chem. 18 (2013) 9–17.
[16] G.E. Büchel, A. Gavriluta, M. Novak, S.M. Meier, M.A. Jakupec, O. Cuzan, C. Turta,
J.B. Tommasino,E. Jeanneau, G. Novitchi, D. Luneau, V.B. Arion, Inorg. Chem. 52
(2013) 6273–6285.
[17] P.S. Kuhn, S.M. Meier, K.K. Jovanović, I. Sandler, L. Freitag, G. Novitchi, L. Gonzalez,
S. Radulović, V.B. Arion, unpublished results
[18] J.D. Morrisett, H.J. Pownall, A.M. Gotto, J. Biol. Chem. 250 (1975) 2487−2494.
[19] T.G. Gantchev, M.B. Shopova, Biochim. Biophys. Acta 1037 (1990) 422−434.
[20] M.J.N. Junk, H.W. Spiess, D. Hinderberger, Angew. Chem. Int. Ed. 49 (2010)
8755−8759.
[21] N. Kocherginsky, H.M. Swartz, in: Nitroxide Spin Labels, CRC Press Inc., Fl. USA,
1995.
[22] A. Gurachevsky, E. Muravskaya, T. Gurachevskaya, L. Smirnova, V. Muravsky, Cancer
Invest. 25 (2007) 378−383.
[23] A.A. Pavićević, A.D. Popović-Bijelić, M.D. Mojović, S.V. Šušnjar, G.G. Bačić, J. Phys.
Chem. B 118 (2014) 10898–10905.
19
[24] H. Yuan, W.E. Antholine, W.K. Subczynski, M.A. Green, J Inorg Biochem. 61 (1996)
251–259.
[25] G.H. Beaven, S. Chen, A. D’Albis, W.B. Gratzer, Eur. J. Biochem. 42 (1974) 539–546.
[26] L. Zékány, I. Nagypál, in: D.L. Leggett (Ed.), Computational Methods for the
Determination of Stability Constants, Plenum Press, New York, 1985, pp. 291–353.
[27] J.R. Lakowicz, Principles of Fluorescence Spectroscopy 3rd. Ed. Springer Science, New
York, 2006.
[28] V. Pichler, J. Mayr, P. Heffeter, O. Dömötör, É.A. Enyedy, G. Hermann, D. Groza, G.
Köllensperger, M. Galanski, W. Berger, B.K. Keppler, C.R. Kowol, Chem. Comm. 49
(2013) 2249–2251.
[29] T. Pieper, W. Peti, B.K. Keppler, Met. Based Drugs 7 (2000) 225–232.
[30] A. Küng, T. Pieper, R. Wissiack, E. Rosenberg, B.K. Keppler, J. Biol. Inorg. Chem. 6
(2001) 292–299.
[31] A.A. Batista, L.R.V. Olmo, C. Oliva, E.E. Castellano, O.R. Nascimento, Inorg. Chim.
Acta 202 (1992) 37‒41.
[32] B. Serli, E. Zangrando, E. Iengo, J. Mestroni, L. Yelowlees, E. Alessio, Inorg. Chem. 41
(2002) 4033‒4043.
[33] M.J. Cleare, Platinum Metals Rev. 12 (1968) 131–133.
[34] P. Ascenzi, A. Bocedi, S. Notari, G. Fanali, R. Fesce M. Fasano, Mini Rev. Med. Chem. 4
(2006) 483–489.
20
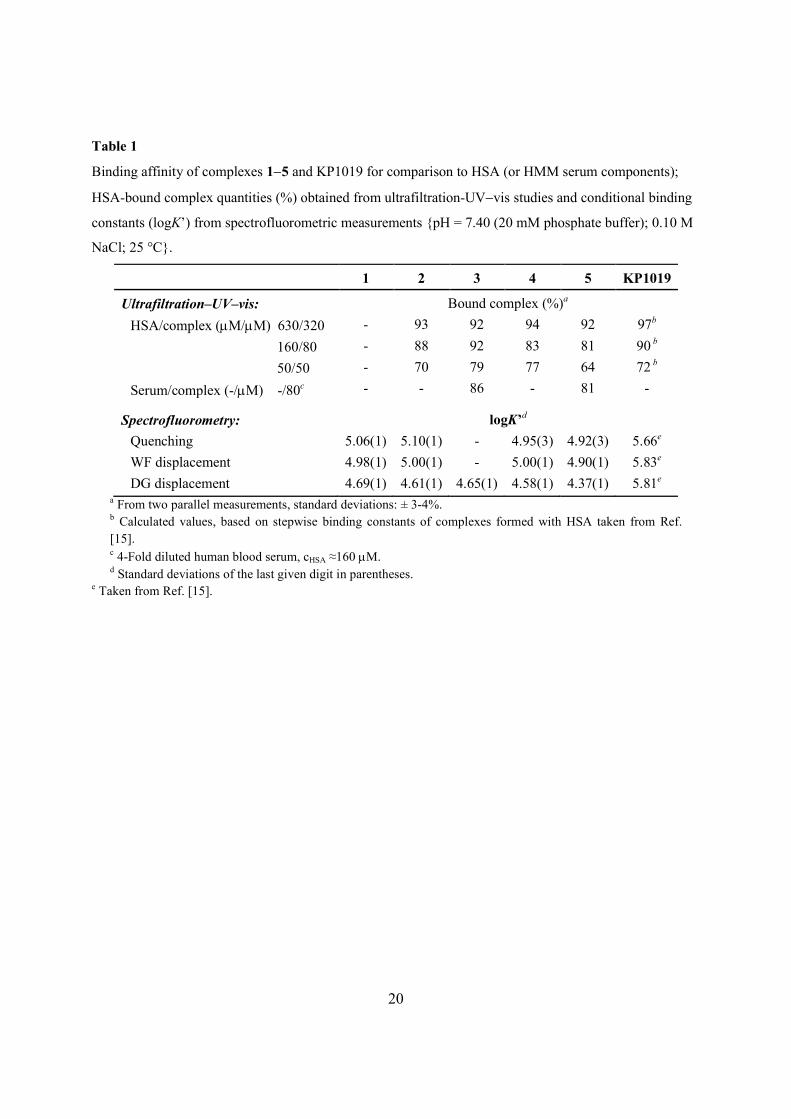
Table 1
Binding affinity of complexes 15 and KP1019 for comparison to HSA (or HMM serum components);
HSA-bound complex quantities (%) obtained from ultrafiltration-UVvis studies and conditional binding
constants (logK’) from spectrofluorometric measurements {pH = 7.40 (20 mM phosphate buffer); 0.10 M
NaCl; 25 °C}.
1 2 3 4 5 KP1019
Ultrafiltration‒UV‒vis: Bound complex (%)a
HSA/complex (mM/mM) 630/320
160/80
50/50
Serum/complex (-/mM) -/80c
-
-
-
-
93
88
70
-
92
92
79
86
94
83
77
-
92
81
64
81
97b
90 b
72 b
-
Spectrofluorometry: logK’d
Quenching
WF displacement
DG displacement
5.06(1)
4.98(1)
4.69(1)
5.10(1)
5.00(1)
4.61(1)
-
-
4.65(1)
4.95(3)
5.00(1)
4.58(1)
4.92(3)
4.90(1)
4.37(1)
5.66e
5.83e
5.81e a From two parallel measurements, standard deviations: ± 3-4%. b Calculated values, based on stepwise binding constants of complexes formed with HSA taken from Ref.
[15]. c 4-Fold diluted human blood serum, cHSA ≈160 mM. d Standard deviations of the last given digit in parentheses.
e Taken from Ref. [15].
21
Chart 1. Complexes 1-6 studied in this work.
0.0
0.2
0.4
0.6
0.8
1.0
1.2
1.4
235 285 335 385 435 485
Ab
so
rba
nc
e
l / nm
free indazole
0.5 min
2.6 min
68 min
0.04
0.07
0.10
0.13
0 15 30 45 60
Ab
s.
(386 n
m)
time / min
a)
0
500
1000
1500
2000
2500
3000
300 325 350 375 400
Inte
ns
ity /
a.u
.
lEM / nm
1.0
1.2
1.4
1.6
1.8
2.0
0 10 20 30
No
rma
lize
d in
ten
sit
y
(32
0 n
m)
time / min
b)
Fig. 1. Time-dependent UV−vis spectra of complex 6 {ccomplex = 80 mM, cindazole = 160 mM}. Inset shows
the absorbance values at 386 nm. (a) Time-dependent fluorescence emission spectra of complex 6 {ccomplex
= 6.3 mM; lEX = 290 nm}. Inset shows the normalized (F/F0) intensities at 320 nm. (b). {pH 7.40 (20 mM
phosphate buffer); 0.1 M NaCl; 25 °C}.
22
0
100
200
300
400
0 5 10 15 20 25
Inte
nsit
y a
t 340 n
m / a
.u.
ccomplex / mM
Fig. 2. Quenching of Trp fluorescence of HSA by the addition of complex 2 (∆) and calibration curve for
the metal complex alone (□) {cHSA = 1 mM; lEX = 295 nm; lEM = 340 nm; pH = 7.40 (20 mM phosphate
buffer); 0.1 M NaCl; 25 °C}.
0
100
200
300
320 370 420 470 520
Inte
ns
ity /
a.u
.
lEM / nm
100
150
200
250
0 8 16 24 32
Inte
ns
ity
/ a.u
.
ccomplex / mM
Fig. 3. Fluorescence emission spectra obtained upon the titration of HSA–WF (1:1) with complex 4 {cHSA
= cWF = 1 mM; ccomplex = 0–30 mM; lEX = 310 nm; pH = 7.40 (20 mM phosphate buffer); 0.1 M NaCl;
25 °C}. The inset shows the concurrence of the measured (squares) and the calculated (dotted line)
intensities at 400 nm for various complex total concentrations.
23
0.00
0.20
0.40
0.60
0.80
1.00
300 350 400 450 500
Ab
so
rba
nc
e
l / nm
70
90
110
0.0 0.5 1.0 1.5 2.0
Fre
e S
H c
on
t. /
%
ccomplex / cSH
ccomplex / cSH
2.0
0.0
Fig. 4. Detection of free SH content in HSA – complex 2. Absorbance spectra of 2-thiopyridone for
increasing c(metal complex) / c(SH) ratios. {cHSA = 100 mM from this accessible thiol groups: cSH =
25.0 mM; ccomplex 2 = 0–50 mM; c2,2’-DTDP = 78.0 mM; pH = 7.40 (20 mM phosphate buffer); 0.10 M NaCl;
25 °C}. Inset shows the free SH content of HSA at various metal complex-to-HSA ratios after 2.5 h
incubation period.
24
Fig. 5. Free (unbound) 160 µM 16DS in PBS buffer (a). EPR spectra of 16DS bound to HSA in the
absence (b and c), and in the presence (d, e and f) of complex 5, for the SLFA:HSA molar ratios 6:1 (b, d
and f), and 8:1 (c and e). All samples (except a) contained 160 µM HSA in PBS. Samples d and e
contained 160 µM complex 5, and sample f contained 960 µM complex 5. The intensity of the high-field
peak in the spectrum of the unbound 16DS (a) is marked as Ihf.
25
SUPPLEMENTARY DATA
Investigation of the binding of cis/trans-[MCl4(1H-indazole)(NO)]‒ (M = Ru, Os) complexes
to human serum albumin
O. Dömötör, A. Rathgeb, P.S. Kuhn, A. Popović-Bijelić, G. Bačić, E. Anna Enyedy, V.B. Arion
Figure S1. 1H NMR spectrum of complex 3 in DMSO-d6.
26
0.90
0.95
1.00
1.05
1.10
0 5 10 15 20 25
Am
ea
su
red
/ A
init
iala
t 2
54
nm
time / h
Fig. S2. Time-dependence of absorbance values at 254 nm of complex 2 (∆, ▲), 4 (□), and 5 (◊, ♦)
measured at 25 °C (empty markers) and at 37 °C (filled markers) {ccomplex = 100 mM; pH = 7.40 (20 mM
phosphate buffer); 0.1 M NaCl; 1%(v/v) DMSO}
a) b)
Fig. S3. The 3-dimensional fluorescence spectra of complex 2 (a) and 4 (b) {ccomplex = 10 mM; pH 7.40
(phosphate buffer); 0.1 M NaCl; 25 °C}
27
100 150 200 250 300 350 400
0.01
0.02
0.03
0.04
0.05
0.5 1.0 1.5 2.0 2.5
SLFA equivalents
16DS concentration (µmol)
Hig
h-f
ield
EP
R lin
e in
ten
sity
(a.u
.)
Ihf
concentration of 16DS / mM
Hig
h-f
ield
EP
R li
ne
inte
ns
ity
/ a
.u.
SLFA equivalents
Fig. S4. The high-field EPR line intensity dependence on the concentration of 16DS. Three independent
samples were prepared for each 16DS concentration. The bottom abscissa shows the actual concentration
of 16DS in the samples. The top abscissa shows the number of the unbound SLFA equivalents that
correspond to the samples that contain 160 µM HSA. A typical EPR spectrum of free 16DS in PBS buffer
is shown in the inset. The intensity of the high-field EPR line is marked as Ihf.
28
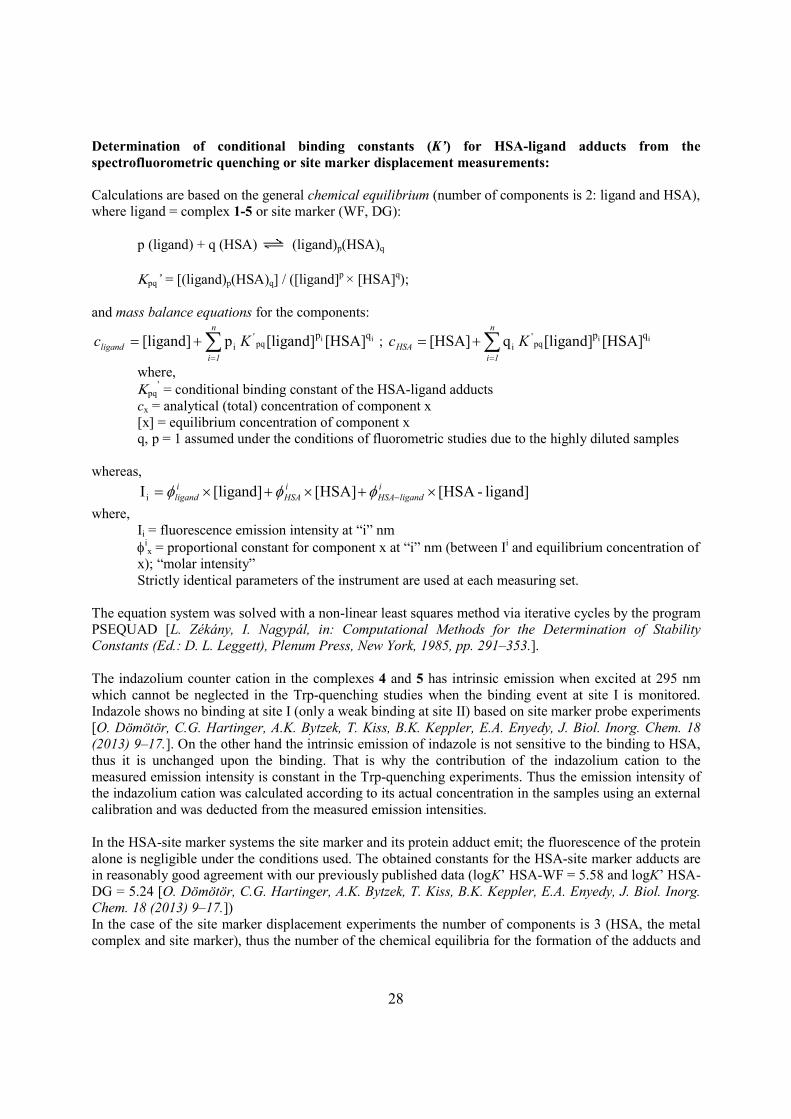
Determination of conditional binding constants (K’) for HSA-ligand adducts from the spectrofluorometric quenching or site marker displacement measurements: Calculations are based on the general chemical equilibrium (number of components is 2: ligand and HSA), where ligand = complex 1-5 or site marker (WF, DG):
p (ligand) + q (HSA) (ligand)p(HSA)q
pq’ = [(ligand)p(HSA)q] / ([ligand]p × [HSA]q); and mass balance equations for the components:
n
1i
'ligand Kc ii qp [HSA][ligand]p[ligand] pqi ;
n
1iHSA Kc ii qp [HSA][ligand]q[HSA] pq
'i
where, pq
’ = conditional binding constant of the HSA-ligand adducts cx = analytical (total) concentration of component x [x] = equilibrium concentration of component x q, p = 1 assumed under the conditions of fluorometric studies due to the highly diluted samples
whereas,
ligand]-[HSA [HSA][ligand]Ii i
ligandHSAiHSA
iligand
where, Ii = fluorescence emission intensity at “i” nm i
x = proportional constant for component x at “i” nm (between Ii and equilibrium concentration of x); “molar intensity” Strictly identical parameters of the instrument are used at each measuring set.
The equation system was solved with a non-linear least squares method via iterative cycles by the program PSEQUAD [L. Zékány, I. Nagypál, in: Computational Methods for the Determination of Stability Constants (Ed.: D. L. Leggett), Plenum Press, New York, 1985, pp. 291–353.]. The indazolium counter cation in the complexes 4 and 5 has intrinsic emission when excited at 295 nm which cannot be neglected in the Trp-quenching studies when the binding event at site I is monitored. Indazole shows no binding at site I (only a weak binding at site II) based on site marker probe experiments [O. Dömötör, C.G. Hartinger, A.K. Bytzek, T. Kiss, B.K. Keppler, E.A. Enyedy, J. Biol. Inorg. Chem. 18 (2013) 9–17.]. On the other hand the intrinsic emission of indazole is not sensitive to the binding to HSA, thus it is unchanged upon the binding. That is why the contribution of the indazolium cation to the measured emission intensity is constant in the Trp-quenching experiments. Thus the emission intensity of the indazolium cation was calculated according to its actual concentration in the samples using an external calibration and was deducted from the measured emission intensities. In the HSA-site marker systems the site marker and its protein adduct emit; the fluorescence of the protein alone is negligible under the conditions used. The obtained constants for the HSA-site marker adducts are in reasonably good agreement with our previously published data (logK’ HSA-WF = 5.58 and logK’ HSA-DG = 5.24 [O. Dömötör, C.G. Hartinger, A.K. Bytzek, T. Kiss, B.K. Keppler, E.A. Enyedy, J. Biol. Inorg. Chem. 18 (2013) 9–17.]) In the case of the site marker displacement experiments the number of components is 3 (HSA, the metal complex and site marker), thus the number of the chemical equilibria for the formation of the adducts and
29
the mass balance equations is increased. During the calculations of the site marker displacement constants, the constants of the HSA-site marker adducts obtained from the independent titrations were kept constant. EPR spin labeling: The method to determine the amount of the unbound SLFAs to HSA The amount of the unbound spin labeled fatty acids (SLFAs) in the EPR spectra of 16-doxyl stearic acid (16DS) bound to HSA in the absence/presence of indazolium trans-[RuCl4(1H-indazole)(NO)] (complex 5), was determined using a calibration curve (Fig. S4). The calibration samples contained 80, 160, 240, 320, and 400 µM 16DS in 0.9% NaCl, pH 7.40 PBS. Higher 16DS concentrations should not be used as pronounced formation of micelles is observed in the EPR spectra (see for more details on analysis of the EPR spectra of SLFA bound to HSA: A.A. Pavićević, A.D. Popović-Bijelić, M.D. Mojović, S.V. Šušnjar, G.G. Bačić, J. Phys. Chem. B 118 (2014) 10898–10905). These concentrations were selected with respect to the final HSA concentration (160 µM) in the samples that were used for the study of the binding of 16DS to the protein to give to the following SLFA-to-HSA molar ratios: 0.5, 1.0, 1.5, 2.0, and 2.5. The acquired EPR spectra were normalized and the height (intensity) of the high-field signal (Ihf) was measured.
The calibration curve is used to determine the concentration of the unbound SLFAs in the EPR spectra of 16DS bound to HSA in the absence/presence of complex 5. The high-field peak in the EPR spectrum of the unbound 16DS in PBS (Fig. 5a) has the same linewidth as that in the spectrum of 16DS in complex with HSA in PBS (Fig. 5c), as well as in the spectra of 16DS bound to HSA in the presence of complex 5 (Figs. 5e and 5f). Therefore, it is possible to compare their Ihf values and to determine the concentration of the unbound 16DS in the EPR spectra of 16DS/HSA/(complex 5), (Figs. 5c, 5e, 5f), using the calibration curve shown in Fig. S3. Of note, the values of Ihf are not used for spin quantification but only to be compared with other intensities. Finally, the determined concentrations of the unbound 16DS were correlated to the number of SLFA equivalents that are unbound to exactly 160 µM HSA. The results are expressed as the mean value of the number of unbound SLFA equivalents determined from three independent measurements ± the standard deviation.