Embed Size (px)
Citation preview
doi:10.1006/jmbi.2000.3835 available online at http://www.idealibrary.com on J. Mol. Biol. (2000) 300, 171±185
Ab Initio Construction of Protein Tertiary StructuresUsing a Hierarchical Approach
Yu Xia1, Enoch S. Huang2, Michael Levitt1* and Ram Samudrala1*
1Department of StructuralBiology, Stanford UniversitySchool of Medicine, StanfordCA 94305, USA2Cereon Genomics, 45 SidneyStreet, CambridgeMA 02139, USA
E-mail addresses of the [email protected]; [email protected]
Abbreviations used: cRMS, Ca rodeviation; dRMS, distance root meaCASP, critical assessment of proteinmethods; RAPDF, residue-speci®c aprobability disriminatory function;classi®cation of proteins.
0022-2836/00/010171±15 $35.00/0
We present a hierarchical method to predict protein tertiary structuremodels from sequence. We start with complete enumeration of confor-mations using a simple tetrahedral lattice model. We then build confor-mations with increasing detail, and at each step select a subset ofconformations using empirical energy functions with increasing complex-ity. After enumeration on lattice, we select a subset of low energy confor-mations using a statistical residue-residue contact energy function, andgenerate all-atom models using predicted secondary structure. A com-bined knowledge-based atomic level energy function is then used toselect subsets of the all-atom models. The ®nal predictions are generatedusing a consensus distance geometry procedure. We test the feasibility ofthe procedure on a set of 12 small proteins covering a wide range of pro-tein topologies. A rigorous double-blind test of our method was madeunder the auspices of the CASP3 experiment, where we did ab initiostructure predictions for 12 proteins using this approach. The perform-ance of our methodology at CASP3 is reasonably good and completelyconsistent with our initial tests.
# 2000 Academic Press
Keywords: protein structure prediction; lattice model; knowledge based;discriminatory function; decoy approach
*Corresponding authorsIntroduction
Ab initio protein structure prediction remainsone of the most important unsolved problems inmolecular biophysics after 30 years of intensiveresearch. This problem is in principle solvable: ifwe know the exact formulation of the physicalmicro-environment within a cell where proteinsfold, we will be able to mimic the folding processin nature by computing the molecular dynamicsbased on our knowledge of the physical laws(McCarmmon & Harvey, 1987; van Gunsteren,1998; Duan & Kollman, 1998). Complementarily,we can rely on the much-debated thermodynamichypothesis, i.e. that the native protein structureis thermodynamically stable and is located at theglobal free energy minimum (An®nsen, 1973).However, we do not yet have a complete under-
ding authors:anford.edu
ot mean squaren square deviation;structure prediction
ll-atom conditionalSCOP, structural
standing of the driving forces behind protein fold-ing. Perturbations introduced by errors in thepotential energy landscape may possibly result in adifferent folding pathway and a different foldedstructure. Even if we have an accurate enoughpotential energy function, we are still hampered bythe huge search space (Levinthal, 1968).
Novel methods have recently been proposed forab initio protein structure prediction with impress-ive results (Simons et al., 1999; Ortiz et al., 1999;Osguthorpe, 1999; Lomize et al., 1999; Lee et al.,1999; Huang et al., 1999; Eyrich et al., 1999). Cur-rent methods for structure prediction can beroughly grouped into two categories. The ®rst setof methods include Monte Carlo and deterministicenergy minimization (Hansmann & Okamoto,1999; Scheraga, 1996; Levitt & Lifson, 1969) andgenetic algorithms (Pedersen & Moult, 1996),which generally start from either one or a small setof random starting points and attempt to drive theconformation to a low energy in an iterative man-ner. The major advantage of these methods is thatthey more or less mimic the physical process ofprotein folding. Besides the folded structure, thepathway that leads to the folded structure mayalso be obtained. However, the success of thesemethods depends crucially on the very high
# 2000 Academic Press
172 Hierarchical Construction of Protein Structures
quality of energy function: it not only has to dis-criminate the native structure from all the otherpossible structures along any possible simulationrun, it also has to lead any random starting con-®guration toward the native structure. It is notclear whether current energy functions can satisfythe two requirements simultaneously (Moult,1997).
The second set of methods use a sampling pro-cedure to produce trial structures, known asdecoys (Chelvanayagam et al., 1998; Huang et al.,1999; Park & Levitt, 1996), that are subsequentlyevaluated by an energy function. The structurewith the lowest energy is assumed to be the nativestructure.
We chose to work within the second paradigmfor the following reasons. First, the prediction pro-cedure is separated into sampling and selectionprocesses. Each process is modular and can bedeveloped and calibrated separately. Ineffective-ness of the whole procedure can be attributed toone or both parts that can be corrected as needed.Second, we ignore pathway prediction and focusour attention on structure prediction. Protein fold-ing is a process that involves hundreds of degreesof freedom. Any single simulation can easily betrapped in one of many local minima along thefolding pathway, and the chances of overcoming alocal energy minimum decrease exponentially withthe height of the free energy barrier. With thedecoy approach, it is possible to explore millions oflocal energy minima of protein conformations inparallel, thereby sampling the protein confor-mational space effectively without the need toovercome high energy barriers. Third, the require-ments demanded of the energy function have beensigni®cantly reduced: the only requirement is dis-crimination between near-native and non-nativestructures. This allows for the use of powerfulstatistical energy functions as discriminatory func-tions, which may not perform as well as foldingpotentials.
Structure sampling and evaluation have con¯ict-ing needs. We need simpli®ed models to reducethe dimensionality of the sampling space to makethe computations tractable. At the same time, tomake the best selections, we need structures withfull atomic detail to represent potential energy sur-face with enough accuracy to allow discriminationby energy functions. Unfortunately, generating andevaluating all-atom structures is a time-consumingprocess and cannot be done for huge numbers ofconformations.
We tackle this problem by sampling low resol-ution structures exhaustively, and performing the®nal selection with a limited, yet promising, set ofall-atom structures. Our approach starts with anexhaustive enumeration of all possible folds usinga highly simpli®ed tetrahedral lattice model. A setof ®lters are then applied to these folds, primarilyin the form of discriminatory functions. As the ®l-ters are applied, we add more detail to the models,until one ®nal all-atom model remains. Using this
puri®cation scheme, many non-native structuresare pruned out due to high energy even before all-atom structures are built. Here, we describe ourmethodology in detail and provide a comprehen-sive analysis of its performance.
Results and Discussion
Simplified lattice representation is able torepresent protein conformations well
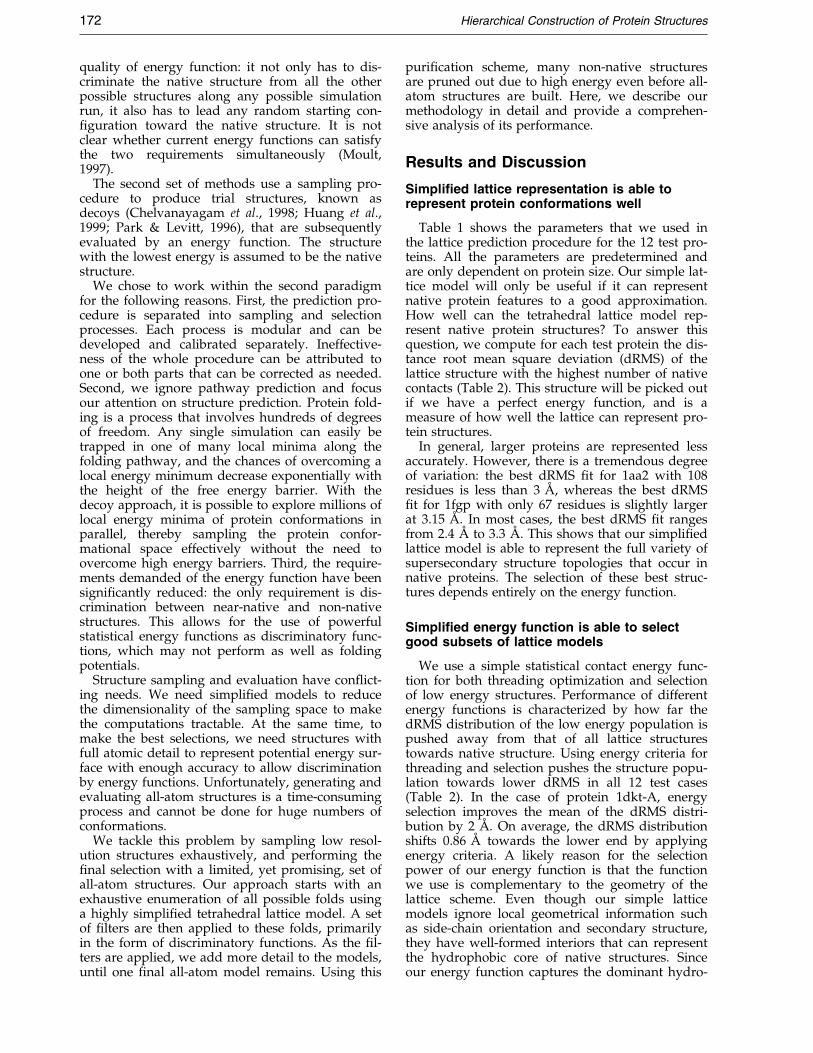
Table 1 shows the parameters that we used inthe lattice prediction procedure for the 12 test pro-teins. All the parameters are predetermined andare only dependent on protein size. Our simple lat-tice model will only be useful if it can representnative protein features to a good approximation.How well can the tetrahedral lattice model rep-resent native protein structures? To answer thisquestion, we compute for each test protein the dis-tance root mean square deviation (dRMS) of thelattice structure with the highest number of nativecontacts (Table 2). This structure will be picked outif we have a perfect energy function, and is ameasure of how well the lattice can represent pro-tein structures.
In general, larger proteins are represented lessaccurately. However, there is a tremendous degreeof variation: the best dRMS ®t for 1aa2 with 108residues is less than 3 AÊ , whereas the best dRMS®t for 1fgp with only 67 residues is slightly largerat 3.15 AÊ . In most cases, the best dRMS ®t rangesfrom 2.4 AÊ to 3.3 AÊ . This shows that our simpli®edlattice model is able to represent the full variety ofsupersecondary structure topologies that occur innative proteins. The selection of these best struc-tures depends entirely on the energy function.
Simplified energy function is able to selectgood subsets of lattice models
We use a simple statistical contact energy func-tion for both threading optimization and selectionof low energy structures. Performance of differentenergy functions is characterized by how far thedRMS distribution of the low energy population ispushed away from that of all lattice structurestowards native structure. Using energy criteria forthreading and selection pushes the structure popu-lation towards lower dRMS in all 12 test cases(Table 2). In the case of protein 1dkt-A, energyselection improves the mean of the dRMS distri-bution by 2 AÊ . On average, the dRMS distributionshifts 0.86 AÊ towards the lower end by applyingenergy criteria. A likely reason for the selectionpower of our energy function is that the functionwe use is complementary to the geometry of thelattice scheme. Even though our simple latticemodels ignore local geometrical information suchas side-chain orientation and secondary structure,they have well-formed interiors that can representthe hydrophobic core of native structures. Sinceour energy function captures the dominant hydro-
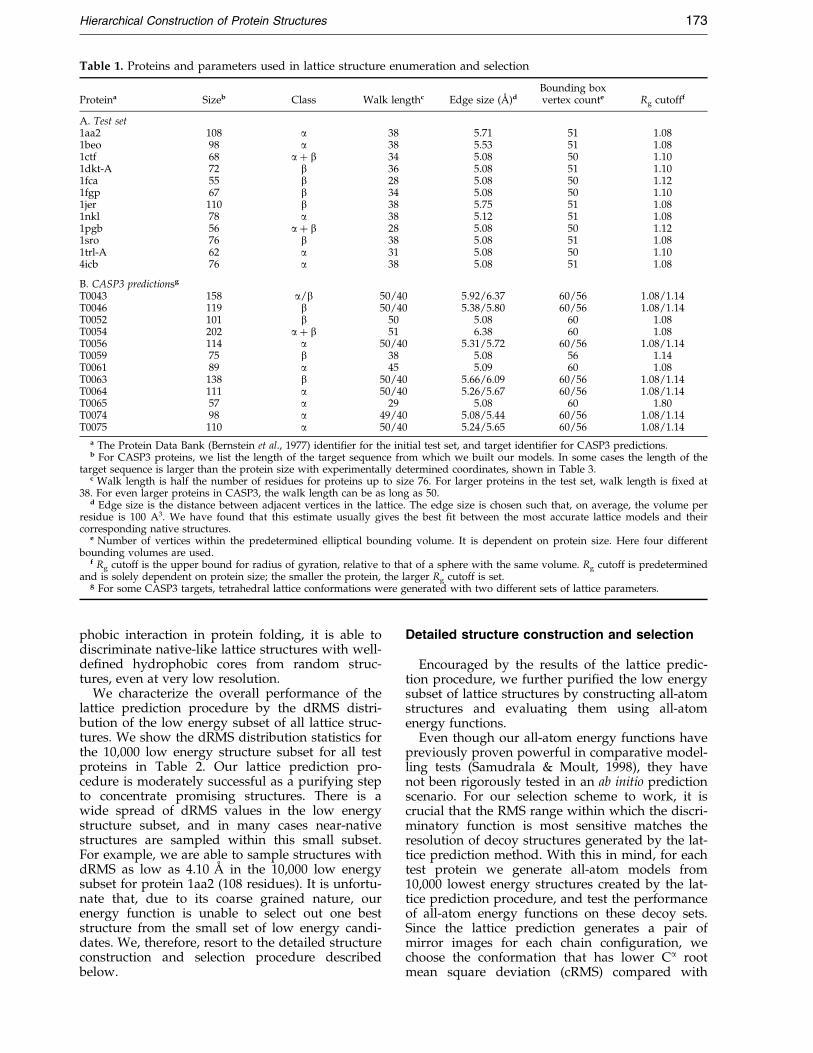
Table 1. Proteins and parameters used in lattice structure enumeration and selection
Proteina Sizeb Class Walk lengthc Edge size (AÊ )dBounding boxvertex counte Rg cutofff
A. Test set1aa2 108 a 38 5.71 51 1.081beo 98 a 38 5.53 51 1.081ctf 68 a � b 34 5.08 50 1.101dkt-A 72 b 36 5.08 51 1.101fca 55 b 28 5.08 50 1.121fgp 67 b 34 5.08 50 1.101jer 110 b 38 5.75 51 1.081nkl 78 a 38 5.12 51 1.081pgb 56 a � b 28 5.08 50 1.121sro 76 b 38 5.08 51 1.081trl-A 62 a 31 5.08 50 1.104icb 76 a 38 5.08 51 1.08
B. CASP3 predictionsg
T0043 158 a/b 50/40 5.92/6.37 60/56 1.08/1.14T0046 119 b 50/40 5.38/5.80 60/56 1.08/1.14T0052 101 b 50 5.08 60 1.08T0054 202 a � b 51 6.38 60 1.08T0056 114 a 50/40 5.31/5.72 60/56 1.08/1.14T0059 75 b 38 5.08 56 1.14T0061 89 a 45 5.09 60 1.08T0063 138 b 50/40 5.66/6.09 60/56 1.08/1.14T0064 111 a 50/40 5.26/5.67 60/56 1.08/1.14T0065 57 a 29 5.08 60 1.80T0074 98 a 49/40 5.08/5.44 60/56 1.08/1.14T0075 110 a 50/40 5.24/5.65 60/56 1.08/1.14
a The Protein Data Bank (Bernstein et al., 1977) identi®er for the initial test set, and target identi®er for CASP3 predictions.b For CASP3 proteins, we list the length of the target sequence from which we built our models. In some cases the length of the
target sequence is larger than the protein size with experimentally determined coordinates, shown in Table 3.c Walk length is half the number of residues for proteins up to size 76. For larger proteins in the test set, walk length is ®xed at
38. For even larger proteins in CASP3, the walk length can be as long as 50.d Edge size is the distance between adjacent vertices in the lattice. The edge size is chosen such that, on average, the volume per
residue is 100 A3. We have found that this estimate usually gives the best ®t between the most accurate lattice models and theircorresponding native structures.
e Number of vertices within the predetermined elliptical bounding volume. It is dependent on protein size. Here four differentbounding volumes are used.
f Rg cutoff is the upper bound for radius of gyration, relative to that of a sphere with the same volume. Rg cutoff is predeterminedand is solely dependent on protein size; the smaller the protein, the larger Rg cutoff is set.
g For some CASP3 targets, tetrahedral lattice conformations were generated with two different sets of lattice parameters.
Hierarchical Construction of Protein Structures 173
phobic interaction in protein folding, it is able todiscriminate native-like lattice structures with well-de®ned hydrophobic cores from random struc-tures, even at very low resolution.
We characterize the overall performance of thelattice prediction procedure by the dRMS distri-bution of the low energy subset of all lattice struc-tures. We show the dRMS distribution statistics forthe 10,000 low energy structure subset for all testproteins in Table 2. Our lattice prediction pro-cedure is moderately successful as a purifying stepto concentrate promising structures. There is awide spread of dRMS values in the low energystructure subset, and in many cases near-nativestructures are sampled within this small subset.For example, we are able to sample structures withdRMS as low as 4.10 AÊ in the 10,000 low energysubset for protein 1aa2 (108 residues). It is unfortu-nate that, due to its coarse grained nature, ourenergy function is unable to select out one beststructure from the small set of low energy candi-dates. We, therefore, resort to the detailed structureconstruction and selection procedure describedbelow.
Detailed structure construction and selection
Encouraged by the results of the lattice predic-tion procedure, we further puri®ed the low energysubset of lattice structures by constructing all-atomstructures and evaluating them using all-atomenergy functions.
Even though our all-atom energy functions havepreviously proven powerful in comparative model-ling tests (Samudrala & Moult, 1998), they havenot been rigorously tested in an ab initio predictionscenario. For our selection scheme to work, it iscrucial that the RMS range within which the discri-minatory function is most sensitive matches theresolution of decoy structures generated by the lat-tice prediction method. With this in mind, for eachtest protein we generate all-atom models from10,000 lowest energy structures created by the lat-tice prediction procedure, and test the performanceof all-atom energy functions on these decoy sets.Since the lattice prediction generates a pair ofmirror images for each chain con®guration, wechoose the conformation that has lower Ca rootmean square deviation (cRMS) compared with
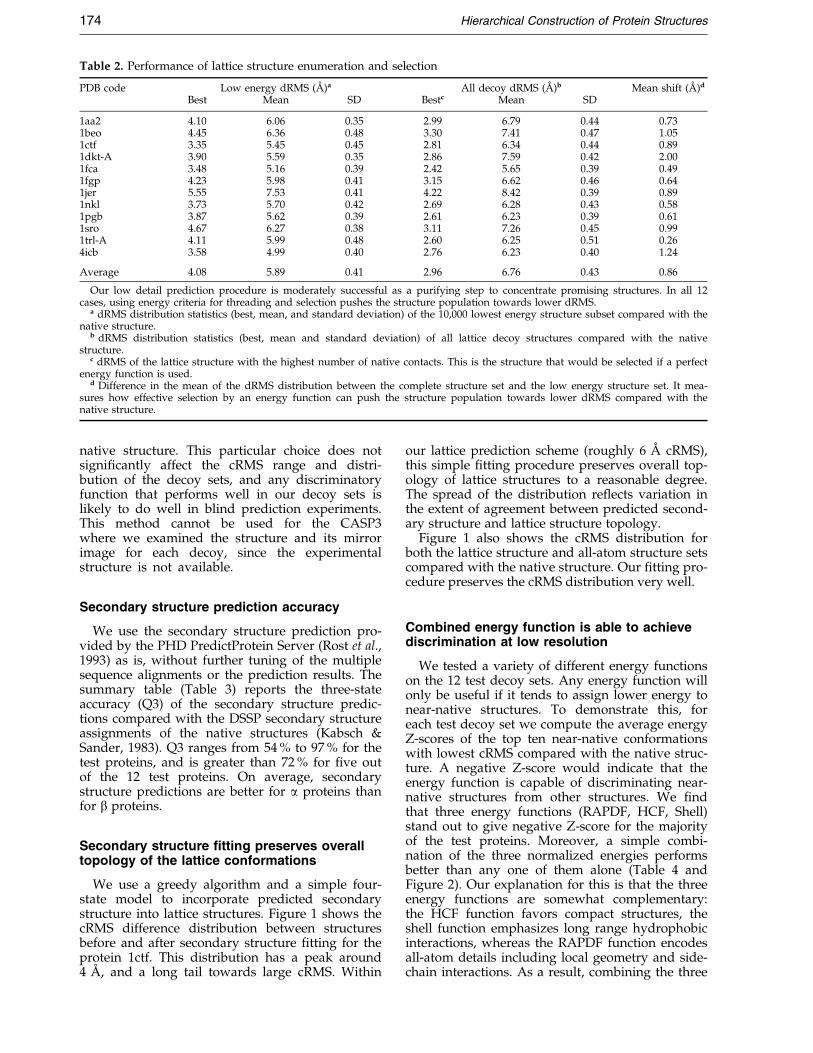
Table 2. Performance of lattice structure enumeration and selection
PDB code Low energy dRMS (AÊ )a All decoy dRMS (AÊ )b Mean shift (AÊ )d
Best Mean SD Bestc Mean SD
1aa2 4.10 6.06 0.35 2.99 6.79 0.44 0.731beo 4.45 6.36 0.48 3.30 7.41 0.47 1.051ctf 3.35 5.45 0.45 2.81 6.34 0.44 0.891dkt-A 3.90 5.59 0.35 2.86 7.59 0.42 2.001fca 3.48 5.16 0.39 2.42 5.65 0.39 0.491fgp 4.23 5.98 0.41 3.15 6.62 0.46 0.641jer 5.55 7.53 0.41 4.22 8.42 0.39 0.891nkl 3.73 5.70 0.42 2.69 6.28 0.43 0.581pgb 3.87 5.62 0.39 2.61 6.23 0.39 0.611sro 4.67 6.27 0.38 3.11 7.26 0.45 0.991trl-A 4.11 5.99 0.48 2.60 6.25 0.51 0.264icb 3.58 4.99 0.40 2.76 6.23 0.40 1.24
Average 4.08 5.89 0.41 2.96 6.76 0.43 0.86
Our low detail prediction procedure is moderately successful as a purifying step to concentrate promising structures. In all 12cases, using energy criteria for threading and selection pushes the structure population towards lower dRMS.
a dRMS distribution statistics (best, mean, and standard deviation) of the 10,000 lowest energy structure subset compared with thenative structure.
b dRMS distribution statistics (best, mean and standard deviation) of all lattice decoy structures compared with the nativestructure.
c dRMS of the lattice structure with the highest number of native contacts. This is the structure that would be selected if a perfectenergy function is used.
d Difference in the mean of the dRMS distribution between the complete structure set and the low energy structure set. It mea-sures how effective selection by an energy function can push the structure population towards lower dRMS compared with thenative structure.
174 Hierarchical Construction of Protein Structures
native structure. This particular choice does notsigni®cantly affect the cRMS range and distri-bution of the decoy sets, and any discriminatoryfunction that performs well in our decoy sets islikely to do well in blind prediction experiments.This method cannot be used for the CASP3where we examined the structure and its mirrorimage for each decoy, since the experimentalstructure is not available.
Secondary structure prediction accuracy
We use the secondary structure prediction pro-vided by the PHD PredictProtein Server (Rost et al.,1993) as is, without further tuning of the multiplesequence alignments or the prediction results. Thesummary table (Table 3) reports the three-stateaccuracy (Q3) of the secondary structure predic-tions compared with the DSSP secondary structureassignments of the native structures (Kabsch &Sander, 1983). Q3 ranges from 54 % to 97 % for thetest proteins, and is greater than 72 % for ®ve outof the 12 test proteins. On average, secondarystructure predictions are better for a proteins thanfor b proteins.
Secondary structure fitting preserves overalltopology of the lattice conformations
We use a greedy algorithm and a simple four-state model to incorporate predicted secondarystructure into lattice structures. Figure 1 shows thecRMS difference distribution between structuresbefore and after secondary structure ®tting for theprotein 1ctf. This distribution has a peak around4 AÊ , and a long tail towards large cRMS. Within
our lattice prediction scheme (roughly 6 AÊ cRMS),this simple ®tting procedure preserves overall top-ology of lattice structures to a reasonable degree.The spread of the distribution re¯ects variation inthe extent of agreement between predicted second-ary structure and lattice structure topology.
Figure 1 also shows the cRMS distribution forboth the lattice structure and all-atom structure setscompared with the native structure. Our ®tting pro-cedure preserves the cRMS distribution very well.
Combined energy function is able to achievediscrimination at low resolution
We tested a variety of different energy functionson the 12 test decoy sets. Any energy function willonly be useful if it tends to assign lower energy tonear-native structures. To demonstrate this, foreach test decoy set we compute the average energyZ-scores of the top ten near-native conformationswith lowest cRMS compared with the native struc-ture. A negative Z-score would indicate that theenergy function is capable of discriminating near-native structures from other structures. We ®ndthat three energy functions (RAPDF, HCF, Shell)stand out to give negative Z-score for the majorityof the test proteins. Moreover, a simple combi-nation of the three normalized energies performsbetter than any one of them alone (Table 4 andFigure 2). Our explanation for this is that the threeenergy functions are somewhat complementary:the HCF function favors compact structures, theshell function emphasizes long range hydrophobicinteractions, whereas the RAPDF function encodesall-atom details including local geometry and side-chain interactions. As a result, combining the three
Table 3. Summary of overall performance for test set and CASP3 predictions
Protein Size Q3aAll cRMS range
(AÊ )bBest all
cRMS (AÊ )cFragment
sized
Predictionfragment cRMS
(AÊ )d
Best fragmentcRMS sampled
(AÊ )d
A. Initial test set1aa2e 108 76 6.18-15.28 11.081beoe 98 54 6.96-15.94 11.131ctf 68 72 5.45-13.54 5.751dkt-A 72 72 6.68-14.79 7.801fca 55 78 5.09-12.06 5.901fgpe 67 66 7.80-14.40 10.931jere 110 69 9.55-17.53 13.601nkle 78 78 5.26-14.23 5.701pgb 56 57 5.60-13.30 8.411sroe 76 65 7.30-15.42 9.681trl-A 62 97 5.30-13.16 6.354icb 76 86 4.74-13.28 4.95
B. CASP3 predictionsT0043 158 70 10.0-19.5 14.5 48 6.3 4.6T0046 119 67 10.1-19.2 13.9 39 6.6 5.1T0052 98 50 10.6-16.3 13.6 33 6.6 5.1T0054f 202 - - 15.5 202 15.5 -T0056 114 100 6.2-17.8 13.0 60 6.8 3.3T0059 71 80 7.4-15.7 11.6 46 6.7 5.4T0061 76 62 6.0-14.0 10.1 66 7.4 5.6T0063 135 60 10.8-22.0 15.1 35 6.4 4.0T0064 103 90 8.0-18.8 11.2 68 4.8 4.5T0065 31 90 2.4-7.6 4.1 31 4.1 2.4T0074 98 88 6.3-16.5 11.3 60 7.0 4.2T0075 88 78 6.0-17.0 9.8 77 7.7 5.5
a Percentage accuracy of the PHD three-state (helix, sheet, other) secondary structure prediction.b The range of cRMS for all the all-atom conformations sampled.c For each protein in the initial test set, we evaluate the cRMS between the experimental structure and the ®nal model for all resi-
dues. For each target in CASP3 predictions, we evaluate the cRMS between the experimental structure and the best model out of®ve for all residues.
d For each target in CASP3 predictions, we select a continuous fragment that ®ts the experimental structure best in at least oneof the ®ve models, and compute cRMS between the fragment of the best model and the corresponding part of the experimentalstructure. We also compute the best cRMS between any fragment with the same size in the all-atom structures sampled and thecorresponding part of the experimental structure.
e These proteins were targets from the second meeting on the Critical Assessment of protein Structure Prediction methods(CASP2).
f The experimental coordinates for T0054 were not made available during CASP3. The only data shown here were provided bythe CASP3 organizers.
Hierarchical Construction of Protein Structures 175
energy functions provides a better balance ofdifferent forces responsible for protein folding thanany single energy function alone.
We also use other measures to assess the discri-minatory power of the combined energy function,for example, correlation coef®cient between energyand cRMS, energy rank of near-native structurewith a certain cRMS cutoff, and average cRMS Z-scores for low energy conformations (Table 5). Weemphasize that even with our best efforts, the com-bined energy function only achieves moderate suc-cess in discriminating near-native structures fromother structures.
One consequence of the moderate discriminatorypower of the energy function is that cRMS of thelowest energy conformation is very noisy. This isparticularly evident in Figure 2(d): a near-nativestructure with cRMS of 5.3 AÊ is one of the threelowest energy conformations, but if we simplychoose the one lowest energy conformation, itscRMS is almost 11 AÊ away from the native struc-ture. Since our energy function is noisy and the
three lowest energy conformations have very simi-lar energy, it is not clear why we should chooseone in favor of the other two conformations. More-over, the lowest energy conformations share cer-tain structural features of the native protein,though they are in many cases overwhelmed bythe high energy of their speci®c non-native parts.We can enhance this shared structural featuresamong lowest energy conformations by averagingthe noise out in a proper way, thereby increasingthe chance of ®nding near-native structures,increasing signal-to-noise ratio and making theprediction more robust. We use consensus-baseddistance geometry to perform proper averaging,the results of which are described in detail below.
Consensus-based distance geometry improvesdistribution of near-native structures
Our consensus-based distance geometry pro-cedure is a proper averaging procedure over theset of candidate structures in distance space. Pre-
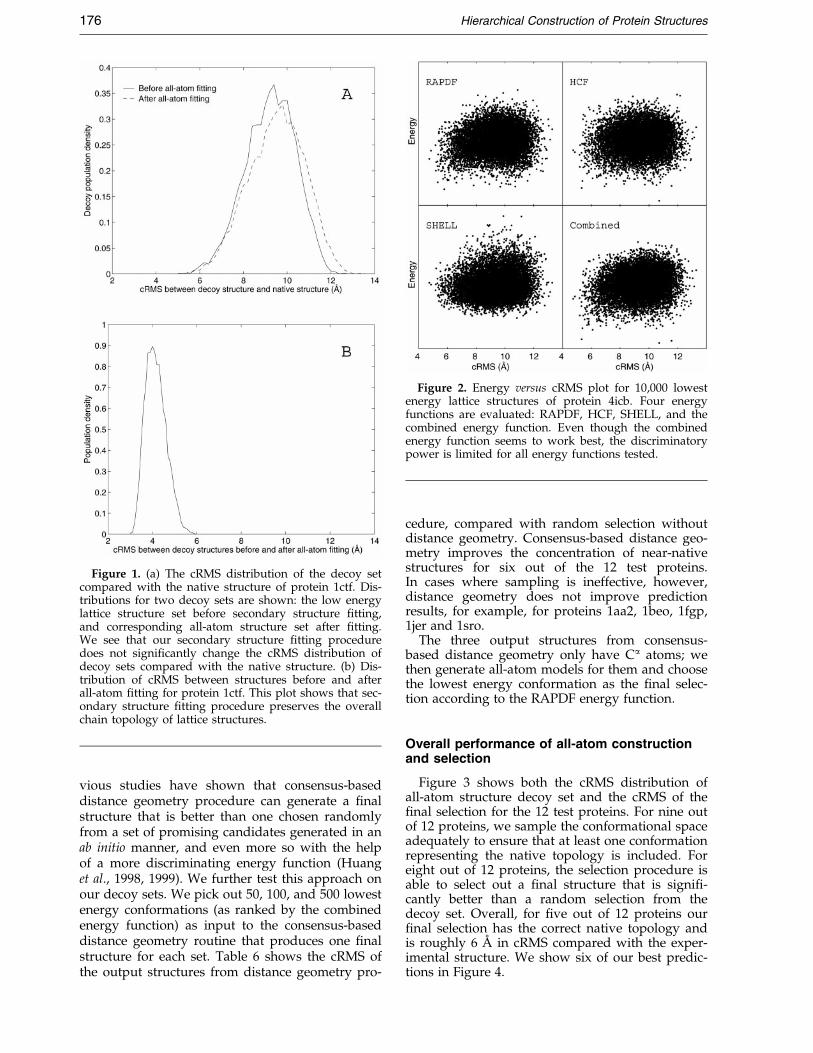
Figure 1. (a) The cRMS distribution of the decoy setcompared with the native structure of protein 1ctf. Dis-tributions for two decoy sets are shown: the low energylattice structure set before secondary structure ®tting,and corresponding all-atom structure set after ®tting.We see that our secondary structure ®tting proceduredoes not signi®cantly change the cRMS distribution ofdecoy sets compared with the native structure. (b) Dis-tribution of cRMS between structures before and afterall-atom ®tting for protein 1ctf. This plot shows that sec-ondary structure ®tting procedure preserves the overallchain topology of lattice structures.
Figure 2. Energy versus cRMS plot for 10,000 lowestenergy lattice structures of protein 4icb. Four energyfunctions are evaluated: RAPDF, HCF, SHELL, and thecombined energy function. Even though the combinedenergy function seems to work best, the discriminatorypower is limited for all energy functions tested.
176 Hierarchical Construction of Protein Structures
vious studies have shown that consensus-baseddistance geometry procedure can generate a ®nalstructure that is better than one chosen randomlyfrom a set of promising candidates generated in anab initio manner, and even more so with the helpof a more discriminating energy function (Huanget al., 1998, 1999). We further test this approach onour decoy sets. We pick out 50, 100, and 500 lowestenergy conformations (as ranked by the combinedenergy function) as input to the consensus-baseddistance geometry routine that produces one ®nalstructure for each set. Table 6 shows the cRMS ofthe output structures from distance geometry pro-
cedure, compared with random selection withoutdistance geometry. Consensus-based distance geo-metry improves the concentration of near-nativestructures for six out of the 12 test proteins.In cases where sampling is ineffective, however,distance geometry does not improve predictionresults, for example, for proteins 1aa2, 1beo, 1fgp,1jer and 1sro.
The three output structures from consensus-based distance geometry only have Ca atoms; wethen generate all-atom models for them and choosethe lowest energy conformation as the ®nal selec-tion according to the RAPDF energy function.
Overall performance of all-atom constructionand selection
Figure 3 shows both the cRMS distribution ofall-atom structure decoy set and the cRMS of the®nal selection for the 12 test proteins. For nine outof 12 proteins, we sample the conformational spaceadequately to ensure that at least one conformationrepresenting the native topology is included. Foreight out of 12 proteins, the selection procedure isable to select out a ®nal structure that is signi®-cantly better than a random selection from thedecoy set. Overall, for ®ve out of 12 proteins our®nal selection has the correct native topology andis roughly 6 AÊ in cRMS compared with the exper-imental structure. We show six of our best predic-tions in Figure 4.
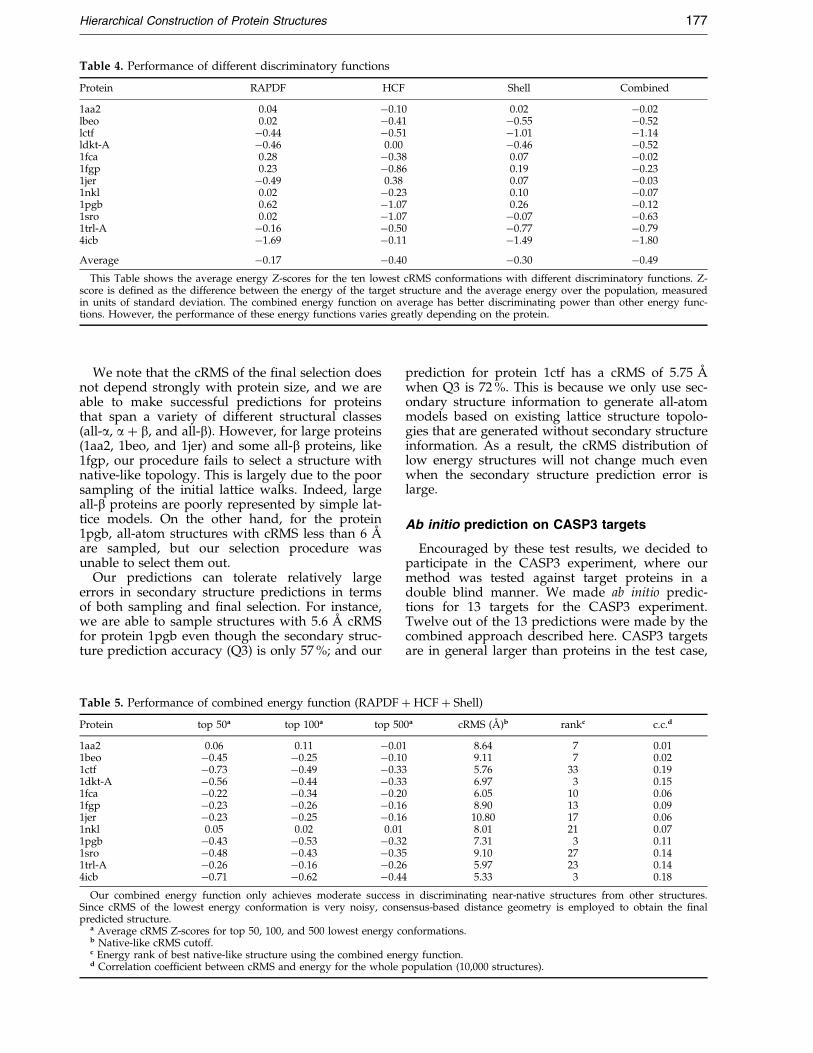
Table 4. Performance of different discriminatory functions
Protein RAPDF HCF Shell Combined
1aa2 0.04 ÿ0.10 0.02 ÿ0.02lbeo 0.02 ÿ0.41 ÿ0.55 ÿ0.52lctf ÿ0.44 ÿ0.51 ÿ1.01 ÿ1.14ldkt-A ÿ0.46 0.00 ÿ0.46 ÿ0.521fca 0.28 ÿ0.38 0.07 ÿ0.021fgp 0.23 ÿ0.86 0.19 ÿ0.231jer ÿ0.49 0.38 0.07 ÿ0.031nkl 0.02 ÿ0.23 0.10 ÿ0.071pgb 0.62 ÿ1.07 0.26 ÿ0.121sro 0.02 ÿ1.07 ÿ0.07 ÿ0.631trl-A ÿ0.16 ÿ0.50 ÿ0.77 ÿ0.794icb ÿ1.69 ÿ0.11 ÿ1.49 ÿ1.80
Average ÿ0.17 ÿ0.40 ÿ0.30 ÿ0.49
This Table shows the average energy Z-scores for the ten lowest cRMS conformations with different discriminatory functions. Z-score is de®ned as the difference between the energy of the target structure and the average energy over the population, measuredin units of standard deviation. The combined energy function on average has better discriminating power than other energy func-tions. However, the performance of these energy functions varies greatly depending on the protein.
Hierarchical Construction of Protein Structures 177
We note that the cRMS of the ®nal selection doesnot depend strongly with protein size, and we areable to make successful predictions for proteinsthat span a variety of different structural classes(all-a, a � b, and all-b). However, for large proteins(1aa2, 1beo, and 1jer) and some all-b proteins, like1fgp, our procedure fails to select a structure withnative-like topology. This is largely due to the poorsampling of the initial lattice walks. Indeed, largeall-b proteins are poorly represented by simple lat-tice models. On the other hand, for the protein1pgb, all-atom structures with cRMS less than 6 AÊ
are sampled, but our selection procedure wasunable to select them out.
Our predictions can tolerate relatively largeerrors in secondary structure predictions in termsof both sampling and ®nal selection. For instance,we are able to sample structures with 5.6 AÊ cRMSfor protein 1pgb even though the secondary struc-ture prediction accuracy (Q3) is only 57 %; and our
Table 5. Performance of combined energy function (RAPDF �Protein top 50a top 100a top 50
1aa2 0.06 0.11 ÿ0.011beo ÿ0.45 ÿ0.25 ÿ0.101ctf ÿ0.73 ÿ0.49 ÿ0.331dkt-A ÿ0.56 ÿ0.44 ÿ0.331fca ÿ0.22 ÿ0.34 ÿ0.201fgp ÿ0.23 ÿ0.26 ÿ0.161jer ÿ0.23 ÿ0.25 ÿ0.161nkl 0.05 0.02 0.011pgb ÿ0.43 ÿ0.53 ÿ0.321sro ÿ0.48 ÿ0.43 ÿ0.351trl-A ÿ0.26 ÿ0.16 ÿ0.264icb ÿ0.71 ÿ0.62 ÿ0.44
Our combined energy function only achieves moderate successSince cRMS of the lowest energy conformation is very noisy, conspredicted structure.
a Average cRMS Z-scores for top 50, 100, and 500 lowest energy cb Native-like cRMS cutoff.c Energy rank of best native-like structure using the combined ened Correlation coef®cient between cRMS and energy for the whole p
prediction for protein 1ctf has a cRMS of 5.75 AÊ
when Q3 is 72 %. This is because we only use sec-ondary structure information to generate all-atommodels based on existing lattice structure topolo-gies that are generated without secondary structureinformation. As a result, the cRMS distribution oflow energy structures will not change much evenwhen the secondary structure prediction error islarge.
Ab initio prediction on CASP3 targets
Encouraged by these test results, we decided toparticipate in the CASP3 experiment, where ourmethod was tested against target proteins in adouble blind manner. We made ab initio predic-tions for 13 targets for the CASP3 experiment.Twelve out of the 13 predictions were made by thecombined approach described here. CASP3 targetsare in general larger than proteins in the test case,
HCF � Shell)
0a cRMS (AÊ )b rankc c.c.d
8.64 7 0.019.11 7 0.025.76 33 0.196.97 3 0.156.05 10 0.068.90 13 0.0910.80 17 0.068.01 21 0.077.31 3 0.119.10 27 0.145.97 23 0.145.33 3 0.18
in discriminating near-native structures from other structures.ensus-based distance geometry is employed to obtain the ®nal
onformations.
rgy function.opulation (10,000 structures).
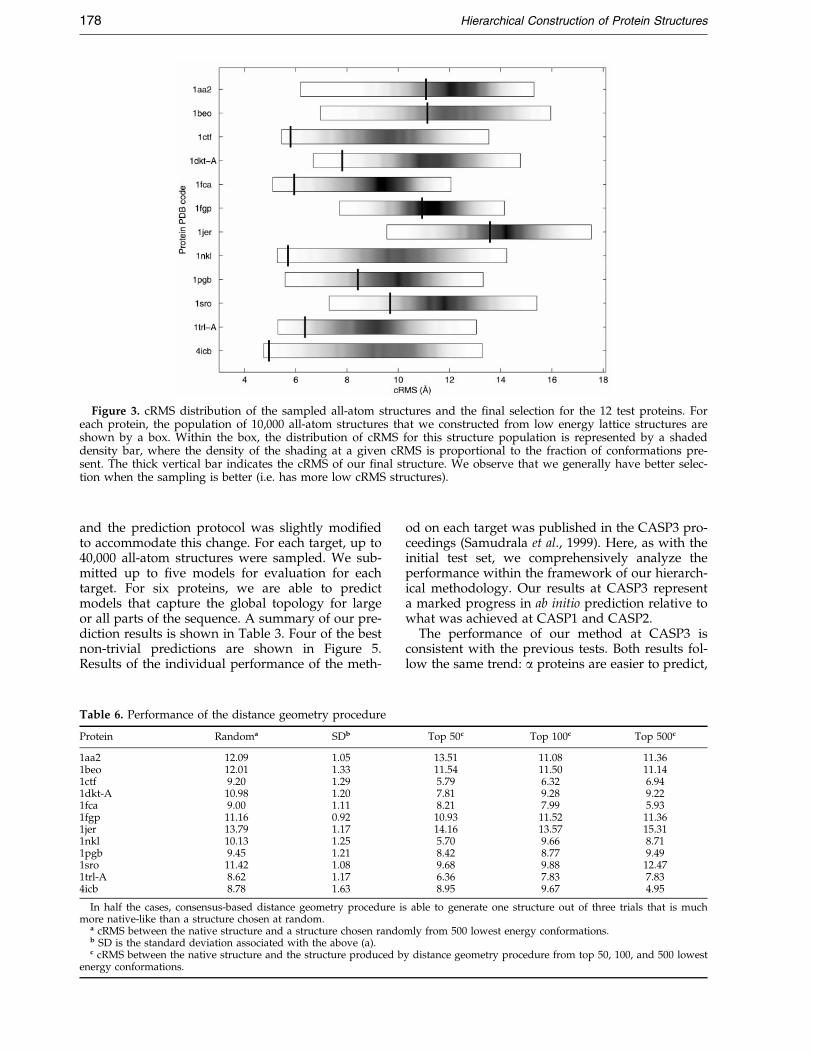
Figure 3. cRMS distribution of the sampled all-atom structures and the ®nal selection for the 12 test proteins. Foreach protein, the population of 10,000 all-atom structures that we constructed from low energy lattice structures areshown by a box. Within the box, the distribution of cRMS for this structure population is represented by a shadeddensity bar, where the density of the shading at a given cRMS is proportional to the fraction of conformations pre-sent. The thick vertical bar indicates the cRMS of our ®nal structure. We observe that we generally have better selec-tion when the sampling is better (i.e. has more low cRMS structures).
178 Hierarchical Construction of Protein Structures
and the prediction protocol was slightly modi®edto accommodate this change. For each target, up to40,000 all-atom structures were sampled. We sub-mitted up to ®ve models for evaluation for eachtarget. For six proteins, we are able to predictmodels that capture the global topology for largeor all parts of the sequence. A summary of our pre-diction results is shown in Table 3. Four of the bestnon-trivial predictions are shown in Figure 5.Results of the individual performance of the meth-
Table 6. Performance of the distance geometry procedure
Protein Randoma SDb
1aa2 12.09 1.051beo 12.01 1.331ctf 9.20 1.291dkt-A 10.98 1.201fca 9.00 1.111fgp 11.16 0.921jer 13.79 1.171nkl 10.13 1.251pgb 9.45 1.211sro 11.42 1.081trl-A 8.62 1.174icb 8.78 1.63
In half the cases, consensus-based distance geometry procedure imore native-like than a structure chosen at random.
a cRMS between the native structure and a structure chosen randob SD is the standard deviation associated with the above (a).c cRMS between the native structure and the structure produced b
energy conformations.
od on each target was published in the CASP3 pro-ceedings (Samudrala et al., 1999). Here, as with theinitial test set, we comprehensively analyze theperformance within the framework of our hierarch-ical methodology. Our results at CASP3 representa marked progress in ab initio prediction relative towhat was achieved at CASP1 and CASP2.
The performance of our method at CASP3 isconsistent with the previous tests. Both results fol-low the same trend: a proteins are easier to predict,
Top 50c Top 100c Top 500c
13.51 11.08 11.3611.54 11.50 11.145.79 6.32 6.947.81 9.28 9.228.21 7.99 5.9310.93 11.52 11.3614.16 13.57 15.315.70 9.66 8.718.42 8.77 9.499.68 9.88 12.476.36 7.83 7.838.95 9.67 4.95
s able to generate one structure out of three trials that is much
mly from 500 lowest energy conformations.
y distance geometry procedure from top 50, 100, and 500 lowest
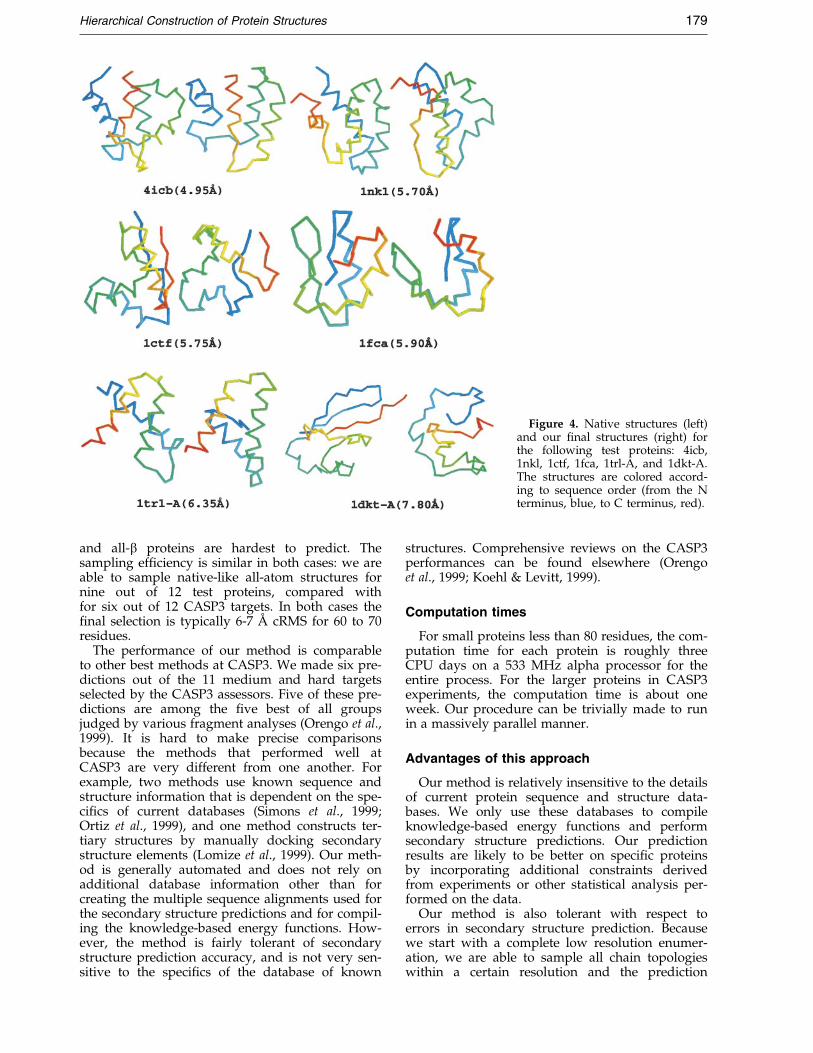
Figure 4. Native structures (left)and our ®nal structures (right) forthe following test proteins: 4icb,1nkl, 1ctf, 1fca, 1trl-A, and 1dkt-A.The structures are colored accord-ing to sequence order (from the Nterminus, blue, to C terminus, red).
Hierarchical Construction of Protein Structures 179
and all-b proteins are hardest to predict. Thesampling ef®ciency is similar in both cases: we areable to sample native-like all-atom structures fornine out of 12 test proteins, compared withfor six out of 12 CASP3 targets. In both cases the®nal selection is typically 6-7 AÊ cRMS for 60 to 70residues.
The performance of our method is comparableto other best methods at CASP3. We made six pre-dictions out of the 11 medium and hard targetsselected by the CASP3 assessors. Five of these pre-dictions are among the ®ve best of all groupsjudged by various fragment analyses (Orengo et al.,1999). It is hard to make precise comparisonsbecause the methods that performed well atCASP3 are very different from one another. Forexample, two methods use known sequence andstructure information that is dependent on the spe-ci®cs of current databases (Simons et al., 1999;Ortiz et al., 1999), and one method constructs ter-tiary structures by manually docking secondarystructure elements (Lomize et al., 1999). Our meth-od is generally automated and does not rely onadditional database information other than forcreating the multiple sequence alignments used forthe secondary structure predictions and for compil-ing the knowledge-based energy functions. How-ever, the method is fairly tolerant of secondarystructure prediction accuracy, and is not very sen-sitive to the speci®cs of the database of known
structures. Comprehensive reviews on the CASP3performances can be found elsewhere (Orengoet al., 1999; Koehl & Levitt, 1999).
Computation times
For small proteins less than 80 residues, the com-putation time for each protein is roughly threeCPU days on a 533 MHz alpha processor for theentire process. For the larger proteins in CASP3experiments, the computation time is about oneweek. Our procedure can be trivially made to runin a massively parallel manner.
Advantages of this approach
Our method is relatively insensitive to the detailsof current protein sequence and structure data-bases. We only use these databases to compileknowledge-based energy functions and performsecondary structure predictions. Our predictionresults are likely to be better on speci®c proteinsby incorporating additional constraints derivedfrom experiments or other statistical analysis per-formed on the data.
Our method is also tolerant with respect toerrors in secondary structure prediction. Becausewe start with a complete low resolution enumer-ation, we are able to sample all chain topologieswithin a certain resolution and the prediction
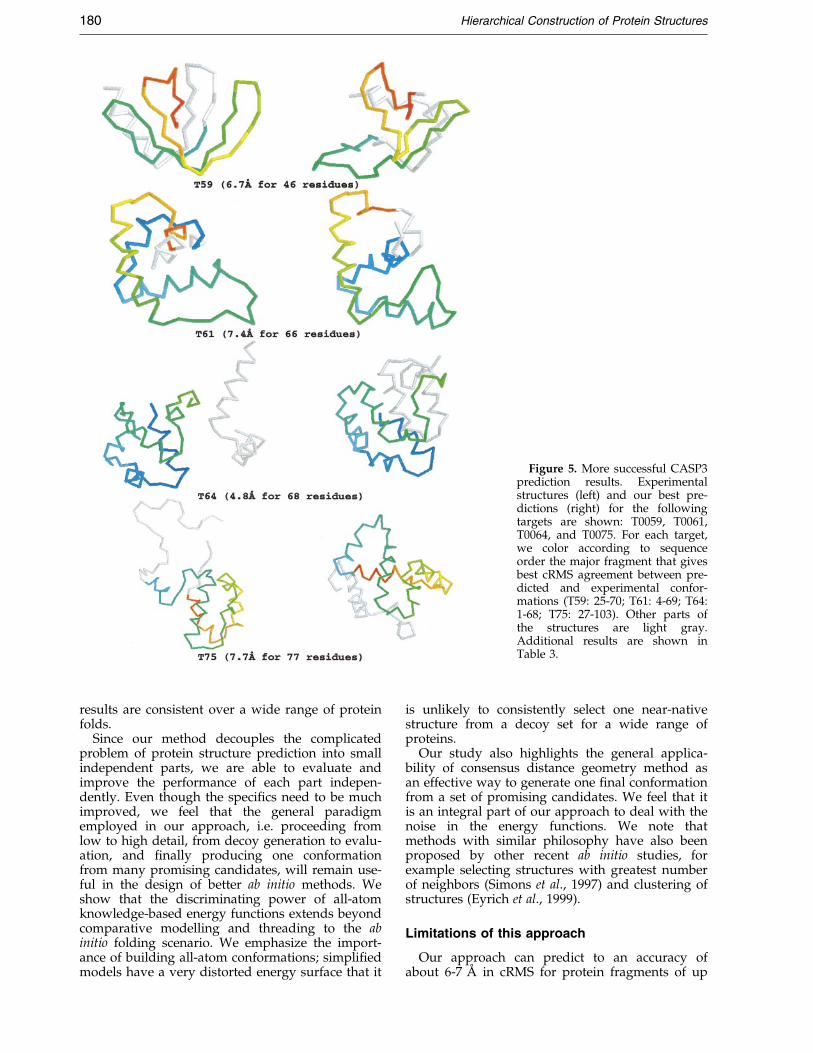
Figure 5. More successful CASP3prediction results. Experimentalstructures (left) and our best pre-dictions (right) for the followingtargets are shown: T0059, T0061,T0064, and T0075. For each target,we color according to sequenceorder the major fragment that givesbest cRMS agreement between pre-dicted and experimental confor-mations (T59: 25-70; T61: 4-69; T64:1-68; T75: 27-103). Other parts ofthe structures are light gray.Additional results are shown inTable 3.
180 Hierarchical Construction of Protein Structures
results are consistent over a wide range of proteinfolds.
Since our method decouples the complicatedproblem of protein structure prediction into smallindependent parts, we are able to evaluate andimprove the performance of each part indepen-dently. Even though the speci®cs need to be muchimproved, we feel that the general paradigmemployed in our approach, i.e. proceeding fromlow to high detail, from decoy generation to evalu-ation, and ®nally producing one conformationfrom many promising candidates, will remain use-ful in the design of better ab initio methods. Weshow that the discriminating power of all-atomknowledge-based energy functions extends beyondcomparative modelling and threading to the abinitio folding scenario. We emphasize the import-ance of building all-atom conformations; simpli®edmodels have a very distorted energy surface that it
is unlikely to consistently select one near-nativestructure from a decoy set for a wide range ofproteins.
Our study also highlights the general applica-bility of consensus distance geometry method asan effective way to generate one ®nal conformationfrom a set of promising candidates. We feel that itis an integral part of our approach to deal with thenoise in the energy functions. We note thatmethods with similar philosophy have also beenproposed by other recent ab initio studies, forexample selecting structures with greatest numberof neighbors (Simons et al., 1997) and clustering ofstructures (Eyrich et al., 1999).
Limitations of this approach
Our approach can predict to an accuracy ofabout 6-7 AÊ in cRMS for protein fragments of up
Hierarchical Construction of Protein Structures 181
to 80 residues, and is not restricted to particularstructural classes. However, it fails for proteinswith complicated supersecondary structure topolo-gies. Sampling appears to be the bottleneck of ourapproach: the low resolution of the lattice modelultimately limits the sampling quality, thus puttingan upper limit on the predictive power of thisapproach.
Our procedure generates protein models withlow resolution. Such rough models are not verylikely to be useful for functional studies in general(Wei et al., 1999). However, when treated withcaution and combined with experimental studies,our models may provide insights for further exper-iments in speci®c cases (Samudrala et al., 2000a).
Directions for future work
Our prediction results can be improved by usingpredicted tertiary contacts (Ortiz et al., 1998) andmore accurate secondary structure predictions(Jones, 1999; http://globin.bio.warwick.ac.uk/psipred). In a more fundamental way, we need toovercome the sampling limit of the lattice model.This can be achieved by replacing the lattice modelby knowledge-based off-lattice models, and repla-cing exhaustive enumeration by Monte Carlo mini-mization (Simons et al., 1997).
Another area of improvement is the energy func-tion. Knowledge-based energy functions have out-performed physical energy functions in manydiscriminatory tests. However, some promisingphysical energy functions have recently been pro-posed with discriminatory power comparable toknowledge-based energy functions, and with theadvantage of clear underlying physics (Lazaridis &Karplus, 1999). Further testing is required to ®ndthe optimal energy function that works best for abinitio prediction.
We hope ultimately to generate better decoy setsthat can fool the best energy functions and betterenergy functions that can discriminate the hardestdecoy sets. We believe that this is the most power-ful way to approach realistic ab initio protein struc-ture prediction.
Methods
Overview
A typical ¯ow chart of our procedure for protein ter-tiary structure prediction is shown in Figure 6. Wedescribe the individual components of our combinedhierarchical approach in detail below.
Lattice enumeration and selection
We represent the simpli®ed chain topology of proteinstructure as a self-avoiding walk on a tetrahedral lattice.A full description of the methodology is given elsewhere(Hinds & Levitt, 1992, 1994). For small proteins with nomore than 76 residues, we choose a walk length suchthat on average each vertex represents two residues. Forlarger proteins, we ®x the walk length to an upper limit
of 38 vertices. Lattice spacing between vertices is scaledbased on the mean Ca-Ca distance obtained from a data-base of protein conformations. We also construct prede-®ned elliptical bounding volumes. To ensure diversity ofthe lattice walks, these bounding volumes contain 20 %to 50 % more vertices than will be used by any particularstructure.
We exhaustively enumerate all possible bounded lat-tice walks and pick out walks that are reasonably com-pact judged by a radius of gyration of no more than 1.14times that of a sphere with the same volume. The criteriaof compactness is also prede®ned: we allow less compactstructures for short lattice walks because small proteinstend to be more irregular in shape. The total number ofsuch compact lattice structures depends on the chainlength but is never more than twenty million.
Since there are more residues than vertices, we threadthe residues into every lattice walk using an iterativedynamic programming method that quickly convergesto a locally optimal arrangement: no more than threeresidues are positioned between each pair of latticepoints along the walk and each lattice point is occupiedby a speci®c residue. After threading optimization, wecalculate the energy for each lattice walk and the subsetof structures with lowest energies are then selected forsubsequent all-atom analysis.
The energy function we use is a residue-residue con-tact function. We count residue-residue contacts in a lat-tice structure in such a way that the total numbers oflong-range contacts in lattice and actual structures areapproximately the same. Contact energy parameters arederived from pairwise amino acid contact frequencies ina database of experimentally determined structures as:
euv � ÿkT ln
Xp
Cuvp
Xp
Cp
TpTuvp
�1�
where euv is the effective energy of a contact betweenamino acid types u and v, and p varies over all proteinsin the database. For each protein p, Cp is the number oftertiary contacts, Cuvp is the number of u-v contacts, Tp isthe total number of possible tertiary contacts, and Tuvp isthe total number of possible u-v tertiary contacts. A ter-tiary contact is de®ned between two residues wherever anon-hydrogen atom of one residue approaches within4.5 AÊ of a non-hydrogen atom of the other residue, andthe two residues are at least ®ve sequence positionsaway from one another.
Secondary structure prediction
We use the PHD PredictProtein Server (http://www.embl-heidelberg.de) (Rost et al., 1993) to predictsecondary structures of the sequences to be modeled. Nomanual adjustment was made to the predictions. Weassign helix or sheet conformation to those residues withhigh con®dence prediction from the PHD server (>5),and do not impose secondary structures on any otherresidues.
Secondary structure fitting and all-atomstructure generation
The lattice structures from our simple lattice predic-tion only capture the overall chain topology and comple-tely lack secondary structure and side-chain detail. We
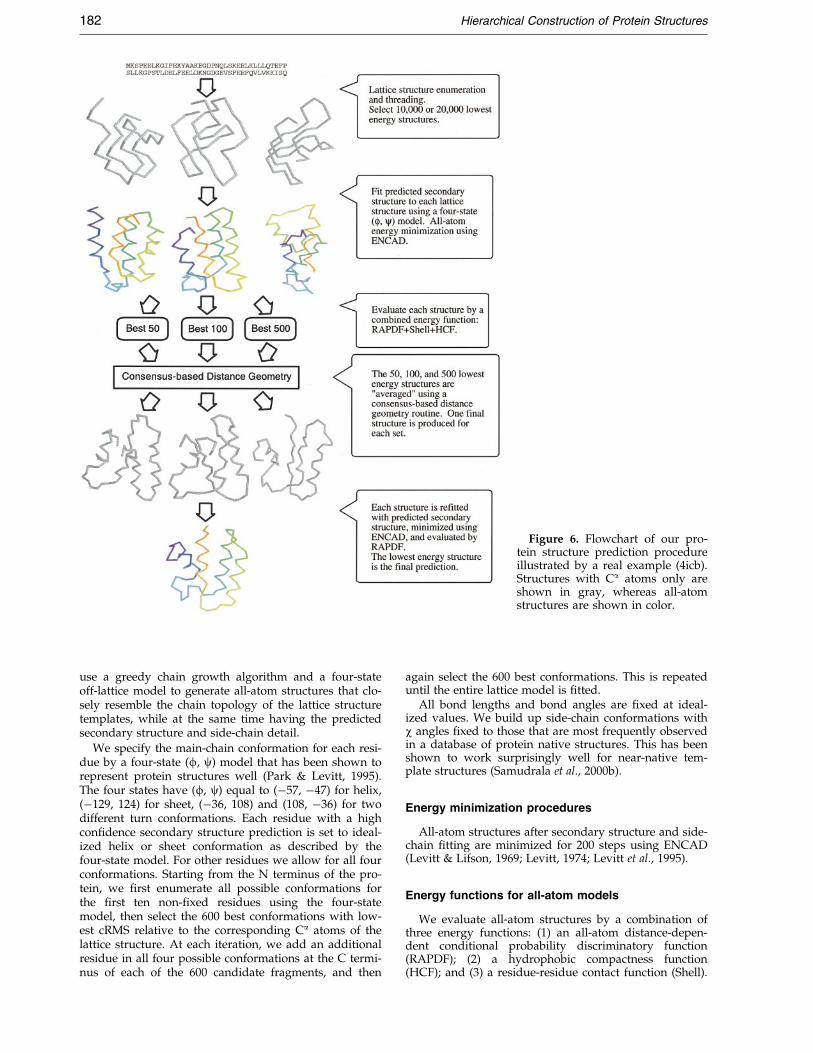
Figure 6. Flowchart of our pro-tein structure prediction procedureillustrated by a real example (4icb).Structures with Ca atoms only areshown in gray, whereas all-atomstructures are shown in color.
182 Hierarchical Construction of Protein Structures
use a greedy chain growth algorithm and a four-stateoff-lattice model to generate all-atom structures that clo-sely resemble the chain topology of the lattice structuretemplates, while at the same time having the predictedsecondary structure and side-chain detail.
We specify the main-chain conformation for each resi-due by a four-state (f, c) model that has been shown torepresent protein structures well (Park & Levitt, 1995).The four states have (f, c) equal to (ÿ57, ÿ47) for helix,(ÿ129, 124) for sheet, (ÿ36, 108) and (108, ÿ36) for twodifferent turn conformations. Each residue with a highcon®dence secondary structure prediction is set to ideal-ized helix or sheet conformation as described by thefour-state model. For other residues we allow for all fourconformations. Starting from the N terminus of the pro-tein, we ®rst enumerate all possible conformations forthe ®rst ten non-®xed residues using the four-statemodel, then select the 600 best conformations with low-est cRMS relative to the corresponding Ca atoms of thelattice structure. At each iteration, we add an additionalresidue in all four possible conformations at the C termi-nus of each of the 600 candidate fragments, and then
again select the 600 best conformations. This is repeateduntil the entire lattice model is ®tted.
All bond lengths and bond angles are ®xed at ideal-ized values. We build up side-chain conformations withw angles ®xed to those that are most frequently observedin a database of protein native structures. This has beenshown to work surprisingly well for near-native tem-plate structures (Samudrala et al., 2000b).
Energy minimization procedures
All-atom structures after secondary structure and side-chain ®tting are minimized for 200 steps using ENCAD(Levitt & Lifson, 1969; Levitt, 1974; Levitt et al., 1995).
Energy functions for all-atom models
We evaluate all-atom structures by a combination ofthree energy functions: (1) an all-atom distance-depen-dent conditional probability discriminatory function(RAPDF); (2) a hydrophobic compactness function(HCF); and (3) a residue-residue contact function (Shell).
Hierarchical Construction of Protein Structures 183
We ®rst normalize the energies of each function respect-ively, and then combine all three energies with equalweights.
Residue-specific all-atom probability discriminatoryfunction (RAPDF)
RAPDF is an all-atom distance dependent knowledge-based energy function that indicates the probability of aconformation being native-like given a set of inter-atomicdistances (Samudrala & Moult, 1998). We use a set of312 unique folds from the SCOP database (Hubbard et al.,1997) to compile the RAPDF energy function. We divideall non-hydrogen atoms into a total of 167 residue-speci®c atom types. We divide distances into a total of18 distance bins: 1 AÊ bins from 3 AÊ to 20 AÊ , and one sep-arate bin for the 0-3 AÊ range. The energy eab for a par-ticular pair of atom types, a and b, is computed thus:
eab � ÿ lnN�dab�=�dN�dab�
�abN�dab�=�d�abN�dab� �2�
where N(dab) is the number of observations of atomtypes a and b in a particular distance bin d in the data-base of experimental protein structures, �d is summationover all distance bins d, and �ab is summation over allpairs of atom types a and b.
The total RAPDF energy, evaluated by summing theenergies for all distances and corresponding atom pairs,represents the negative log conditional probability thatwe are observing a native conformation. A completedescription of RAPDF can be found elsewhere(Samudrala & Moult, 1998).
Hydrophobic compactness function (HCF)
Hydrophobic compactness function (HCF) measuresthe compactness of a structure. It is calculated using thefollowing formula:
HCF � �i��xi ÿ �x�2 � �yi ÿ �y�2 � �zi ÿ �z�2�N
�3�
where N is the number of carbon atoms in the protein,and x, y, z are the Cartesian coordinates of the carbonatoms.
Residue-residue contact function (Shell)
The shell energy function (Park et al., 1997) is a pair-wise residue contact function. Two residues are said tobe in contact if their interaction centers, located 3 AÊ fromthe Ca atom along the Ca-Ca vector, are within 7 AÊ . Thetotal energy for a conformation is then the sum of con-tact energies for all residue pairs that are in contact. Thecontact energy euv for residue types u and v is computedin a similar way to the energy function that we use forselecting lattice structures:
euv � ÿkT ln
Xp
Cuvp
Xp
Cp
TpTuvp
�4�
where for each protein p, Cuvp is the number of contactcounts for residue types u, and v, Cp is the total numberof contacts, and Tuvp is the number of residue pairs oftype u and v separated by at least two residues in
sequence. Tp, the total number of possible tertiary con-tacts, is calculated in the following way:
Tp � �Np ÿ 2��Np ÿ 1�=2 �5�where Np is the number of residues for protein p.
Consensus-based distance geometry
We use consensus-based distance geometry to pro-duce a single Cartesian structure from a set of lowestenergy conformations. Restraints for metric matrix dis-tance geometry are taken directly from the lowest energyconformation sets by measuring and storing inter-Ca dis-tance in 1 AÊ bins. The upper and lower bounds for eachdistance are determined by a jury process. Each distancereceive a weight equal to the Boltzmann weight of thestructure from which it was measured, i.e.:
wi � exp�ÿEi=kT��i exp�ÿEi=kT� �6�
where Ei is the energy for the ith structure in the lowestenergy set, and kT is set to 10. In the jury process, thedistance bin that received the most weighted votes wasused to set the upper and lower bounds for a given Ca-Ca distance.
Distance geometry calculations are performed usingthe program distgeom from the TINKER suite (http://dasher.wustl.edu/tinker/) to compute a single Cartesianstructure consistent with the most frequently observedCa-Ca distances in the lowest energy subset of confor-mations. The generated structure is re®ned via 10,000steps of simulated annealing against a set of penaltyfunctions to enforce local geometry, chirality, excludedvolume, and the input distance restraints. Additionaldetails can be found elsewhere (Huang et al., 1998;Samudrala et al., 1999).
Structure comparison
In our study of lattice prediction, we compare struc-tures using the rmsd of corresponding Ca-Ca distances(dRMS) (Cohen & Sternberg, 1980). Our lattice enumer-ation procedure only generates low resolution Ca struc-tures with no secondary structure or side-chaininformation, and our energy function is based entirelyon distance. As a result, the lattice prediction proceduredoes not discriminate between a structure and its mirrorimage. dRMS, which is based on distance and also doesnot discriminate between mirror images, is therefore agood measure of the performance of our lattice predic-tion procedure.
For our subsequent study of all-atom prediction, thesymmetry in supersecondary structure level is brokendue to handedness of secondary structure elements andside-chain conformations, hence mirror image latticestructures are readily discernible by the all-atom energyfunction. To evaluate the performance of our all-atomprediction procedure, we use the more familiar cRMS oftwo structures with best superposition (McLachlan,1971).
Selection of test proteins
We select as a test set 12 small globular proteins withless than 110 residues representing different fold classes(Table 1). We choose half of these proteins from targets
184 Hierarchical Construction of Protein Structures
for the CASP2 meeting because they represent more rea-listic test cases. Test proteins were not used in compi-lation of the energy functions, i.e. our procedure isproperly jack-knifed.
Differences in the CASP3 strategy
Target proteins in the CASP3 experiment were gener-ally larger than our test proteins. For these larger pro-teins, we used a longer walk length of 50 within abounded volume that contains 60 vertices, and only con-sidered compact conformations with relative radius ofgyration no larger than 1.08. To account for possiblenon-globular shapes, we also prepared another set of lat-tice models using walk length of 40 within a boundedvolume that contains 56 vertices, and considered confor-mations with relative radius of gyration up to 1.14(Table 1). Subsequently we sampled all compact latticestructures exhaustively, the total number of which ismore than two billion for one protein. Each low energyconformation generated by our lattice prediction pro-cedure is a pair of mirror images, and all-atom structureswere generated for both of them. The resulting all-atomdecoy set contains up to 40,000 structures for each target.
For secondary structure prediction, instead of takingthe prediction result from PHD server alone, we gener-ated 20 multiple sequence alignments of a homologousset of sequences to the target protein with a bootstrap-ping procedure, and used them as input for three sec-ondary structure prediction methods: PHD (Rost et al.,1993), DSC (Ross & Sternberg, 1996), and Predator(Frishman, 1995). The consensus of the 20 predictions foreach method was taken as the ®nal prediction.
Acknowledgments
We are extremely grateful to David A. Hinds for theoriginal lattice enumeration and selection program,Patrice Koehl for providing us with ef®cient FORTRANcode to construct models given a set of f/c/w anglesand to calculate cRMS values, and Jay Ponder forthe TINKER suite. This work was supported in part bya Howard Hughes Medical Institute PredoctoralFellowship to Y.X., a Jane Cof®n Childs MemorialFund Fellowship to E.H., and a Burroughs WellcomeFund Fellowship from the Program in Mathematics andMolecular Biology to R.S. Overall support was providedby NIH grant GM 41455 to M.L.
References
An®nsen, C. (1973). Principles that govern the folding ofprotein chains. Science, 181, 223-230.
Bernstein, F., Koetzle, T., Williams, G., Meyer, E., Brice,M., Rodgers, J., Kennard, O., Shimanouchi, T. &Tsumi, M. (1977). The Protein Data Bank: a compu-ter-based archival ®le for macromolecular struc-tures. J. Mol. Biol. 112, 535-542.
Chelvanayagam, G., Knecht, L., Jenny, T., Benner, S. &Gonnet, G. (1998). A combinatorial distance-con-straint approach to predicting protein tertiarymodels from known secondary structure. FoldingDes. 3, 149-160.
Cohen, F. & Sternberg, M. (1980). On the prediction ofprotein structure: the signi®cance of root-mean-square deviation. J. Mol. Biol. 138, 321-333.
Duan, Y. & Kollman, P. (1998). Pathways to a proteinfolding intermediate observed in a 1-microsecondsimulation in aqueous solution. Science, 282, 740-744.
Eyrich, V., Standley, D. & Friesner, R. (1999). Predictionof protein tertiary structure to low resolution: per-formance for a large and structurally diverse testset. J. Mol. Biol. 288, 725-742.
Frishman, D. (1995). Knowledge-based secondary struc-ture assignment. Proteins: Struct. Funct. Genet. 23,566-579.
Hansmann, U. & Okamoto, Y. (1999). New Monte Carloalgorithms for protein folding. Curr. Opin. Struct.Biol. 9, 177-183.
Hinds, D. & Levitt, M. (1992). A lattice model for pro-tein structure prediction at low resolution. Proc.Natl Acad. Sci. USA, 89, 2536-2540.
Hinds, D. & Levitt, M. (1994). Exploring conformationalspace with a simple lattice model for protein struc-ture. J. Mol. Biol. 243, 668-682.
Huang, E., Samudrala, R. & Ponder, J. (1998). Distancegeometry generates native-like folds for small heli-cal proteins using the consensus distances of pre-dicted protein structures. Protein Sci. 7, 1998-2003.
Huang, E., Samudrala, R. & Ponder, J. (1999). Ab initiofold prediction of small helical proteins using dis-tance geometry and knowledge-based scoring func-tions. J. Mol. Biol. 290, 267-281.
Hubbard, T., Murzin, A., Brenner, S. & Chothia, C.(1997). SCOP: a structural classi®cation of proteinsdatabase. Nucl. Acids Res. 25, 236-239.
Jones, D. (1999). Protein secondary structure predictionbased on position-speci®c scoring matrices. J. Mol.Biol. 292, 195-202.
Kabsch, W. & Sander, C. (1983). Dictionary of proteinsecondary structure: pattern recognition of hydro-gen-bonded and geometrical features. Biopolymers,22, 2577-2637.
Koehl, P. & Levitt, M. (1999). A brighter future forprotein structure prediction. Nature Struct. Biol. 6,108-111.
Lazaridis, T. & Karplus, M. (1999). Effective energyfunction for proteins in solution. Proteins: Struct.Funct. Genet. 35, 133-152.
Lee, J., Liwo, A., Ripoll, D., Pillardy, J. & Scheraga, H.(1999). Calculation of protein conformation byglobal optimization of a potential energy function.Proteins: Struct. Funct. Genet. S3, 204-208.
Levinthal, C. (1968). Are there pathways for proteinfolding? J. Chim. Phys. 65, 44-45.
Levitt, M. (1974). Energy re®nement of hen egg-whitelysozyme. J. Mol. Biol. 82, 393-420.
Levitt, M. & Lifson, S. (1969). Re®nement of protein con-formations using a macromolecular energy mini-mization procedure. J. Mol. Biol. 46, 269-279.
Levitt, M., Hirshberg, M., Sharon, R. & Daggett, V.(1995). Potential energy function and parameters forsimulations of the molecular dynamics of proteinsand nucleic acids in solution. Comp. Phys. Comm. 91,215-231.
Lomize, A., Pogozheva, I. & Mosberg, H. (1999). Predic-tion of protein structure: the problem of fold multi-plicity. Proteins: Struct. Funct. Genet. S3, 199-203.
McCammon, J. & Harvey, S. (1987). Dynamics of Proteinsand Nucleic Acids, Cambridge University Press,Cambridge.
McLachlan, A. (1971). Test for comparing related aminoacid sequences. J. Mol. Biol. 61, 409-424.
Hierarchical Construction of Protein Structures 185
Moult, J. (1997). Comparison of database potentials andmolecular mechanics force ®elds. Curr. Opin. Struct.Biol. 7, 194-199.
Orengo, C., Bray, J., Hubbard, T., LoConte, L. & Sillitoe,I. (1999). Analysis and assessment of ab initio three-dimensional prediction, secondary structure, andcontacts prediction. Proteins: Struct. Funct. Genet. S3,149-170.
Ortiz, A., Kolinski, A. & Skolnick, J. (1998). Fold assem-bly of small proteins using Monte Carlo simulationsdriven by restraints derived from multiple sequencealignments. J. Mol. Biol. 277, 419-448.
Ortiz, A., Kolinski, A., Rotkiewicz, P., Ilkowski, B. &Skolnick, J. (1999). Ab initio folding of proteinsusing restraints derived from evolutionary infor-mation. Proteins: Struct. Funct. Genet. S3, 177-185.
Osguthorpe, D. (1999). Improved ab initio predictionswith a simpli®ed, ¯exible geometry model. Proteins:Struct. Funct. Genet. S3, 186-193.
Park, B. & Levitt, M. (1995). The complexity and accu-racy of discrete state models of protein structure.J. Mol. Biol. 249, 493-507.
Park, B. & Levitt, M. (1996). Energy functions thatdiscriminate X-ray and near native folds fromwell-constructed decoys. J. Mol. Biol. 258, 367-392.
Park, B., Huang, E. & Levitt, M. (1997). Factors affectingthe ability of energy functions to discriminate cor-rect from incorrect folds. J. Mol. Biol. 266, 831-846.
Pedersen, J. T. & Moult, J. (1996). Genetic algorithms forprotein structure prediction. Curr. Opin. Struct. Biol.6, 227-231.
Ross, D. & Sternberg, M. (1996). Identi®cation and appli-cation of the concepts important for accurate andreliable protein secondary structure prediction. Pro-tein Sci. 5, 2298-2310.
Rost, B., Sander, C. & Scheider, R. (1993). PHD - anautomatic mail server for protein secondary struc-ture prediction. Comput. Appl. Biosci. 10, 53-60.
Samudrala, R. & Moult, J. (1998). An all-atom distancedependent conditional probability discriminatoryfunction for protein structure prediction. J. Mol.Biol. 275, 895-916.
Samudrala, R., Xia, Y., Huang, E. & Levitt, M. (1999).Ab initio protein structure prediction using a com-bined hierarchical approach. Proteins: Struct. Funct.Genet. S3, 194-198.
Samudrala, R., Xia, Y., Levitt, M., Cotton, N., Huang, E.& Davis, R. (2000a). Probing structure-functionrelationships of the DNA polymerase alpha-associ-ated zinc-®nger protein using computationalapproaches. Proceedings of the Paci®c Symposium onBioComputing, 179-190.
Samudrala, R., Huang, E. S., Koehl, P. & Levitt, M.(2000b). Constructing side-chains on near-nativemain-chains for ab initio protein structure predic-tion. Protein Eng. In the press.
Scheraga, H. (1996). Recent developments in the theoryof protein folding: searching for the global energyminimum. Biophys. Chem. 59, 329-339.
Simons, K., Kooperberg, C., Huang, E. & Baker, D.(1997). Assembly of protein tertiary structures fromfragments with similar local sequences using simu-lated annealing and bayesian scoring functions.J. Mol. Biol. 268, 209-225.
Simons, K., Bonneau, R., Ruczinski, I. & Baker, D.(1999). Ab initio protein structure prediction ofCASP III targets using ROSETTA. Proteins: Struct.Funct. Genet. S3, 171-176.
van Gunsteren, W. (1998). Validation of moleculardynamics simulation. J. Comput. Phys. 108, 6109-6116.
Wei, L., Huang, E. & Altman, R. (1999). Are predictedstructures good enough to preserve functional sites?Structure, 7, 643-650.
Edited by B. Honig
(Received 28 January 2000; received in revised form 3 April 2000; accepted 3 April 2000)