Embed Size (px)
Citation preview
Ab Initio Simulations of Temperature Dependent
Phase Stability and Martensitic Transitions in NiTi
Justin B. Haskins,†,§ Alexander E. Thompson,‡,§ and John W. Lawson∗,¶
AMA Inc., Thermal Materials Protection Branch, NASA Ames Research Center, Moffett
Field, California 94035, USA, USRA, Thermal Materials Protection Branch, NASA Ames
Research Center, Moffett Field, California 94035, USA, and Thermal Materials Protection
Branch, NASA Ames Research Center, Moffett Field, California 94035, USA
E-mail: [email protected]
1
∗To whom correspondence should be addressed†AMA Inc., Thermal Materials Protection Branch, NASA Ames Research Center, Moffett Field, Califor-
nia 94035, USA‡USRA, Thermal Materials Protection Branch, NASA Ames Research Center, Moffett Field, California
94035, USA¶Thermal Materials Protection Branch, NASA Ames Research Center, Moffett Field, California 94035,
USA§Contributed equally to this work
1
https://ntrs.nasa.gov/search.jsp?R=20160011948 2020-04-25T03:58:33+00:00Z
Abstract2
For NiTi based alloys, the shape memory effect is governed by a transition from a3
low-temperature martensite phase to a high-temperature austenite phase. Despite con-4
siderable experimental and computational work, basic questions regarding the stability5
of the phases and the martensitic phase transition remain unclear even for the simple6
case of binary, equiatomic NiTi. We perform ab initio molecular dynamics simulations7
to describe the temperature-dependent behavior of NiTi and resolve several of these8
outstanding issues. Structural correlation functions and finite temperature phonon9
spectra are evaluated to determine phase stability. In particular, we show that finite10
temperature, entropic effects stabilize the experimentally observed martensite (B19’)11
and austenite (B2) phases while destabilizing the theoretically predicted (B33) phase.12
Free energy computations based on ab initio thermodynamic integration confirm these13
results and permit estimates of the transition temperature between the phases. In14
addition to the martensitic phase transition, we predict a new transition between the15
B33 and B19’ phases. The role of defects in suppressing these phase transformations is16
discussed.17
2
Shape memory alloys are materials that after deformation recover their original shape18
upon heating. They are technologically important for a wide range of applications, including19
actuators, shape-morphing wings and next generation space suits, among others. Nickel20
Titanium (nitinol) is perhaps the best-known example in this class of alloys and figures21
prominently in many commercial applications. The shape memory effect in NiTi is driven22
by a martensitic phase transition from a low temperature martensite phase (B19’) to a high23
temperature austenite phase (B2).1,2 Many applications involving shape memory alloys are24
tied to the specific value of the martensitic phase transition temperature.3 Having the ability25
to tune this transition temperature, for example, through ternary additions in NiTi-based26
alloys,3–5 will open the door to significantly more far-reaching applications. However, even27
for binary, equiatomic NiTi, which is the simplest example in this class of materials, basic28
questions regarding the stability of the phases and the martensitic phase transition remain29
unclear. In this paper, we resolve several of these important, outstanding issues.30
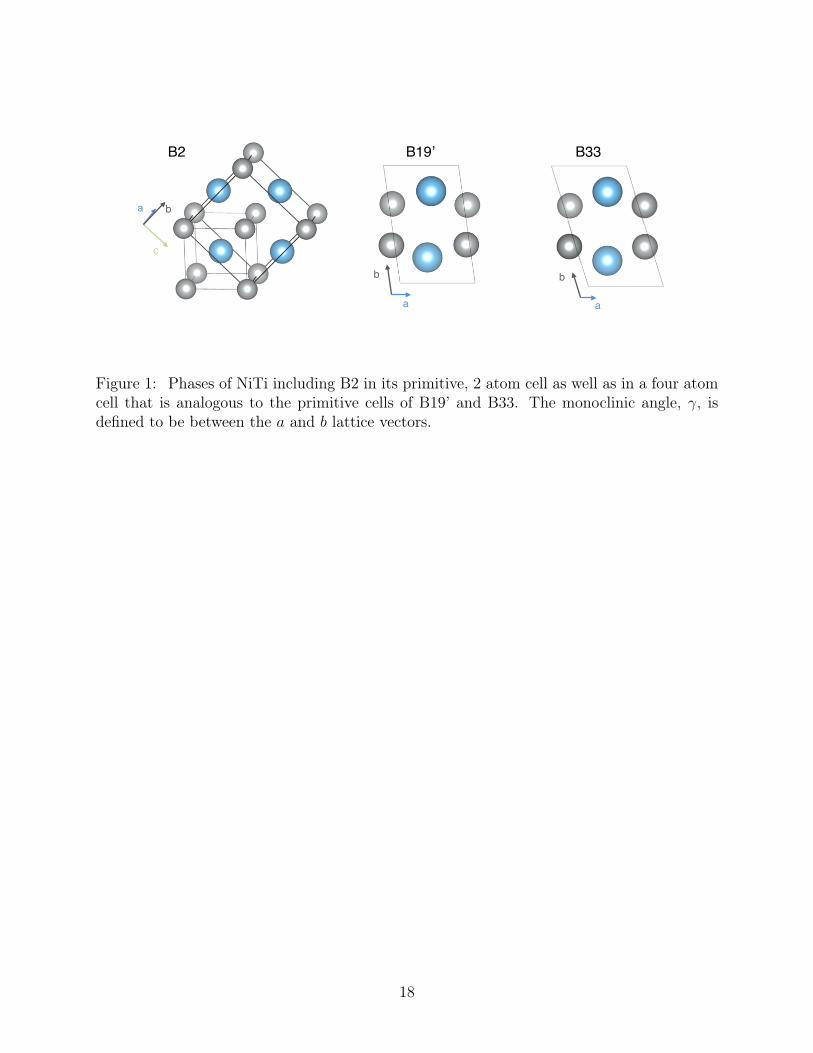
Experimentally, the high temperature austenite phase of NiTi has the cubic B2 (Pm3m31
symmetry) structure. The low temperature martensite phase has the monoclinic B19’32
(P21/m symmetry) structure, with an experimentally determined angle γ of 98.6,7 The33
transition temperature between the two phases is reported to be approximately 341 K.8 Rel-34
evant crystal structures are shown in Figure 1. Considerable computational work has been35
performed to understand the phases of NiTi and related materials. In particular, density36
functional theory (DFT) studies9–22 have provided many insights into the energetics and37
properties of NiTi; but they have also generated new unanswered questions. For example,38
DFT formation energies for B2 are in good agreement with experiments;23–26 however, B2 is39
predicted to be dynamically unstable at T = 0, i.e. certain phonons modes have imaginary40
frequencies.27 Recent attempts using small systems to include finite temperatures effects into41
B2 stability analyses have given contradictory results.28,29 On the other hand, B19’ at the ex-42
perimental monoclinic angle γ of 98 is dynamically stable at T = 0; however, the computed43
structure is unstable to shear.12 Huang et al. determined the DFT ground state of NiTi44
3
at T = 0 to be a new orthorhombic phase (B33) with an angle of γ = 107.3 .30 However,45
the B33 structure has not been observed experimentally in NiTi and its crystal symmetry46
(Cmcm) is incompatible with the shape memory effect, and therefore cannot represent the47
martensitic phase of this material. Thus, after considerable computational analysis, we are48
in the unsatisfying position that the two experimentally observed phases for NiTi have un-49
determined stability; whereas the only computed stable phase has never been observed and50
is incompatible with the shape memory effect.51
To address these discrepancies, we perform high accuracy, ab initio molecular dynamics52
(AIMD) simulations based on density functional theory combined with extended thermody-53
namic integration methods to evaluate the stability and relative free energies for the defect-54
free, single crystal phases (B2, B19’, B33) of NiTi for a range of temperatures up to 900 K.55
These materials are strongly anharmonic, and therefore, methods based primarily on phonon56
analysis, even at finite temperatures, will not capture the full behavior. This necessitates57
high accuracy computations of the free energy. We show that finite temperature, entropic58
effects resolve many of the controversies derived from previous studies, bringing computa-59
tion into much closer agreement with experiment. Specifically, we show that entropic effects60
stabilize both B2 and B19’ while destabilizing B33. Furthermore, the martensitic transition61
temperature is estimated between these stable phases. In addition, we also identify a new62
phase transition between B33 and B19’.63
For B2, B19’, and B33, we consider phase stability from several complementary view-64
points. For each case, the lattice vectors of the AIMD simulation cells are optimized such65
that all finite temperature components of the stress tensor are zero. This procedure not only66
accounts for thermal expansion, but also places the system at a critical point on the free67
energy surface. Next, we examine deviations of the crystalline structure from ideality during68
the course of the simulations in these optimized cells. Structural evolution is evaluated quan-69
titatively with: (1) normalized position correlation functions (NPCFs) 31 and (2) atomic dis-70
placement scatter diagrams.32 The NPCF is proportional to∑
i〈(ri(t−t0)−R0i )·(ri(t0)−R0
i )〉71
4
where ri(t) are the atomic trajectories from the AIMD simulation, R0i is the ideal reference72
lattice vectors of interest and the brackets are ensemble averages. For long times (t → ∞),73
vibrational motion becomes uncorrelated, and therefore, NPCF → 0 indicates stabilization74
with respect to the reference lattice whereas nonzero values indicate the converse. We plot75
the atomic displacements explicitly relative to the reference structures on scatter diagrams.76
Significant deviations from zero displacement signal an instability.77
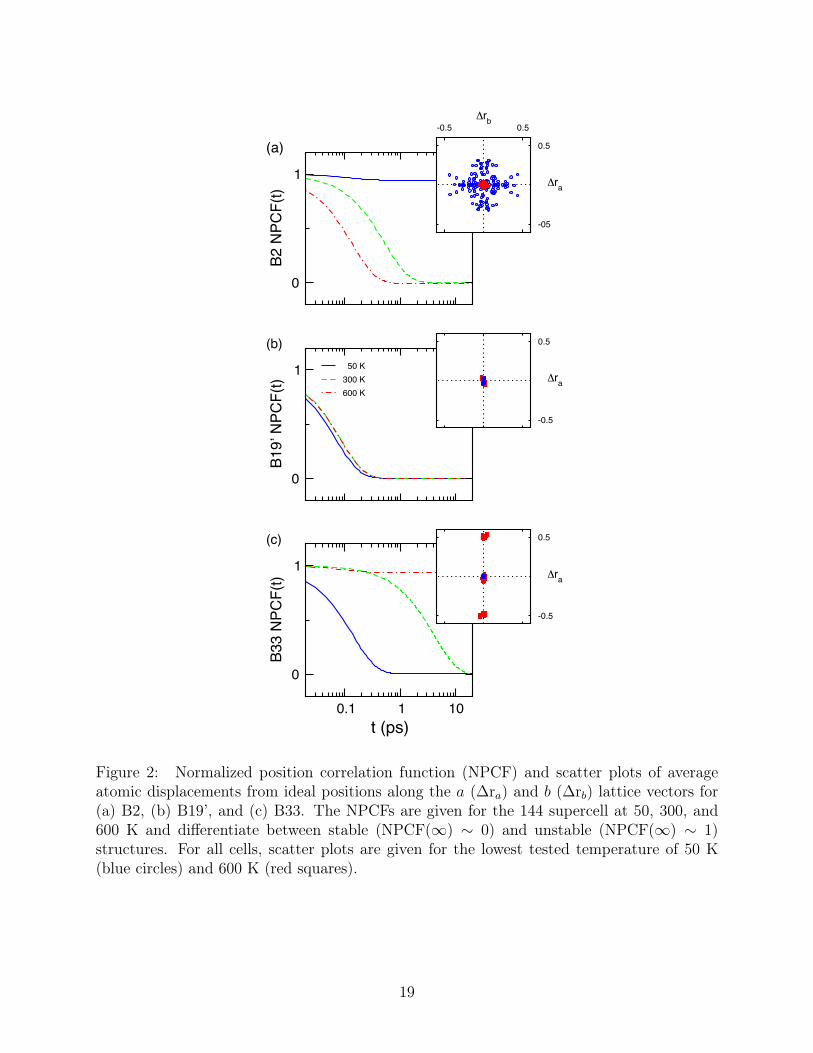
Both NPCFs as well as atomic displacement scatter plots are shown in Figure 2 for78
144 atom cells of B33, B19’, and B2. Large cell sizes are required to eliminate finite size79
effects (see Supplemental Documentation for extensive convergence tests for all computed80
properties). Figure 2a, b, and c, shows very different behavior for the three phase at different81
temperatures. For B33, the NPCFs indicate structural stability at lower temperatures, 50 K82
and 300 K, but instability for T > 300 K. Convergence times at 300 K are almost two83
orders of magnitude larger than at 50 K. This may indicate the proximity of a stability84
transition for B33. Interestingly, the B19’ phase loses its T = 0 non-zero shear stress even85
at low T and maintains its ideal configuration across the full 50 to 600 K temperature range86
considered. Perhaps most striking is that while the B2 structure is unstable at 50 K, it87
stabilizes for T > 300 K. Unlike B33, the NPCF convergence rates for B2 increase with88
increasing temperature.89
The atomic displacements scatter plots for B2, B19’, and B33 are shown in the overlay90
plots in Figure 2a, b, and c, respectively. For each case, displacements are provided for91
50 K (blue circles) and 600 K (red squares). At low temperatures, B33 displacements are92
negligible; however, at high temperatures, large displacements on the order of 0.5 Å can93
be seen in the a direction. Displacements in a result from thermally induced motion along94
the [100](011) stacking fault, which previously has been shown from DFT calculations to95
be important for the martensitic transition.9,10 At low and high temperatures, the B19’96
phase exhibits only minor displacements, ∼ 0.05 Å. The B19’ displacements do not show97
any particular ordering and can most likely be attributed to vibrational motion, as indicated98
5

by the loss of correlation in the NPCF. The B2 phase at low temperatures shows large99
displacements ∼ 0.4 Å from ideality. At higher temperatures, however, these displacements100
largely vanish, as seen in the tight clustering near the origin. Both the NPCF and the atomic101
scatter plots indicate that for T > 300 K, the high temperature phase of NiTi is very closely102
approximated by ideal B2.103
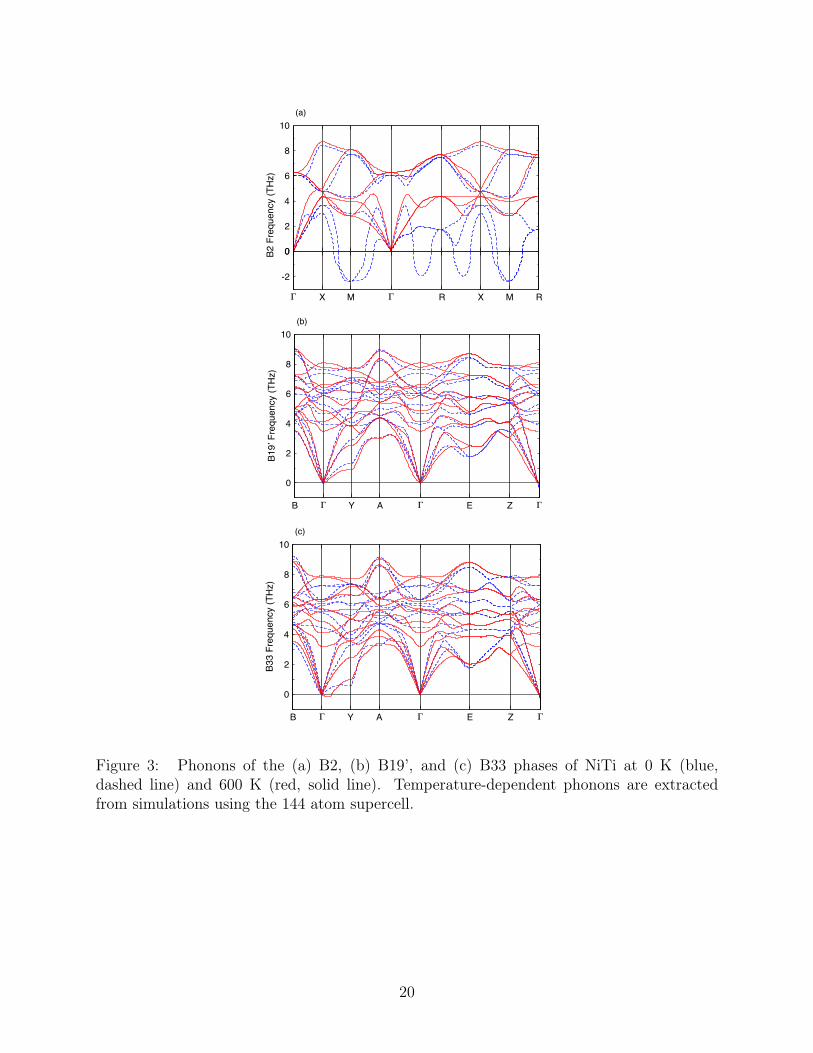
Phase stability is further investigated by explicit computation of temperature-dependent104
phonons as derived from the AIMD simulations.33,34 Imaginary phonon modes (represented105
as negative numbers) indicate the crystal structure is dynamically unstable, i.e. it is not a106
local minima of the energy. Phonon spectra are shown in Figure 3 at both zero-temperature107
and at 600 K. It is important to note that these results are very sensitive to cell size, and108
therefore, using sufficiently large cells is crucial to obtain reliable results. Because of this,109
144 atom cells were employed for computations on all phases (see Supplemental Figures S3-110
S8 for convergence study results). The B33 phase, given in Figure 3a, develops imaginary111
modes at 600 K through the lowering of the TA mode along the Γ → A direction. Phonon112
dispersions for the B19’ phase shows stability across the full temperature range investigated,113
as shown in Figure 3b. Most dramatically perhaps, the imaginary modes reported for the114
B2 T = 0 K phonon dispersion lift and become positive at 300 K, as shown in Figure 3a,115
indicating stabilization of this phase, consistent with the structure analysis of Figure 2.116
The stress tensor, structure, and phonon analyses provide a complementary picture of117
the temperature dependent stability of the three phases that is consistent with experiment.118
Namely, stable phases at a given temperature exhibit the following properties: all compo-119
nents of the stress tensor (normal stresses and shears) are on average zero; the NPCF goes120
to zero in finite time; and all phonon modes are positive. Our results therefore show that121
finite temperature, entropic effects stabilize the high-temperature B2 phase between 50 and122
300 K. Similarly, the low-temperature B33 phase is progressively destabilized, fully losing123
stability between 300 K and 600 K. The B19’ phase, on the other hand, is unstable to shear124
at T = 0 but exhibits full stability from 50 K up to 700 K.125
6
To obtain further insights into phase stability as well as transitions between the phases,126
we next compute the relative free energies of the phases. Vibrational entropy is frequently127
evaluated via the quasi-harmonic approximation (QHA). However, stability issues at T = 0128
invalidates this approach for B2 due to the appearance of imaginary phonon modes. Alter-129
natively, stable, finite temperature phonon spectra can be used with the QHA expressions130
to obtain entropy estimates. However, for strongly anharmonic materials such as NiTi, this131
approach will not be a good approximation to the full anharmonic entropy. This strong132
anharmonicity therefore necessitates the use of high accuracy methods for computing free133
energies. For this reason, we use two different methods based on thermodynamic integration134
to compute the free energies. The computations should be exact to within the accuracy of135
DFT.136
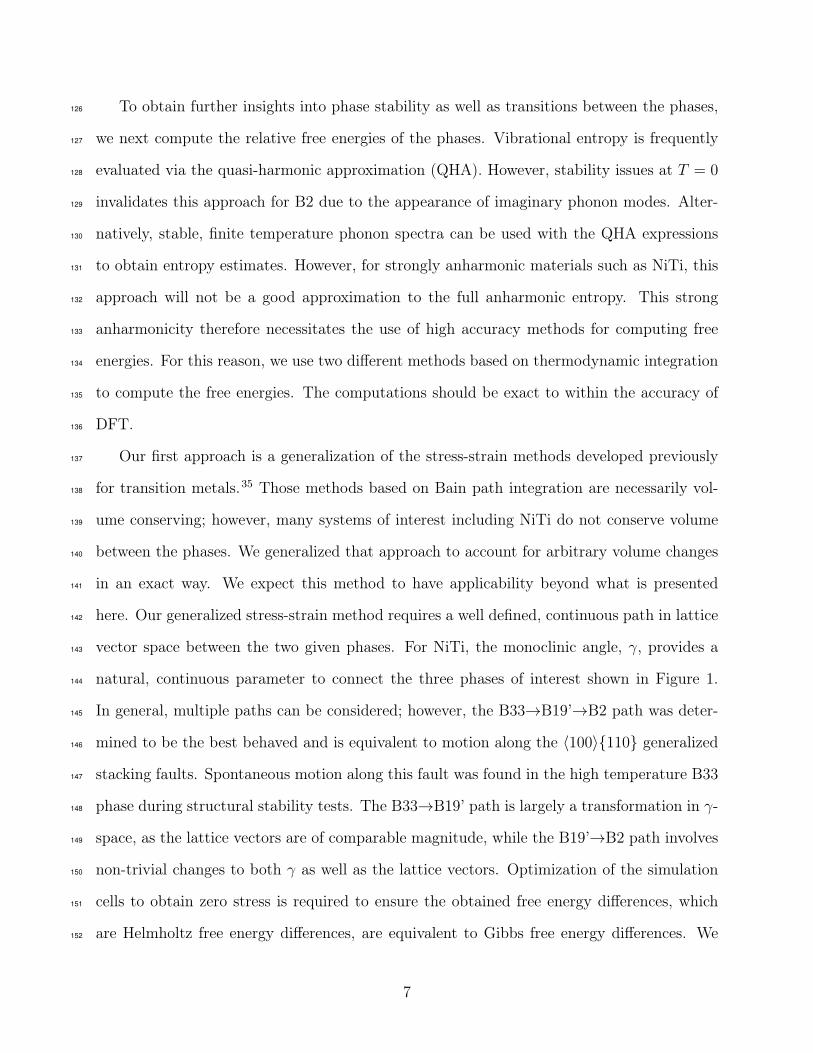
Our first approach is a generalization of the stress-strain methods developed previously137
for transition metals.35 Those methods based on Bain path integration are necessarily vol-138
ume conserving; however, many systems of interest including NiTi do not conserve volume139
between the phases. We generalized that approach to account for arbitrary volume changes140
in an exact way. We expect this method to have applicability beyond what is presented141
here. Our generalized stress-strain method requires a well defined, continuous path in lattice142
vector space between the two given phases. For NiTi, the monoclinic angle, γ, provides a143
natural, continuous parameter to connect the three phases of interest shown in Figure 1.144
In general, multiple paths can be considered; however, the B33→B19’→B2 path was deter-145
mined to be the best behaved and is equivalent to motion along the 〈100〉110 generalized146
stacking faults. Spontaneous motion along this fault was found in the high temperature B33147
phase during structural stability tests. The B33→B19’ path is largely a transformation in γ-148
space, as the lattice vectors are of comparable magnitude, while the B19’→B2 path involves149
non-trivial changes to both γ as well as the lattice vectors. Optimization of the simulation150
cells to obtain zero stress is required to ensure the obtained free energy differences, which151
are Helmholtz free energy differences, are equivalent to Gibbs free energy differences. We152
7
find the internal atomic coordinates for the 144 atom cell for this path to transform contin-153
uously and that the stresses converge rapidly (< 10 ps) (see Supplemental Figure S9). It154
should be noted that while free energy differences between stable phases can be rigorously155
computed, evaluation of free energies differences involving unstable structures is still an area156
of active investigation. Therefore, free energies involving unstable structures may contain157
some systematic error as discussed recently.36158
Our second approach uses the Einstein crystal method to compute free energy differences159
at isolated points along the transformation paths. These computations were used to check the160
stress-strain method and were only performed at free energy mimina along the transformation161
path. The reference harmonic free energy is obtained from the force constants associated162
with the temperature dependent phonon dispersions. This approach overcomes difficulties163
in using T = 0 K phonon dispersions with imaginary modes. For each stable crystal at a164
given temperature, thermodynamic integration is performed from the system described by165
the harmonic reference potential to the one described by DFT. The integration can result in166
anharmonic contributions to the free energy on the order of 5 meV/atom compared to the167
harmonic reference free energy. This nontrivial anharmonic contribution to the free energy168
can shift the transition temperature by as much as 100 K and thus confirms the need for169
high accuracy or exact methods to study these systems.170
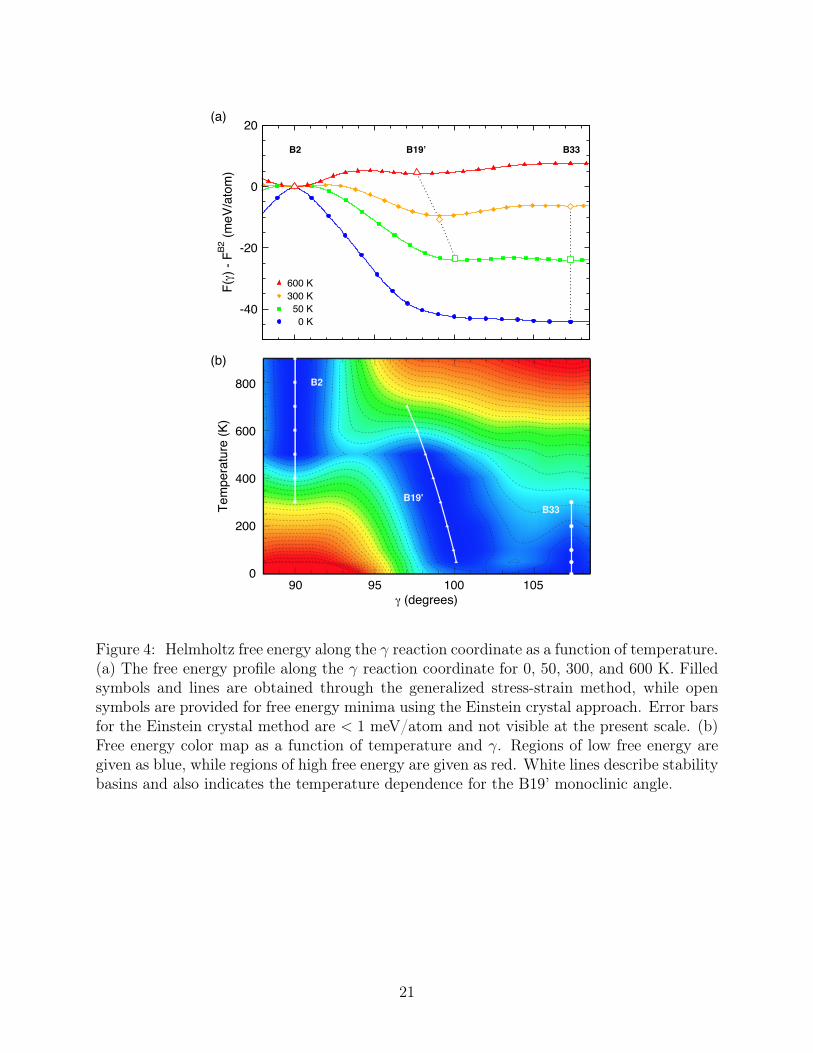
Free energy results using the generalized stress-strain method at 0, 50, 300, and 600 K171
are given in Figure 4a as a function of γ. Einstein crystal results are shown as open symbols172
for validation. Agreement between the methods is excellent (≤ 1 meV/atom). The T = 0173
curve reproduces previous DFT results, and clearly shows that B2 and B19’ are not energetic174
minima whereas B33 is a stable minimum, as reported by Huang et al.30 We see however175
that the free energy surface changes considerably as a function of temperature. Between176
B33 and B19’, a small but distinguishable barrier develops between the phases for T =177
50K − 300K. Above 600 K, however, the free energy is monotonically decreasing from B33178
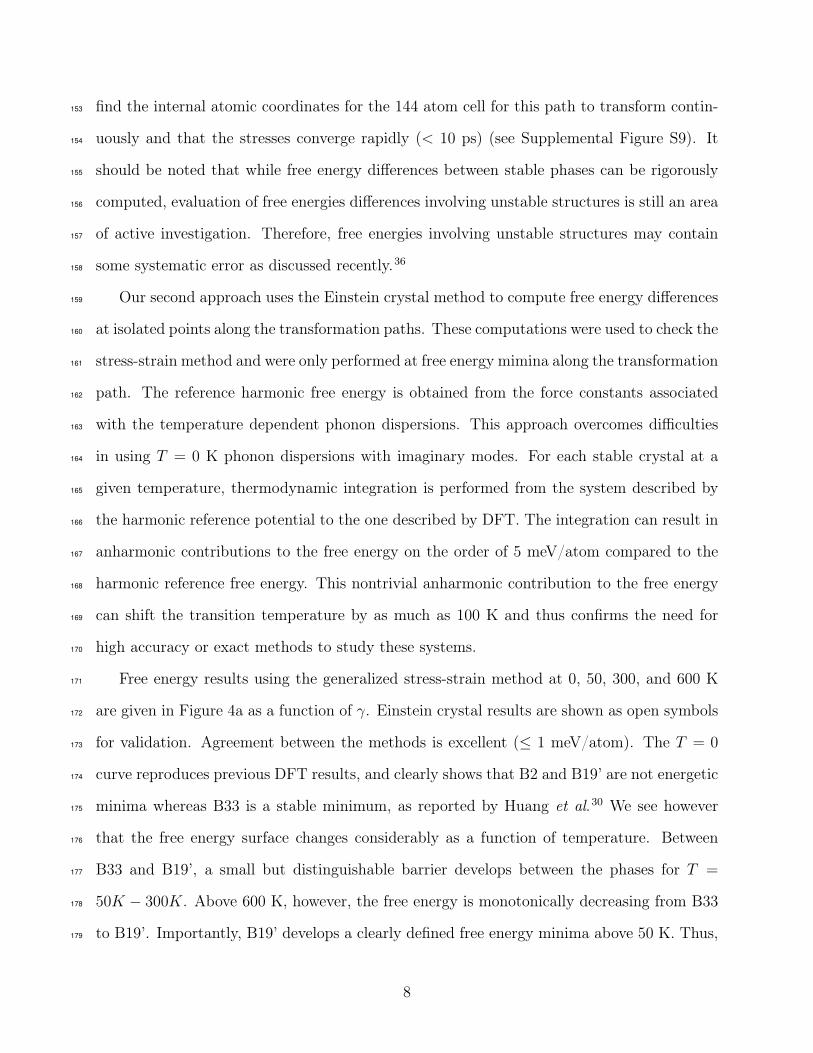
to B19’. Importantly, B19’ develops a clearly defined free energy minima above 50 K. Thus,179
8
B19’ is entropically stabilized and develops into a separate phase distinct from B33. The180
B2 phase is unstable to transitions to B19’ until 300 K, above which a free energy barrier181
develops stabilizing this phase as a local minima. These results are consistent with the182
structural and phonon analysis.183
Further detail is provided by Figure 4b where free energy differences relative to the most184
stable phase are mapped as a function of T and γ. Blue and red represent small and large185
free energy differences, respectively. The free energies are again derived from the generalized186
stress-strain method. The free energy map illustrates the stability regions associated with187
each of the phases: B33, B19’, and B2. White circles indicate stable points of each phase,188
i.e. all finite temperature stresses are zero and all finite temperature phonons are real and189
positive. Thus each white circle represents a stable, free energy miminum for that phase and190
the white lines denote the extent of the stable free energy basins. Free energy and stability191
results are provided for 50 K as well as between 0 and 900 K in steps of 100 K. The regions192
of stability for each phase are found to be 0 < T < 300 K for B33, 50 < T < 600 K for B19’,193
and T > 300 K for B2. Interestingly, the B19’ angle is shown to be a function of temperature,194
ranging from ∼ 100 at 50 K to ∼ 98 at 600 K. Furthermore, the stable basin of B19’ is195
relatively shallow suggesting that γ values for this phase might be fairly sensitive to small196
changes in stress. This could be important since stress fields associated with defects could197
potentially alter the value of γ quoted here. The free energy results allow us to estimate the198
phase transition temperatures. In particular from Figure 4, the transition between B33 and199
B19’ appears to occur between 50 and 300 K. The B19’→B2 free energy path, is uphill until200
600 K, indicating that a transition occurs between 300 and 600 K.201
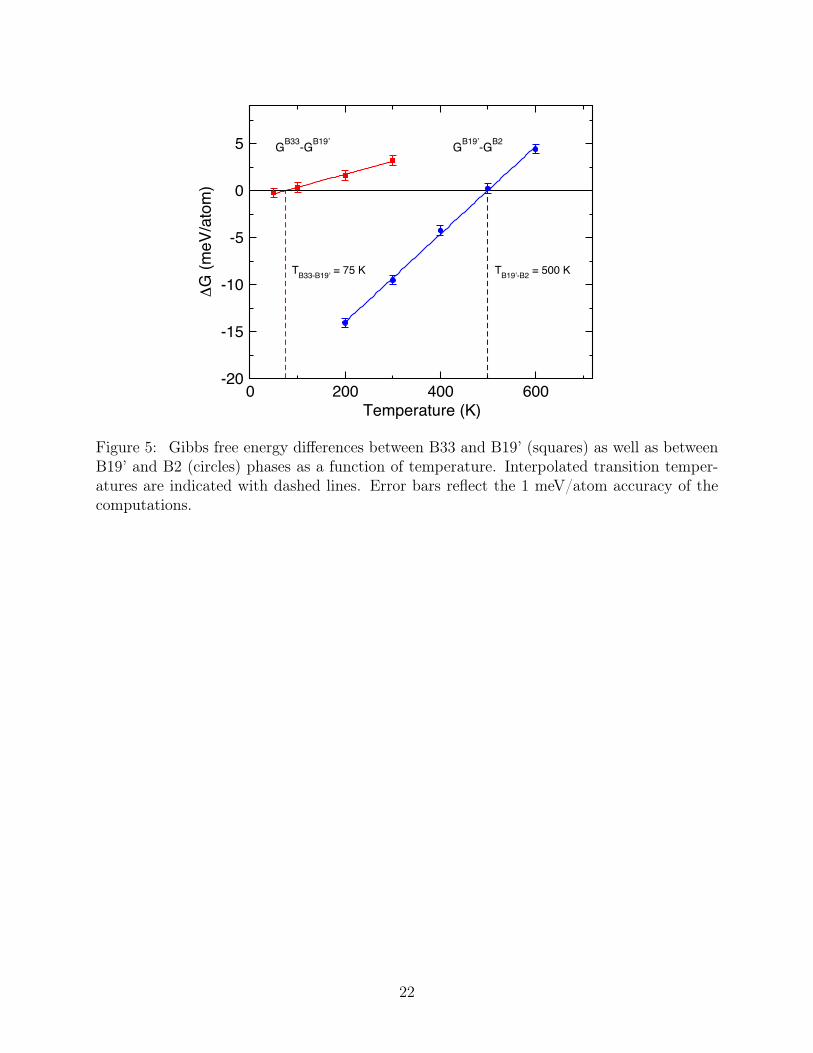
Differences in the Gibb’s free energy (∆G) between the various stable phases as a function202
of T are plotted in Figure 5. Vanishing of the free energy difference indicates a phase203
transition. For ∆G between B33 and B19’, a new phase transition is predicted to ocurrs204
at 75±26 K. For B19’ to B2, ∆G goes to zero at 500±14 K. The larger error for the low-205
T transition is a function of the slope of ∆G and the target accuracy of 1 meV/atom.206
9
The low values for the B33→B19’ transition temperature explains the lack of experimental207
evidence for B33, despite being energetically favored at 0 K. If B33 becomes unstable at208
low temperatures, it may be difficult to synthesize and therefore to observe. The B19’→B2209
transition temperature is roughly 150 K above the experimental value of 341 K.8 However,210
the methods used to obtain this value, based on ab initio thermodynamic integration, are211
numerically exact to within the accuracy of DFT. Therefore, we expect it to be a reliable212
estimate of the martensitic transition temperature for defect-free, single crystal NiTi. The213
non-trivial difference with experimental values is most likely due to defects that have been214
shown to suppress transition temperatures in this and related materials.37 This also suggests215
that improved processing resulting in higher material quality could produce materials with216
higher measured transition temperatures. In addition, it is also known that the transition217
temperature is dependent on the heating and cooling rates with slower rates giving higher218
transition temperatures. Since we use equilibrium methods to estimate this temperature,219
our results correspond effectively to infinitely slow rates. For that reason, we expect them220
to be an upper bound for the experimental transition temperature.221
We have performed a comprehensive computational analysis based on ab initio molecular222
dynamics of the stability and transitions between the major phases of NiTi: B2, B19’, and223
B33. Considerable previous computational analysis based mainly on T = 0 DFT resulted224
in significant discrepancies between experiment and computation. We have shown that by225
including temperature dependent entropic effects into the computations, many of these dif-226
ferences can be resolved. We show that B2 and B19’ are stabilized due to these entropic227
effects whereas B33 is destabilized. These materials are shown to be highly anharmonic. An-228
harmonic contributions to the free energy can shift the transition temperature by as much229
as 100K and thus necessitates the need for high accuracy or exact methods to study these230
systems. We develop an generalized stress-strain method to perform such computations. The231
phase transition temperature between B2 and B19’ is estimated to be approximately 500 K232
for defect-free, single crystals which is about 150 K above experimental results. Defects and233
10
non-equilibrium rate effects are expected to suppress the transition temperature and bring234
it more into line with experiments.37 This also suggests opportunities to obtain higher tran-235
sition temperatures with current materials by improved material processing. A new phase236
transition in this material is identified between B19’ and B33 with an estimated temperature237
of 75 K. High temperature destabilization of B33 and the corresponding low transition tem-238
perature to B19’ could explain why B33 has not yet been observed experimentally. Defects239
could affect this transition as well.240
Methods241
Simulations are performed with the Vienna Ab Initio Simulation Package (VASP)38–41 using242
the frozen core all-electron projector augmented wave (PAW) method42,43 and the generalized243
gradient approximation of Perdew, Burke, and Ernzerhof.44 All DFT-MD simulations employ244
an energy cutoff of 269.5 eV, an electronic energy convergence criteria of 1×10⁻⁷ eV, a time245
step of 3.0 fs, and ∼3000 k-points per inverse atom. Furthermore, electronic smearing is246
handled through the Methfessel-Paxton scheme45 with a smearing width of 0.05 eV, and247
the computations are not spin polarized. For both Ni and Ti the 3d and 4s electrons are248
included in the valence. This valence configuration was found to produce free energy results249
within 1 meV/atom agreement with smaller core simulations that include the 3p in the the250
Ti valence. Computations are performed on 144 atom supercells, which were found to be251
free of vibrational size effects. Temperature is controlled through the use of a Langevin252
thermostat with a simulation-time equivalent friction factor of 100 fs.253
For the B33, B19’, and B2 phases, structures were optimized at temperature (from 50 to254
900 K) to provide negligible stress. Optimization is carried out by performing 3 ps AIMD255
simulations, obtaining stresses averaged over this period, and altering the cell to decrease the256
stress. This procedure was iterated until all stresses were < 1 kbar. During the optimization,257
the value of γ for B19’ and B33 was allowed to change to produce negligible shear stress, γ was258
11
held 90 for B2. The value of γ was sensitive to temperature for B19’, while it remained near259
107.32 for B33. Barrierless, and spontaneous, B33→B19’ and B19’→B2 phase transitions260
were found upon optimization at critical temperatures of 400 K and 800 K, respectively. At261
and above the critical temperature, geometry optimization was performed with γ for B33262
and B19’ being held to the terminal values of 107.32 and 97, respectively.263
Zero-temperature phonon dispersions were obtained from the frozen phonon approach264
using displacements of 0.01 Å. Temperature dependent phonons were computed by fitting265
force data from 50 ps DFT-MD simulations to a force constant matrix.33,34 The force constant266
matrix was then symmetrized in accordance with the crystal structure. Imaginary frequencies267
were indicated with negative numbers.268
Helmholtz free energy computations were provided by a generalized stress-strain method269
and through a modified Einstein crystal approach. The generalized stress-strain method270
involves the incremental interpolation of lattice vectors and atomic positions between stress271
optimized B33 and B19’ structures as well as between stress optimized B19’ and B2 struc-272
tures. The resulting path is effectively γ-dependent. The transition between the phases is273
represented by changes in the tensor composed of the cell lattice vectors, Ω(λ), where λ is a274
mixing parameter that describes a linear change between the initial and final lattice vectors.275
The initial and final structures correspond to λ values of 0 and 1, respectively, and AIMD276
simulations were performed on structures at nine intermediate values of λ. The Helmholtz277
free energy difference between the initial and final structures was then obtained by278
∆F =
∫ 1
0
Vλ
[(σΩ−T ) :
∂Ω
∂λ
]dλ, (1)
where σ is the stress tensor and Vλ is the λ-dependent volume. Derivation and validation279
of this expression is presented in the supplementary material. Extensive convergence tests280
were performed with respect to simulation parameters and system size (see Supplementary281
Fig. S10) to ensure accurate measures of free energy.282
12
Checks of the generalized stress strain approach were conducted using the Einstein crystal283
approach for structures representing free energy minima. The temperature-dependent force284
constant matrix was employed as a reference harmonic state for which the free energy was285
known. Thermodynamic integration was then performed between the force constant reference286
and DFT to provide the anharmonic contribution to free energy. The free energy difference287
between the reference potential and DFT is given by ∆F =∫ 1
0
⟨∂U∂λ
⟩λdλ. In this expression288
U = UH − λ(UH − UDFT ), where UH is the harmonic reference potential energy and UDFT289
represent the DFT potential energy. The mixing parameter, λ, defines a linear change290
between the harmonic potential and DFT. MD simulations are performed for potential energy291
surfaces resulting from λ values of 0, 0.25, 0.5, 0.75, and 1 to produce a smoothly varying292
∂U/∂λ. Convergence tests (see Supplementary Figs. S11 and S12) were performed to ensure293
accurate measures of free energy.294
Acknowledgement295
This work was supported by funding from the NASA Aeronautics Research Mission Direc-296
torate’s Transformational Tools & Technologies (TTT) project. We benefited from discus-297
sions with Charles Bauschlicher, Ronald Noebe, and Othmane Benafan.298
References299
(1) Shaw, J. A.; Kyriakides, S. Thermomechanical Aspects of NiTi. J. Mech. Phys. Solids300
1995, 43, 1243–1281.301
(2) Benafan, O.; Padula, S. A.; Noebe, R. D.; Sisneros, T.; Vaidyanathan, R. Role of B19’302
martensite deformation in stabilizing two-way shape memory behavior in NiTi. J. Appl.303
Phys. 2012, 112, 093510.304
(3) Ma, J.; Karaman, I.; Noebe, R. D. High Temperature Shape Memory Alloys. Int. Mater.305
Rev. 2013, 55, 257–315.306
13
(4) Zarnetta, R.; Takahashi, R.; Young, M. L.; Savan, A.; Furuya, Y.; Thienhaus, S.; Maaß,;307
Rahim, M.; Frenzel, J.; Brunken, H. et al. Identification of Quaternary Shape Memory308
Alloys with Near-Zero Thermal Hysteresis and Unprecedented Functional Stability.309
Adv. Funct. Mater. 2010, 20, 1917–1923.310
(5) Bucsek, A. N.; Hudish, G. A.; Bigelow, G. S.; Noebe, R. D.; Stebner, A. P. Composition,311
compatibility, and the functional performances of Ternary NiTiX high-temperature312
shape memory alloys. Shap. Mem. Superelasticity 2016, 2, 62.313
(6) Michal, G. M.; Sinclair, R. The Structure of TiNi Martensite. Acta Crystallogr. B 1981,314
37, 1803–1807.315
(7) Brüher, W.; Gotthardt, R.; Kulik, A.; Mercier, O.; Staub, F. Powder Neutron Diffrac-316
tion Study of Nickel-Titanium Martensite. J. Phys. F. 1983, 13, L77–L81.317
(8) Prokishkin, S. D. On the Lattice Parameters of Phases in Binary Ti-Ni Shape Memory318
Alloys. Acta Mater. 2004, 52, 4479–4492.319
(9) Hatcher, N.; Kontsevoi, O. Y.; Freeman, A. J. Martensitic Transformation Path in NiTi.320
Phys. Rev. B 2009, 79, 020202.321
(10) Hatcher, N.; Kontsevoi, O. Y.; Freeman, A. J. Role of Elastic and Shear Stabilities in322
the Martensitic Transformation Path of NiTi. Phys. Rev. B 2009, 80, 144203.323
(11) Vishnu, G.; Strachan, A. Size Effects in NiTi from Density Functional Theory Calcu-324
lations. Phys. Rev. B 2012, 85, 014114.325
(12) Wagner, M. F.-X.; Windl, W. Lattice Stability, Elastic Constants and Macroscopic326
Moduli of NiTi Martensites from First Principles. Acta Mater. 2008, 56, 6232–6245.327
(13) Wang, J.; Sehitoglu, H. Resolving Quandaries Surrounding NiTi. Appl. Phys. Lett.328
2012, 101, 081907.329
14
(14) Huang, X.; Bungaro, C.; Godlevsky, V.; Rabe, K. M. Lattice Instabilities of Cubic NiTi330
from First Principles. Phys. Rev. B 2001, 65, 014108.331
(15) Holec, D.; Friák, M.; Dlouhý, A.; Neugebauer, J. Ab initio Study of Pressure Stabilized332
NiTi Allotropes: Pressure-Induced Transformations and Hysteresis Loops. Phys. Rev.333
B 2011, 84, 224119.334
(16) Kibey, S.; Sehitoglu, H.; Johnson, D. Energy Landscape for Martensitic Phase Trans-335
formation in Shape Memory NiTi. Acta Mater. 2009, 57, 1624–1629.336
(17) Sesták, P.; Cerný, M.; Pokluda, J. On the Effect of Deformation Twins on Stability of337
B19′ Structure in NiTi Martensite. Comput. Mater. Sci. 2014, 87, 107–111.338
(18) Pasturel, A.; Colinet, C.; Manh, D.; Paxton, A.; van Schilfgaarde, M. Electronic Struc-339
ture and Phase Stability Study in the Ni-Ti System. Phys. Rev. B 1995, 52, 15176–340
15190.341
(19) Wang, X.-Q. Twinned Structure for Shape Memory: First-Principles Calculations.342
Phys. Rev. B 2008, 78, 092103.343
(20) Ye, Y.; Chan, C.; Ho, K. Structural and Electronic Properties of the Martensitic Alloys344
TiNi, TiPd, and TiPt. Phys. Rev. B 1997, 56, 3678–3689.345
(21) Zeng, Z.-Y.; Hu, C.-E.; Cai, L.-C.; Chen, X.-R.; Jing, F.-Q. Molecular Dynamics Study346
of the Melting Curve of NiTi Alloy under Pressure. J. Appl. Phys. 2011, 109, 043503.347
(22) Sesták, P.; Cerný, M.; Pokluda, J. Can Twinning Stabilize B19’ Structure in NiTi348
Martensite? Intermetallics 2011, 19, 1567–1572.349
(23) Hu, R.; Nash, P.; Chen, Q. Enthalpy and Formation of the Al-Ni-Ti System. J. Phase350
Equilibria Diffus. 2009, 30, 559–563.351
(24) Kubaschewski, O. The Heats of Formation in the System Aluminum + Nickel + Tita-352
nium. Trans. Faraday Soc. Engl. 1958, 54, 814–820.353
15
(25) Gachon, J.; Notin, M.; Hertz, J. The Enthalphy of Mixing of the Intermediate Phases354
in the Systems FeTi, CoTi, and NiTi by Direct Reaction Calorimetry. Thermochim.355
Acta 1981, 48, 155–164.356
(26) Guo, Q.; Kleppa, O. Standard Enthalpies of Formation of Some Alloys Formed between357
Group IV Elements and Group VIII Elements, Determined by High-Temperature Direct358
Synthesis Calorimetry: II. Alloys of (Ti, Zr, Hf) with (Co, Ni). J. Alloys Compd. 1998,359
269, 181–186.360
(27) Parlinski, K.; Parlinska-Wojtan, M. Lattice Dynamics of NiTi Austenite, Martensite,361
and R Phase. Phys. Rev. B 2002, 66, 064307.362
(28) Sourvatzis, P.; Legut, D.; Eriksson, O.; Katsnelson, M. Ab Initio Study of Interacting363
Lattice Vibrations and Stabilization of the Beta Phase in Ni-Ti Shape-Memory Alloys.364
Phys. Rev. B 2010, 81, 092201.365
(29) Zarkevich, N. A.; Johnson, D. D. Stable Atomic Structure of NiTi Austenite. Phys.366
Rev. B 2014, 90, 060102.367
(30) Huang, X.; Ackland, G. J.; Rabe, K. M. Crystal Structures and Shape-Memory Behav-368
ior of NiTi. Nature Mater. 2003, 2, 307–311.369
(31) Vocadlo, L.; Alfé, D.; Gillan, M.; Wood, I.; Brodholt, J.; David Price, G. Possible370
Thermal and Chemical Stabilization of Body-Centered-Cubic Iron in the Earth’s Core.371
Nature 2003, 31, 536.372
(32) Asker, C.; Belonoshko, A.; Mikhaylushkin, A.; Abrikosov, I. First-Principles Solution373
to the Problem of Mo Lattice Stability. Phys. Rev. B 2008, 77, 220102(R).374
(33) Hellman, O.; Abriksosov, I. A.; Simak, S. I. Lattice Dynamics of Anharmonic Solids375
from First Principles. Phys. Rev. B 2011, 84, 180301.376
16
(34) Hellman, O.; Abriksosov, I. A.; Simak, S. I. Temperature Dependent Effective Potential377
Method for Accurate Free Energy Calculations of Solids. Phys. Rev. B 2013, 87, 104111.378
(35) Carzola, C.; Alfé, D.; Gillan, M. J. Constraints on the Phase Diagram of Molybdenum379
from First-Principles Free-Energy Calculations. Phys. Rev. B 2012, 85, 064113.380
(36) van de Walle, A.; Hong, Q.; Kadkhodaei, S.; Sun, R. The free energy of mechanically381
unstable phases. Nat. Commun. 2015, 6, 7559.382
(37) Tehrani, A.; Shahrokhshahi, H.; Parvin, N.; Brgoch, J. Influencing the Martensitic383
Phase Transition in NiTi Through Point Defects. J. Appl. Phys. 2015, 118, 014901.384
(38) Kresse, G.; Hafner, J. Ab Initio Molecular Dynamics for Liquid Metals. Phys. Rev. B385
1993, 47, 558.386
(39) Kresse, G.; Hafner, J. Ab Initio Molecular-Dynamics Simulation of the Liquid-Metal-387
Amorphous-Semiconductor Transition in Germanium. Phys. Rev. B 1994, 49, 14251.388
(40) Kresse, G.; Furthmüller, J. Efficiency of Ab Initio Total Energy Calculations for Metals389
and Semiconductors Using a Plane-Wave Basis Set. Comput. Mat. Sci. 1996, 6, 15.390
(41) Kresse, G.; Furthmüller, J. Efficient Iterative Schemes for Ab Initio Total Energy Cal-391
culations Using a Plane-Wave Basis Set. Phys. Rev. B 1996, 54, 11169.392
(42) Blochl, P. E. Projector Augmented-Wave Method. Phys. Rev. B 1994, 50, 17953.393
(43) Kresse, G.; Joubert, D. From Ultrasoft Pseudopotentials to the Projector Augmented-394
Wave Method. Phys. Rev. B 1999, 59, 1758.395
(44) Perdew, J. P.; Burke, K.; Ernzerhof, M. Generalized Gradient Approximation Made396
Simple. Phys. Rev. Lett. 1996, 77, 3865.397
(45) Methfessel, M.; Paxton, A. T. High-precision sampling for brillouin-zone integration in398
metals. Phys. Rev. Lett. 1997, 78, 1396.399
17
Crystal(Structure(
Figure(1:(NiTi(structures.(We(examine(the(proper<es(of(B2(in(its(primi<ve,(2(atom(cell,(as(well(as(a(four(atom(cell(that(is(more(analogous(to(the(primi<ve(cells(of(B19’((and(B33.((
B19’ B33B2
a b
c
b
a
b
a
Figure 1: Phases of NiTi including B2 in its primitive, 2 atom cell as well as in a four atomcell that is analogous to the primitive cells of B19’ and B33. The monoclinic angle, γ, isdefined to be between the a and b lattice vectors.
18
0.1 1 10t (ps)
0
1
B33
NPC
F(t)
50 K300 K600 K
0.5
-0.5
50 K600 K
0
1
B19’
NPC
F(t)
50 K300 K600 K
-0.5
0.5
900 K 50 K
0
1
B2 N
PCF(
t)
50 K300 K600 K
-0.5 0.5
-05
0.5
50 K300 K
-50-2502550z (Å)
(a)
(b)
(c)
[pyr14][TFSI]
[pyr13][FSI]
B2
B19’
B33
∆ra
∆ra
∆ra
∆rb
Figure 2: Normalized position correlation function (NPCF) and scatter plots of averageatomic displacements from ideal positions along the a (∆ra) and b (∆rb) lattice vectors for(a) B2, (b) B19’, and (c) B33. The NPCFs are given for the 144 supercell at 50, 300, and600 K and differentiate between stable (NPCF(∞) ∼ 0) and unstable (NPCF(∞) ∼ 1)structures. For all cells, scatter plots are given for the lowest tested temperature of 50 K(blue circles) and 600 K (red squares).
19
0
2
4
6
8
10
B2 F
requ
ency
(TH
z)
0 K300 K
Γ X M Γ R X M R
-2
0
[ζ,0,0]
[1/2,ζ,0] [ζ,ζ,0]
[1/2,ζ,ζ]
[1/2,1/2,ζ]
[1/2,ζ,0] [ζ,ζ,0] [ζ,ζ,ζ] [1/2,ζ,0] [1/2,1/2,ζ]
(a)
Phonons&
B Γ Y A Γ E Z Γ
0
2
4
6
8
10
B19’
Fre
quen
cy (T
Hz)
0 K900 K
[ζ,0,0]
[1/2,ζ,0] [ζ,ζ,0]
[ζ,ζ,ζ]
[1/2,1/2,ζ]
[0,ζ,0] [ζ,1/2,0] [ζ,ζ,0] [ζ,ζ,1/2] [0,0,ζ]
(b)
B Γ Y A Γ E Z Γ
0
2
4
6
8
10
B33
Freq
uenc
y (T
Hz)
0 K600 K
[ζ,0,0]
[1/2,ζ,0] [ζ,ζ,0]
[ζ,ζ,ζ]
[1/2,1/2,ζ]
[0,ζ,0] [ζ,1/2,0] [ζ,ζ,0] [ζ,ζ,1/2] [0,0,ζ]
(c)
Figure 3: Phonons of the (a) B2, (b) B19’, and (c) B33 phases of NiTi at 0 K (blue,dashed line) and 600 K (red, solid line). Temperature-dependent phonons are extractedfrom simulations using the 144 atom supercell.
20
90 95 100 105γ (degrees)
-40
-20
0
20
F(γ)
- FB2
(meV
/ato
m)
600 K300 K 50 K 0 K
T = 0 K
T = 50 K
T = 300 K
T = 600 K
P=0open symbols: Einstein crystal
filled symbols: stress-strain
B2 B19’ B33
90 95 100 105γ (degrees)
0
200
400
600
800
Tem
pera
ture
(K)
50 K300 K600 K600 K300 K
T = 0 K
T = 50 K
T = 300 K
T = 600 K
P=0
open symbols: Einstein crystalfilled symbols: stress-strain
90 95 100 105γ (degrees)
0
200
400
600
800
Tem
pera
ture
(K)
50 K300 K600 K600 K300 K
T = 0 K
T = 50 K
T = 300 K
T = 600 K
P=0
open symbols: Einstein crystalfilled symbols: stress-strain
(b)
(a)
Figure 4: Helmholtz free energy along the γ reaction coordinate as a function of temperature.(a) The free energy profile along the γ reaction coordinate for 0, 50, 300, and 600 K. Filledsymbols and lines are obtained through the generalized stress-strain method, while opensymbols are provided for free energy minima using the Einstein crystal approach. Error barsfor the Einstein crystal method are < 1 meV/atom and not visible at the present scale. (b)Free energy color map as a function of temperature and γ. Regions of low free energy aregiven as blue, while regions of high free energy are given as red. White lines describe stabilitybasins and also indicates the temperature dependence for the B19’ monoclinic angle.
21
0 200 400 600Temperature (K)
-20
-15
-10
-5
0
5
6G
(meV
/ato
m)
0 K
T = 0 KT = 50 K T = 300 K
T = 600 K
GB33-GB19’ GB19’-GB2
TB33-B19’ = 75 K TB19’-B2 = 500 K
Figure 5: Gibbs free energy differences between B33 and B19’ (squares) as well as betweenB19’ and B2 (circles) phases as a function of temperature. Interpolated transition temper-atures are indicated with dashed lines. Error bars reflect the 1 meV/atom accuracy of thecomputations.
22
SUPPLEMENTAL MATERIAL
Contents
1. Energy and Structure 2
2. Finite Temperature Optimization 4
3. Phonon Dispersions 6
4. Free Energy: Generalized Stress-Strain Method 8
5. Free Energy: Einstein Crystal Methods 12
References 13
1

SUPPLEMENTAL MATERIAL 2
1. Energy and Structure
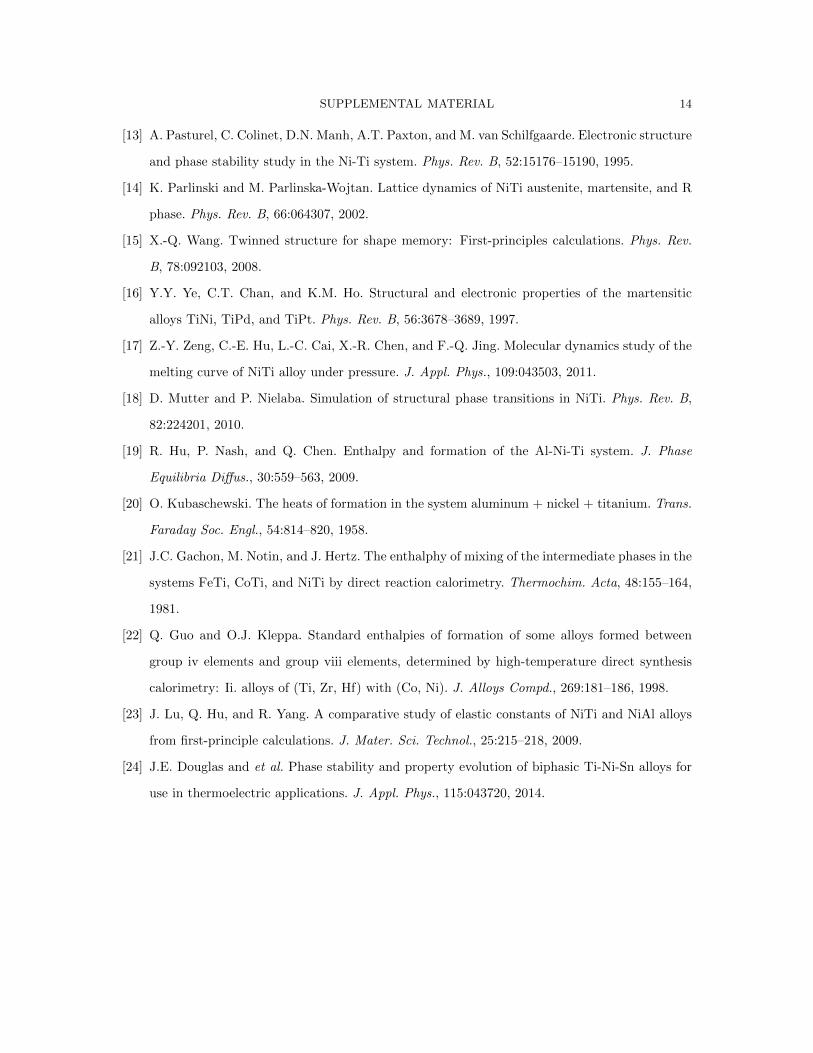
Table S1 summarizes a large number of previous T = 0 DFT calculations [1–18]
obtained for a range of DFT codes and DFT parameters. These results were as-
sembled for B19’, as well as for B19” and B33 where available. A weakly stable
phase (B19”) has been reported recently which is a monoclinic structure very similar
to B19’, except with a larger monoclinic angle (around 102o instead of 98o). The
existence of B19” is somewhat controversial with assertions that it may be a compu-
tational artifact. The table also reports if a non-zero shear stress was obtained for
the B19’ cell at a fixed monoclinic angle. While B19’ is often found to be unstable,
the exceptions are for calculations with small valences or where the valence was not
explicitly indicated. Our calculations indicate a similar trend where including p and
s electrons in the valence destabilizes B19’. We have found that when a calculation
is sufficiently converged with respect to smearing value and k-point mesh, B19” is
destabilized, though weakly so. At T = 0 K, we find only B33 to be stable with
respect to phonons and cell stresses.
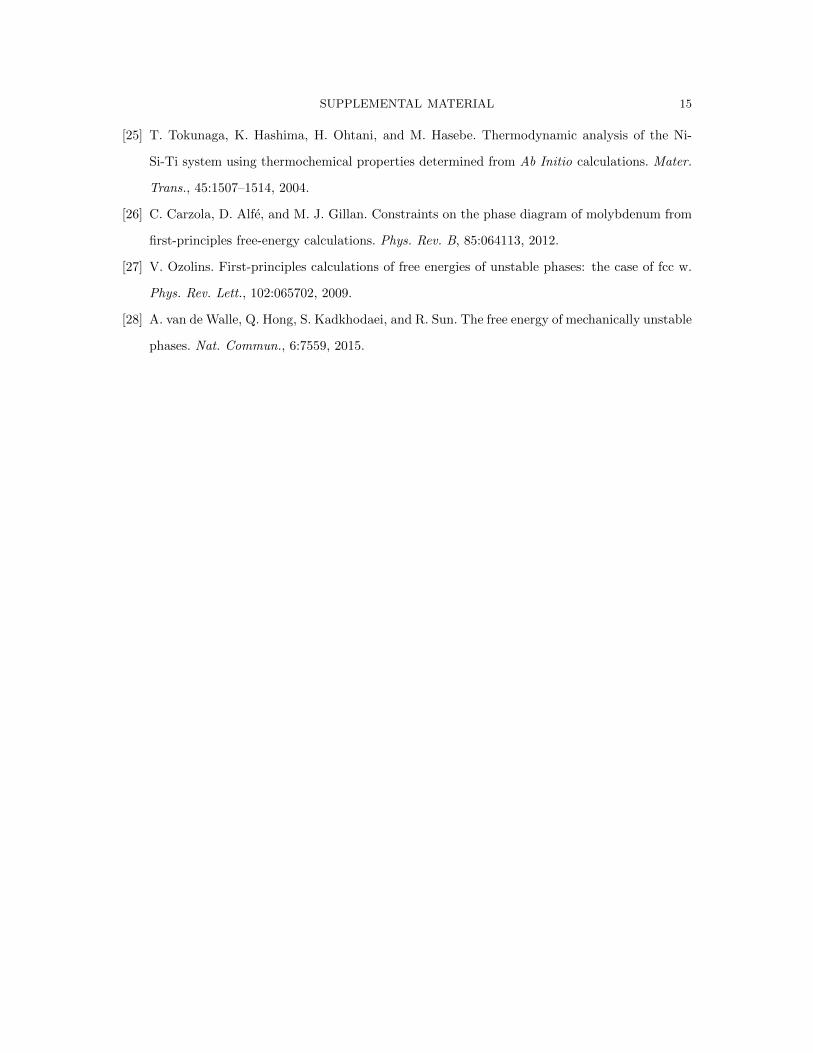
Table S2 shows experimental formation energies [19–22] of B2 as well as the calcu-
lated formation energies [1–3,13,16,23–25] of B2, B19’, B19”, and B33. The present
B2 formation energies are within the range of experimental uncertainty and in good
agreement with the values of Hatcher, [3] which were calculated with an all-electron
method. The formation energies of B19’ and B33 calculated by Hatcher are 14-15
meV/atom lower in energy than the present Ni Tipv calculations.
The varied results shown in Table S1 and Table S2 clearly show that convergence
criteria must be studied carefully for this material. We examined the effect on the en-
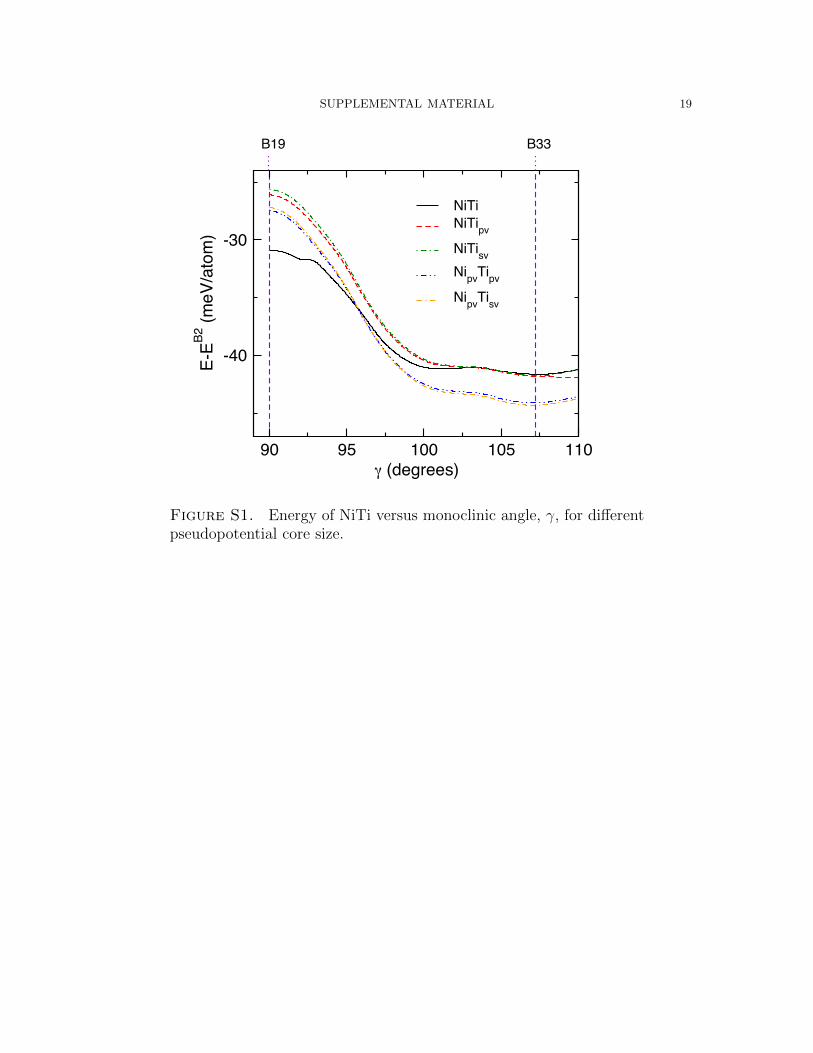
ergetic landscape caused by various calculation convergence parameters. Figures S1
SUPPLEMENTAL MATERIAL 3
and S2 show the lowest energy structures (referenced to B2) for a range of γ from 99o
to 107.5o (approximately B33) with different calculation parameters. PAW potentials
with different core/valence configurations are shown in Figure S1 for 16380 k-points
per inverse atom and an electron smearing width of 0.05 eV. The Ni Ti potential
deviates from the potentials with more valence electrons (up to 6.1 meV/atom com-
pared to Nipv Tisv). The other potentials are all within 1.3 meV/atom of one other.
The Ni Ti potential is also differentiated from the others in that it yields a stable
B19” phase while the others yield no energy minima aside from B33. This result
parallels the calculations shown in Table S1 where the potentials with the smaller
valences produced phases that were not stable when calculated with larger valences.
In Figure S2, we show a similar set of calculations, but instead of changing the
valence electrons, the k-point mesh and electron smearing parameter, sigma, are
varied. We found that B19” was stable for larger smearing parameters and less
dense meshes, but exploring denser meshes (up to 116,000 k-points per inverse atom)
with smaller sigma values (0.01 eV) yielded no stable B19” phase. For the PBE PAW
potentials included with VASP, our convergence tests show that B19’ is not a T=0 K
energy minima, and B19” is only a minima for the smallest valence PAW calculations.
When these two phases are found with VASP PAW potentials, it is likely because of
loose convergence.
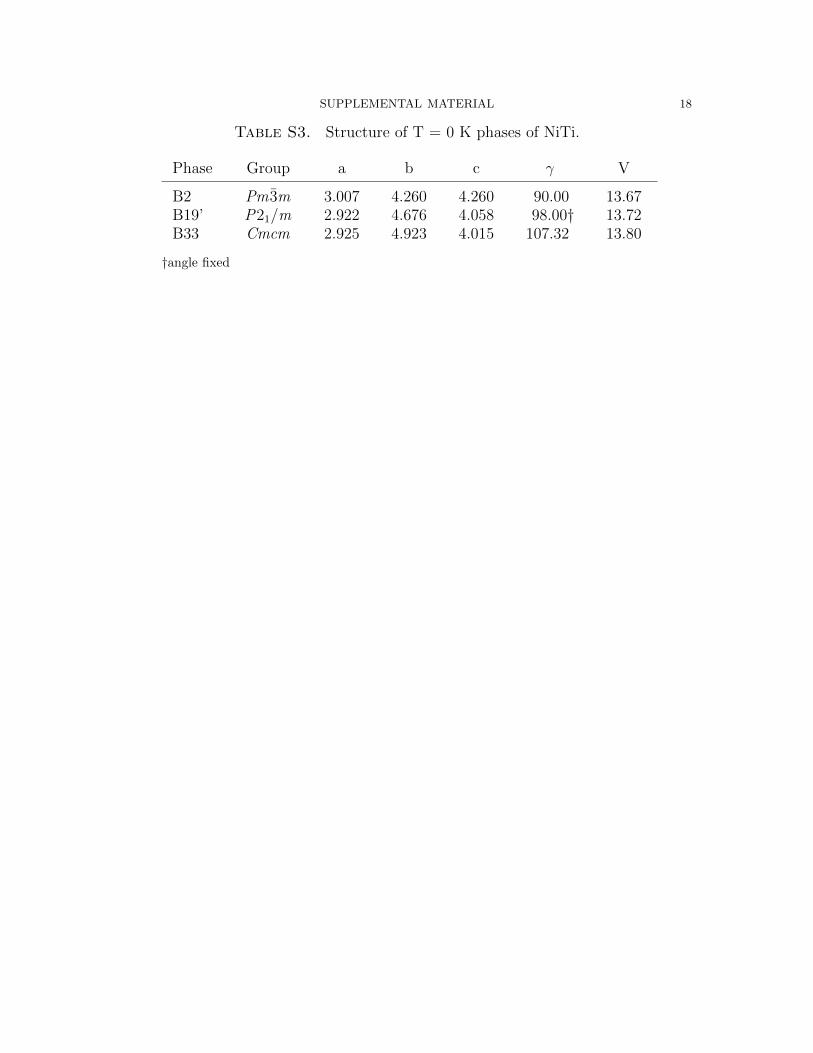
In Table S3, the T = 0 K lattice parameters for the 4-atom unit cells of B2, B19’,
and B33 are shown. As B19’ is not a stable minimum on the zero temperature energy
profile, the shown parameters are obtained from fixing the angle to 98.0o. The zero-
temperature structures have been employed [4,5] to comment on possible transition
paths between the various phases. Most notably, the large b lattice parameter of
SUPPLEMENTAL MATERIAL 4
B33, 4.923 A, is much larger than that of the other phases. There are transition
paths that include B33 as an intermediate; however, such paths would lead to large
variations in b that would be unfavorable.
2. Finite Temperature Optimization
The free energy of the B33, B19’, and B2 phases were optimized with respect to
lattice parameters at temperature to produce structures having negligible stress. The
optimization scheme is iterative and entails performing 3 ps DFT-MD simulations,
obtaining stresses averaged over this period, and altering the cell according to Ωk+1 =
Ωk−α∂F∂Ω
, where Ω is a tensor describing the cell shape, F is the Helmholtz free energy,
“k” is an iteration index, and α is a constant parameter. For a generalized crystal,
Ω is given by
(1) Ω =
ax bx cx
ay by cy
az bz cz
,where the lattice vectors are a = (ax, ay, az), b = (bx, by, bz), and c = (cx, cy, cz). This
procedure was iterated until all components of σ were < 1 kbar, which is considered
here to be stress-free and a free energy minimum.
The value of ∂F∂Ω
can be written as in terms of Ω and the stress tensor, σ. The free
energy of the system in the canonical ensemble is given by
(2) F = −β−1ln(Z),
SUPPLEMENTAL MATERIAL 5
where F is the Helmholtz free energy, Z is the partition function, and β−1 is equal
to the product of the Boltzmann constant and temperature. The partition function
is given by Z =∫
ΠNi=1dridpie
−βH, where∫
ΠNi=1dridpi... represents the integral over
phase space. The Hamiltonian, H, describing this system is
(3) H =N∑i=1
pi · pi2mi
+ U(ri),
where pi and mi are the momentum and mass of particle “i”, the summation in the
first term is taken over the N atoms in the system, and U is potential energy, which
is determined by the set of all atomic positions ri. The derivative of F with respect
to Ω is given by
(4)∂F
∂Ω= −β−1 1
Z∂Z∂Ω
.
One may expand the derivative of Z with respect to Ω by performing a canonical
transformation on the coordinates r and momenta p, such that
(5)ri = Ωρi
pi = πiΩ−1,
where ρi are reduced coordinates, πi are transformed momentum, and a superscript
“-1” indicates the inverse tensor. This transformation preserves the dynamics de-
rived from the Hamiltonian, and leads to the partition function being written as∫Πidπidρie
−βH(πi,ρi). The free energy expression in Eq. 4 then reduces to
(6)∂F
∂Ω=
⟨∂H(πi, ρi)
∂Ω
⟩,
SUPPLEMENTAL MATERIAL 6
where 〈...〉 denotes the ensemble average. The transformed Hamiltonian is given by
(7) H =N∑i=1
1
2mi
(πiΩ−1) · (πiΩ
−1) + U(Ωρi).
The derivative of H with respect to Ω may then be written as
(8)∂H∂Ω
=N∑i=1
1
mi
(πiΩ−1) · ∂(πiΩ
−1)
∂Ω+
N∑i=1
∂U
∂(Ωρi)· ∂(Ωρi)
∂Ω.
Employing vector-matrix manipulations, one may rearrange Eq. 8 as
(9)∂H∂Ω
= −N∑i=1
1
m(πiΩ
−1)⊗ (πiΩ−1)Ω−T −
N∑i=1
fi ⊗ ρi,
where f is force, ⊗ is the outer product operation, and “−T” indicated the transpose
of the inverse. Transforming back to p and r leads to
(10)∂H∂Ω
= −N∑i=1
1
mi
(pi ⊗ pi)Ω−T −
N∑i=1
(fi ⊗ ri)Ω−T .
The quantity given by −∑N
i=11m
(pi⊗pi) + (fi⊗ ri) is the product of the absolute
value of the determinant of ΩT , or volume, with the stress tensor, |detΩT |σ. Using
these relations with Eq. 6 leads to the final expression for the derivative of free energy,
(11)∂F
∂Ω= |detΩT |(σΩ−T ),
which may be employed to optimize F with respect to lattice vectors.
3. Phonon Dispersions
In Figure S3, the well known phonon dispersion of the cubic unit cell at T = 0 K
of B2 is given as a function of supercell size. The smaller end of the size range,
SUPPLEMENTAL MATERIAL 7
3x3x3 to 5x5x5 supercells, are given in Figure S3a. Increasing size from 3x3x3 to
5x5x5 reduces the frequency of the imaginary modes. Additionally, there is some
minor distortion of low frequency modes in the M→ Γ direction, near the Γ-point.
The 5x5x5 supercell results in imaginary frequencies near the Γ-point. To remove
any ambiguity in the discussion of size effects on the B2 phonons, we have computed
the phonon dispersions for 6x6x6, 7x7x7, and 8x8x8 supercell. A comparison of the
dispersions at these sizes, given in Figure S3b, indicates that size effects are effectively
mitigated by using a 6x6x6 or larger supercell. With respect to the smaller sizes, the
anomalous imaginary modes near the Γ point vanish at these large sizes, and a fine
structure of the imaginary modes along the X→M direction develops.
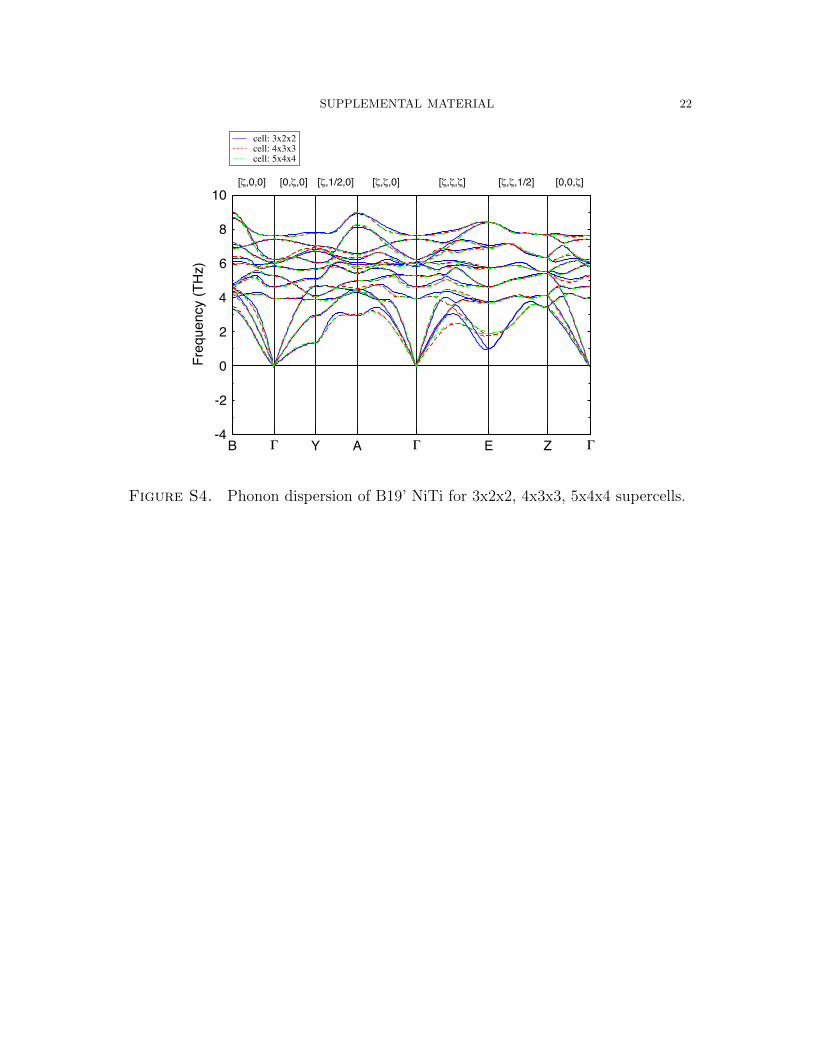
The T = 0 K phonon dispersions of the monoclinic B19’, and B33 phases are given
in Figures S4 and S5). As opposed to B2, the unit cell for the monoclinic phases
contains 4 atoms. For these systems, phonon dispersions have been computed for
3x2x2, 4x3x3, and 5x4x4 supercells, each of which has similar a, b, and c lattice
parameters. For all of these cells, the influence of size is relatively minor, with the
acoustic modes along the Γ→E→Z path exhibiting variations of roughly 1 THz.
The influence of supercell on zero temperature phonon dispersions arises from
interactions of images of displaced atoms. In a dynamical system, the number of
existing phonon modes is a finite number that is determined by the size of the system.
Simulations using larger supercells will have a denser population of phonon modes
in reciprocal space. The vibrational properties resulting from such a dynamical
simulation must therefore by converged with respect to supercell size.
A more explicit analysis of supercell size effects on the T -dependent vibrations
is through the computation of T -dependent phonon dispersions. We show such a
SUPPLEMENTAL MATERIAL 8
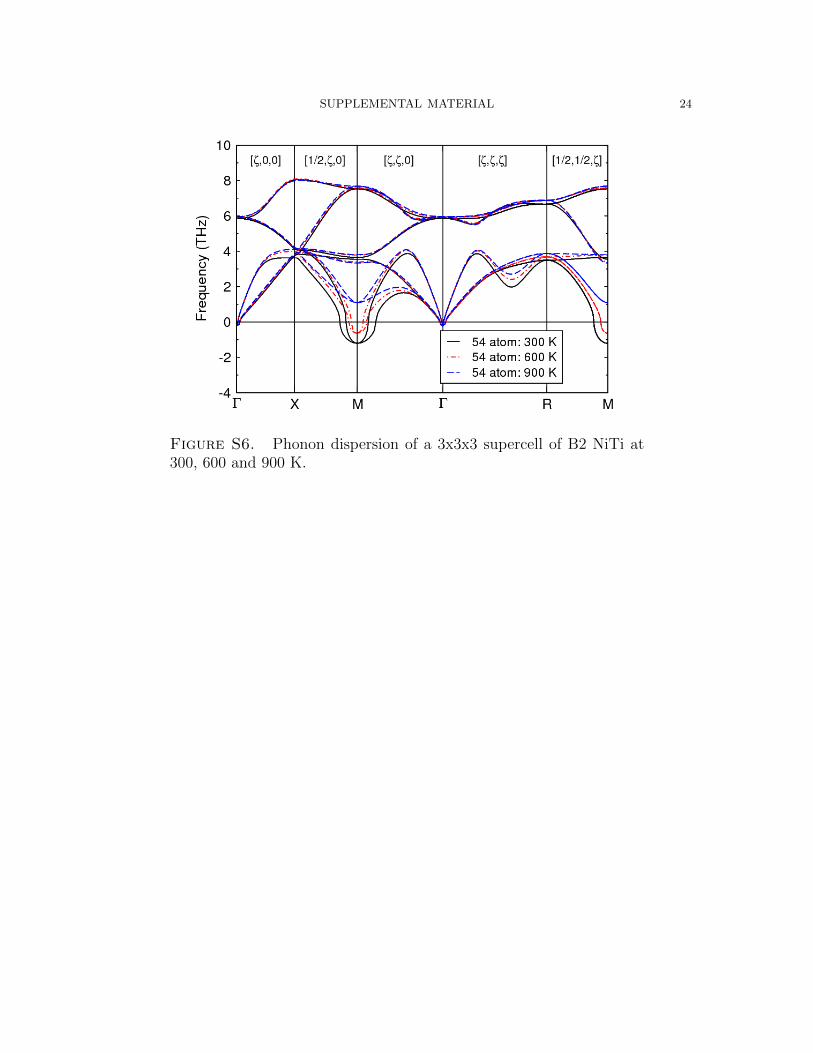
dispersions for the 3x3x3 supercell of the 2 atom B2 unit cell at 300, 600, and 900
K in Figure S6. From this size, the imaginary modes centered about the M-point
persist up to 600 K. At 900 K, the imaginary modes are not present, and the B2
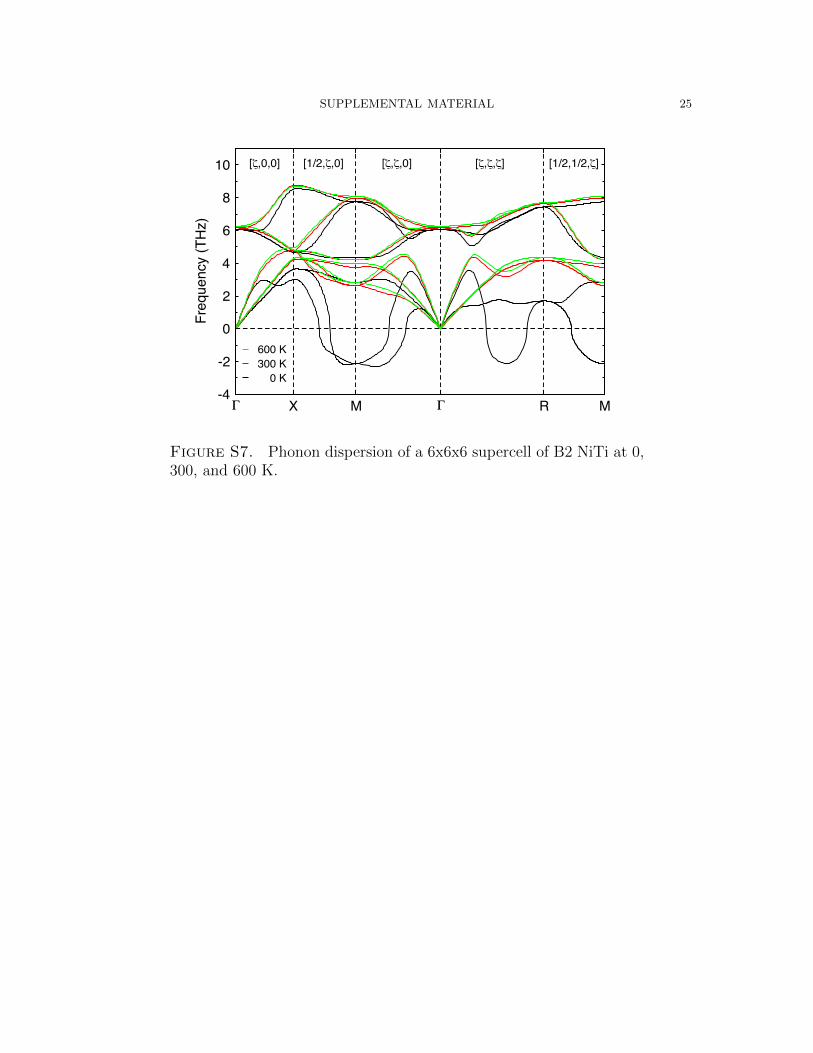
crystal is assumed stable. The B2 phonon dispersion is also shown for a 6x6x6
supercell in Figure S7. In this case, there are no imaginary modes all the way down
to 300 K, suggesting phase stability. These results are in qualitative agreement with
our previous analysis of size effects in the T = 0, and again suggests phase stability
is strongly influence by system size in the 3x3x3 unit cell.
Many of our free energy energy computations utilize the 4 atom unit cell for DFT-
MD simulations. To complete our analysis of size effects, we provide the stability
behavior of the 4x3x3 supercell in terms of T -dependent phonons in Figure S7. We
have chosen a 4x3x3, 144 atom supercell of 4 atom unit cells for our free energy
computations. As with the 6x6x6 supercell, the 4x3x3 supercell exhibits stability
down to 300 K.
4. Free Energy: Generalized Stress-Strain Method
A path between the low temperature monoclinic phases of NiTi, B33 and B19’, and
the high temperature phase, B2, can be established as a function of the monoclinic
angle, γ. This presents a natural path variable for the computation of free energy.
The free energy changes resulting from distortion of lattice vectors have been previ-
ously described for the limited case of the constant volume bcc→fcc Bain path. [26]
We here generalize this formalism to treat the variable volume deformation of any
cell. Incorporation of variable volume allows for a transformation path between two
stable phases at a given temperature but different volumes, which is the case for
SUPPLEMENTAL MATERIAL 9
NiTi phases of interest. Because the present investigation occurs at zero pressure,
the resulting difference in free energy is equivalent to Gibbs free energy.
The Ω tensor can be continuously deformed from the low temperature monoclinic
phases to the high temperature B2 phase. This deformation can be effected by
defining Ω to be dependent on a mixing parameter, λ, that linearly changes Ω from
an initial state to a final state, or Ω(λ) = Ω0 − λ(Ω0 − Ω1). The values of Ω at λ =
0 and 1 correspond to structures of stable phases, Ω0 and Ω1, respectively. Through
the use of Eq. 4, the free energy change upon such a deformation may be represented
as
(12) ∆F = −β−1
∫ 1
0
1
Z∂Z∂λ
dλ = −β−1
∫ 1
0
1
Z∂Z∂Ω
:∂Ω
∂λdλ,
where Z∂Ω
and ∂Ω∂λ
are both tensors and “:” denotes the Frobenius inner product (i.e.,∑ij∂Z∂Ω ij
∂Ω∂λ ij
). The changes in Helmholtz free energy given by Eq. 12 do not require
a constant volume. When the integration is performed between zero-pressure states,
as in the present work, the resulting measure of free energy is equivalent to Gibbs
free energy. The free energy expression in Eq. 12 further reduces to
(13) ∆F =
∫ 1
0
⟨∂H(π,ρ)
∂Ω
⟩:∂Ω
∂λdλ.
Using Eq. 10 with Eq. 13 leads to the final expression for free energy,
(14) ∆F =
∫ 1
0
Vλ
[(σΩ−T ) :
∂Ω
∂λ
]dλ,
where Vλ is defined as |detΩT |.
For NiTi, the lattice vectors of both the low-temperature martensite B33 and
B19’ structures as well as the high-temperature B2 structure can be represented as
SUPPLEMENTAL MATERIAL 10
a tensor Ω, given by
(15) Ω =
ax bx 0
0 by 0
0 0 cz
.Using this with Eq. 11 leads to
(16)
∆F =
∫ 1
0
Vλ
σxx
∂lnax∂λ
+ σyy∂lnby∂λ
+ σzz∂lncz∂λ− σxy
bxby
[∂lnax∂λ
− ∂lnbx∂λ
]dλ.
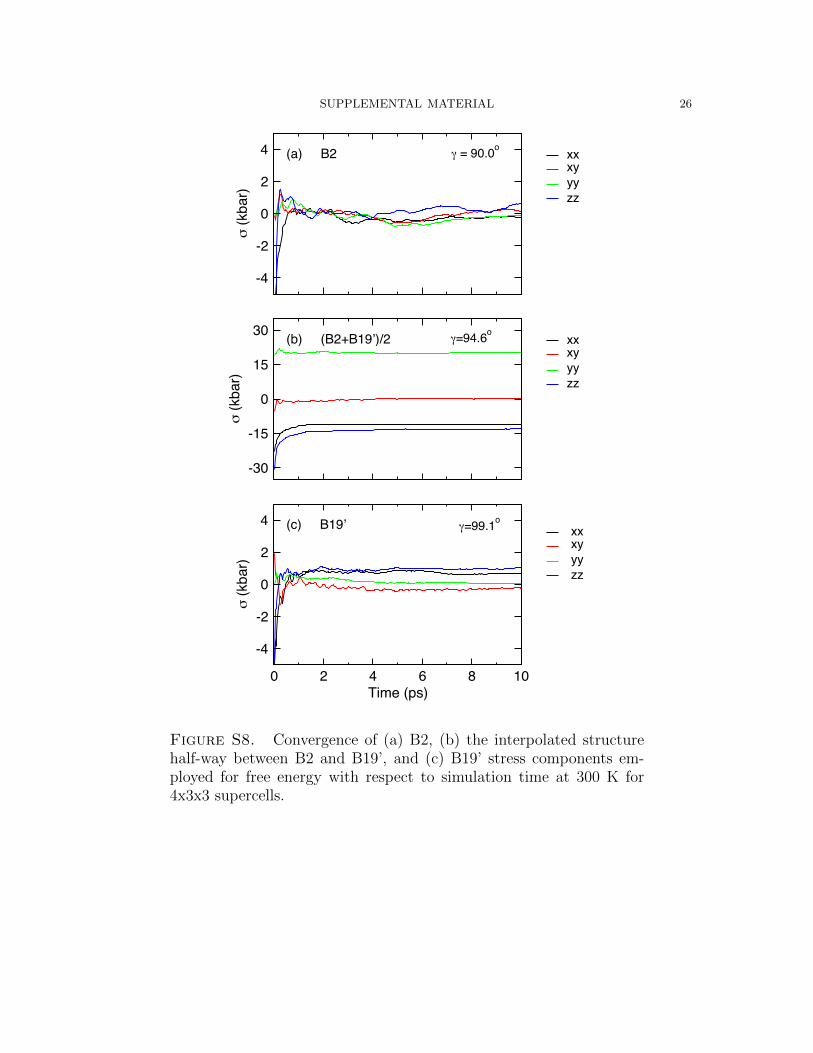
The stresses in this formulation are obtained from DFT-MD simulations, which must
be suitably long to provide a well-converged measure of stress. The time averages
of stress components required for Eq. 16 are given in Figure S8. Stresses are given
for the B2 (λ = 0) and B19’ (λ = 1) phases, as well as for an interpolated structure
between these phases (λ = 0.5). In all cases, the stresses converge in a well-behaved
manner and reach full convergence, which is defined to be within 1 kbar of the long-
time average, within a few picoseconds. As a standard practice in the present work,
we employ 10 ps DFT-MD simulations for points along our stress strain λ path.
The numerical accuracy of the DFT techniques could influence the average stress
obtained from MD simulations, as well as the resulting measure of free energy. Free
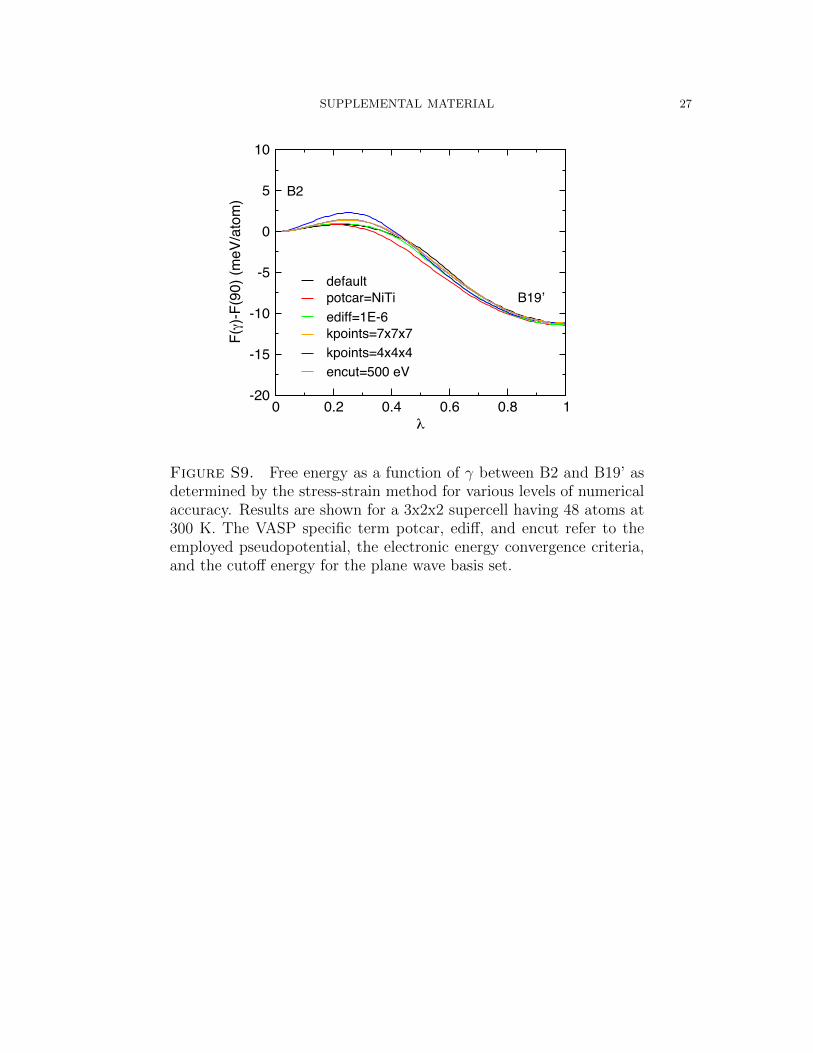
energy profiles along λ for various levels of numerical accuracy are presented in
Figure S9. For each numerical configuration, the structure of B2 and B19’, which
correspond to λ values of 0 and 1, respectively, have been fully optimized. DFT-MD
simulations are performed for nine structures (a λ spacing of 0.1) obtained by linearly
interpolating between B2 and B19’, B2−λ(B2−B19’). Our default simulation param-
eters correspond to the Ni Tipv pseudo potential, a 6x5x6 k-point mesh, a 269.5 eV
SUPPLEMENTAL MATERIAL 11
energy cutoff, and a energetic convergence criteria of 10−7. To evaluate the tolerance
of free energy to these parameters, we have performed single substitutions of each
parameter and recomputed the free energy profile. Employing the large Ni Ti core
results in variations along the λ path but no significant change in F (1)− F (0). For
k-points, both 4x4x4 and 7x7x7 k-point meshes have been employed. Both meshes
result in slightly higher transition barriers, though the difference between B19’ and
B2 free energies agrees with that obtained from simulations with the default param-
eters. For the energy cutoff. As with the other parameters, the energy cutoff, too,
results in the same free energy differences between the stable phases as the default
parameters. The free energy difference is a weak function of the above parameters.
More accurate methods, including smaller cores and more accurate functionals, are
not tenable to DFT-MD simulations, but could very well have a marked influence on
free energy.
As a final note, the free energy profile for the generalized stress-strain method rep-
resents a single interpolated path between two phases in lattice vector configuration
space. This implies that the free energy barriers are likely upper bounds to an al-
ternative path exhibiting lower stress. Nevertheless, the path chosen for the present
work coincides with motion along the [100](011) generalized stacking fault, which is
meaningful as it has been experimentally conjectured as a possible physical path for
transition. The changes in atomic configuration along this path are well-behaved and
reversible and the resulting free energy agrees well with Einstein crystal approaches,
as described in the next section. The above evidence suggests that errors resulting
from loss of lattice stability along the path or from constrained cell effects [27, 28]
are minimal.
SUPPLEMENTAL MATERIAL 12
5. Free Energy: Einstein Crystal Methods
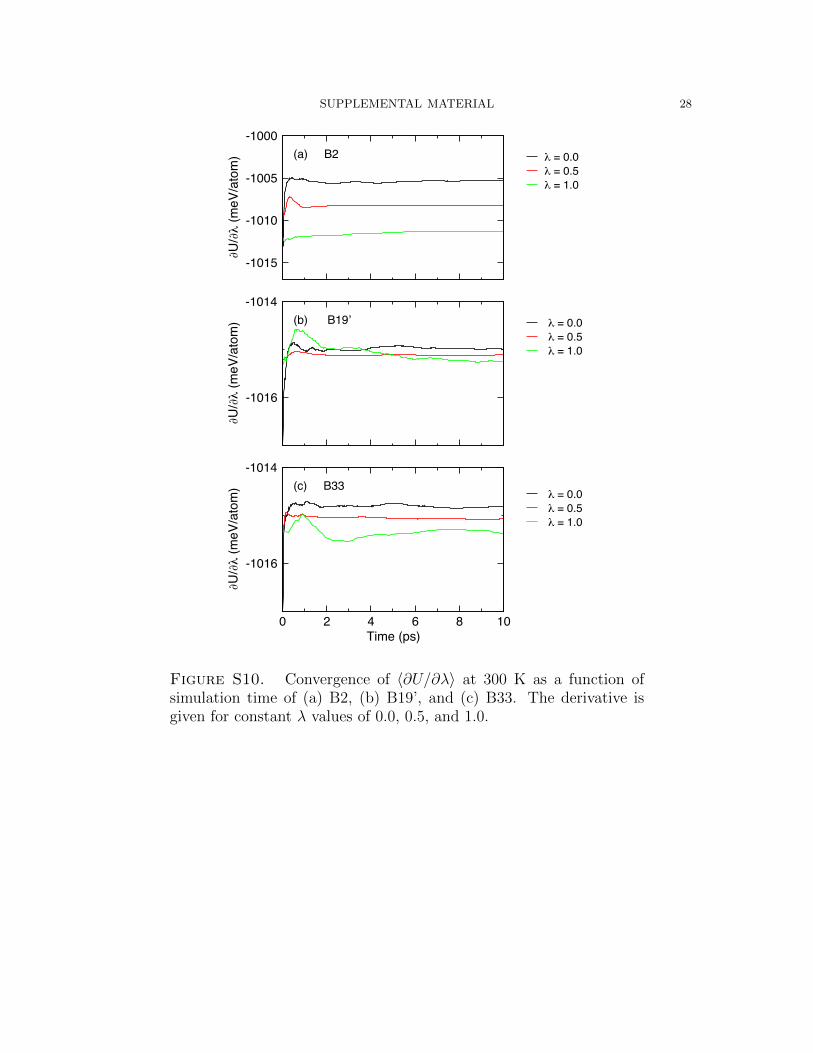
One may additionally use the principles of thermodynamic integration.
(17) ∆F =
∫ 1
0
⟨∂U
∂λ
⟩λ=λ′
dλ′
The potential energy is taken from a reference system, which preferably has a know
value of free energy, to the system of interest, given as U = U ref − λ(U ref − U full).
Choices for U ref have ranged from single harmonic wells to full force constant matrix
to represent the internal energy of the crystal. The spring constant is a generally
poor choice for U ref , while the force constant matrix is sensible if the crystal is stable
and phonons are real. There are a few classes of systems where application can vary:
disordered systems, ordered crystal with unstable phonons, and ordered crystals with
stable phonons.
In essence, the choice of reference potential will vary with respect to system type.
For the first case of a highly disordered solid system, the spring constant approach
may be a sensible reference potential. For ordered crystalline systems, phonons are
an excellent choice for reference potential. For ordered systems with unstable modes
at T = 0 K, the stabilized T-dependent phonons are used as a reference potential.
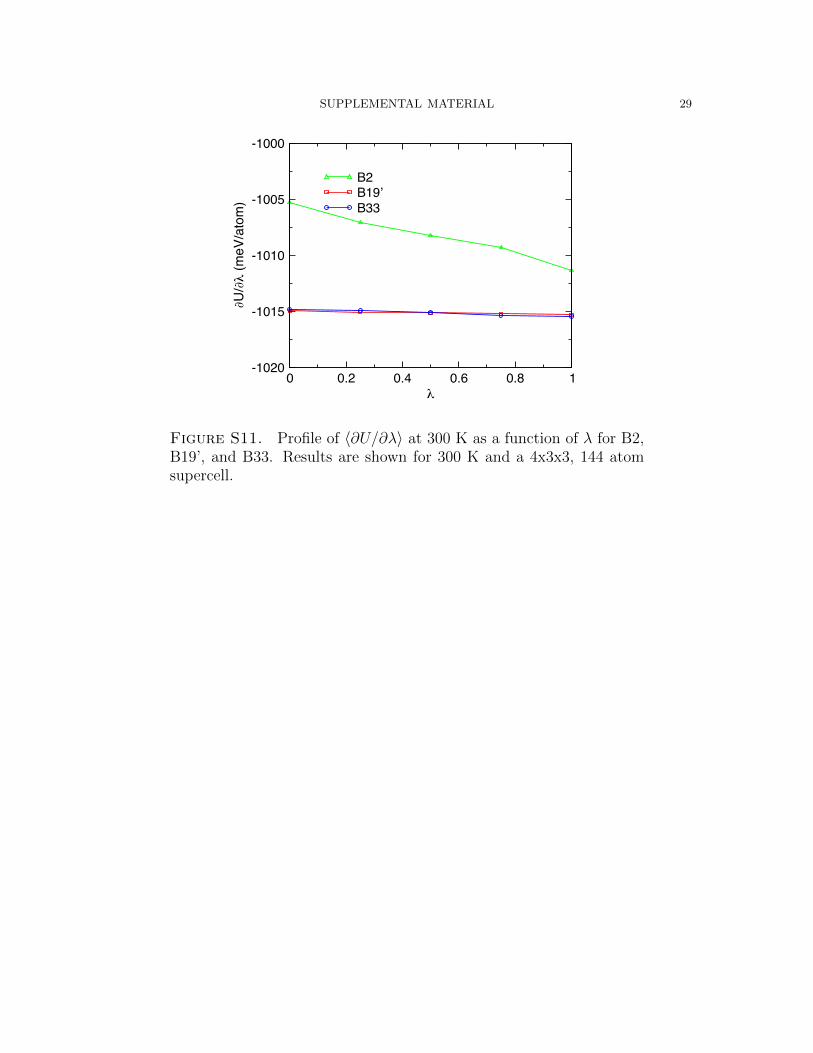
The convergence of U with respect to λ for all phases at 300 K is given in Figure S10.
For all phases, the derivatives are shown to converge within 10 ps. Profiles of ∂U∂λ
as
a function of λ are shown in Figure. S11. The highly harmonic nature of B33 and
B19’ are exhibited in the minor variation in ∂U∂λ
over the λ range. The large variation
of ∂U∂λ
for B2 may be attributed to its highly anharmonic character.
SUPPLEMENTAL MATERIAL 13
References
[1] J. E. Saal, S. Kirkland, M. Aykol, B. Meredig, and C. Wolverton. Materials design and dis-
covery with high-throughput density functional theory: The open quantum materials database
(OQMD). JOM, 65:1501–1509, 2013.
[2] A. Jain and et al. Commentary: The materials project: A materials genome approach to
accelerating materials innovation. APL Mater., 1:011002, 2013.
[3] M. Armand, F. Endres, D. R. MacFarlane, H. Ohno, and B. Scrosati. Electronic and phononic
origins of martensitic behavior in nickel titanium-based binary and ternary shape memory
alloys. Ph.D. Thesis, 2010.
[4] N. Hatcher, O. Yu. Kontsevoi, and A. J. Freeman. Martensitic transformation path in NiTi.
Phys. Rev. B, 79:020202, 2009.
[5] N. Hatcher, O. Yu. Kontsevoi, and A. J. Freeman. Role of elastic and shear stabilities in the
martensitic transformation path of NiTi. Phys. Rev. B, 80:144203, 2009.
[6] G. Vishnu and A. Stachan. Size effects in NiTi from density functional theory calculations.
Phys. Rev. B, 85:014114, 2012.
[7] M. F.-X. Wagner and W. Windl. Lattice stability, elastic constants and macroscopic moduli
of NiTi martensites from first principles. Acta Mater., 56:6232–6245, 2008.
[8] J. Wang and H. Sehitoglu. Resolving quandaries surrounding NiTi. Appl. Phys. Lett.,
101:081907, 2012.
[9] X. Huang, C. Bungaro, V. Godlevsky, and K. M. Rabe. Lattice instabilities of cubic NiTi from
first principles. Phys. Rev. B, 65:014108, 2001.
[10] D. Holec, M. Friak, A. Dlouhy, and J. Neugebauer. Ab initio study of pressure stabilized NiTi
allotropes: Pressure-induced transformations and hysteresis loops. Phys. Rev. B, 84:224119,
2011.
[11] S. Kibey, H. Sehitoglu, and D.D. Johnson. Energy landscape for martensitic phase transfor-
mation in shape memory NiTi. Acta Mater., 57:1624–1629, 2009.
[12] P. Sestak, M. Cerny, and J. Pokluda. On the effect of deformation twins on stability of B19′
structure in NiTi martensite. Comput. Mater. Sci., 87:107–111, 2014.
SUPPLEMENTAL MATERIAL 14
[13] A. Pasturel, C. Colinet, D.N. Manh, A.T. Paxton, and M. van Schilfgaarde. Electronic structure
and phase stability study in the Ni-Ti system. Phys. Rev. B, 52:15176–15190, 1995.
[14] K. Parlinski and M. Parlinska-Wojtan. Lattice dynamics of NiTi austenite, martensite, and R
phase. Phys. Rev. B, 66:064307, 2002.
[15] X.-Q. Wang. Twinned structure for shape memory: First-principles calculations. Phys. Rev.
B, 78:092103, 2008.
[16] Y.Y. Ye, C.T. Chan, and K.M. Ho. Structural and electronic properties of the martensitic
alloys TiNi, TiPd, and TiPt. Phys. Rev. B, 56:3678–3689, 1997.
[17] Z.-Y. Zeng, C.-E. Hu, L.-C. Cai, X.-R. Chen, and F.-Q. Jing. Molecular dynamics study of the
melting curve of NiTi alloy under pressure. J. Appl. Phys., 109:043503, 2011.
[18] D. Mutter and P. Nielaba. Simulation of structural phase transitions in NiTi. Phys. Rev. B,
82:224201, 2010.
[19] R. Hu, P. Nash, and Q. Chen. Enthalpy and formation of the Al-Ni-Ti system. J. Phase
Equilibria Diffus., 30:559–563, 2009.
[20] O. Kubaschewski. The heats of formation in the system aluminum + nickel + titanium. Trans.
Faraday Soc. Engl., 54:814–820, 1958.
[21] J.C. Gachon, M. Notin, and J. Hertz. The enthalphy of mixing of the intermediate phases in the
systems FeTi, CoTi, and NiTi by direct reaction calorimetry. Thermochim. Acta, 48:155–164,
1981.
[22] Q. Guo and O.J. Kleppa. Standard enthalpies of formation of some alloys formed between
group iv elements and group viii elements, determined by high-temperature direct synthesis
calorimetry: Ii. alloys of (Ti, Zr, Hf) with (Co, Ni). J. Alloys Compd., 269:181–186, 1998.
[23] J. Lu, Q. Hu, and R. Yang. A comparative study of elastic constants of NiTi and NiAl alloys
from first-principle calculations. J. Mater. Sci. Technol., 25:215–218, 2009.
[24] J.E. Douglas and et al. Phase stability and property evolution of biphasic Ti-Ni-Sn alloys for
use in thermoelectric applications. J. Appl. Phys., 115:043720, 2014.
SUPPLEMENTAL MATERIAL 15
[25] T. Tokunaga, K. Hashima, H. Ohtani, and M. Hasebe. Thermodynamic analysis of the Ni-
Si-Ti system using thermochemical properties determined from Ab Initio calculations. Mater.
Trans., 45:1507–1514, 2004.
[26] C. Carzola, D. Alfe, and M. J. Gillan. Constraints on the phase diagram of molybdenum from
first-principles free-energy calculations. Phys. Rev. B, 85:064113, 2012.
[27] V. Ozolins. First-principles calculations of free energies of unstable phases: the case of fcc w.
Phys. Rev. Lett., 102:065702, 2009.
[28] A. van de Walle, Q. Hong, S. Kadkhodaei, and R. Sun. The free energy of mechanically unstable
phases. Nat. Commun., 6:7559, 2015.
SUPPLEMENTAL MATERIAL 16
Table S1. Survey of literature results for the relative energies ofB19’, B19” and B33 with respect to B2 for different DFT codes andDFT parameters.
E-EB2 (meV/atom)
Program Method XC Valence Spin B19’ Stable? B19” B33
OQMD [1] VASP PAW PBE Ni Ti yes -31.0 yes(98.3)Materials Project [2] VASP PAW PBE Nipv Tipv yes -54.2Hatcher [3–5] FLAPW PBE All electron no -56.0 no -60.1Vishnu [6] SeqQuest LCAO NC PP PBE Ni Tipv no -40.5 no -43.5 -46.0Vishnu [6] SeqQuest LCAO NC PP PBE Ni Ti no -40.5 yes -46.5 -48.5Wagner [7] VASP PAW PW91 Ni Tipv yes -44.0 no -49.5J. Wang [8] VASP PAW PW91 no -44.1 yes -51.4 -52.4Huang [9] VASP USPP LDA Ni Tipv yes -49.0 no -54.0Huang [9] VASP PAW LDA Ni Tipv yes -54.0Huang [9] VASP USPP PW91 Ni Tipv yes -42.0 no -50.0Holec [10] VASP PAW PBE no -33.5 yes(95.3) -41.5 -42.0Kibey [11] VASP PAW PW91 no -39.5 yesSestak [12] VASP PAW PW91 Ni Tipv no -40.3 no -48.0Sestak [12] ABINIT NC PP PBE Ni Ti no -13.6 no -66.4Pasturel [13] LMTO-ASA LDA All electron no -17.6 yes (96.8)Pasturel [13] FP-LMTO LDA All electron no -18.7 yes (96.8)Parlinski [14] VASP USPP GGA Ni Ti no -43.0 yesX. Wang [15] VASP PP LDA no -51.0 yesYe [16] NC PP LDA no -45.0 yesZeng [17] VASP PAW PBE Nipv Tipv no -42.9 yes -44.7
This work VASP PAW PBE Ni Ti yes -39.6 no -41.2 -41.6This work VASP PAW PBE Ni Tipv yes -38.2 no -41.5This work VASP PAW PBE Nipv Tipv yes -40.6 no -44.2This work VASP PAW PBE Ni Tisv yes -38.4 no -41.7This work VASP PAW PBE Nipv Tisv yes -40.8 no -44.5
Mutter [18] EAM -54.0 yes
LCAO: Linear Combination of Atomic Orbitals Ni: 3d9 4s1NC: Norm Conserving Nipv: 3p6 3d8 4s2
PP: Pseudopotentials Ti: 3d3 4s1
PAW: Projector Augmented Waves Tipv: 3p6 3d3 4s1
EAM: Embedded Atom Method Tisv: 3s2 3p6 3d3 4s1
FLAPW: Full Potential Linearized Augmented Plane Wave Method
USPP: Ultrasoft Pseudopotenital
LMTO-ASA: Linear Muffin Tin Orbital-Atomic Sphere Approximation
FP-LMTO: Full Potenital-Linear Muffin Tin Orbital
SUPPLEMENTAL MATERIAL 17
Table S2. Formation energies of NiTi phases.
Eform (eV/atom)
Experimental Method B2 B19’ Stable? B19” B33
Hu [19] Direct reaction calorimetry -0.3742Kubaschewski [20] Direct reaction calorimetry -0.3513Gachon [21] Direct reaction calorimetry -0.3524Guo [22] Direct reaction calorimetry -0.3431
Program DFT Method XC Valence Spin B2 B19’ Stable? B19” B33
OQMD [1] VASP PAW PBE Ni Ti yes -0.378 -0.409 yes(98.3)Materials Project [2] VASP PAW PBE Nipv Tipv yes -0.3437 -0.3979Hatcher [3–5] FLAPW PBE All electron no -0.353 -0.409 no -0.4135Pasturel [13] LMTO-ASA LDA All electron no -0.3949 -0.4125 yes (96.8)Pasturel [13] FP-LMTO LDA All electron no -0.3731 -0.3918 yes (96.8)Lu [23] EMTO-CPA PBE Ni Ti no -0.34Douglas [24] VASP PAW PBE yes -0.411Tokunaga [25] FLAPW GGA All electron no -0.3585Ye [16] NC PP LDA no -0.66 -0.705 yes
This work VASP PAW PBE Ni Ti yes -0.3439 -0.3835 no -0.3851 -0.3855This work VASP PAW PBE Ni Tipv yes -0.3574 -0.3955 -0.3989This work VASP PAW PBE Nipv Tipv yes -0.3555 -0.3961 no -0.3997This work VASP PAW PBE Ni Tisv yes -0.3574 -0.3958 no -0.3991This work VASP PAW PBE Nipv Tisv yes -0.3557 -0.3965 no -0.4002
PAW: Projector Augmented Waves Ni: 3d9 4s1
FLAPW: Full Potential Linearized Augmented Plane Wave Method Nipv: 3p6 3d8 4s2
LMTO-ASA: Linear Muffin Tin Orbital-Atomic Sphere Approximation Ti: 3d3 4s1
FP-LMTO: Full Potenital-Linear Muffin Tin Orbital Tipv: 3p6 3d3 4s1
EMTO-CPA: Exact Muffin Tin Orbitals-Coherent Potential Approximation Tisv: 3s2 3p6 3d3 4s1
PAW: Projector Augmented Waves
NC PP: Norm Conserving Pseudopotenitals
SUPPLEMENTAL MATERIAL 18
Table S3. Structure of T = 0 K phases of NiTi.
Phase Group a b c γ V
B2 Pm 3m 3.007 4.260 4.260 90.00 13.67B19’ P21/m 2.922 4.676 4.058 98.00† 13.72B33 Cmcm 2.925 4.923 4.015 107.32 13.80
†angle fixed
SUPPLEMENTAL MATERIAL 19
90 95 100 105 110γ (degrees)
-40
-30
E-EB2
(meV
/ato
m)
NiTiNiTipv
NiTisvNipvTipv
NipvTisv
B19 B33
Figure S1. Energy of NiTi versus monoclinic angle, γ, for differentpseudopotential core size.
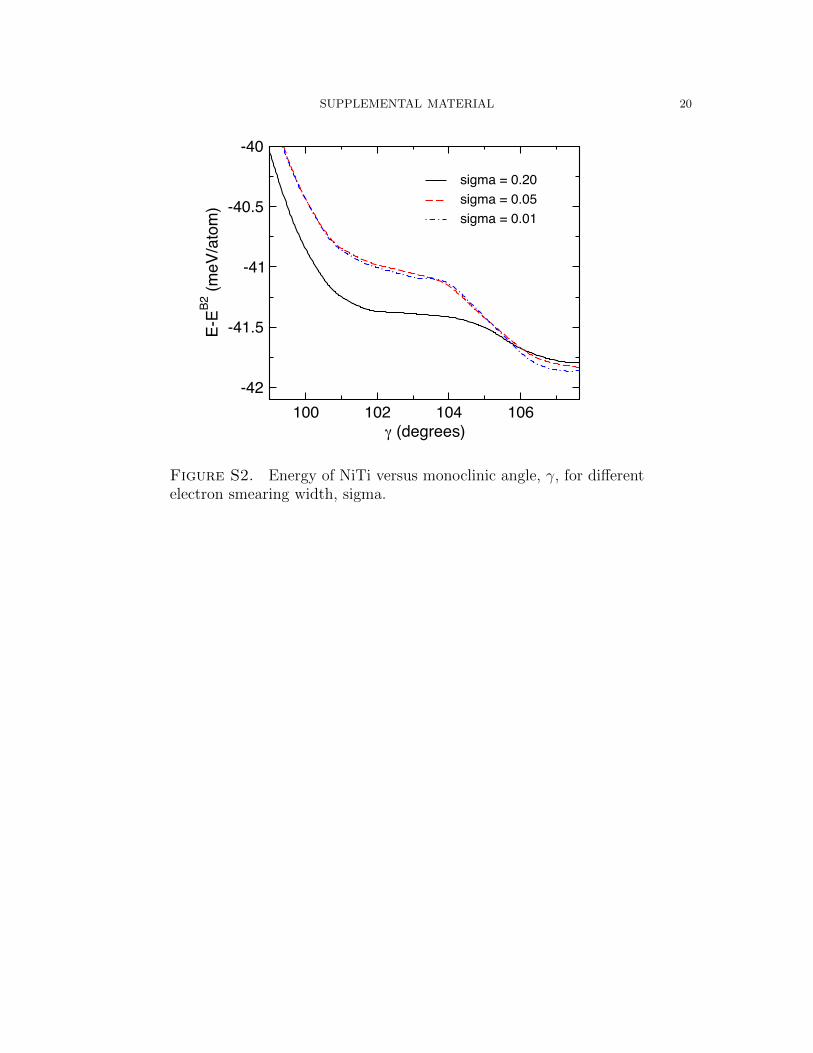
SUPPLEMENTAL MATERIAL 20
100 102 104 106γ (degrees)
-42
-41.5
-41
-40.5
-40
E-EB2
(meV
/ato
m)
sigma = 0.20sigma = 0.05sigma = 0.01
B19 B33
Figure S2. Energy of NiTi versus monoclinic angle, γ, for differentelectron smearing width, sigma.

SUPPLEMENTAL MATERIAL 21
Γ X M Γ R M-4
-2
0
2
4
6
8
10Fr
eque
ncy
(TH
z)
cell: 3x3x3cell: 4x4x4cell: 5x5x5
[ζ,0,0] [1/2,ζ,0] [ζ,ζ,0] [ζ,ζ,ζ] [1/2,1/2,ζ]
(a)
Γ X M Γ R M-4
-2
0
2
4
6
8
10
Freq
uenc
y (T
Hz)
cell: 6x6x6cell: 7x7x7cell: 8x8x8
[ζ,0,0] [1/2,ζ,0] [ζ,ζ,0] [ζ,ζ,ζ] [1/2,1/2,ζ]
(b)
Figure S3. Phonon dispersion of cubic B2 NiTi for 3x3x3 to 8x8x8 supercells.
SUPPLEMENTAL MATERIAL 22B19’,&4&atom&cell,&T&=&0&K&
B K Y A K E Z K-4
-2
0
2
4
6
8
10Fr
eque
ncy
(TH
z)
cell: 3x2x2cell: 4x3x3cell: 5x4x4[c,0,0]
[1/2,c,0] [c,c,0]
[c,c,c]
[1/2,1/2,c]
[0,c,0] [c,1/2,0] [c,c,0] [c,c,1/2] [0,0,c]
B19,%4%atom%cell,%T%=%0%K%
B K Y A K E Z K-4
-2
0
2
4
6
8
10
Freq
uenc
y (T
Hz)
cell: 3x2x2cell: 4x3x3cell: 5x4x4[c,0,0]
[1/2,c,0] [c,c,0]
[c,c,c]
[1/2,1/2,c]
[0,c,0] [c,1/2,0] [c,c,0] [c,c,1/2] [0,0,c]
Figure S4. Phonon dispersion of B19’ NiTi for 3x2x2, 4x3x3, 5x4x4 supercells.
SUPPLEMENTAL MATERIAL 23B33,$4$atom$cell,$T$=$0$K$
B K Y A K E Z K-4
-2
0
2
4
6
8
10Fr
eque
ncy
(TH
z)
cell: 3x2x2cell: 4x3x3cell: 5x4x4[c,0,0]
[1/2,c,0] [c,c,0]
[c,c,c]
[1/2,1/2,c]
[0,c,0] [c,1/2,0] [c,c,0] [c,c,1/2] [0,0,c]
B19,%4%atom%cell,%T%=%0%K%
B K Y A K E Z K-4
-2
0
2
4
6
8
10
Freq
uenc
y (T
Hz)
cell: 3x2x2cell: 4x3x3cell: 5x4x4[c,0,0]
[1/2,c,0] [c,c,0]
[c,c,c]
[1/2,1/2,c]
[0,c,0] [c,1/2,0] [c,c,0] [c,c,1/2] [0,0,c]
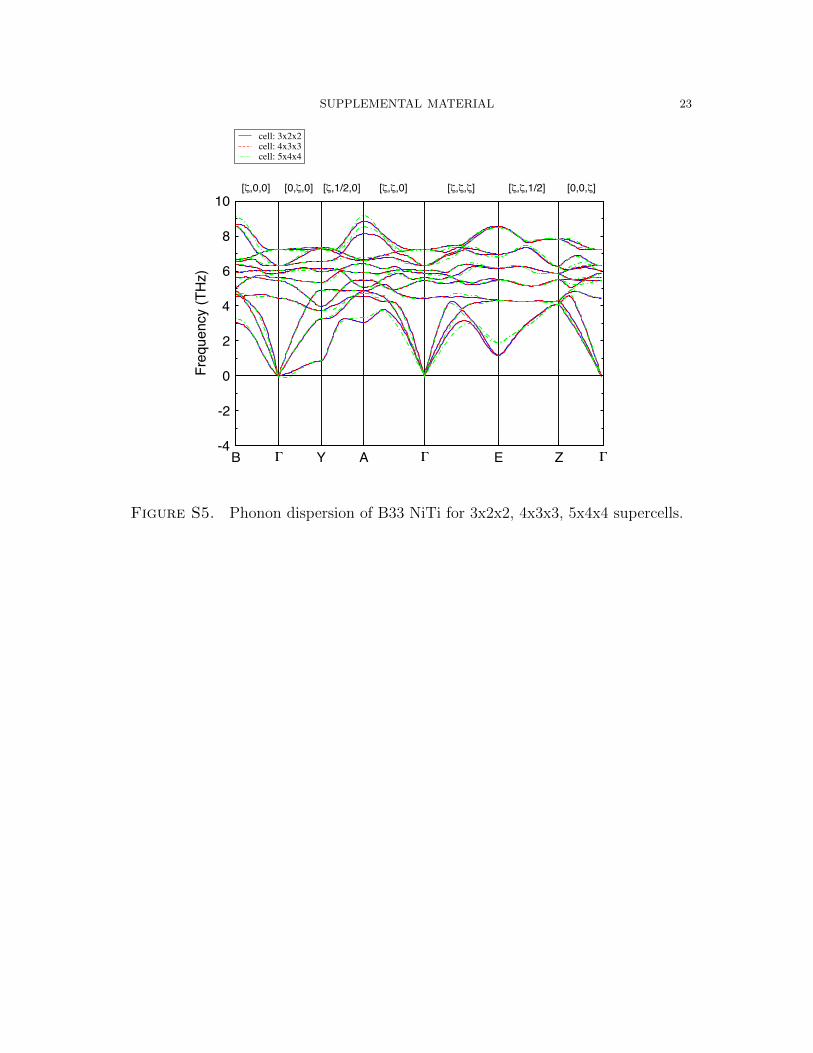
Figure S5. Phonon dispersion of B33 NiTi for 3x2x2, 4x3x3, 5x4x4 supercells.
SUPPLEMENTAL MATERIAL 24
Temperature)Dependent)B2)Phonon)Dispersion)
Figure S6. Phonon dispersion of a 3x3x3 supercell of B2 NiTi at300, 600 and 900 K.
SUPPLEMENTAL MATERIAL 25
Γ X M Γ R M-4
-2
0
2
4
6
8
10
Freq
uenc
y (T
Hz)
600 K 300 K 0 K
[ζ,0,0] [1/2,ζ,0] [ζ,ζ,0] [ζ,ζ,ζ] [1/2,1/2,ζ]
Figure S7. Phonon dispersion of a 6x6x6 supercell of B2 NiTi at 0,300, and 600 K.
SUPPLEMENTAL MATERIAL 26
-4
-2
0
2
4
σ (k
bar)
xxxyyyzz
-30
-15
0
15
30
σ (k
bar)
xxxyyyzz
0 2 4 6 8 10Time (ps)
-4
-2
0
2
4
σ (k
bar)
xxxyyyzz
-3 -2 -1 0 1 2 3Ψ (V)
(a) B2
(b) (B2+B19’)/2
(c) B19’
(b)
(d)
(f)
[pyr14][TFSI]
[pyr13][FSI]
[EMIM][BF4]
γ = 90.0o
γ=94.6o
γ=99.1o
Figure S8. Convergence of (a) B2, (b) the interpolated structurehalf-way between B2 and B19’, and (c) B19’ stress components em-ployed for free energy with respect to simulation time at 300 K for4x3x3 supercells.
SUPPLEMENTAL MATERIAL 27
0 0.2 0.4 0.6 0.8 1λ
-20
-15
-10
-5
0
5
10
F(γ)
-F(9
0) (m
eV/a
tom
)
defaultpotcar=NiTiediff=1E-6kpoints=7x7x7kpoints=4x4x4encut=500 eV
B2
B19’
default: lreal = TRUE, ediff 1E-7, encut = min, potcar=NiTi_pv
T = 300K3x2x2 supercell, 48 atoms
Figure S9. Free energy as a function of γ between B2 and B19’ asdetermined by the stress-strain method for various levels of numericalaccuracy. Results are shown for a 3x2x2 supercell having 48 atoms at300 K. The VASP specific term potcar, ediff, and encut refer to theemployed pseudopotential, the electronic energy convergence criteria,and the cutoff energy for the plane wave basis set.
SUPPLEMENTAL MATERIAL 28
-1015
-1010
-1005
-1000
∂U/∂λ
(meV
/ato
m) λ = 0.0
λ = 0.5λ = 1.0
-1016
-1014
∂U/∂λ
(meV
/ato
m) λ = 0.0
λ = 0.5λ = 1.0
0 2 4 6 8 10Time (ps)
-1016
-1014
∂U/∂λ
(meV
/ato
m) λ = 0.0
λ = 0.5λ = 1.0
-3 -2 -1 0 1 2 3Ψ (V)
(a) B2
(b) B19’
(c) B33
(b)
(d)
(f)
[pyr14][TFSI]
[pyr13][FSI]
[EMIM][BF4]
γ = 90.0o
γ=94.6o
γ=99.1o
Figure S10. Convergence of 〈∂U/∂λ〉 at 300 K as a function ofsimulation time of (a) B2, (b) B19’, and (c) B33. The derivative isgiven for constant λ values of 0.0, 0.5, and 1.0.
SUPPLEMENTAL MATERIAL 29
0 0.2 0.4 0.6 0.8 1λ
-1020
-1015
-1010
-1005
-1000
∂U/∂λ
(meV
/ato
m)
B2B19’B33
P=0
Figure S11. Profile of 〈∂U/∂λ〉 at 300 K as a function of λ for B2,B19’, and B33. Results are shown for 300 K and a 4x3x3, 144 atomsupercell.
![PDF] Hands-On Tutorial on Ab Initio Molecular Simulations ...Hands-On Tutorial on Ab Initio Molecular Simulations Berlin, July 12 { 21, 2011 Tutorial I: Basics of Electronic-Structure](https://img.pdfslide.net/doc/110x75/612d24fa1ecc5158694201ae/hands-on-tutorial-on-ab-initio-molecular-simulations-hands-on-tutorial-on-ab.jpg)