Embed Size (px)
Citation preview
www.gov.uk/defra
Abatement cost guidance for valuing changes in air quality May 2013
This in
formati
on is
out o
f date
.
Lates
t infor
mation
is av
ailab
le on
gov.u
k
© Crown copyright 2013
You may re-use this information (not including logos) free of charge in any format or medium, under the terms of the Open Government Licence. To view this licence, visit www.nationalarchives.gov.uk/doc/open-government-licence/ or write to the Information Policy Team, The National Archives, Kew, London TW9 4DU, or e-mail: [email protected]
This document/publication is also available on our website at:
www.gov.uk/air-quality-economic-analysis
Any enquiries regarding this document/publication should be sent to us at:
PB13912
This in
formati
on is
out o
f date
.
Lates
t infor
mation
is av
ailab
le on
gov.u
k

Contents
Executive Summary ............................................................................................................. 1
1. Introduction ................................................................................................................... 3
2. Overview of the abatement cost approach ................................................................... 7
3. Stage One: Apply damage costs ................................................................................ 10
4. Stage Two: Assess impact on compliance ................................................................. 11
Establishing current levels of air quality ......................................................................... 11
Estimating changes as a result of the proposal .............................................................. 11
Assessing compliance .................................................................................................... 12
5. Stage Three: Apply unit costs ..................................................................................... 14
6. Stage Four: Undertake detailed abatement assessment ............................................ 18
7. Hypothetical example of the application of unit costs ................................................. 22
Annex A: National Air Quality Objectives and European Directive Limit and Target Values ........................................................................................................................................... 24
Annex B: Glossary ............................................................................................................. 27
This in
formati
on is
out o
f date
.
Lates
t infor
mation
is av
ailab
le on
gov.u
k
1
2 2010.
Executive Summary The quality of the air impacts upon people’s health and the environment. Air pollution is estimated to reduce life expectancy of people in the UK by 6 months on average, imposing a cost of around £16 billion per year1. Despite substantial improvements that have reduced these adverse effects, air quality in some locations remains a notable concern. Minimum air quality standards in some areas are not being delivered, in particular the NOannual mean limit of 40μg.m–3 which was breached in 40 out of 43 zones in
This guidance provides an overview of the abatement cost methodology which is designed to value changes in air quality linked to breaches of legally binding obligations. It describes the abatement cost valuation process and highlights sources of further information, building on the principles set out in Air Quality Appraisal – Valuing Environmental Limits2. This methodology has been developed by Defra with support from the Interdepartmental Group on Costs and Benefits (IGCB), a Defra-led group of government analysts that provides advice relating to the quantification and valuation of local environmental impacts.
Supplementary Green Book guidance on valuing changes in air quality explains how to incorporate air quality impacts into policy appraisal3. In most cases changes in air quality should be valued using the impact pathway approach. The abatement cost approach should be used only when air pollution is in breach of legally binding obligations; or when breaches are expected as a result of a proposal. The primary source of obligations is the Air Quality Directive.
When pollution is in breach of legally binding obligations action to reduce emissions is needed. If a policy affects compliance this alters how much abatement action is required to ensure compliance. The abatement cost approach informs decision-making by estimating the value of such changes in abatement activity. For increases in pollution the abatement cost reflects the associated increase in the cost of action while for reductions in pollution it reflects a benefit in terms of avoided costs of action. Where a policy affects compliance the abatement cost approach replaces the existing impact pathway approach, which remains best practice for changes not affecting compliance with legally binding obligations and estimates the social costs of changes in air quality.
There are two parts to the abatement cost approach: the scientific assessment and the economic assessment. The scientific assessment reviews whether a decision is likely to result in non-compliance with a legally binding obligation, taking a proportionate approach depending on the expected scale of the air quality impacts. The economic assessment then values the change in air quality estimated by the scientific assessment, producing a monetary estimate of the air quality impact.
1 http://archive.defra.gov.uk/environment/quality/air/airquality/panels/igcb/documents/100303-aq-valuing-impacts.pdf 2 As above. 3 Available at www.gov.uk/air-quality-economic-analysis
This in
formati
on is
out o
f date
.
Lates
t infor
mation
is av
ailab
le on
gov.u
k
2
Drivers of air pollution vary between areas and so the best abatement options will often depend on the local situation. As bespoke local-level assessments to identify the best options are resource intensive, standard unit costs have been developed to help inform decision making. They help indicate the scale of air quality impact from key pollutants and can inform what level of analysis will be proportionate. This guidance explains when unit costs should be used, and how they should be applied.
Unit costs help to determine whether more detailed abatement cost analysis is needed. If the air quality impacts are valued at more than £50m using unit costs it is suggested that a full abatement cost analysis might be necessary. This guidance provides an overview of what such analysis entails. We recommend that you contact Defra in such cases for advice on what is proportionate. The advice might be to continue to use the unit costs approach, to use available abatement cost tools, or to undertake bespoke analysis.
This in
formati
on is
out o
f date
.
Lates
t infor
mation
is av
ailab
le on
gov.u
k

3
1. Introduction 1. The quality of the air impacts people’s health and the environment. A conservative
estimate for one type of air pollution (particulates) is that it reduces life expectancy in the UK by six months on average, worth £16 billion per year4. It is also estimated that pollution levels affecting over half of the world’s habitable areas could lead to “significant harmful effects” on the environment5.
2. Significant progress has been made in improving air quality. However there is still more to do to ensure that the decisions made by individuals, businesses and the public sector deliver cleaner air, both for today and for future generations. To help with this it is therefore important that the air quality impacts of any proposed policy, programme or project are understood and proportionately accounted for in appraisal and decision making.
3. This guidance has been produced by Defra with the support of the Interdepartmental Group on Costs and Benefits (IGCB), a group that provides advice relating to the quantification and valuation of local environmental impacts. Depending on the circumstances different methodologies will be recommended for valuing changes in air quality.
4. This guidance focuses on one of these methodologies, the abatement cost approach. It explains how to value the air quality impacts of a proposal that changes air quality above a legally binding obligation. This approach is only recommended for use on emissions above legally binding obligations, where a decision is likely to:
• Cause an exceedence of a legally binding obligation; • Increase emissions in an area where a legally binding obligation is already being
breached; or, • Reduce emissions in an area where a legally binding minimum obligation is
already being breached.
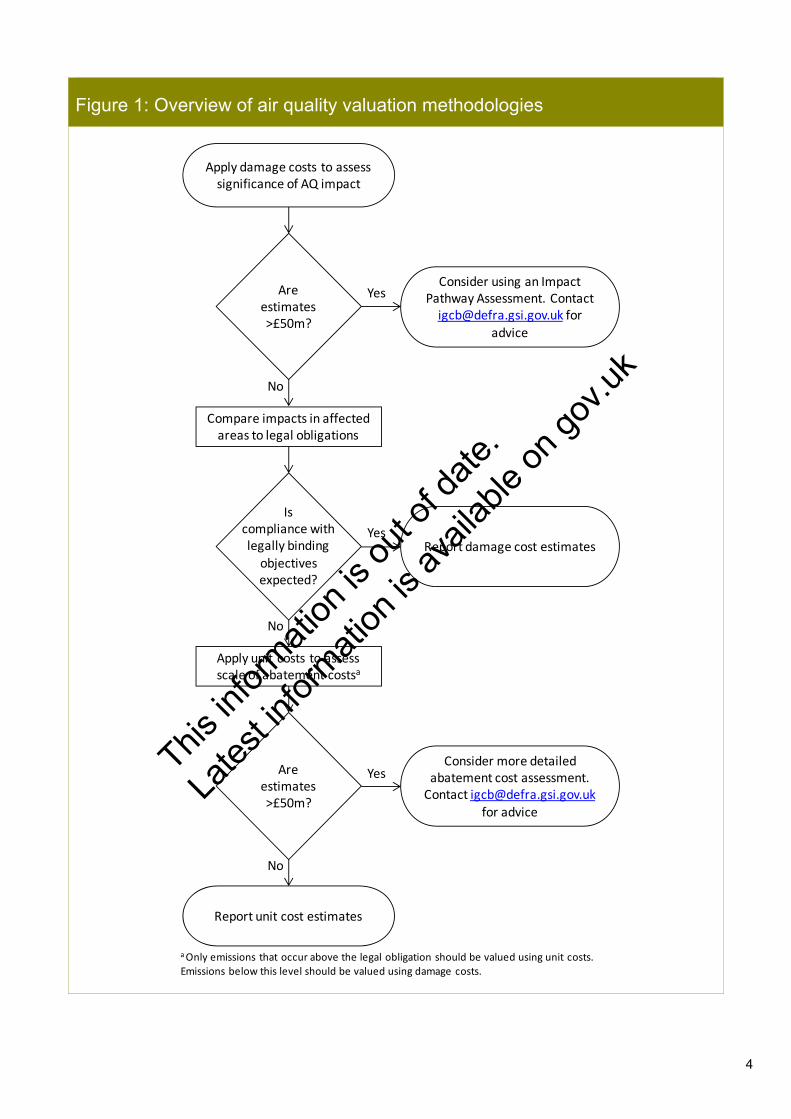
5. This therefore covers decisions which would cause an exceedence and those which would worsen or improve an existing exceedence. Other objectives such as target values which are not legally binding should not be valued using the abatement cost methodology. In all other circumstances valuation should be undertaken using either the impact pathway approach or damage cost approach6. Figure 1 illustrates how to identify the appropriate approach.
4 http://archive.defra.gov.uk/environment/quality/air/airquality/panels/igcb/documents/100303-aq-valuing-impacts.pdf 5 http://archive.defra.gov.uk/environment/quality/air/airquality/strategy/documents/air-qualitystrategy-vol1.pdf 6 www.gov.uk/air-quality-economic-analysis
This in
formati
on is
out o
f date
.
Lates
t infor
mation
is av
ailab
le on
gov.u
k
4
Figure 1: Overview of air quality valuation methodologies
Yes
No
Yes
Yes
No
No
Are estimates >£50m?
Is compliance with legally binding objectives expected?
Are estimates >£50m?
Compare impacts in affected areas to legal obligations
Apply unit costs to assess scale of abatement costsa
Report unit cost estimates
Apply damage costs to assess significance of AQ impact
aOnly emissions that occur above the legal obligation should be valued using unit costs. Emissions below this level should be valued using damage costs.
Consider using an Impact Pathway Assessment. Contact [email protected] for
advice
Report damage cost estimates
Consider more detailed abatement cost assessment. Contact [email protected]
for advice
This in
formati
on is
out o
f date
.
Lates
t infor
mation
is av
ailab
le on
gov.u
k
5
6. The UK has a number of legally binding obligations established to manage the risk to health and the environment. They restrict the levels at which particular substances can be present in the air or the total amount which can be emitted and are set in EU directives, primarily the Air Quality Directive. Annex A provides further details of these obligations.
7. The obligations were set using the best available scientific and medical evidence on the effect of pollutants on health and the wider environment. The complexity of the science is such that standards have to be set without perfect information, but applying these obligations allows the risks to be managed. Currently the UK is projected to comply with the majority of its obligations. However, compliance with certain obligations is uncertain, particularly the EU limit values for nitrogen dioxide (NO2) and particulate matter (PM10). The abatement cost approach can be applied for any pollutant where legally binding obligations are expected to be breached.
8. If legally binding obligations are not met remedial actions will be needed to restore compliance, or fines will be imposed. Consequently decisions that result in non-compliance may create substantial financial liabilities. The abatement cost approach recognises this, and values any changes in air quality that exceed an obligation at the cost of subsequently restoring compliance. The approach is only recommended where pollution is already in breach of legally binding obligations, or where this is expected as a result of the policy under consideration. The approach should not be used for objectives that are not legally binding, nor when setting targets or binding obligations. The impact pathway approach is appropriate for such circumstances.
9. For decisions likely to result in exceedences the approach estimates the change in cost to restore compliance. For decisions that improve air quality the approach values the benefit in terms of the cost of avoided compliance activity. A full explanation of the basis on which this approach was adopted is available in Air Quality Appraisal – Valuing Environmental Limits7.
10. The abatement cost approach has two parts: the scientific assessment and the economic assessment. While the focus of this guidance is on the economic tools for valuation, an outline of the scientific assessment is included with links to more detailed information. The scientific assessment reviews how a decision is likely to affect air quality and compliance with relevant legally binding objectives. The ‘compliance gap’ is the difference between air quality with the decision and the relevant obligation (unless non-compliance is forecast both with the decision and in the baseline, in which case it is the difference between the two outcomes).
7 Available from www.gov.uk/air-quality-economic-analysis
This in
formati
on is
out o
f date
.
Lates
t infor
mation
is av
ailab
le on
gov.u
k
6
11. The economic assessment then places a monetary cost estimate on the change in air quality represented by the compliance gap. Which value is applied will depend upon the specific situation. A four stage methodology has been developed:
• Estimate the likely scale of the impact on emissions by applying damage costs to the change in emissions.
• Identify whether there is expected to be any impact on compliance with legally-binding obligations.
• Estimate the value of the change in air quality using unit abatement costs, which provide an indicative marginal cost per tonne of emission based on the average marginal abatement technology. This provides an easy to use indicative estimate of the abatement impact.
• Where a decision is likely to have a significant impact on compliance (suggested as a value greater than £50m) then more detailed analysis may be justified. One approach to such an analysis is the use of Marginal Abatement Cost curves (MACCs). The flexibility of this approach provides a more accurate estimate than the single figure applied in Stage 3 above.
The selection between approaches should be informed by the circumstances of the decision being made.
12. The remainder of this guidance focuses on the available tools to undertake such an assessment. The structure of this guidance is as follows:
• Chapter 2: Overview of the abatement cost approach • Chapter 3: Stage One: Apply damage costs • Chapter 4: Stage Two: Assess impact on compliance • Chapter 5: Stage Three: Apply unit costs • Chapter 6: Stage Four: Undertake detailed abatement assessment • Chapter 7: Hypothetical worked example
This in
formati
on is
out o
f date
.
Lates
t infor
mation
is av
ailab
le on
gov.u
k
7
2. Overview of the abatement cost approach 13. The abatement cost approach to valuing changes in air quality is required for the
minority of occasions when the breach of legally binding obligations is an issue. It could be that air pollution is already in breach of an obligation, or that a breach is expected as a result of the decision under consideration. In such instances it is still only those changes in air quality in excess of the relevant obligation that should be valued using this approach. Legally binding obligations have been established to manage the risk from air pollution and to protect the environment for the current and future generations. These were set using the best available science and medical evidence (although it should be noted gaps in the evidence remain).
14. To ensure that Government takes account of air quality impacts consistently across decision making this guidance provides monetary values for these impacts to be used in the broader framework of cost benefit analysis. In this way it is possible to balance air quality impacts against the range of other consequences from a proposed policy, programme or project.
15. The abatement cost approach supplements the existing damage based approach by using the cost of mitigation where such action is necessary. More specifically the approach looks to reflect the fact that where legally binding obligations are not met action will be necessary, and so the cost of this action should help inform any decisions that impact on compliance with a legally binding objective.
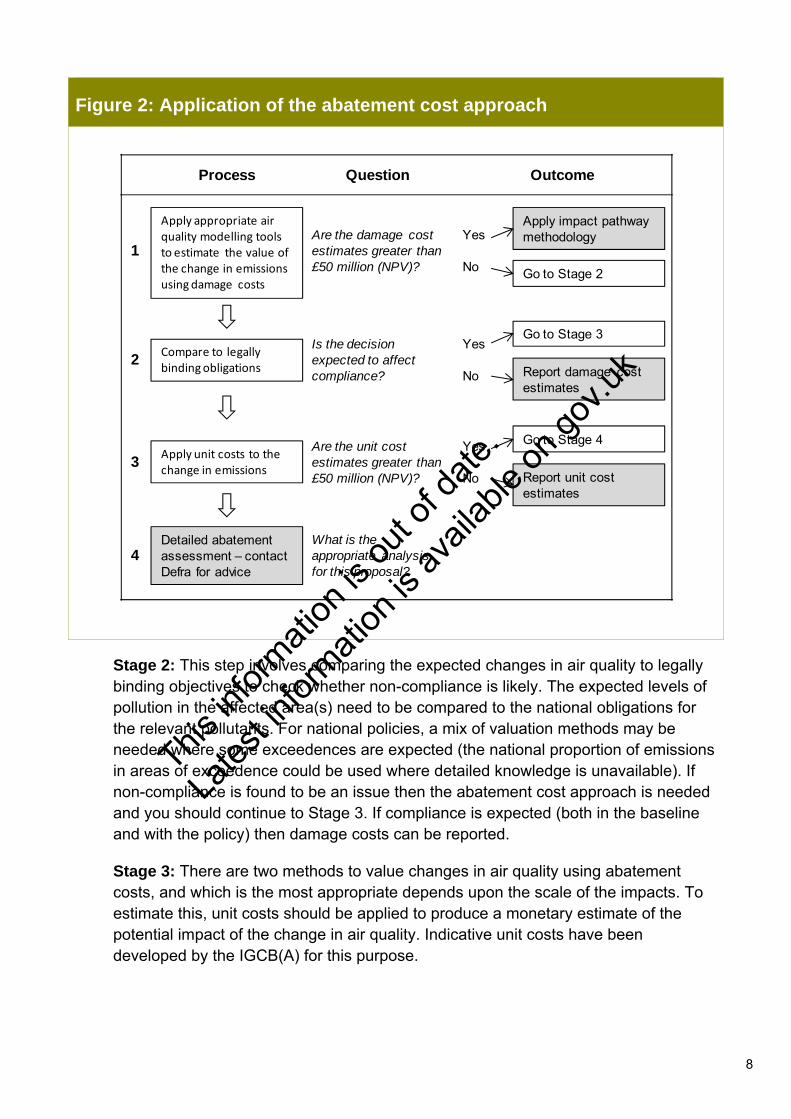
16. Figure 2 sets out the process by which the appropriate scope of an assessment can be undertaken. There are four stages to it, of which the first two are common to all assessments of changes in air quality. The final two stages are specific to the abatement cost approach, determining the most appropriate means to undertake abatement cost analysis.
Stage 1: To begin with, the significance of the air quality impact should be assessed by applying damage costs. This uses the scientific assessment of the change in emissions and values it using the relevant damage cost for the pollutant in question. These are available from the Defra website8. Damage cost estimates will not be the appropriate values to report in all instances but they serve as a filtering mechanism to determine the appropriate valuation approach. If total air quality impacts are valued at more than £50m, a full impact pathway assessment may be needed. Where impacts are valued at less than £50m you can continue to Stage 2.
8 www.gov.uk/air-quality-economic-analysis
This in
formati
on is
out o
f date
.
Lates
t infor
mation
is av
ailab
le on
gov.u
k
8
Figure 2: Application of the abatement cost approach
Process Question Outcome
1Are the damage cost estimates greater than £50 million (NPV)?
Yes
No
2Is the decision expected to affect compliance?
Yes
No
3Are the unit cost estimates greater than £50 million (NPV)?
Yes
No
4What is the appropriate analysis for this proposal?
Apply appropriate air quality modelling tools to estimate the value of the change in emissions using damage costs
Compare to legally binding obligations
Apply unit costs to the change in emissions
Detailed abatement assessment – contact Defra for advice
Apply impact pathway methodology
Go to Stage 2
Report damage cost estimates
Go to Stage 3
Report unit cost estimates
Go to Stage 4
Stage 2: This step involves comparing the expected changes in air quality to legally binding objectives to check whether non-compliance is likely. The expected levels of pollution in the affected area(s) need to be compared to the national obligations for the relevant pollutants. For national policies, a mix of valuation methods may be needed where some exceedences are expected (the national proportion of emissions in areas of exceedence could be used where detailed knowledge is unavailable). If non-compliance is found to be an issue then the abatement cost approach is needed and you should continue to Stage 3. If compliance is expected (both in the baseline and with the policy) then damage costs can be reported.
Stage 3: There are two methods to value changes in air quality using abatement costs, and which is the most appropriate depends upon the scale of the impacts. To estimate this, unit costs should be applied to produce a monetary estimate of the potential impact of the change in air quality. Indicative unit costs have been developed by the IGCB(A) for this purpose.
This in
formati
on is
out o
f date
.
Lates
t infor
mation
is av
ailab
le on
gov.u
k

9
Stage 4: If the decision is shown to have a significant impact on air quality, i.e. creating an air quality impact with a net present value of over £50 million then it may be necessary to undertake a more detailed bespoke analysis. Advice on this can be sought from Defra, ([email protected]). If the unit cost assessment indicates an NPV of less than £50m, you can report the unit cost estimates.
17. Each of these stages is covered in more detail in the following chapters, and section 7 provides a hypothetical worked example of the methodology.
This in
formati
on is
out o
f date
.
Lates
t infor
mation
is av
ailab
le on
gov.u
k

10
3. Stage One: Apply damage costs 18. The first stage of any analysis valuing changes in air quality is to apply damage costs
to the estimated change. This indicates the magnitude of the valued air quality impacts and is used to identify instances where the impact pathway approach is appropriate.
19. If the estimated value is more than £50 million (net present value) then the impact pathway approach is recommended. However it will also depend on other factors such as the importance of air quality to the specific decision. If the damage cost assessment suggests a full impact pathway assessment may be required, contact Defra at [email protected] for support.
20. To apply damage cost estimates the change in emissions (in tonnes) will have to be quantified. The amount of pollution produced from each source can be estimated from the amount of raw material used at the source. The relationship between the raw material and the pollution produced is known as the emission factor. For instance, for road traffic it gives the amount of pollution produced per vehicle mile travelled. Estimates of emission factors for different activities are developed by the National Atmospheric Emissions Inventory (NAEI) and compiled in an Emissions Factor Database at www.naei.org.uk/emissions. An Emissions Factor Toolkit is also available from Defra which allows emissions to be calculated from road links9.
21. Having estimated the change in air quality using these tools, damage cost estimates can then be applied to value the change in monetary terms. Damage costs are available for four key pollutants: particulate matter (PM10), oxides of nitrogen (NOx), sulphur dioxide (SO2), and ammonia (NH3). The change in emissions as a result of the decision is multiplied by the relevant damage cost to get a monetised indication of the scale of the impact. Damage costs and supporting guidance is available from Defra10. You can use the Damage Cost Calculator available on the UK-AIR website11 to generate the estimates by inputting the following information:
• The length (in years) of the policy appraisal • The base year for the appraisal • The pollutant(s) being assessed • The annual change in emissions (in tonnes)
22. If the estimated value of the air quality impact is greater than £50 million a bespoke impact pathway analysis is recommended, and you should contact Defra for support ([email protected]). If it is less than £50m you should proceed to Stage Two.
9 http://laqm.defra.gov.uk/review-and-assessment/tools/emissions.html#EFT 10 See www.gov.uk/air-quality-economic-analysis 11 http://uk-air.defra.gov.uk/library/reports?section_id=19
This in
formati
on is
out o
f date
.
Lates
t infor
mation
is av
ailab
le on
gov.u
k
11
4. Stage Two: Assess impact on compliance
23. The second step is to determine whether the proposal will affect compliance with any legally-binding air quality obligations. The three key pieces of information to do this are:
• To estimate current concentrations in affected areas; • Changes in concentrations as a result of the proposal; and, • Relevant legally-binding obligations.
Establishing current levels of air quality 24. National air quality monitoring data is available from the UK’s Air Information
Resource (UK-AIR) which will provide an initial indication of the current and future air quality. This modelling provides estimates of concentrations for given years by pollutant. This data is available from http://uk-air.defra.gov.uk.
25. This national level data may be supplemented with information from relevant Local Authorities. This may include local monitoring data and details of whether the study area is within a designated Air Quality Management Area (AQMA). Local Authorities declare AQMAs where air quality objectives might not be met, and create an action plan for how they will comply. AQMAs can provide a useful indication of where air quality issues may exist, although do not imply that the area covered is automatically in exceedance. Similarly, there may be exceedences in areas without an AQMA.
26. The size of the change in air quality will depend in part on the scale of the policy. Modelling at a local level is likely to be suitable for local policies, using tools such as the Design Manual for Roads and Bridges (DMRB, see Box 1 below). Regional policies are likely to require more detailed modelling to reflect the interaction of sources and background concentrations. Full national modelling will be needed for large scale proposals, usually using Defra’s Pollution Climate Mapping model (PCM).
Estimating changes as a result of the proposal 27. A number of methods are available to estimate changes in air quality, ranging from
simple tools to complex dispersion models. The choice of scientific assessment should be proportionate to the expected air quality impacts. Technical guidance on how to perform an air quality assessment is published by Defra12. Box 1 details some of the tools available.
12 http://laqm.defra.gov.uk/documents/LAQM-TG-(09)-Dec-12.pdf
This in
formati
on is
out o
f date
.
Lates
t infor
mation
is av
ailab
le on
gov.u
k
12
28. These tools allow a detailed assessment of the impact of the decision upon air quality, either estimating the change in emissions or the change in concentrations.
Box 1: Examples of available concentration assessment tools
• Commercially available dispersion models such as AERMOD or ADMS. Guidance on the use of these is available in Defra’s Local Air Quality Management Technical Guidance 200913.
• Defra’s Emission Factor Toolkit which allows emissions to be calculated from road links14.
• The Design Manual for Roads and Bridges (DMRB) Screening Model can be used to assess changes from road traffic sources. The DMRB Screening Model can predict changes in air quality concentrations of a range of pollutants, including NO2 and PM10
15.
• Industrial Emissions Screening Tools can be used to estimate the characteristics of industrial sources that would cause non-compliance with a range of obligations16.
• The Biomass Calculator estimates the maximum stack emission rate that is not likely to exceed the PM10 cap17.
• A chimney height calculation spreadsheet for sulphur dioxide emissions from small boilers18.
• Guides for biomass19 and CHP20 installation, relevant to proposals installing a small number in a specific development.
Assessing compliance 29. The outputs of the modelling can then be used to assess compliance by comparing
air quality under the baseline and with the proposal to legally-binding obligations. Annex A provides a list of obligations as at the time of publication. As these may change the reader should ensure they use current obligations. Any changes to the obligations will be published on the Defra website.
30. While it is up to the user to ensure that the appropriate approach is applied the IGCB(A) have identified two ‘rules of thumb’. The abatement cost approach is likely to be necessary where either:
13 http://laqm.defra.gov.uk/documents/LAQM-TG-(09)-Dec-12.pdf 14 http://laqm.defra.gov.uk/review-and-assessment/tools/emissions.html#EFT 15 Guidance on using the DMRB can be downloaded from www.laqm.defra.gov.uk/documents/DMRB_text_150409.pdf . 16 Calculators for industrial nomograms are available from http://laqm.defra.gov.uk/review-and-assessment/tools/emissions.html 17 Available from www.laqm.defra.gov.uk/review-and-assessment/tools/emissions.html 18 Available from http://laqm.defra.gov.uk/review-and-assessment/modelling.html 19 Available from http://www.lacors.gov.uk/lacors/NewsArticleDetails.aspx?id=21913 20 Available from http://www.iaqm.co.uk/text/guidance/epuk/chp_guidance.pdf
This in
formati
on is
out o
f date
.
Lates
t infor
mation
is av
ailab
le on
gov.u
k

13
• There is an expected reduction in air pollution in an area currently not in compliance. Once compliance has been delivered either the impact pathway, or damage cost approach should be applied; or
• There is an expected increase in air pollution and the current level is above 95% of a legally-binding obligation. For example for an area with a concentration of 38μg.m–3 or higher annual mean NO2 (for which the limit is 40μg.m–3)21.
31. If either of these conditions is met or an impact on compliance is expected, it is necessary to continue to Stage Three where unit costs are applied to the change in air quality.
21 Where a policy is below the objective it is prudent to undertake a initial assessment of the likelihood the change will result in an exceedence. If it is unlikely to cause an exceedence this should be reported and the impact pathway approach applied to any changes.
This in
formati
on is
out o
f date
.
Lates
t infor
mation
is av
ailab
le on
gov.u
k
14
5. Stage Three: Apply unit costs 32. Local air quality issues can be assessed best at the local level. This allows situation-
specific factors to be taken into account. However a full local assessment can be relatively resource intensive, especially when impacts affect a wide area. Unit costs help indicate the scale of air quality impacts from key pollutants and thus can inform decisions about what level of analysis will be proportionate. These unit costs relate changes in emissions (in tonnes) to monetary values using indicative national abatement technologies.
33. To make the unit cost approach simple to apply required a range of restrictive assumptions. They are therefore only recommended for use in two circumstances:
• Either as part of an initial filtering mechanism to consider a wide range of policy options which may then require a more comprehensive assessment; or
• Where air quality impacts are expected to be relatively small. IGCB(A) recommend that any decision causing an air quality impact with an NPV of over £50 million should be considered for further analysis.
Stage Three of the abatement cost approach applies unit costs following the second of these circumstances, to determine the appropriate level of analysis. It is important to stress that abatement costs are only recommended for valuing emissions that exceed legally binding obligations. If an increase in air pollution is partly within an obligation and partly in excess of it, abatement costs should only be applied to the latter change. Damage costs should be used to value the part of the change that maintains compliance.
34. The unit costs were developed using a marginal abatement cost curve (MACC) to estimate the potential supply of abatement. The MACC reflects the abatement potential and cost for a range of different abatement technologies. Wider impacts on society are incorporated, including: impacts on other pollutants; energy and fuel impacts, and health impacts (damage costs). The abatement represented by the national average compliance gap is compared against the MACC to estimate an indicative unit cost of abatement. It is only indicative because both the gap and the abatement potential from different technologies will vary between areas. Box 2 provides a more detailed explanation of how a MACC works.
35. This unit cost is then provided in terms of the marginal cost of emissions, usually measured in £/tonne. Table 1 below shows the menu of abatement costs which have been derived from the NOx MACC. These are derived from the full package of measures that would mitigate the typical compliance gap, assessed for the year 2015. These measures are those which may represent the marginal technology once all cheaper options have been exhausted, so is an extract from the complete MACC.
This in
formati
on is
out o
f date
.
Lates
t infor
mation
is av
ailab
le on
gov.u
k
15
Box 2: Estimating the unit costs of abatement
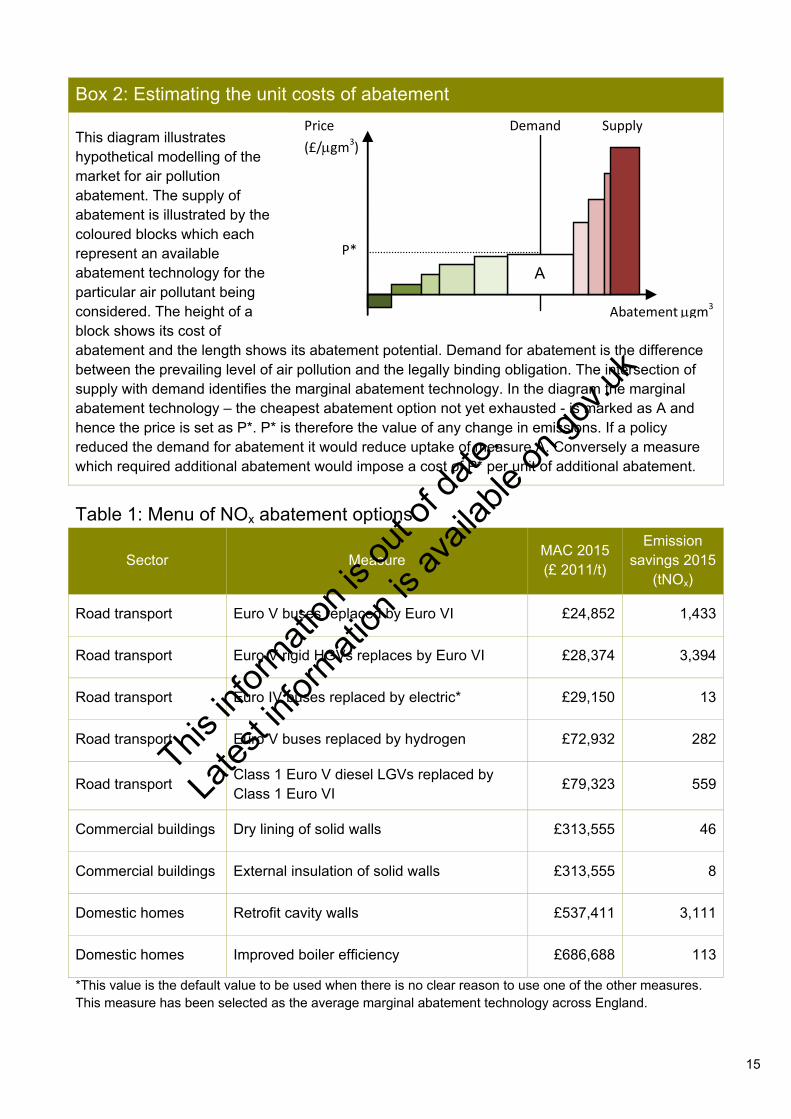
This diagram illustrates hypothetical modelling of the market for air pollution abatement. The supply of abatement is illustrated by the coloured blocks which each represent an available abatement technology for the particular air pollutant being considered. The height of a block shows its cost of abatement and the length shows its abatement potential. Demand for abatement is the difference between the prevailing level of air pollution and the legally binding obligation. The intersection of supply with demand identifies the marginal abatement technology. In the diagram the marginal abatement technology – the cheapest abatement option not yet exhausted - is marked as A and hence the price is set as P*. P* is therefore the value of any change in emissions. If a policy reduced the demand for abatement it would reduce uptake of measure A. Conversely a measure which required additional abatement would impose a cost of P* per unit of additional abatement.
Table 1: Menu of NOx abatement options
Sector Measure MAC 2015 (£ 2011/t)
Emission savings 2015
(tNOx)
Road transport Euro V buses replaced by Euro VI £24,852 1,433
Road transport Euro V rigid HGVs replaces by Euro VI £28,374 3,394
Road transport Euro IV buses replaced by electric* £29,150 13
Road transport Euro V buses replaced by hydrogen £72,932 282
Road transport Class 1 Euro V diesel LGVs replaced by Class 1 Euro VI
£79,323 559
Commercial buildings Dry lining of solid walls £313,555 46
Commercial buildings External insulation of solid walls £313,555 8
Domestic homes Retrofit cavity walls £537,411 3,111
Domestic homes Improved boiler efficiency £686,688 113
*This value is the default value to be used when there is no clear reason to use one of the other measures. This measure has been selected as the average marginal abatement technology across England.
Supply Demand
Abatement μgm3
Price
(£/μgm3)
P*
A
This in
formati
on is
out o
f date
.
Lates
t infor
mation
is av
ailab
le on
gov.u
k
16
36. The most appropriate abatement cost should be selected from the abatement measures in Table 1. It will depend upon a range of factors, including the source and location of the emission. The abatement option should be chosen according to which measure most closely reflects conditions in the particular area. For example, an increase in emissions from road transport is likely to be reduced most effectively using an abatement option aimed at the road transport sector.
37. It is for the appraiser to decide which value is most appropriate for a particular case. In some circumstances additional work has identified particular technologies for specific users – refer to your departmental guidance if available. If uncertain, contact Defra for advice about which option best fits the circumstances. If there is no clear rationale to use a particular measure the default value that is recommended is £29,150.
38. Sensitivity analysis is recommended to reflect the uncertainty in the abatement costs, using both a higher and lower abatement cost technology selected from Table 1. The selection of these technologies is for the judgement of the analyst. If the default value of £29,150 is used then it is suggested that you apply a range of £28,000 - £73,000, derived from the rounded values of the abatement technologies on either side of the default value in Table 1.
39. Marginal abatement costs are considered to remain constant over time in real terms. Given the relatively short timescales over which the abatement cost technique is expected to be used it was considered unnecessary to investigate how the costs might change through time.
40. The result of the unit cost analysis, including the relevant uncertainties, determines whether further abatement cost analysis is needed. If the NPV of the air quality impacts valued using unit costs is greater than £50m you should continue to Stage 4 to do more detailed analysis. Some decisions with lower NPVs may warrant further analysis because of specific circumstances such as a wide range of uncertainties. Defra can provide advice if it is unclear whether further abatement cost analysis is required ([email protected]). Where the NPV is less than £50m and no other factors point towards more detailed analysis, unit cost estimates can be reported.
41. If your unit cost estimate of air quality impacts is close to £50m you should consider adjusting the unit cost values to reflect the specific circumstances of your proposal. This can help determine whether a full abatement cost analysis might be appropriate. Some key considerations include:
• Timing: The time profile of the air quality under consideration should be considered. For most pollutants in most areas air quality continues to improve and so it is likely that any exceedence would be temporary, eg modelling in 2011 suggests that there will be no exceedences, outside London, of the NO2 limit value by 2020. Similarly it is important to consider the time profile of abatement with natural turnover in sources typically reducing the abatement potential.
This in
formati
on is
out o
f date
.
Lates
t infor
mation
is av
ailab
le on
gov.u
k

17
• Abatement potential from the technology: The usage of different sources varies between different locations and therefore so will the potential abatement. Where a specific source is abundant in a given area relative to the average the national MACC may understate the potential.
• Total demand and supply of abatement: If your proposal is expected to lead to a large increase in emissions then it is important to consider the total level of abatement it would need. Table 1 includes the emission savings in 2015 for each abatement technology. Using a unit abatement cost linked to an abatement technology with limited potential abatement will not be appropriate on its own for a proposal causing a major increase in emissions.
• Targeting: In some cases not all abatement will occur in the area of interest, eg for mobile sources that move outside the target area, some of the abatement will also occur outside the target area. Therefore the level of abatement may be lower than it initially appears. If a mobile source spends half its time outside the target area the actual abatement from this source might be half its potential.
• Distribution: Even where abatement activity remains confined within the area of interest, the distribution of abatement may be such that compliance is not guaranteed. Abatement within an area may not be spread evenly across the area and so may not deliver compliance. For instance if the area of non-compliance is larger than the area targeted by a particular measure then abatement from that measure may not be sufficient to bring the entire area into compliance. While targeting recognises that not all abatement will occur within the area of interest, distribution recognises that where abatement occurs within the area should also be considered.
This in
formati
on is
out o
f date
.
Lates
t infor
mation
is av
ailab
le on
gov.u
k
18
6. Stage Four: Undertake detailed abatement assessment
42. If in Stage 3 a decision is assessed as having air quality impacts of over £50m it is recommended that a detailed abatement assessment is undertaken. Advice in this instance should be sought from Defra ([email protected]). This section outlines what such assessments entail.
43. A range of factors affect what will be appropriate for the assessment, including the scale, location and duration of the impact. As such it is not possible to follow a single detailed abatement assessment approach and Defra, and the inter-departmental group IGCB, provide the necessary support. Relevant information to inform this includes:
• Background on the decision being made; • The outline of the proposal and different options being assessed; • The indicative assessment undertaken and the relevant sensitivities; • Timing of the analysis to feed into the decision; and, • Quantitative estimates of the other impacts of the decision.
44. There are three potential broad outcomes to this discussion:
Include unit cost estimates: in marginal cases it may be sufficient to report the indicative estimates even where the £50m NPV threshold has been exceeded.
Use available tools: to estimate the abatement cost for the change being considered.
Bespoke analysis: for major changes only it will be proportionate to develop evidence specific to the situation to provide the quality robust evidence base needed.
45. Where the indicative estimates are considered sufficient these figures should be reported within the evidence base and summary sheets as appropriate. To recognize the scale of the impact it is just necessary to note that this issue was discussed with Defra and the IGCB with a brief summary of why a more detailed assessment was not seen to be proportionate.
46. For other cases advice tailored to the particular situation will be offered. Often existing tools can be used to undertake bespoke analysis. These include marginal abatement cost curves for the oxides of nitrogen (NOX) and for particulate matter (PM); the multi-pollutant measures database (MPMD), and cost curves for national emissions. Marginal abatement cost curves are of key importance to the abatement cost approach; Box 3 below provides an overview of the MACC for NOX.
This in
formati
on is
out o
f date
.
Lates
t infor
mation
is av
ailab
le on
gov.u
k
19
Box 3: The NOx MAC curve
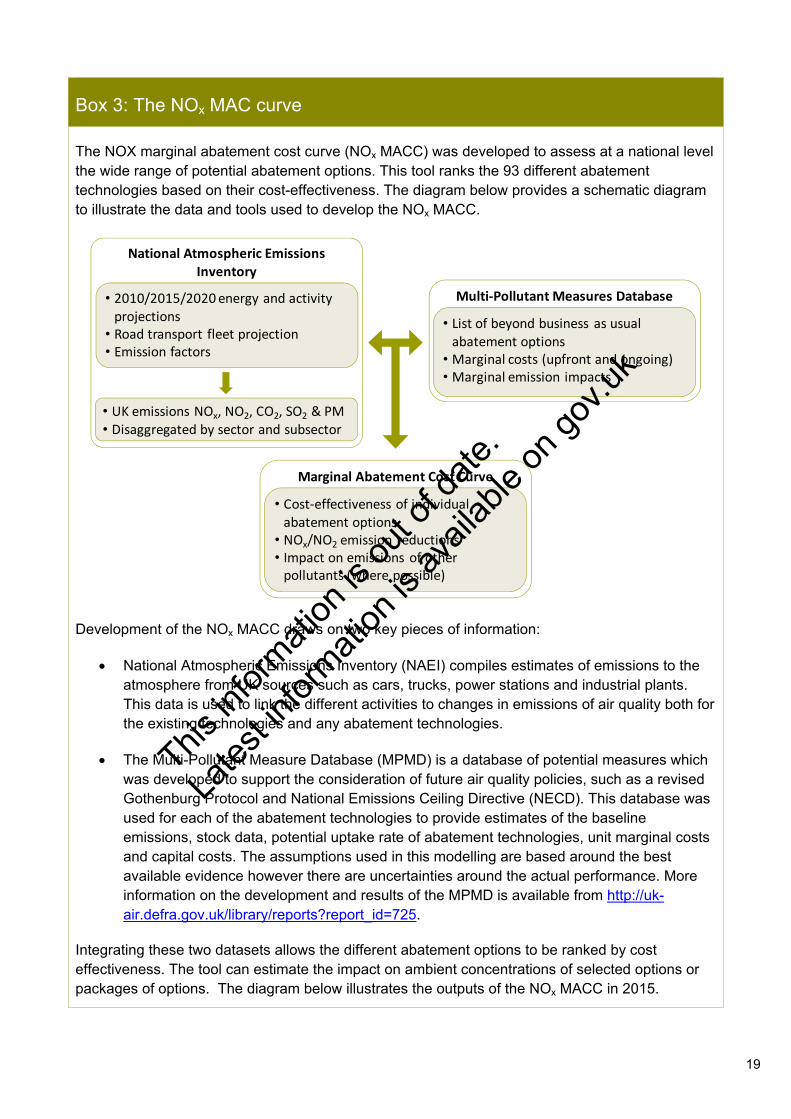
The NOX marginal abatement cost curve (NOx MACC) was developed to assess at a national level the wide range of potential abatement options. This tool ranks the 93 different abatement technologies based on their cost-effectiveness. The diagram below provides a schematic diagram to illustrate the data and tools used to develop the NOx MACC.
National Atmospheric Emissions Inventory
• 2010/2015/2020 energy and activity projections
• Road transport fleet projection• Emission factors
• UK emissions NOx, NO2, CO2, SO2 & PM• Disaggregated by sector and subsector
Multi‐Pollutant Measures Database
• List of beyond business as usual abatement options
• Marginal costs (upfront and ongoing)• Marginal emission impacts
Marginal Abatement Cost Curve
• Cost‐effectiveness of individual abatement options
• NOx/NO2 emission reductions• Impact on emissions of other pollutants (where possible)
Development of the NOx MACC draws on two key pieces of information:
• National Atmospheric Emissions Inventory (NAEI) compiles estimates of emissions to the atmosphere from UK sources such as cars, trucks, power stations and industrial plants. This data is used to link the different activities to changes in emissions of air quality both for the existing technologies and any abatement technologies.
• The Multi-Pollutant Measure Database (MPMD) is a database of potential measures which was developed to support the consideration of future air quality policies, such as a revised Gothenburg Protocol and National Emissions Ceiling Directive (NECD). This database was used for each of the abatement technologies to provide estimates of the baseline emissions, stock data, potential uptake rate of abatement technologies, unit marginal costs and capital costs. The assumptions used in this modelling are based around the best available evidence however there are uncertainties around the actual performance. More information on the development and results of the MPMD is available from http://uk-air.defra.gov.uk/library/reports?report_id=725.
Integrating these two datasets allows the different abatement options to be ranked by cost effectiveness. The tool can estimate the impact on ambient concentrations of selected options or packages of options. The diagram below illustrates the outputs of the NOx MACC in 2015.
This in
formati
on is
out o
f date
.
Lates
t infor
mation
is av
ailab
le on
gov.u
k
20
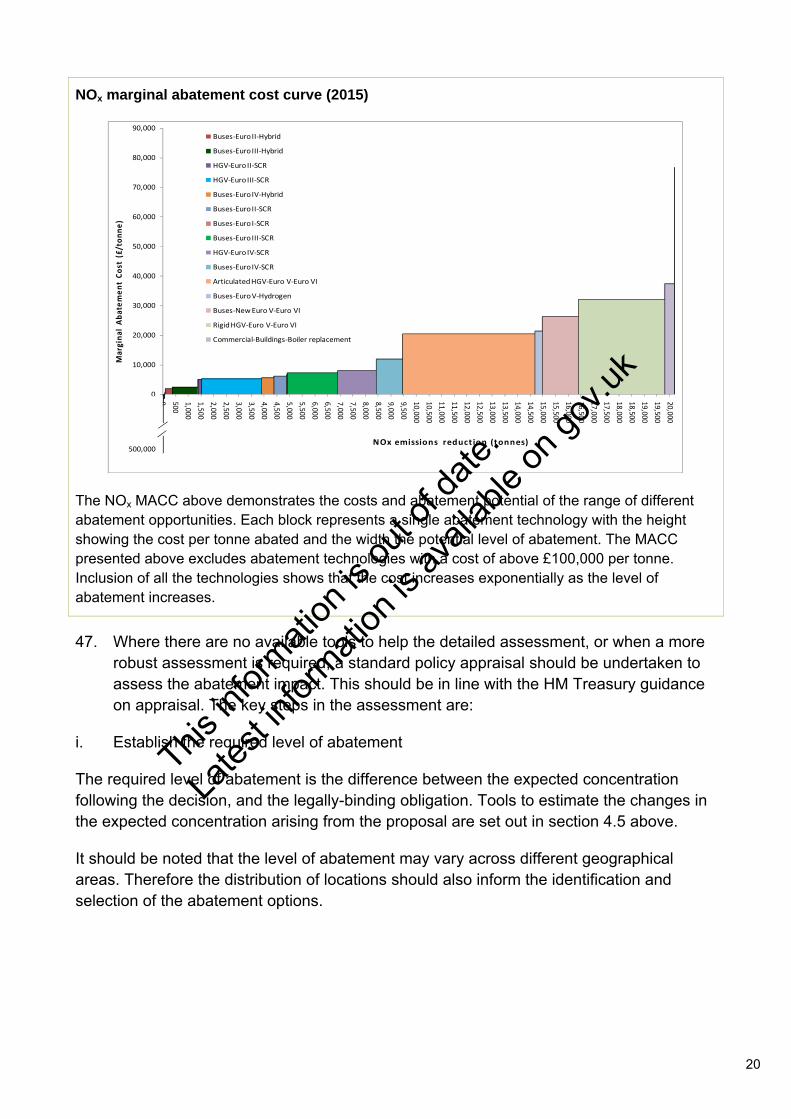
NOx marginal abatement cost curve (2015)
‐20,000
‐10,000
0
10,000
20,000
30,000
40,000
50,000
60,000
70,000
80,000
90,000
0 500
1,000
1,500
2,000
2,500
3,000
3,500
4,000
4,500
5,000
5,500
6,000
6,500
7,000
7,500
8,000
8,500
9,000
9,500
10,000
10,500
11,000
11,500
12,000
12,500
13,000
13,500
14,000
14,500
15,000
15,500
16,000
16,500
17,000
17,500
18,000
18,500
19,000
19,500
20,000Margina
l Aba
temen
t Co
st (£/tonn
e)
NOx emissions reduction (tonnes)
Buses‐Euro II‐Hybrid
Buses‐Euro III‐Hybrid
HGV‐Euro II‐SCR
HGV‐Euro III‐SCR
Buses‐Euro IV‐Hybrid
Buses‐Euro II‐SCR
Buses‐Euro I‐SCR
Buses‐Euro III‐SCR
HGV‐Euro IV‐SCR
Buses‐Euro IV‐SCR
Articulated HGV‐Euro V‐Euro VI
Buses‐Euro V‐Hydrogen
Buses‐New Euro V‐Euro VI
Rigid HGV‐Euro V‐Euro VI
Commercial‐Buildings‐Boiler replacement
500,000
The NOx MACC above demonstrates the costs and abatement potential of the range of different abatement opportunities. Each block represents a single abatement technology with the height showing the cost per tonne abated and the width the potential level of abatement. The MACC presented above excludes abatement technologies with a cost of above £100,000 per tonne. Inclusion of all the technologies shows that the cost increases exponentially as the level of abatement increases.
47. Where there are no available tools to help the detailed assessment, or when a more robust assessment is required, a standard policy appraisal should be undertaken to assess the abatement impact. This should be in line with the HM Treasury guidance on appraisal. The key steps in the assessment are:
i. Establish the required level of abatement
The required level of abatement is the difference between the expected concentration following the decision, and the legally-binding obligation. Tools to estimate the changes in the expected concentration arising from the proposal are set out in section 4.5 above.
It should be noted that the level of abatement may vary across different geographical areas. Therefore the distribution of locations should also inform the identification and selection of the abatement options.
This in
formati
on is
out o
f date
.
Lates
t infor
mation
is av
ailab
le on
gov.u
k
21
ii. Identify abatement options
Options for reducing the concentrations of pollutants should be identified. Both technological and behavioural options can be considered – those that reduce the level of emissions through the use of tools and techniques, and those that involve changing human actions. The scope, availability and feasibility of abatement options will depend on the location under consideration.
iii. Select the abatement method(s) to be used
Once a range of abatement options have been identified, each needs to be appraised for its costs and benefits to society. The wider social and environmental costs and benefits of the different options must be considered as well as the financial costs. Other concerns such as public acceptability and the degree of certainty over the method’s effectiveness and cost may also influence the choice of options where appropriate.
The solution may involve the use of more than one option. For example, it may be cheapest overall to use one method for the first 10 μgm3 of abatement, after which the abatement potential of this method is reduced or further use becomes very expensive, and it becomes sensible to switch to a different method to achieve the remaining abatement required.
48. The results of this more detailed analysis can then be included alongside the other quantitative and qualitative evidence to inform the decision.
This in
formati
on is
out o
f date
.
Lates
t infor
mation
is av
ailab
le on
gov.u
k
22
7. Hypothetical example of the application of unit costs
49. This section works through a hypothetical example where abatement costs need to be applied. The proposal being considered is whether to open a new incineration plant for municipal solid waste (MSW).
50. The plant would have capacity to burn up to 500 tonnes of MSW per day. However, the location of the site is within an area that is predicted to be at the ambient NO2 limit value. If this plant is allowed to be constructed it is likely that additional abatement would be needed to counter the increased emissions of NOx.
51. Because it is known that compliance is an issue, you can start at Stage 2 of the process and establish the likely impact on compliance with the ambient NO2 limit value. An air quality map is consulted for the relevant local authority, pollutant and year at http://laqm.defra.gov.uk/maps/maps2008.html. These maps list the levels of NOx, NO2, PM10 and PM2.5, for 1km2 areas across the country, listing the centre point of each of the grid squares. Nationwide background maps can be viewed at http://laqm.defra.gov.uk/documents/Backgroundmaps20090202.pdf
52. The likely change in NOx emissions if the incinerator were to be set up must be calculated. This is estimated using the National Atmospheric Emission Inventory (NAEI) emission factor database (http://naei.defra.gov.uk/emissions/index.php). This suggests an emission rate of 0.76 kilotonnes of NOx per megatonne combusted. The capacity of the proposed plant is 0.18 megatonnes, therefore the potential emissions are 139 tonnes of NOx.
53. The estimated costs to abate these emissions are then valued using the unit cost for NOx. Unit abatement costs for NOx as NO2 are available from the Defra website and in Table 1. Currently the default national average marginal technology is estimated as electrification of buses with an abatement cost of £29,150 per tonne within the range £28,374 to £72,932 per year. Therefore the annual cost of abating these emissions is estimated at £4.1 million with a range of £3.9 to £10.1 million. If the increase in emissions would be more directly abated from one of the other options on the menu then this should replace the default value of £29,150. The technologies either side of the chosen abatement options should then be used for sensitivity analysis.
54. It is then necessary to tailor the assessment to the specific circumstances, where possible. In this case it might be assumed that the abatement technology would only last two years and that targeting of buses can be 50 per cent effective (i.e. they spend half their operating time outside the area of exceedence). Based on these assumptions the abatement cost is estimated at £8.1 million per year for two years providing a present value of £15.4 million for the year before opening.
This in
formati
on is
out o
f date
.
Lates
t infor
mation
is av
ailab
le on
gov.u
k
23
55. Finally the decision is made if it is worthwhile to consider a more detailed analysis. In this case given the scale of the impact this is unlikely, given that it is well below the indicative £50 million threshold. However, it is noted that using the high abatement cost and extending the duration for an additional year would create a NPV of £57 million which would require consideration of a more detailed analysis.
This in
formati
on is
out o
f date
.
Lates
t infor
mation
is av
ailab
le on
gov.u
k
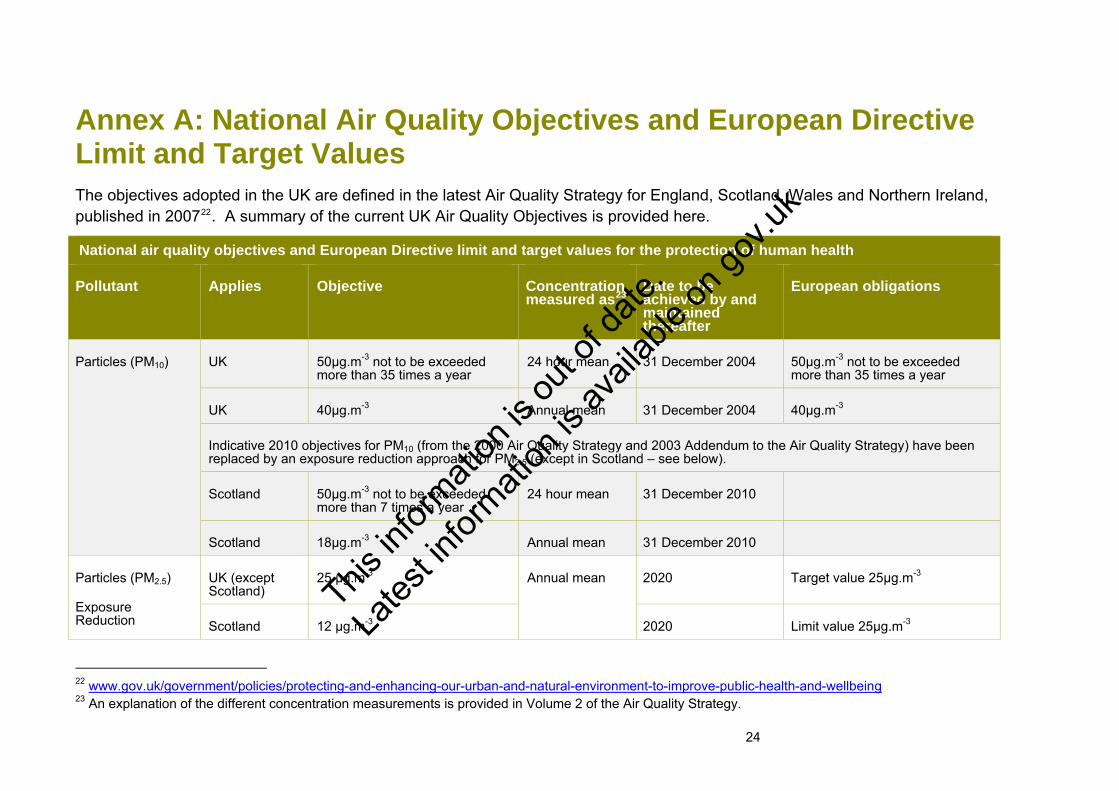
Annex A: National Air Quality Objectives and European Directive Limit and Target Values The objectives adopted in the UK are defined in the latest Air Quality Strategy for England, Scotland, Wales and Northern Ireland, published in 200722. A summary of the current UK Air Quality Objectives is provided here.
National air quality objectives and European Directive limit and target values for the protection of human health
Pollutant Applies Objective Concentration measured as23
Date to be achieved by and maintained thereafter
European obligations
Particles (PM10) UK 50µg.m-3 not to be exceeded more than 35 times a year
24 hour mean 31 December 2004 50µg.m-3 not to be exceeded more than 35 times a year
UK 40µg.m-3 Annual mean 31 December 2004 40µg.m-3
Indicative 2010 objectives for PM10 (from the 2000 Air Quality Strategy and 2003 Addendum to the Air Quality Strategy) have been replaced by an exposure reduction approach for PM2.5 (except in Scotland – see below).
Scotland 50µg.m-3 not to be exceeded more than 7 times a year
24 hour mean 31 December 2010
Scotland 18µg.m-3 Annual mean 31 December 2010
Particles (PM2.5)
Exposure Reduction
UK (except Scotland)
25 μg.m-3 Annual mean 2020 Target value 25μg.m-3
Scotland 12 μg.m-3 2020 Limit value 25μg.m-3
22 www.gov.uk/government/policies/protecting-and-enhancing-our-urban-and-natural-environment-to-improve-public-health-and-wellbeing 23 An explanation of the different concentration measurements is provided in Volume 2 of the Air Quality Strategy.
24
This in
formati
on is
out o
f date
.
Lates
t infor
mation
is av
ailab
le on
gov.u
k
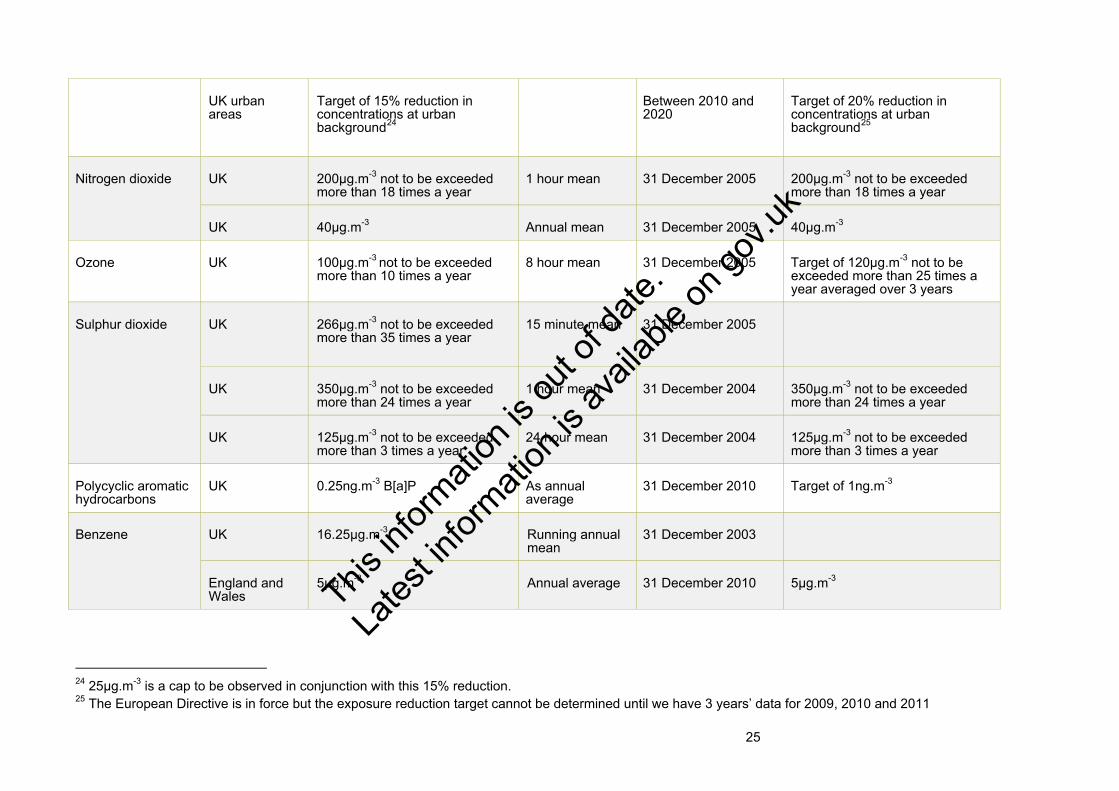
UK urban areas
Target of 15% reduction in concentrations at urban background24
Between 2010 and 2020
Target of 20% reduction in concentrations at urban background25
Nitrogen dioxide UK 200µg.m-3 not to be exceeded more than 18 times a year
1 hour mean 31 December 2005 200µg.m-3 not to be exceeded more than 18 times a year
UK 40µg.m-3 Annual mean 31 December 2005 40µg.m-3
Ozone UK 100µg.m-3 not to be exceeded more than 10 times a year
8 hour mean 31 December 2005 Target of 120µg.m-3 not to be exceeded more than 25 times a year averaged over 3 years
Sulphur dioxide UK 266µg.m-3 not to be exceeded more than 35 times a year
15 minute mean
31 December 2005
UK 350µg.m-3 not to be exceeded more than 24 times a year
1 hour mean 31 December 2004 350µg.m-3 not to be exceeded more than 24 times a year
UK 125µg.m-3 not to be exceeded more than 3 times a year
24 hour mean 31 December 2004 125µg.m-3 not to be exceeded more than 3 times a year
Polycyclic aromatic hydrocarbons
UK 0.25ng.m-3 B[a]P As annual average
31 December 2010 Target of 1ng.m-3
Benzene UK 16.25µg.m-3 Running annual mean
31 December 2003
England and Wales
5µg.m-3 Annual average 31 December 2010 5µg.m-3
24 25μg.m-3 is a cap to be observed in conjunction with this 15% reduction. 25 The European Directive is in force but the exposure reduction target cannot be determined until we have 3 years’ data for 2009, 2010 and 2011
25
This in
formati
on is
out o
f date
.
Lates
t infor
mation
is av
ailab
le on
gov.u
k
26
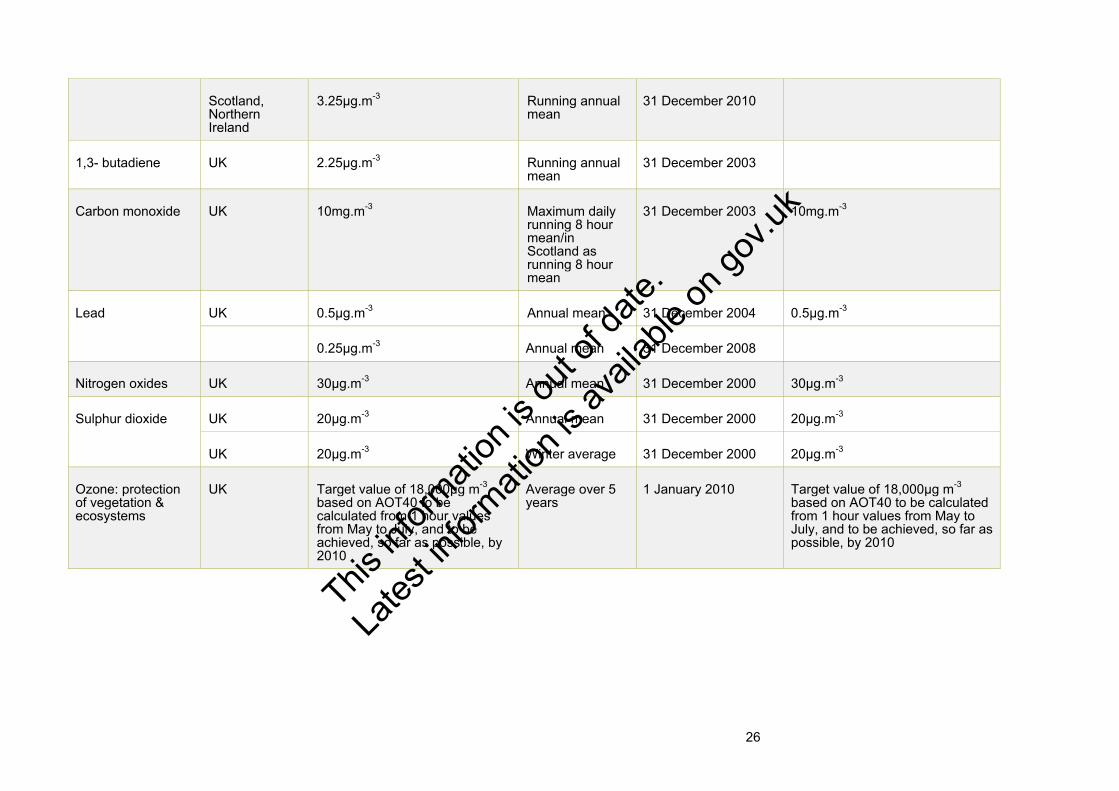
Scotland, Northern Ireland
3.25µg.m-3 Running annual mean
31 December 2010
1,3- butadiene UK 2.25µg.m-3 Running annual mean
31 December 2003
Carbon monoxide UK 10mg.m-3 Maximum daily running 8 hour mean/in Scotland as running 8 hour mean
31 December 2003 10mg.m-3
Lead UK 0.5µg.m-3 Annual mean 31 December 2004 0.5µg.m-3
0.25µg.m-3 Annual mean 31 December 2008
Nitrogen oxides UK 30µg.m-3 Annual mean 31 December 2000 30µg.m-3
Sulphur dioxide UK 20µg.m-3 Annual mean 31 December 2000 20µg.m-3
UK 20µg.m-3 Winter average 31 December 2000 20µg.m-3
Ozone: protection of vegetation & ecosystems
UK Target value of 18,000µg m-3 based on AOT40 to be calculated from 1 hour values from May to July, and to be achieved, so far as possible, by 2010
Average over 5 years
1 January 2010 Target value of 18,000µg m-3 based on AOT40 to be calculated from 1 hour values from May to July, and to be achieved, so far as possible, by 2010
This in
formati
on is
out o
f date
.
Lates
t infor
mation
is av
ailab
le on
gov.u
k

27
Annex B: Glossary AQMA Air Quality Management Area. These are designated by Local Authorities to
cover areas where air quality objectives might not be met. Action plans are produced to detail how they will comply,
Concentration The level of pollutants in the atmosphere; usually expressed in µgm-3. Legally binding obligations are primarily expressed as concentrations because human health impacts are linked most directly to pollutant concentrations (rather than emissions).
DMRB Design Manual for Roads and Bridges. A tool that assesses changes from road traffic emissions sources, covering various pollutants including NO2 and PM10.
Emissions The release of pollutants into the atmosphere; usually expressed in tonnes. An increase in emissions from a given source will increase local concentrations. The relationship between the two is complex and atmospheric modelling is used to estimate the impact of emissions on concentrations.
IGCB Inter-departmental Group on Costs and Benefits
Impact-pathway approach
Assesses the impacts of air pollutants by traces a logical progression from emission, through dispersion and exposure to quantify the impacts on the location/population that it affects.
Limit value Legally binding limit on ambient air quality concentrations
NAEI National Atmospheric Emissions Inventory
NH3 Ammonia
NO2 Nitrogen dioxide
NOX Oxides of nitrogen
PCM Pollution Climate Mapping Model
PM10 Particulate Matter of 10 micrometers or less in aerodynamic diameter
PM2.5 Particulate Matter of 2.5 micrometers or less in aerodynamic diameter
SO2 Sulphur dioxide
Target Value Target values are defined objectives which are not legally binding.
This in
formati
on is
out o
f date
.
Lates
t infor
mation
is av
ailab
le on
gov.u
k