Embed Size (px)
DESCRIPTION
The basic theory to measure and analyze electromyography signals
Citation preview

isIiiiilkjfkdjflkj dfdfe
The ABC of EMG
A Practical Introduction to Kinesiological Electromyography
Peter Konrad
Version 1.4 March 2006
Noraxon INC. USA.Powered by:
NORAXON
U.S.A., INC
.
ISBN 0-9771622-1-4

ABC of EMG – A Practical Introduction to Kinesiological Electromyography Page 2
ISBN 0-9771622-1-4 Copyright © 2005 by Noraxon U.S.A., Inc. Reproduction without written permission is granted to educational institutions for educational purposes only. Noraxon is a registered trademark of Noraxon U.S.A., Inc. All rights reserved. All other company and product names contained herein may be trademarks or registered trademarks of their respective companies and are sole property of their respected owners. Printed by Noraxon U.S.A, Inc. Noraxon U.S.A. Inc. 13430 N. Scottsdale Road, Suite 104 Scottsdale, Arizona 85254 Tel: (480) 443-3413 Fax: (480) 443-4327 E-mail: [email protected] Support E-mail: [email protected] Web Site: www.noraxon.com
ABC of EMG – A Practical Introduction to Kinesiological Electromyography Page 3
Contents: SIGNAL ORIGIN AND ACQUISITION
Introduction & Definition………………………………………………………………………………….. 5
Use and Benefits of EMG…………………………………………………………………………………. 6
Signal Origin………………………………………………………………………………………………… 7
The Generation of the EMG Signal……………………………………………………………………… 8
Signal Propagation and Detection………………………………………………………………………. 9
Composition of EMG Signal……………………………………………………………………………… 10
Nature of the EMG Signal…………………………………………………………………………………. 11
The Influence of detection condition…………………………………………………………………… 12
EMG Amplification…………………………………………………………………………………………. 13
Computation of the EMG signal…………………………………………………………………………. 14
Skin Preparation……………………………………………………………………………………………. 15
Surface Electrode Selection……………………………………………………………………………… 16
Fine Wire electrodes……………………………………………………………………………………….. 17
Guidelines Electrode Application……………………………………………………………………….. 18
Specific Aspects of Electrode Application…………………………………………………………….. 19
Muscle Map Frontal………………………………………………………………………………………… 20
Muscle Map Dorsal…………………………………………………………………………………………. 21
Signal Check Procedures…………………………………………………………………………………. 22
EMG Artifacts……………………………………………………………………………………………….. 25
Prepare EMG - Action list…………………………………………………………………………………. 26
SIGNAL PROCESSING
Signal Processing – Rectification……………………………………………………………………….. 27
Signal Processing – Smoothing…………………………………………………………………………. 28
Signal Processing - Digital Filtering……………………………………………………………………. 29
Signal Processing – Amplitude Normalization……………………………………………………….. 30
Signal Processing – ECG Reduction…………………………………………………………………… 36
Time Normalization for Repetition Cycles…………………………………………………………….. 37
Average EMG / Ensemble Averages……………………………………………………………………. 38
EMG Amplitude Parameters……………………………………………………………………………… 40
EMG Frequency Parameters……………………………………………………………………………… 41
Timing Related Parameters………………………………………………………………………………. 42
Thresholds Concepts to Define Subperiods………………………………………………………….. 43
EMG To Force Ratio……………………………………………………………………………………….. 44
ABC of EMG – A Practical Introduction to Kinesiological Electromyography Page 4
EMG ANALYSIS
EMG as a Biomechanical Method……………………………………………………………………….. 45
EMG Analysis Questions – Overview…………………………………………………………………... 46
EMG Analysis: On/Off?.................................................................................................................... 47
EMG Analysis: More / less?............................................................................................................. 48
EMG Analysis: Muscle Timing?...................................................................................................... 49
EMG Analysis: How Much Activity?............................................................................................... 50
EMG Analysis: How Much Fatigue?............................................................................................... 51
EMG Analysis: Movement Coordination……………………………………………………………….. 52
Design of EMG Tests: Need of Standardization………………………………………………………. 53
Recommendations for Test Standardization………………………………………………………….. 54
EMG Triggered to Movement…………………………………………………………………………….. 55
Period Definition For Analysis…………………………………………………………………………… 56
Comparison Analysis……………………………………………………………………………………… 57
Recommended EMG books………………………………………………………………………………. 58
EMG Guidelines, Societies, Search Links……………………………………………………………... 59
The World of Electromyography………………………………………………………………………… 61
ABC of EMG – A Practical Introduction to Kinesiological Electromyography Page 5
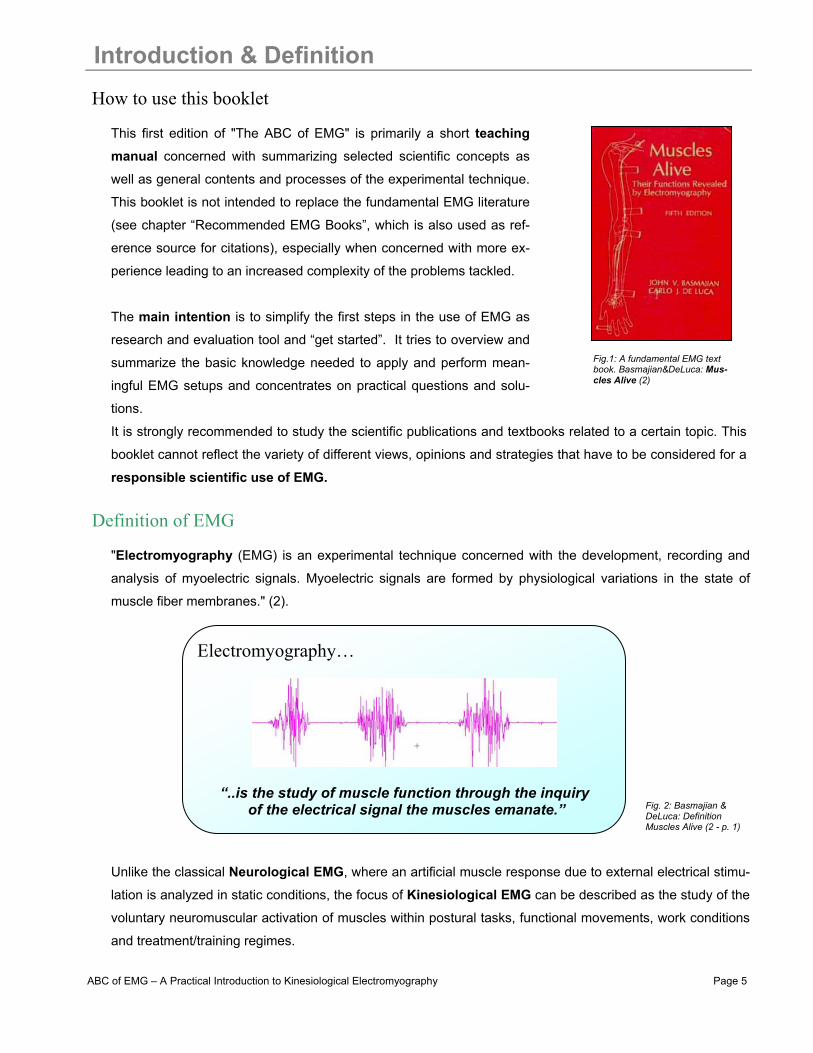
Introduction & Definition How to use this booklet
This first edition of "The ABC of EMG" is primarily a short teaching manual concerned with summarizing selected scientific concepts as
well as general contents and processes of the experimental technique.
This booklet is not intended to replace the fundamental EMG literature
(see chapter “Recommended EMG Books”, which is also used as ref-
erence source for citations), especially when concerned with more ex-
perience leading to an increased complexity of the problems tackled.
The main intention is to simplify the first steps in the use of EMG as
research and evaluation tool and “get started”. It tries to overview and
summarize the basic knowledge needed to apply and perform mean-
ingful EMG setups and concentrates on practical questions and solu-
tions.
It is strongly recommended to study the scientific publications and textbooks related to a certain topic. This
booklet cannot reflect the variety of different views, opinions and strategies that have to be considered for a
responsible scientific use of EMG.
Definition of EMG
"Electromyography (EMG) is an experimental technique concerned with the development, recording and
analysis of myoelectric signals. Myoelectric signals are formed by physiological variations in the state of
muscle fiber membranes." (2).
Unlike the classical Neurological EMG, where an artificial muscle response due to external electrical stimu-
lation is analyzed in static conditions, the focus of Kinesiological EMG can be described as the study of the
voluntary neuromuscular activation of muscles within postural tasks, functional movements, work conditions
and treatment/training regimes.
Electromyography…
“..is the study of muscle function through the inquiry of the electrical signal the muscles emanate.”
Fig.1: A fundamental EMG text book. Basmajian&DeLuca: Mus-cles Alive (2)
Fig. 2: Basmajian & DeLuca: Definition Muscles Alive (2 - p. 1)

ABC of EMG – A Practical Introduction to Kinesiological Electromyography Page 6
Use and Benefits of EMG Widespread use of EMG
Besides basic physiological and biomechanical studies, kinesiological EMG is established as an evaluation tool for applied research, physiotherapy/rehabilitation, sports training and interactions of the human body to
industrial products and work conditions:
Typical benefits of EMG
The use of EMG starts with the basic question: “What are the muscles doing?” Typical benefits are:
• EMG allows to directly “look” into the muscle
• It allows measurement of muscular performance
• Helps in decision making both before/after surgery
• Documents treatment and training regimes
• Helps patients to “find” and train their muscles
• Allows analysis to improve sports activities
• Detects muscle response in ergonomic studies
Medical Research
• Orthopedic • Surgery • Functional Neurology • Gait & Posture Analysis
Rehabilitation
• Post surgery/accident • Neurological Rehabilitation • Physical Therapy • Active Training Therapy
Ergonomics
• Analysis of demand • Risk Prevention • Ergonomics Design • Product Certification
Sports Science
• Biomechanics • Movement Analysis • Athletes Strength Training • Sports Rehabilitation
Fig. 4: Direct look into the body / muscle function: EMG syn-chronized with video and other movement sensors. Software screenshot of MyoResearch XPTM - NORAXON INC. USA
Fig.3: Application areas of kinesiological EMG
ABC of EMG – A Practical Introduction to Kinesiological Electromyography Page 7
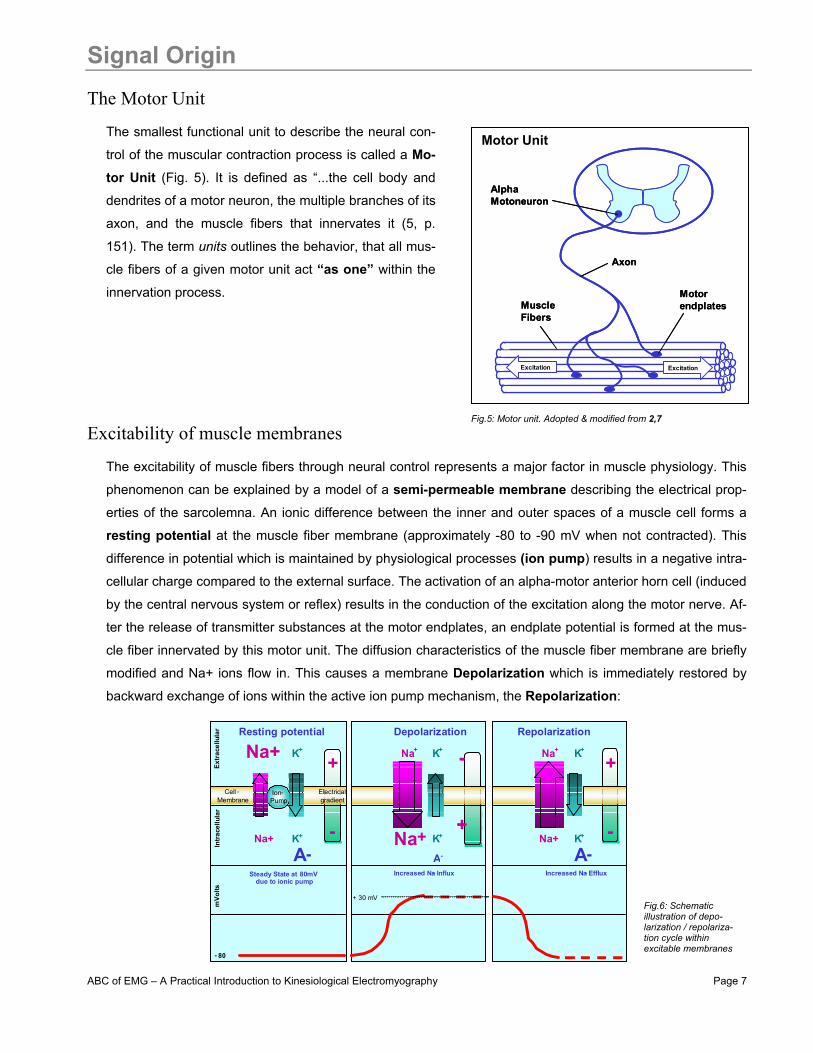
Signal Origin The Motor Unit
The smallest functional unit to describe the neural con-
trol of the muscular contraction process is called a Mo-tor Unit (Fig. 5). It is defined as “...the cell body and
dendrites of a motor neuron, the multiple branches of its
axon, and the muscle fibers that innervates it (5, p.
151). The term units outlines the behavior, that all mus-
cle fibers of a given motor unit act “as one” within the
innervation process.
Excitability of muscle membranes The excitability of muscle fibers through neural control represents a major factor in muscle physiology. This
phenomenon can be explained by a model of a semi-permeable membrane describing the electrical prop-
erties of the sarcolemna. An ionic difference between the inner and outer spaces of a muscle cell forms a
resting potential at the muscle fiber membrane (approximately -80 to -90 mV when not contracted). This
difference in potential which is maintained by physiological processes (ion pump) results in a negative intra-
cellular charge compared to the external surface. The activation of an alpha-motor anterior horn cell (induced
by the central nervous system or reflex) results in the conduction of the excitation along the motor nerve. Af-
ter the release of transmitter substances at the motor endplates, an endplate potential is formed at the mus-
cle fiber innervated by this motor unit. The diffusion characteristics of the muscle fiber membrane are briefly
modified and Na+ ions flow in. This causes a membrane Depolarization which is immediately restored by
backward exchange of ions within the active ion pump mechanism, the Repolarization:
Motor Unit
AlphaMotoneuron
Axon
MuscleFibers
Motorendplates
Excitation Excitation
AlphaMotoneuron
Axon
MuscleFibers
Motorendplates
Excitation Excitation
Fig.5: Motor unit. Adopted & modified from 2,7
Fig.6: Schematic illustration of depo-larization / repolariza-tion cycle within excitable membranes
+
- +
-+
-
Extracellular
Intracellular
Na+
Na+
K +
K +
- 80
mVolts
Na+
Na+
K+
K+
+ 30 mV
Cell - Membrane
Resting potential Depolarisation
Na+ K +
K +
Repolarisation
Na+
Steady State at - 80mV due to ionic pump Increased Na - Influx Increased Na - Exflux
Ion - Pump Electrical
gradient
A - A- A -
+
-
+
- +
-
+
-+
-
+
-
Extr
acel
lula
r In
trac
ellu
lar
Na+
Na+
K +
K +
- 80
mVo
lts
Na+
Na+
K+
K+
+ 30 mV
Cell - Membrane
Resting potential Depolarization
Na+ K +
K +
Repolarization
Na+
Steady State at 80mV due to ionic pump Increased Na - Influx Increased Na - Efflux
Ion - Pump Electrical
gradient
A - A- A -
ABC of EMG – A Practical Introduction to Kinesiological Electromyography Page 8
The Generation of the EMG Signal
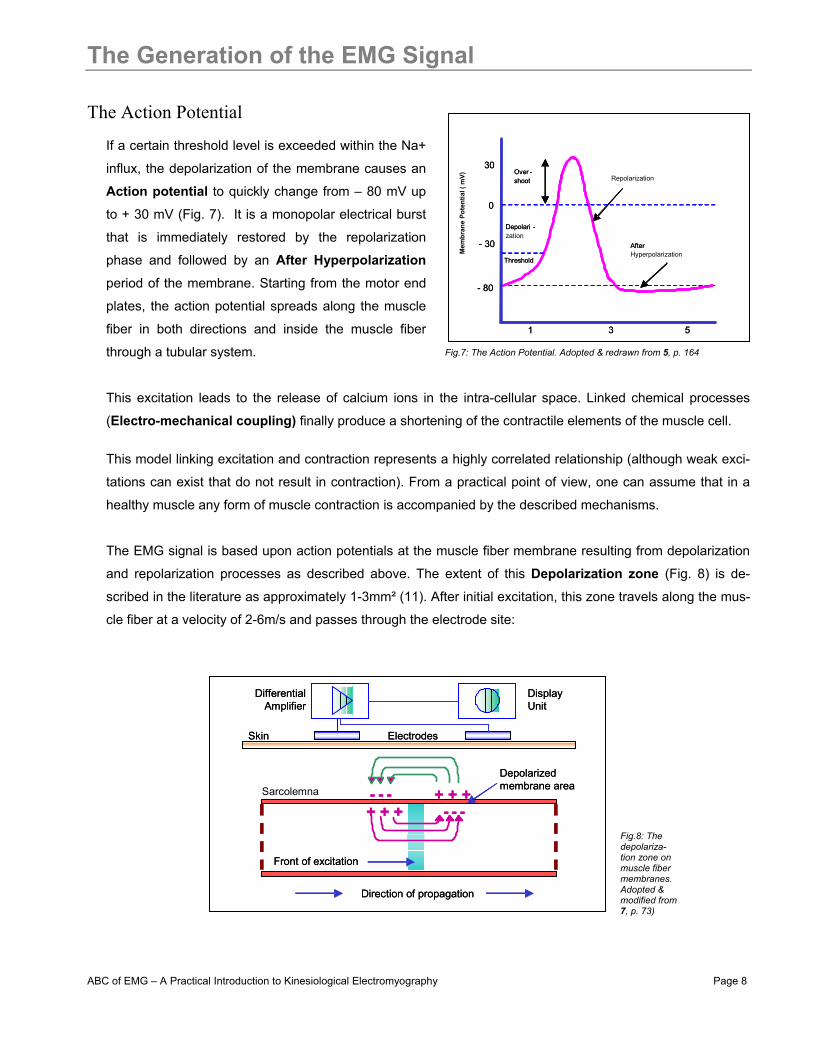
The Action Potential If a certain threshold level is exceeded within the Na+
influx, the depolarization of the membrane causes an
Action potential to quickly change from – 80 mV up
to + 30 mV (Fig. 7). It is a monopolar electrical burst
that is immediately restored by the repolarization
phase and followed by an After Hyperpolarization
period of the membrane. Starting from the motor end
plates, the action potential spreads along the muscle
fiber in both directions and inside the muscle fiber
through a tubular system.
This excitation leads to the release of calcium ions in the intra-cellular space. Linked chemical processes
(Electro-mechanical coupling) finally produce a shortening of the contractile elements of the muscle cell.
This model linking excitation and contraction represents a highly correlated relationship (although weak exci-
tations can exist that do not result in contraction). From a practical point of view, one can assume that in a
healthy muscle any form of muscle contraction is accompanied by the described mechanisms.
The EMG signal is based upon action potentials at the muscle fiber membrane resulting from depolarization
and repolarization processes as described above. The extent of this Depolarization zone (Fig. 8) is de-
scribed in the literature as approximately 1-3mm² (11). After initial excitation, this zone travels along the mus-
cle fiber at a velocity of 2-6m/s and passes through the electrode site:
+ + + - - -+ + +- - -
Differential Amplifier
DisplayUnit
Skin Electrodes
Sarcolemna Depolarized membrane area
Front of excitation
Direction of propagation
+ + + - - -+ + +- - -
Differential Amplifier
DisplayUnit
Skin Electrodes
Depolarized membrane area
Front of excitation
Direction of propagation
- 80
0
Depolari -zation
- 30
Repolarization
After Hyperpolarization
Threshold
30Over -shoot
1 3 5
- 80
0
Depolari -
- 30
After Threshold
30Over -shoot
Mem
bran
e Po
tent
ial (
mV)
1 3 5
Fig.7: The Action Potential. Adopted & redrawn from 5, p. 164
Fig.8: The depolariza-tion zone on muscle fiber membranes. Adopted & modified from 7, p. 73)
ABC of EMG – A Practical Introduction to Kinesiological Electromyography Page 9
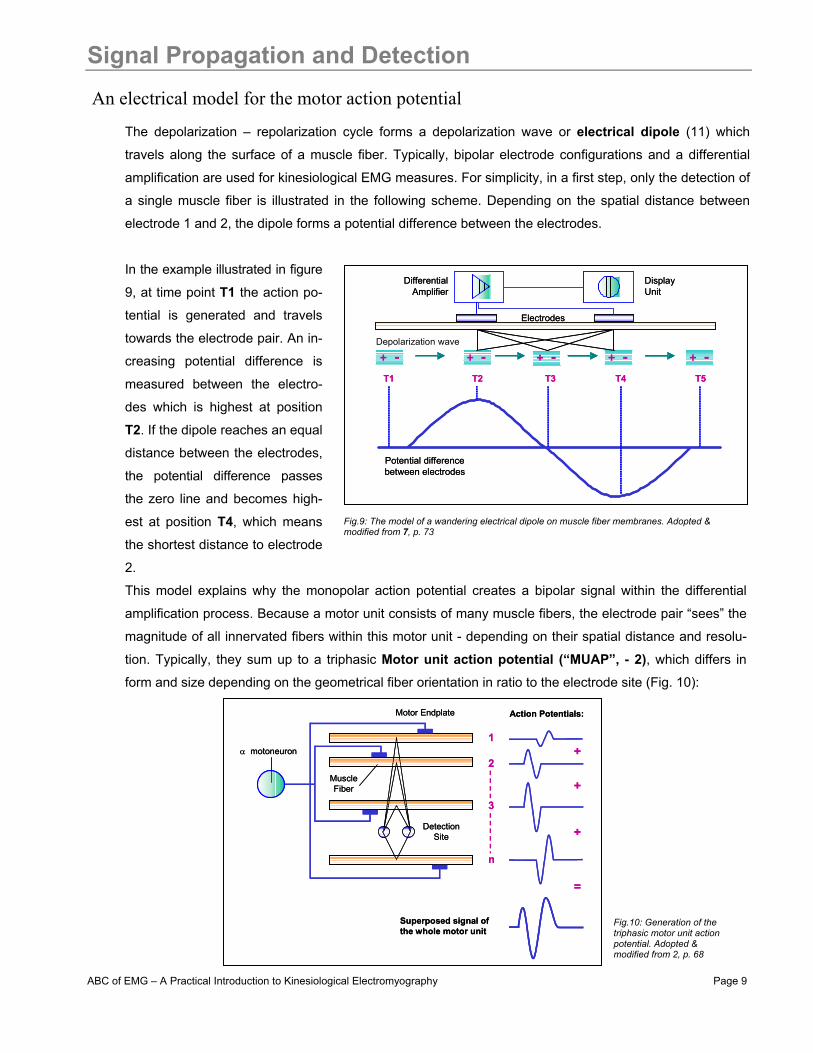
Signal Propagation and Detection An electrical model for the motor action potential
The depolarization – repolarization cycle forms a depolarization wave or electrical dipole (11) which
travels along the surface of a muscle fiber. Typically, bipolar electrode configurations and a differential
amplification are used for kinesiological EMG measures. For simplicity, in a first step, only the detection of
a single muscle fiber is illustrated in the following scheme. Depending on the spatial distance between
electrode 1 and 2, the dipole forms a potential difference between the electrodes.
In the example illustrated in figure
9, at time point T1 the action po-
tential is generated and travels
towards the electrode pair. An in-
creasing potential difference is
measured between the electro-
des which is highest at position
T2. If the dipole reaches an equal
distance between the electrodes,
the potential difference passes
the zero line and becomes high-
est at position T4, which means
the shortest distance to electrode
2.
This model explains why the monopolar action potential creates a bipolar signal within the differential
amplification process. Because a motor unit consists of many muscle fibers, the electrode pair “sees” the
magnitude of all innervated fibers within this motor unit - depending on their spatial distance and resolu-
tion. Typically, they sum up to a triphasic Motor unit action potential (“MUAP”, - 2), which differs in
form and size depending on the geometrical fiber orientation in ratio to the electrode site (Fig. 10):
DifferentialAmplifier
DisplayUnit
Depolarization wave
Electrodes
T1 T2 T3 T4 T5
+ - + - + - + - + -
Potential difference between electrodes
DifferentialAmplifier
DisplayUnit
Electrodes
T1 T2 T3 T4 T5
+ - + - + - + - + -
Potential difference between electrodes
1
2
3
n
+
+
+
=
Superposed signal ofthe whole motor unit
DetectionSite
α motoneuron
Motor Endplate Action Potentials:
MuscleFiber
1
2
3
n
+
+
+
=
Superposed signal ofthe whole motor unit
DetectionSite
α motoneuron
Motor Endplate Action Potentials:
MuscleFiber
Fig.9: The model of a wandering electrical dipole on muscle fiber membranes. Adopted & modified from 7, p. 73
Fig.10: Generation of the triphasic motor unit action potential. Adopted & modified from 2, p. 68

ABC of EMG – A Practical Introduction to Kinesiological Electromyography Page 10
Composition of EMG Signal Superposition of MUAPs
In kinesiological studies the motor unit action
potentials of all active motor units detectable
under the electrode site are electrically su-perposed (Fig. 11) and observed as a bipolar
signal with symmetric distribution of positive
and negative amplitudes (mean value equals
to zero). It is called an Interference pattern. Recruitment and Firing Frequency
The two most important mechanisms influenc-
ing the magnitude and density of the observed
signal are the Recruitment of MUAPs and their
Firing Frequency.
These are the main control strategies to adjust the contraction process and modulate the force output of
the involved muscle. Because the human connective tissue and skin layers have a low pass filter effect on
the original signal, the analyzed firing frequency e.g. of a surface EMG does not measure the original firing
and amplitude characteristics. For simplicity, one can say that the EMG signal directly reflects the recruit-
ment and firing characteristics of the detected motor units within the measured muscle (Fig. 12):
25 mathematically generated MUAPs
Superposed signal
∑
25 mathematically generated MUAPs
Superposed signal
∑∑
Volta
ge (m
V)
1
MU 1(3 Hz)
MU 2(4 Hz)
MU 3( 6 Hz)
M4(8 Hz)
SuperposedSurface Signal
Motor Unit Firing
Motor U
nit Recruitm
ent
+
+
+
=
Volta
ge (m
V)
1
MU 1(3 Hz)
MU 2(4 Hz)
MU 3( 6 Hz)
M4(8 Hz)
SuperposedSurface Signal
Motor Unit Firing
Motor U
nit Recruitm
ent
+
+
+
=
Fig.11: Superposition of MUAPs to a resulting electromyogram. Adopted & modified from 2, p. 81
Fig.12: Recruitment and firing frequency of motor units modulates force output and is reflected in the superposed EMG signal. Adopted & modified from 7, p. 75

ABC of EMG – A Practical Introduction to Kinesiological Electromyography Page 11
Nature of the EMG Signal The “raw” EMG signal
An unfiltered (exception: amplifier bandpass) and unprocessed signal detecting the superposed MUAPs is
called a raw EMG Signal. In the example given below (Fig. 13), a raw surface EMG recording (sEMG) was
done for three static contractions of the biceps brachii muscle:
When the muscle is relaxed, a more or less noise-free EMG Baseline can be seen. The raw EMG baseline
noise depends on many factors, especially the quality of the EMG amplifier, the environment noise and the
quality of the given detection condition. Assuming a state-of-the-art amplifier performance and proper skin
preparation (see the following chapters), the averaged baseline noise should not be higher than 3 – 5 micro-
volts, 1 to 2 should be the target. The investigation of the EMG baseline quality is a very important checkpoint
of every EMG measurement. Be careful not to interpret interfering noise or problems within the detection ap-
paratus as “increased” base activity or muscle (hyper-) tonus!
The healthy relaxed muscle shows no significant EMG activity due to lack of depolarization and action poten-
tials. By its nature, raw EMG spikes are of random shape, which means one raw recording burst cannot be
precisely reproduced in exact shape. This is due to the fact that the actual set of recruited motor units con-
stantly changes within the matrix/diameter of available motor units: If occasionally two or more motor units
fire at the same time and they are located near the electrodes, they produce a strong superposition spike. By
applying a smoothing algorithm (e.g. moving average) or selecting a proper amplitude parameter (e.g. area
under the rectified curve), the non- reproducible contents of the signal is eliminated or at least minimized.
Raw sEMG can range between +/- 5000 microvolts (athletes!) and typically the frequency contents ranges
between 6 and 500 Hz, showing most frequency power between ~ 20 and 150 Hz (see chapter Signal Check
Procedures).
Base Line
Non reproducibleamplitude spikes
Rest Period
Active Contraction Burst
time (ms)
Mic
rovo
lts
Base Line
Non reproducibleamplitude spikes
Rest Period
Active Contraction Burst
time (ms)
Mic
rovo
lts
Fig.13: The raw EMG recording of 3 contractions bursts of the M. biceps br.

ABC of EMG – A Practical Introduction to Kinesiological Electromyography Page 12
The Influence of detection condition Factors influencing the EMG signal
On its way from the muscle membrane up to the electrodes, the EMG signal can be influenced by several ex-
ternal factors altering its shape and characteristics. They can basically be grouped in:
1) Tissue characteristics The human body is a good electrical conductor,
but unfortunately the electrical conductivity var-
ies with tissue type, thickness (Fig. 14),
physiological changes and temperature. These
conditions can greatly vary from subject to sub-
ject (and even within subject) and prohibit a di-
rect quantitative comparison of EMG amplitude
parameters calculated on the unprocessed
EMG signal.
2) Physiological cross talk Neighboring muscles may produce a significant amount of EMG that is detected by the local electrode site.
Typically this “Cross Talk” does not exceed 10%-15% of the overall signal contents or is not available at all.
However, care must been taken for narrow arrangements within muscle groups.
ECG spikes can interfere with the EMG recording, especially when
performed on the upper trunk & shoulder muscles. They are easy to
see and new algorithms are developed to eliminate them (see ECG
Reduction).
3) Changes in the geometry between muscle belly and electrode site Any change of distance between signal origin and detection site will
alter the EMG reading. It is an inherent problem of all dynamic
movement studies and can also be caused by external pressure.
4) External noise Special care must be taken in very noisy electrical environments. The most demanding is the direct interfer-
ence of power hum, typically produced by incorrect grounding of other external devices.
5) Electrode and amplifiers The selection/quality of electrodes and internal amplifier noise may add signal contents to the EMG baseline.
Internal amplifier noise should not exceed 5 Vrms (ISEK Standards, see chapter “Guidelines…”)
Most of these factors can be minimized or controlled by accurate preparation and checking the given
room/laboratory conditions.
=> Given Raw -EMG ( µVolt )Active muscle
2) Adipositas
1) Normal condition
Skin
=> Decreased overall amplitude
Active muscle
Subcut. Fat tissue
-=> Given Raw EMG ( µVolt )Active muscle
2) Adipose
1) Normal condition
Skin
=> Decreased overall amplitude
Active muscle
Subcut. Fat tissue
Fig.14: The influence of varying thickness of tissue layers below the elec-trodes: Given the same amount of muscle electricity, condition 1 produces more EMG magnitude due to smaller distance between muscle and electrodes
Fig.15: Raw EMG recording with heavy ECG interference
ABC of EMG – A Practical Introduction to Kinesiological Electromyography Page 13
EMG Amplification EMG - Amplifiers
EMG-amplifiers act as differential amplifiers and their main purpose is the ability to reject or eliminate arti-
facts. The differential amplification detects the potential differences between the electrodes and cancels ex-
ternal interferences out. Typically external noise signals reach both electrodes with no phase shift. These
“common mode” signals are signals equal in phase and amplitude. The term "common mode gain" refers to
the input-output relationship of common mode signals. The "Common Mode Rejection Ratio" (CMRR) represents the relationship between differential and common mode gain and is therefore a criteria for the
quality of the chosen amplification technique. The CMRR should be as high as possible because the elimina-
tion of interfering signals plays a major role in quality. A value >95dB is regarded as acceptable (11,
SENIAM, ISEK).
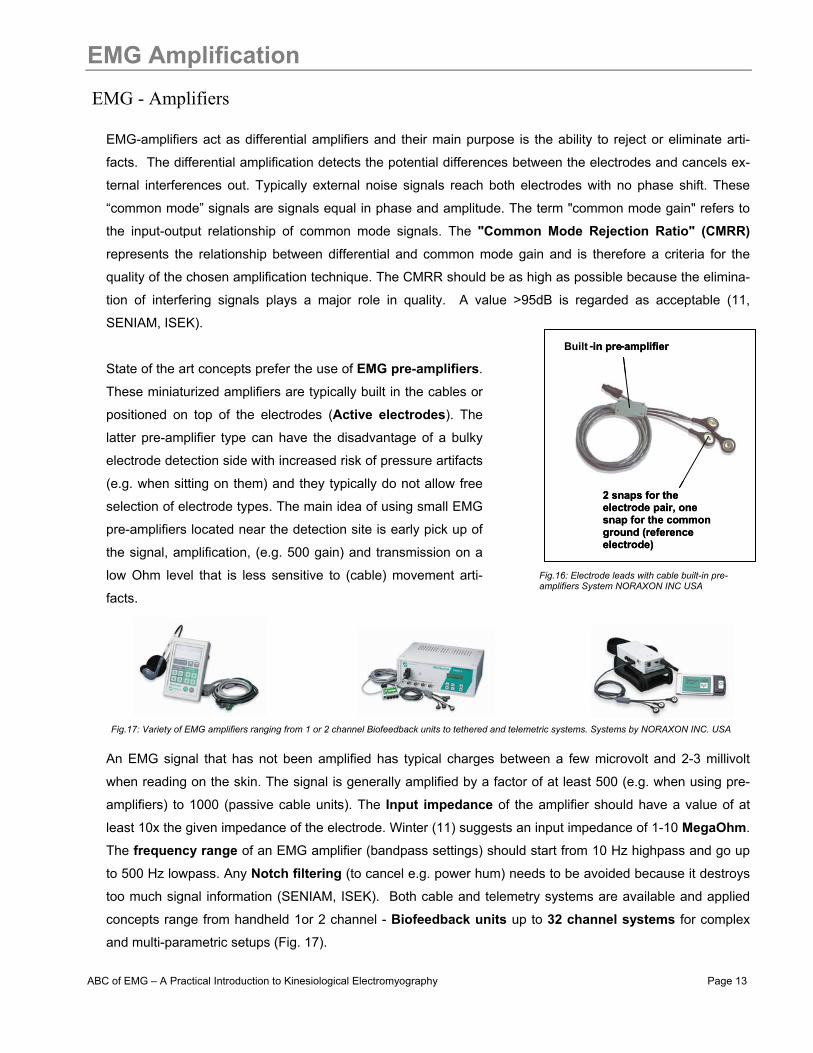
State of the art concepts prefer the use of EMG pre-amplifiers.
These miniaturized amplifiers are typically built in the cables or
positioned on top of the electrodes (Active electrodes). The
latter pre-amplifier type can have the disadvantage of a bulky
electrode detection side with increased risk of pressure artifacts
(e.g. when sitting on them) and they typically do not allow free
selection of electrode types. The main idea of using small EMG
pre-amplifiers located near the detection site is early pick up of
the signal, amplification, (e.g. 500 gain) and transmission on a
low Ohm level that is less sensitive to (cable) movement arti-
facts.
An EMG signal that has not been amplified has typical charges between a few microvolt and 2-3 millivolt
when reading on the skin. The signal is generally amplified by a factor of at least 500 (e.g. when using pre-
amplifiers) to 1000 (passive cable units). The Input impedance of the amplifier should have a value of at
least 10x the given impedance of the electrode. Winter (11) suggests an input impedance of 1-10 MegaOhm.
The frequency range of an EMG amplifier (bandpass settings) should start from 10 Hz highpass and go up
to 500 Hz lowpass. Any Notch filtering (to cancel e.g. power hum) needs to be avoided because it destroys
too much signal information (SENIAM, ISEK). Both cable and telemetry systems are available and applied
concepts range from handheld 1or 2 channel - Biofeedback units up to 32 channel systems for complex
and multi-parametric setups (Fig. 17).
Built - in pre - amplifier
2 snaps for the electrode pair, one snap for the commonground (reference electrode)
in pre - amplifier
2 snaps for the electrode pair, one snap for the commonground (reference electrode)
Fig.16: Electrode leads with cable built-in pre-amplifiers System NORAXON INC USA
Fig.17: Variety of EMG amplifiers ranging from 1 or 2 channel Biofeedback units to tethered and telemetric systems. Systems by NORAXON INC. USA
ABC of EMG – A Practical Introduction to Kinesiological Electromyography Page 14
Computation of the EMG signal
A/D Resolution
Before a signal can be displayed and analyzed in the computer, it has to be converted from an analog volt-
age to a digital signal (A/D conversion). The resolution of A/D measurement boards need to properly con-
vert the expected amplitude range (e.g. +/- 5 Volts). A 12 bit A/D board can separate the voltage range of the
input signal into 4095 intervals (2^12=4096 levels =4095 intervals). This is sufficient for most kinesiological
setups. Very small signals may need a higher amplification to achieve a better amplitude resolution.
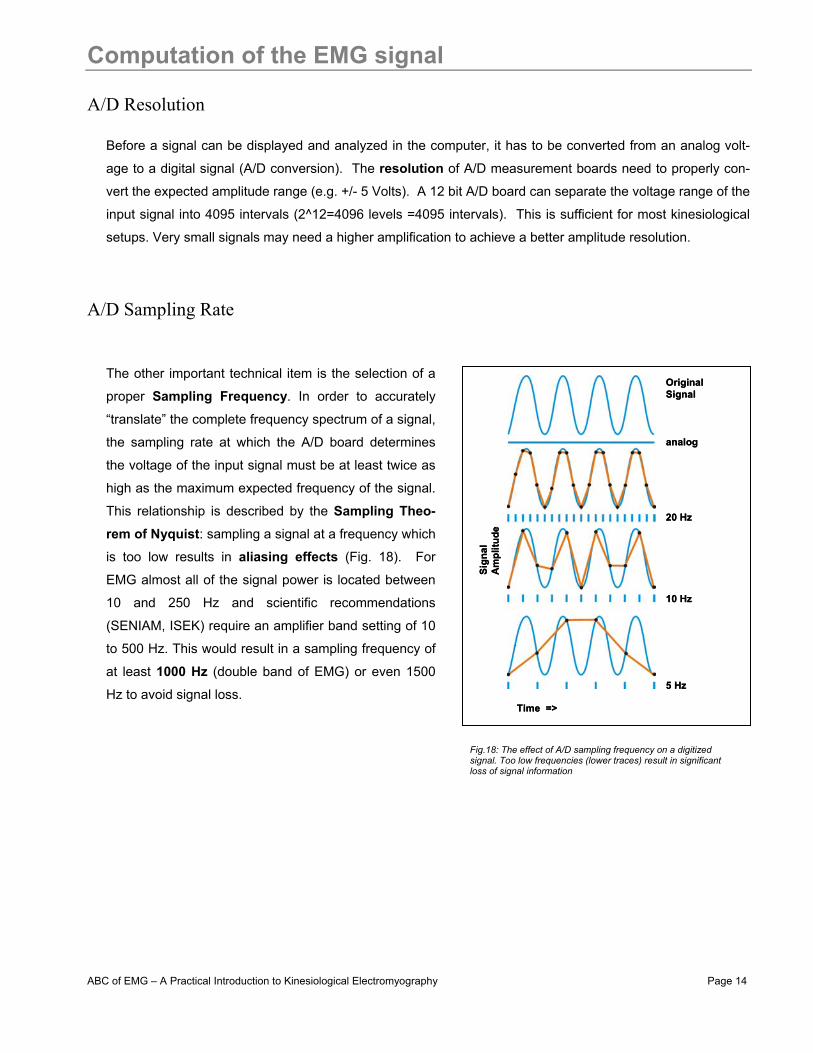
A/D Sampling Rate
The other important technical item is the selection of a
proper Sampling Frequency. In order to accurately
“translate” the complete frequency spectrum of a signal,
the sampling rate at which the A/D board determines
the voltage of the input signal must be at least twice as
high as the maximum expected frequency of the signal.
This relationship is described by the Sampling Theo-rem of Nyquist: sampling a signal at a frequency which
is too low results in aliasing effects (Fig. 18). For
EMG almost all of the signal power is located between
10 and 250 Hz and scientific recommendations
(SENIAM, ISEK) require an amplifier band setting of 10
to 500 Hz. This would result in a sampling frequency of
at least 1000 Hz (double band of EMG) or even 1500
Hz to avoid signal loss.
Original Signal
20 Hz
10 Hz
5 Hz
Time =>
Sign
al
Am
plitu
de
analog
Original Signal
20 Hz
10 Hz
5 Hz
Time =>
Sign
al
Am
plitu
de
analog
Fig.18: The effect of A/D sampling frequency on a digitized signal. Too low frequencies (lower traces) result in significant loss of signal information
ABC of EMG – A Practical Introduction to Kinesiological Electromyography Page 15
Skin Preparation General considerations
The quality of an EMG measurement largely depends on a proper skin preparation and electrode positioning.
The main strategy of skin preparation is stable electrode contact and low skin impedance. Most modern
EMG-amplifiers are designed for skin impedance levels between 5 and 50 kOhm (between pairs of elec-
trodes). Usually it is necessary to perform some skin preparation before the electrodes can be applied.
There are no general rules for it and several possibilities to reach a good skin condition for EMG-
measurements exist. Especially for beginners, it will be beneficial to check the quality of the chosen method
by measuring the actual impedance resistance between electrodes with a regular multi-meter or specialized
impedance meters (see chapter Signal Check Procedures).
Another important consideration is the targeted test condition and exercise. If a somewhat static or slow mo-
tion movement is planned (e.g. a clinical muscle function test) and the basic analysis idea is qualitative (ampli-
tude changes in terms of more/less), a simple alcohol cleaning may be sufficient. If very dynamic conditions
with risk of movement artifacts (e.g. fast walking, running or other highly accelerated movements is planned),
a very thorough preparation is imperative.
Skin preparation procedures
The following procedures may be considered as steps to prepare the electrode application:
1) Removing the hair: This is needed to improve the adhesion of the electrodes, especially under humid conditions or for sweaty
skin types and/or dynamic movement conditions.
2) Cleaning of the skin: Method A: Special abrasive and conductive cleaning pastes are available which remove dead skin cells (they produce
high impedance) and clean the skin from dirt and sweat.
Method B: Alternatively, a very find sand paper can be used: A soft and controlled pressure in 3 or 4 sweeps usually is
enough to get a good result. Attention: Avoid any harm to the skin from rubbing too hard! The use of sand-
paper should be combined with an alcohol pad cleaning.
Method C: The pure use of alcohol may be another alternative if used with a textile towel (that allows soft rubbing). This
latter method may be sufficient for static muscle function tests in uncompromised conditions.
Whichever skin preparation method and electrode application technique is used, when done properly, the
skin typically receives a light red color. This indicates good skin impedance condition.
ABC of EMG – A Practical Introduction to Kinesiological Electromyography Page 16
Surface Electrode Selection
Skin surface electrodes
Due to their non-invasive character, in most cases surface electrodes are used in kinesiological studies. Be-
sides the benefit of easy handling, their main limitation is that only surface muscles can be detected. For
deeper muscles (covered by surface muscles or bones) fine-wire or needle electrodes are inevitable. At best
case, a free selection of any electrode type is supported by an EMG – (pre) amplifier. The selection of an
electrode type greatly depends on the given investigation and condition, one electrode type cannot cover all
possible requirements!
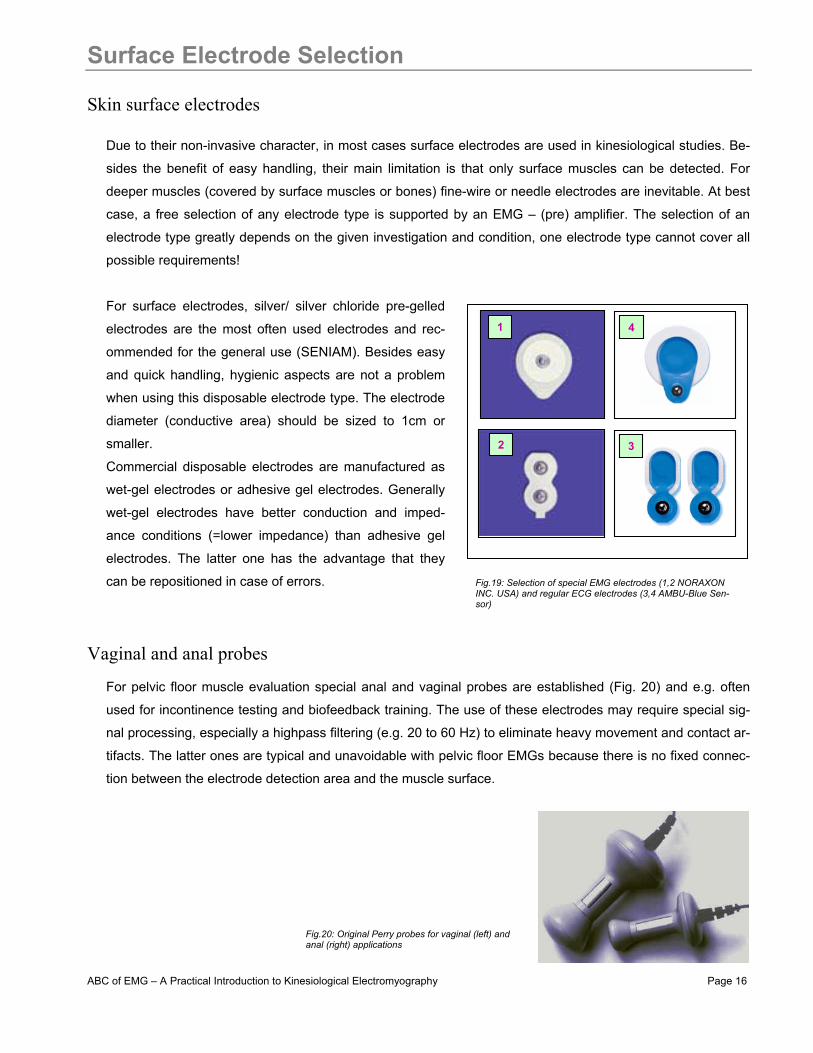
For surface electrodes, silver/ silver chloride pre-gelled
electrodes are the most often used electrodes and rec-
ommended for the general use (SENIAM). Besides easy
and quick handling, hygienic aspects are not a problem
when using this disposable electrode type. The electrode
diameter (conductive area) should be sized to 1cm or
smaller.
Commercial disposable electrodes are manufactured as
wet-gel electrodes or adhesive gel electrodes. Generally
wet-gel electrodes have better conduction and imped-
ance conditions (=lower impedance) than adhesive gel
electrodes. The latter one has the advantage that they
can be repositioned in case of errors.
Vaginal and anal probes
For pelvic floor muscle evaluation special anal and vaginal probes are established (Fig. 20) and e.g. often
used for incontinence testing and biofeedback training. The use of these electrodes may require special sig-
nal processing, especially a highpass filtering (e.g. 20 to 60 Hz) to eliminate heavy movement and contact ar-
tifacts. The latter ones are typical and unavoidable with pelvic floor EMGs because there is no fixed connec-
tion between the electrode detection area and the muscle surface.
2
1
3
4
2
1
3
4
Fig.19: Selection of special EMG electrodes (1,2 NORAXON INC. USA) and regular ECG electrodes (3,4 AMBU-Blue Sen-sor)
Fig.20: Original Perry probes for vaginal (left) and anal (right) applications

ABC of EMG – A Practical Introduction to Kinesiological Electromyography Page 17
Fine Wire electrodes The use of fine wire electrodes
Due to muscle movements within kinesiological studies, thin and flexible fine wire electrodes are the pre-
ferred choice for invasive electrode application in deeper muscle layers.
The sterilized paired or single hook wires are inserted by hollow needles and their proper localization can be
tested by electrical stimulators or ultrasound imaging:
The signals are measured and processed
like regular surface EMG signals. It may be
helpful or necessary to apply a high pass fil-
ter at 20 Hz (instead of 10Hz) to eliminate
baseline shifts which typically appear from
wire movement artifacts in the muscle tis-
sue.
1) Insert Needle 2) Remove Needle 3) Connect wires to springs1) Insert Needle 2) Remove Needle 3) Connect wires to springs
Un-isolatedEnding (red)
Steelcannula
Un-isolated Ending (red)- electrode site
Hooked electrode wires
Un-isolatedEnding (red)
Steelcannula
Un-isolated Ending (red)- electrode site
Hooked electrode wires
Fig.21: Schematics of a fine wire electrode: two fine wires with un-isolated endings are located with a steel cannula. System MEDELEC.
Fig.22: Procedure to insert the fine wires into the muscle tissue. After removing the needle, the distal endings of the wires are con-nected to steel spring adapters, which again are connected to the regular EMG pre-amplifier lead
Fig.22: Raw fine wire EMG recording of the M. tibialis posterior (upper blue trace) in treadmill walking. Baseline shifts indicate motion artifacts. The baseline can be stabilized by applying a 20 Hz highpass filter (lower red curve) – Institut fuer Biomechanik & Orthopaedie, D. Sporthochschule Köln-Germany)

ABC of EMG – A Practical Introduction to Kinesiological Electromyography Page 18
Guidelines Electrode Application General guidelines
• Wet-gel electrodes have the best skin impedance values
• Use small electrodes to increase the selectivity of your measures (avoid cross-talk)
• The smaller the electrode (active detection area) the higher the impedance values
• Select the closest possible inter-electrode distance to increase selectivity
• The general recommendation for the inter-electrode distance is 2 cm (center point to center point)
• Apply electrodes in parallel to the muscle fiber direction
• Use the dominant middle portion of the muscle belly for best selectivity
• Avoid the region of motor points if possible (see next page)
• Take care that the electrode site remains on the active muscle mass during muscle shortening
• Use a map system with measured distances between the electrode site and dominant anatomical land-marks (Fig. 23)
• Use electrodes with de-centralized snap/cable connection if you expect increased pressure on elec-trodes (e.g. sitting on electrodes)
Anatomical landmarks
Most recommendations for electrode application (e.g. SENIAM) work with an anatomical landmark system,
based on dominant bone areas and prominences or other structures that can easily be palpated. Use these
points to clearly locate the position of a selected electrode site:
Scapula trigonum spinae
Scapula angulus inferior
L1/L5 proc. spinosus
Epicondylus lateralis / medialis
Spina iliaca superior
C7 proc. spinosus
Epicondylus lateralis/medialis
Processus styloideus radiiProcessus styloideus ulnae
Trochanter major
AcromionAcromion
Patella
Knee joint
Christa iliaca
Rib cage
Umbicilus
Sternum
Malleolus medialis/lateralis
Medial clavicula head
Spina iliaca anteriorsuperior
Head of Fibula
Tibia Bone
CircumferencePoint
CircumferencePoint
Fossa cubitalis
TH 3 proc. spinosus
Heel / calcaneum
Medial border of scapula
TH 8 proc. spinosus
Olecranum
Fig.23: Anatomical landmarks on the human body in dorsal and frontal view
ABC of EMG – A Practical Introduction to Kinesiological Electromyography Page 19
Specific Aspects of Electrode Application Motor point regions
Due to increased signal instability some researchers recommend not to place electrodes over motor point re-
gions (area with high density of motor endplates) of the muscle. When using electrode sizes as recom-
mended above, in many cases it cannot be avoided that one electrode comes near a motor point region. Mo-
tor points can be detected by low frequency stimulus power generators producing right angled impulses.
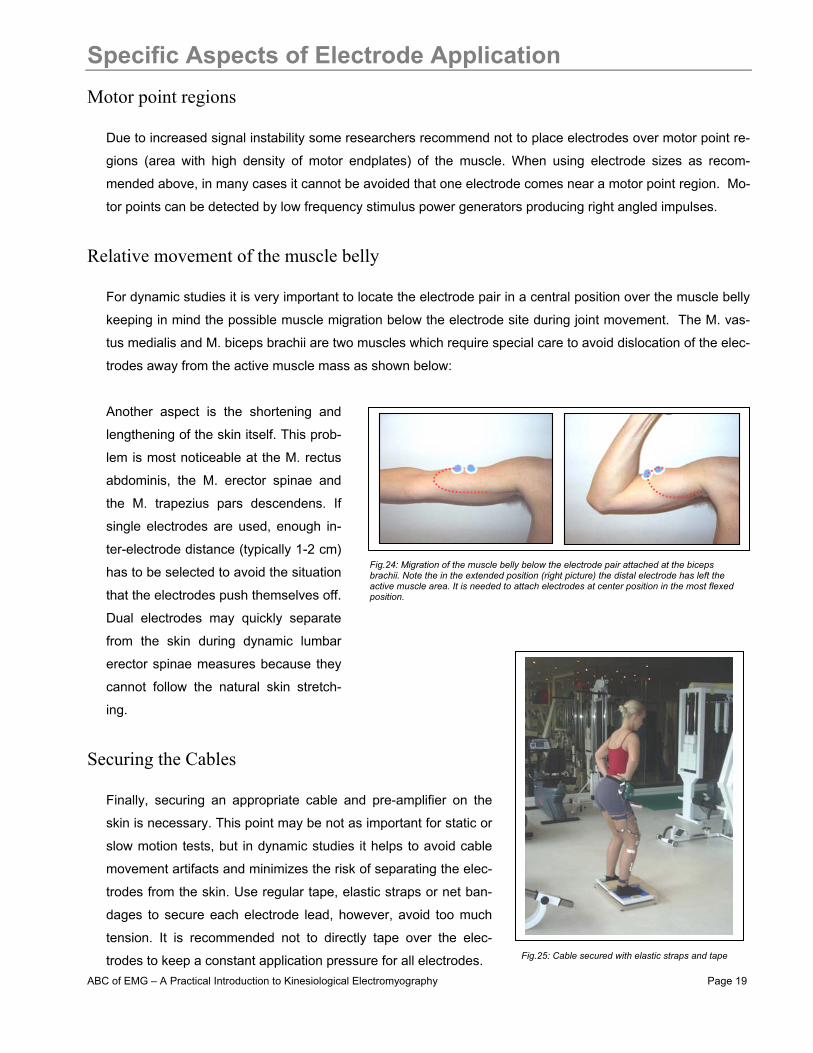
Relative movement of the muscle belly
For dynamic studies it is very important to locate the electrode pair in a central position over the muscle belly
keeping in mind the possible muscle migration below the electrode site during joint movement. The M. vas-
tus medialis and M. biceps brachii are two muscles which require special care to avoid dislocation of the elec-
trodes away from the active muscle mass as shown below:
Another aspect is the shortening and
lengthening of the skin itself. This prob-
lem is most noticeable at the M. rectus
abdominis, the M. erector spinae and
the M. trapezius pars descendens. If
single electrodes are used, enough in-
ter-electrode distance (typically 1-2 cm)
has to be selected to avoid the situation
that the electrodes push themselves off.
Dual electrodes may quickly separate
from the skin during dynamic lumbar
erector spinae measures because they
cannot follow the natural skin stretch-
ing.
Securing the Cables
Finally, securing an appropriate cable and pre-amplifier on the
skin is necessary. This point may be not as important for static or
slow motion tests, but in dynamic studies it helps to avoid cable
movement artifacts and minimizes the risk of separating the elec-
trodes from the skin. Use regular tape, elastic straps or net ban-
dages to secure each electrode lead, however, avoid too much
tension. It is recommended not to directly tape over the elec-
trodes to keep a constant application pressure for all electrodes.
Fig.24: Migration of the muscle belly below the electrode pair attached at the biceps brachii. Note the in the extended position (right picture) the distal electrode has left the active muscle area. It is needed to attach electrodes at center position in the most flexed position.
Fig.25: Cable secured with elastic straps and tape

ABC of EMG – A Practical Introduction to Kinesiological Electromyography Page 20
Muscle Map Frontal
Most of the important limb and trunk muscles can be measured by surface electrodes (right side muscles
in Fig. 26a/26b). Deeper, smaller or overlaid muscles need a fine wire application to be safely or selec-
tively detected. The muscle maps show a selection of muscles that typically have been investigated in
kinesiological studies. The two yellow dots of the surface muscles indicate the orientation of the electrode
pair in ratio to the muscle fiber direction (proposals compiled from 1, 4, 10 and SENIAM).
Frontal View
Frontalis
Masseter
Sternocleidomastoideus
Deltoideus p. acromialis Deltoideus p. clavicularis
Pectoralis major
Biceps brachii
Brachioradialis Flexor carpum radialis
Rectus abdominis
Serratus anterior
Flexor carpum ulnaris
Obliquus externus abdominis
Internus / Transversus abd.
Rectus femoris
Vastus lateralis
Vastus medialis
Peroneus longus
Interosseus
Adductores
Tensor fascia latae
Tibialis anterior
Surface Sites: Fine Wire Sites:
Iliacus
Pectoralis minor
Diaphragma
Transversus abd.
Adductors (selective)
Vastus intermedius
Thin / deep shank muscles
Smaller foot muscles
Smaller neck muscles
Psoas major
Smaller face muscles
Smaller forearm muscles
Fig. 26a: Anatomical positions of selected electrode sites, frontal view. The left side indicates deep muscles and positions for fine wire electrodes,while the right side is for surface muscles and electrodes

ABC of EMG – A Practical Introduction to Kinesiological Electromyography Page 21
Muscle Map Dorsal Dorsal View
Reference electrodes
At least one neutral reference electrode per subject needs to be positioned. Typically an electrically unaf-
fected but nearby area is selected, such as joints, bony area, frontal head, processus spinosus, christa il-
iaca, tibia bone etc. Due to differential amplification against any reference, the latest amplifier technology
(NORAXON active systems) needs no special area but only a location nearby the first electrode site. Re-
member to prepare the skin for the reference electrode also and use electrode diameters of at least 1 cm.
Trapezius p. descendenz
Neck extensors
Deltoideus p. scapularis
Trapezius p. transversus
Infraspinatus
Erector spinae (thoracic region)
Latissimus dorsi
Erector spinae (lumbar region)
Multifiduus lumbar region
Semitendinosus/membranosus
Biceps femoris
Gastrocnemius lat.
Glutaeus maximus
Glutaeus medius
Gastrocemius med.
Surface Sites:
Trapezius p. ascendenz
Triceps brachii (c. long./lat.)
Smaller forcearm extensors
Soleus
Fine Wire Sites:
Deep hip muscles
Subscapularis
Triceps brachii c. med.
Deep multifii
Thin / deep shank muscles
Supraspinatus
Deep neck muscles
Smaller forearm extensors
Thoracic erector spinae
Rhomboideus
Teres major / minor
Quadratus lumborum
Deep segmental erector spinae
Fig. 26b: Anatomical positions of selected electrode sites, dorsal view. The left side indicates deep muscles and positions for fine wire electrodes,while the right side is for surface muscles and electrodes

ABC of EMG – A Practical Introduction to Kinesiological Electromyography Page 22
Signal Check Procedures
It is an important procedure within all EMG investigations to check the validity and quality of the EMG signals
regardless of which skin preparation method and electrode application technique is used. Several steps
should be considered here:
1) Proof of the EMG signal validity
This checkpoint addresses the basic questions: “Did I measure the right muscle” and “can I see valid signals
at all?” Very often, even though it sounds silly, there is a possibility of accidentally applying the wrong cable
end to the muscle, e.g. the wire designated for one muscle is mixed with another. Checking all connections
again can confirm the EMG signal by a specific muscle function test for that particular muscle. Later, during
the quality check of the EMG baseline (next chapter) you may also check the sensitivity of an electrode site
against cable movement, limb movements and local pressure (e.g. when sitting on electrodes). Detection
sites over very thick subcutaneous fat tissue (e.g. more that 4 cm) may mean that no EMG signal is visible at
all or the EMG to baseline ratio is poor. Explicit / isolated static test contractions based on muscle function
tests give you a clear understanding if the EMG recording will reveal valid data and/or if the subject is able to
activate the muscle.
2) Impedance Test
If the skin preparation was done properly, the skin typically gets a light
red color. This indicates a good skin impedance condition. To verify it,
the Ohm – resistance between the electrode pair can be measured.
This step is especially recommended for beginners and for sophisti-
cated research studies (some journals require the control of the typical
skin impedance condition). Usually the application area needs about 5
minutes to reach a stable electrical condition: within the first minute one
can observe a decrease of electrical resistance of over 50%, mainly due
to chemical changes within the skin layers. Skin impedance ranges can
be classified in:
Impedance range (KOhm)
Recommendation
1 - 5 -very good condition
5 - 10 - good and recommended if feasible
10 - 30 - acceptable for easy conditions
30 - 50 - less good, attention is needed (see next chapter)
> 50 - should be avoided or requires a second cleaning run
Fig. 27: EMG electrode impedance tester – model NORAXON INC. USA
Fig. 28: Recommendations for electrode/skin impedance ranges

ABC of EMG – A Practical Introduction to Kinesiological Electromyography Page 23
Signal Check Procedures
3) Inspection of the raw EMG-baseline quality The (visual) inspection of the raw EMG baseline is the most important step and cannot be replaced by any
other method (like automatic impedance check). The amplifier has to pick up a signal no larger than a few
millions of a volt (microvolt) and this sensitive signal can easily be influenced by external sources (artifacts) if
not treated correctly. After connecting the electrodes to the amplifier, start the PC-signal monitor and zoom
into the raw EMG trace of each channel for a detailed inspection. Ask your subject to completely relax. For
true relaxation, let your subject lay down on a therapy bench or similar position. The EMG baseline inspec-
tion focuses on these three major factors:
1) Baseline noise A complete noise-free recording is impossible: small amplitude spikes or random nature may be visible but
they should not exceed 10 – 15 microvolts. The average noise level (=calculate the EMG mean amplitude of
the raw rectified EMG for 5 seconds) should be located at 1 (=excellent) to 3.5 microvolts. A frequency dis-
tribution test (next page) is a second objective possibility to check the baseline quality.
2) Baseline offset Most amplifiers work with an auto offset correction. How-
ever, it is possible that the EMG baseline is shifted away
from the true zero line (test: mean value of the raw EMG≠
zero). If not identified and corrected, all amplitude based
calculations are invalid for that record.
3) Baseline shifts The baseline before/after contractions has to constantly re-
main at the zero line (see EMG Artifacts, baseline shifts)
Fig. 29: Visual (left) and numerical (right) evaluation of the EMG baseline quality. The left raw EMG trace shows an example for a nearly perfect EMG recording with stable flat EMG baseline be-tween active contractions. A quick analysis of a baseline section (blue area) indicates a mean noise level of 1.8 microvolts. System NORAXON INC. USA.
Fig. 30: Example for an offset shifted baseline. Special post recording edit functions should be applied to correct the shift
ABC of EMG – A Practical Introduction to Kinesiological Electromyography Page 24
Signal Check Procedures
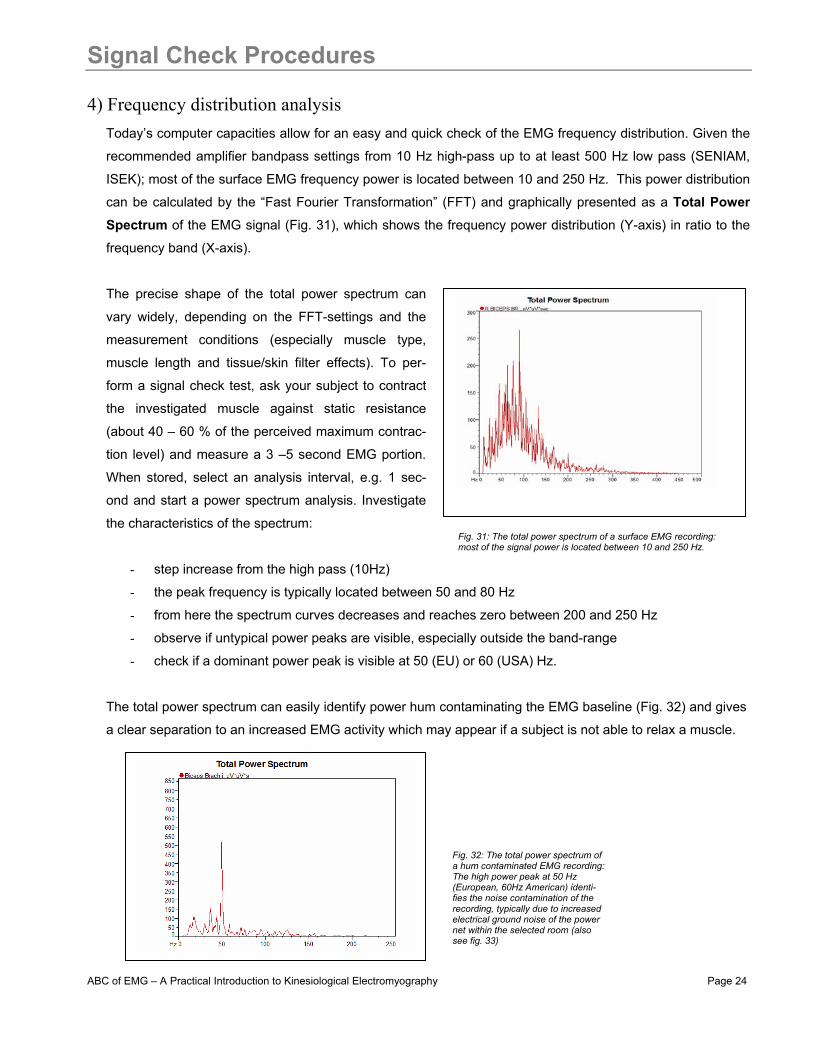
4) Frequency distribution analysis Today’s computer capacities allow for an easy and quick check of the EMG frequency distribution. Given the
recommended amplifier bandpass settings from 10 Hz high-pass up to at least 500 Hz low pass (SENIAM,
ISEK); most of the surface EMG frequency power is located between 10 and 250 Hz. This power distribution
can be calculated by the “Fast Fourier Transformation” (FFT) and graphically presented as a Total Power Spectrum of the EMG signal (Fig. 31), which shows the frequency power distribution (Y-axis) in ratio to the
frequency band (X-axis).
The precise shape of the total power spectrum can
vary widely, depending on the FFT-settings and the
measurement conditions (especially muscle type,
muscle length and tissue/skin filter effects). To per-
form a signal check test, ask your subject to contract
the investigated muscle against static resistance
(about 40 – 60 % of the perceived maximum contrac-
tion level) and measure a 3 –5 second EMG portion.
When stored, select an analysis interval, e.g. 1 sec-
ond and start a power spectrum analysis. Investigate
the characteristics of the spectrum:
- step increase from the high pass (10Hz)
- the peak frequency is typically located between 50 and 80 Hz
- from here the spectrum curves decreases and reaches zero between 200 and 250 Hz
- observe if untypical power peaks are visible, especially outside the band-range
- check if a dominant power peak is visible at 50 (EU) or 60 (USA) Hz.
The total power spectrum can easily identify power hum contaminating the EMG baseline (Fig. 32) and gives
a clear separation to an increased EMG activity which may appear if a subject is not able to relax a muscle.
Fig. 31: The total power spectrum of a surface EMG recording: most of the signal power is located between 10 and 250 Hz.
Fig. 32: The total power spectrum of a hum contaminated EMG recording: The high power peak at 50 Hz (European, 60Hz American) identi-fies the noise contamination of the recording, typically due to increased electrical ground noise of the power net within the selected room (also see fig. 33)

ABC of EMG – A Practical Introduction to Kinesiological Electromyography Page 25
EMG Artifacts
Due to its sensitive nature (signal range starts from a few microvolts) the EMG signal can be influenced by
external noise sources or other artifact sources. Most of them can easily be avoided if the previously men-
tioned guidelines of proper skin preparation and electrode position are checked. To give a better picture of
possible disturbances, the following graphs show some typical noise or artifact contaminated signals.
Interfering power hum An EMG amplifier can “catch” ground noise from the power net which results in increased baseline noise (50/60 Hz noise – Fig. 33). If the electrode was applied properly, in most cases another device (with poor electrical grounding) causes this problem. To solve it correctly, ground all devices, especially when equipped with electro-motors (treadmills, training machines, isokinetics machines etc…). Also try to change the power plug and always try to avoid multiple plug connec-tors and cable drums for the EMG amplifier.
Baseline offset
This constant EMG - baseline shift may occur if any change within the application site was done after the auto-calibration or if the subject did not relax at measurement start (Fig. 34). Use an “Offset correction” function to correct this shift before you record your data.
Baseline shifts
Any regular EMG burst returns to zero within a few milli-seconds, the EMG rest-line stays at constant zero. Any visible shift > 5 ms indicates an artifact (Fig. 35). This typically occurs if the cables shake too much or if the volume distance between the muscle belly and electrode site is changed by e.g. external lever arm forces (bad cable fixation) or lo-cal pressure. In jump testing, you may see similar base shifts due to heavy dislocation of the muscle belly (muscle wobbling due to impact forces) Proper electrode/cable fixation and very good skin preparation can solve these problems.
ECG artifacts
Whenever you measure near the heart (shoulder and trunk muscles on the left side), ECG bursts may contaminate the EMG recording (Fig. 36). This is a biological artifact that often cannot be avoided. It can be reduced by very good skin preparation and modified position of the ground electrode. State of the art signal processing routines can “clean” these bursts without destroying the regular EMG characteris-tics (see chapter Signal Processing ECG Reduction).
Fig. 33: EMG raw recording contaminated by power hum noise
Fig. 34: EMG raw recording with offset shift positive side
Fig. 35: EMG raw recording with cable movement artifacts
Fig. 36: EMG raw recording with ECG spikes

ABC of EMG – A Practical Introduction to Kinesiological Electromyography Page 26
Prepare EMG - Action list
Action / Step Comments
1. Ask your subject to wear appropriate clothes You need access to muscles which may be covered by pants, etc. Stiff clothes on the electrodes may produce artifacts
2. Decide for a “navigation” technique to identify the electrode location and landmark promi-nent regions
Use a pen to mark landmarks and orientation lines. Use a flexible measuring tape to meas-ure distances. Follow the e.g. SENIAM guide-lines.
3. Clean the skin with abrasive /conductive fluid Easiest and fastest method! Alternatively: very good alcohol cleaning
4. Attach electrodes parallel to muscle fibers at typically 2cm electrode distance, use the smallest electrode type available
If possible avoid motor endplates (static tests) and select middle belly portions to increase selectivity and decrease the risk of muscle belly dislocation
5. Wait at least 3 minutes and use the time to stretch, warm up or prepare your subject
The electrodes to skin contacts require time to reach a stable electrical (impedance) condi-tion. Beginners may want to check the elec-trode impedance
6. Connect and secure cables For dynamic movements secure all cables allowing enough room to avoid lever forces on the electrodes
7. Ask your subject to lay down on a bench and relax
Similar positions like lying on the ground or sitting may work well too
8. Start the signal monitor and check each EMG trace: Baseline check.
Check noise level, zero offset and possible shifts within joint movement
9. Check EMG activity bursts: do I see EMG? By using manual muscle tests, the general appearance of EMG bursts should be checked

ABC of EMG – A Practical Introduction to Kinesiological Electromyography Page 27
Signal Processing - Rectification
General comments The raw EMG recording already contains very important information and may serve as a first objective infor-
mation and documentation of the muscle innervation. The “off-on” and “more-less” characteristics and other
qualitative assessments can directly be derived and give an important first understanding of the neuromuscu-
lar control within tests and exercises. If a quantitative amplitude analysis is targeted in most cases some
EMG specific signal processing steps are applied to increase the reliability and validity of findings. By scien-
tific recommendations, (ISEK, SENIAM) the EMG recording should not use any hardware filters (e.g. notch fil-
ters), except the amplifier bandpass (10 – 500 Hz) filters that are needed to avoid anti-aliasing effects within
sampling. At best case, the post hoc processing can be removed at any time to restore the raw data set.
Some of the well established processing methods are introduced in the following chapters.
Full wave rectification
In a first step, all negative amplitudes are converted to positive amplitudes; the negative spikes are “moved
up” to positive or reflected by the baseline (Fig. 37). Besides easier reading, the main effect is that standard
amplitude parameters like mean, peak/max value and area can be applied to the curve (raw EMG has a
mean value of zero).
Fig. 37: EMG raw recording (upper trace) and rectified EMG recording (same signal, lower trace)

ABC of EMG – A Practical Introduction to Kinesiological Electromyography Page 28
Signal Processing - Smoothing
General comments As stated above, the interference pattern of EMG is of random nature, due to the fact that the actual set of
recruited motor units constantly changes within the diameter of available motor units and the arbitrary way
the motor unit action potentials superpose. This results in the fact that a raw EMG burst cannot be repro-
duced a second time by its precise shape. To address this problem, the non-reproducible part of the signal is
minimized by applying digital smoothing algorithms that outline the mean trend of signal development. The
steep amplitude spikes are cut away; the signal receives a “linear envelope”. Two algorithms are established:
Moving average (Movag) Based on a user defined time window, a certain amount of data are averaged
using the sliding window technique. If used for rectified signals it is also called the Average Rectified
Value (ARV) and serves as an “estimator of the amplitude behavior” (SENIAM). It relates to information
about the area under the selected signal epoch (Fig. 38).
Root Mean Square (RMS) Based on the square root calculation, the RMS reflects the mean power of the
signal (also called RMS EMG) and is the preferred recommendation for smoothing (2, 3).
Both algorithms are defined for a certain epoch (time window) and typically in kinesiological studies, time du-
ration of 20 ms (fast movements like jump, reflex studies) to 500 ms (slow or static activities) are selected. A
value that works well in most conditions is between 50 and 100 ms. The higher the time window is selected,
the higher the risk of a phase shift in contractions with steep signal increase needs to be considered (see red
rectangle in Fig. 38).
Movag at 300 ms
RMS at 300 ms
Fig. 38: Comparison of two smoothing algorithms using the same window width: Being very similar in shape, the RMS algo-rithm (lower trace) shows higher EMG amplitude data than the MovAg (upper trace)
ABC of EMG – A Practical Introduction to Kinesiological Electromyography Page 29
Signal Processing - Digital Filtering
General comments With the exception of amplifier bandpass filtering additional filtering is not needed in regular kinesiological
EMG studies (performed with modern amplifier technology). Scientific recommendations for research studies
(SENIAM, ISEK) deny any narrower band setting and the target is to measure the EMG in the full band length
of 10 to 500 Hz. Especially any type of notch filter (to e.g. cancel out 50 or 60 Hz noise) is not accepted be-
cause it destroys too much EMG signal power. Biofeedback units working with heavily preprocessed signals
should not be used for scientific studies.
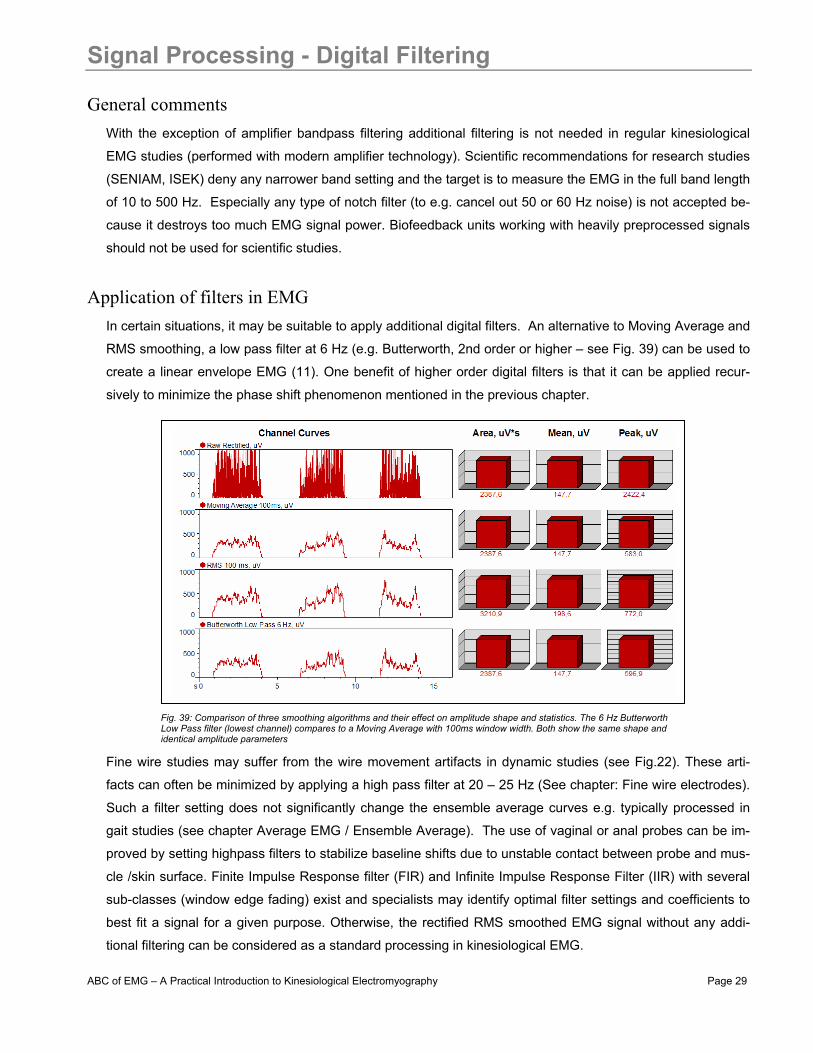
Application of filters in EMG In certain situations, it may be suitable to apply additional digital filters. An alternative to Moving Average and
RMS smoothing, a low pass filter at 6 Hz (e.g. Butterworth, 2nd order or higher – see Fig. 39) can be used to
create a linear envelope EMG (11). One benefit of higher order digital filters is that it can be applied recur-
sively to minimize the phase shift phenomenon mentioned in the previous chapter.
Fine wire studies may suffer from the wire movement artifacts in dynamic studies (see Fig.22). These arti-
facts can often be minimized by applying a high pass filter at 20 – 25 Hz (See chapter: Fine wire electrodes).
Such a filter setting does not significantly change the ensemble average curves e.g. typically processed in
gait studies (see chapter Average EMG / Ensemble Average). The use of vaginal or anal probes can be im-
proved by setting highpass filters to stabilize baseline shifts due to unstable contact between probe and mus-
cle /skin surface. Finite Impulse Response filter (FIR) and Infinite Impulse Response Filter (IIR) with several
sub-classes (window edge fading) exist and specialists may identify optimal filter settings and coefficients to
best fit a signal for a given purpose. Otherwise, the rectified RMS smoothed EMG signal without any addi-
tional filtering can be considered as a standard processing in kinesiological EMG.
Fig. 39: Comparison of three smoothing algorithms and their effect on amplitude shape and statistics. The 6 Hz Butterworth Low Pass filter (lowest channel) compares to a Moving Average with 100ms window width. Both show the same shape and identical amplitude parameters
ABC of EMG – A Practical Introduction to Kinesiological Electromyography Page 30
Signal Processing – Amplitude Normalization
General comments One major drawback of any EMG analysis is that the amplitude (microvolt scaled) data are strongly influ-
enced by the given detection condition (see chapter Influence of Detection Condition): it can vary greatly be-
tween electrode sites, subjects and even day to day measures of the same muscle site. One solution to over-
come this “uncertain” character of micro-volt scaled parameters is the normalization to a reference value, e.g.
the maximum voluntary contraction (MVC) value of a reference contraction. The basic idea is to “calibrate the
microvolts value to a unique calibration unit with physiological relevance”, the “percent of maximum innerva-
tion capacity” in that particular sense. Other methods normalize to the internal mean value or a given trial or
to the EMG level of a certain submaximal reference activity. The main effect of all normalization methods is
that the influence of the given detection condition is eliminated and data are rescaled from microvolt to per-
cent of selected reference value. It is important to understand that amplitude normalization does not change
the shape of EMG curves, only their Y-axis scaling!
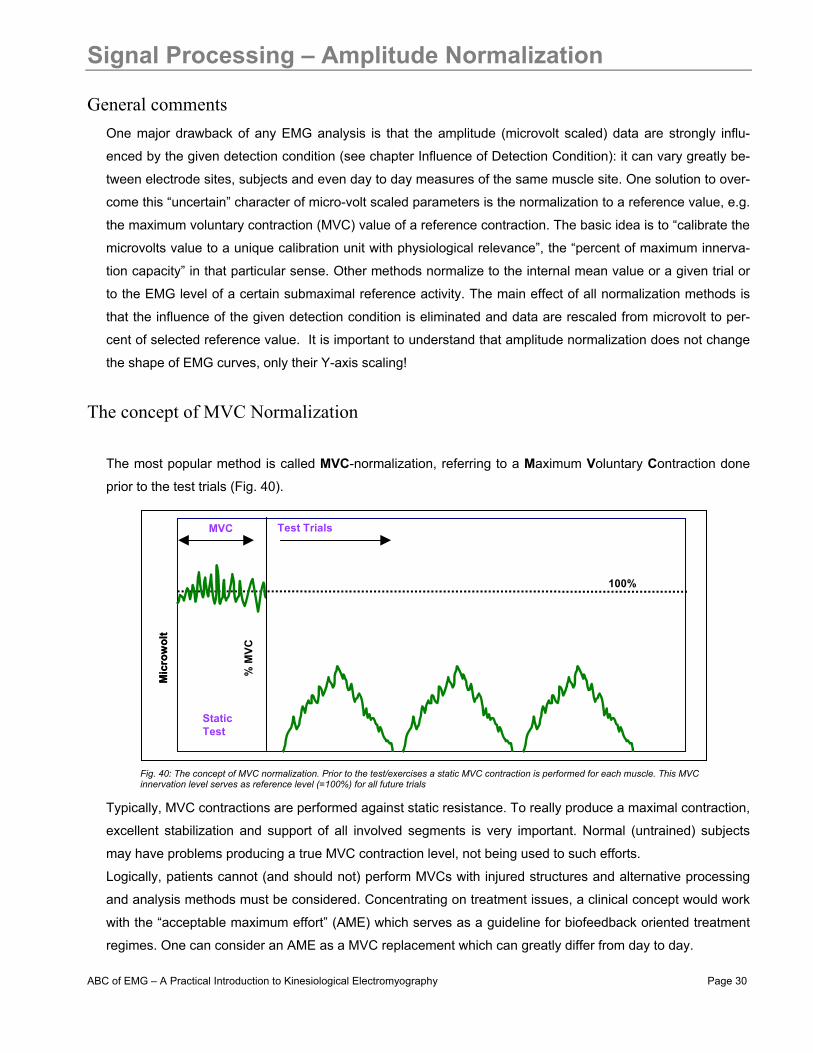
The concept of MVC Normalization
The most popular method is called MVC-normalization, referring to a Maximum Voluntary Contraction done
prior to the test trials (Fig. 40).
Typically, MVC contractions are performed against static resistance. To really produce a maximal contraction,
excellent stabilization and support of all involved segments is very important. Normal (untrained) subjects
may have problems producing a true MVC contraction level, not being used to such efforts.
Logically, patients cannot (and should not) perform MVCs with injured structures and alternative processing
and analysis methods must be considered. Concentrating on treatment issues, a clinical concept would work
with the “acceptable maximum effort” (AME) which serves as a guideline for biofeedback oriented treatment
regimes. One can consider an AME as a MVC replacement which can greatly differ from day to day.
Mic
row
olt
% M
VC
MVC
100%
Test Trials
StaticTest
Mic
row
olt
% M
VC
MVC
100%
Test Trials
StaticTest
Fig. 40: The concept of MVC normalization. Prior to the test/exercises a static MVC contraction is performed for each muscle. This MVC innervation level serves as reference level (=100%) for all future trials

ABC of EMG – A Practical Introduction to Kinesiological Electromyography Page 31
The practice of MVC Normalization The MVC test needs to be performed for each investigated muscle separately. The first step is to identify an
exercise/position that allows for an effective maximum innervation (not force output!). For extremity muscles
typically isolated single-joint activities - statically held at middle positions within the range of motion (ROM) -
give best results. For trunk muscles exercises innervating the given “muscle chain” work best. Whenever
possible, use robust machines with straps. It is interesting to note that depending on the subject’s individual
coordinative capacity, different test exercises/positions can produce the highest MVC value, especially for
trunk muscles: it may be necessary to try two or three possible candidates of test exercises and determine
where the highest EMG level can be found. For complex studies addressing trunk and hip muscles, it is rec-
ommended to select a sequence of these “best candidates” and have them be performed in random order
(Fig. 41).
After an initial warming up sequence (stretching, low aerobic exercises, 5 to 10 minutes), ask your subjects to
slowly start increasing the force, reach the maximum effort after 3 –5 seconds, hold it for 3 seconds and
promptly relax. (Relaxation should be accomplished within 3 seconds). Repeat it at least one time, with a
pausing period of 30 to 60 seconds in between. Repeat this sequence for each MVC exercise (studies re-
quire random order to avoid systematic fatigue effects).
The most efficient way is to store all data
in one record and pause the recording
while changing the test position (Fig. 42).
This would allow mathematical algo-
rithms to find peak portions automati-
cally, regardless of which “candidate”
produced it. The MVC value itself is not
calculated as a single peak data point
because that would allow too much vari-
ability. A more stable reference value is
the mean amplitude of the highest signal
portion with e.g. 500 ms duration. It
needs to be determined by algorithms
using a sliding window technique
Rect. Abd.
Obliquus
Rect.Fem.
3 5
1
10
2
3 4 2
MVC-TestSequence
MVC - “Hit-Quotes”Rect. Abd.
Obliquus
Rect.Fem.
3 5
1
10
2
3 4 2
MVC-TestSequence
MVC - “Hit-Quotes”
Fig. 41: MVC test sequence for trunk/hip flexor muscles (Rectus abd., Obliquus ext. abd., Rectus femoris). The numbers below each test exercise indicate how many of 10 subjects showed highest innervation at that exercise.
Fig. 42: Example for an 8 channel MVC test sequence. Each MVC – test is repeated as least one time, interrupted by a pausing (red lines). An automatic algorithm detects the highest EMG portions (green bars labelled “MVC”) and stores them for further use. Sys-tem MYORESEARCH XP, NORAXON INC. USA
ABC of EMG – A Practical Introduction to Kinesiological Electromyography Page 32
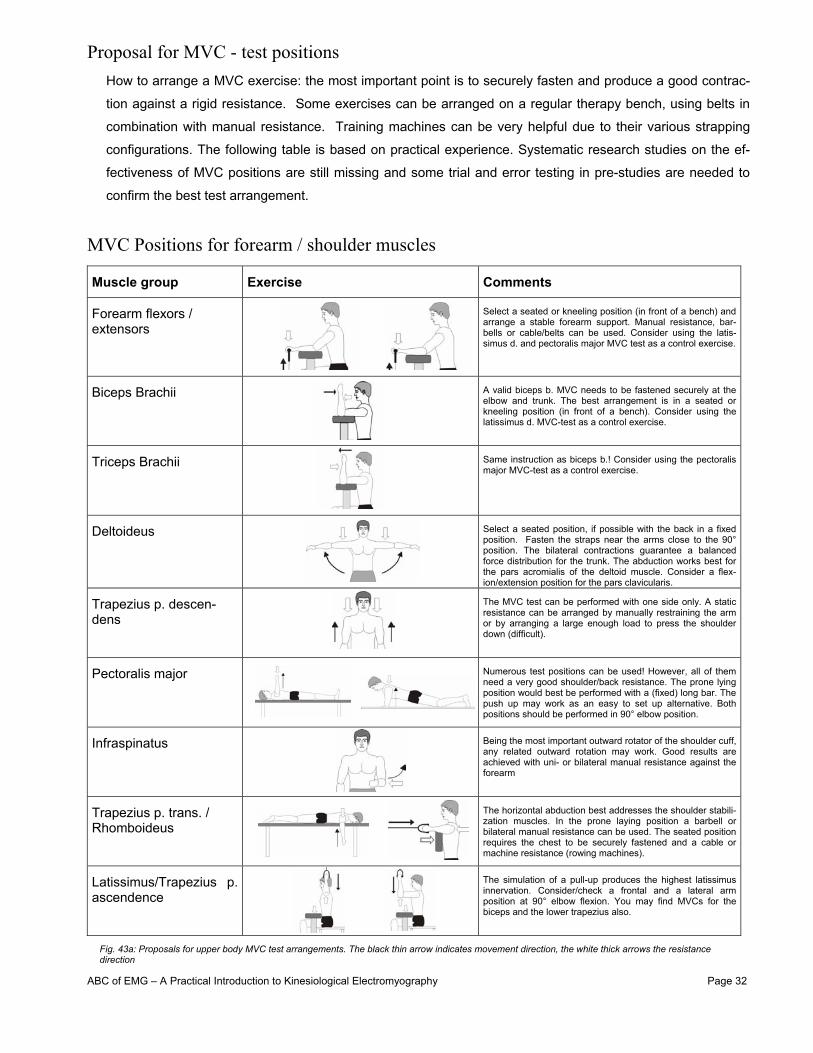
Proposal for MVC - test positions How to arrange a MVC exercise: the most important point is to securely fasten and produce a good contrac-
tion against a rigid resistance. Some exercises can be arranged on a regular therapy bench, using belts in
combination with manual resistance. Training machines can be very helpful due to their various strapping
configurations. The following table is based on practical experience. Systematic research studies on the ef-
fectiveness of MVC positions are still missing and some trial and error testing in pre-studies are needed to
confirm the best test arrangement.
MVC Positions for forearm / shoulder muscles
Muscle group Exercise Comments
Forearm flexors / extensors
Select a seated or kneeling position (in front of a bench) and arrange a stable forearm support. Manual resistance, bar-bells or cable/belts can be used. Consider using the latis-simus d. and pectoralis major MVC test as a control exercise.
Biceps Brachii
A valid biceps b. MVC needs to be fastened securely at the elbow and trunk. The best arrangement is in a seated or kneeling position (in front of a bench). Consider using the latissimus d. MVC-test as a control exercise.
Triceps Brachii
Same instruction as biceps b.! Consider using the pectoralis major MVC-test as a control exercise.
Deltoideus
Select a seated position, if possible with the back in a fixed position. Fasten the straps near the arms close to the 90° position. The bilateral contractions guarantee a balanced force distribution for the trunk. The abduction works best for the pars acromialis of the deltoid muscle. Consider a flex-ion/extension position for the pars clavicularis.
Trapezius p. descen-dens
The MVC test can be performed with one side only. A static resistance can be arranged by manually restraining the arm or by arranging a large enough load to press the shoulder down (difficult).
Pectoralis major
Numerous test positions can be used! However, all of them need a very good shoulder/back resistance. The prone lying position would best be performed with a (fixed) long bar. The push up may work as an easy to set up alternative. Both positions should be performed in 90° elbow position.
Infraspinatus
Being the most important outward rotator of the shoulder cuff, any related outward rotation may work. Good results are achieved with uni- or bilateral manual resistance against the forearm
Trapezius p. trans. / Rhomboideus
The horizontal abduction best addresses the shoulder stabili-zation muscles. In the prone laying position a barbell or bilateral manual resistance can be used. The seated position requires the chest to be securely fastened and a cable or machine resistance (rowing machines).
Latissimus/Trapezius p. ascendence
The simulation of a pull-up produces the highest latissimus innervation. Consider/check a frontal and a lateral arm position at 90° elbow flexion. You may find MVCs for the biceps and the lower trapezius also.
Fig. 43a: Proposals for upper body MVC test arrangements. The black thin arrow indicates movement direction, the white thick arrows the resistance direction
ABC of EMG – A Practical Introduction to Kinesiological Electromyography Page 33
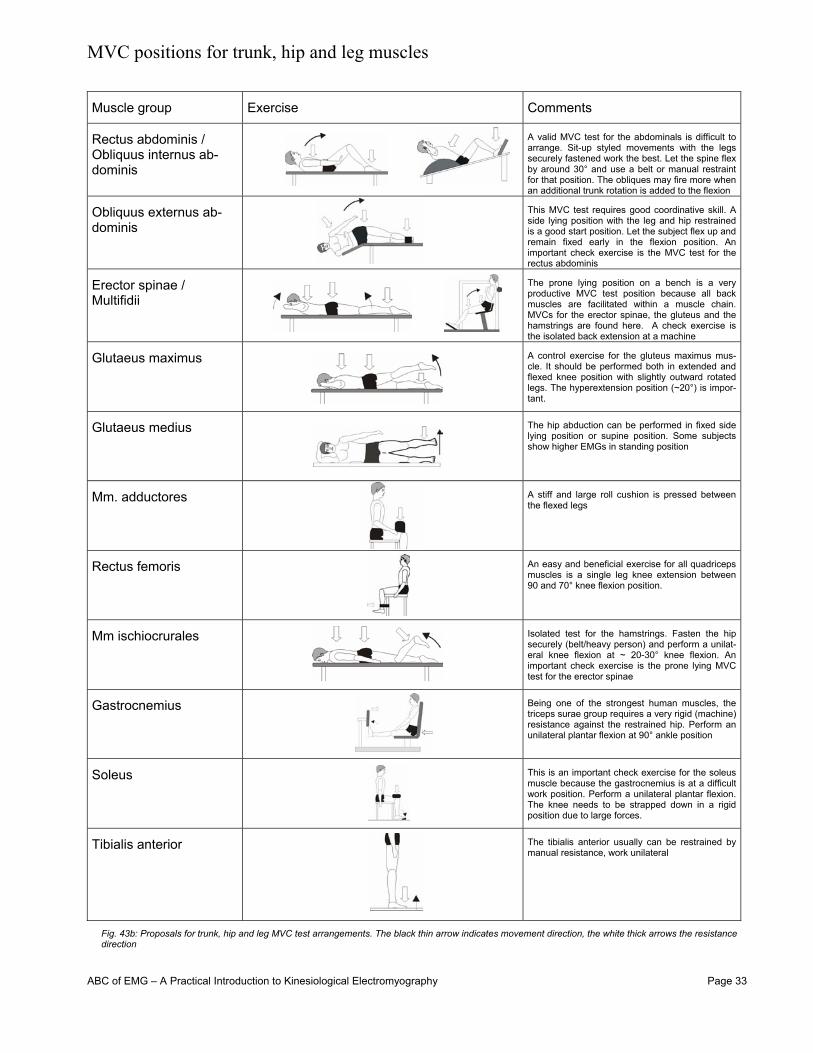
MVC positions for trunk, hip and leg muscles Muscle group Exercise Comments
Rectus abdominis / Obliquus internus ab-dominis
A valid MVC test for the abdominals is difficult to arrange. Sit-up styled movements with the legs securely fastened work the best. Let the spine flex by around 30° and use a belt or manual restraint for that position. The obliques may fire more when an additional trunk rotation is added to the flexion
Obliquus externus ab-dominis
This MVC test requires good coordinative skill. A side lying position with the leg and hip restrained is a good start position. Let the subject flex up and remain fixed early in the flexion position. An important check exercise is the MVC test for the rectus abdominis
Erector spinae / Multifidii
The prone lying position on a bench is a very productive MVC test position because all back muscles are facilitated within a muscle chain. MVCs for the erector spinae, the gluteus and the hamstrings are found here. A check exercise is the isolated back extension at a machine
Glutaeus maximus
A control exercise for the gluteus maximus mus-cle. It should be performed both in extended and flexed knee position with slightly outward rotated legs. The hyperextension position (~20°) is impor-tant.
Glutaeus medius
The hip abduction can be performed in fixed side lying position or supine position. Some subjects show higher EMGs in standing position
Mm. adductores
A stiff and large roll cushion is pressed between the flexed legs
Rectus femoris
An easy and beneficial exercise for all quadriceps muscles is a single leg knee extension between 90 and 70° knee flexion position.
Mm ischiocrurales
Isolated test for the hamstrings. Fasten the hip securely (belt/heavy person) and perform a unilat-eral knee flexion at ~ 20-30° knee flexion. An important check exercise is the prone lying MVC test for the erector spinae
Gastrocnemius
Being one of the strongest human muscles, the triceps surae group requires a very rigid (machine) resistance against the restrained hip. Perform an unilateral plantar flexion at 90° ankle position
Soleus
This is an important check exercise for the soleus muscle because the gastrocnemius is at a difficult work position. Perform a unilateral plantar flexion. The knee needs to be strapped down in a rigid position due to large forces.
Tibialis anterior
The tibialis anterior usually can be restrained by manual resistance, work unilateral
Fig. 43b: Proposals for trunk, hip and leg MVC test arrangements. The black thin arrow indicates movement direction, the white thick arrows the resistance direction
ABC of EMG – A Practical Introduction to Kinesiological Electromyography Page 34
Benefits of MVC-normalization One important benefit MVC normalized data provides is the estimation of neuromuscular effort “invested” or
needed for a given task or exercise. On the microvolt level, it is impossible to estimate the neuromuscular
demand because these data are too strongly influenced by the individual signal detection condition. Any
“normative” amplitude data published in microvolt values must be used with very special care! MVC normal-
ized data provide an understanding at what capacity level the muscles worked, how effective a training exer-
cise “reached” the muscles or how much demand ergonomically a work task is asking from a worker.
The other significant benefit of MVC-normalization is the rescaling to percent of a reference value unique and
standardized for all subjects within a study. It eliminates any varying influence of local signal detection condi-
tions. This again allows a direct quantitative comparison of EMG findings between subjects. Group statistics
and normative data can be developed and statistically be verified.
Drawbacks of MVC-normalization The MVC concept can only be used in studies done with healthy and trained subjects. And even here, some
uncertainties have to be considered: is the subject able to perform a valid trial, did the test exercise correctly
“catch” the muscle and is the selected muscle length representative for dynamic movements etc.? Very often
supramaximal EMG data can be observed for submaximal dynamic activities. Unfortunately this phenomenon
is not systematically addressed by scientific studies and numerous factors may be responsible for it, e.g.:
• Changes in the muscle length due to dynamic movements
• Using a MVC window instead of a peak data point
• Motor unit synchronization and increased electrical superposition within submaximal movements
As mentioned previously, valid MVC data can only be produced with healthy subjects, which were prepared
(trained) for the MVC test series. This may make the methodological organization of a study very demanding
and time consuming. Consider a 16 channel EMG measurement with one repeated trial; the efforts needed
to perform an appropriate MVC test series easily need one hour of preparation. Most reviewers in scientific
journals ask for MVC or any other normalization by default. But as a note of caution, the reader should be
aware that MVC tests easily get invalid and produce more data instability/invalidity instead of benefits.
Changing the analysis philosophy often makes normalization unnecessary (see analysis chapters below).
Especially when working with patient groups, one cannot expect a valid MVC trial at all. In most clinical
cases, it is better to stay at the microvolt scaling but ensure a very well prepared and standardized skin-
/electrode preparation and accept a certain amount of “error” produced by varying detection conditions. In
side comparison or repeated day to day tests done with one subject, a rough guideline may be to consider 10
to 15% per se variance due to differing detection condition. However, caution is needed if subjects are com-
pared: at extremes the difference can easily be several hundred percent! EMG patient findings that are not
normalized should be analyzed with qualitative scales, direct comparison muscle activity of the same muscle
in different test positions, or qualitative description of the curves characteristics within a movement cycle
(”muscle behavior”).

ABC of EMG – A Practical Introduction to Kinesiological Electromyography Page 35
Amplitude normalization internal mean or peak value
For ensemble average EMG curves (see next chapter) some researchers recommend the amplitude
normalization (based on smoothed rectified EMG) be set to mean value found within each test/exercise/trial
(Fig. 44). The main effect is a reduction of the variability, expressed in smaller coefficients of variance (12,
see Fig. 45). This may have statistical benefits, such as reduced standard deviation range, but since this
normalization method (like any other method) does not change the shape and ratios within the averaged
EMG curve, the true benefit is academic and of lesser practical relevance.
Alternatively, the peak value can be used as a reference point (Fig. 44). Both methods have the big drawback
that any (at least qualitative) information about the innervation level is eliminated, e.g. an activation curve
near the maximum capacity receives the same dimension as a low level contraction. Any comparison be-
tween trials of the same subject and channel will loose the innervation ratio, which is a very important analy-
sis factor for EMG findings. Both normalization methods allow the study of the innervation behavior or devel-
opment of EMG pattern within the investigated repetition cycle (typically gait analysis).
Other normalization methods Other methods are reported (10), such as using the EMG innervation of a task specific reference activity (e.g. holding the arms in 90° abduction and normalizing the trapezius and deltoid EMG to this position). This approach is very critical and may even add confusion because one will never know about the given individual’s relative or coordinated (EMG) input within the reference activity. An alternative concept to MVC normalization is the nor-malization to submaximal EMG levels. This is only practical if the force output can be determined: given the case the subject is able to perform a maximum (force-) effort; the EMG level of e.g. 40% of max force is used for nor-malization.
100%
Averaged Curve
100%
Averaged Curve
Time normalized cycle [%] Time normalized cycle [%]
Mic
row
olt
Mic
row
olt
Normalizatio to Mean
Normalizatio to Peak
100%
Averaged Curve
100%
Averaged Curve
Time normalized cycle [%] Time normalized cycle [%]
Mic
row
olt
Mic
row
olt
Normalizatio to Mean
Normalizatio to Peak
0
100
200
300
400
500
0
100
200
300
400
Mic
row
olt
NO
RM
ALI
ZED
(%)
MEDIAL GASTROCNEMIUS
N= 25CV= 66.4%
N= 25CV= 55.3%
% OF STRIDE % OF STRIDE0 100 0 1000
100
200
300
400
500
0
100
200
300
400
Mic
row
olt
NO
RM
ALI
ZED
(%)
MEDIAL GASTROCNEMIUS
N= 25CV= 66.4%
N= 25CV= 55.3%
% OF STRIDE % OF STRIDE0 100 0 100
Fig. 44: Amplitude normalization to the test internal mean (left) or peak value (right) of the averaged curve.
Fig. 45: Comparison of microvolt vs. mean value normalized ensemble averages of the medial gastrocnemius. The shape of the curve is not altered, but the variance (CV-coefficient of variance) is reduced due to mean normalization (left). Redrawn from 11, p. 64
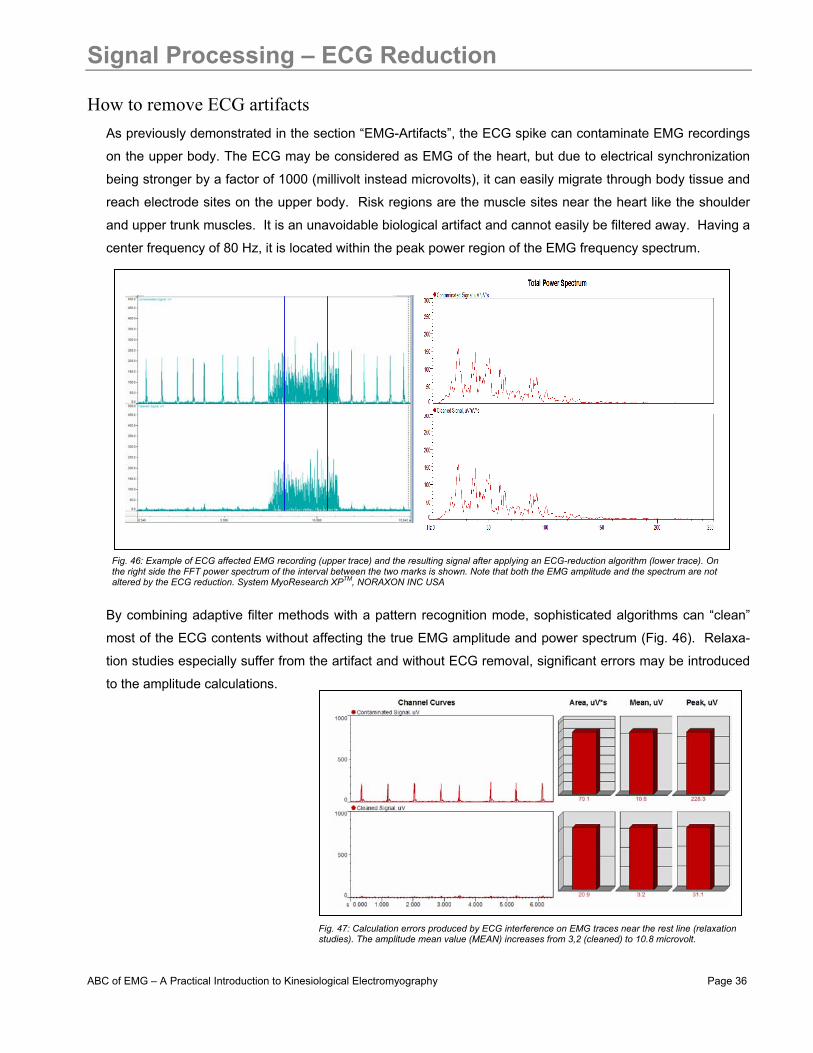
ABC of EMG – A Practical Introduction to Kinesiological Electromyography Page 36
Signal Processing – ECG Reduction
How to remove ECG artifacts As previously demonstrated in the section “EMG-Artifacts”, the ECG spike can contaminate EMG recordings
on the upper body. The ECG may be considered as EMG of the heart, but due to electrical synchronization
being stronger by a factor of 1000 (millivolt instead microvolts), it can easily migrate through body tissue and
reach electrode sites on the upper body. Risk regions are the muscle sites near the heart like the shoulder
and upper trunk muscles. It is an unavoidable biological artifact and cannot easily be filtered away. Having a
center frequency of 80 Hz, it is located within the peak power region of the EMG frequency spectrum.
By combining adaptive filter methods with a pattern recognition mode, sophisticated algorithms can “clean”
most of the ECG contents without affecting the true EMG amplitude and power spectrum (Fig. 46). Relaxa-
tion studies especially suffer from the artifact and without ECG removal, significant errors may be introduced
to the amplitude calculations.
Fig. 46: Example of ECG affected EMG recording (upper trace) and the resulting signal after applying an ECG-reduction algorithm (lower trace). On the right side the FFT power spectrum of the interval between the two marks is shown. Note that both the EMG amplitude and the spectrum are not altered by the ECG reduction. System MyoResearch XPTM, NORAXON INC USA
Fig. 47: Calculation errors produced by ECG interference on EMG traces near the rest line (relaxation studies). The amplitude mean value (MEAN) increases from 3,2 (cleaned) to 10.8 microvolt.
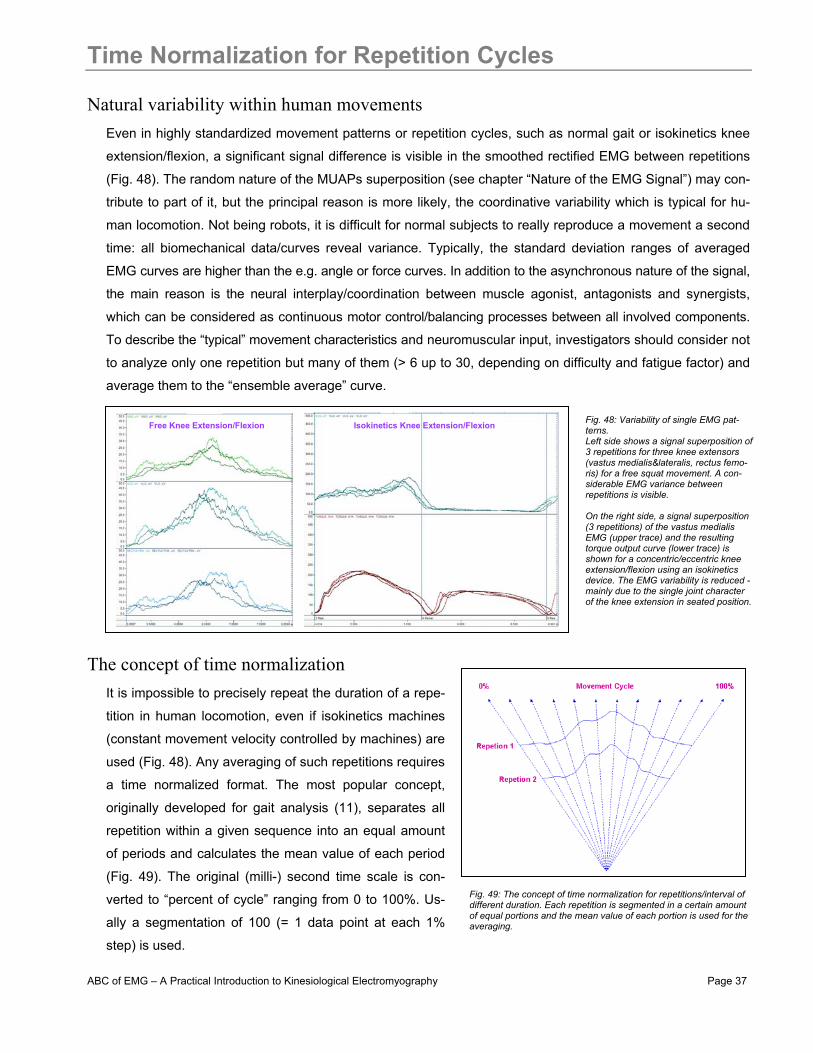
ABC of EMG – A Practical Introduction to Kinesiological Electromyography Page 37
Time Normalization for Repetition Cycles
Natural variability within human movements Even in highly standardized movement patterns or repetition cycles, such as normal gait or isokinetics knee
extension/flexion, a significant signal difference is visible in the smoothed rectified EMG between repetitions
(Fig. 48). The random nature of the MUAPs superposition (see chapter “Nature of the EMG Signal”) may con-
tribute to part of it, but the principal reason is more likely, the coordinative variability which is typical for hu-
man locomotion. Not being robots, it is difficult for normal subjects to really reproduce a movement a second
time: all biomechanical data/curves reveal variance. Typically, the standard deviation ranges of averaged
EMG curves are higher than the e.g. angle or force curves. In addition to the asynchronous nature of the signal,
the main reason is the neural interplay/coordination between muscle agonist, antagonists and synergists,
which can be considered as continuous motor control/balancing processes between all involved components.
To describe the “typical” movement characteristics and neuromuscular input, investigators should consider not
to analyze only one repetition but many of them (> 6 up to 30, depending on difficulty and fatigue factor) and
average them to the “ensemble average” curve.
The concept of time normalization It is impossible to precisely repeat the duration of a repe-
tition in human locomotion, even if isokinetics machines
(constant movement velocity controlled by machines) are
used (Fig. 48). Any averaging of such repetitions requires
a time normalized format. The most popular concept,
originally developed for gait analysis (11), separates all
repetition within a given sequence into an equal amount
of periods and calculates the mean value of each period
(Fig. 49). The original (milli-) second time scale is con-
verted to “percent of cycle” ranging from 0 to 100%. Us-
ally a segmentation of 100 (= 1 data point at each 1%
step) is used.
Free Knee Extension/Flexion Isokinetics Knee Extension/Flexion Fig. 48: Variability of single EMG pat-terns. Left side shows a signal superposition of 3 repetitions for three knee extensors (vastus medialis&lateralis, rectus femo-ris) for a free squat movement. A con-siderable EMG variance between repetitions is visible. On the right side, a signal superposition (3 repetitions) of the vastus medialis EMG (upper trace) and the resulting torque output curve (lower trace) is shown for a concentric/eccentric knee extension/flexion using an isokinetics device. The EMG variability is reduced - mainly due to the single joint character of the knee extension in seated position.
Fig. 49: The concept of time normalization for repetitions/interval of different duration. Each repetition is segmented in a certain amount of equal portions and the mean value of each portion is used for the averaging.
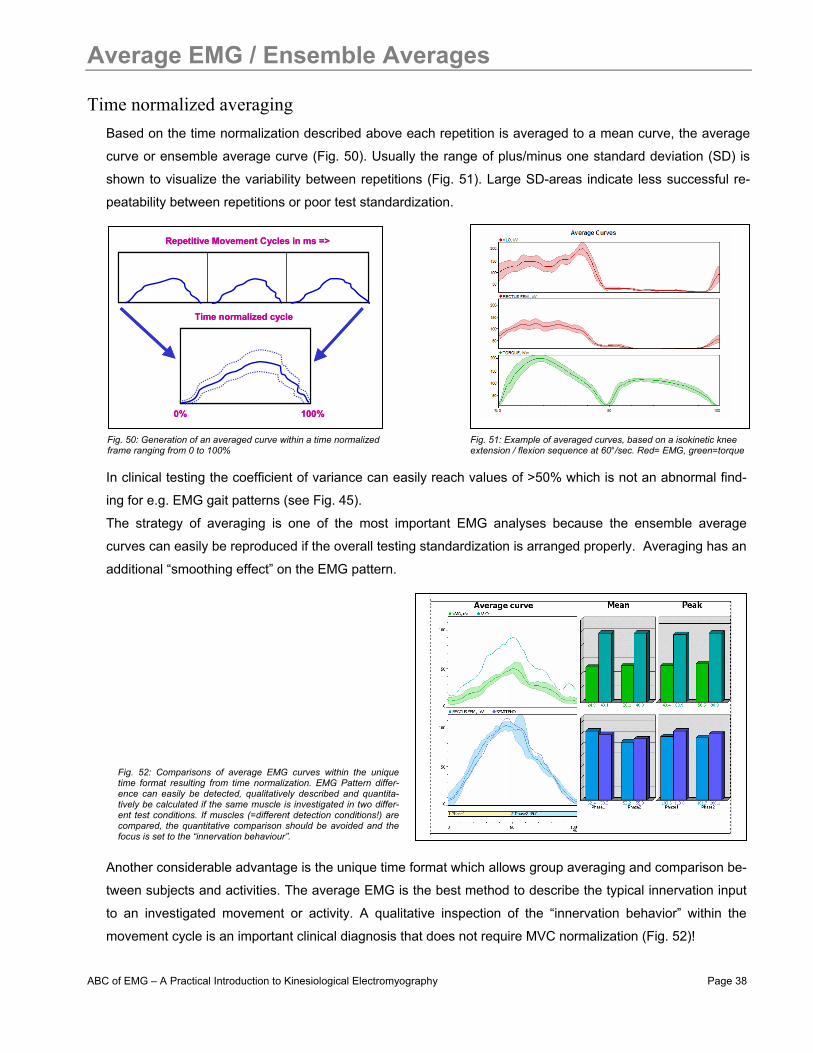
ABC of EMG – A Practical Introduction to Kinesiological Electromyography Page 38
Average EMG / Ensemble Averages
Time normalized averaging Based on the time normalization described above each repetition is averaged to a mean curve, the average
curve or ensemble average curve (Fig. 50). Usually the range of plus/minus one standard deviation (SD) is
shown to visualize the variability between repetitions (Fig. 51). Large SD-areas indicate less successful re-
peatability between repetitions or poor test standardization.
In clinical testing the coefficient of variance can easily reach values of >50% which is not an abnormal find-
ing for e.g. EMG gait patterns (see Fig. 45). The strategy of averaging is one of the most important EMG analyses because the ensemble average
curves can easily be reproduced if the overall testing standardization is arranged properly. Averaging has an
additional “smoothing effect” on the EMG pattern.
Another considerable advantage is the unique time format which allows group averaging and comparison be-
tween subjects and activities. The average EMG is the best method to describe the typical innervation input
to an investigated movement or activity. A qualitative inspection of the “innervation behavior” within the
movement cycle is an important clinical diagnosis that does not require MVC normalization (Fig. 52)!
Time normalized cycle
0%
Repetitive Movement Cycles in ms =>
100%
Time normalized cycle
0%
Repetitive Movement Cycles in ms =>
100% Fig. 50: Generation of an averaged curve within a time normalized frame ranging from 0 to 100%
Fig. 51: Example of averaged curves, based on a isokinetic knee extension / flexion sequence at 60°/sec. Red= EMG, green=torque
Fig. 52: Comparisons of average EMG curves within the unique time format resulting from time normalization. EMG Pattern differ-ence can easily be detected, qualitatively described and quantita-tively be calculated if the same muscle is investigated in two differ-ent test conditions. If muscles (=different detection conditions!) are compared, the quantitative comparison should be avoided and the focus is set to the “innervation behaviour”.
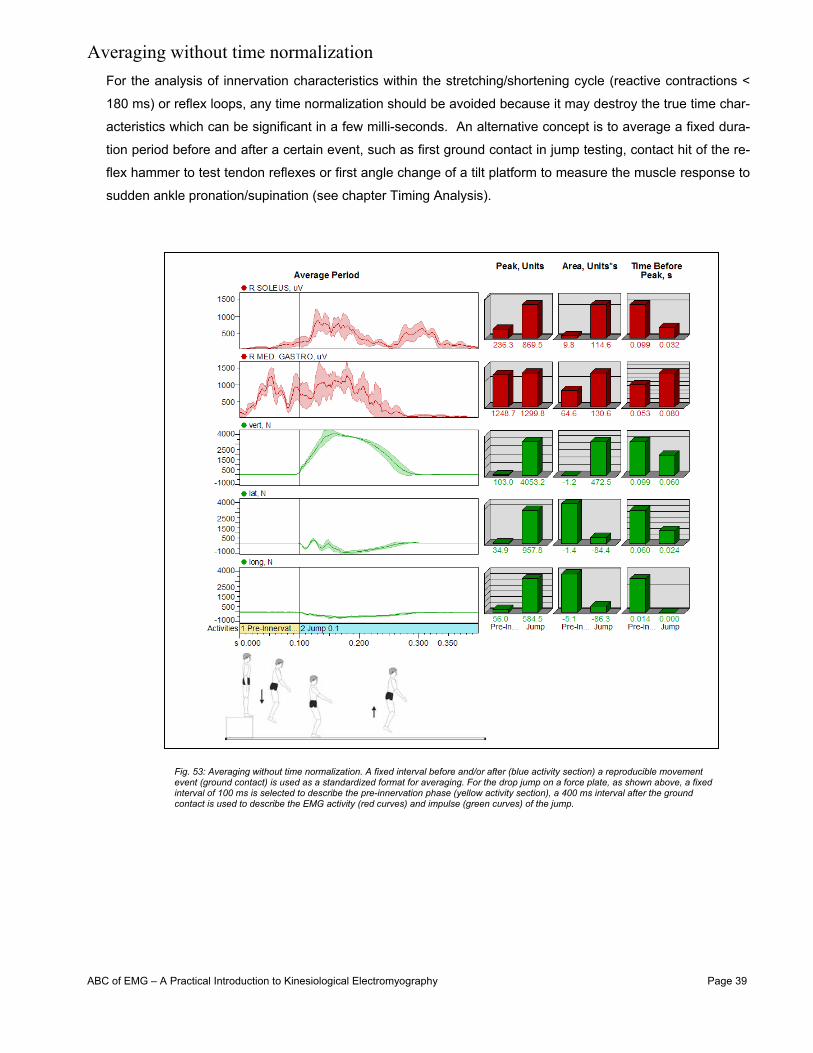
ABC of EMG – A Practical Introduction to Kinesiological Electromyography Page 39
Averaging without time normalization For the analysis of innervation characteristics within the stretching/shortening cycle (reactive contractions <
180 ms) or reflex loops, any time normalization should be avoided because it may destroy the true time char-
acteristics which can be significant in a few milli-seconds. An alternative concept is to average a fixed dura-
tion period before and after a certain event, such as first ground contact in jump testing, contact hit of the re-
flex hammer to test tendon reflexes or first angle change of a tilt platform to measure the muscle response to
sudden ankle pronation/supination (see chapter Timing Analysis).
Fig. 53: Averaging without time normalization. A fixed interval before and/or after (blue activity section) a reproducible movement event (ground contact) is used as a standardized format for averaging. For the drop jump on a force plate, as shown above, a fixed interval of 100 ms is selected to describe the pre-innervation phase (yellow activity section), a 400 ms interval after the ground contact is used to describe the EMG activity (red curves) and impulse (green curves) of the jump.
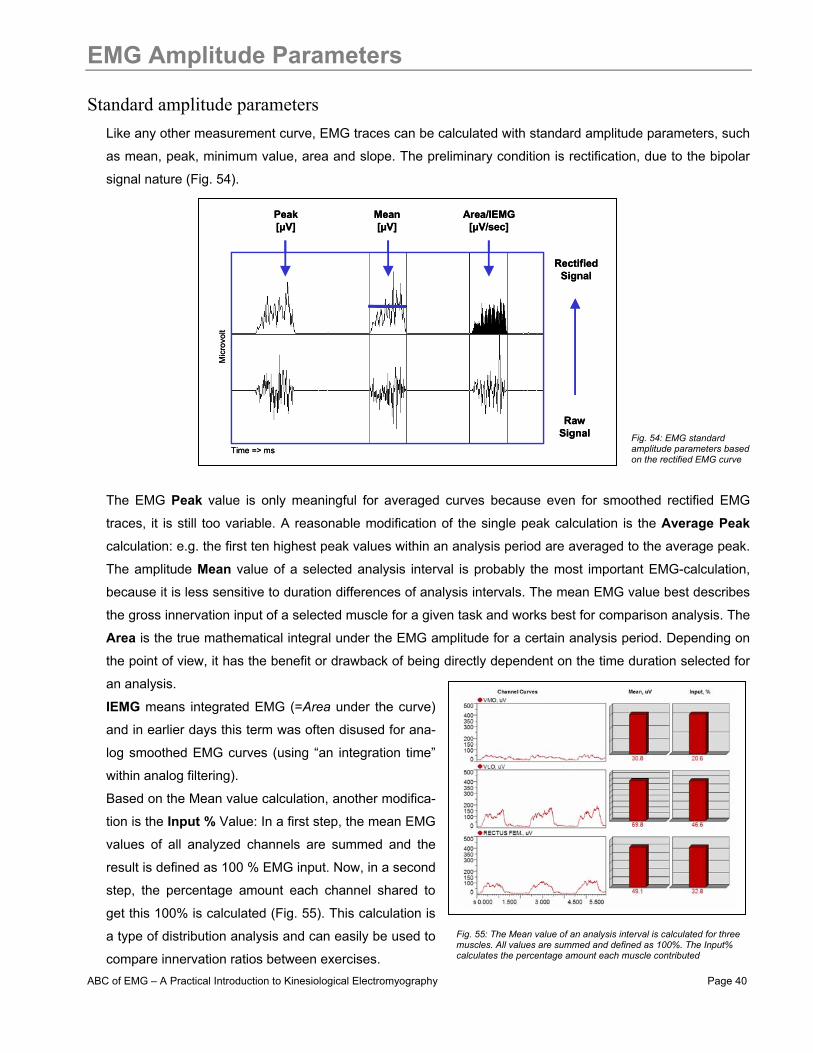
ABC of EMG – A Practical Introduction to Kinesiological Electromyography Page 40
EMG Amplitude Parameters
Standard amplitude parameters Like any other measurement curve, EMG traces can be calculated with standard amplitude parameters, such
as mean, peak, minimum value, area and slope. The preliminary condition is rectification, due to the bipolar
signal nature (Fig. 54).
The EMG Peak value is only meaningful for averaged curves because even for smoothed rectified EMG
traces, it is still too variable. A reasonable modification of the single peak calculation is the Average Peak
calculation: e.g. the first ten highest peak values within an analysis period are averaged to the average peak.
The amplitude Mean value of a selected analysis interval is probably the most important EMG-calculation,
because it is less sensitive to duration differences of analysis intervals. The mean EMG value best describes
the gross innervation input of a selected muscle for a given task and works best for comparison analysis. The
Area is the true mathematical integral under the EMG amplitude for a certain analysis period. Depending on
the point of view, it has the benefit or drawback of being directly dependent on the time duration selected for
an analysis.
IEMG means integrated EMG (=Area under the curve)
and in earlier days this term was often disused for ana-
log smoothed EMG curves (using “an integration time”
within analog filtering).
Based on the Mean value calculation, another modifica-
tion is the Input % Value: In a first step, the mean EMG
values of all analyzed channels are summed and the
result is defined as 100 % EMG input. Now, in a second
step, the percentage amount each channel shared to
get this 100% is calculated (Fig. 55). This calculation is
a type of distribution analysis and can easily be used to
compare innervation ratios between exercises.
Peak[µV]
RawSignal
Mean[µV]
Area/IEMG[µV/sec]
RectifiedSignal
Time => ms
Mic
rovo
ltPeak[µV]
RawSignal
Mean[µV]
Area/IEMG[µV/sec]
RectifiedSignal
Time => ms
Mic
rovo
lt
Fig. 54: EMG standard amplitude parameters based on the rectified EMG curve
Fig. 55: The Mean value of an analysis interval is calculated for three muscles. All values are summed and defined as 100%. The Input% calculates the percentage amount each muscle contributed
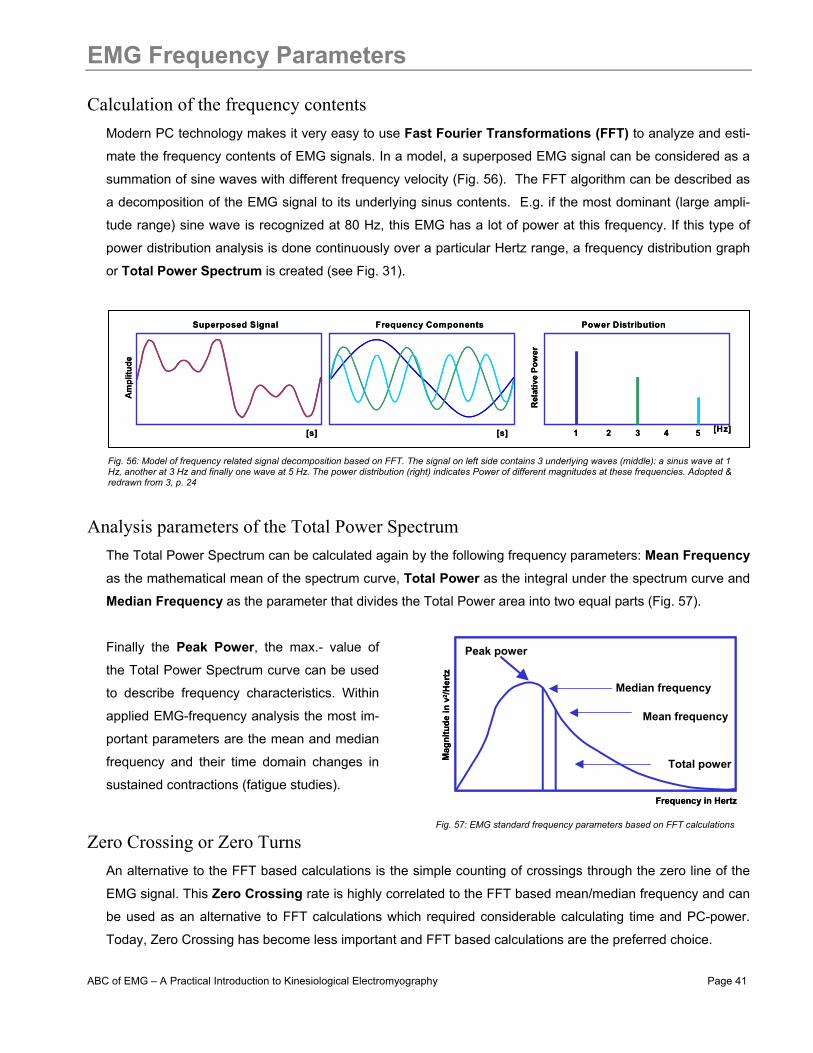
ABC of EMG – A Practical Introduction to Kinesiological Electromyography Page 41
EMG Frequency Parameters
Calculation of the frequency contents Modern PC technology makes it very easy to use Fast Fourier Transformations (FFT) to analyze and esti-
mate the frequency contents of EMG signals. In a model, a superposed EMG signal can be considered as a
summation of sine waves with different frequency velocity (Fig. 56). The FFT algorithm can be described as
a decomposition of the EMG signal to its underlying sinus contents. E.g. if the most dominant (large ampli-
tude range) sine wave is recognized at 80 Hz, this EMG has a lot of power at this frequency. If this type of
power distribution analysis is done continuously over a particular Hertz range, a frequency distribution graph
or Total Power Spectrum is created (see Fig. 31).
Analysis parameters of the Total Power Spectrum The Total Power Spectrum can be calculated again by the following frequency parameters: Mean Frequency
as the mathematical mean of the spectrum curve, Total Power as the integral under the spectrum curve and
Median Frequency as the parameter that divides the Total Power area into two equal parts (Fig. 57).
Finally the Peak Power, the max.- value of
the Total Power Spectrum curve can be used
to describe frequency characteristics. Within
applied EMG-frequency analysis the most im-
portant parameters are the mean and median
frequency and their time domain changes in
sustained contractions (fatigue studies).
Zero Crossing or Zero Turns An alternative to the FFT based calculations is the simple counting of crossings through the zero line of the
EMG signal. This Zero Crossing rate is highly correlated to the FFT based mean/median frequency and can
be used as an alternative to FFT calculations which required considerable calculating time and PC-power.
Today, Zero Crossing has become less important and FFT based calculations are the preferred choice.
Frequency in Hertz
Mag
nit u
d e in
v2 / H
e rtz
Median frequency
Mean frequency
Peak power
Total power
Frequency in Hertz
Mag
nit u
d e in
v2 / H
e rtz
Median frequency
Mean frequency
Peak power
Total power
Am
plitu
de
Rel
ativ
e Po
wer
[s] [Hz][s] 1 3 52 4
Superposed Signal Frequency Components Power Distribution
Am
plitu
de
Rel
ativ
e Po
wer
[s] [Hz][s] 1 3 52 4
Superposed Signal Frequency Components Power Distribution
Fig. 56: Model of frequency related signal decomposition based on FFT. The signal on left side contains 3 underlying waves (middle): a sinus wave at 1 Hz, another at 3 Hz and finally one wave at 5 Hz. The power distribution (right) indicates Power of different magnitudes at these frequencies. Adopted & redrawn from 3, p. 24
Fig. 57: EMG standard frequency parameters based on FFT calculations
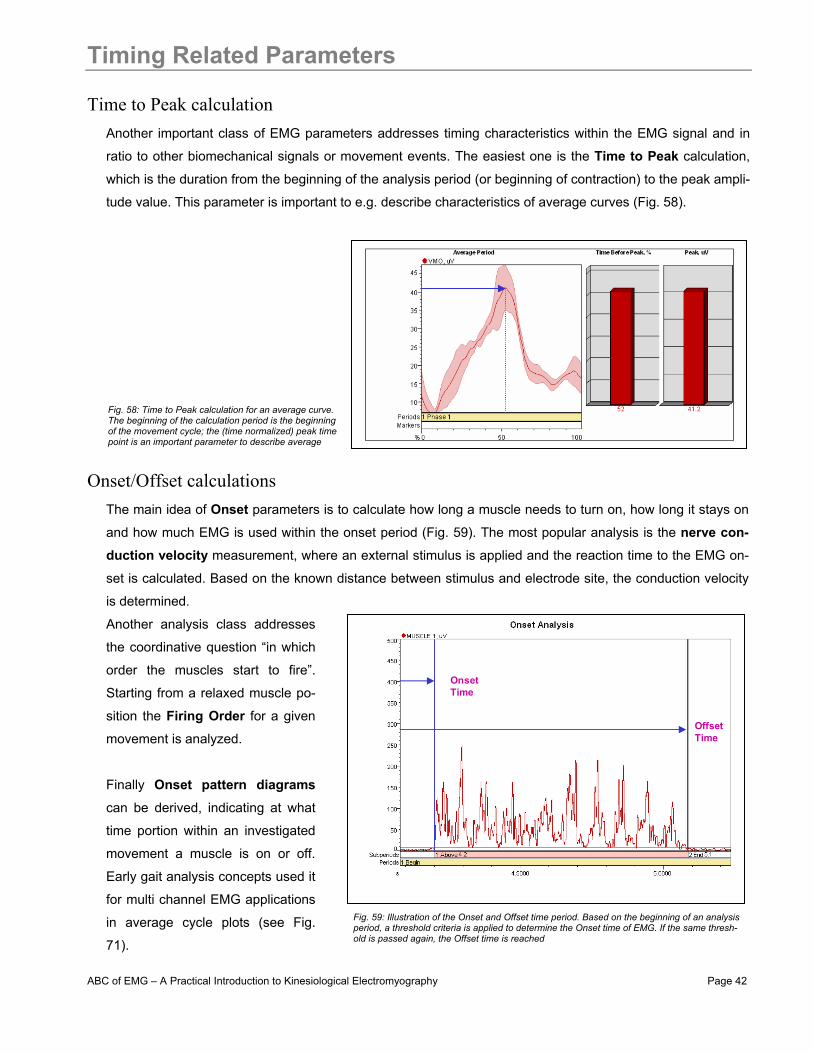
ABC of EMG – A Practical Introduction to Kinesiological Electromyography Page 42
Timing Related Parameters
Time to Peak calculation Another important class of EMG parameters addresses timing characteristics within the EMG signal and in
ratio to other biomechanical signals or movement events. The easiest one is the Time to Peak calculation,
which is the duration from the beginning of the analysis period (or beginning of contraction) to the peak ampli-
tude value. This parameter is important to e.g. describe characteristics of average curves (Fig. 58).
Onset/Offset calculations The main idea of Onset parameters is to calculate how long a muscle needs to turn on, how long it stays on
and how much EMG is used within the onset period (Fig. 59). The most popular analysis is the nerve con-duction velocity measurement, where an external stimulus is applied and the reaction time to the EMG on-
set is calculated. Based on the known distance between stimulus and electrode site, the conduction velocity
is determined.
Another analysis class addresses
the coordinative question “in which
order the muscles start to fire”.
Starting from a relaxed muscle po-
sition the Firing Order for a given
movement is analyzed.
Finally Onset pattern diagrams
can be derived, indicating at what
time portion within an investigated
movement a muscle is on or off.
Early gait analysis concepts used it
for multi channel EMG applications
in average cycle plots (see Fig.
71).
OnsetTime
OffsetTime
Fig. 58: Time to Peak calculation for an average curve. The beginning of the calculation period is the beginning of the movement cycle; the (time normalized) peak time point is an important parameter to describe average
Fig. 59: Illustration of the Onset and Offset time period. Based on the beginning of an analysis period, a threshold criteria is applied to determine the Onset time of EMG. If the same thresh-old is passed again, the Offset time is reached
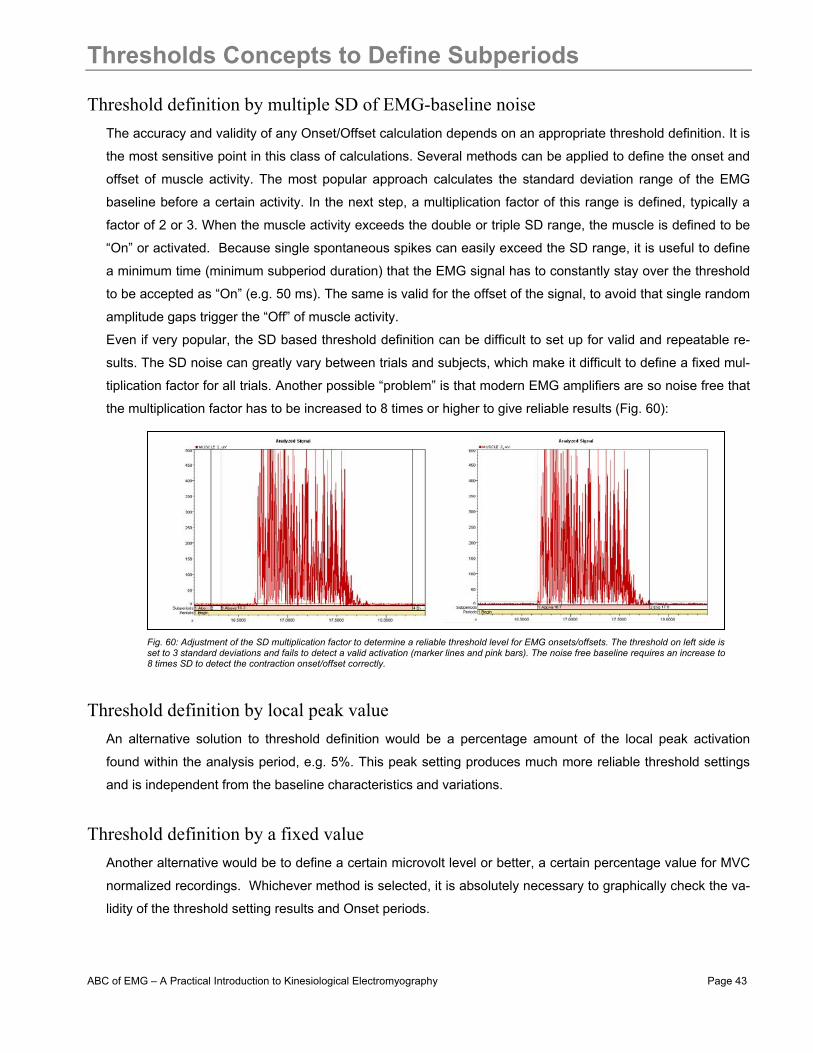
ABC of EMG – A Practical Introduction to Kinesiological Electromyography Page 43
Thresholds Concepts to Define Subperiods
Threshold definition by multiple SD of EMG-baseline noise The accuracy and validity of any Onset/Offset calculation depends on an appropriate threshold definition. It is
the most sensitive point in this class of calculations. Several methods can be applied to define the onset and
offset of muscle activity. The most popular approach calculates the standard deviation range of the EMG
baseline before a certain activity. In the next step, a multiplication factor of this range is defined, typically a
factor of 2 or 3. When the muscle activity exceeds the double or triple SD range, the muscle is defined to be
“On” or activated. Because single spontaneous spikes can easily exceed the SD range, it is useful to define
a minimum time (minimum subperiod duration) that the EMG signal has to constantly stay over the threshold
to be accepted as “On” (e.g. 50 ms). The same is valid for the offset of the signal, to avoid that single random
amplitude gaps trigger the “Off” of muscle activity.
Even if very popular, the SD based threshold definition can be difficult to set up for valid and repeatable re-
sults. The SD noise can greatly vary between trials and subjects, which make it difficult to define a fixed mul-
tiplication factor for all trials. Another possible “problem” is that modern EMG amplifiers are so noise free that
the multiplication factor has to be increased to 8 times or higher to give reliable results (Fig. 60):
Threshold definition by local peak value An alternative solution to threshold definition would be a percentage amount of the local peak activation
found within the analysis period, e.g. 5%. This peak setting produces much more reliable threshold settings
and is independent from the baseline characteristics and variations.
Threshold definition by a fixed value Another alternative would be to define a certain microvolt level or better, a certain percentage value for MVC
normalized recordings. Whichever method is selected, it is absolutely necessary to graphically check the va-
lidity of the threshold setting results and Onset periods.
Fig. 60: Adjustment of the SD multiplication factor to determine a reliable threshold level for EMG onsets/offsets. The threshold on left side is set to 3 standard deviations and fails to detect a valid activation (marker lines and pink bars). The noise free baseline requires an increase to 8 times SD to detect the contraction onset/offset correctly.

ABC of EMG – A Practical Introduction to Kinesiological Electromyography Page 44
EMG To Force Ratio
The relationship between EMG input and force output EMG activation is the preliminary condition for any force development and one can expect a very close rela-
tionship between both measures. Indeed, there is a very high correlation between both parameters, but un-
fortunately it can greatly vary within its characteristics. The typical case is a curvi-linear relationship: at higher
force portions, proportional more EMG is needed to increase force (Fig. 61):
For certain conditions within static force testing (both EMG and Force are normalized to its maximum value)
some (smaller) muscles tend to show true linear EMG-Force relationship (Fig. 61, right diagram). The investi-
gation of such relationships is important if EMG needs to assist torque calculations in biomechanical models.
Under a more practical point of view, e.g. in clinical treatment procedures, one can safely derive that with any
EMG increase, the torque and compression force around a joint increase in a similar fashion.
The EMG-Force ratio can be used to de-
termine the neuromuscular (training)
status of a muscle. Within static contrac-
tions with constantly increasing force
output (ramping), well-trained muscles
show a clear right shift of the ratio, atro-
phic or very untrained muscles show a
left shift (Fig. 62).
0
0.5
1.0
0 50 100
Relative static force F/FmaxStatic force F (kgf)
EMG
act
ivity
(arb
itrar
y un
its)
0.5
1.0
0 10 20 30 40
α
G
0
A
B C
0
0.5
1.0
0 50 100
Relative static force F/FmaxStatic force F (kgf)
EMG
act
ivity
(arb
itrar
y un
its)
0.5
1.0
0 10 20 30 40
α
G
0
A
B C
NO
RM
ALIZ
ED M
YOEL
ECTR
IC S
IGN
AL(R
MS
AMPL
ITU
DE)
FORCE(% OF MAXIMAL VOLUNTARY CONTRACTION)
BICEPS (N=61)DELTOID (N=76)FDI (N=43)
20
40 60 80
40
60
80
100
20
NO
RM
ALIZ
ED M
YOEL
ECTR
IC S
IGN
AL(R
MS
AMPL
ITU
DE)
FORCE(% OF MAXIMAL VOLUNTARY CONTRACTION)
BICEPS (N=61)DELTOID (N=76)FDI (N=43)
20
40 60 80
40
60
80
100
20
EMG
Act
ivity at
roph
y
fatig
ue
concen
tric
static
eccentric
trained
FORCE PRODUCTION LEVEL
Fig. 61: Two classical static EMG/force experiments: The left figure (adopted & redrawn from 10, p. 110) shows the dependency of the EMG/force ratio from angle position (A,B), which can be eliminated by normalization of the MVC of force. The right figure (redrawn from 2, p. 193) shows EMG/force ratios of 3 different muscles for MVC normalized EMG and force output data
Fig. 62: Schematic EMG/force relationship in ramp contrac-tions. Depending on the muscle condition and training status, the ratio can change. Trained muscles need less EMG for a given force output than atrophic or fatigued muscles.

ABC of EMG – A Practical Introduction to Kinesiological Electromyography Page 45
EMG as a Biomechanical Method
The role of EMG within biomechanical studies and setups The world of biomechanical measurement method can basically be separated to 4 major areas: Anthropome-
try, Kinematics, Kinetics and Kinesiological EMG (Fig. 63). The important role of EMG is the objective evalua-
tion of the neuromuscular activation within any activity. Unlike the other areas, EMG is without a serious
competitive method in its class.
The important starting point is the proper selec-
tion and combination of methods that can ad-
dress a certain topic. Starting from a problem you
observe with your subjects or patients or the de-
sire to achieve a better understanding of the
physiological conditions within any activity, you
formulate expectations or hypothesis on that par-
ticular topic. Usually it is easy to convert assump-
tions to categories of questions. In the next step
you need to decide which biomechanical method
can best detect the processes related to your
questions. The selection of a correct biome-
chanical sensor or class is very important.
E.g. EMG cannot answer how strong (in Newton) a muscle is, and the other way around, force measures
cannot answer if a muscle fires correctly. Finally, within each category of biomechanical sensors, several
sub-classes of analysis questions can be answered. The following chapters explain in detail what types of
analytical questions you can “ask” EMG and how to use them as an analysis concept.
EMG in Biomechanics
Anthro-pometry
Kine-matics
Kinetics/Dynamometry
Electro-myography
Bone&Segments- structure
- proportion
DistanceAngle
Velocity&Accel.
Linear ForceMoment/TorquePressure distr.
Muscle ActionPotientials
Data Integration &CorrelationKinesiological Analysis
“Body” “Movement” “Forces” “Muscle Activation”
Observation of a“problem” or phenomenom
Formulation of hypothesis or expectation
Need for diagnosisor improved understanding
“Translation” to analysis questions
Selection of the right“sensor” / method
Adjustment and finetuning of analysis questions
Fig. 63: The 4 major areas of biomechanical measurement methods. Based on Ball-reich/Baumann 1983
Fig. 64: Analytical questions are the basis of proper sensor selection within biomechanical methods

ABC of EMG – A Practical Introduction to Kinesiological Electromyography Page 46
EMG Analysis Questions - Overview
Types and scaling of analysis questions There are basically 5 major categories of analysis questions that EMG can address and (very precisely!) an-
swer:
Level of questioning Type of answer Type of scaling
1) Is the muscle active? Yes/No and On/Off Nominal
2) Is the muscle more or less active? Ranking between tests in qualitative terms Ordinal
3) When is the muscle on/off? Onset/Offset calculations, firing orders Metric
4) How much is the muscle active? Expressed in e.g. % MVC Metric
5) Does the muscle fatigue? Slope calculation of EMG parameters Metric
It is important to note that with increasing question level, the complexity of EMG analysis increases too. If a
clinician needs a quick check if a neurological patient can voluntary activate a muscle, a one channel raw
EMG recording that requires 1 minute preparation time will directly answer his question. On the other hand, if
the coordinative quality within complex movements needs a deeper investigation, one may decide to use a
16 channel recording and amplitude normalization to MVC that may require 1 hour preparation time.
EMG can only answer its specific categories of questions. Like any other biomechanical method, it acts like a
lens by focusing on one selected subsystem or component of a very complex overall biological system. Mus-
cles are the “motors” (or brakes) of locomotion, but by their nature they only receive and operate reflex based
or CNS driven commands. EMG of a muscle alone can never answer a “Why?”
This makes any interpretation of
EMG findings very demanding and
requires fundamental understand-
ing of the sensi-motor system. Be
aware that any neuromuscular
finding from the “Active Motor Sys-
tem” is also influenced by proc-
esses of other biological subsys-
tems (Fig. 65). The challenge is to
re-integrate a certain finding from
one sub-system to the entirety of
the human body. A single biome-
chanical finding, even if measured
accurately, is worthless if not inte-
grated to the total system.
Active MotorSystem
PassiveMotor System
Cardio-vasc.System
MetabolicPathways
Cognitive/EmotionalProcesses
Central-/PeripheralNervous System
ConnectiveTissue
InnerOrgans
Biological Sub-systems within Humans
Fig. 65: Biological sub-systems that act in dependency to each other. A single finding within a selected subsystem does not reflect the whole system
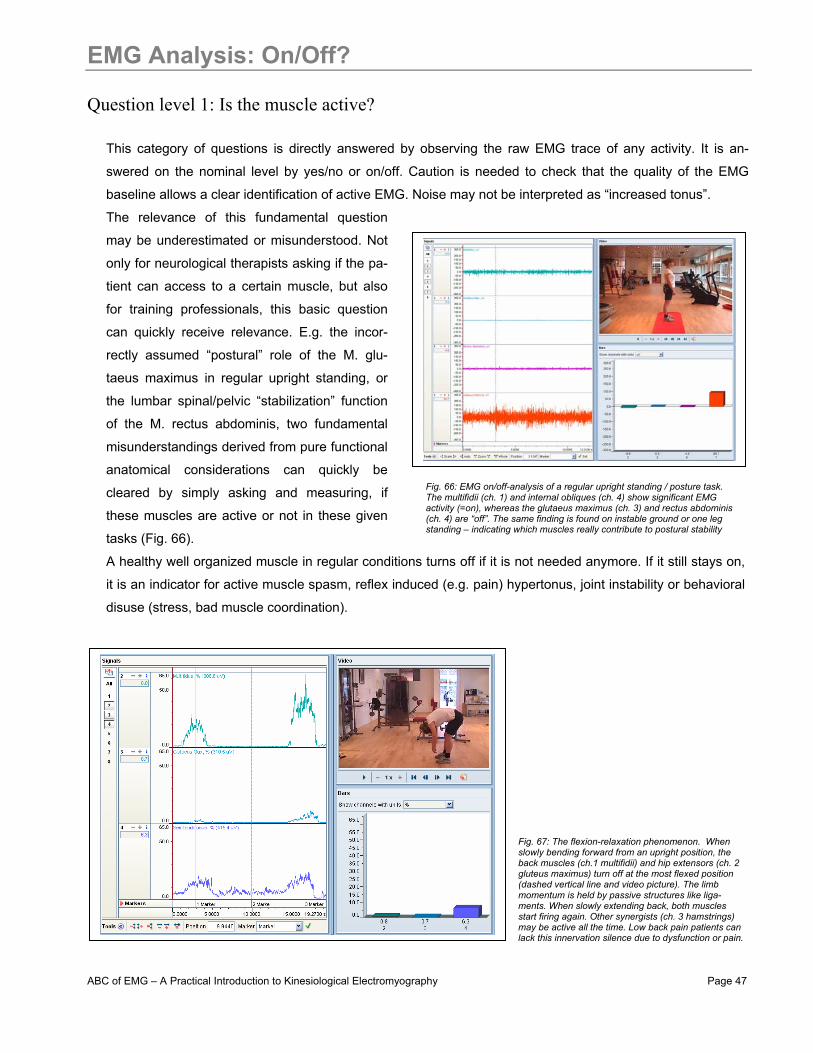
ABC of EMG – A Practical Introduction to Kinesiological Electromyography Page 47
EMG Analysis: On/Off?
Question level 1: Is the muscle active?
This category of questions is directly answered by observing the raw EMG trace of any activity. It is an-
swered on the nominal level by yes/no or on/off. Caution is needed to check that the quality of the EMG
baseline allows a clear identification of active EMG. Noise may not be interpreted as “increased tonus”.
The relevance of this fundamental question
may be underestimated or misunderstood. Not
only for neurological therapists asking if the pa-
tient can access to a certain muscle, but also
for training professionals, this basic question
can quickly receive relevance. E.g. the incor-
rectly assumed “postural” role of the M. glu-
taeus maximus in regular upright standing, or
the lumbar spinal/pelvic “stabilization” function
of the M. rectus abdominis, two fundamental
misunderstandings derived from pure functional
anatomical considerations can quickly be
cleared by simply asking and measuring, if
these muscles are active or not in these given
tasks (Fig. 66).
A healthy well organized muscle in regular conditions turns off if it is not needed anymore. If it still stays on,
it is an indicator for active muscle spasm, reflex induced (e.g. pain) hypertonus, joint instability or behavioral
disuse (stress, bad muscle coordination).
Fig. 66: EMG on/off-analysis of a regular upright standing / posture task. The multifidii (ch. 1) and internal obliques (ch. 4) show significant EMG activity (=on), whereas the glutaeus maximus (ch. 3) and rectus abdominis (ch. 4) are “off”. The same finding is found on instable ground or one leg standing – indicating which muscles really contribute to postural stability
Fig. 67: The flexion-relaxation phenomenon. When slowly bending forward from an upright position, the back muscles (ch.1 multifidii) and hip extensors (ch. 2 gluteus maximus) turn off at the most flexed position (dashed vertical line and video picture). The limb momentum is held by passive structures like liga-ments. When slowly extending back, both muscles start firing again. Other synergists (ch. 3 hamstrings) may be active all the time. Low back pain patients can lack this innervation silence due to dysfunction or pain.
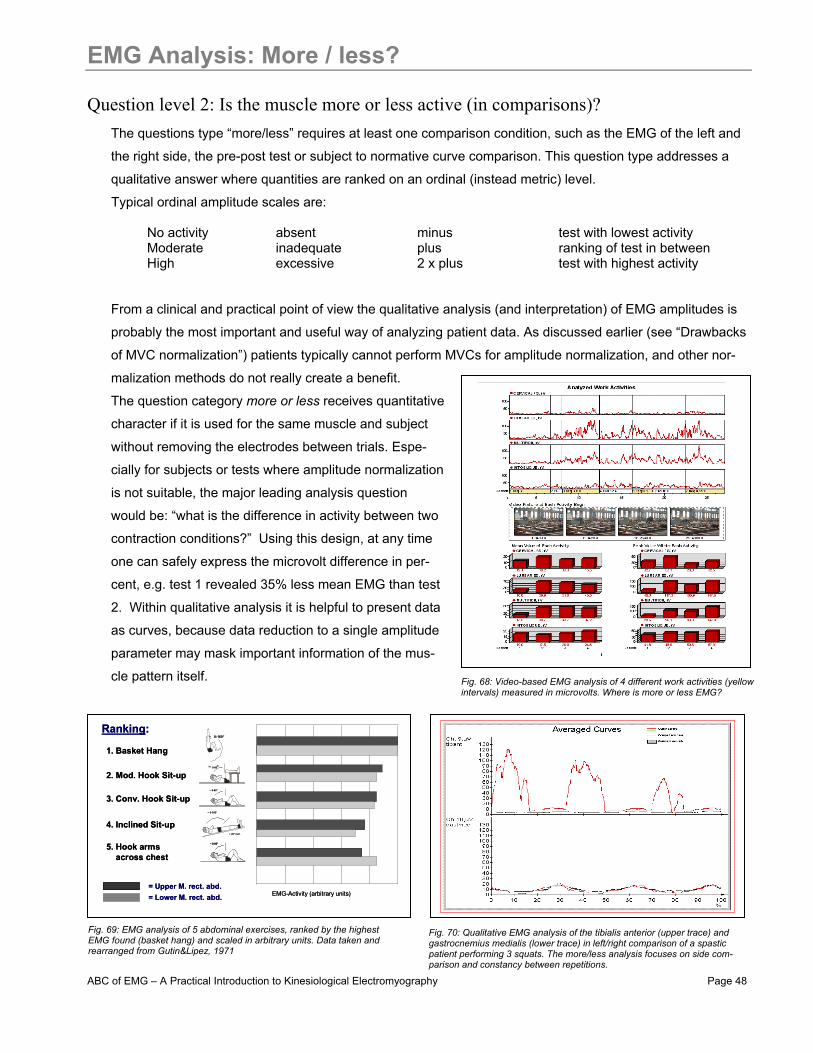
ABC of EMG – A Practical Introduction to Kinesiological Electromyography Page 48
EMG Analysis: More / less?
Question level 2: Is the muscle more or less active (in comparisons)? The questions type “more/less” requires at least one comparison condition, such as the EMG of the left and
the right side, the pre-post test or subject to normative curve comparison. This question type addresses a
qualitative answer where quantities are ranked on an ordinal (instead metric) level.
Typical ordinal amplitude scales are:
No activity absent minus test with lowest activity Moderate inadequate plus ranking of test in between High excessive 2 x plus test with highest activity
From a clinical and practical point of view the qualitative analysis (and interpretation) of EMG amplitudes is
probably the most important and useful way of analyzing patient data. As discussed earlier (see “Drawbacks
of MVC normalization”) patients typically cannot perform MVCs for amplitude normalization, and other nor-
malization methods do not really create a benefit.
The question category more or less receives quantitative
character if it is used for the same muscle and subject
without removing the electrodes between trials. Espe-
cially for subjects or tests where amplitude normalization
is not suitable, the major leading analysis question
would be: “what is the difference in activity between two
contraction conditions?” Using this design, at any time
one can safely express the microvolt difference in per-
cent, e.g. test 1 revealed 35% less mean EMG than test
2. Within qualitative analysis it is helpful to present data
as curves, because data reduction to a single amplitude
parameter may mask important information of the mus-
cle pattern itself.
1. Basket Hang
2. Mod. Hook Sit-up
3. Conv. Hook Sit-up
4. Inclined Sit-up
5. Hook armsacross chest
= Upper M. rect. abd.= Lower M. rect. abd. EMG-Activity (arbitrary units)
0-160°
~ 0-80°
~ 0-160°
~ 20° incl.
~ 0-90°
~ 0-90°
Ranking:
1. Basket Hang
2. Mod. Hook Sit-up
3. Conv. Hook Sit-up
4. Inclined Sit-up
5. Hook armsacross chest
= Upper M. rect. abd.= Lower M. rect. abd. EMG-Activity (arbitrary units)
0-160°
~ 0-80°
~ 0-160°
~ 20° incl.
~ 0-90°
~ 0-90°~ 0-90°
Ranking:
Fig. 68: Video-based EMG analysis of 4 different work activities (yellow intervals) measured in microvolts. Where is more or less EMG?
Fig. 69: EMG analysis of 5 abdominal exercises, ranked by the highest EMG found (basket hang) and scaled in arbitrary units. Data taken and rearranged from Gutin&Lipez, 1971
Fig. 70: Qualitative EMG analysis of the tibialis anterior (upper trace) and gastrocnemius medialis (lower trace) in left/right comparison of a spastic patient performing 3 squats. The more/less analysis focuses on side com-parison and constancy between repetitions.
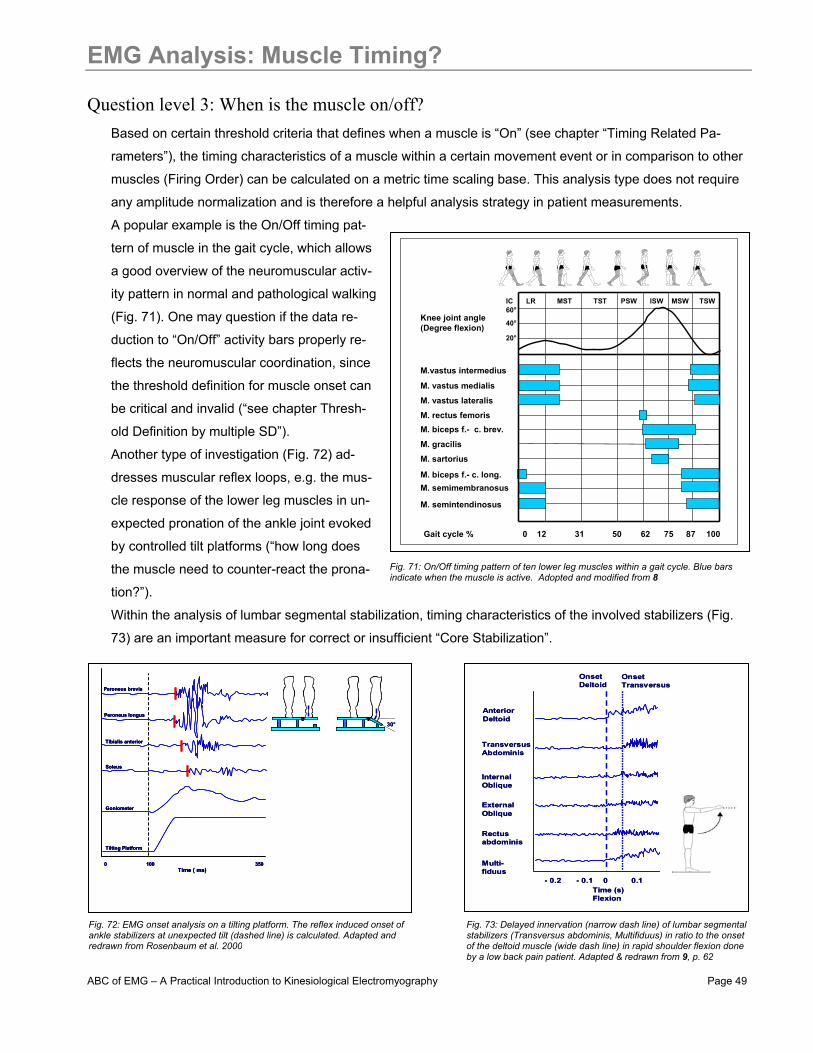
ABC of EMG – A Practical Introduction to Kinesiological Electromyography Page 49
EMG Analysis: Muscle Timing?
Question level 3: When is the muscle on/off? Based on certain threshold criteria that defines when a muscle is “On” (see chapter “Timing Related Pa-
rameters”), the timing characteristics of a muscle within a certain movement event or in comparison to other
muscles (Firing Order) can be calculated on a metric time scaling base. This analysis type does not require
any amplitude normalization and is therefore a helpful analysis strategy in patient measurements.
A popular example is the On/Off timing pat-
tern of muscle in the gait cycle, which allows
a good overview of the neuromuscular activ-
ity pattern in normal and pathological walking
(Fig. 71). One may question if the data re-
duction to “On/Off” activity bars properly re-
flects the neuromuscular coordination, since
the threshold definition for muscle onset can
be critical and invalid (“see chapter Thresh-
old Definition by multiple SD”).
Another type of investigation (Fig. 72) ad-
dresses muscular reflex loops, e.g. the mus-
cle response of the lower leg muscles in un-
expected pronation of the ankle joint evoked
by controlled tilt platforms (“how long does
the muscle need to counter-react the prona-
tion?”).
Within the analysis of lumbar segmental stabilization, timing characteristics of the involved stabilizers (Fig.
73) are an important measure for correct or insufficient “Core Stabilization”.
M. vastus medialis
M. vastus lateralis
M. rectus femorisM. biceps f.- c. brev.
M. gracilis
M. sartorius
M. biceps f.- c. long.M. semimembranosus
M. semintendinosus
M.vastus intermedius
Knee joint angle(Degree flexion)
60°
40°
20°
Gait cycle % 50 1000 12 31 62 75 87
IC LR MST TST PSW ISW MSW TSW
OnsetDeltoid
OnsetTransversus
AnteriorDeltoid
TransversusAbdominis
InternalOblique
ExternalOblique
Rectusabdominis
Multi-fiduus
Time (s)Flexion
- 0.2 - 0.1 0 0.1
OnsetDeltoid
OnsetTransversus
AnteriorDeltoid
TransversusAbdominis
InternalOblique
ExternalOblique
Rectusabdominis
Multi-fiduus
Time (s)Flexion
- 0.2 - 0.1 0 0.1
Fig. 71: On/Off timing pattern of ten lower leg muscles within a gait cycle. Blue bars indicate when the muscle is active. Adopted and modified from 8
Fig. 73: Delayed innervation (narrow dash line) of lumbar segmental stabilizers (Transversus abdominis, Multifiduus) in ratio to the onset of the deltoid muscle (wide dash line) in rapid shoulder flexion done by a low back pain patient. Adapted & redrawn from 9, p. 62
Peroneus brevis
Peroneus longus
Tibialis anterior
Soleus
Goniometer
Tilting Platform
0Time ( ms)
100 350
30°
Peroneus brevis
Peroneus longus
Tibialis anterior
Soleus
Goniometer
Tilting Platform
0Time ( ms)
100 350
Peroneus brevis
Peroneus longus
Tibialis anterior
Soleus
Goniometer
Tilting Platform
0Time ( ms)
100 350
30°
Fig. 72: EMG onset analysis on a tilting platform. The reflex induced onset of ankle stabilizers at unexpected tilt (dashed line) is calculated. Adapted and redrawn from Rosenbaum et al. 2000
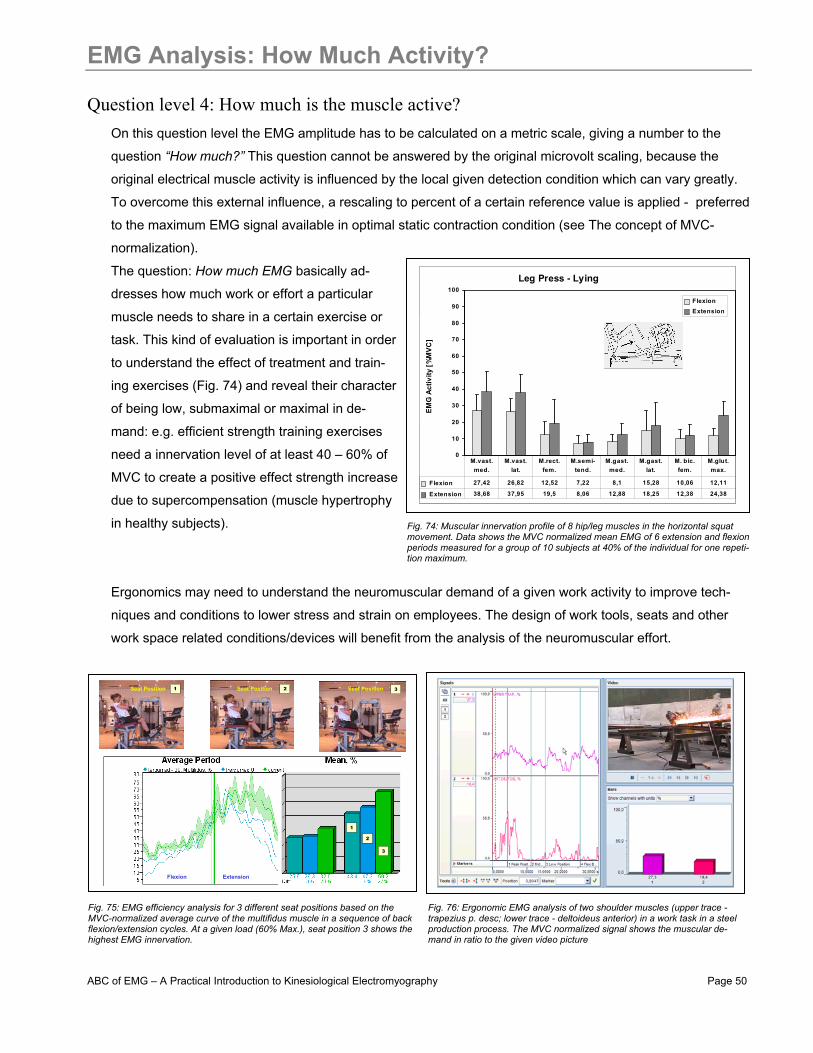
ABC of EMG – A Practical Introduction to Kinesiological Electromyography Page 50
EMG Analysis: How Much Activity?
Question level 4: How much is the muscle active? On this question level the EMG amplitude has to be calculated on a metric scale, giving a number to the
question “How much?” This question cannot be answered by the original microvolt scaling, because the
original electrical muscle activity is influenced by the local given detection condition which can vary greatly.
To overcome this external influence, a rescaling to percent of a certain reference value is applied - preferred
to the maximum EMG signal available in optimal static contraction condition (see The concept of MVC-
normalization).
The question: How much EMG basically ad-
dresses how much work or effort a particular
muscle needs to share in a certain exercise or
task. This kind of evaluation is important in order
to understand the effect of treatment and train-
ing exercises (Fig. 74) and reveal their character
of being low, submaximal or maximal in de-
mand: e.g. efficient strength training exercises
need a innervation level of at least 40 – 60% of
MVC to create a positive effect strength increase
due to supercompensation (muscle hypertrophy
in healthy subjects).
Ergonomics may need to understand the neuromuscular demand of a given work activity to improve tech-
niques and conditions to lower stress and strain on employees. The design of work tools, seats and other
work space related conditions/devices will benefit from the analysis of the neuromuscular effort.
Beinpresse liegend
0
10
20
30
40
50
60
70
80
90
100
EM
G A
ktiv
ität [
%M
VC
]
Flexion Extension
Flexion 27,42 26,82 12,52 7,22 8,1 15,28 10,06 12,11
Extension 38,68 37,95 19,5 8,06 12,88 18,25 12,38 24,38
M.vast. med.
M.vast. lat.
M.rect. fem.
M.semi- tend.
M.gast. med.
M.gast. lat.
M. bic. fem.
M.glut. max.
Leg Press - Lying
EMG
Act
ivity
[%
MVC
]
1
1
2
3
2
3Seat Position Seat Position Seat Position
Flexion Extension
1
1
2
3
2
3Seat Position Seat Position Seat Position
Flexion Extension
Fig. 74: Muscular innervation profile of 8 hip/leg muscles in the horizontal squat movement. Data shows the MVC normalized mean EMG of 6 extension and flexion periods measured for a group of 10 subjects at 40% of the individual for one repeti-tion maximum.
Fig. 75: EMG efficiency analysis for 3 different seat positions based on the MVC-normalized average curve of the multifidus muscle in a sequence of back flexion/extension cycles. At a given load (60% Max.), seat position 3 shows the highest EMG innervation.
Fig. 76: Ergonomic EMG analysis of two shoulder muscles (upper trace -trapezius p. desc; lower trace - deltoideus anterior) in a work task in a steel production process. The MVC normalized signal shows the muscular de-mand in ratio to the given video picture
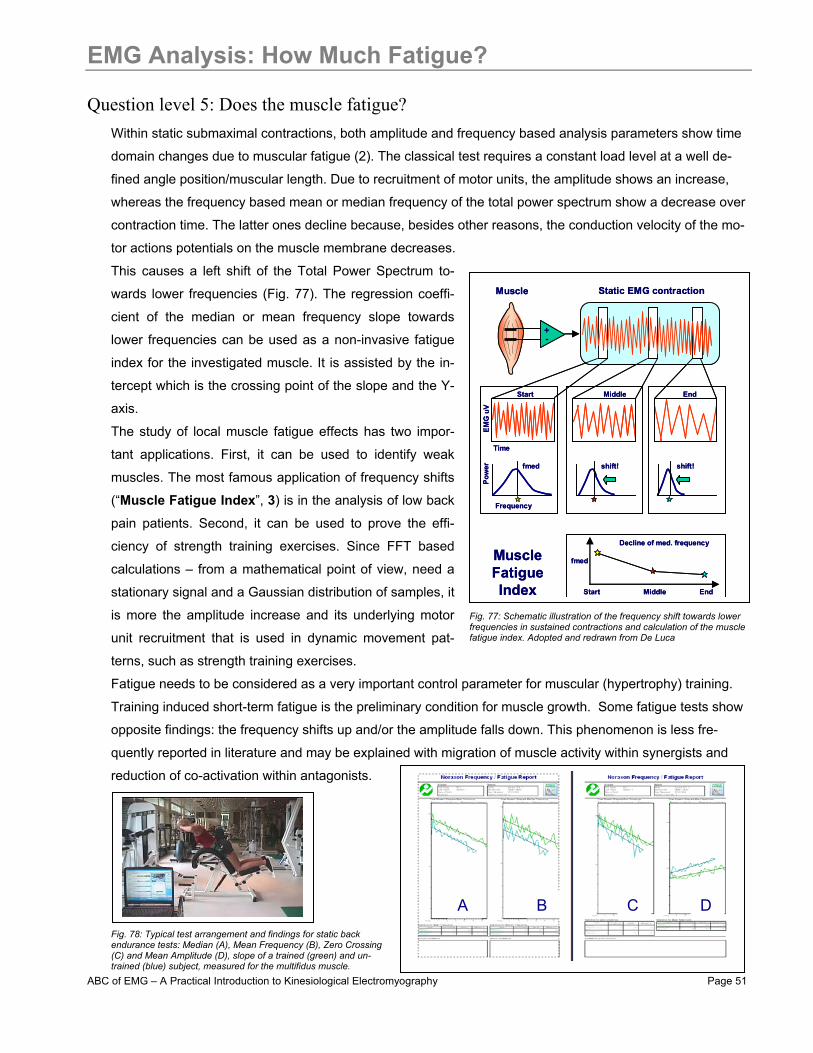
ABC of EMG – A Practical Introduction to Kinesiological Electromyography Page 51
EMG Analysis: How Much Fatigue?
Question level 5: Does the muscle fatigue? Within static submaximal contractions, both amplitude and frequency based analysis parameters show time
domain changes due to muscular fatigue (2). The classical test requires a constant load level at a well de-
fined angle position/muscular length. Due to recruitment of motor units, the amplitude shows an increase,
whereas the frequency based mean or median frequency of the total power spectrum show a decrease over
contraction time. The latter ones decline because, besides other reasons, the conduction velocity of the mo-
tor actions potentials on the muscle membrane decreases.
This causes a left shift of the Total Power Spectrum to-
wards lower frequencies (Fig. 77). The regression coeffi-
cient of the median or mean frequency slope towards
lower frequencies can be used as a non-invasive fatigue
index for the investigated muscle. It is assisted by the in-
tercept which is the crossing point of the slope and the Y-
axis.
The study of local muscle fatigue effects has two impor-
tant applications. First, it can be used to identify weak
muscles. The most famous application of frequency shifts
(“Muscle Fatigue Index”, 3) is in the analysis of low back
pain patients. Second, it can be used to prove the effi-
ciency of strength training exercises. Since FFT based
calculations – from a mathematical point of view, need a
stationary signal and a Gaussian distribution of samples, it
is more the amplitude increase and its underlying motor
unit recruitment that is used in dynamic movement pat-
terns, such as strength training exercises.
Fatigue needs to be considered as a very important control parameter for muscular (hypertrophy) training.
Training induced short-term fatigue is the preliminary condition for muscle growth. Some fatigue tests show
opposite findings: the frequency shifts up and/or the amplitude falls down. This phenomenon is less fre-
quently reported in literature and may be explained with migration of muscle activity within synergists and
reduction of co-activation within antagonists.
+-
Muscle Static EMG contraction
Start Middle End
Pow
er
Start Middle End
fmed
Decline of med. frequency
MuscleFatigueIndex
shift! fmed
Frequency
EMG
uV
Time
shift!
+-
Muscle Static EMG contraction
Start Middle End
Pow
er
Start Middle End
fmed
Decline of med. frequency
MuscleFatigueIndex
shift! fmed
Frequency
EMG
uV
Time
shift!
Fig. 77: Schematic illustration of the frequency shift towards lower frequencies in sustained contractions and calculation of the muscle fatigue index. Adopted and redrawn from De Luca
Fig. 78: Typical test arrangement and findings for static back endurance tests: Median (A), Mean Frequency (B), Zero Crossing (C) and Mean Amplitude (D), slope of a trained (green) and un-trained (blue) subject, measured for the multifidus muscle.
A B C D
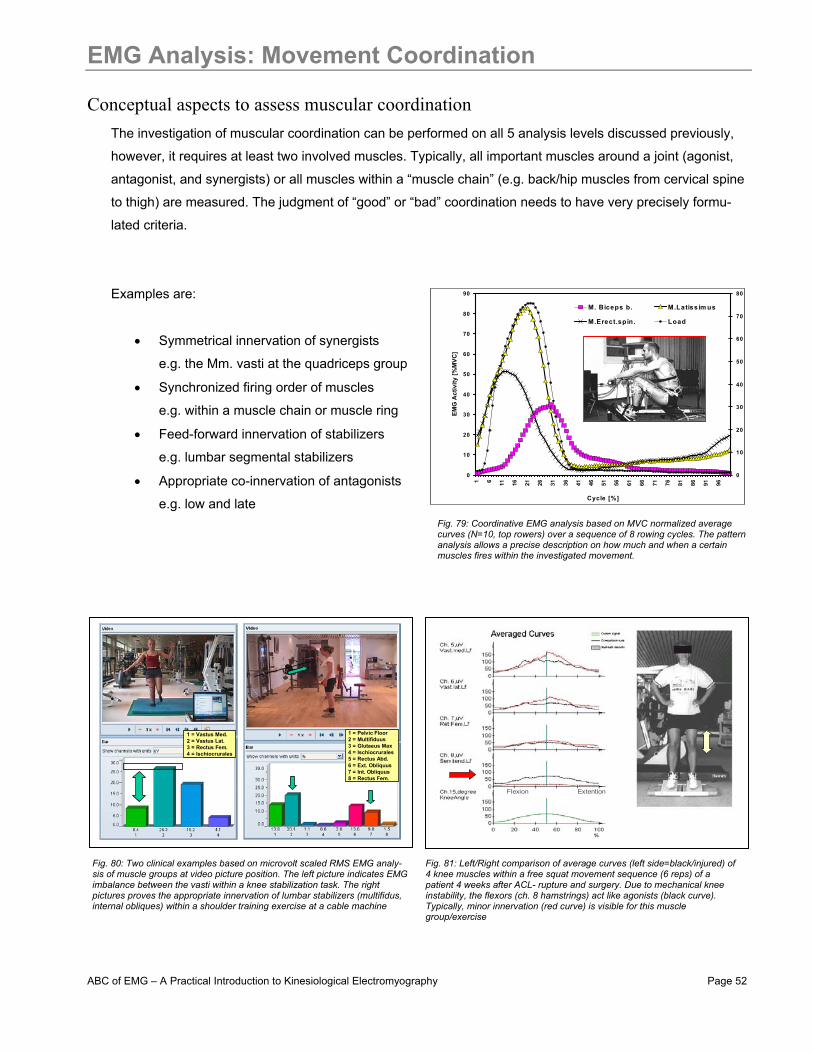
ABC of EMG – A Practical Introduction to Kinesiological Electromyography Page 52
EMG Analysis: Movement Coordination
Conceptual aspects to assess muscular coordination The investigation of muscular coordination can be performed on all 5 analysis levels discussed previously,
however, it requires at least two involved muscles. Typically, all important muscles around a joint (agonist,
antagonist, and synergists) or all muscles within a “muscle chain” (e.g. back/hip muscles from cervical spine
to thigh) are measured. The judgment of “good” or “bad” coordination needs to have very precisely formu-
lated criteria.
Examples are:
• Symmetrical innervation of synergists
e.g. the Mm. vasti at the quadriceps group
• Synchronized firing order of muscles
e.g. within a muscle chain or muscle ring
• Feed-forward innervation of stabilizers
e.g. lumbar segmental stabilizers
• Appropriate co-innervation of antagonists
e.g. low and late
Flexion Extention
1 = Vastus Med.2 = Vastus Lat.3 = Rectus Fem.4 = Ischiocrurales
1 = Pelvic Floor2 = Multifiduus3 = Glutaeus Max4 = Ischiocrurales5 = Rectus Abd.6 = Ext. Obliquus7 = Int. Obliquus8 = Rectus Fem.
1 = Vastus Med.2 = Vastus Lat.3 = Rectus Fem.4 = Ischiocrurales
1 = Pelvic Floor2 = Multifiduus3 = Glutaeus Max4 = Ischiocrurales5 = Rectus Abd.6 = Ext. Obliquus7 = Int. Obliquus8 = Rectus Fem.
0
10
20
30
40
50
60
70
80
90
1 6 11 16 21 26 31 36 41 46 51 56 61 66 71 76 81 86 91 96
Cycle [%]
EMG
Act
ivity
[%M
VC]
0
10
20
30
40
50
60
70
80
M. Biceps b. M.Latissim us
M.Erect.spin. Load
Fig. 79: Coordinative EMG analysis based on MVC normalized average curves (N=10, top rowers) over a sequence of 8 rowing cycles. The pattern analysis allows a precise description on how much and when a certain muscles fires within the investigated movement.
Fig. 80: Two clinical examples based on microvolt scaled RMS EMG analy-sis of muscle groups at video picture position. The left picture indicates EMG imbalance between the vasti within a knee stabilization task. The right pictures proves the appropriate innervation of lumbar stabilizers (multifidus, internal obliques) within a shoulder training exercise at a cable machine
Fig. 81: Left/Right comparison of average curves (left side=black/injured) of 4 knee muscles within a free squat movement sequence (6 reps) of a patient 4 weeks after ACL- rupture and surgery. Due to mechanical knee instability, the flexors (ch. 8 hamstrings) act like agonists (black curve). Typically, minor innervation (red curve) is visible for this muscle group/exercise
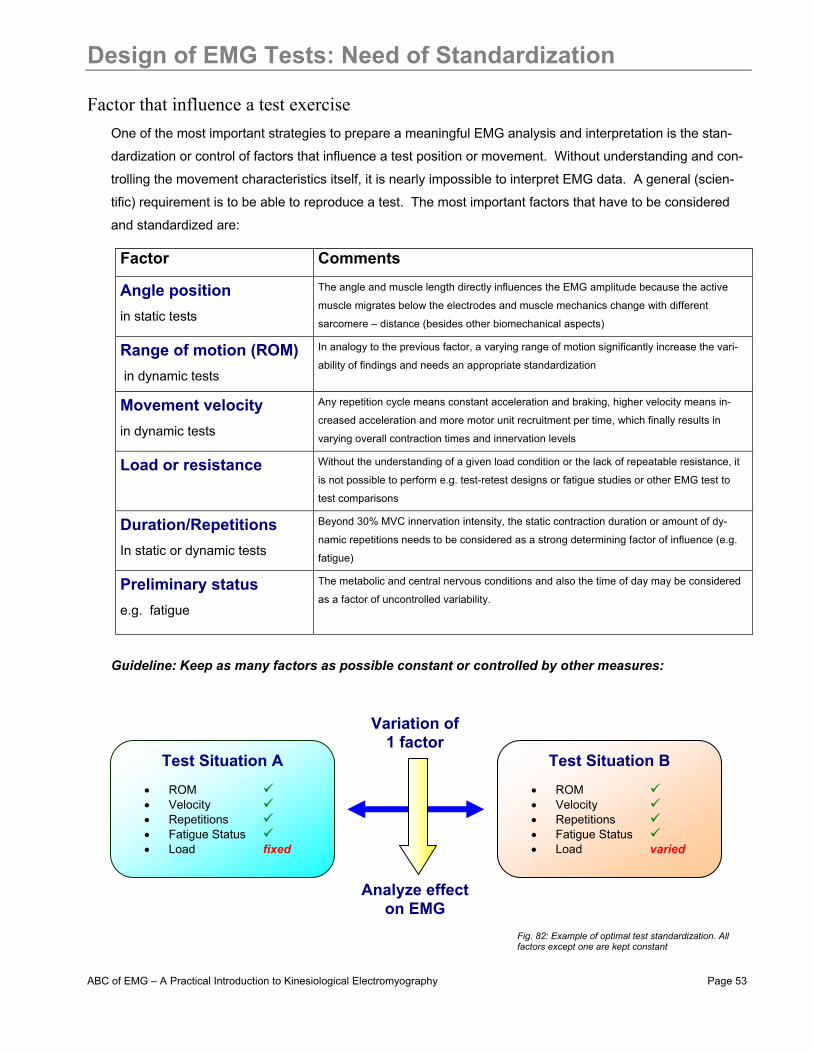
ABC of EMG – A Practical Introduction to Kinesiological Electromyography Page 53
Design of EMG Tests: Need of Standardization
Factor that influence a test exercise One of the most important strategies to prepare a meaningful EMG analysis and interpretation is the stan-
dardization or control of factors that influence a test position or movement. Without understanding and con-
trolling the movement characteristics itself, it is nearly impossible to interpret EMG data. A general (scien-
tific) requirement is to be able to reproduce a test. The most important factors that have to be considered
and standardized are:
Factor Comments
Angle position
in static tests
The angle and muscle length directly influences the EMG amplitude because the active
muscle migrates below the electrodes and muscle mechanics change with different
sarcomere – distance (besides other biomechanical aspects)
Range of motion (ROM) in dynamic tests
In analogy to the previous factor, a varying range of motion significantly increase the vari-
ability of findings and needs an appropriate standardization
Movement velocity
in dynamic tests
Any repetition cycle means constant acceleration and braking, higher velocity means in-
creased acceleration and more motor unit recruitment per time, which finally results in
varying overall contraction times and innervation levels
Load or resistance
Without the understanding of a given load condition or the lack of repeatable resistance, it
is not possible to perform e.g. test-retest designs or fatigue studies or other EMG test to
test comparisons
Duration/Repetitions In static or dynamic tests
Beyond 30% MVC innervation intensity, the static contraction duration or amount of dy-
namic repetitions needs to be considered as a strong determining factor of influence (e.g.
fatigue)
Preliminary status
e.g. fatigue
The metabolic and central nervous conditions and also the time of day may be considered
as a factor of uncontrolled variability.
Guideline: Keep as many factors as possible constant or controlled by other measures:
Test Situation A
• ROM • Velocity • Repetitions • Fatigue Status • Load fixed
Test Situation B
• ROM • Velocity • Repetitions • Fatigue Status • Load varied
Variation of 1 factor
Analyze effect on EMG
Fig. 82: Example of optimal test standardization. All factors except one are kept constant

ABC of EMG – A Practical Introduction to Kinesiological Electromyography Page 54
Recommendations for Test Standardization
Strategies to standardize tests Load
• Use the whole body or body segments as a static resistance • Use external weights to standardize load • Use a tilt platform or two body scales to control the weight distribution in
squat exercises (Fig. 83) • Use force load/torque cells for varying force output
ANGLE/ROM • Use belts to arrange a good fixation of body segments • Use goniometers or inclinometers to monitor the ROM in free functional
movements • Use a “grid mirror” (Fig. 84) for free functional movements to standardize
the ROM • Use training machines to best control ROM (Fig. 85)
VELOCITY • Use a metronome to standardize contraction velocity or step cadence • Consider treadmills or isokinetics for constant speed
DURATION • Use fixed contraction intervals • Count repetitions • Limit repetitions at high intensities
PRELIMINARY STATUS/CONDITIONS • Same time of day • Best to select a non-fatigued condition and warm up subjects • Constant room temperature
GENERAL • For quick evaluations, choose static tests against defined resistance • Use isokinetics devices if very high standardization is needed • Use random orders for multiple exercise to avoid systematic errors • Try to only change one test factor between test comparisons • Single joint exercises have less variability, use isolation techniques to
study certain muscles within muscle chains
Examples for test standardization levels:
Active! Passive!Active! Passive!
Free FunctionalMovements
Manual ResistanceTests
Low Medium
Machine BasedTests
Very HighHigh
Static Hold +Constant Load
Free FunctionalMovements
Manual ResistanceTests
Low Medium
Machine BasedTests
Very HighHigh
Static Hold +Constant Load
Fig. 83: Equal weight distribution by using two scales or a tilting plate
Fig. 84: Standardized ROM by using mirrors with grid lines
Fig. 85: Standardized ROM, body position and load by machines
Fig. 86: Control of any movement parameter by biofeedback bars and predefined ranges
Fig 87: Different levels of standardization depend on the general test condition
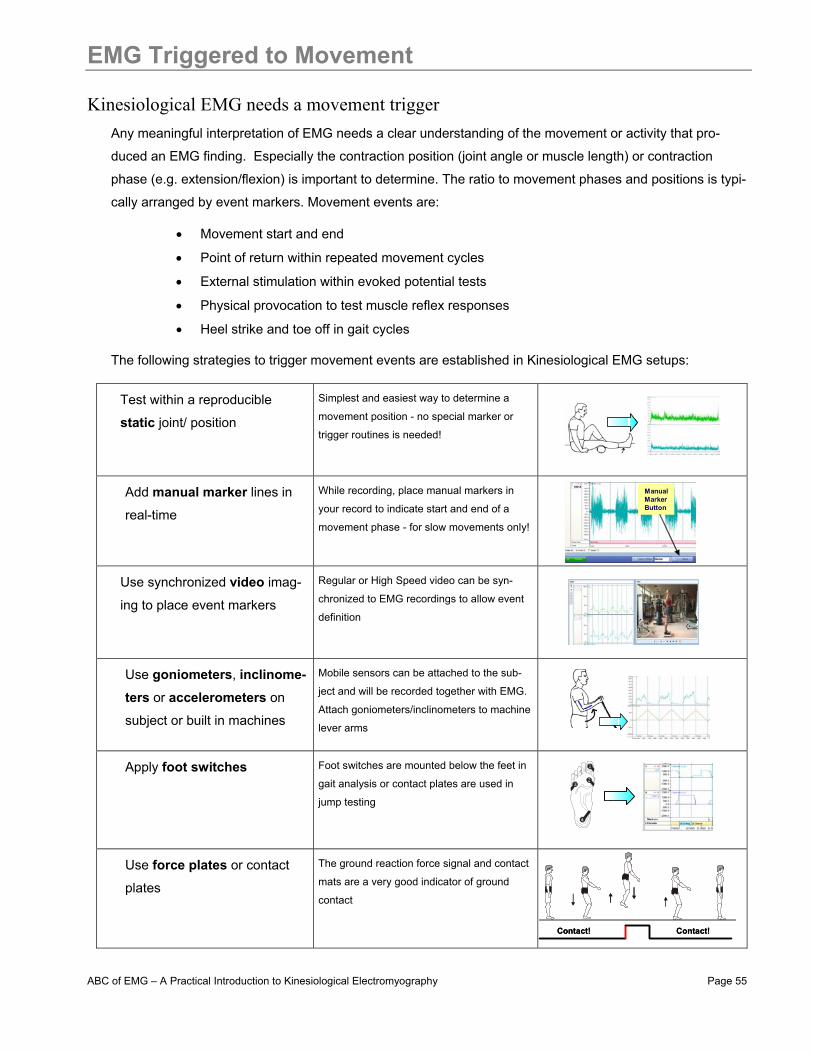
ABC of EMG – A Practical Introduction to Kinesiological Electromyography Page 55
EMG Triggered to Movement
Kinesiological EMG needs a movement trigger Any meaningful interpretation of EMG needs a clear understanding of the movement or activity that pro-
duced an EMG finding. Especially the contraction position (joint angle or muscle length) or contraction
phase (e.g. extension/flexion) is important to determine. The ratio to movement phases and positions is typi-
cally arranged by event markers. Movement events are:
• Movement start and end
• Point of return within repeated movement cycles
• External stimulation within evoked potential tests
• Physical provocation to test muscle reflex responses
• Heel strike and toe off in gait cycles
The following strategies to trigger movement events are established in Kinesiological EMG setups:
Test within a reproducible
static joint/ position Simplest and easiest way to determine a
movement position - no special marker or
trigger routines is needed!
Add manual marker lines in
real-time
While recording, place manual markers in
your record to indicate start and end of a
movement phase - for slow movements only!
Use synchronized video imag-
ing to place event markers Regular or High Speed video can be syn-
chronized to EMG recordings to allow event
definition
Use goniometers, inclinome-ters or accelerometers on
subject or built in machines
Mobile sensors can be attached to the sub-
ject and will be recorded together with EMG.
Attach goniometers/inclinometers to machine
lever arms
Apply foot switches
Foot switches are mounted below the feet in
gait analysis or contact plates are used in
jump testing
Use force plates or contact
plates
The ground reaction force signal and contact
mats are a very good indicator of ground
contact
ManualMarkerButton
ManualMarkerButton
Contact! Contact!Contact! Contact!
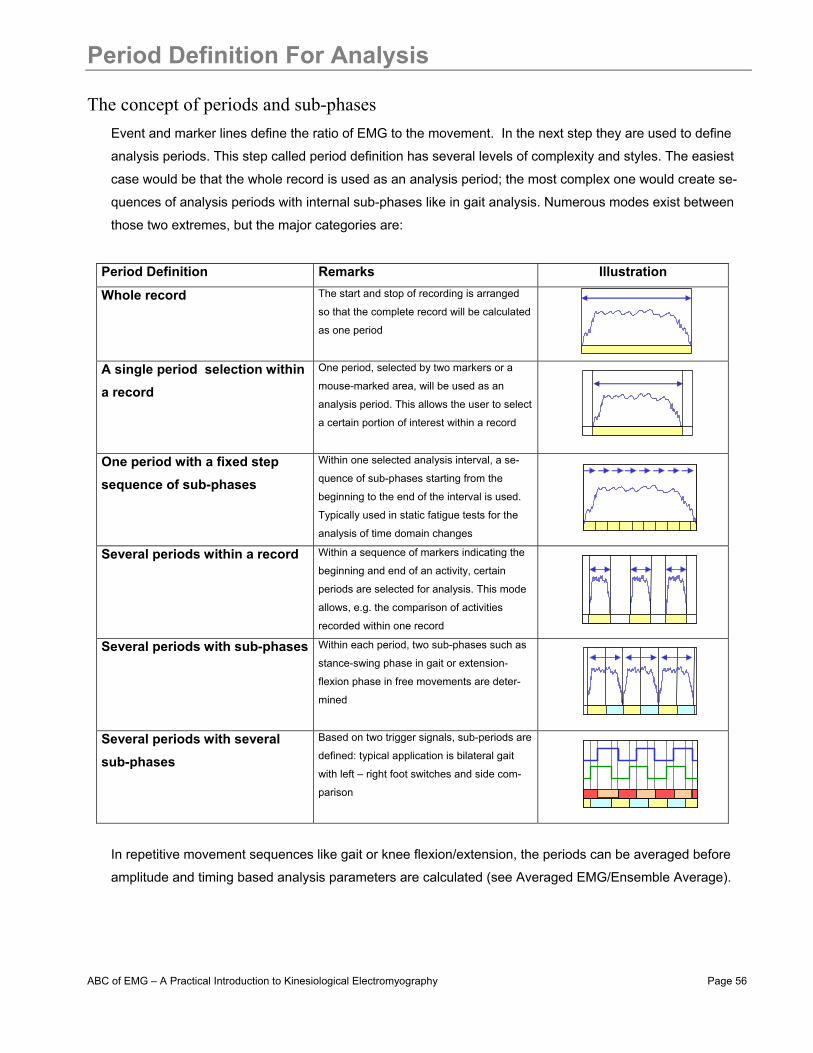
ABC of EMG – A Practical Introduction to Kinesiological Electromyography Page 56
Period Definition For Analysis
The concept of periods and sub-phases Event and marker lines define the ratio of EMG to the movement. In the next step they are used to define
analysis periods. This step called period definition has several levels of complexity and styles. The easiest
case would be that the whole record is used as an analysis period; the most complex one would create se-
quences of analysis periods with internal sub-phases like in gait analysis. Numerous modes exist between
those two extremes, but the major categories are:
Period Definition Remarks Illustration
Whole record The start and stop of recording is arranged
so that the complete record will be calculated
as one period
A single period selection within a record
One period, selected by two markers or a
mouse-marked area, will be used as an
analysis period. This allows the user to select
a certain portion of interest within a record
One period with a fixed step sequence of sub-phases
Within one selected analysis interval, a se-
quence of sub-phases starting from the
beginning to the end of the interval is used.
Typically used in static fatigue tests for the
analysis of time domain changes
Several periods within a record
Within a sequence of markers indicating the
beginning and end of an activity, certain
periods are selected for analysis. This mode
allows, e.g. the comparison of activities
recorded within one record
Several periods with sub-phases
Within each period, two sub-phases such as
stance-swing phase in gait or extension-
flexion phase in free movements are deter-
mined
Several periods with several sub-phases
Based on two trigger signals, sub-periods are
defined: typical application is bilateral gait
with left – right foot switches and side com-
parison
In repetitive movement sequences like gait or knee flexion/extension, the periods can be averaged before
amplitude and timing based analysis parameters are calculated (see Averaged EMG/Ensemble Average).
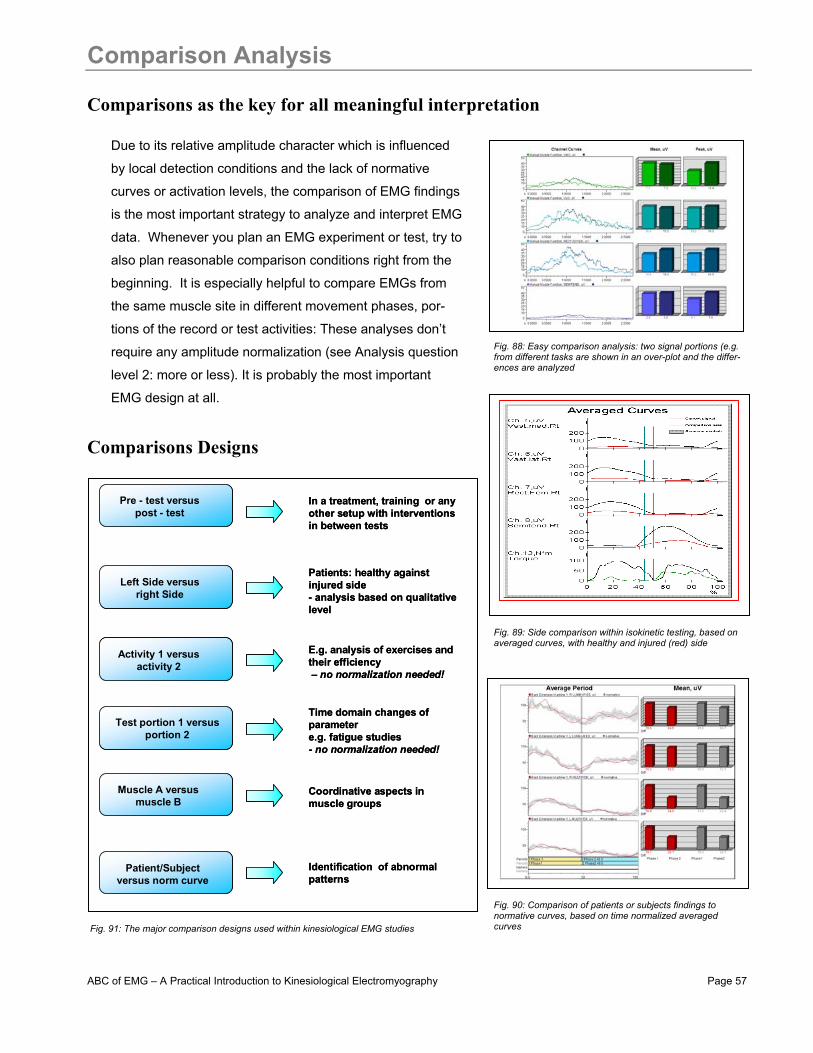
ABC of EMG – A Practical Introduction to Kinesiological Electromyography Page 57
Comparison Analysis
Comparisons as the key for all meaningful interpretation
Due to its relative amplitude character which is influenced
by local detection conditions and the lack of normative
curves or activation levels, the comparison of EMG findings
is the most important strategy to analyze and interpret EMG
data. Whenever you plan an EMG experiment or test, try to
also plan reasonable comparison conditions right from the
beginning. It is especially helpful to compare EMGs from
the same muscle site in different movement phases, por-
tions of the record or test activities: These analyses don’t
require any amplitude normalization (see Analysis question
level 2: more or less). It is probably the most important
EMG design at all.
Comparisons Designs
Pre - test versus post - test
In a treatment, training or any other setup with interventionsin between tests
Patient/Subject versus norm curve
Identification of abnormal patterns
Muscle A versus muscle B
Coordinative aspects in muscle groups
Activity 1 versus activity 2
E.g. analysis of exercises and their efficiency– no normalization needed!
Left Side versusright Side
Patients: healthy against injured side- analysis based on qualitative level
Test portion 1 versus portion 2
Time domain changes of parametere.g. fatigue studies- no normalization needed!
Fig. 88: Easy comparison analysis: two signal portions (e.g. from different tasks are shown in an over-plot and the differ-ences are analyzed
Fig. 89: Side comparison within isokinetic testing, based on averaged curves, with healthy and injured (red) side
Fig. 90: Comparison of patients or subjects findings to normative curves, based on time normalized averaged curves Fig. 91: The major comparison designs used within kinesiological EMG studies

ABC of EMG – A Practical Introduction to Kinesiological Electromyography Page 58
Recommended EMG books
Selection of EMG text books used as a reference in this booklet
1) J.V. Basmajian
Biofeedback Principles and Practice for Clinicians. Williams Wilkins, Baltimore 1989 ISBN 0-683-00357-7
2) J.V. Basmajian; C.J. De Luca
Muscles Alive Their Function Revealed by Electromyography. Williams Wilkins, Baltimore 1985 ISBN 0-683-00414-X
3) C.J. De Luca; M. Knaflitz
Surface Electromyography: What’s New? C.L.U.T., Torino 1992 ISBN -
4) J.R.Cram; G. Kasman
Introduction to Surface Electromyography Aspen 1998 ISBN 0-8342-0751-6
5) R.M. Enoka
Neuromechanical Basis of Kinesiology Human Kinetics, Champaign 1994 ISBN 0-87322-655-8
6) G.S. Kasman et al.
Clinical Applications in Surface Electromyography Chronic Musculoskeletal Pain. Aspen 1997 ISBN 0-8342-0752-4
7) S. Kumar; A. Mital
Electromyography in Ergonomics Taylor&Francis, London 1996 ISBN 0-7484-0130-X
8) J. Perry
Gait Analysis Normal and Pathological Function. Slack Thorofare 1992 ISBN 1-55642-192-3 9) C. Richardson et al.
Therapeutic Exercises for Spinal Segmental Stabilization in Low Back Pain Churchill Livingstone, Edinburg 1999 ISBN 0-443-058024
10) US Department of Health and Human Services Selected Topics in Surface Electromy-ography for Use in Occupational Set-tings: Expert Perspectives
DHHS NIOSH Publications #91-100 1992
11) D.A. Winter
Biomechanics and Motor Control of Human Movement John Wiley & Sons New York 1990 ISBN 0-683-00357-7
12) D.A: Winter
The Biomechanics and Motor Control of Human Gait: Normal, Elderly and Pathological Waterloo Biomechanics 1991 ISBN 0-88898-105-8
Remark: Some text citations are not listed here (scientific articles). Non-cited figures contain date from own unpublished studies. Please contact the author for missing references and/or more information
ABC of EMG – A Practical Introduction to Kinesiological Electromyography Page 59
EMG Guidelines, Societies, Search Links
The International Society of Electrophysiology and Kinesiology (ISEK)
Web Link: http://isek.bu.edu/ “The International Society of Electrophysiology and Kinesiology (ISEK) is a multidisci-
plinary organization composed of members from all over the world in health-related
fields and basic science with a common desire to study human movement and the neu-
romuscular system”. The webpage contains important links, journals, congress dates
and addresses for electromyographers. The very important “ISEK Standards of Report-
ing EMG Data” can be found under: http://isek.bu.edu/publications/standards/emg_standards.html
The European Recommendations for Surface Electromyography (SENIAM) Web Link: http://www.seniam.org/ The SENIAM project (Surface Electromyography for the Non-Invasive Assess-
ment of Muscles) is a European concerted action in the Biomedical Health and
Research Program (BIOMED II) of the European Union. The SENIAM project
developed important guidelines for EMG measurements. The results are pub-
lished under:
Hermens H.J., Freriks B., Merletti R., Hägg G., Stegeman D.F., Blok J., Rau G., Dissel-horst-Klug C. (1999) SENIAM 8: European Recommendations for Surface ElectroMyoGra-phy, Roessingh Research and Development b.v., ISBN 90-75452-15-2. Freriks B., Hermens H.J. (1999) SENIAM 9: European Recommendations for Surface Elec-troMyoGraphy, results of the SENIAM project, Roessingh Research and Development b.v., 1999, ISBN 90-75452-14-4 (CD-rom).
Pubmed – free access to Medline
Web Link: http://www.ncbi.nlm.nih.gov/entrez/query.fcgi “PubMed, a service of the National Library of Medicine, includes over 15 mil-
lion citations for biomedical articles back to the 1950's. These citations are
from MEDLINE and additional life science journals. PubMed includes links to
many sites providing full text articles and other related resources”
Search engine Scholar Google
Web Link: http://scholar.google.com/ Extremely powerful search engine for (EMG-) articles and publications

Noraxon U.S.A. Inc. ▪ 13430 N. Scottsdale Rd., Suite 104 ▪ Scottsdale, AZ 85254 Tel: (480) 443-3413 Fax: (480) 443-4327 ▪ E-mail: [email protected] ▪ Web Site: www.noraxon.com Page 60
The World of Electromyography
Complete Line of Surface EMG and Sensor Systems Since 1989, Noraxon has been manufacturing and distributing high-end surface electromyography
(SEMG) and biomechanical sensor systems to research, sports medicine, ergonomics and clinical
professionals worldwide. Our systems meet the technical requirements of highly acclaimed inter-
national research societies, like ISEK and Seniam and are CE or FDA approved.
Mobile Monitoring Concept and Connectivity EMG, force, angle and other types of biomechanical sensors can be connected to a telemetry sys-
tem. Data is then transmitted from the system directly to a computer or notebook. Hardware inter-
face solutions and software export/import modules ensure complete communication capabilities to
other measurement devices, such as movement analysis, isokinetics, force plates, footswitches,
goniometers, etc.
Handheld Biofeedback
Multi Channel Cable units
Wireless LAN Telemetry
BiomechanicalSensors

Noraxon U.S.A. Inc. ▪ 13430 N. Scottsdale Rd., Suite 104 ▪ Scottsdale, AZ 85254 Tel: (480) 443-3413 Fax: (480) 443-4327 ▪ E-mail: [email protected] ▪ Web Site: www.noraxon.com Page 61
The World of Electromyography
Real Time Monitoring of Muscle Activity and Performance Noraxon’s comprehensive data acquiring software features the most commonly used analysis rou-
tines of biomechanical, medical, occupational and sport science applications: from MVC Normaliza-
tion to Wavelet Analysis, Onset Timing to ECG Removing. The option to quickly and easily config-
ure report routines meets the professional need for a highly sophisticated software program.
Numerous Ready-to-go Application Protocols Noraxon’s latest MyoResearch XP software features many protocols, such as Gait Analysis, Incon-
tinence and Isokinetics, which perform immediate analysis with the push of a few buttons! From
Postural Analysis to Gait Analysis, from Manual Muscle Function Tests to EMG Isokinetics,
Noraxon’s unique protocol system automatically guides you to meaningful results.
Choose the Market Leader! With the investment in our high-quality, manufactured products and superior lifetime customer ser-
vice, you can be assured you’re in good hands. With more than 500 installations worldwide,
Noraxon is the market leader for tethered and wireless multi-channel EMG & sensor systems.