Embed Size (px)
Citation preview
THE FRANKINCENSE TREE OF ETHIOPIA
ecology, productivity and population dynamics
Abeje Eshete Wassie
2011
ii
thesis committee thesis supervisor Prof. Dr. F.J.J.M. Bongers Personal chair at the Forest Ecology and Forest Management Group Wageningen University thesis co-supervisor Dr. Ir. F. J. Sterck Assistant professor at the Forest Ecology and Forest Management Group Wageningen University other members Dr. T. Bekele, Ethiopian Institute of Agricultural Research, Addis Ababa, Ethiopia Prof. Dr. L. Brussaard, Wageningen University Prof. Dr. J.C.J.M. de Kroon, Radboud University, Nijmegen Prof. Dr. B. Muys, Catholic University Leuven, Belgium This research was conducted under the auspices of the C.T. de Wit Graduate School of Production Ecology and Resource Conservation (PE&RC).
iii
THE FRANKINCENSE TREE OF ETHIOPIA
ecology, productivity and population dynamics
Abeje Eshete Wassie
thesis Submitted in fulfillment of the requirements for the degree of doctor
at Wageningen University by the authority of the Rector Magnificus
Prof. Dr. M.J. Kropff in the presence of the
Thesis Committee appointed by the Academic Board to be defended in public on Friday 01 July 2011 at 13.30 pm in the Aula.
iv
Abeje Eshete Wassie The frankincense tree of Ethiopia: ecology, productivity and population dynamics. Thesis, Wageningen University, Wageningen, NL (2011) With references, with summaries in English and Dutch ISBN: 978-90-8585-953-6

v
The research described in this thesis was financially supported by NWO-WOTRO (Netherlands Organization for Scientific Research- Science for Global Development) through the Integrated Program FRAME (Frankincense, myrrh and gum arabic: sustainable use of dry woodlands resources in Ethiopia), grant nr W01.65.220.00

vi

vii
To my father (Eshete Wassie) who passed before his dream comes true To my mother (Bosena Alemu) who did more than enough for my life

viii
ix
Abstract Combretum – Terminalia woodlands and Acacia – Commiphora woodlands are the two
dominant vegetation types that cover large parts of the dry land areas in Ethiopia. Several of
their tree and shrub species yield economically valuable products such as gum Arabic,
frankincense and myrrh. Boswellia papyrifera provides the widely traded frankincense that
accounts for >80% of the export revenues that the country is earning from gum and resin
resources. Unfortunately, the Ethiopian dry woodlands and the B. papyrifera populations are
disappearing rapidly due to the combined effects of over-harvesting gums and resins,
overgrazing by livestock, recurrent fires, and excessive wood harvesting. The current lack of
small saplings in the remaining populations of Boswellia suggests that the populations may
not be sustained for the future.
The main objectives of this thesis were to determine diversity and production patterns in B.
papyrifera dominated dry woodlands, to show the regeneration status in various B. papyrifera
populations, and to evaluate the effects of environment, frankincense harvesting, and grazing
on the population dynamics of B. papyrifera. The main research questions were: (1) how do
environmental conditions affect the tree/shrub species richness and production of Ethiopian
dry woodlands? (2) what factors determine the frankincense production by B. papyrifera
trees? (3) how do the vital rates and population dynamics of B. papyrifera vary across
habitats that differ in soil conditions and biotic factors? (4) What are the major bottlenecks in
the life cycle of the trees that hinder the sustainability of the remaining populations? To
address these questions, tree populations were studied in the highlands of Abergelle and the
lowlands of Metema. Metema also has a longer wet season length, higher annual rainfall and
better soil fertility status than Abergelle.
In total 36 and 22 tree and shrub species representing 20 and 9 families were recorded in
Metema and Abergelle woodlands, respectively. The most dominant plant families were
Burseraceae, Fabaceae, Combretaceae and Anacardiaceae. The vegetation at both sites was
dominated by B. papyrifera. The two sites differed in species richness, diversity and
production. Metema, the site with the longer wet season, had a higher species richness,
diversity and production than Abergelle. The productivity of woodlands also increased with a
x
higher clay content and greater soil depth. Populations structures indeed lacked the saplings,
except for one very isolated population on a steep mountain slope.
The studied frankincense trees produced 41 to 840 gram of frankincense during a year with
seven collection rounds, and 185 to 1826 gram of frankincense during a year with 14
collection rounds. The variation in frankincense production was large across individuals.
Frankincense production increased with tree size, tapping intensity, and tapping frequency.
The increase in production, however, levelled-off beyond a stem diameter of 20 cm, a tapping
intensity of 9 spots, and a tapping intensity of 10 rounds. Growth rate, survival rate and
fruiting probability varied across populations, but were not related to soil conditions or biotic
factors. The growth rates of the 12 Metema populations varied between 0.86 to 0.98,
suggesting that they were all decreasing. Matrix model analyses indicated that the mortality
of adult trees was the major bottleneck for sustainable population growth, and that the lack of
sapling recruitment was a second major bottleneck. These bottlenecks appear both in tapped
and non-tapped stands. Remarkably, tapped stand showed higher growth rates than non-
tapped stands, probably because productive stands were selected for harvesting resin.
All results suggest that the remaining populations of B. papyrifera will disappear in the near
future if the current situation continues. Frankincense production is expected to halve in 15-
20 years. Unexpectedly, tapping had no negative effect on vital rates, nor on population
growth rates indicating that other factors are responsible for the decline of the populations.
Adult mortality by insect infestation and windfall, and the negative impact of grazing and fire
on the establishment of saplings need extra attention. Management should be directed
towards releasing two major population bottlenecks (improve sapling regeneration, reduce
adult mortability) to maintain the Boswellia populations and frankincense production in the
future.
Keywords: Boswellian papyrifera, Frankincense tree, matrix model, population dynamics,
population bottleneck, tapping.

xi
Contents Abstract ix
Chapter 1 1
Introduction
Chapter 2 13
Diversity and production of Ethiopian dry woodlands explained by
climate - and soil - stress gradients
(Forest Ecology and Management 261:1499-1509)
(Abeje Eshete, Frank Sterck & Frans Bongers)
Chapter 3 37
Frankincense production from Boswellia papyrifera
(Submitted for publication)
(Abeje Eshete, Frank Sterck & Frans Bongers)
Chapter 4 53
Limitations to sustainable frankincense production: blocked regeneration,
high adult mortality and declining populations
(Submitted for publication)
(Peter Groenendijk , Abeje Eshete, Frank Sterck, Pieter Zuidema,Frans Bongers)
Chapter 5 77
The collapse of Frankincense tree populations and frankincense production
is unaffected by soil conditions and biotic factors
(Abeje Eshete, Frank Sterck, Pieter Zuidema, Tesfaye Bekele,
Kindeya Gebrehiwot & Frans Bongers )
Chapter 6 99
Synthesis
References 111
Summary 131
Samenvatting 135
Acknowledgements 139
Short biography 143
Publications 145

xii
Education Certificate 147
The FRAME project 149
CCh
In
ha
ntr
ap
rod
pte
duc
er
ctio
1
on

Chapter 1 – Introduction
2
SPECIES RICHNESS AND DIVERSITY OF TROPICAL DRY FORESTS
Tropical dry forests occur at a lower annual rainfall and stronger seasonality in rainfall than
the wetter tropical rain forests . Tropical dry forests are poorer in species than rain forests
(Gentry 1995), which has been attributed to a longer dry season and a lower annual
precipitation. Dry forest are however very diverse and differ in the vegetation composition,
structure, species richness and diversity due to different climates, soils, biogeographic
histories and disturbance regimes across the globe or at more local scales (Murphy and Lugo
1986b). How and why the tropical forest productivity and diversity varies so largely at
different spatial scales inspired ecologists for collecting large datasets of tropical forests
(Gentry 1995), but the drier forest are relatively poorly know in this respect.
For tropical dry forests a number of variables have been identified that are associated with
plant species richness and diversity. Variables affecting species richness include annual and
seasonal distribution of precipitation, temperature, soil nutrients, habitat area and various
forms of disturbance, such as fire, grazing and plant or plant product harvests by people. The
amount of annual precipitation and a shorter dry season are correlate positively with species
richness, but not anymore when the rainfall threshold has been reached that allows for a
closed-canopy dry forest (Gentry 1988, Ter Steege et al. 2000). Soil nutrients also play a role,
but the greatest plant species richness is observed at intermediate nutrient values (Huston
1979, Tilman 1982, Ashton 1992). With increasing altitude, the general trend is a decline in
species richness (Wassie et al. 2010b, Gentry 1988, Lieberman et al. 1996). Anthropogenic
disturbances is widely believed to influence species diversity in these dry forests (Connell
1978, Huston 1979). The intermediate disturbance hypothesis proposed that species richness
peaks at intermediate disturbance level because superior competitor species monopolize
resources and exclude other species at low levels of disturbance, whereas at high disturbance
levels only the most damage resistant species survive (Grime 1973; Connell 1978). Several
research studies tried to validated the hypothesis (Bongers et al. 2009; Molino & Sabatier
2001), but the empirical proof is not general for tropical forest and is particularly poorly
known for dry forests (Mackay and Currie 2001).

Chapter 1 – Introduction
3
TROPICAL DRY FORESTS PRODUCTS
Forests provide a great variety of products and services to human kind. The major economic
value of forests comes from wood of trees, used or traded as lumber, plywood, fuel wood or
charcoal. Other economic importance include food, medicines, fodder for livestock, natural
gums, etc. The latter collectively called non-timber forest products (NTFPs) (Ros-Tonen et
al. 1995). For tropical dry forests, NTFPs are a major source of livelihood and cash income
for the majority of rural households and many urban households as well in developing
countries (FAO 1989, Wollenberg & Ingles 1998 1998, Lemenih et al. 2003).
While less rich in species than wet forests, tropical dry forest provide habitats for a large
number of tree species (Hegner, 1979; Murphy and Lugo, 1986a; Wassie et al., 2010a; White,
1983), many of them being used by local communities for a multitude of products and
services. Countries that consist of large dry tropical forests, such as many countries in Africa,
do not export timber in quantities as observed for countries with tropical rain forests
(Dufournaud et al., 1995), but rather provide sources of fuel, construction, and furniture to
local or international markets. Fuel wood provides >80% of the energy supply in most Sub-
Saharan countries (Pearce and Turner, 1990). Dry forests also provide NTFPs like resins,
gums, bark, leaves, grass, bamboo, fern, tubers, fruits, fungi, honey, bees wax, animal
products etc, that are used for food and medicine and as sources for running a local cash
economy. Some of NTFPs are widely traded in local, regional and international markets, such
as natural gum and resins of dry forests running from east to west below the Sahel in Africa.
Gum Arabic and Frankincense are traded in the greatest volumes and improve livelihoods of
local communities in terms of products and income, and also provide national foreign
exchange earnings (Lemenih et al. 2003, Chikamai 2002). Moreover, the trees that produce
such product are also important as buffer against soil erosion and desertification (Pearce et
al., 1990). In this thesis, I studied Ethiopian tropical dry forest, or woodland, dominated by
the resin producing Frankincense trees.
Chapter 1 – Introduction
4
ETHIOPIAN DRY FORESTS/WOODLANDS
Ethiopia’s total surface area amounts 1.22 million km2. The country is ecologically very
diverse owing to diverse physio-geographic features with high and rugged mountains, flat
topped plateaux, deep gorges, incised river valleys and rolling plains. The altitudinal diversity
ranges from 110 m below sea level to 4620 m above sea level. Ethiopia experiences a very
high variation in macro and micro-climatic conditions that have contributed to the formation
of diverse ecosystems inhabited with a great diversity of life forms of both animals and
plants. The mean annual rainfall ranges from 500 to 2800 mm and with high variation in
temperature (>30 oC and < 10 oC (Demissew and Nordal 2010, Such diverse ecological
conditions enabled the country to inhabit > 7000 higher plants of which about 12% is
considered to be endemic (Tewolde 1991).
While Ethiopia is considered a mountainous country, more than 70% of the land surface is
considered lowland dry area (Tamire, 1997). The Institute of Biodiversity Conservation (IBC
2007) has grouped vegetation of Ethiopia into 10 categories based on the results of other
studies and, more recently, Friss et al. (2010) classified the vegetation resources of Ethiopia
into 12 vegetation types, out of which seven are encountered in dry lowland areas. The two
dominant dry forest types in these dry land areas are the Combretum – Terminallia
woodlands and the Acacia – Commiphora woodlands.
The Combretum–Terminalia woodland and wooded grassland vegetation that are located in
the lowland dry areas occur in large parts of the lowland of north western and western parts
(Gondar, Gojam Wellega, Illubabor) and south western region (Gamo Gofa, Kefa) of the
country. This Combretum–Terminalia woodland vegetation is often dominated by a
combination of Boswellia papyrifera, Anogeissues leiocarpa, Terminalia brownii,
Combretum collinum, Balanites aegyptiaca, Commiphora africana, Erythrina abyssinica,
Stereospermum kunthianum, Gardenia lutea, Lannea schimperi, Piliostigma thonningii, and
Lonchocarpus laxiflorus. The species composition varies most strongly with altitude, ranging
from 500 masl to 1.900 masl (Awas et al. 2001, Awas 2007). Eighty percent of the 199
woody species recorded here are considered endemic for this vegetation. This vegetation

Chapter 1 – Introduction
5
provide livelihood diversification, wood and food security, animal feed, human health care
and environmental conservation to rural and urban households (Lemenih and Teketay 2003a).
The Acacia – Commiphora woodlands occur in the north, east, south and central parts of the
country, mainly east of the highlands and in the rift valley (Friis et al. 2010). The common
species in this vegetation type include species of the genera Acacia, Commiphora, Zizyphus,
Maerua, Cadaba, Boscia, Euphorbia, Aloe, and Sansevieria. The most common species
include Acacia tortilis, A. etbaica, A. seyal, A. abyssinica, A. spirocarpa subsp. spirocarpa,
A. mellifera, Ballanites eagyptica and Erythrina, Aerva spp., Acalypha spp., and Barleria
spp. This composition also varies mainly with altitude, also running from 500 to 1900 m.a.s.l.
Annual rainfall is however lower and ranges from 410 to 820 mm. Of the 565 species
recorded, 286 (~53%) are considered endemic. The Combretum – Terminalia woodland and
Acacia – Commiphora woodland are both dominated by gum and resin producing tree
species, and the gums and resins in particular Arabic gum and Frankincense are economically
very important non-timber forest products.
FRANKINCENSE: A MAJOR NON-TIMBER FOREST PRODUCT OF ETHIOPIA
The main sources of frankincense are tree or shrub species of the genera Boswellia
(Burseraceae). The genera Boswellia is composed of about 20 species. The six Boswellia
species of Ethiopia include B. microphyllae, B. neglecta, B. ogadensis, B. rivae, B. papyrifera
and B. pirrotae (Vollesen, 1989). Of the three frankincense types Tigray, Ogaden and
Borena, the Tigray frankincense type produced by B. papyrifera through tapping its bark is
the most widely traded from Ethiopia and accounts for >80% of all gum and resin export
(Eshete 2002, Tadesse et al. 2007). Organizations or local cooperatives are engaged in
collecting, processing and marketing this product, but local communities may also harvest
more locally. Moreover, people may benefit from the activities of the more commercial
enterprises providing employment. Frankincense has been and is still used for religious
rituals and the traditional coffee ceremony, as well as for yielding volatile oils, balsamic
odours, which are used in perfumery industry (Lemenih and Teketay 2003b).
Chapter 1 – Introduction
6
Adequate information is lacking on the potential as well as the actual production of gum and
resin in Ethiopia (Tadesse et al. 2002, 2007). Fitwi (2000), however, indicated a potential of
more than 300,000 metric tons of natural gum per year. While the actual maximum
production was only 3,421 tons in 1994 during the period 1992-1999 (Fitwi, 2000) indicating
that the resource is being underutilized. The major economic importance of gum and resin
resources in Ethiopia is the generation of income to the government and foreign currency to
the country. The total value of gum and resins exports from Ethiopia was US $34,138,670 for
the period between 1998 to 2007 from the export of 25,192 tons, approximately an average of
2,519 tons per year (Lemenih and Kassa 2008). None the less, the total amount of gum and
resins produced and exported in Ethiopia showed an increasing trend from 1976 to 1994, but
after 1994 the production showed fluctuations due to several factors such as drought,
prolonged cold weather, policy changes, security problem, and decrease in number of
harvestable trees (Tadesse et al. 2002).
FRANKINCENSE PRODUCTION AND MANAGEMENT
Commercial production of gum and resin in Ethiopia is an old activity. Gum and resins in
Ethiopia has been produced formally on a commercial bases by “Tigray Agricultural and
Industrial Development Limited” (TAIDL) since 1948. TAIDL was then replaced by Natural
Gum Processing and Marketing Enterprise (NGPME) during the Derg regime in 1977/78.
NGPME was the sole governmental organization responsible for the collection, processing
and marketing of gum and resin in Ethiopia until the dawn fall of the Derg regime in 1991.
Since 1992, a free market economic policy was installed in the country that leads to the
increase in the number of organizations that involve in the collection, processing and
marketing of the gum and resins. At present, more than 15 organization involved in the
business (Eshete 2002).
Kebede (2010) identified three kinds of gum and resin production system at the Metema,
north western Ethiopia based on the nature of the organization involved in the production and
marketing of gum and resins, how the production site is managed, how the employees (skilled
or unskilled labourers) are arranged and capital resources of the organizations. The three
systems are direct collection, concessions and farming-integrated. Under direct collection
Chapter 1 – Introduction
7
system, only one governmental organization (NGPME) is involved whereas in the other two
systems a number of organizations (private or farmer cooperatives) are involved. In all cases,
gum and resin are collected from natural stands that belong to the property of the state and
the people. The collection of gum and resin resources in the south and south eastern of
Ethiopia is mainly practiced by individuals that sell the products to licensed organizations. In
the north, north western and western Ethiopia the collection of the products is practiced by
licensed organizations. Very recently, farmers cooperatives start the collection, but are
obliged to sell to the licensed organizations or to become business partner with licensed
organization (Habebo et al. in preparation, Kebede 2010). Production license is issued by the
Regional Commerce and Industry Bureau upon the request of the organization that full fill the
requirements set by the Bureau (Eshete 2002; Kebede 2010). Licensed organizations shall
apply to regional and local agricultural offices to lease production site on yearly bases that is
subjected to renewal annually (Kebede 2010). The sustainable utilization of the gum and
resin resources rests upon the licensed organization through written agreement with Regional
bureau of Agriculture (personal communication).
CHALLENGES FOR SUSTAINABLE GUM AND RESIN PRODUCTION IN ETHIOPIAN WOODLANDS
The areas in which Combretum - Terminalia and Acacia - Commiphora woodland vegetation
located are very hot, prone for malaria infestation, and inaccessible. As a result these areas
were sparsely populated (Teketay 2000). Recently, the number of inhabitants increased due to
population growth, migration of people from dry highlands and government resettlement
programs (Eshete 2002). Today the vegetation is being cleared for agriculture by native
inhabitants, temporary and permanent settlers, which are coming into the area through the
national resettlement program. Thus, expansion of farmlands is one of the major threats for
the vegetation. Moreover, these vegetations are the grazing areas throughout the year for the
native people and seasonally (during the rainy season) for the nearby mid highlanders and
highlanders (Eshete, 2002). The large livestock population of both the native inhabitants and
nearby inhabitants degraded and is still degrading the vegetation. Today, there is heavy,
unregulated and unmanaged grazing by large numbers of livestock. This even increased the
already high pressure on the remaining vegetation resources (Tedla and Lemma 1998).
Consequently, the increasing levels of disturbance by grazing might create a problem for the
Chapter 1 – Introduction
8
regeneration of this species, and threaten the persistence of the B. papyrifera populations and
the Frankincense yield in the long run.
A second threat is the more intensive use of the remaining population for frankincense
production by an increasing amount of people and, moreover, commercial companies.
Tapping for frankincense impacts the trees negatively since they reduce the survival, growth
and reproduction of trees (Ogbazghi, 2001; Rijkers et al 2006). The current tapping system
has been condemned by several researchers impling that it is too intensive and damaging. So
far there is no systematic effort to conserve these trees or to develop sustainable harvest
systems for it (Gebrehiwot 2003). The current results suggest that the remaining populations
of Frankincense trees are declining at an alarming rate and that tapping might be one of the
major underlying causes.
The challenge is to understand the overall impact of this mix of factors and thus predict the
future of the remaining populations and, if possible, provide sustainable management actions
for those populations. I provide the first study with extensive quantitative information over
the entire life cycle of B. papyrifera trees, analyze their present and future productivity, and
the impact of climate, soil, tapping regime and disturbance by grazing and other factors on
the population dynamics, and on the productivity and diversity of the whole dry woodland
communities.
LIFE CYCLE DYNAMICS OF B. PAPYRIFERA AND HUMAN IMPACTS
Overexploitation of the vegetation that harbors gum and resin bearing tree species has
significantly increased since the arrival of humans in and around the vegetation through the
national settlement programs. Inhabitants usually practice mixed agriculture which resulted in
the conversion of large forested areas to agricultural fields. The forest vegetation is also
subject to overgrazing throughout the year. Besides, fire is the most commonly used tool for
various activities. Collection and marketing of natural gums as a source of income at
household and national level has shown a remarkable increased in the last few decades. The
organizations now employ a more intensive and greater frequency tapping regime. Hence, the
present scale and extent of exploitation is different from the previous times, and with that the
Chapter 1 – Introduction
9
current impact of exploitation on population dynamics of gum and resin bearing tree species
probably will be higher.
The focus of this thesis is to identify the specific life stage and demographic processes that
act as a bottleneck to maintain the population of B. papyrifera and the anthropogenic factors
that negatively affect the specific stages in the life cycle of the study species. For this
purpose, the life cycle of B. papyrifera has been categorized into four stages: seedlings,
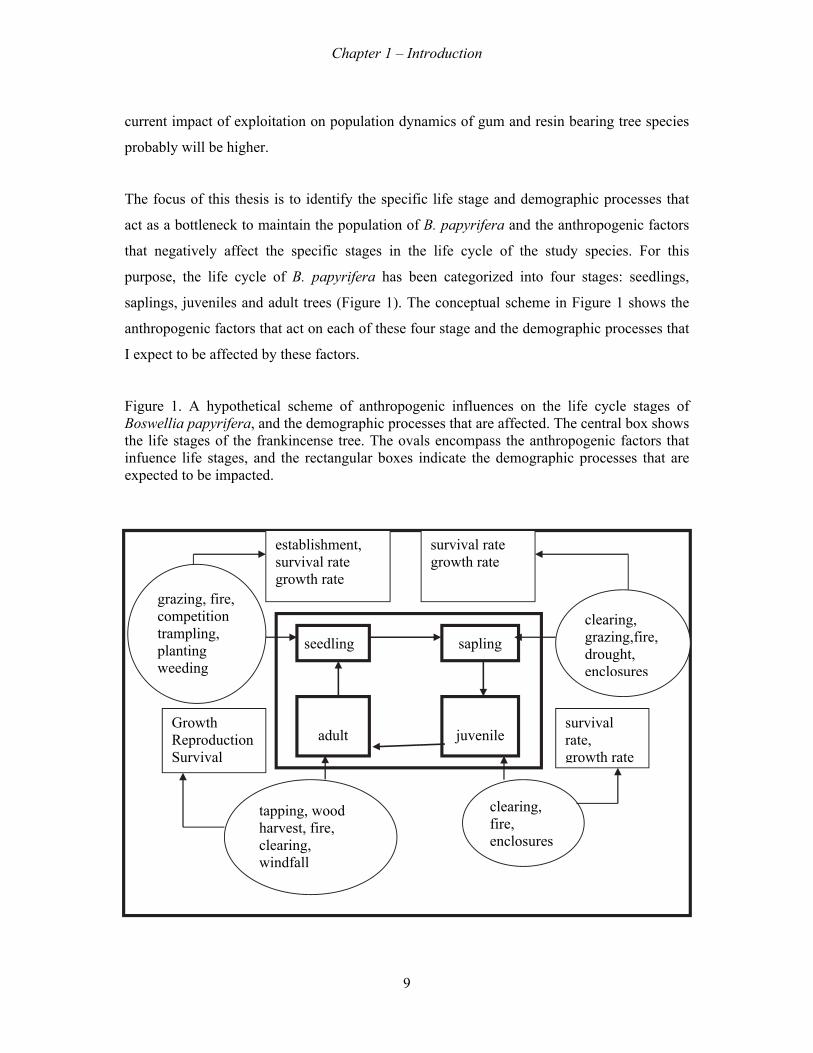
saplings, juveniles and adult trees (Figure 1). The conceptual scheme in Figure 1 shows the
anthropogenic factors that act on each of these four stage and the demographic processes that
I expect to be affected by these factors.
Figure 1. A hypothetical scheme of anthropogenic influences on the life cycle stages of Boswellia papyrifera, and the demographic processes that are affected. The central box shows the life stages of the frankincense tree. The ovals encompass the anthropogenic factors that infuence life stages, and the rectangular boxes indicate the demographic processes that are expected to be impacted.
seedling sapling
juvenile
adult
grazing, fire, competition trampling, planting weeding
clearing, grazing,fire, drought, enclosures
clearing, fire, enclosures
tapping, wood harvest, fire, clearing, windfall
survival rate growth rate
establishment, survival rate growth rate
Growth Reproduction Survival
survival rate, growth rate
Chapter 1 – Introduction
10
Grazing and recurrent fire limit the successful establishment, survival and growth of
seedlings of the palatable and fire intolerant frankincense tree species. Besides, increased fire
frequency and overgrazing of the vegetation could result in degradation of the habitat by
decreasing its potential to maintain the tree population. This may lead to the decline of the
frankincense tree population, an increase in the current population of fire and grazing tolerant
species and an introduction of new tolerant tree species. Currently, B. papyrifera trees are
being tapped improperly. The more intensive and greater frequency tapping regime that has
been used recently is considered to impact tapped trees negatively.
At the other end of human intervention, the inhabitants as well as concerned governmental
and non-governmental organization could play a significant role in maintaining the declining
B. papyrifera populations and restoring the degrading ecosystems. This would be possible
through implementing active management directed at encouraging natural regeneration,
establishment of new seedlings of tree species that exhibited unstable population, or
increased reproduction and survival of adult trees. This is a crucial process to develop a self-
sustained population. These would be possible through removal of the indicated
anthropological factors (i.e. installing enclosures) and improving the environmental
conditions that help for successful establishment and increased survival and growth rate of
established seedlings with the application of management practices, like cultivation of soil to
improve the soil condition, weeding to reduce competition and providing adequate
reproductive materials (seed and/or seedlings) and developing scientifically proved tapping
methods. This thesis evaluated the likely effects on population growth rates of various
management actions using population matrix models.
OBJECTIVES AND RESEARCH QUESTIONS
This thesis aims at (1) evaluating how environmental factors (climate and soil conditions) affect
species richness, diversity and productivity of Ethiopian dry woodlands, (2) determining how
the tapping regime impacts frankincense production by Boswellia papyrifera, and (3)
identifying the bottleneck for sustainable population dynamics and resin yield, and forecasting
the potential effects of various human interventions on those dynamics. This is crucial for

Chapter 1 – Introduction
11
development of long-term sustainability and use of these dry lowland woodlands . This thesis
addresses the following research questions: (1) how dry tropical woodlands in Ethiopia vary in
the production by woody plants and in woody plant richness and diversity? (2) what factors
determine frankincense production by B. papyrifera? (3) what is the impact of tapping for
frankincense production on vital rates and population dynamics of B. papyrifera? (4) How do
vital rates (reproduction, stem growth, survival) and population growth rates of B. papyrifera
populations vary among populations differing in soil conditions? and (5) What are the
bottlenecks for achieving persistent B. papyrifera populations?
THESIS OUTLINE
This thesis consists of six chapters. In Chapter 2, I describe the species composition of
Ethiopian dry woodlands and evaluate the effect of climate (wet season length) and soil
conditions on the species richness, diversity and productivity of Ethiopian dry woodlands. In
addition, the population structures of the community and B. papyrifera populations are
described, showing the general lack of smaller frankincense individuals. In Chapter 3, I show
how different factors affect the frankincense production by Boswellia papyrifera. In particular,
it is evaluated how annual frankincense production depends on tree size and tapping methods
differing in intensity and frequency. In Chapter 4, I deal with the effects of tapping for
frankincense production on the vital rates and population dynamics of B. papyrifera
populations at Metema. Matrix models are applied to analyze the population dynamics and
identify the major bottlenecks for the maintenance or growth of B. papyrifera populations
located at different management regimes. Subsequently, matrix models are used with 3
different human intervention scenarios to determine future B. papyrifera populations and
frankincense production. In chapter 5, I show an analysis of the population dynamics of B.
papyrifera across its habitat range and I evaluate the effects of soil conditions on vital rates on
elasticity values and population growth of B. papyrifera populations. And finally, in Chapter 6,
I summarize the main results of this thesis and provide a general discussion. Because each
chapter was written in a paper format, some overlap could not be avoided in the introduction
and methods section of the chapters.
Chapter 1 – Introduction
12
STUDY SITES
This study was conducted in the lowland dry woodlands of Abergelle and Metema located in
the northern and north western Ethiopia, respectively. The vegetation in these sites are known
as the Combretum–Terminalia woodland vegetation (Friss et al. 2010, Teketay, 2000). These
woodlands have been classified under “undifferentiated woodlands in Ethiopia and Sudan
Republic” by White (1983). Such woodlands are often encountered in degraded sites with
shallow soils, steep rocky slopes, lava flows or sandy river valleys (Fichtl and Admasu, 1994;
Teketay, 2000) and are co-dominated by one or more tree species that produce gum or resin
(Lemenih et al. 2003; Ogbazghi et al 2006b). The rainfall is characterized by a unimodal
distribution in both sites with mean annual rainfall of 965 mm and 800 mm at Metema and
Abergelle, respectively. The rainy season (>100 mm/month) lasts for 4 months from June till
September at Metema and for 3 months from June to August at Abergelle. Diurnal minimum
and maximum temperature per month are 19.6 and 35.7 ◦C and 14.2 and 29.3 ◦C at Metema
and Abergelle, respectively. In both study areas the forest vegetation is dominated by the
frankincense tree Boswellia papyrifera.
I established 18 permanent plots: 12 plots at Metema and 6 plots at Abergelle in August 2007.
The size of each plot ranges from 1.6 ha to 2 ha and distance between plots ranged from 2.5 km
to 30 km within a study site. Each permanent plot was divided into 20 m × 20 m subplots
where all ≥1.5m tall trees and shrubs were systematically surveyed by identifying, measuring
and coding them. I measured the stem diameter, using a diameter tape at breast height (1.3 m
above the ground). Stem height (to the top of the crown) was measured using a telescopic pole
up to 12 m, and with a Suunto clinometer for taller trees. Local names for tree and shrub
species were recorded and individuals were identified to species level at the site. Altitude of all
plots was also recorded. All trees and new recruits were re-measured in August 2008 and
August 2009.
DDiveerssity
(P
y a
Pub
and
lish
d pr
hed
rod
d in
duc
n: F
cti
ore
ion
est
n of
Eco
f E
A
olo
Eth
Abej
ogy
hiopc
eje E
an
piaclim
Esh
nd M
an ma
het
Man
dryate-
te, F
nag
y w- a
Fra
gem
wooand
ank
men
odld so
k Ste
nt 2
lanoil-
erc
61
C
ndsl-st
ck &
(20
Ch
s extres
& F
011
ha
xpss g
Fran
1):1
ap
plaigra
ns B
149
pte
ineadi
Bon
99-1
er
ed bien
nge
150
2
by nts
ers
09)
Chapter 2 - Diversity and production
14
ABSTRACT
Dry woodlands cover about 14% of the total African land surface and represent about 25% of
the natural vegetation. They are characterized by a seasonal climate, with a dry season of 4–7
months. Large parts of these ecosystems are degrading due to grazing, fire or exploitation by
people. We studied species richness and productivity patterns of dry woodlands in Ethiopia.
For such ecosystems, classic productivity and diversity hypotheses predict that species
richness and productivity increase as the wet season length increases, and decrease when soil
conditions create water stress. We inventoried and measured trees in 18 2-ha plots distributed
in two sites, one higher altitude site with a shorter wet season than the lower altitude site. We
found that the stand volume per hectare was lower in the site with a shorter wet season.
Across all 18 plots we observed that stand volume decreased with soil water stress (estimated
from texture and depth). This was in line with the prediction. The species richness was lower
in the short-wet season woodlands, but was unaffected by variation in soil conditions. This
suggests that climate driven constraints (wet season length) set the limits to species richness,
and not soil conditions. As far as we know, this study is one of the first studies that evaluated
these productivity and diversity hypotheses for dry African woodlands.
Keywords: Dry woodland, Ethiopia, Frankincense tree, Matrix model, Population dynamics,
Productivity, Species composition, Species richness
Chapter 2 - Diversity and production
15
INTRODUCTION
Dry tropical forests or woodlands once covered over 40% of the global tropical forest areas
(Mayaux et al., 2005) and 14% of the total African surface. These forests however decline
rapidly in area by the expansion of agriculture and pasture lands (Gerhardt, 1993; Janzen,
1988; Miles et al., 2006). About 97% of the remaining dry tropical forests are at the risk of
being further fragmented and degraded by fire, fuel wood collection (Lerdau et al., 1991;
Miles et al., 2006; Mittermeier et al., 1999) and grazing damage (Yates et al., 2000). Tropical
dry forest, defined as frost-free regions with 500–2000 mm annual precipitation and a dry
season of four to seven months (Bullock et al., 1995; Walter, 1971), differs significantly from
wet tropical forests in structure, diversity, species composition, leafing phenology, and other
functional aspects (Bullock et al., 1995). While less rich in species than wet forests, tropical
dry forest provides habitats for a large number of tree species (Hegner, 1979; Murphy and
Lugo, 1986a; Wassie et al., 2010a; White, 1983), often used by local communities for a
multitude of products and services. In the present study, we investigate how dry tropical
woodlands in Ethiopia vary in the production by woody plants and in woody plant richness
and diversity.
The production in tropical dry forest is expected to be greater with a more extensive rainy
season and more fertile and deeper soils where texture improves water availability. It is less
obvious how species richness will vary along such environmental gradients. The classical
theories that have been developed for explaining broad diversity patterns suggest that
diversity peaks at intermediate levels of disturbance (Bongers et al., 2009; Connell, 1978) and
abiotic stress (Huston, 1979; Michalet et al., 2006). For example, species diversity might be
highest at intermediate productivity levels when only few species are able to survive at high
stress levels, few rapidly growing competitors dominate at low stress levels, and both groups
of species survive at intermediate stress levels. It is however not yet clear how this hypothesis
holds for dry tropical woodlands, which have been poorly studied in this respect (but see
Bongers et al., 2009). For tropical dry woodlands the long dry season obviously creates
stressful conditions, while water shortage generally is inferior in wet tropical forests.
Moreover, dry forests are more often disturbed by grazing and fires (Miles et al., 2006; Yates
et al., 2000), which remove biomass frequently and hinder the dominance by few competitive
Chapter 2 - Diversity and production
16
species (cf. Grace and Jutila, 1999; Huston, 1979). For the tropical dry woodlands studied
here we thus predict a higher species richness with lower abiotic stress, as provided by
climatic or soil conditions.
In the present paper, we test these predictions for dry woodlands in northern Ethiopia, co-
dominated by the Frankincense tree, Boswellia papyrifera (Del.) Hochst. We predicted that
productivity (using tree size and stand volume as proxies) and species richness increase with
wet season length and for deeper soils with a texture and composition that better supplies
nutrients and water to plants. We explore predictions with a correlative field study of dry
tropical woodlands in two contrasting areas in Ethiopia, and associated soil and vegetation
properties across 18 dry woodland stands. The studied woodlands include the climatic
extremes of the “Combretum–Terminalia woodlands”, co-dominated by B. papyrifera, in the
Horn of Africa.
MATERIALS AND METHODS
Study site
This study focuses on dry woodlands that are known as the Combretum–Terminalia or
Acacia-Commiphora woodland vegetation (Teketay, 2000). Such woodlands are often
encountered in degraded sites with shallow soils, steep rocky slopes, lava flows or sandy river
valleys (Fichtl and Admasu, 1994; Teketay, 2000). These woodlands are co-dominated by
one or more tree species that produce gum or resin (Lemenih et al., 2003; Ogbazghi et
al.,2006b). The selected sites of this study were co-dominated by the Frankincense producing
tree, B. papyrifera. These woodlands have been classified under “undifferentiated woodlands
in Ethiopia and Sudan Republic” by White (1983). In Ethiopia, more than half of the
country’s land area is located in such dry areas and associated tropical dry forest (NCSS,
1993). Moreover, these woodlands extend in large areas in other parts of Africa, including
Nigeria, Cameroon,Central African Republic, Chad, Uganda, Sudan and Eritrea (White,
1983). The forests consist of many species providing timber and non-timber products to local
communities (FAO, 1995). Owing to high human pressure and migration programs, they are
cu
po
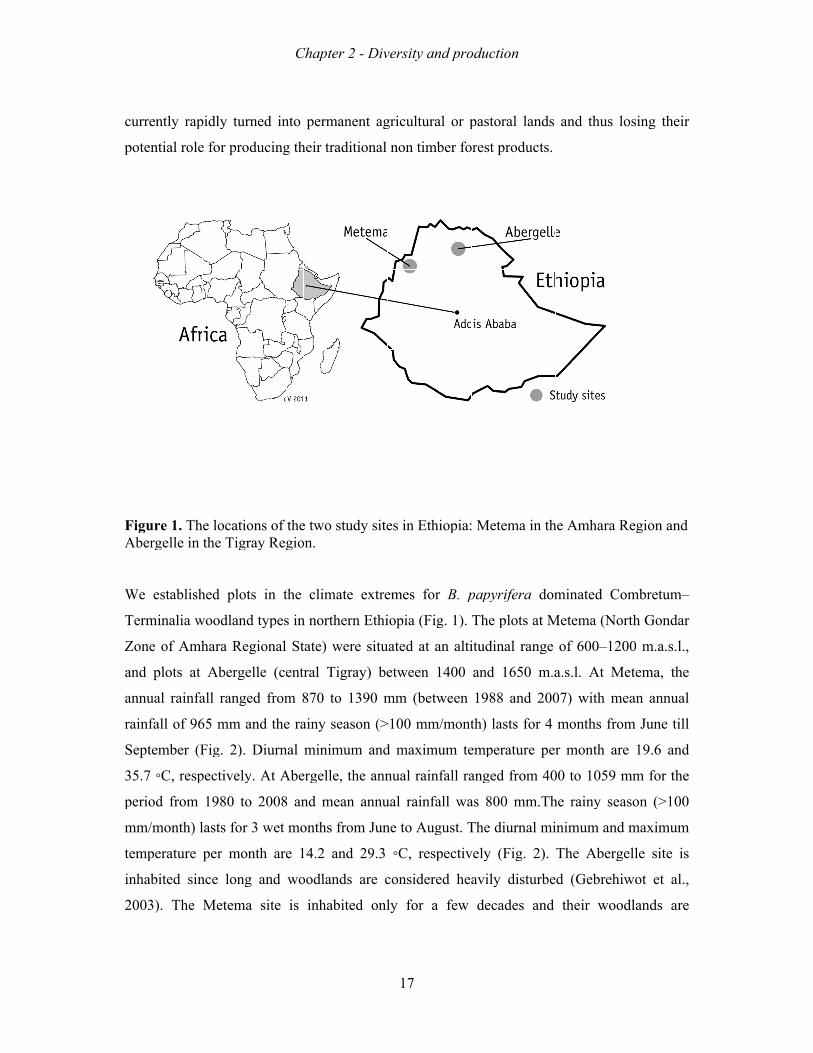
FiA W
Te
Zo
an
an
ra
Se
35
pe
m
te
in
20
urre
oten
iguber
We
erm
one
nd
nnu
ainf
epte
5.7
erio
mm/
mp
nhab
003
entl
ntia
ure rge
est
min
e of
plo
ual
fall
em
◦C
od
mo
pera
bite
3).
ly r
al r
1. lle
tabl
alia
f A
ots
rai
of
mber
C, re
fro
onth
atur
ed
Th
rap
role
Thin
lish
a w
Amh
at
infa
f 96
r (F
esp
om
h) l
re
sin
he
pidl
e fo
e lothe
hed
woo
har
Ab
all
65 m
Fig
pect
19
last
per
nce
Me
y t
or p
ocae Ti
d pl
odla
ra R
ber
ran
mm
g. 2
tive
80
ts fo
r m
lo
etem
turn
rod
atioigra
lots
and
Reg
rgel
nge
m an
2). D
ely.
to
for 3
mon
ong
ma
ned
duc
ons ay R
s in
d typ
gion
lle
d f
nd
Diu
. A
20
3 w
nth
an
si
d in
cing
of Reg
n t
pes
nal
(ce
from
the
urn
At A
008
wet
are
nd
te
C
nto
g th
thegio
the
s in
St
ent
m 8
e ra
nal
Abe
8 an
mo
e 1
wo
is
Chap
pe
heir
e twon.
cl
n no
tate
tral
870
ainy
min
erge
nd
onth
14.2
ood
inh
pte
erm
r tra
wo s
ima
orth
e) w
Ti
0 to
y se
nim
elle
me
hs f
2 a
dlan
hab
er 2
mane
adit
stud
ate
hern
wer
igra
o 1
eas
mum
e, th
ean
from
and
nds
bite
2 - D
ent
tion
dy
ex
n E
re s
ay)
390
son
m a
he
n an
m J
29
ar
ed
Div
ag
nal
site
xtre
Ethi
situ
) be
0 m
(>
and
ann
nnu
Jun
9.3
re c
onl
vers
1
gric
no
es i
eme
iopi
uate
etw
mm
>100
d m
nua
ual
ne t
◦C
con
ly
sity
17
cult
on t
in E
es
ia (
ed a
ween
m (b
0 m
max
al ra
rai
to A
C, r
nsid
for
y an
tura
imb
Eth
for
(Fig
at a
n 1
betw
mm
ximu
ain
infa
Aug
resp
dere
r a
nd p
al o
ber
hiop
r B
g. 1
an a
140
wee
m/m
um
nfall
all
gus
pec
ed
a fe
pro
or p
r fo
pia:
B. p
1).
alti
00
en
mont
m te
l ra
wa
t. T
ctiv
hea
ew
odu
pas
ores
M
pap
Th
itud
and
19
th)
emp
ang
as 8
The
vely
avi
de
ctio
stor
st pr
Mete
pyrif
e p
dina
d 1
88
las
per
ged
800
e di
y (F
ily
ecad
on
ral
rod
ema
ifer
plot
al r
165
an
sts
atu
fro
0 m
iurn
Fig
dis
des
lan
duc
a in
ra
ts a
ran
50 m
nd 2
for
ure
om
mm.
nal
g. 2
stur
s a
nds
ts.
n th
dom
t M
nge
m.a
200
r 4
per
40
.Th
mi
2).
rbe
and
an
he A
min
Mete
of
a.s.
07)
mo
r m
00 t
he r
inim
Th
d (
th
nd t
Am
nate
em
f 60
.l. A
w
onth
mon
to 1
rain
mum
he A
(Ge
heir
thu
mhar
ed
ma (N
00–
At
ith
hs
nth
105
ny
m a
Abe
ebre
r w
us l
ra R
Co
No
–120
M
me
fro
ar
59 m
sea
and
erg
ehi
woo
osi
Reg
omb
orth
00
Mete
ean
om
e 1
mm
ason
d m
gelle
iwo
odla
ing
gion
bre
h Go
m.
ema
n an
Jun
19.6
m fo
n (
maxi
e s
ot e
and
th
n an
etum
ond
a.s
a, t
nnu
ne t
6 a
or t
(>1
imu
site
et a
ds a
eir
nd
m–
dar
.l.,
the
ual
till
and
the
00
um
is
al.,
are
Chapter 2 - Diversity and production
18
considered one of the least affected wooded vegetations in Ethiopia (Teketay, 2000), but this
situation is rapidly changing (Lemenih et al., 2007).
Plot establishment and sampling
A total of eighteen plots were established in August, 2007: 12 plots at Metema and 6 plots at
Abergelle. The distance between plots ranged from 2.5 km to 30 km within a study site. At
Metema more plots were established because dry woodlands covered a larger area and greater
heterogeneity in soil and tree physiognomy. Both at Abergelle and Metema, the Combretum–
Terminalia woodlands are dominated by B. papyrifera and are fragmented within a landscape
of other dry woodland types and, in some cases, surrounded by agricultural lands. While we
aimed at the establishment of 2 ha plots, some fragments were too small for a full 2 ha plot
(Appendix A). Taking a minimum distance of 2.5 km between plots, we consider different
plots as independent, approximate randomly selected replicates of the selected woodland
types in both areas. However, since selected plots were at walking distance (<5 km) from
existent roads and relatively easy to reach by people, we cannot exclude some bias to more
disturbed conditions by, for example, grazing and fire or tapping regime. For Abergelle, such
disturbances have a longer history (>50 years) than at Metema (<20 years), but at Metema the
same disturbances are rapidly become more frequent and intense, owing to new settlements
and new roads providing access to people. From that perspective, we expect that the historical
effects of disturbance on Abergelle wood lands are nowadays acting in many areas of
Metema woodlands, and certainly in the selected plots since they were accessible from the
current road and walk track system.
Each permanent plot was divided into 20 m × 20 m subplots where all ≥1.5m tall trees and
shrubs were systematically surveyed by identifying, measuring and coding them. For all
stems, also for different stems of the few multiple-stemmed shrubs, we measured the stem
diameter, using a diameter tape at breast height (1.3 m above the ground). Stem height (to the
top of the crown) was measured using a telescopic pole up to 12 m, and with a Suunto
clinometer for taller trees. Local names for tree and shrub species were recorded and
individuals were identified to species level at the site according to The Flora of Ethiopia
(Edwards et al., 1995, 1997, 2000; Hedberg and Edwards, 1989; Hedberg et al., 2003).
Fi(BmteG19obto
In
N
To
20
m
w
en
sa
sa
w
tra
A
de
pH
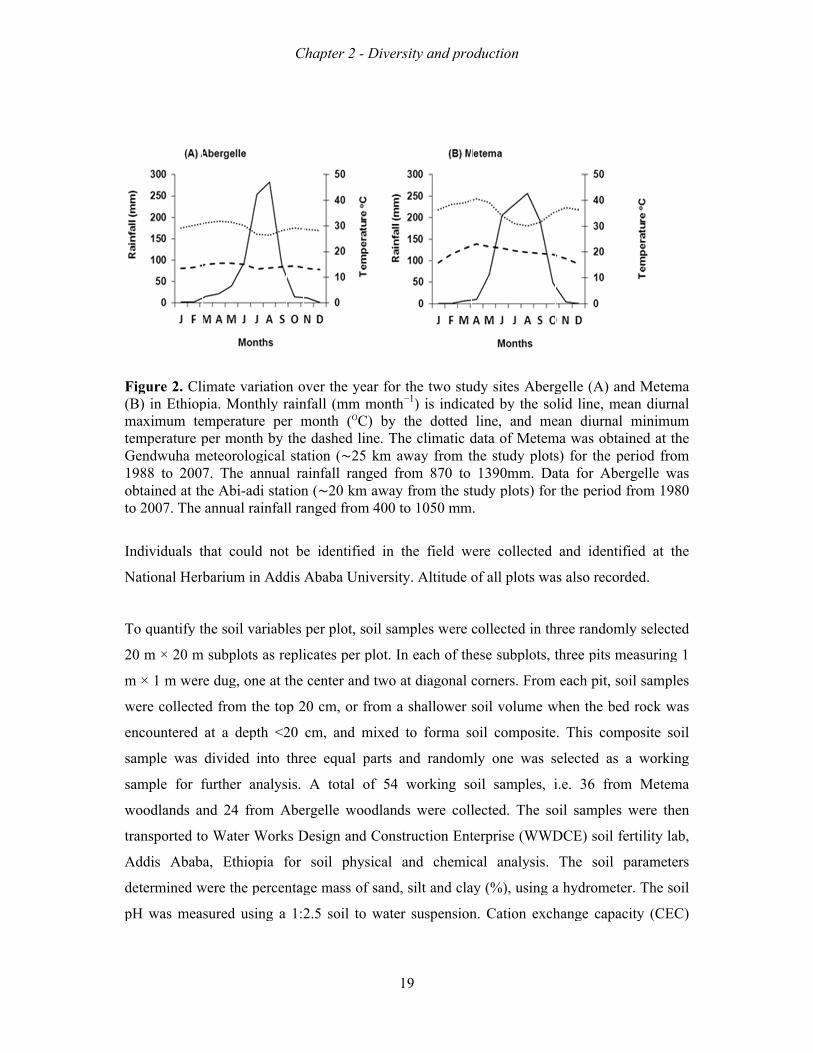
iguB) i
maximpend988btaio 20
ndiv
atio
o q
0 m
m ×
ere
nco
amp
amp
ood
ans
ddi
eter
H w
ure in Eimuperadwu8 toine007
vidu
ona
quan
m ×
1 m
e co
ount
ple
ple
dlan
spor
is
rmi
was
2. Ethum aturuhao 2d a
7. T
ual
al H
ntif
20
m w
olle
tere
wa
fo
nds
rted
Ab
ined
s m
Clihiop
tere pa m2007at thThe
ls t
Herb
fy t
0 m
wer
ecte
ed
as
or f
s an
d to
bab
d w
mea
imapia.empper
mete7. he Aann
that
bar
the
m su
re d
ed f
at
div
furt
nd
o W
a,
were
sur
ate . Mperar meorThAbnua
t co
rium
soi
ubp
dug
from
a d
vide
the
24
Wat
Et
e th
red
vaMon
atumontrolohe a
i-adal r
oul
m i
il v
lots
, on
m t
dep
ed
r a
4 fr
ter
hio
he p
us
arianthlure th bogicanndi s
rain
ld n
n A
vari
s as
ne
the
pth
int
ana
rom
Wo
opia
per
sing
ationly rpe
by cal nualstat
nfal
not
Add
iabl
s re
at t
top
<2
to t
alys
m A
ork
a f
rcen
g a
C
n orainer mthesta
l rationll ra
t b
dis
les
epli
the
p 2
20
thr
sis.
Abe
ks D
for
ntag
1:2
Chap
overnfalmone daatioainn (∼ang
e i
Ab
per
icat
ce
20 c
cm
ee
A
erge
Des
so
ge
2.5
pte
r thll (mnthashon (fall∼20ged
iden
baba
r pl
tes
nte
cm
m, a
eq
to
elle
sign
oil
ma
5 so
er 2
he ymm
h (O
hed (∼2l ra0 kfro
ntif
a U
lot,
pe
er a
, or
and
qual
otal
e w
n an
ph
ass
oil
2 - D
yeam mOC)lin
25angkm om
fied
Univ
, so
er p
and
r fr
d m
l p
l of
woo
nd
hys
of
to
Div
ar fmon) bne. km
ged aw40
d in
ver
oil s
plot
tw
rom
mixe
arts
f 5
odla
Co
ica
san
wa
vers
1
for nth−
by tTh
m awfr
way 0 to
n t
rsity
sam
t. In
wo a
m a
ed
s a
54
and
onst
al a
nd,
ater
sity
19
the−1) the
he cwayomfro
o 1
the
y. A
mpl
n ea
at d
sh
to
and
wo
ds w
truc
and
sil
r su
y an
e twis
e dclimy f
m 87om 050
fie
Alti
les
ach
diag
hallo
for
ra
orki
wer
ctio
d c
lt an
usp
nd p
wo indotte
matifrom70 the0 m
eld
itud
we
h of
gon
ow
rma
ando
ing
re c
on E
chem
nd
ens
pro
studicaed ic dm t
to e st
mm
w
de o
ere
f th
nal c
er
a s
om
g so
coll
Ent
mic
cla
sion
odu
udy atedlin
datthe
13tud
m.
were
of a
col
hese
cor
soi
oil
mly
oil
lect
terp
cal
ay (
n. C
ctio
sitd bne, a ostu
390y p
e co
all
llec
e su
rner
l v
co
on
sa
ted
pris
an
(%)
Cat
on
tes by t
anof Mudy0mmplot
olle
plo
cted
ubp
rs.
olu
omp
ne w
amp
d. T
se (
nal
), u
tion
Abthe nd Mety plm. ts)
ecte
ots w
d in
plot
Fro
ume
pos
was
ples
The
(WW
ysi
usin
n ex
bergsometemlotsDafor
ed
wa
n th
ts, t
om
e w
site
s s
s, i
e so
WD
is.
ng a
xch
gelolid ean
ma ws) fata r th
an
as a
hree
thre
ea
whe
. T
sele
i.e.
oil
DC
Th
a hy
han
le (lindi
wasfor for
e p
nd i
lso
e ra
ee p
ach
n th
This
ecte
36
sam
CE)
he
ydr
nge
(A)ne, iurns othe
r Aperi
ide
o rec
and
pits
pit
he
s c
ed
6 f
mpl
soi
soi
rom
ca
) anme
nal btae p
Abeod
ntif
cor
om
s m
t, so
bed
om
as
from
les
il f
il
mete
apac
nd ean
maineperiergefro
fied
rded
mly
mea
oil
d r
mpo
a w
m
we
ferti
par
er.
city
Men diminied aod elleom
d a
d.
sel
asur
sam
ock
site
wo
Me
ere
ility
ram
Th
y (C
etemiurnimuat tfro
e w19
at t
lect
ring
mpl
k w
e s
orki
etem
e th
y la
mete
he s
CE
ma nal um the om
was 980
the
ted
g 1
les
was
oil
ing
ma
hen
ab,
ers
oil
EC)
Chapter 2 - Diversity and production
20
was determined, as well as the amount of exchangeable calcium (Ca2+), magnesium (Mg2+),
potassium (K+) and sodium (Na+) in meq/100 g of soil. For this purpose, the cations were
extracted from 2.5 g of soil sample in 50 mL of a molar solution of ammonium acetate
(Thomas, 1982). The amount of organic C (%) was measured using the Walkley–Black
method. The available P (in meq/100 g of soil) was measured using the Olsen method, and
the amount of N (%) using the Kjeldahl method. Holes were dug to measure the soil depth as
the vertical distance between the surface soil and the solid rocky parent material.
Data analysis
Differences in textural and chemical soil conditions and tree and stand structure and
productivity measures between Abergelle and Metema were tested using a t-test, using the
plots as replicates. Prior to each t-test available P and total cations were transformed using
natural logarithm to meet the assumption of normal distribution. The proxies used for tree
productivity included the median and maximum height (the 95 percentile) and the median
and maximum stem diameter (the 95 percentile). The proxies used for the stand structure and
productivity included the tree density (number of stems per hectare), the total basal area per
hectare (m2 ha−1), and the stand stem volume per hectare, assuming a cone stem shape (sum
of stem volumes, with each tree volume equal to the product of the stem basal area, tree
height and a form factor of 1/3). In addition to the community analysis, we also compared all
those traits for the B. papyrifera populations separately. Vegetation structures are presented
for Metema and Abergelle woodlands as frequency diagrams for different diameter classes,
both for the whole plant community and for B. papyrifera populations separately. The
Kolmogorov–Smirnov test was used to determine whether the distributions differed between
sites.
For all 18 plots the floristic composition, species richness and species diversity were
determined. We calculated individual density per species (where multiple-stem individuals
count for one), basal area, stand volume, frequency (number of 20 m × 20 m subplots in
which a species is present) and importance value index (IVI) of each species per plot. IVI of a
species is defined as the sum of its relative abundance (number of individuals per hectare of a
species divided by total number of individuals per hectare of all species), its relative
Chapter 2 - Diversity and production
21
dominance (total basal area for a species divided by total basal area for all species), and its
relative frequency (frequency of a species divided by the sum of all frequencies of all
species) (Kent and Coker, 1992).
To estimate the species richness and diversity of both sites, Rarefaction, Fisher’s and
Shannon’ diversity indices and Shannon evenness were calculated on a plot basis. Since
species richness and diversity are plot size and abundance dependent (Magurran, 2004), we
calculated species richness estimates and species diversity indices based on values from a
random selection of twenty five 20 m × 20 m subplots, which is the lowest number of
subplots encountered in any plot, using EstimateS software version 8.2 (Colwell, 2006). The
difference in species richness and diversity between Metema and Abergelle woodlands was
tested using a t-test. We also constructed randomized species accumulation curves against
number of individuals for each of the 18 plots and species rank-abundance curves based on
logarithmic (base 10) transformed number of individuals for the two woodlands.
We computed the principal components (PCs) of the soil variables, and tested for soil-species
richness and soil-productivity associations for the first two components. Stand volume of the
community and of the B. papyrifera population and species richness (dependent variables)
were related to soil PCs (independent variables), using a linear regression. We also used
linear regression to explore whether individual soil characteristics determined stand species
richness and our proxies for stand productivity and B. papyrifera productivity, using the stand
volume as the best proxy for this. PASW Statistics 17 statistical software was used for these
analyses.
RESULTS
Soils
The soils of the Metema woodlands differed from those at Abergelle in some but not all traits
(Table 1). At Metema, woodlands occurred on deeper and more clayey soils than at
Abergelle, but texture did not differ significantly. The cations Mg2+ and Na+ and the cation
exchange capacity CEC were higher at Metema than at Abergelle, but N supply and soil pH

Chapter 2 - Diversity and production
22
were lower at Metema. P and K+ supply did not differ between sites. Thus, except for N, the
soils at Metema are generally more fertile in terms of nutrients.
The first two PCs of the soil variables from all plots described 56% of the variance (results
not shown). The first axis is a fertility and acidity axis which shows a gradient from basic and
less fertile to almost neutral and more fertile soils. The second axis is a textural and organic
carbon content axis. These two PCs, clay content and soil depth affected community tree
volume and B. papyrifera volume (Table 3).
Table 1. Soil properties at 0–20cm depth in dry woodlands at Metema (N= 12) and Abergelle (N= 6) in Northern Ethiopia. aExchange rates. bCation exchange capacity.
Variable Unit Metema Abergelle t-value P-value
Physical
Sand % 39.22 ± 3.91 40.27 ± 7.24 0.141 0.890
Silt % 23.91 ± 0.90 29.72 ± 3.18 1.755 0.131
Clay % 36.86 ± 4.42 30.0 ± 4.28 0.982 0.341
Soil depth cm 27.73 ± 3.58 15.30 ± 2.97 2.250 0.039
Chemicals
aCa++ meq/100 g soil 27.95 ± 1.90 31.90 ± 2.46 1.236 0.234
aMg++ meq/100 g soil 17.85 ± 1.23 8.17 ± 0.68 5.310 0.000
aNa+ meq/100 g soil 0.26 ± 0.02 0.19 ± 0.01 5.672 0.002
aK+ meq/100 g soil 0.43 ± 0.11 0.29 ± 0.03 0.745 0.467
Total Cations meq/100 g soil 46.54 ± 2.31 40.58 ± 2.82 1.669 0.115
bCEC meq/100 g soil 48.27 ± 2.18 39.26 ± 2.86 2.440 0.027
C % 2.58 ± 0.35 2.58 ± 0.32 0.008 0.994
N % 0.19 ± 0.02 0.29 ± 0.04 2.241 0.040
P mg /kg soil 13.86 ± 4.59 5.29 ± 0.85 1.303 0.211
pH 6.59± 0.09 8.28 ± 0.06 12.937 0.000
Chapter 2 - Diversity and production
23
When each soil variable was tested separately, altitude, CEC, nitrogen and soil pH did not
affect the stand volume of the community or of B. papyrifera alone (Fig. 5 and Table 3). Site
had an effect on the following soil variables: PC2, clay, soil depth and CEC for community
tree volume, and only PC1 and PC2 for B. papyrifera volume (Table 3). In all cases Metema
had the higher tree volumes when controlling for the independent variable (Fig. 5). None of
the soil variables significantly affected species richness (data not shown).
Population structure
At the community level, trees and shrubs were taller and had greater stem diameters at
Metema than at Abergelle (Table 2). The mean abundance of trees and shrubs in Abergelle
(range: 364–858 ha−1) was higher than in Metema (range: 329–646 ha−1,t-test, P = 0.011), but
mean basal area (range: 5.8–12.4 m2 ha−1 for Abergelle and 7.6–16.4 m2 ha−1 for Metema) did
not differ significantly (P = 0.095). Because trees were taller in Metema (Table 2), stand
volume was significantly higher at Metema (range: 21–57 m3 ha−1) compared to Abergelle
(range: 9–20 m3 ha−1).
B. papyrifera populations did not significantly differ in abundance and basal area between
Abergelle (ranges: 117–401 ha−1 and 5.8–12.4 m2 ha−1, respectively) and Metema (ranges:
89–301 ha−1 and 7.6–16.4 m2 ha−1, respectively, Table 2). Because trees at Metema were
taller than at Abergelle (Table 2), the Boswellia stand volumes tended to be larger at Metema
(range: 7–38 m3 ha−1) than at Abergelle (range: 7–19 m3 ha−1), but this was not significant.
The whole tree community showed a bi-modal distribution with relatively large numbers of
individuals in the lowest and middle diameter size classes (Fig. 4). Abergelle had a large
proportion of individuals in the lowest classes (DBH≤5 cm); while in Metema the middle
classes had the highest values. Abergelle had hardly any tree bigger than 33 cm while
Metema showed higher numbers of such trees. In contrast to the bi-model distribution of the
community, the diameter distribution of B. papyrifera showed a hump or uni-modal
distribution in both woodlands without individuals in the lowest classes (Fig. 4). Larger B.
papyrifera individuals were encountered at Metema than at Abergelle (Table 2).
Chapter 2 - Diversity and production
24
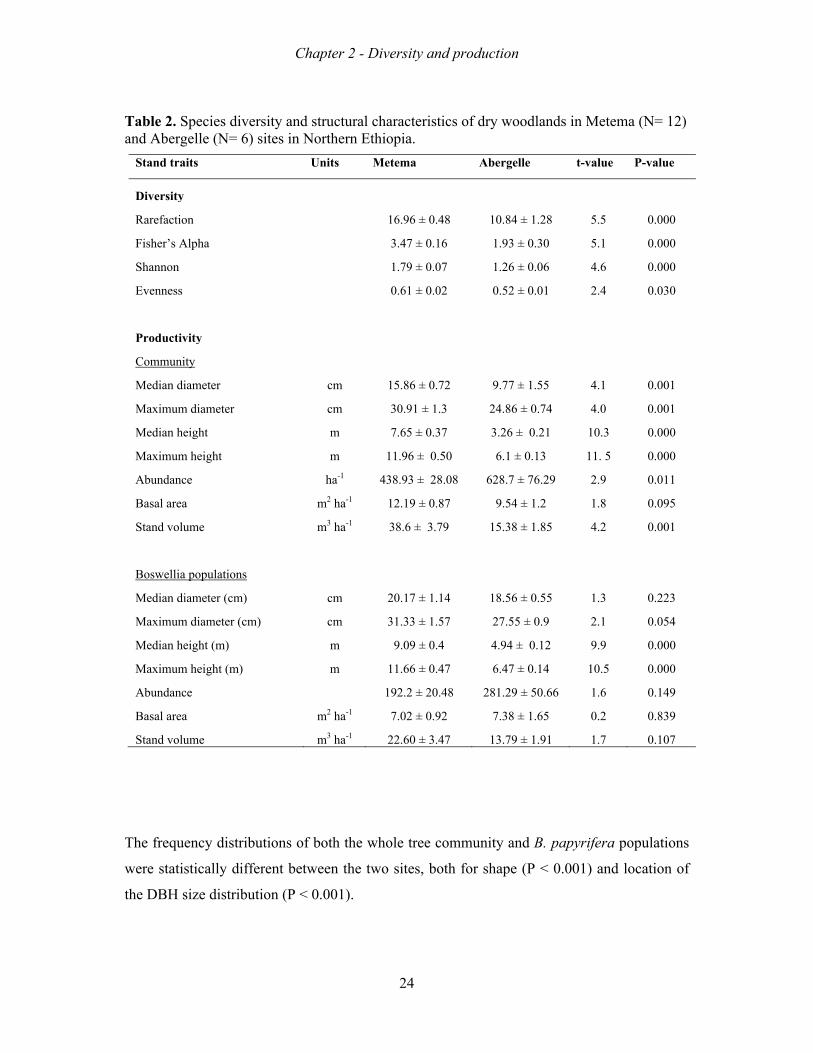
Table 2. Species diversity and structural characteristics of dry woodlands in Metema (N= 12) and Abergelle (N= 6) sites in Northern Ethiopia.
The frequency distributions of both the whole tree community and B. papyrifera populations
were statistically different between the two sites, both for shape (P < 0.001) and location of
the DBH size distribution (P < 0.001).
Stand traits Units Metema Abergelle t-value P-value
Diversity
Rarefaction 16.96 ± 0.48 10.84 ± 1.28 5.5 0.000
Fisher’s Alpha 3.47 ± 0.16 1.93 ± 0.30 5.1 0.000
Shannon 1.79 ± 0.07 1.26 ± 0.06 4.6 0.000
Evenness 0.61 ± 0.02 0.52 ± 0.01 2.4 0.030
Productivity
Community
Median diameter cm 15.86 ± 0.72 9.77 ± 1.55 4.1 0.001
Maximum diameter cm 30.91 ± 1.3 24.86 ± 0.74 4.0 0.001
Median height m 7.65 ± 0.37 3.26 ± 0.21 10.3 0.000
Maximum height m 11.96 ± 0.50 6.1 ± 0.13 11. 5 0.000
Abundance ha-1 438.93 ± 28.08 628.7 ± 76.29 2.9 0.011
Basal area m2 ha-1 12.19 ± 0.87 9.54 ± 1.2 1.8 0.095
Stand volume m3 ha-1 38.6 ± 3.79 15.38 ± 1.85 4.2 0.001
Boswellia populations
Median diameter (cm) cm 20.17 ± 1.14 18.56 ± 0.55 1.3 0.223
Maximum diameter (cm) cm 31.33 ± 1.57 27.55 ± 0.9 2.1 0.054
Median height (m) m 9.09 ± 0.4 4.94 ± 0.12 9.9 0.000
Maximum height (m) m 11.66 ± 0.47 6.47 ± 0.14 10.5 0.000
Abundance 192.2 ± 20.48 281.29 ± 50.66 1.6 0.149
Basal area m2 ha-1 7.02 ± 0.92 7.38 ± 1.65 0.2 0.839
Stand volume m3 ha-1 22.60 ± 3.47 13.79 ± 1.91 1.7 0.107

Chapter 2 - Diversity and production
25
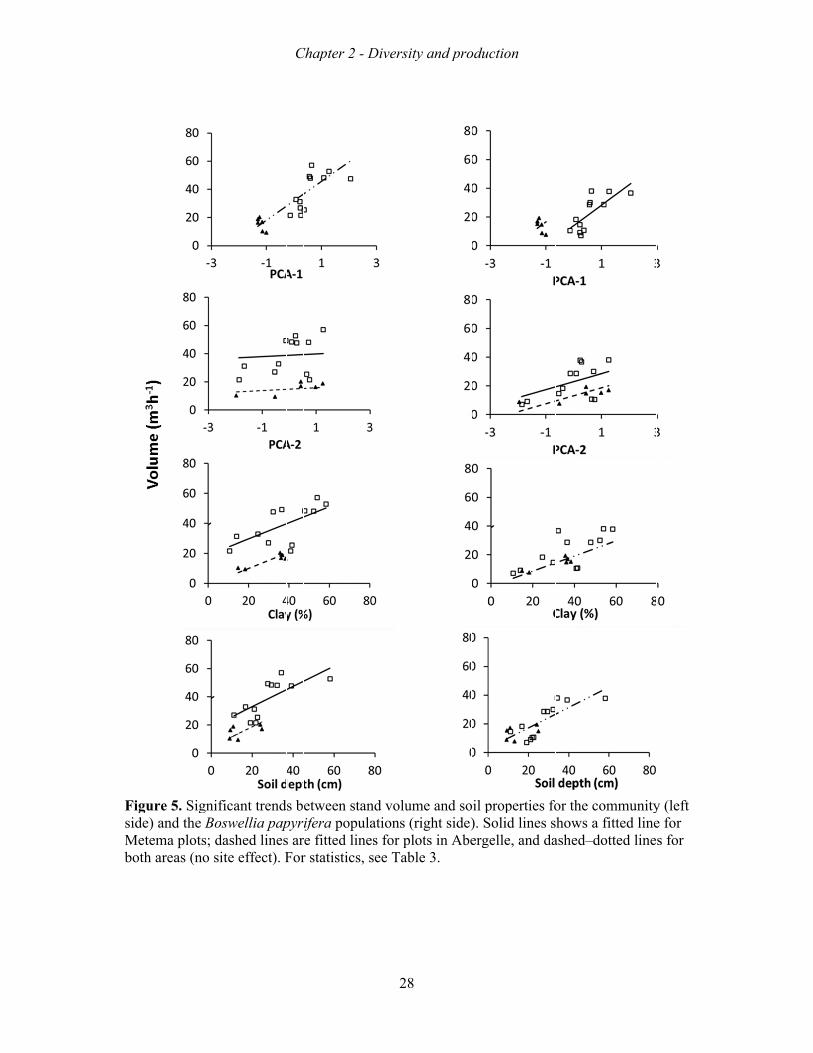
Table 3. Testing for the effects of soil conditions on stand volume (m3 ha−1) and Boswellia population volume (m3 ha−1), while controlling for site (Abergelle and Metema) and site interaction effects. For unit of soil traits, see Table 1. Interactions are not shown since they were not significant. PCA-1 and PCA-2 are the major multivariate factors that result from a principal component analysis of all soil factors. Results are based on linear relation in relation to listed soil variables; test and significance (ns: P≥0.05, *P < 0.05, **P < 0.01, ***P < 0.001).
a altitude, N and pH did not show significant trends for the whole community and Boswellia population, and CEC did not show a trend for Boswellia.
Species composition, richness and diversity
A total of 36 and 22 tree and shrub species representing 20 and 9 families were recorded in
Metema and Abergelle woodlands, respectively. The most dominant plant families included
the Burseraceae, Fabaceae, Combretaceae and Anacardiaceae (Appendix B). Vegetation at
both sites were dominated by B. papyrifera and, in some cases, co-dominated by L. fruticosa,
Combretum collinum, Pterocarpus lucens or Lonchocarpus laxiflorus (Appendix B). The
species that occurred at both sites were B. papyrifera, L. fruticosa, Stereospermum
kunthianum and Dichrostachys cinerea. The total number of
Variable Intercept slope Site F P R2
Community a
PCA-1 31.817 13.75** Ns 18.141 0.000 0.67
PCA-2 14.813 ns 24.101*** 12.782 0.001 0.58
Clay −0.81 0.54** 19.553*** 21.132 0.000 0.70
Soil depth 4.314 0.72** 14.261** 24.426 0.000 0.73
CEC −3.372 ns 18.95** 9.837 0.002 0.51 Boswellia a
PCA-1 30.837 14.26** −16.764* 10.068 0.002 0.52
PCA-2 13.187 5.56* 9.711* 5.309 0.018 0.34
Clay −2.014 0.53** Ns 10.577 0.001 0.53
soil depth 2.961 0.71*** Ns 13.414 0.000 0.59
ob
th
m
Fiininab D
Sp
In
sit
m
ch
al
lo
w
al
str
tre
fo
bser
han
more
igun Nndivbun
ISC
pec
n th
te A
migh
hara
so
owla
ere
., 2
ruc
ees
or B
rve
Ab
e ev
ure Nortvidundan
CU
cies
he p
Ab
ht b
acte
fou
and
e la
200
ctur
s, th
B. p
ed s
ber
ven
3. therualnce
USS
s co
pres
berg
be
eris
und
d w
arge
6b)
re f
his
papy
spe
rgel
nly
Sprn s pe of
ION
omp
sen
gell
ass
stic
d si
woo
e ar
) an
from
wa
yrif
cie
lle
dis
eciEther pf sp
N
pos
nt st
le a
soci
cs b
mil
dla
reas
nd
m
as n
fera
es a
(Ta
strib
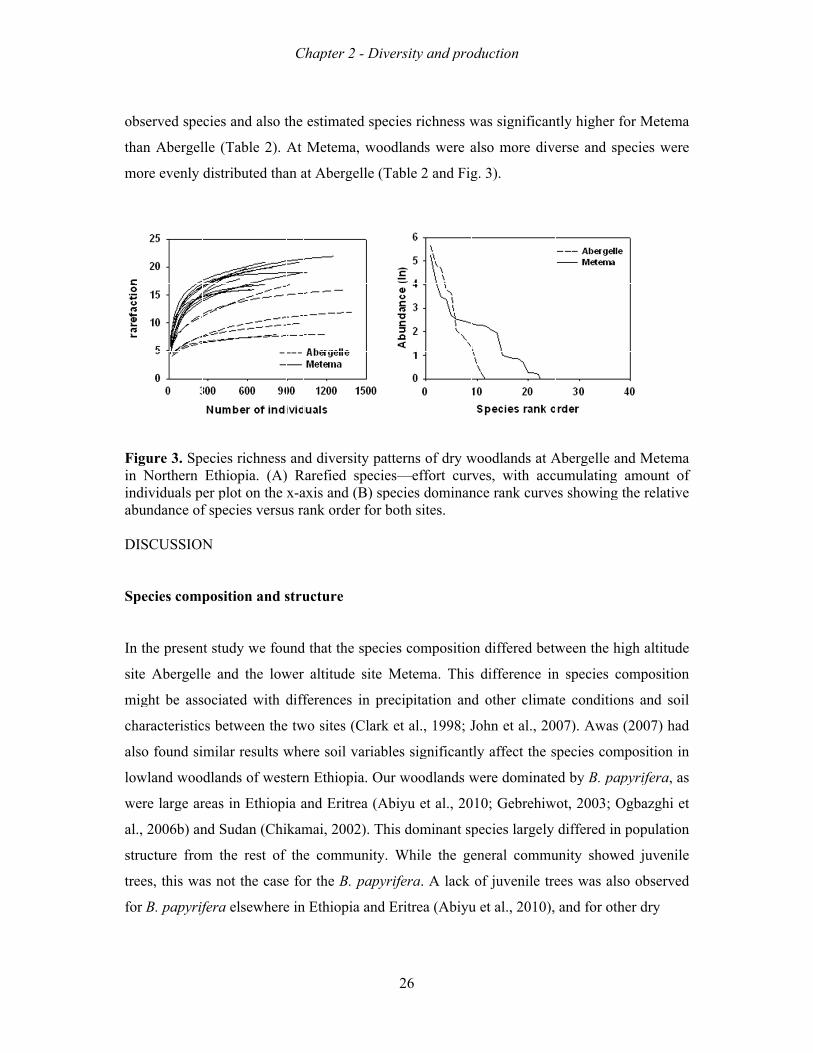
ies hioplopeci
siti
tud
and
iate
betw
lar
and
s in
Sud
the
not
a e
and
abl
but
richopiaot onies
ion
dy w
d th
ed
wee
res
ds o
n E
dan
e re
the
lsew
als
e 2
ed
hnea. (n thve
an
we
he
wit
en t
sult
of w
Ethi
n (C
est
e c
wh
so t
2). A
tha
ess (A)he rsu
nd s
fou
low
th d
the
ts w
west
opi
Chi
of
ase
here
C
the
At
an a
an) Rx-a
us r
stru
und
wer
diff
e tw
whe
tern
ia a
kam
th
e fo
e in
Chap
est
M
at A
nd dRareaxisank
uct
d th
r al
ffere
wo s
ere
n E
and
mai
e c
or t
n Et
pte
tim
ete
Abe
diveefies ank or
tur
hat t
ltitu
enc
site
so
Ethi
d Er
i, 2
com
he
thio
er 2
mate
ema
erge
ersied nd (rde
e
the
ude
ces
es (
oil v
iop
ritr
200
mmu
B.
opia
2 - D
ed s
a, w
elle
ity spe(B)
er fo
sp
e si
in
(Cla
vari
ia.
rea
2).
uni
pap
a an
Div
spe
woo
e (T
patecie) spor b
peci
ite
pr
ark
iab
Ou
(A
Th
ity.
apyr
nd
vers
2
ecie
odla
Tab
tteres—peciboth
ies
Me
reci
k et
bles
ur w
Abiy
his
W
rife
Eri
sity
26
es r
and
ble
rns —efies h s
com
etem
ipit
al.
sig
woo
yu e
dom
Whil
era
itre
y an
ich
ds w
2 a
of ffordoites
mp
ma
tatio
., 1
gni
odla
et a
min
le
. A
ea (
nd p
hnes
wer
and
f dryrt c
omins.
posi
. T
on
998
ific
and
al.,
nan
the
A la
(Ab
pro
ss w
re a
Fig
y wcurnan
itio
This
an
8; J
ant
ds w
20
nt sp
e ge
ack
biyu
odu
was
also
g. 3
woorvesnce
on d
s di
d o
Joh
tly
wer
010
pec
ene
of
u et
ctio
s si
o m
3).
odlas, we ra
diff
iffe
othe
hn e
aff
re d
; G
cies
eral
juv
t al
on
ign
mor
andwithnk
fere
eren
er c
et a
fect
dom
Geb
s la
l co
ven
., 2
ific
re d
ds ah acur
ed b
nce
clim
al.,
t th
min
reh
arge
om
nile
201
can
dive
at Aaccrve
betw
e in
mat
20
he s
nate
hiw
ely
mmu
e tre
0),
ntly
ers
Abecumes s
we
n sp
te c
07)
spec
ed b
wot,
dif
unit
ees
an
hig
e a
ergemula
how
en
pec
con
). A
cies
by B
20
ffer
ty s
s wa
nd f
ghe
and
elleatinwin
the
cies
ndit
Aw
s co
B. p
003
red
sho
as
for o
er f
d sp
e anng ng t
e hi
s co
tion
as
om
pap
; O
in
owe
als
oth
for
peci
nd amthe
igh
om
ns
(20
mpo
pyr
Ogb
po
ed j
o o
her
Me
ies
Memoue rel
h alt
mpos
and
007
siti
rifer
bazg
pul
juv
obse
dry
etem
we
etemunt lati
titu
siti
d s
7) h
ion
ra,
ghi
lati
ven
erv
y
ma
ere
ma of
ive
ude
ion
oil
had
in
as
et
ion
nile
ved
f

Fi(NanA1–er
iguN= nd bun–<3rror
ure 12)the
nda3, 3rs.
4. ) ine panc3 =
Sizn Npope is3–
ze Nortpulas th<5,
fretheatiohe n, 4
equrn
ons num= 5
encEthof
mbe5–<
cy hiopf ther o
<7,
C
dispiahe of i. .
Chap
striba. R
mind., 2
pte
butResumostdivi23 =
er 2
tionultst ddua= 4
2 - D
ns os ar
domals
41–<
Div
of dre s
minape<43
vers
2
dryshoant r si3 a
sity
27
y wown
spize
and
y an
woon fopeccla24
nd p
dlaor tciesass
4 ≥4
pro
andthe s, B
pe43 c
odu
s awh
Boser hcm
ctio
at Aholeswehect
m. E
on
Abee trelliatarerro
ergeree a pe. D
ors b
elleco
papDBHbar
e (NommpyrH crs in
N= muniferclasndi
6)nityra ss 1icat
) any (w(bl
1 =te ±
nd whlack
= 0–±1 s
Meite k b–<1stan
etembabar1, 2nda
ma rs) rs). 2 = ard
FisidMbo
igude)
Meteoth
ure ) anemaare
5. nd ta pleas
Sigthe lots (no
gnifBo
s; do s
ficaoswdashite
ant wellhedeff
treia p
d linfect
endpapnest). F
C
s bpyrs arFor
Chap
etwifer
re fir sta
pte
weera p
fitteatis
er 2
en spoped lstic
2 - D
stanpulaine
cs, s
Div
nd vatio
es fosee
vers
2
voluonsfor p Ta
sity
28
ums (riploable
y an
me aigh
ots ie 3.
nd p
andht siin A.
pro
d soide)Abe
odu
oil p). Serg
ctio
propSoligelle
on
perid le, a
rtielineand
s foes sd da
or thow
ashe
the ws ed–
coa f
–do
mmfitteotte
muned ld li
nitylineine
y (le fos fo
eft or or
Chapter 2 - Diversity and production
29
forest species, both in Ethiopia (Gebrehiwot, 2003; Sterck et al., 2010; Tesfaye et al., 2010)
as elsewhere (Metcalfe et al., 2007). Population structures that lack juveniles are also found
in other forest areas, notably in Ethiopian Afromontane systems, including Ethiopian church
forest areas—small woodland remnants around churches and protected by church owners
(Wassie et al., 2010a). The lack of regeneration in our case and those other cases is driven by
land use changes, and increasing grazing intensity, fire frequency and clearing for agricultural
purpose in particular (Belsky and Blumenthal, 1997; Fischer et al., 2009; Sagar et al., 2003;
Shorrocks, 2007; Staver et al., 2009; Tesfaye et al., 2004; Wassie et al., 2010a). Our results
suggest that the currently very dominant B. papyrifera will gradually be replaced by other
species. Such changes in species composition have also been observed else- where, particular
in relation to uncontrolled grazing (Yates et al., 2000).
Productivity
We predicted larger trees and higher stand volumes as proxies for stand productivity at lower
abiotic stress levels. We indeed found that the wetter – lower altitude site – had larger tree
and larger stand volumes than the drier – higher altitude – site, suggesting that wet season
length and annual rainfall limit tree and stand productivity. At Metema, a longer wet season
allows for longer leaf life spans and, in turn, for a greater potential for resource acquisition
over a year. Probably, trees were therefore taller and had greater stem diameters and stand
volumes were larger at Metema. Across all 18 plots, tree sizes and stand volumes increased
with soil depth and soil clay content, but no trend was observed with nutrient supply. Since
water stress becomes less with increasing soil depth as well as with increasing clay content,
we expected that soil water stress drove the major variation in tree size and stand volume
within the studied woodlands systems. This trend was observed for both whole tree
communities and for B. papyrifera populations separately.
For B. papyrifera, we did not observe any difference in tree size or stand volume between the
drier and wetter area at a given clay or soil depth content. In other words, annual rainfall and
wet season length do apparently not explain the observed variation between those sites. From
this observation, we suggest that production differences of B. papyrifera populations between
the two studied geographic regions are driven by differences in texture (clay content) and soil
Chapter 2 - Diversity and production
30
depth, which drive soil water availability. In contrast, the productivity of the other species is
much lower (Fig. 6) in the drier – high altitude – site at a given soil depth and clay content.
Thus, the overall community productivity seems suppressed by low annual rainfall or a
shorter wet season length.
Species richness
For the studied dry Ethiopian woodlands, we expected higher species richness with
decreasing water stress (cf. Gentry, 1982, 1988; Hawkins et al., 2007; Holdridge et al., 1971).
Despite considerable variation in soil properties, significant relationships between species
richness and soil properties were not encountered. In line with our prediction, we did observe
a higher species richness, diversity and evenness at the site that was characterized by a longer
wet season (Metema). We cannot exclude other potential factors influencing species richness,
such as for example altitude differing between the wetter (800m) and drier site (1600 m). The
decline in species richness is thus also associated with increasing altitude, as was observed
for church forests in the same region (Wassie et al., 2010b). These church forests however
varied in altitude over a larger range (1800–3300m) and, remarkably, consisted of far more
species, possibly owing to the forest policy of the church owners (Bongers et al., 2006;
Wassie et al., 2010b). Qualitatively, our results and those of Wassie et al. (2010b) confirm
those on other tropical forests showing that species richness and diversity generally decrease
with altitude (Aiba and Kitayama, 1999; Hemp, 2006; Lieberman et al., 1996; Stevens, 1992;
Vázquez and Givnish, 1998). For our expectation that species richness decreases with higher
soil water stress (explained in terms of soil clay content and soil depth), we thus found no
proof either. The tree size and stand volume analysis showed however that soil depth and clay
content largely contributed to the productivity of sites. Knowing that these factors reduce
water stress and possibly nutrient stress (Fernadez-Illescas et al., 2001; Knoop & Walker,
1985), we conclude that soil water stress did not contribute to variation in species richness in
our study sites.
Both the study sites are exposed to anthropogenic disturbances, such as burning, grazing, and
wood collection, which may also affect plant species richness and productivity of forests
(Sabogal, 1992; Swaine, 1992; Maass, 1995). These effects would depend on the type and
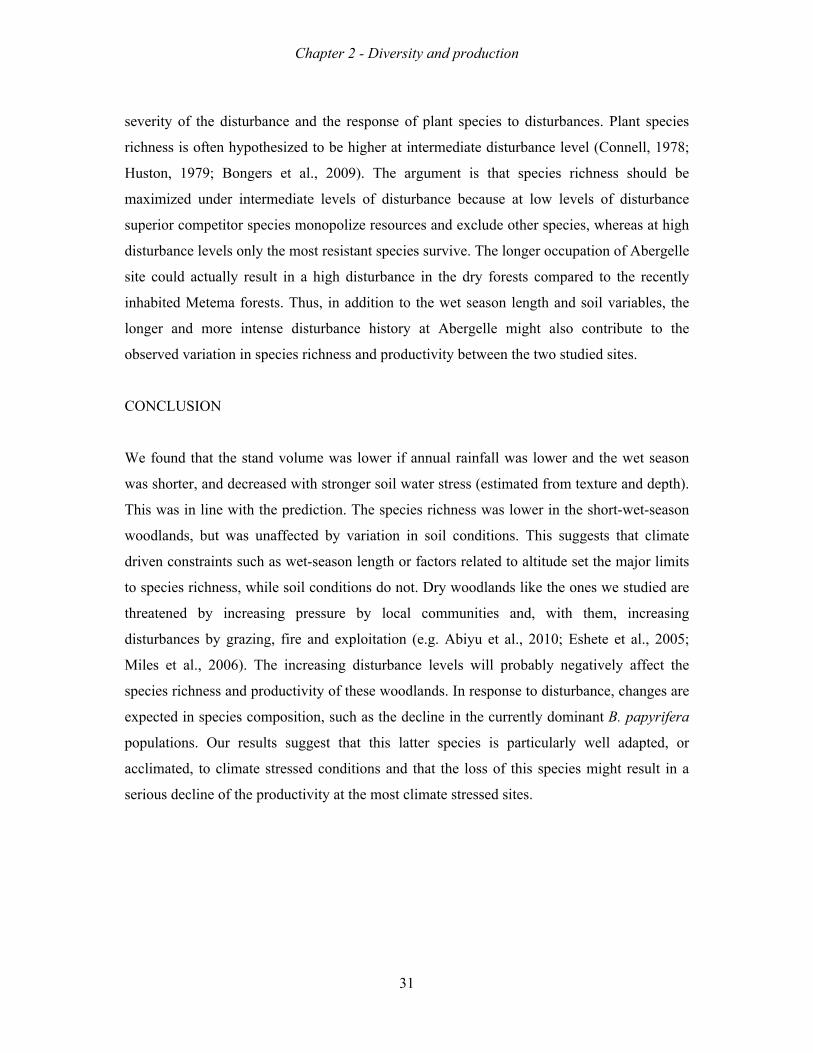
Chapter 2 - Diversity and production
31
severity of the disturbance and the response of plant species to disturbances. Plant species
richness is often hypothesized to be higher at intermediate disturbance level (Connell, 1978;
Huston, 1979; Bongers et al., 2009). The argument is that species richness should be
maximized under intermediate levels of disturbance because at low levels of disturbance
superior competitor species monopolize resources and exclude other species, whereas at high
disturbance levels only the most resistant species survive. The longer occupation of Abergelle
site could actually result in a high disturbance in the dry forests compared to the recently
inhabited Metema forests. Thus, in addition to the wet season length and soil variables, the
longer and more intense disturbance history at Abergelle might also contribute to the
observed variation in species richness and productivity between the two studied sites.
CONCLUSION
We found that the stand volume was lower if annual rainfall was lower and the wet season
was shorter, and decreased with stronger soil water stress (estimated from texture and depth).
This was in line with the prediction. The species richness was lower in the short-wet-season
woodlands, but was unaffected by variation in soil conditions. This suggests that climate
driven constraints such as wet-season length or factors related to altitude set the major limits
to species richness, while soil conditions do not. Dry woodlands like the ones we studied are
threatened by increasing pressure by local communities and, with them, increasing
disturbances by grazing, fire and exploitation (e.g. Abiyu et al., 2010; Eshete et al., 2005;
Miles et al., 2006). The increasing disturbance levels will probably negatively affect the
species richness and productivity of these woodlands. In response to disturbance, changes are
expected in species composition, such as the decline in the currently dominant B. papyrifera
populations. Our results suggest that this latter species is particularly well adapted, or
acclimated, to climate stressed conditions and that the loss of this species might result in a
serious decline of the productivity at the most climate stressed sites.
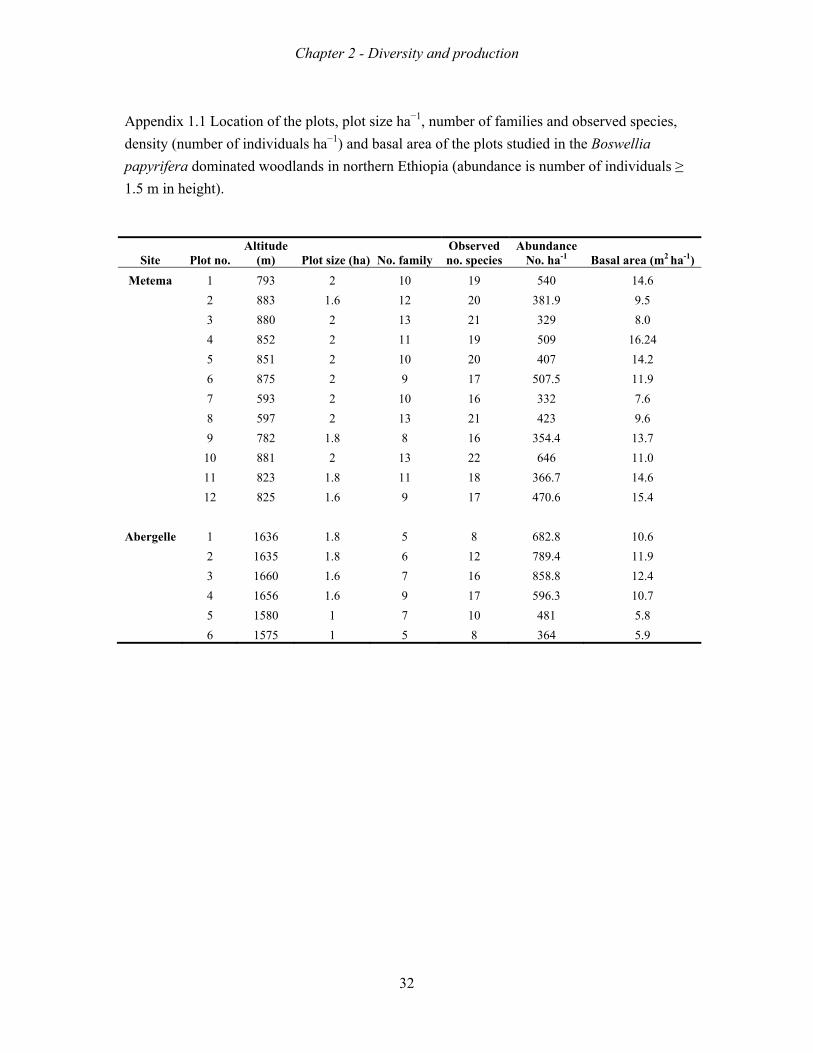
Chapter 2 - Diversity and production
32
Appendix 1.1 Location of the plots, plot size ha−1, number of families and observed species,
density (number of individuals ha−1) and basal area of the plots studied in the Boswellia
papyrifera dominated woodlands in northern Ethiopia (abundance is number of individuals ≥
1.5 m in height).
Site Plot no. Altitude
(m) Plot size (ha) No. family Observed no. species
Abundance No. ha-1 Basal area (m2 ha-1)
Metema 1 793 2 10 19 540 14.6
2 883 1.6 12 20 381.9 9.5
3 880 2 13 21 329 8.0
4 852 2 11 19 509 16.24
5 851 2 10 20 407 14.2
6 875 2 9 17 507.5 11.9
7 593 2 10 16 332 7.6
8 597 2 13 21 423 9.6
9 782 1.8 8 16 354.4 13.7
10 881 2 13 22 646 11.0
11 823 1.8 11 18 366.7 14.6
12 825 1.6 9 17 470.6 15.4
Abergelle 1 1636 1.8 5 8 682.8 10.6
2 1635 1.8 6 12 789.4 11.9
3 1660 1.6 7 16 858.8 12.4
4 1656 1.6 9 17 596.3 10.7
5 1580 1 7 10 481 5.8
6 1575 1 5 8 364 5.9

Cha
pter
2 -
Div
ersi
ty a
nd p
rodu
ctio
n
33
App
endi
x 1.
2.1.
Sci
enti
fic
nam
es o
f sp
ecie
s, f
amil
y na
mes
, abu
ndan
ce (
num
ber
of in
divi
dual
s pe
r he
ctar
e), b
asal
are
a, f
requ
ency
, and
IV
I (i
mpo
rtan
t val
ue in
dex)
of
spec
ies
foun
d in
Met
ema
site
. N
o.
Sci
enti
fic
nam
es
Fam
ily
nam
e A
bu
nd
ance
B
asal
are
a/h
a F
req
uen
cy
IVI
1 A
caci
a po
lyac
anth
a W
illd
. sub
sp. (
unid
enti
fied
)
Fab
acea
e
1.3±
0.6
0.05
± 0.
02
2.0±
0.8
1.7±
0.6
2 A
caci
a po
lyac
anth
a W
illd
. sub
sp. c
ampy
laca
ntha
(H
ochs
t. ex
A
.Ric
h.)
Bre
nan
F
abac
eae
0.
7±0.
4 0.
02±
0.02
0.
9±0.
5 0.
8±0.
5
3 A
caci
a se
yal (
Del
.) V
ar. S
eyal
F
abac
eae
2.0±
1.1
0.00
5± 0
.002
2.
6±1.
2 1.
7±0.
8
4 A
caci
a se
yal D
el. v
ar. f
istu
la
Fab
acea
e 0.
1±0.
1 0.
002±
0.0
01
0.3±
0.3
0.2±
0.2
5 A
ccai
a sp
p3.
Fab
acea
e 0.
5±0.
4 0.
001±
0.0
01
0.4±
0.3
0.4±
0.3
6 A
lbiz
ia m
alac
ophy
lla
(A. R
ich.
) W
alp.
F
abac
eae
0.
1±0.
1 0.
004±
0.0
03
0.2±
0.1
0.2±
0.1
7 A
noge
issu
s le
ioca
rpa
(DC
.) G
uill
. & P
err.
C
ombr
etac
eae
9.9±
5.7
0.32
± 0.
2 5.
9±2.
7 8.
3±4.
4
8 B
alan
ites
aeg
ypti
aca
Del
. B
alan
itac
eae
0.1±
0.1
0.00
1± 0
.001
0.
2±0.
2 0.
1±0.
1
9 B
osw
elli
a pa
pyri
fera
(D
el.)
Hoc
hst.
Bur
sera
ceae
19
2.2±
20.5
7.
0± 0
.9
43.6
±1.7
92
.9±1
5.8
10
Bos
wel
lia
piro
ttae
Chi
ov.
Bur
sera
ceae
0.
4±0.
3 0.
01±
0.01
0.
6±0.
4 0.
6± 0
.4
11
Chi
mli
kie/
Dim
etoa
Uni
dent
ifie
d 0.
8±0.
3 0.
02±
0.01
1.
5±0.
5 1.
2±0.
4
12
Com
bret
um a
cule
atum
Ven
t. C
ombr
etac
eae
1.3±
0.4
0.02
± 0.
01
2.0±
0.7
1.4±
0.5
13
Com
bret
um a
deno
goni
um S
teud
. ex
A.R
ich.
C
ombr
etac
eae
7.7±
2.2
0.08
± 0.
02
8.6±
1.9
6.2±
1.4
14
Com
bret
um c
olli
num
Fre
s.
Com
bret
acea
e 32
.±12
.9
0.2±
0.1
15
.0±3
.8
14.1
±4.2
15
Com
bret
um m
olle
R.B
r. e
x G
.Don
C
ombr
etac
eae
9.8±
4.2
0.1±
0.0
4 9.
6±3.
1 7.
5±2.
4
16
Cor
dia
afri
cana
Lam
. B
orag
inac
eae
0.1±
0.1
0.00
1± 0
.001
0.
1±0.
1 0.
1±0.
1
17
Dal
berg
ia m
elan
oxyl
on G
uill
. & P
err.
L
egum
inos
ae
6.9±
4.1
0.03
± 0.
01
3.8±
1.9
2.0±
1.0
18
Dic
hros
tach
ys c
iner
ea (
L.)
Wig
ht &
Arn
F
abac
eae
10.6
±3.8
0.
03±
0.01
4.
4±1.
2 3.
7± 1
.1
19
Dio
spyr
os m
espi
lifo
rmis
Hoc
hst.
ex A
.DC
. E
bena
ceae
0.
2±0.
2 0.
001±
0.0
01
0.1±
0.1
0.1±
0.1
20
Fic
us g
lum
osa
Del
. M
orac
eae
0.4±
0.4
0.01
± 0.
01
0.3±
0.3
0.3±
0.3
a Loc
al n
ame
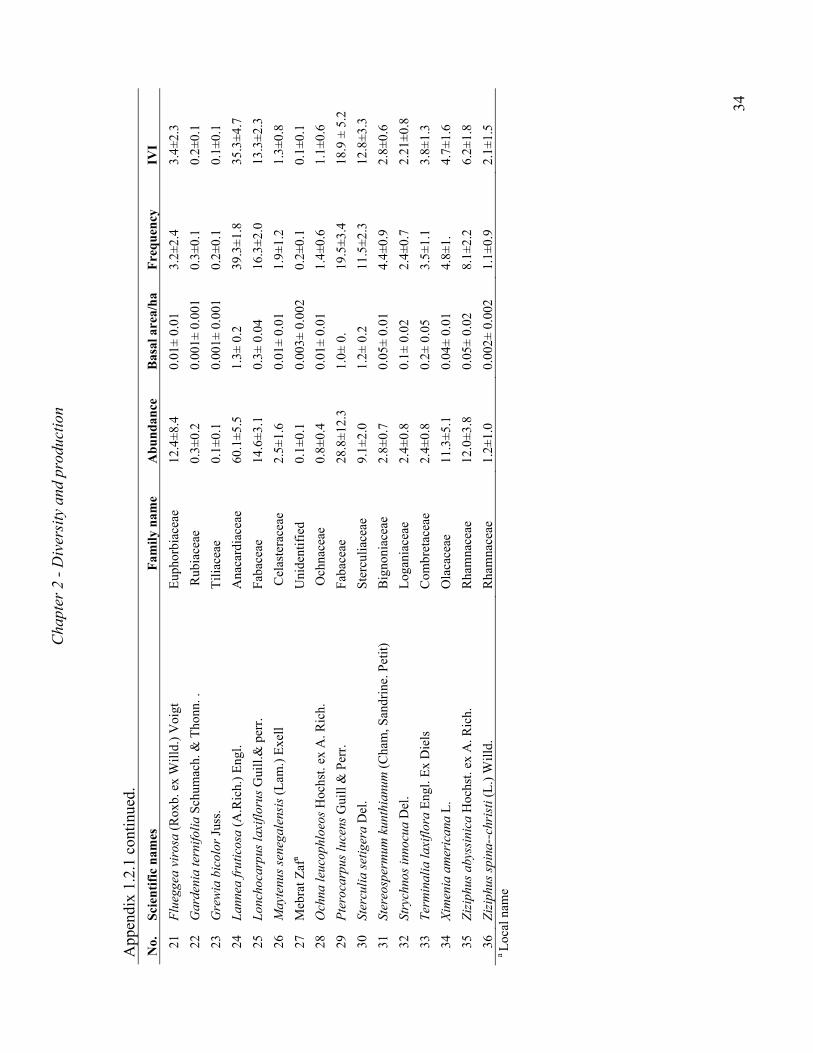
Cha
pter
2 -
Div
ersi
ty a
nd p
rodu
ctio
n
34
App
endi
x 1.
2.1
cont
inue
d.
No.
S
cien
tifi
c n
ames
F
amil
y n
ame
Ab
un
dan
ce
Bas
al a
rea/
ha
Fre
qu
ency
IV
I
21
Flu
egge
a vi
rosa
(R
oxb.
ex
Wil
ld.)
Voi
gt
Eup
horb
iace
ae
12.4
±8.4
0.
01±
0.01
3.
2±2.
4 3.
4±2.
3
22
Gar
deni
a te
rnif
olia
Sch
umac
h. &
Tho
nn. .
R
ubia
ceae
0.
3±0.
2 0.
001±
0.0
01
0.3±
0.1
0.2±
0.1
23
Gre
wia
bic
olor
Jus
s.
Til
iace
ae
0.1±
0.1
0.00
1± 0
.001
0.
2±0.
1 0.
1±0.
1
24
Lan
nea
frut
icos
a (A
.Ric
h.)
Eng
l. A
naca
rdia
ceae
60
.1±5
.5
1.3±
0.2
39
.3±1
.8
35.3
±4.7
25
Lon
choc
arpu
s la
xifl
orus
Gui
ll.&
per
r.
Fab
acea
e 14
.6±3
.1
0.3±
0.0
4 16
.3±2
.0
13.3
±2.3
26
May
tenu
s se
nega
lens
is (
Lam
.) E
xell
C
elas
tera
ceae
2.
5±1.
6 0.
01±
0.01
1.
9±1.
2 1.
3±0.
8
27
Meb
rat Z
afa
Uni
dent
ifie
d 0.
1±0.
1 0.
003±
0.0
02
0.2±
0.1
0.1±
0.1
28
Och
na le
ucop
hloe
os H
ochs
t. ex
A. R
ich.
O
chna
ceae
0.
8±0.
4 0.
01±
0.01
1.
4±0.
6 1.
1±0.
6
29
Pte
roca
rpus
luce
ns G
uill
& P
err.
F
abac
eae
28.8
±12.
3 1.
0± 0
. 19
.5±3
.4
18.9
± 5
.2
30
Ster
culi
a se
tige
ra D
el.
Ste
rcul
iace
ae
9.1±
2.0
1.2±
0.2
11
.5±2
.3
12.8
±3.3
31
Ster
eosp
erm
um k
unth
ianu
m (
Cha
m, S
andr
ine.
Pet
it)
Big
noni
acea
e 2.
8±0.
7 0.
05±
0.01
4.
4±0.
9 2.
8±0.
6
32
Stry
chno
s in
nocu
a D
el.
Log
ania
ceae
2.
4±0.
8 0.
1± 0
.02
2.4±
0.7
2.21
±0.8
33
Ter
min
alia
laxi
flor
a E
ngl.
Ex
Die
ls
Com
bret
acea
e 2.
4±0.
8 0.
2± 0
.05
3.5±
1.1
3.8±
1.3
34
Xim
enia
am
eric
ana
L.
Ola
cace
ae
11.3
±5.1
0.
04±
0.01
4.
8±1.
4.
7±1.
6
35
Ziz
iphu
s ab
yssi
nica
Hoc
hst.
ex A
. Ric
h.
Rha
mna
ceae
12
.0±3
.8
0.05
± 0.
02
8.1±
2.2
6.2±
1.8
36
Ziz
iphu
s sp
ina-
-chr
isti
(L
.) W
illd
. R
ham
nace
ae
1.2±
1.0
0.00
2± 0
.002
1.
1±0.
9 2.
1±1.
5 a L
ocal
nam
e
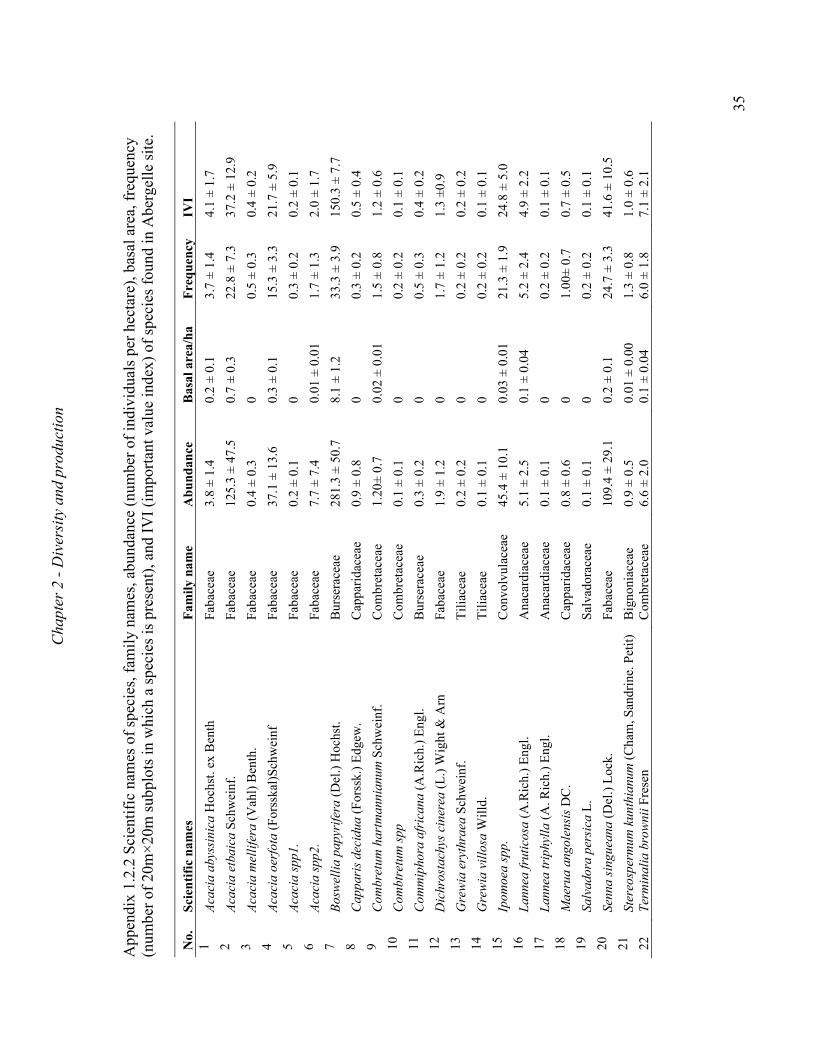
Cha
pter
2 -
Div
ersi
ty a
nd p
rodu
ctio
n
35
App
endi
x 1.
2.2
Sci
enti
fic
nam
es o
f sp
ecie
s, f
amil
y na
mes
, abu
ndan
ce (
num
ber
of in
divi
dual
s pe
r he
ctar
e), b
asal
are
a, f
requ
ency
(n
umbe
r of
20m
×20
m s
ubpl
ots
in w
hich
a s
peci
es is
pre
sent
), a
nd I
VI
(im
port
ant v
alue
inde
x) o
f sp
ecie
s fo
und
in A
berg
elle
sit
e.
No.
S
cien
tifi
c n
ames
F
amil
y n
ame
Ab
un
dan
ce
Bas
al a
rea/
ha
Fre
qu
ency
IV
I 1
Aca
cia
abys
sini
ca H
ochs
t. ex
Ben
th
Fab
acea
e 3.
8 ±
1.4
0.2
± 0.
1 3.
7 ±
1.4
4.1
± 1.
7 2
Aca
cia
etba
ica
Sch
wei
nf.
Fab
acea
e 12
5.3
± 47
.5
0.7
± 0.
3 22
.8 ±
7.3
37
.2 ±
12.
9 3
Aca
cia
mel
life
ra (
Vah
l) B
enth
. F
abac
eae
0.4
± 0.
3 0
0.5
± 0.
3 0.
4 ±
0.2
4 A
caci
a oe
rfot
a (F
orss
kal)
Sch
wei
nf
Fab
acea
e 37
.1 ±
13.
6 0.
3 ±
0.1
15.3
± 3
.3
21.7
± 5
.9
5 A
caci
a sp
p1.
Fab
acea
e 0.
2 ±
0.1
0 0.
3 ±
0.2
0.2
± 0.
1 6
Aca
cia
spp2
. F
abac
eae
7.7
± 7.
4 0.
01 ±
0.0
1 1.
7 ±
1.3
2.0
± 1.
7 7
Bos
wel
lia
papy
rife
ra (
Del
.) H
ochs
t. B
urse
race
ae
281.
3 ±
50.7
8.
1 ±
1.2
33.3
± 3
.9
150.
3 ±
7.7
8 C
appa
ris
deci
dua
(For
ssk.
) E
dgew
. C
appa
rida
ceae
0.
9 ±
0.8
0 0.
3 ±
0.2
0.5
± 0.
4 9
Com
bret
um h
artm
anni
anum
Sch
wei
nf.
Com
bret
acea
e 1.
20±
0.7
0.02
± 0
.01
1.5
± 0.
8 1.
2 ±
0.6
10
Com
btre
tum
spp
C
ombr
etac
eae
0.1
± 0.
1 0
0.2
± 0.
2 0.
1 ±
0.1
11
Com
mip
hora
afr
ican
a (A
.Ric
h.)
Eng
l. B
urse
race
ae
0.3
± 0.
2 0
0.5
± 0.
3 0.
4 ±
0.2
12
Dic
hros
tach
ys c
iner
ea (
L.)
Wig
ht &
Arn
F
abac
eae
1.9
± 1.
2 0
1.7
± 1.
2 1.
3 ±0
.9
13
Gre
wia
ery
thra
ea S
chw
einf
. T
ilia
ceae
0.
2 ±
0.2
0 0.
2 ±
0.2
0.2
± 0.
2 14
G
rew
ia v
illo
sa W
illd
. T
ilia
ceae
0.
1 ±
0.1
0 0.
2 ±
0.2
0.1
± 0.
1 15
Ip
omoe
a sp
p.
Con
volv
ulac
eae
45.4
± 1
0.1
0.03
± 0
.01
21.3
± 1
.9
24.8
± 5
.0
16
Lan
nea
frut
icos
a (A
.Ric
h.)
Eng
l. A
naca
rdia
ceae
5.
1 ±
2.5
0.1
± 0.
04
5.2
± 2.
4 4.
9 ±
2.2
17
Lan
nea
trip
hyll
a (A
. Ric
h.)
Eng
l. A
naca
rdia
ceae
0.
1 ±
0.1
0 0.
2 ±
0.2
0.1
± 0.
1 18
M
aeru
a an
gole
nsis
DC
. C
appa
rida
ceae
0.
8 ±
0.6
0 1.
00±
0.7
0.7
± 0.
5 19
Sa
lvad
ora
pers
ica
L.
Sal
vado
race
ae
0.1
± 0.
1 0
0.2
± 0.
2 0.
1 ±
0.1
20
Senn
a si
ngue
ana
(Del
.) L
ock.
F
abac
eae
109.
4 ±
29.1
0.
2 ±
0.1
24.7
± 3
.3
41.6
± 1
0.5
21
Ster
eosp
erm
um k
unth
ianu
m (
Cha
m, S
andr
ine.
Pet
it)
Big
noni
acea
e 0.
9 ±
0.5
0.01
± 0
.00
1.3
± 0.
8 1.
0 ±
0.6
22
Ter
min
alia
bro
wni
i Fre
sen
Com
bret
acea
e 6.
6 ±
2.0
0.1
± 0.
04
6.0
± 1.
8 7.
1 ±
2.1

Chapter 2 - Diversity and production
36
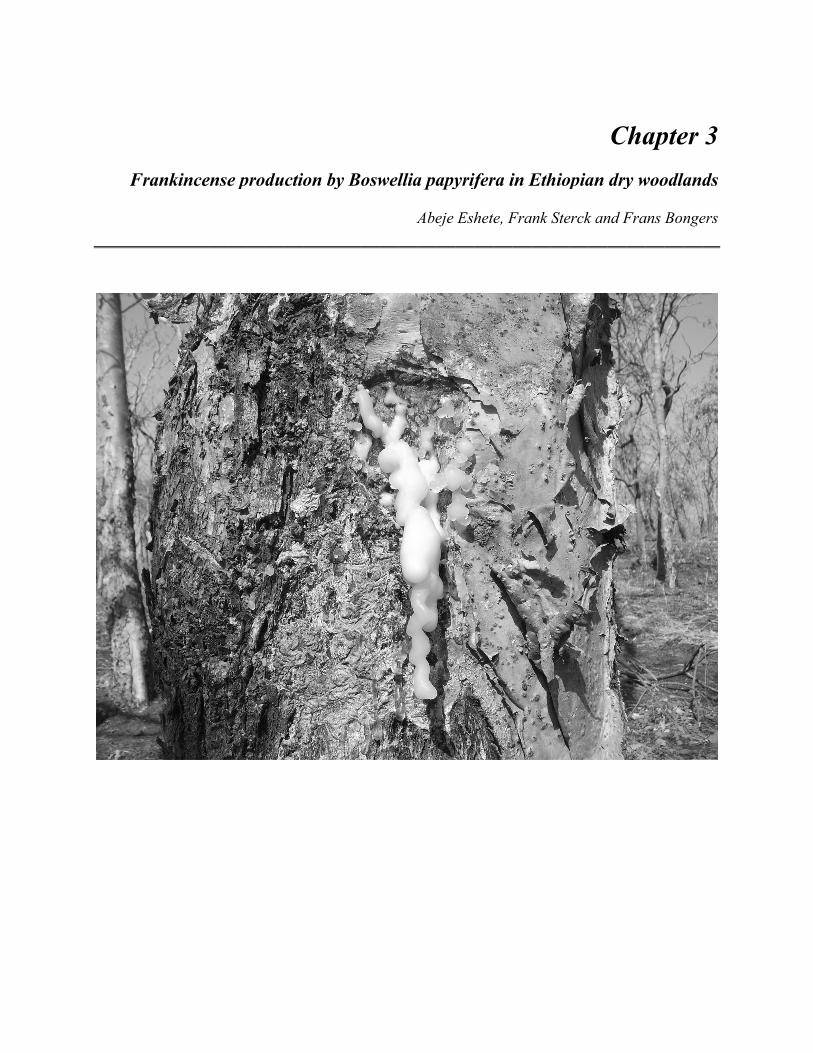
FFraankkinnceensee pprodductio
on byy Boswwel
llia
A
a pa
Abe
apy
eje
yrif
Esh
fer
hete
ra i
e, F
in E
Fra
Eth
nk
hiop
Ste
opia
erck
an
k an
C
dry
nd F
Cha
y w
Fra
ap
woo
ans B
pte
odla
Bon
er
and
nge
3
ds
ers
Chapter 3 - Frankincense production
38
ABSTRACT
Resins produced by trees can provide economically important products and their production has
therefore been commercialized for, for example, rubber and Arabic gum. Highly esteemed resins,
such as Frankincense, are however still exploited in more traditional ways. Remarkably, these
traditional ways nowadays lead to weak trees and non sustainable resin production. We therefore
investigated how frankincense yield is affected by different tapping intensities and frequencies,
since both of them have been intensified recently. Moreover, these effects are considered for
trees of different size, since larger trees probably provide more resources for resin production.
These patterns were studied for 4 different populations of Boswellia papyrifera, in Northern
Ethiopia.
We predicted that frankincense production would initially increase with tapping intensity and
tapping frequency, but later level-off because of resin depletion. We indeed found that resin yield
increased with tapping intensity, but not anymore beyond an intensity of 9 incision spots. We
also observed that resin yield peaked at around the seventh collection round, but declined
thereafter. Moreover, we found that resin yield increased with tree size, but not anymore for trees
>20 cm DBH. These resin yield patterns were similar across populations on contrasting soils and
in contrasting climates.
In conclusion, our result shows that management should take intensity and frequency of tapping,
and tree size, into account because it allows for maximizing resin yield at intermediate levels of
tree damage by tapping. Soil and climate did not effect this pattern. This study thus allows for
developing less damaging and more commercial and sustainable management regimes of highly
esteemed frankincense in threatened dry woodlands in the future.
Keywords: insect attack, resin canals, tapping frequency, tapping intensity, tree size.
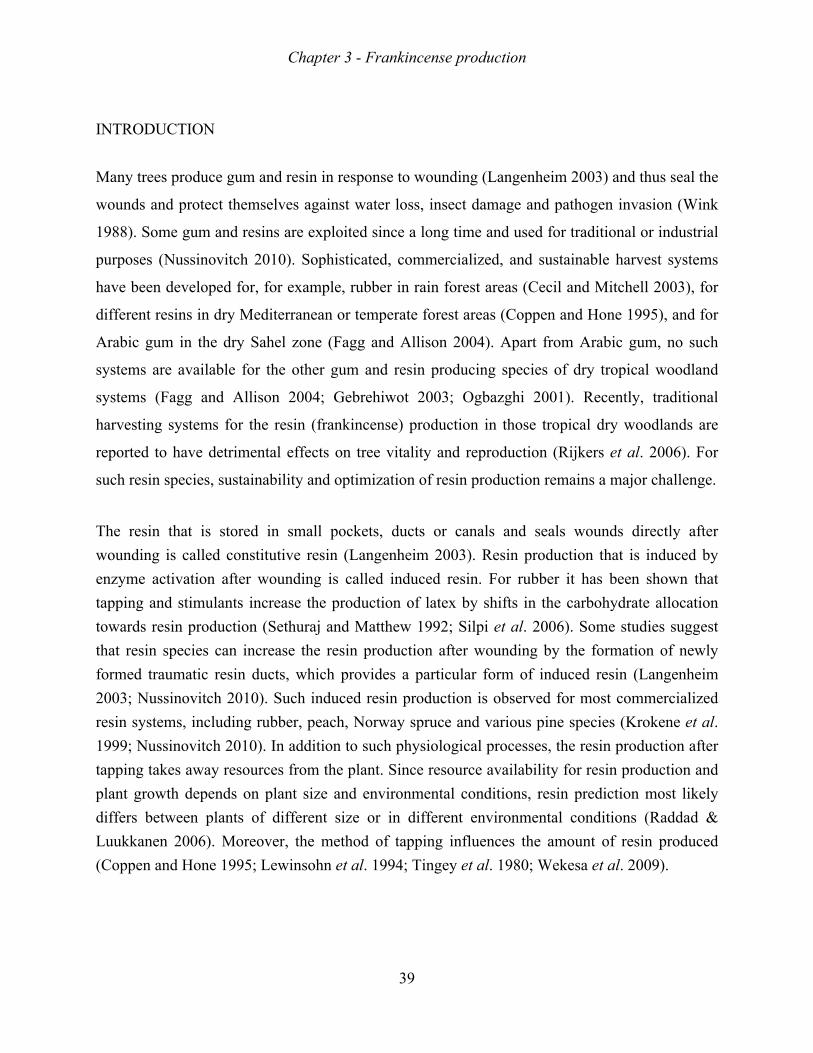
Chapter 3 - Frankincense production
39
INTRODUCTION
Many trees produce gum and resin in response to wounding (Langenheim 2003) and thus seal the
wounds and protect themselves against water loss, insect damage and pathogen invasion (Wink
1988). Some gum and resins are exploited since a long time and used for traditional or industrial
purposes (Nussinovitch 2010). Sophisticated, commercialized, and sustainable harvest systems
have been developed for, for example, rubber in rain forest areas (Cecil and Mitchell 2003), for
different resins in dry Mediterranean or temperate forest areas (Coppen and Hone 1995), and for
Arabic gum in the dry Sahel zone (Fagg and Allison 2004). Apart from Arabic gum, no such
systems are available for the other gum and resin producing species of dry tropical woodland
systems (Fagg and Allison 2004; Gebrehiwot 2003; Ogbazghi 2001). Recently, traditional
harvesting systems for the resin (frankincense) production in those tropical dry woodlands are
reported to have detrimental effects on tree vitality and reproduction (Rijkers et al. 2006). For
such resin species, sustainability and optimization of resin production remains a major challenge.
The resin that is stored in small pockets, ducts or canals and seals wounds directly after
wounding is called constitutive resin (Langenheim 2003). Resin production that is induced by
enzyme activation after wounding is called induced resin. For rubber it has been shown that
tapping and stimulants increase the production of latex by shifts in the carbohydrate allocation
towards resin production (Sethuraj and Matthew 1992; Silpi et al. 2006). Some studies suggest
that resin species can increase the resin production after wounding by the formation of newly
formed traumatic resin ducts, which provides a particular form of induced resin (Langenheim
2003; Nussinovitch 2010). Such induced resin production is observed for most commercialized
resin systems, including rubber, peach, Norway spruce and various pine species (Krokene et al.
1999; Nussinovitch 2010). In addition to such physiological processes, the resin production after
tapping takes away resources from the plant. Since resource availability for resin production and
plant growth depends on plant size and environmental conditions, resin prediction most likely
differs between plants of different size or in different environmental conditions (Raddad &
Luukkanen 2006). Moreover, the method of tapping influences the amount of resin produced
(Coppen and Hone 1995; Lewinsohn et al. 1994; Tingey et al. 1980; Wekesa et al. 2009).
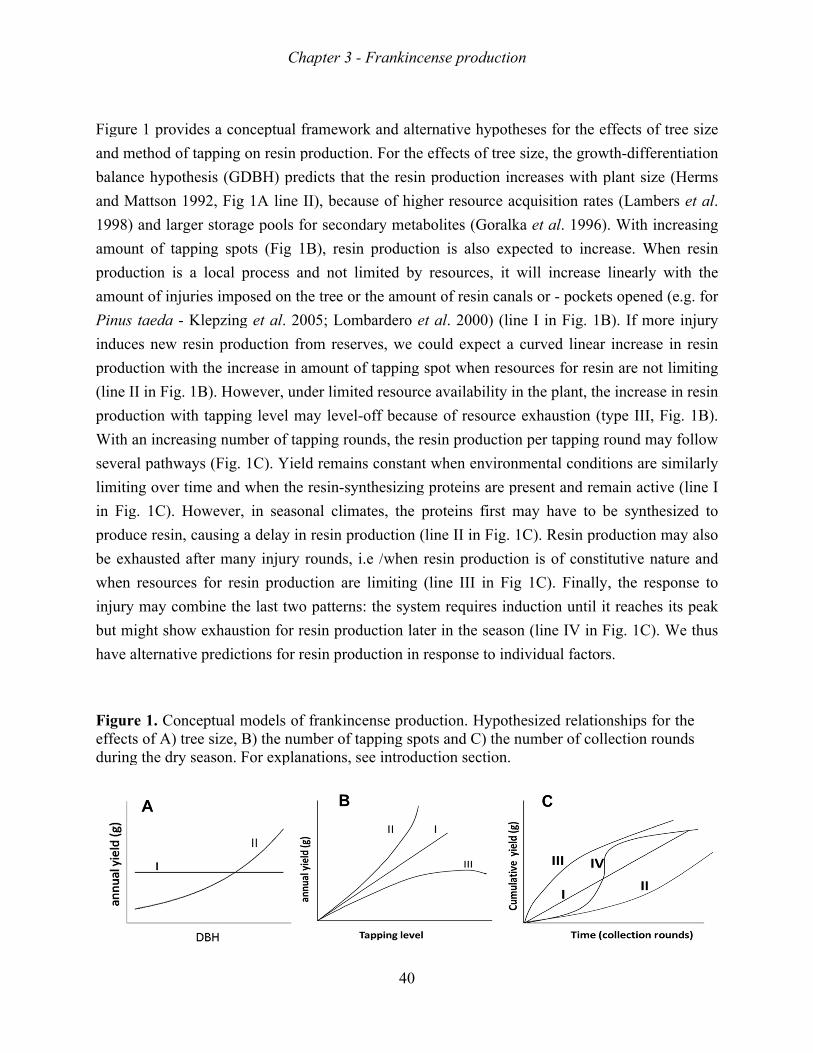
Fig
and
bal
and
199
am
pro
am
Pin
ind
pro
(lin
pro
Wi
sev
lim
in
pro
be
wh
inju
but
hav
Figeffdur
gure
d m
lanc
d M
98)
moun
odu
moun
nus
duce
odu
ne I
odu
ith a
vera
mitin
Fig
odu
exh
hen
ury
t m
ve a
gurfectsring
e 1
meth
ce h
Matt
an
nt o
uctio
nt o
tae
es n
uctio
II in
uctio
an i
al p
ng o
g. 1
uce r
hau
res
y ma
migh
alte
re 1s ofg th
pro
hod
hyp
tson
nd la
of t
on
of in
eda
new
on w
n Fi
on w
incr
path
ove
1C)
resi
uste
sou
ay
ht sh
erna
1. Cf A
he d
ovid
d of
poth
n 1
arg
tap
is
nju
a - K
w re
wit
ig.
wit
rea
hwa
er ti
. H
in,
ed a
urce
com
how
ativ
ConcA) trdry
des
f tap
hesi
992
ger s
pin
a lo
uries
Kle
esin
th th
1B)
th t
asin
ays
ime
How
cau
afte
es f
mbi
w ex
ve p
cepree sea
s a c
ppin
is (
2, F
stor
ng s
oca
s im
epzi
n pr
he i
). H
app
g n
(Fi
e an
wev
usin
er m
for
ine
xha
red
ptuasize
ason
con
ng o
(GD
Fig
rag
spo
al p
mpo
ing
rod
incr
How
ping
num
ig.
nd w
er,
ng a
man
res
the
aust
dicti
al me, Bn. F
ncep
on r
DBH
1A
e p
ts (
proc
osed
g et
duct
rea
wev
g le
mber
1C)
whe
in
a de
ny i
in p
e la
tion
ion
modB) thFor
ptu
resi
H) p
A lin
pool
(Fig
cess
d on
al.
tion
se i
ver,
evel
r of
). Y
en t
sea
elay
nju
pro
ast t
n fo
s fo
delshe nexp
Ch
al f
in p
pre
ne I
ls f
g 1
s an
n th
. 20
n fr
in a
un
l m
f tap
Yiel
the
aso
y in
ury
oduc
two
or r
or r
s ofnumplan
hap
fram
prod
edic
II),
for
1B)
nd
he t
005
rom
amo
der
may
ppi
ld r
res
onal
n re
rou
ctio
o pa
esin
resin
f frambenati
ter
mew
duc
cts t
be
sec
, re
no
tree
; L
m re
oun
r lim
lev
ng
rem
sin-
l cl
sin
und
on a
atte
n p
n pr
anker oion
3 -
wor
ctio
that
ecau
cond
esin
ot li
e or
Lom
eser
nt o
mite
vel-
rou
main
-syn
lima
pro
ds, i
are
erns
rod
rod
kincof tas, s
Fr
rk a
n. F
t th
use
dary
n pr
imi
the
mbar
rves
of ta
ed r
-off
und
ns c
nthe
ates
odu
i.e /
lim
s: th
duct
duct
censappsee
rank
and
For
he r
of
y m
rod
ted
e am
rde
s, w
app
reso
f be
ds, t
ons
esiz
s, t
ucti
/wh
miti
he s
tion
tion
se ppingintr
kinc
40
alt
r the
resin
f hig
meta
duct
d by
mou
ro
we
ing
ourc
ecau
the
stan
zing
the
ion
hen
ing
syst
n la
n in
prodg sprod
cen
tern
e ef
n p
ghe
abo
tion
y re
unt
et a
cou
g sp
ce a
use
res
nt w
g p
pro
(lin
n res
(li
tem
ater
n res
ducpotsduct
nse p
nati
ffec
prod
er re
olite
n is
eso
of
al.
uld
pot w
ava
e of
in p
whe
rote
otei
ne I
sin
ine
m re
in
spo
ctios antion
pro
ve
cts o
duc
eso
es (
s al
urc
res
200
exp
wh
ailab
f re
pro
en e
eins
ins
II in
pro
III
equi
the
onse
n. Hnd Cn se
odu
hyp
of t
tion
urc
(Go
lso
ces,
sin c
00)
pec
en
bili
sou
duc
envi
s ar
fir
n F
odu
I in
ires
e se
e to
HypC) tctio
uctio
poth
tree
n in
ce a
oralk
exp
it
can
(li
ct a
res
ity i
urce
ctio
iron
re p
rst m
ig.
ucti
n Fi
s in
easo
o ind
potthe on.
on
hes
e siz
ncre
acqu
ka
pec
wi
nals
ne
a cu
our
in t
e ex
on p
nme
pres
ma
1C
ion
ig 1
nduc
on (
div
hesnum
ses
ze,
eas
uisi
et a
cted
ill i
s or
I in
urve
rces
the
xha
per
ent
sent
y h
C). R
is
1C)
ctio
(lin
vidu
sizemb
for
the
es w
itio
al.
d to
incr
- p
n F
ed l
s fo
pla
aust
tap
al c
t an
hav
Res
of
). F
on u
ne IV
ual f
ed rer o
r the
e gr
wit
n r
199
o in
reas
pock
Fig.
line
or re
ant,
tion
ppin
con
nd r
e to
sin p
con
Fina
unti
V i
fact
relaof c
e ef
row
th p
ate
96)
ncre
se
kets
1B
ear
esin
the
n (ty
ng r
nditi
rem
o b
pro
nsti
ally
il it
in F
tors
ationcoll
ffec
wth-
plan
s (L
. W
ease
line
s op
B). I
inc
n ar
e in
ype
roun
ion
main
be s
oduc
tuti
, th
t re
Fig.
s.
nshect
cts
diff
nt s
Lam
With
e. W
earl
pen
If m
crea
re n
ncre
e III
nd m
s ar
n ac
syn
ctio
ive
he r
each
1C
hipsion
of
ffere
size
mbe
h in
Wh
ly w
ned
mor
ase
not
ease
I, F
may
re s
ctiv
nthe
on m
na
resp
hes
C).
s fon rou
tree
enti
(H
ers
ncre
hen
wit
(e.
re i
in
lim
e in
Fig.
y fo
sim
ve (
esiz
may
ature
pon
its
We
r thund
e si
iati
Herm
et a
easin
res
th t
g. f
inju
res
mitin
res
1B
ollo
milar
(line
ed
y al
e an
nse
pe
e th
he ds
ize
on
ms
al.
ng
sin
the
for
ury
sin
ng
sin
B).
ow
rly
e I
to
lso
nd
to
ak
hus
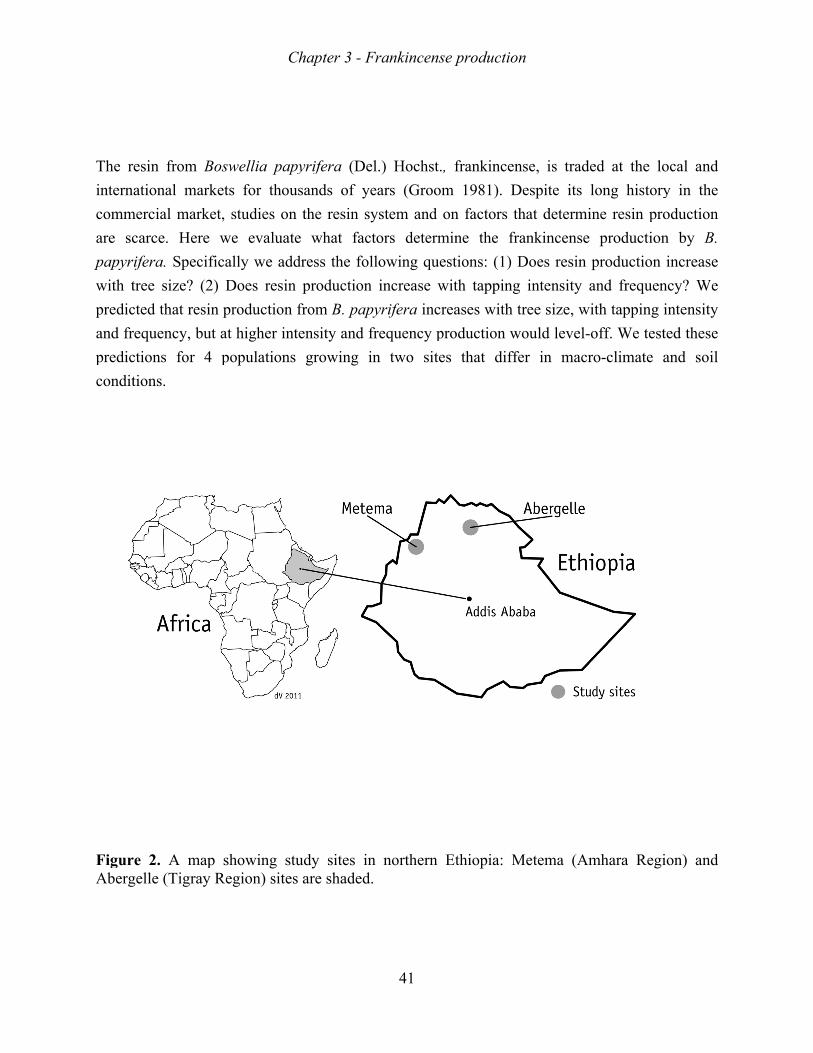
p
Th
inte
com
are
pap
wit
pre
and
pre
con
FigAb
e r
ern
mm
e sc
pyr
th t
edic
d fr
edic
ndit
gurberg
resin
atio
merc
carc
rifer
tree
cted
requ
ctio
tion
re 2gell
n f
ona
cial
ce.
ra.
e si
d th
uen
ns
ns.
2. Ae (T
from
al m
ma
H
Spe
ize?
hat r
ncy,
for
A mTig
m B
mar
ark
Here
ecif
? (2
resi
, bu
r 4
mapgray
Bos
rket
ket,
e w
fica
2) D
in p
ut at
4 p
p sy Re
wel
ts f
stu
we
ally
Doe
prod
t hi
popu
showegio
llia
for
udie
eva
y w
es r
duc
ighe
ulat
winon)
a pa
tho
es o
alua
e a
resi
ction
er i
tion
ng sit
Ch
apy
ous
on t
ate
addr
in p
n fr
inte
ns
stutes a
hap
yrife
and
the
wh
ress
pro
rom
ensi
gro
dy are
ter
fera
ds o
res
hat
s th
oduc
m B
ity a
owi
sitsha
3 -
(D
of
sin
t fa
he f
ctio
. pa
and
ing
tes ade
Fr
Del.
yea
sys
acto
follo
on i
apy
d fre
in
in ed.
rank
.) H
ars
stem
ors
owi
incr
yrife
equ
n tw
no
kinc
41
Hoc
(G
m a
de
ing
rea
fera
uenc
wo
rthe
cen
chst
Groo
and
eter
qu
se
inc
cy p
sit
ern
nse p
t., f
om
d on
rmin
uest
wit
crea
pro
tes
n Et
pro
fran
19
n fa
ne
tion
th t
ases
oduc
tha
thio
odu
nkin
981
acto
the
ns:
tapp
s w
ctio
at
opia
uctio
nce
). D
ors
e f
(1)
pin
with
on w
diff
a: M
on
ense
Des
tha
fran
Do
g in
tre
wou
ffer
Me
e, i
spit
at d
nkin
oes
nte
ee s
uld
in
etem
s tr
te i
deter
ncen
res
nsit
size
lev
n m
ma
rad
its
rmi
nse
sin
ty
, w
vel-
macr
(Am
ded
lon
ine
e p
pro
and
with
-off
ro-c
mh
at
ng h
res
rod
odu
d fr
tap
f. W
clim
hara
the
hist
sin
duct
uctio
requ
ppin
We t
mat
a R
e lo
tory
pro
tion
on
uen
ng i
test
te a
Regi
oca
y in
odu
n b
inc
ncy?
inte
ted
and
ion)
l an
n t
ucti
by
crea
? W
ensi
the
d so
) an
nd
the
on
B.
ase
We
ity
ese
oil
nd
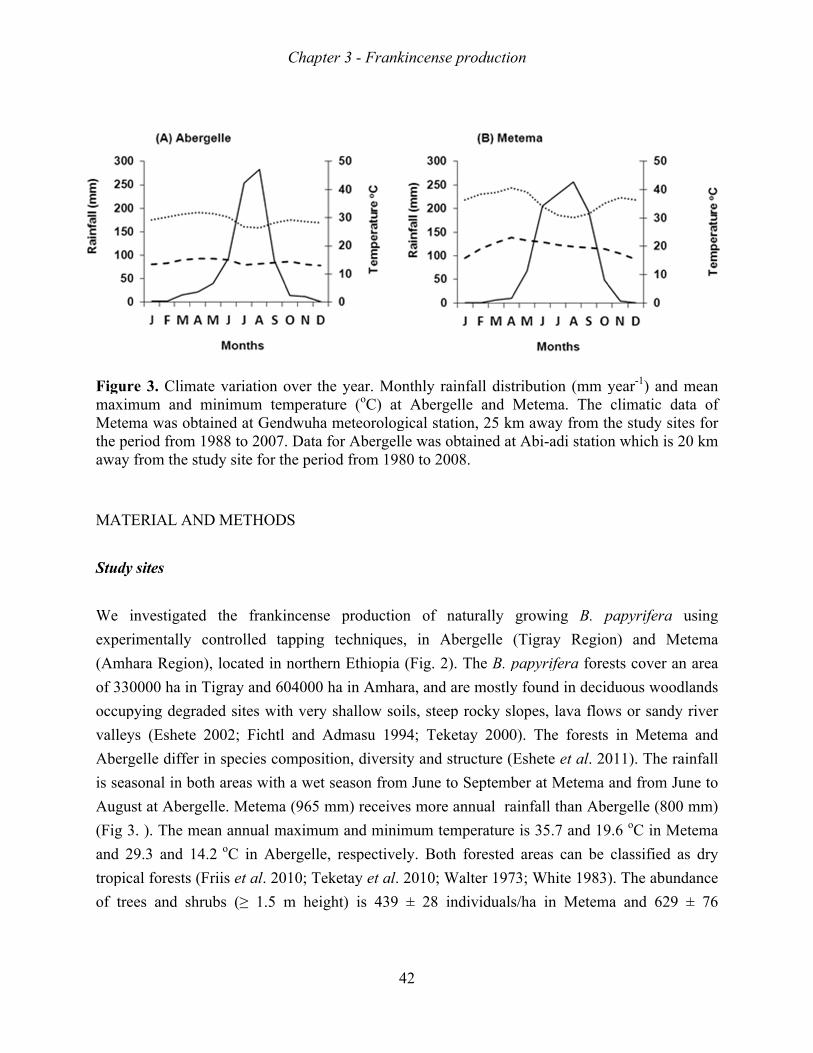
FigmaMetheaw
MA
Stu
We
exp
(Am
of 3
occ
val
Ab
is s
Au
(Fi
and
trop
of
guraximeteme pe
way
ATE
udy
e i
peri
mh
330
cup
lley
berg
seas
ugus
ig 3
d 2
pic
tre
re 3mumma eriofro
ERI
site
inve
ime
ara
000
pyin
ys (
gell
son
st a
3. ).
9.3
al f
ees
3. Cm awad frm t
IAL
es
esti
enta
a Re
00 h
ng d
(Esh
e d
nal i
at A
. Th
3 an
fore
and
Climand
as ofromthe
L A
igat
ally
egio
ha in
deg
hete
diffe
in b
Aber
he m
nd
ests
d s
mated mbta
m 19stu
AND
ted
y c
on)
n T
grad
e 2
er in
both
rge
mea
14.
s (F
shru
e vminiaine988
udy
D M
th
ont
, lo
Tigr
ded
2002
n sp
h ar
lle.
an a
2 o
Friis
ubs
variaimued a8 tosite
MET
he
trol
ocat
ray
site
2;
pec
rea
. M
ann
C i
s et
(≥
atioum at Go 20e fo
THO
fra
led
ted
and
es w
Fic
cies
s w
Mete
nual
in A
al.
≥ 1.
on otem
Gen007or th
OD
anki
d ta
in
d 60
wit
chtl
s co
with
ema
l m
Abe
20
.5 m
Ch
ovempedw. Dhe p
DS
ince
app
nor
040
th v
an
omp
h a w
a (9
maxi
erg
010;
m h
hap
er therat
wuhaata per
ens
ing
rthe
000
very
nd A
posi
wet
65
imu
elle
; Te
hei
ter
he turea mfor
riod
e p
g te
ern
ha
y sh
Adm
itio
t se
mm
um
e, r
eke
ght
3 -
yeae (o
meter Ab
d fro
pro
ech
Eth
a in
hall
ma
n, d
easo
m) r
and
resp
etay
t) i
Fr
ar. oC)
eoroberom
oduc
hniq
hio
Am
low
asu
dive
on f
rece
d m
pect
y et
s 4
rank
Mo) atologrgel19
ctio
ques
pia
mha
w so
19
ersi
from
eive
mini
tive
al.
439
kinc
42
ontht Agicalle w80
on
s, i
a (F
ara,
oils,
94;
ity
m J
es m
imu
ely.
20
±
cen
hly Aberal swasto 2
of
in
Fig.
, an
, ste
; Te
and
June
mor
um
Bo
010;
28
nse p
rairge
statis ob200
f na
Ab
2).
nd a
eep
eke
d st
e to
re a
tem
oth
; W
8 in
pro
infaelle ionbtai08.
atur
berg
. Th
are m
p ro
etay
truc
o Se
ann
mpe
h fo
Walt
ndiv
odu
all dan
, 25ined
rall
gell
he B
mo
ocky
y 20
ctur
epte
nual
erat
ores
ter 1
vidu
uctio
distnd 5 kmd at
ly
le
B. p
ostly
y sl
000
re (
emb
l ra
ture
sted
197
uals
on
tribMem at Ab
gro
(Ti
pap
y fo
lop
0).
Esh
ber
ainf
e is
d ar
73;
s/ha
butioetemawabi-a
owi
igra
pyrif
oun
es,
Th
hete
at
fall
35
reas
Wh
a in
on ma. ay fadi
ing
ay
ifer
nd in
lav
he f
e et
Me
tha
.7 a
s ca
hite
n M
(mTh
fromsta
B
Re
ra f
n de
va f
fore
t al
etem
an A
and
an b
e 19
Met
mm yhe m thation
B. p
gio
fore
ecid
flow
ests
. 20
ma
Abe
d 19
be
983)
tem
yeaclimhe n w
pap
on)
ests
duo
ws
s in
011
and
erg
9.6
cla
). T
ma a
ar-1)mastu
whic
pyrif
an
co
ous
or
n M
1). T
d fr
elleoC
assi
The
and
) anatic udy ch i
ifera
nd
ver
wo
san
Mete
The
rom
e (8
in
fied
ab
d 62
nd dasiteis 2
a u
Me
r an
ood
ndy
ema
e ra
m Ju
800
Me
d a
und
29
meata es f
20 k
usin
etem
n ar
dlan
riv
a an
ainf
une
mm
etem
as d
dan
±
an of
for km
ng
ma
rea
nds
ver
nd
fall
to
m)
ma
dry
nce
76
Chapter 3 - Frankincense production
43
individuals/ha in Abergelle (Eshete et al. 2011). At both sites, the forests are dominated by our
study species: the density of B. papyrifera is 192 ± 20 (accounting for 44% of total density) at
Metema and 281 ± 50.7 (accounting for 51% of total density) at Abergelle (Eshete et al. 2011).
We selected two populations at Metema and two populations at Abergelle for the present study.
Tapping techniques
Tapping of B. papyrifera trees involves removal of the bark, leaving the xylem intact, using a
special tool locally called “Mengaff”. Tapping starts in the first week of October (at the start of
the dry season) and ends in the first week of June (just before the start of the rainy season).
During this dry period, the tree has no leaves. Traditionally a tree is tapped 8-12 times (rounds,
tapping frequency) per year (Gebrehiwot 2003). During the first tapping, a thin layer of the bark
(~1 mm deep and ~2.5 cm2 in area) is removed. The subsequent tappings deepen and enlarge the
already established wounded spots . At the last tapping round the size of a tapping spot will be
~6 cm in horizontal direction, ~10 cm in vertical direction, and approximately 10-20 mm. deep.
Using the traditional tapping technique all trees with a diameter of 10–30 cm are tapped at 6-8
spots (tapping levels) while trees with a diameter of >30 cm are tapped at 8-12 spots. During and
after each tapping a white resin flows out of the bark, dries and becomes solid on top of the
wound, and is collected by tappers before they start the next tapping round.
The present experiment was conducted in four B. papyrifera populations, two at Abergelle
(named Abergelle-1 and Abergelle-2) and two at Metema (Metema-1 and Metema-2). We
selected 125 trees per population and thus 500 tree in total. We allocated the 125 trees per
population randomly to two treatments, where the tapping intensity treatment consisted of five
levels (3, 6, 9, 12 and 16 spots) and the tree size treatment of five stem diameter classes (10–15
cm, 15-20 cm, 20–25 cm, 25–30 cm and >30 cm). We thus established a fully crossed 5x5
design, with five replications for every tapping intensity – tree size combination. For trees with
three tapping spots, the spots were separated vertically by 50 cm at either the eastern or western
side of the trunk. For trees with 6 tapping spots, the three spots were at the east side and three at
the west side of the trunk. For trees with 9 tapping spots, three directions were used (3 E, 3 W
and the remaining 3 in either N or S). Trees with 12 tapping spots are tapped in four directions (3
in each of the cardinal directions). Trees with tapping level 16 were tapped in four directions
Chapter 3 - Frankincense production
44
with 4 tapping spots above each other at each side. The vertical distance between two successive
tapping spots was in all cases 50 cm.
Frankincense collection
The experiment was conducted for two production seasons. The first production season (October
2007 – June 2008) involved a low tapping frequency with only 7 frankincense collection rounds,
similar to traditional tapping techniques. During the second production season (October 2008 –
June 2009), the resin was collected for 14 rounds to show the possible exhaustion of
frankincense production with increasing tapping frequency. The first frankincense collection
round started at the second tapping round. Frankincense production per tree was determined by
weighing the freshly harvested frankincense (locally called ‘greazo’) directly after collection,
using a digital balance (0.01 g precision).
Data analysis
We used ANOVA to test for the predicted tree size and tapping intensity effects on frankincense
production, and also included the population as a possible explanatory factor in the model. Two-
way interactions of the main effects were also included in the model. The two seasons were
analyzed separately. Yield differences resulting from each of the main effects were tested using
Tukey test. A paired t-test was used to evaluate the difference between the first year 7-round
collection and the first 7 collection rounds of the second year. Data were transformed to natural
logarithm to meet the assumption of normal distribution. We used PASW Statistics 17.0 for all
tests.
RESULTS
The annual frankincense production of trees ranged from 41 to 840 g in the first season with
seven collection rounds, from 185 to 1826 g in the second season with 14 collection rounds. The
production was in the same order of magnitude across the three populations but, the production
at Metema-2 was lower than at the three other populations. (Table 1; Fig. 4). In all these
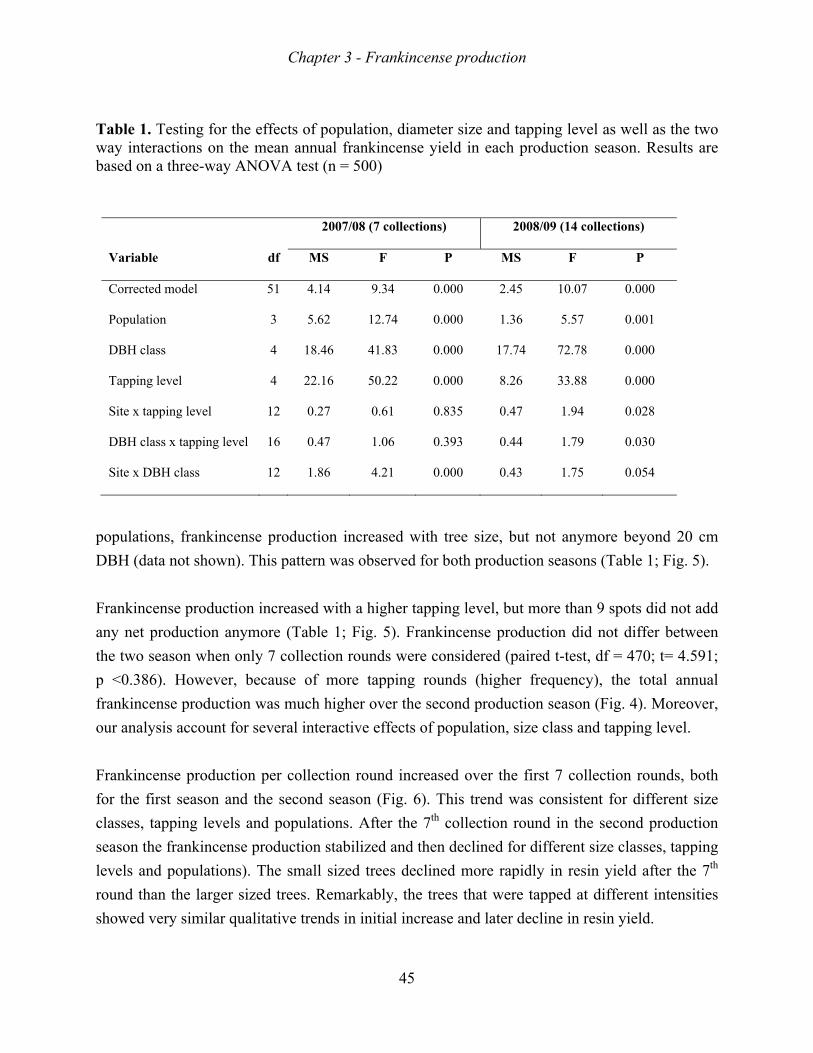
Chapter 3 - Frankincense production
45
Table 1. Testing for the effects of population, diameter size and tapping level as well as the two way interactions on the mean annual frankincense yield in each production season. Results are based on a three-way ANOVA test (n = 500)
populations, frankincense production increased with tree size, but not anymore beyond 20 cm
DBH (data not shown). This pattern was observed for both production seasons (Table 1; Fig. 5).
Frankincense production increased with a higher tapping level, but more than 9 spots did not add
any net production anymore (Table 1; Fig. 5). Frankincense production did not differ between
the two season when only 7 collection rounds were considered (paired t-test, df = 470; t= 4.591;
p <0.386). However, because of more tapping rounds (higher frequency), the total annual
frankincense production was much higher over the second production season (Fig. 4). Moreover,
our analysis account for several interactive effects of population, size class and tapping level.
Frankincense production per collection round increased over the first 7 collection rounds, both
for the first season and the second season (Fig. 6). This trend was consistent for different size
classes, tapping levels and populations. After the 7th collection round in the second production
season the frankincense production stabilized and then declined for different size classes, tapping
levels and populations). The small sized trees declined more rapidly in resin yield after the 7th
round than the larger sized trees. Remarkably, the trees that were tapped at different intensities
showed very similar qualitative trends in initial increase and later decline in resin yield.
Variable df
2007/08 (7 collections) 2008/09 (14 collections)
MS F P MS F P
Corrected model 51 4.14 9.34 0.000 2.45 10.07 0.000
Population 3 5.62 12.74 0.000 1.36 5.57 0.001
DBH class 4 18.46 41.83 0.000 17.74 72.78 0.000
Tapping level 4 22.16 50.22 0.000 8.26 33.88 0.000
Site x tapping level 12 0.27 0.61 0.835 0.47 1.94 0.028
DBH class x tapping level 16 0.47 1.06 0.393 0.44 1.79 0.030
Site x DBH class 12 1.86 4.21 0.000 0.43 1.75 0.054
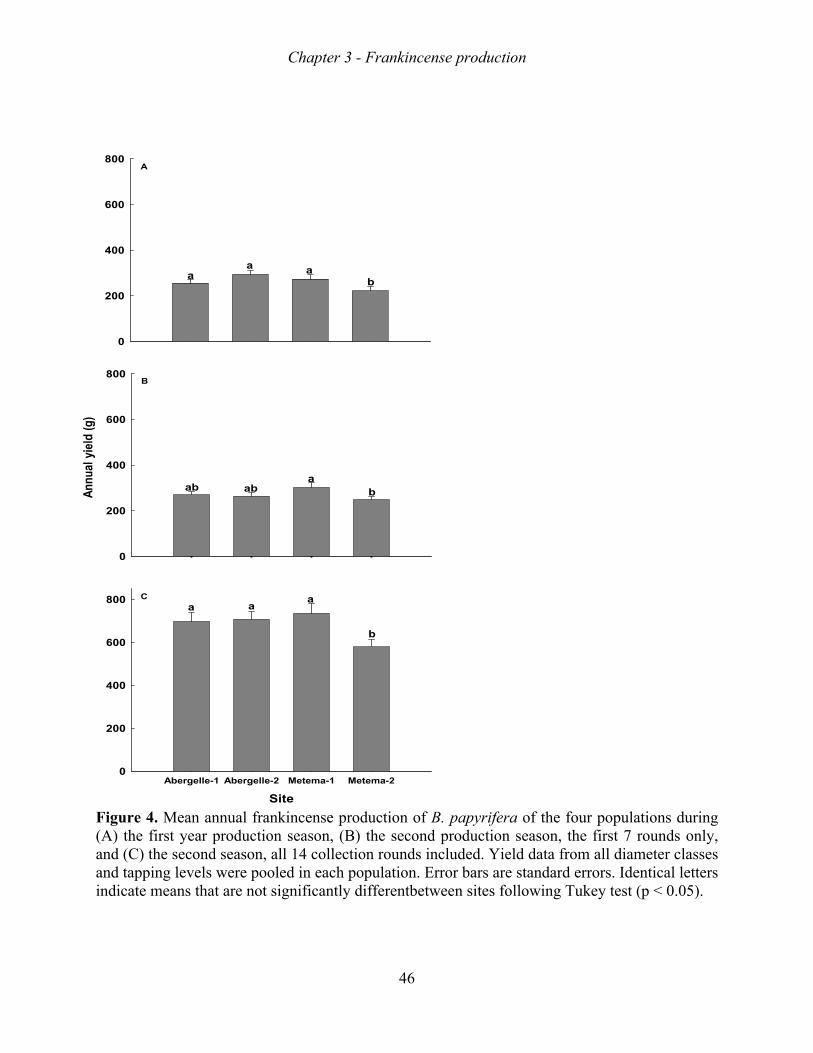
Chapter 3 - Frankincense production
46
Figure 4. Mean annual frankincense production of B. papyrifera of the four populations during (A) the first year production season, (B) the second production season, the first 7 rounds only, and (C) the second season, all 14 collection rounds included. Yield data from all diameter classes and tapping levels were pooled in each population. Error bars are standard errors. Identical letters indicate means that are not significantly differentbetween sites following Tukey test (p < 0.05).
0
200
400
600
800
aa a
b
Site
Abergelle-1 Abergelle-2 Metema-1 Metema-20
200
400
600
800
b
aaa
0
200
400
600
800
ab aba
b
C
B
A
Ann
ual y
ield
(g)

Chapter 3 - Frankincense production
47
DISCUSSION
In this study we show how the frankincense yield in four Ethiopian B. papyrifera dry woodland
populations varied with tree size, tapping intensity and tapping frequency. We evaluate our
results in the light of the postulated hypotheses (see also Figure 1) and discuss their implications
for sustainable frankincense yield, but first we compare the frankincense yield amongst the four
populations.
For this study, we selected B. papyrifera populations at relative extreme and opposite climatic
conditions, with the two Abergelle populations characterized by a higher altitude and a drier,
colder and more intensively sun-lit site conditions than the two Metema plots. While the
Abergelle plots and one Metema plot (Metema -2) were characterized by similarly poor soil
conditions, the Metema-1 plots was characterized by much better soil conditions (Eshete et al.
2011). Remarkably, the two Abergelle plots on poor soils and the Metema plot on the richest soil
did not differ in frankincense yield, whereas the Metema plot on a soil as poor as those plots at
Abergelle exhibited a lower annual resin yield. Based on a parallel study on leaf and crown
photosynthesis of these trees (Mengistu et al. in prep.), we suggest that high illumination and
photosynthetic acclimation to those conditions at Abergelle might compensate for resource
acquisition for resin production, despite rather poor soil conditions and a shorter wet season. The
Metema plot on poor soil is characterized by less favorable irradiation conditions, and may not
be capable to produce a similar amount of annual resin yield. These differences were small,
however, suggesting that the selection for a sufficient amount of resin might be strong. Testing
such hypothetical mechanisms for a lack of larger differences in resin yield between tree
populations is however beyond the scope of the present study. The minor differences in resin
yield nevertheless allowed us to pool the data of the four tree populations to show the much
stronger trends in resin yield with tree size, tapping intensity and number of tapping rounds.
Trends per population were very similar and are therefore not shown.
In line with our prediction (Fig. 1A Type II), bigger trees indeed produced more frankincense
than smaller trees. Particularly, individual trees in the lowest diameter classes (10 – 15 cm DBH)
gave lower amounts of frankincense (Figs. 5 & 6). This phenomenon was consistent over two
production seasons, 5 tapping levels and 4 populations. Similar results were also reported for a
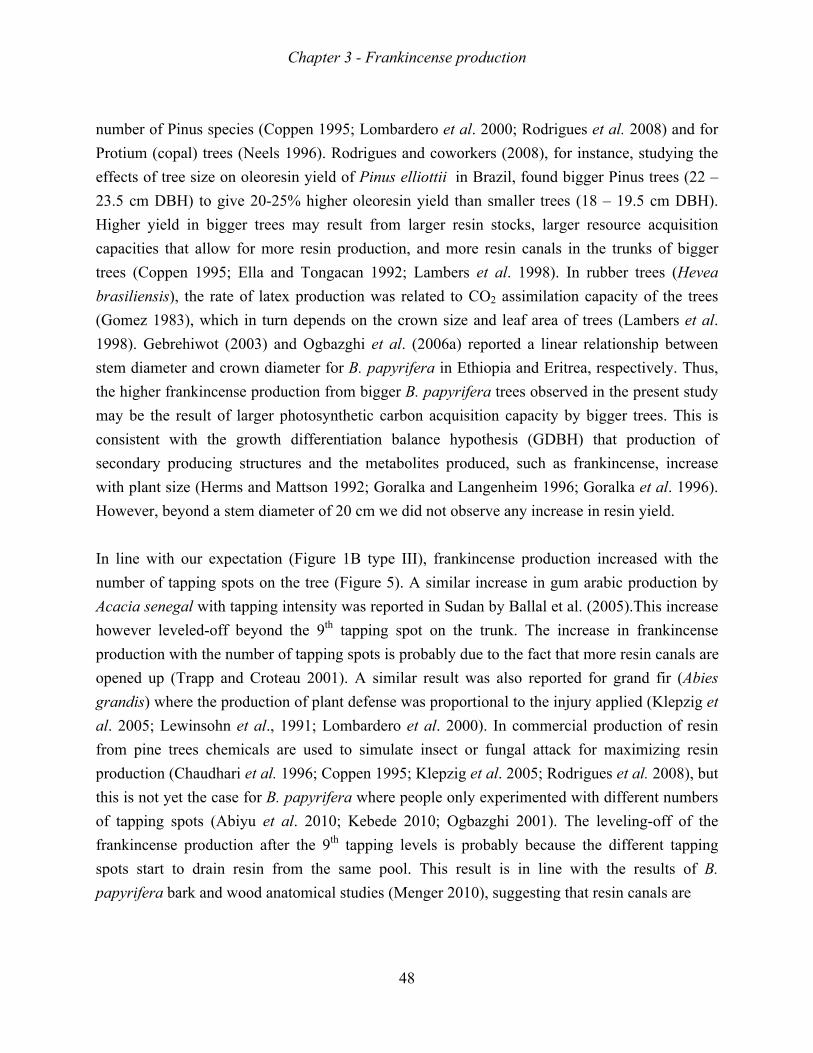
Chapter 3 - Frankincense production
48
number of Pinus species (Coppen 1995; Lombardero et al. 2000; Rodrigues et al. 2008) and for
Protium (copal) trees (Neels 1996). Rodrigues and coworkers (2008), for instance, studying the
effects of tree size on oleoresin yield of Pinus elliottii in Brazil, found bigger Pinus trees (22 –
23.5 cm DBH) to give 20-25% higher oleoresin yield than smaller trees (18 – 19.5 cm DBH).
Higher yield in bigger trees may result from larger resin stocks, larger resource acquisition
capacities that allow for more resin production, and more resin canals in the trunks of bigger
trees (Coppen 1995; Ella and Tongacan 1992; Lambers et al. 1998). In rubber trees (Hevea
brasiliensis), the rate of latex production was related to CO2 assimilation capacity of the trees
(Gomez 1983), which in turn depends on the crown size and leaf area of trees (Lambers et al.
1998). Gebrehiwot (2003) and Ogbazghi et al. (2006a) reported a linear relationship between
stem diameter and crown diameter for B. papyrifera in Ethiopia and Eritrea, respectively. Thus,
the higher frankincense production from bigger B. papyrifera trees observed in the present study
may be the result of larger photosynthetic carbon acquisition capacity by bigger trees. This is
consistent with the growth differentiation balance hypothesis (GDBH) that production of
secondary producing structures and the metabolites produced, such as frankincense, increase
with plant size (Herms and Mattson 1992; Goralka and Langenheim 1996; Goralka et al. 1996).
However, beyond a stem diameter of 20 cm we did not observe any increase in resin yield.
In line with our expectation (Figure 1B type III), frankincense production increased with the
number of tapping spots on the tree (Figure 5). A similar increase in gum arabic production by
Acacia senegal with tapping intensity was reported in Sudan by Ballal et al. (2005).This increase
however leveled-off beyond the 9th tapping spot on the trunk. The increase in frankincense
production with the number of tapping spots is probably due to the fact that more resin canals are
opened up (Trapp and Croteau 2001). A similar result was also reported for grand fir (Abies
grandis) where the production of plant defense was proportional to the injury applied (Klepzig et
al. 2005; Lewinsohn et al., 1991; Lombardero et al. 2000). In commercial production of resin
from pine trees chemicals are used to simulate insect or fungal attack for maximizing resin
production (Chaudhari et al. 1996; Coppen 1995; Klepzig et al. 2005; Rodrigues et al. 2008), but
this is not yet the case for B. papyrifera where people only experimented with different numbers
of tapping spots (Abiyu et al. 2010; Kebede 2010; Ogbazghi 2001). The leveling-off of the
frankincense production after the 9th tapping levels is probably because the different tapping
spots start to drain resin from the same pool. This result is in line with the results of B.
papyrifera bark and wood anatomical studies (Menger 2010), suggesting that resin canals are
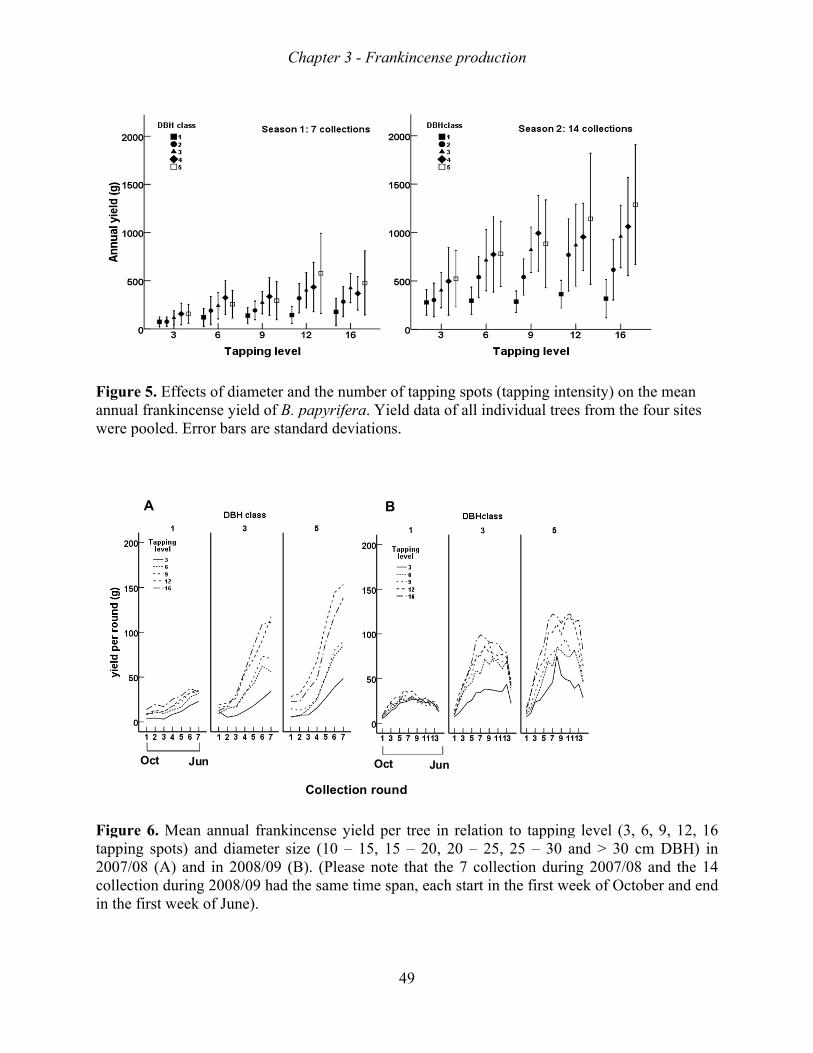
Figannwe
Figtap200colin t
gurnuare p
gurppin07/0llecthe
re 5al frpoo
re 6ng s08
ctionfirs
Oc
A
5. Erankoled
6. Mspo(An dust w
ct
A
ffeckincd. E
Meaots) ) anurin
wee
J
cts cen
Erro
an aan
nd ng 2
ek o
Jun
of dnse or b
annnd d
in 200
of Ju
diayiears
nualdiam200
08/0une
meld oare
l frmet08/09 he).
eter of Be st
rankter 09 had
Ch
andB. pand
kincsize(B)
d th
hap
d thpapydard
cene (). (
he sa
Co
ter
he nyrifd de
nse 10 (Pleam
llec
3 -
numferaevia
yie– 1
easee ti
ction
Fr
mbea. Yatio
eld 15, e noime
O
n ro
rank
er oYielons.
per15
ote e sp
Oct
oun
B
kinc
49
f tald d.
r tre5 –
thaan,
d
cen
appidata
ee i20
at t ea
Ju
nse p
ing a of
in r, 20the ch
un
pro
spof all
rela0 –7 cstar
odu
ots l in
atio– 25collrt in
uctio
(tadiv
on t5, 2lectn th
on
appividu
to t25 –tionhe f
ing ual t
app– 3n dufirst
inttree
ping30 aurint we
tenses f
g leandng eek
sityfrom
eved > 200
k of
y) onm th
l (330
07/0f Oc
n thhe f
3, 60 cm08 ctob
he mfour
6, 9m Dand
ber
mear si
9, 1DBHd thand
an tes
2, H) he d en
16 in 14 nd
Chapter 3 - Frankincense production
50
interconnected over longer distances than those between tapping spots, and thus allowing for
draining frankincense from one spot by the other.
In line with our hypothesis, annual frankincense production increased with a higher tapping
frequency (Figure 6). Frankincense production per tapping round increased over the first 7
collection rounds, then leveled-off, and ultimately decreased, which is in line with our prediction
shown in Fig. 1C (type IV). The initial increase in frankincense production with tapping round
may result from opening-up more resin canals (Trapp and Croteau 2001). Menger (2010) showed
that indeed the density of resin canals increases from outer to inner side of the bark: more
tapping rounds and getting deeper in the bark will open more resin canals. Moreover,
frankincense production may also increase in response to a higher temperature (Wekesa et al.
2009). The decline in resin production at the end of the dry season in the second production
season may indicate exhaustion of the resources for frankincense production (Ella and Tongacan
1987). Similar trends for resin yield per collection round were also obtained for Pinus roxburghii
in India (Chaudhari et al. 1996) and Protium copal in Guatemala (Neels 1996). Remarkably, the
decline was observed for all tapping intensity levels.
Implications for management
It is clear that smaller trees (10 -15 cm DBH) produce much less resin than large trees. We do
not know if intensive tapping of small trees will negatively affect the production capacity of
these trees when large: longer-term studies are needed to evaluate whether tapping has longer-
term effects. However, studies of commercial resin production by Pinus species have led to
obligatory minimum tree size limits for tapping (20 cm DBH in China and 20-25 cm DBH in
other countries; Coppen and Hone 1995; Wang et al. 2006). In India a standard minimum
diameter for tapping of Pinus roxburgii of 30 cm is used (Lohani 1970): tapping of trees smaller
than 25 cm increased annual mortality rate from 1.1% to 29.3%. For B. papyrifera, Mengistu and
coworkers (in preparation) showed that tapping reduced the photosynthetic capacity through a
decrease in crown size. Given the rapid rise in resin yield in trees > 15 cm DBH, we therefore
suggest a minimum tapping diameter of 15 cm for B. papyrifera.
Our results show how frankincense production varies with population, tree size, the amount of
tapping spots, collection rounds and the frequency of tapping. Our study indicates that trees are
Chapter 3 - Frankincense production
51
clearly limited in resin production, and that the amount of tapping spots should be limited to 9 or
less and the amount of tapping rounds should probably not exceed 10 in one production season
(from October to June). Wounding without proper sealing will expose it to attacks by insects,
fungi, or other pathogens (Trapp & Croteau 2001; Abiyu et al. 2010; Negussie 2008). Indeed, B.
papyrifera trees in Tigray with more than 12 tapping spots had higher levels of insect attack
(Negussie 2008). And in Metema the fate of insect affected trees is death: currently more than
65% of the dead B. papyrifera trees in this area were infested by the insect (Chapter 5).
Extremely high numbers of tapping spots and collection rounds as currently found in some
commercial production sites (up to 27 tapping spots – and 16 collection rounds - Kebede 2010)
are therefore likely to result in high adult tree mortality and probably into the collapse of resin
yield in a near future.
CONCLUSION
Resin production by trees is practiced in a sustainable commercialized way for a number of
products and species, but not for most of the highly esteemed resins from tropical dry woodland
trees. In this study, we evaluated how traditional methods drive the resin yield from
Frankincense trees, inhabiting dry woodlands in the Horn of Africa (Ethiopia). Similar methods
have probably been applied for millennia, but currently they result in non sustainable populations
and resin yield. In this paper we show how frankincense yield changes with tapping intensity
level and tapping frequency for trees of different size. We show that management should take
these three factors into account, because that approach allows for maximizing resin yield at
intermediate levels of tree damage by tapping. The presented detailed information of resin yield
dynamics also suggests how physiological constraints limit the resin yield. Finally, we show that
resin yield was relatively similar across populations on contrasting soils and in contrasting
climates. From this we suggest that selection for a similar resin production capacity is strong
across different populations. We consider our study the first broad scale study on the effects of
alternative management regimes inspired by traditional practices, which allows for developing
least damaging and more commercial and sustainable management regimes of the highly
esteemed frankincense in threatened dryland woodlands in the future.

Chapter 3 - Frankincense production
52
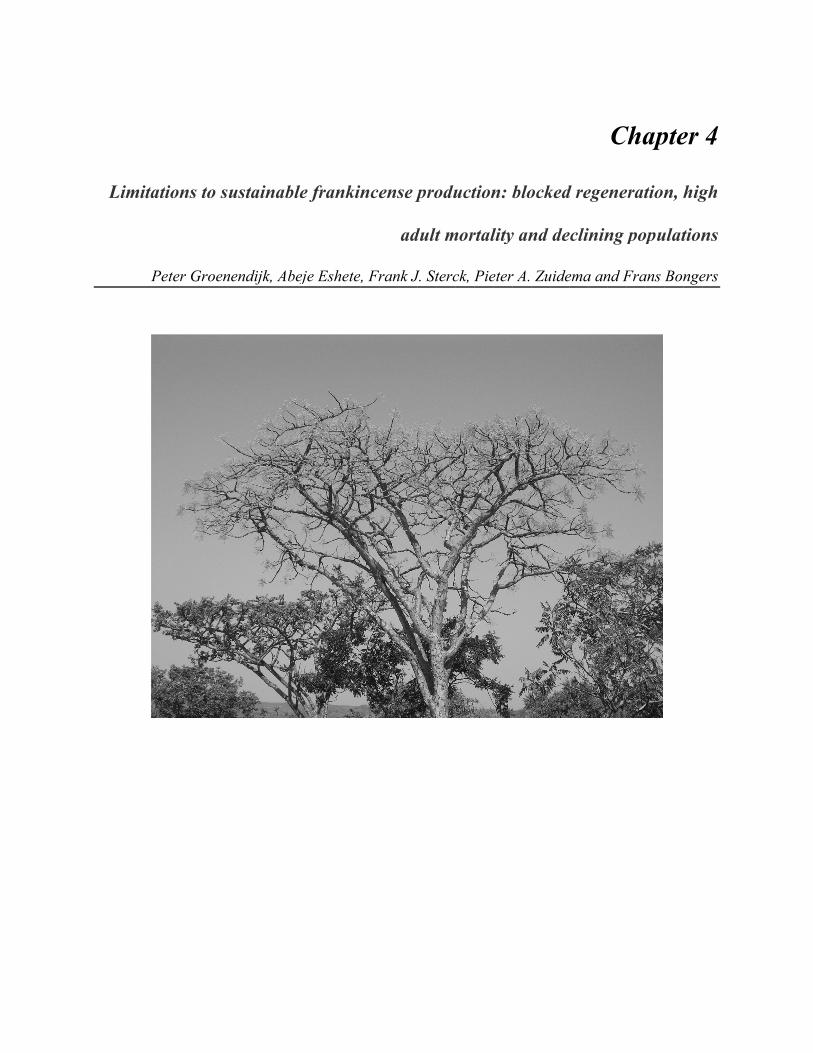
L
Limmita
P
atio
Pet
ons
ter
s to
Gro
o s
oen
ust
nend
tain
dijk
na
k, A
ble
Abej
e fr
je E
ran
Esh
nkin
ete,
nce
, Fr
ens
ran
se p
ad
nk J
pro
dult
J. St
odu
t m
terc
uct
mor
ck, P
tion
rtal
Pie
n: b
lity
eter
blo
y an
r A.
ock
nd
Zu
ked
de
uide
d re
clin
ema
ege
nin
a an
C
ene
ng p
nd F
Cha
erat
pop
Fra
ap
tion
opu
ans B
pte
n, h
ulat
Bon
er
hig
tion
nge
4
gh
ns
ers
Chapter 4 - Declining populations independent of tapping
54
ABSTRACT
Frankincense, an aromatic resin, is tapped from the bark of several Boswellia spp. (Burseraceae).
Though important on local and international markets, exploited populations often suffer from
poor regeneration. The demographic consequences of regeneration bottlenecks are poorly
quantified and understood. Here we report on the first large-scale demographic study of
frankincense-producing trees. We studied twelve populations of Boswellia papyrifera in
Northern Ethiopia, distributed over an altitudinal and forest productivity gradient. Six of these
populations had been exploited and were tapped during the study. Survival, growth and fecundity
were determined for 4370 adult trees and 2228 seedlings and saplings, in a total of 22.8 ha over
two years. Additionally an isolated population was studied to quantify growth and survival rates
of missing sapling classes. Matrix models were used to project population growth and
frankincense production based on observed dynamics and four management scenarios.
Population structures of both tapped and untapped populations show clear gaps. Small seedlings
– which only appear above-ground during the rainy season – were abundant in the 12 main
populations, but none developed into persistent saplings. Fire and grazing are likely causes of
this regeneration bottleneck. Tapped populations presented higher diameter growth rates and
fecundity compared to untapped populations, while survival rates did not differ. Faster growth in
tapped populations probably resulted from non-random selection of exploited populations by
tappers. Our matrix models projected an 87% decline in size of tapped populations over 50 years,
and a 93% decline of untapped populations. Frankincense yields were projected to be halved in
~15 years. Scenario studies showed that stable populations could only be achieved when sapling
recruitment was guaranteed and adult mortality was strongly reduced. Tapping does not appear
to be the major driver behind these bottlenecks and field trials are needed to determine their
causes and possible solutions to them. In conclusion, in addition to the conversion to agricultural
land, the lack of regeneration and high adult mortality are causing raid decline of Frankincense-
producing tree populations in Ethiopia. Current levels of frankincense production cannot be
sustained unless these demographic bottlenecks are overcome.
Key words: population dynamics, tapping, managment actions, vital rates, frankincense,
Ethiopia

Chapter 4 - Declining populations independent of tapping
55
INTRODUCTION
Resins are among the most valuable Non Timber Forest Products (NTFP) produced, particularly
those tapped for fragrances and flavours. Frankincense, an oleo-gum resin tapped from several
Boswellia spp of the Burseraceae family, is an important resin on the local and international
market (Lemenih, Abebe & Olsson 2003b). For instance, in the Horn of Africa, frankincense is
tapped from adult individuals of Boswellia papyrifera (Del.) Hochst. in natural woodlands and
has several traditional, medicinal and ceremonial uses. On the international market it is an
important commodity in the production of perfumes and incenses (Chikamai 2002; Lemenih &
Teketay 2003b). B. papyrifera is a small deciduous tree, occurring from northern Nigeria to the
highlands of Ethiopia and Eritrea, often on steep and rocky slopes with shallow soil in semi-arid
conditions (Ogbazghi et al. 2006a). Tapping of resins can form a substantial sink of
carbohydrates for a tree (Silpi et al. 2007) and reduce diameter growth (Silpi et al. 2006). In
Boswellia, tapping was found to reduce seed production and viability (Rijkers et al. 2006), but its
effects on growth of trees and populations are unknown.
Many populations of B. papyrifera are threatened by conversion into agricultural land and the
lack of natural regeneration (Ogbazghi 2001; Gebrehiwot et al. 2003; Ogbazghi et al. 2006a).
Natural Boswellia populations often present a hump-shaped population distribution, dominated
by small seedlings and adult trees, lacking the sapling and treelet stages (Ogbazghi 2001;
Gebrehiwot et al. 2003; Eshete, Teketay & Hulten 2005; Abiyu et al. 2010). This gap in the
population structure may be caused by the low production and viability of seeds of tapped trees
(Rijkers et al. 2006), recurrent droughts (Ogbazghi 2001), increased fire frequency, uncontrolled
livestock grazing (Ogbazghi et al. 2006a) or a combination of these (Eshete, Teketay & Hulten
2005; Abiyu et al. 2010). Alternatively, the lack of regeneration may refer to unfavourable
conditions during the recent past and to episodic recruitment, as sometimes encountered in arid
environments (Crisp 1978; Walker 1993; Watson, Westoby & Holm 1997).
Blocked regeneration poses a threat to the maintenance of Boswellia populations and the
production of frankincense on the long term. Understanding the effects of tapping and the
blocked regeneration on population dynamics is crucial to assess the sustainability of current
frankincense exploitation practices. Despite the economic importance of this species, virtually
nothing is known about the population dynamical consequences of tapping and blocked
regeneration in Boswellia populations. Such information can be obtained from stage-based

Chapter 4 - Declining populations independent of tapping
56
population matrix models (Caswell 2001) which project population development. Matrix models
are powerful tools to study population dynamics and have often been applied to study
consequences of NTFP harvest (Ticktin 2004). They require relatively low data inputs for model
parameterization and are suitable for sustainability analysis of NTFPs harvest (Boot & Gullison
1995).
Here we present a first study on the consequences of current frankincense exploitation for
Boswellia populations and future frankincense production. This is also one of the first studies
assessing the effects of resin tapping on population growth (Ticktin 2004). We hypothesize that
tapped Boswellia populations will present stronger regeneration bottlenecks and lower rates of
diameter growth, fecundity and survival compared to untapped populations. As a result, we
expect lower population growth rates in tapped populations. We also expect that simulating full
sapling regeneration in models for tapped and untapped populations will cause simulations to
show growing populations.
We studied the dynamics in populations of six tapped and six untapped stands between 2007 and
2009. Data from another study area, where saplings and treelets are present, were used to
quantify the vital rates of these size categories. We constructed matrix models for the pooled data
of all tapped and all untapped populations, and used these to project population development.
Using results from a yield study, we converted projected population sizes to projected
frankincense yield. We also implemented various management scenarios, for increased
regeneration and reduced adult mortality.
MATERIALS AND METHODS
Experimental sites and study species
Data collection was carried out in Metema districts, northern Ethiopia (12°33.58' – 12°41.53'N,
36°04.12' – 36°18.84'E). Stands were selected based on the presence of relatively intact B.
papyrifera populations and to cover altitudinal and ‘production’ gradients (based on visual
observations of stand characteristics and nearby cropland production). The region has a uni-
modal rainfall, with the rainy season extending from June to the end of September. The annual
rainfall in Metema ranges from (870-1390 mm (mean=965 mm), the mean minimum temperature
is 19.6ºC and the mean maximum 35.7°C. The region is one of the main Boswellia growing areas
Chapter 4 - Declining populations independent of tapping
57
in the Horn of Africa and has attracted several companies for the commercial extraction of
frankincense (Eshete, Teketay & Hulten 2005). Population structure of Boswellia stands in the
study area present only individuals in the classes above ca. 6 cm Diameter at Breast Height
(DBH), except for small non-permanent seedlings (Eshete, Teketay & Hulten 2005; Abiyu et al.
2010). Additionally, a third site was selected near the village of Adi Arkay (13º27’N, 38º4’E), in
the homonymous district, ca. 210 km Northeast of Metema. Located at an altitude of 1415 m, the
area is characterized by steep cliffs with presence of Boswellia populations. In Adi Arkay, B.
papyrifera regeneration of all sizes is present, presumably because the poor accessibility of the
area prevents grazing and agricultural practices.
Boswellia papyrifera is a deciduous multipurpose tree found in woodlands and wooded
grasslands with an altitudinal range of 800 – 1850 m (in Eritrea), often occurring on steep rocky
slopes, sandy river valleys or lava flows (Ogbazghi et al. 2006b). In our study region, trees
reached maximum height of 14–16 m, and a max DBH of 51.5 cm. The phenological cycle of the
species is mainly controlled by the precipitation regime, characterized by a long dry season
starting in mid-September to mid-May. Tapping for frankincense occurs during the dry season
and coincides with the reproductive cycle of Boswellia. A special axe (‘mengaff’) is used to
make incisions in the bark and trees are revisited periodically to collect the resin clumps and
reopen tapping wounds. Tapping intensity (the amount of tapping spots) and frequency (the
amount of rounds of frankincense collection) is variable among trees and tapping methods. The
‘traditional’ tapping intensity – which we applied in this research – implies 6-8 tapping incisions
for trees of 10-30 cm DBH and 8-12 incisions for larger trees, after which frankincense is
collected in 8-12 rounds (Ogbazghi 2001). Due to increasing demand, current commercial
tapping is performed at much higher intensities, with up to 18 tapping spots on trees of 10-30 cm
and up to 27 spots in trees > 30cm DBH (Kebede 2010).
Data collection
In Metema, 12 plots of 1.6-2.0 ha (total area 22.8 ha) were installed: six plots in areas where
frankincense tapping is conducted (T1-T6) and six in untapped areas (U1-U6). Measurements
took place during the rainy seasons (July) of 2007, 2008 and 2009.
During the first census, a total of 4370 trees >1cm DBH were found, tagged and their DBH
measured. For all individuals under 150 cm height (n=2228), diameter at the stem base (hence
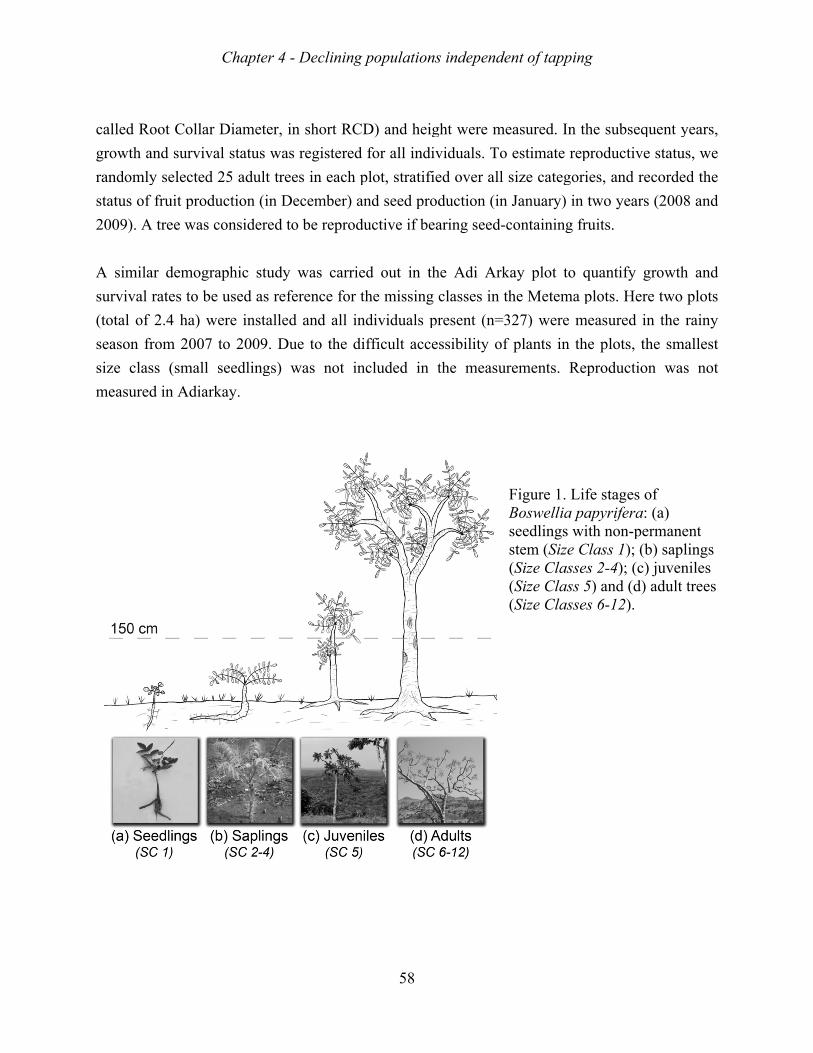
cal
gro
ran
stat
200
A
sur
(tot
sea
siz
me
lled
owt
ndom
tus
09)
sim
rviv
tal
ason
e c
easu
d Ro
th a
mly
of
. A
mila
val r
of
n fr
clas
ured
oot
and
y se
fru
A tre
ar d
rate
2.4
rom
ss (
d in
Co
sur
elec
uit p
ee w
dem
es t
4 ha
m 20
(sm
n Ad
olla
rviv
cted
prod
was
mog
to b
a) w
007
mall
diar
C
ar D
val
d 25
duc
co
rap
be u
wer
7 to
se
rka
Chap
Diam
stat
5 ad
ctio
nsi
phic
used
re i
o 20
eedl
ay.
apte
met
tus
dult
n (i
der
c st
d as
nst
009
ling
er 4
ter,
wa
t tre
in D
red
tudy
s re
alle
9. D
gs)
4 - D
in
as r
ees
Dec
to b
y w
efer
ed a
Due
wa
Dec
sho
regi
s in
cem
be r
was
enc
and
to
as
clin
ort R
ister
eac
mber
rep
ca
ce f
d al
the
not
ing
RC
red
ch p
r) a
rod
arrie
for t
ll in
e d
t in
g po
CD)
d fo
plo
and
duct
ed
the
ndiv
diffi
nclu
opul
an
r al
t, s
see
tive
out
mi
vidu
icul
ude
lati
58
nd h
ll in
strat
ed p
e if
t in
issi
ual
lt ac
ed i
ions
heig
ndiv
tifie
pro
bea
n th
ng
s p
cce
in
s in
ght
vidu
ed o
oduc
arin
he A
cla
pres
essib
the
ndep
we
ual
ove
ctio
ng s
Adi
asse
ent
bili
e m
pen
ere m
s. T
er a
on (
seed
i A
es in
t (n
ity
meas
nden
mea
To e
all s
(in J
d-c
Arka
n th
n=32
of
sure
FBss(((
nt o
asu
esti
size
Jan
ont
ay p
he M
27)
pla
eme
FiguBosseedstem(Siz(Siz(Siz
of ta
ured
ima
e ca
nuar
tain
plo
Met
) we
ants
ent
ureswedlinm (Sze Cze Cze C
app
d. In
ate r
ateg
ry)
ning
ot to
tem
ere
s in
s. R
1. llia
ngs Size
ClasClasClas
ping
n th
rep
gori
in t
g fru
o q
ma p
me
the
Rep
Lifa pa
wite Cssesss 5sses
g
he s
prod
es,
two
uits
quan
plot
eas
e p
pro
fe stapyrth n
Classs 2-5) as 6-
sub
duct
and
o ye
s.
ntif
ts. H
ure
lots
duc
tagrifenons 1)-4);nd -12)
seq
tive
d re
ears
fy g
Her
ed i
s, th
ctio
es oera:n-pe); (b (c)(d)).
quen
e st
eco
s (2
grow
re tw
in th
he
on w
of : (a)ermb) s) ju ad
nt y
tatu
orde
200
wth
wo
he
sm
wa
) manesapl
uvendult
yea
us, w
ed t
8 an
h an
plo
rain
malle
s n
ent lingniletre
ars,
we
the
nd
nd
ots
ny
est
not
gs es es
Chapter 4 - Declining populations independent of tapping
59
In addition to the above demographic studies, we also conducted a tapping experiment to relate
frankincense production per tree to its size (DBH). In two of the sites in Metema we selected ca.
5 trees per 10 cm DBH category just outside the plots and tapped them at an average intensity of
9 incisions in 2008 and 2009. Resin clumps produced by each tree were collected and their dry
weight was measured.
Categorization and population structure
The population cycle of Boswellia papyrifera can roughly be split into seedlings, saplings,
juvenile trees and adult trees (Figure 1). Seedlings are 0-2.0 cm RCD in size, with a height of 0-
2.6 cm. In the Metema plots, we observed that these seedlings die back every dry season. It
seems that these seedlings do not invest in height growth, forming only a rosette of leaves during
the rainy period. Presumably, seedlings in this stage invest in roots and reserves. Several
seedlings were dug out and even for small individuals, root systems of more than two meters in
length were found (A. Eshete, unpublished data and P. Groenendijk).
It is unclear what triggers the switch from non-permanent seedlings to permanent sapling and we
assume that this shift is made at approximately 2.0 cm RCD (Supporting Information Fig. S1).
Saplings are all individuals between 2.0 cm RCD and 6 cm DBH, subdivided into three size
classes: 2-4 cm RCD, from 4.0 cm RCD to 150 cm height and from 150 cm height to 6 cm DBH.
All individuals between 6-10 cm DBH were categorized as juvenile (non-reproductive) trees.
Reproduction started at ~10cm DBH and individuals >10cm DBH were thus classified as adults
and categorized in 7 DBH categories, from 10-14, 14-18, 18-22, 22-26, 26-30 30-35 and >35cm.
Thus, a total of 12 categories were distinguished: one for seedlings, three for saplings, one for
juvenile and seven for adult individuals (Fig. 1).
To obtain representative population structures for tapped and untapped populations based on a
sufficiently large sample size in all categories, we pooled abundance data from the six tapped
and untapped populations. We compared these population structures using a Kolmogorov-
Smirnov test. We also tested for differences in adult and seedling densities (using plots as
replicates) using a t-test.
Chapter 4 - Declining populations independent of tapping
60
Calculation of vital rates
We tested for relations between size on the one hand and growth, survival and reproduction on
the other, using regression models. In these models, data of all size categories were combined.
We used dummy variables to analyze differences between individual plots (tapped: T1-T6 and
untapped: U1-U6) and interaction terms (plot*DBH) to check for differential relations across
plots. To calculate the relation between growth rates and size we used linear regressions. For
seedlings, the regression was computed between increment in root collar diameter (ΔRCD) and
RCD for the period of 2008-2009. For saplings, we used growth data from Adi Arkay over two
years (from 2007-2009). For adults, we used diameter increment (ΔDBH) over the period of
2007-2009. The relation between survival and diameter was analyzed using a multiple logistic
regression. We also used a logistic regression to analyze the relation between reproduction and
diameter and to calculate the probability of reproduction (Prob{f}i) per size class. We computed
the regression for each year separately and calculated the Prob{f}i per year for the six tapped and
six untapped plots. Annual frankincense production per tree (in kg) was related to DBH by a
linear regression.
Matrix model construction
We used stage based matrix models (Caswell 2001) to analyze the population dynamics of B.
papyrifera. Matrix models are in the form: n(t+1) = A x n(t). Where n(t) and n(t+1) represent
the population structure at time t and t+1, and A the square matrix containing the transition
probabilities between categories for each time step (1 year). In our case, transition matrix A had
12 size categories.
We first parameterized one transition matrix for tapped and one for untapped stands based on the
observed transitions in Metema (i.e. with blocked regeneration). These are hence called ‘business
as usual’. We then used these as a basis to create management scenarios with increased
regeneration and reduced adult mortality (see below under Scenarios).
Matrix elements in A can be grouped into progression (G, in the sub-diagonal of the matrix),
stasis (P, the diagonal of the matrix) and fecundity (F, the upper row except for the leftmost
element). The progression elements represent the probability of an individual to grow from one
size class (gi) to the next and were calculated as Gi = i * i, where i is the probability that a

Chapter 4 - Declining populations independent of tapping
61
surviving individual in size class i grows to the next class (i+1) and i is the annual survival
probability in class i. We calculated i as gi/ci, where gi is the DBH or RCD growth rate for
category i (in cm.yr-1 at its midpoint) and ci is the category width (in cm). The stasis elements (P)
represent the probability that a surviving individual stays in the same size class and were
calculated as Pi = i - Gi. The fecundity elements represent the seedling production per adult
individual. Assuming that the number of new seedlings is equal for all reproductive individuals,
we calculated F as Fi = i Prob{f}i fi, where Prob{f}i is the probability for an individual in
class i of being reproductive and fi the quotient of annual seedling recruitment per hectare
divided by the abundance of reproductive adults per hectare.
To determine the vital rate value for every category, we used the regression equations of vital
rates and size, by filling the size midpoint in the regression equation. For seedlings and trees >6
cm DBH, we calculated vital rates with data from Metema. The vital rates for saplings were
calculated using data from Adi Arkay, and these were only used in transition models for the
management scenarios (see below). The production of seedlings for each size class was
calculated by multiplying the reproductive probability of that size class with the annual number
of seedlings produced per reproductive tree.
Growth rates of seedlings presented high variation between individuals and an average negative
growth rate, likely due to the annual die-back of non-permanent seedlings. We therefore used
observed transitions from a different area to calculate the transition probability from seedling to
sapling. Seedlings have been observed to continuously die-back yearly, even eight years after
being planted (E. Birhane, pers. communication). We assumed that seedlings need at least 10
years to become permanent (growth rate of 0.2 cm.yr-1) and used this growth rate in our
simulation.
For the ‘business as usual’ models (Supporting Information Table S1) we calculated the vital
rates for each of the six tapped and untapped plots using the regression models. Subsequently we
took the average of each vital rate per size category from the six tapped and untapped plots. This
procedure ensures that we obtain good and representative transition matrix for both tapped and
untapped stands, in which plots that differ in environmental conditions and tree densities have an
equal weight.

Chapter 4 - Declining populations independent of tapping
62
Scenario analysis
The business as usual models were used as the basis for several scenarios. Firstly, we used the
vital rates from Adi Arkay to create transition matrices that included seedling-to-sapling
transitions, for both for tapped and untapped populations (‘REG’ scenario, Supporting
Information Table 1). Second, we also performed scenarios in which adult mortality was
reduced, as this is an important vital rate which may be targeted by active management and
protection in Boswellia populations. We simulated a 50% reduction in adult mortality (scenario
REGMOR50) and a 75% reduction (scenario REGMOR75). Finally, to account for eventual
effects of variation in seedling growth speed on the population growth, we also simulated
variation in seedling growth by doubling (to 20 years) and halving (to 5 years) growth rates. We
could thus test our hypotheses that population decline results from a lack of regeneration alone or
also from the observed high adult morality rates.
Matrix model analysis
In matrix modelling, the dominant eigenvalue of a matrix (λ) represents the fixed population
growth rate of the matrix once it has reached the stable stage distribution (i.e. the eigenvector of
the matrix). Both eigenvalue and eigenvector are inherent characteristics of a matrix model
(Caswell 2001). Although the eigenvalue is the most used measure for population growth, it is
not realistic to apply it to a population with a blocked regeneration. Therefore we calculated the
transient population growth rate over a period of 100 years (λ100). Transient growth rates take the
population structure at t=0 into account and were calculated as:
λnn
where n0 and n100 are the population sizes at t=0 and at t=100, respectively. We calculated λ100
for tapped and untapped populations in the ‘business as usual’ situation, as well as for the three
management scenarios. These projections were combined with results of the yield experiment to
calculate the development of frankincense yield over 100 years.
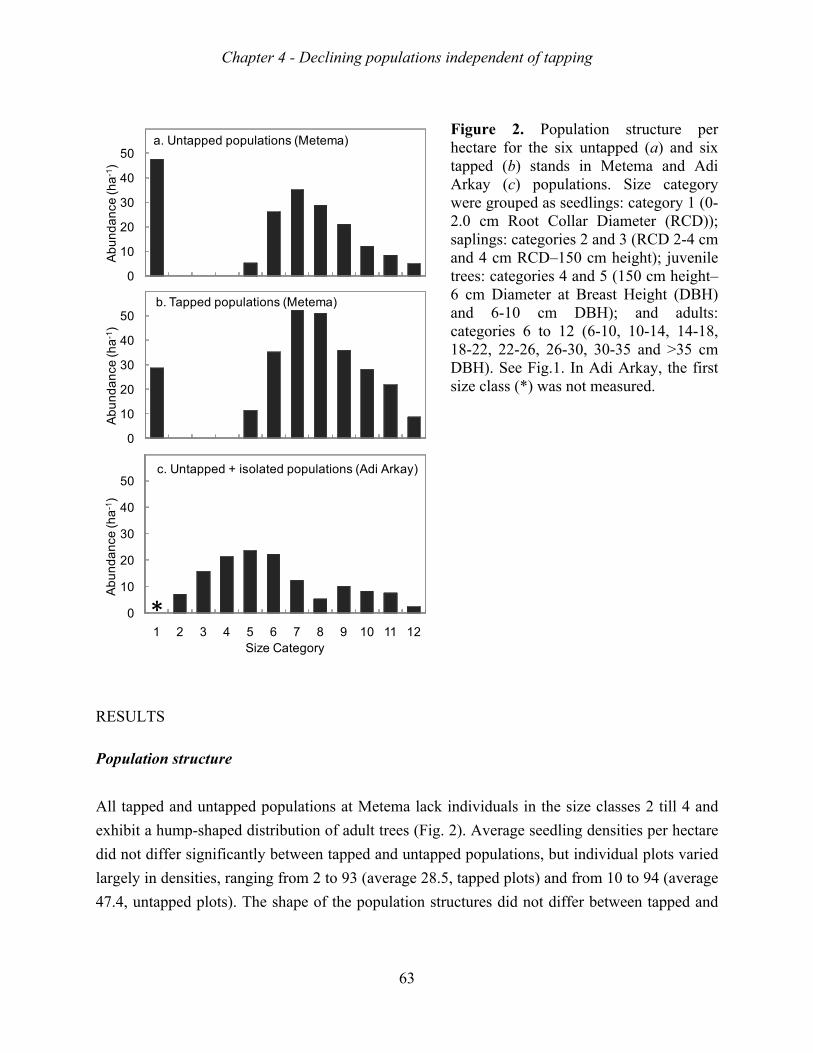
Chapter 4 - Declining populations independent of tapping
63
Figure 2. Population structure per hectare for the six untapped (a) and six tapped (b) stands in Metema and Adi Arkay (c) populations. Size category were grouped as seedlings: category 1 (0-2.0 cm Root Collar Diameter (RCD)); saplings: categories 2 and 3 (RCD 2-4 cm and 4 cm RCD–150 cm height); juvenile trees: categories 4 and 5 (150 cm height–6 cm Diameter at Breast Height (DBH) and 6-10 cm DBH); and adults: categories 6 to 12 (6-10, 10-14, 14-18, 18-22, 22-26, 26-30, 30-35 and >35 cm DBH). See Fig.1. In Adi Arkay, the first size class (*) was not measured.
RESULTS
Population structure
All tapped and untapped populations at Metema lack individuals in the size classes 2 till 4 and
exhibit a hump-shaped distribution of adult trees (Fig. 2). Average seedling densities per hectare
did not differ significantly between tapped and untapped populations, but individual plots varied
largely in densities, ranging from 2 to 93 (average 28.5, tapped plots) and from 10 to 94 (average
47.4, untapped plots). The shape of the population structures did not differ between tapped and
0
10
20
30
40
50
Ab
un
da
nce
(ha
-1)
a. Untapped populations (Metema)
0
10
20
30
40
50
Ab
un
da
nce
(ha
-1)
b. Tapped populations (Metema)
0
10
20
30
40
50
1 2 3 4 5 6 7 8 9 10 11 12
Ab
un
da
nce
(ha
-1)
Size Category
c. Untapped + isolated populations (Adi Arkay)
*
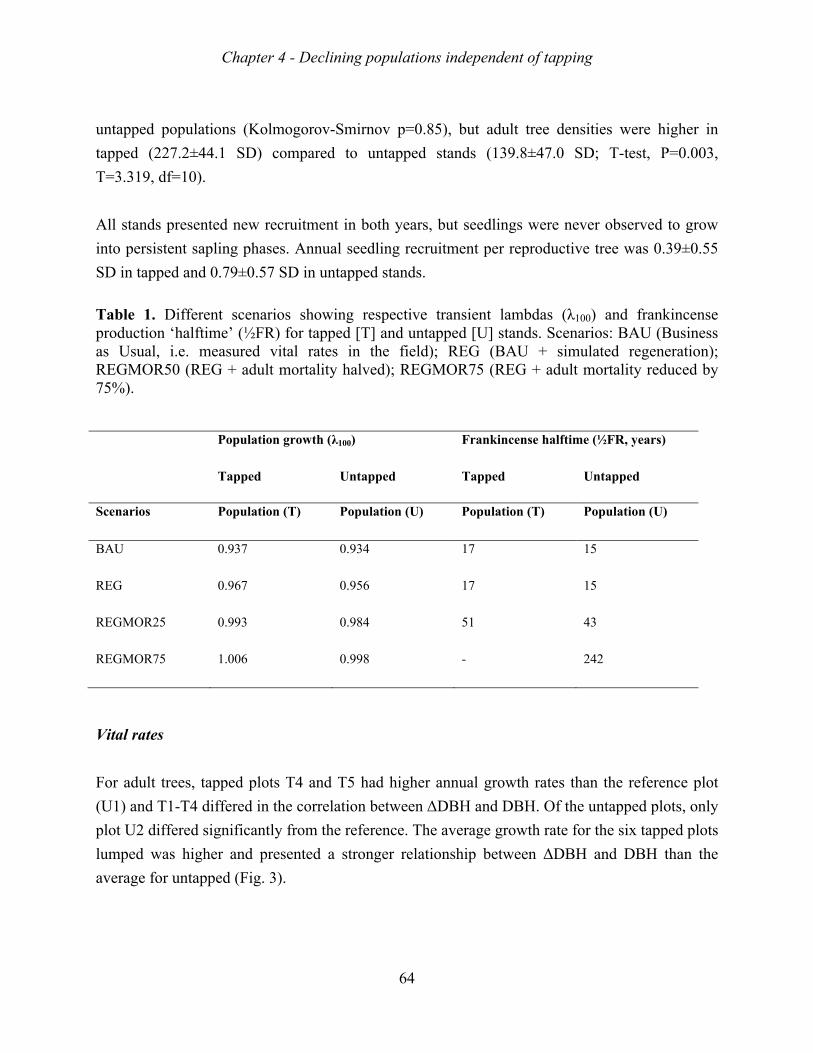
Chapter 4 - Declining populations independent of tapping
64
untapped populations (Kolmogorov-Smirnov p=0.85), but adult tree densities were higher in
tapped (227.2±44.1 SD) compared to untapped stands (139.8±47.0 SD; T-test, P=0.003,
T=3.319, df=10).
All stands presented new recruitment in both years, but seedlings were never observed to grow
into persistent sapling phases. Annual seedling recruitment per reproductive tree was 0.39±0.55
SD in tapped and 0.79±0.57 SD in untapped stands.
Table 1. Different scenarios showing respective transient lambdas (λ100) and frankincense production ‘halftime’ (½FR) for tapped [T] and untapped [U] stands. Scenarios: BAU (Business as Usual, i.e. measured vital rates in the field); REG (BAU + simulated regeneration); REGMOR50 (REG + adult mortality halved); REGMOR75 (REG + adult mortality reduced by 75%).
Vital rates
For adult trees, tapped plots T4 and T5 had higher annual growth rates than the reference plot
(U1) and T1-T4 differed in the correlation between ΔDBH and DBH. Of the untapped plots, only
plot U2 differed significantly from the reference. The average growth rate for the six tapped plots
lumped was higher and presented a stronger relationship between ΔDBH and DBH than the
average for untapped (Fig. 3).
Population growth (λ100) Frankincense halftime (½FR, years)
Tapped Untapped Tapped Untapped
Scenarios Population (T) Population (U) Population (T) Population (U)
BAU 0.937 0.934 17 15
REG 0.967 0.956 17 15
REGMOR25 0.993 0.984 51 43
REGMOR75 1.006 0.998 - 242
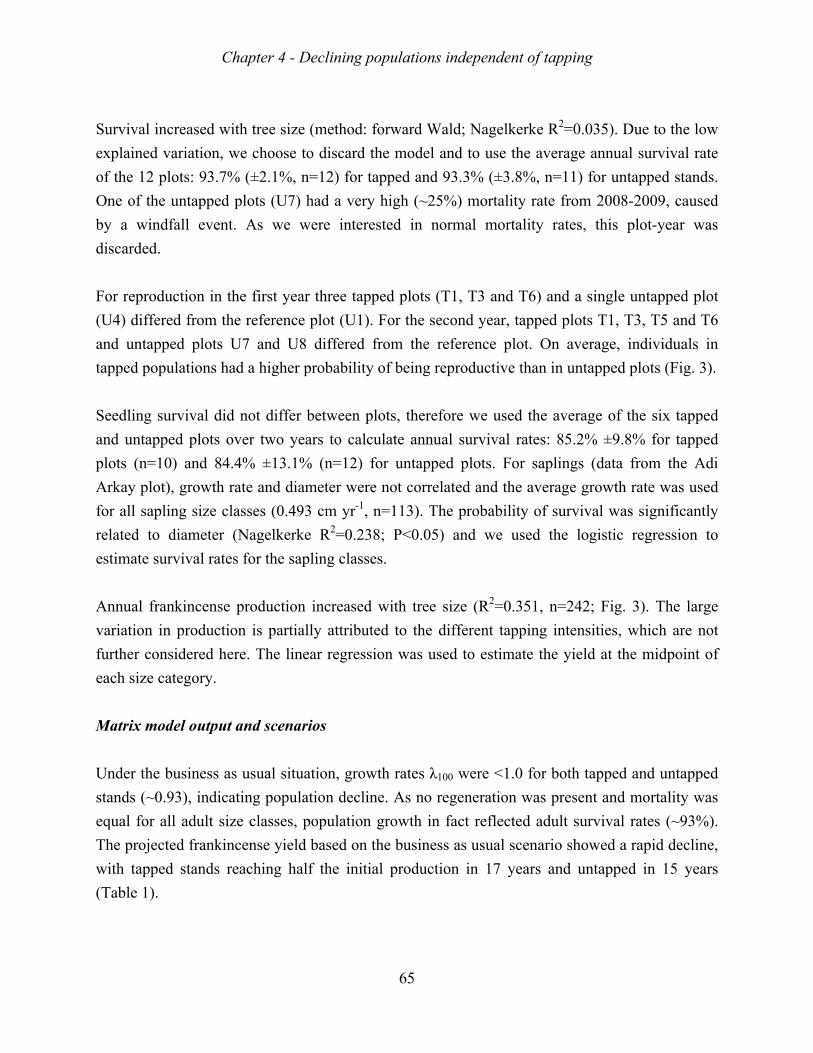
Chapter 4 - Declining populations independent of tapping
65
Survival increased with tree size (method: forward Wald; Nagelkerke R2=0.035). Due to the low
explained variation, we choose to discard the model and to use the average annual survival rate
of the 12 plots: 93.7% (±2.1%, n=12) for tapped and 93.3% (±3.8%, n=11) for untapped stands.
One of the untapped plots (U7) had a very high (~25%) mortality rate from 2008-2009, caused
by a windfall event. As we were interested in normal mortality rates, this plot-year was
discarded.
For reproduction in the first year three tapped plots (T1, T3 and T6) and a single untapped plot
(U4) differed from the reference plot (U1). For the second year, tapped plots T1, T3, T5 and T6
and untapped plots U7 and U8 differed from the reference plot. On average, individuals in
tapped populations had a higher probability of being reproductive than in untapped plots (Fig. 3).
Seedling survival did not differ between plots, therefore we used the average of the six tapped
and untapped plots over two years to calculate annual survival rates: 85.2% ±9.8% for tapped
plots (n=10) and 84.4% ±13.1% (n=12) for untapped plots. For saplings (data from the Adi
Arkay plot), growth rate and diameter were not correlated and the average growth rate was used
for all sapling size classes (0.493 cm yr-1, n=113). The probability of survival was significantly
related to diameter (Nagelkerke R2=0.238; P<0.05) and we used the logistic regression to
estimate survival rates for the sapling classes.
Annual frankincense production increased with tree size (R2=0.351, n=242; Fig. 3). The large
variation in production is partially attributed to the different tapping intensities, which are not
further considered here. The linear regression was used to estimate the yield at the midpoint of
each size category.
Matrix model output and scenarios
Under the business as usual situation, growth rates λ100 were <1.0 for both tapped and untapped
stands (~0.93), indicating population decline. As no regeneration was present and mortality was
equal for all adult size classes, population growth in fact reflected adult survival rates (~93%).
The projected frankincense yield based on the business as usual scenario showed a rapid decline,
with tapped stands reaching half the initial production in 17 years and untapped in 15 years
(Table 1).
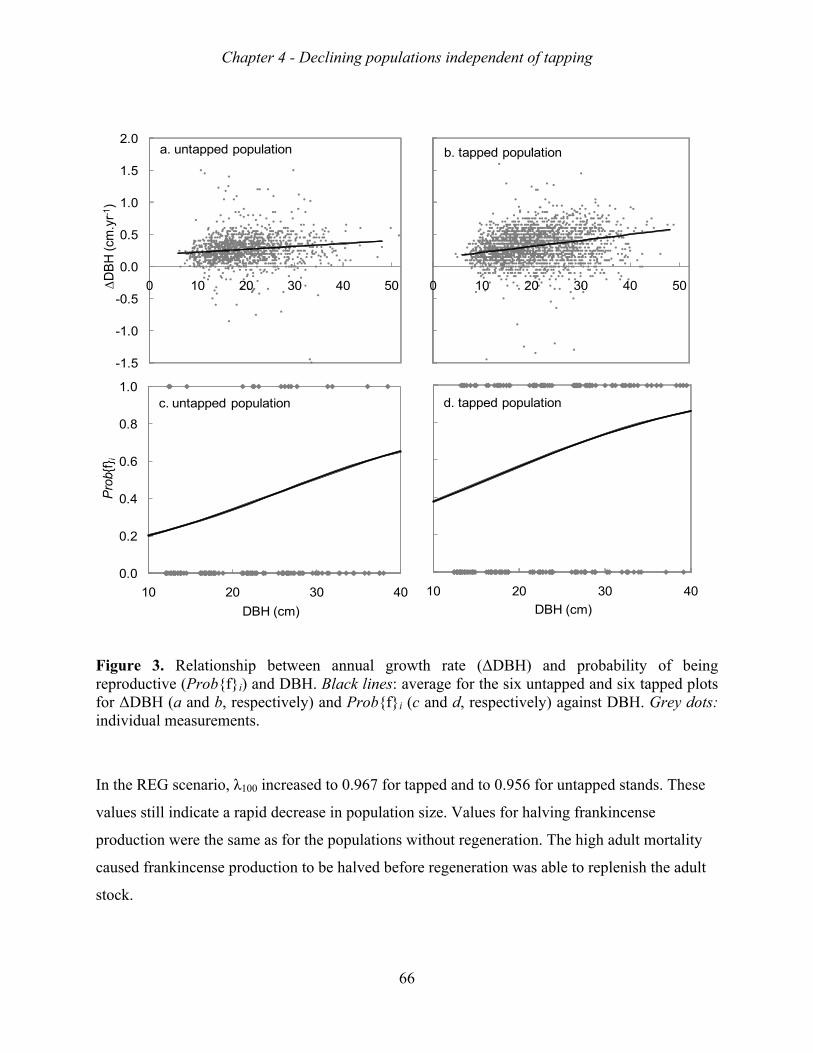
Chapter 4 - Declining populations independent of tapping
66
Figure 3. Relationship between annual growth rate (ΔDBH) and probability of being reproductive (Prob{f}i) and DBH. Black lines: average for the six untapped and six tapped plots for ΔDBH (a and b, respectively) and Prob{f}i (c and d, respectively) against DBH. Grey dots: individual measurements.
In the REG scenario, λ100 increased to 0.967 for tapped and to 0.956 for untapped stands. These
values still indicate a rapid decrease in population size. Values for halving frankincense
production were the same as for the populations without regeneration. The high adult mortality
caused frankincense production to be halved before regeneration was able to replenish the adult
stock.
0 10 20 30 40 50
�D
BH
(cm
.yr
-1)
b. tapped population
10 20 30 40
DBH (cm)
d. tapped population
-1.5
-1.0
-0.5
0.0
0.5
1.0
1.5
2.0
0 10 20 30 40 50DB
H (
cm.y
r-1)
a. untapped population
0.0
0.2
0.4
0.6
0.8
1.0
10 20 30 40
Prob{
f}i
DBH (cm)
c. untapped population
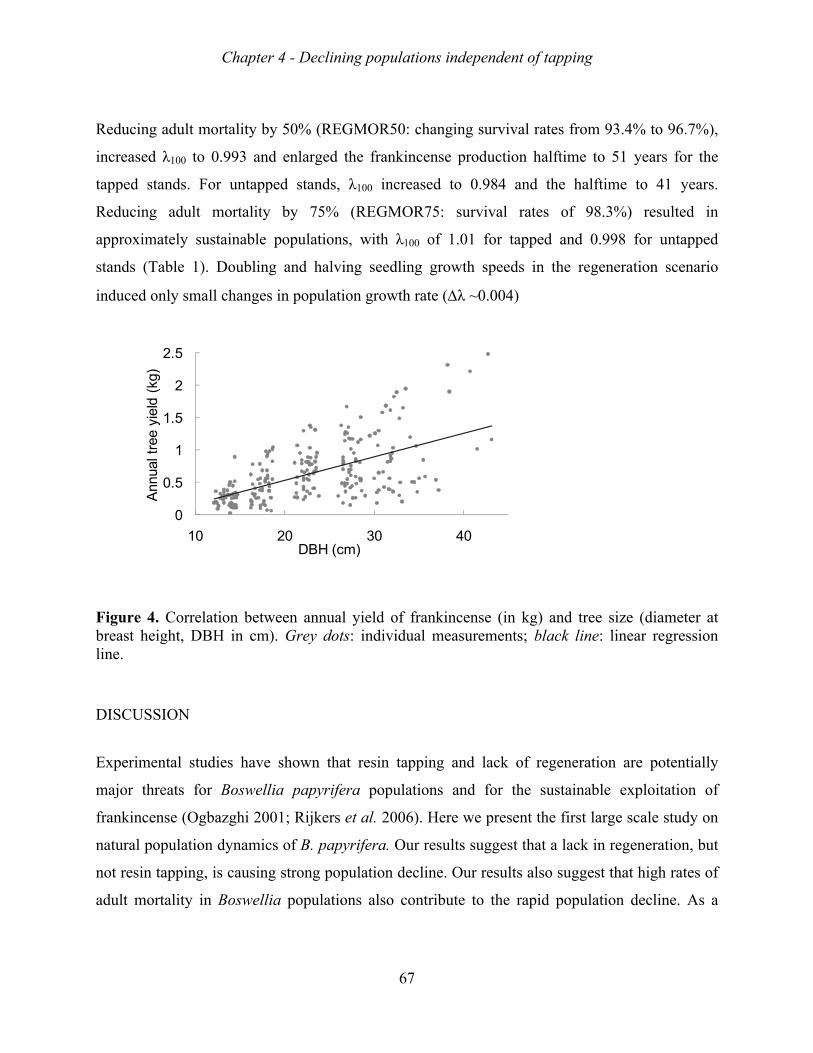
Chapter 4 - Declining populations independent of tapping
67
Reducing adult mortality by 50% (REGMOR50: changing survival rates from 93.4% to 96.7%),
increased λ100 to 0.993 and enlarged the frankincense production halftime to 51 years for the
tapped stands. For untapped stands, λ100 increased to 0.984 and the halftime to 41 years.
Reducing adult mortality by 75% (REGMOR75: survival rates of 98.3%) resulted in
approximately sustainable populations, with λ100 of 1.01 for tapped and 0.998 for untapped
stands (Table 1). Doubling and halving seedling growth speeds in the regeneration scenario
induced only small changes in population growth rate (λ ~0.004)
Figure 4. Correlation between annual yield of frankincense (in kg) and tree size (diameter at breast height, DBH in cm). Grey dots: individual measurements; black line: linear regression line.
DISCUSSION
Experimental studies have shown that resin tapping and lack of regeneration are potentially
major threats for Boswellia papyrifera populations and for the sustainable exploitation of
frankincense (Ogbazghi 2001; Rijkers et al. 2006). Here we present the first large scale study on
natural population dynamics of B. papyrifera. Our results suggest that a lack in regeneration, but
not resin tapping, is causing strong population decline. Our results also suggest that high rates of
adult mortality in Boswellia populations also contribute to the rapid population decline. As a
0
0.5
1
1.5
2
2.5
10 20 30 40
Ann
ual t
ree
yiel
d (k
g)
DBH (cm)
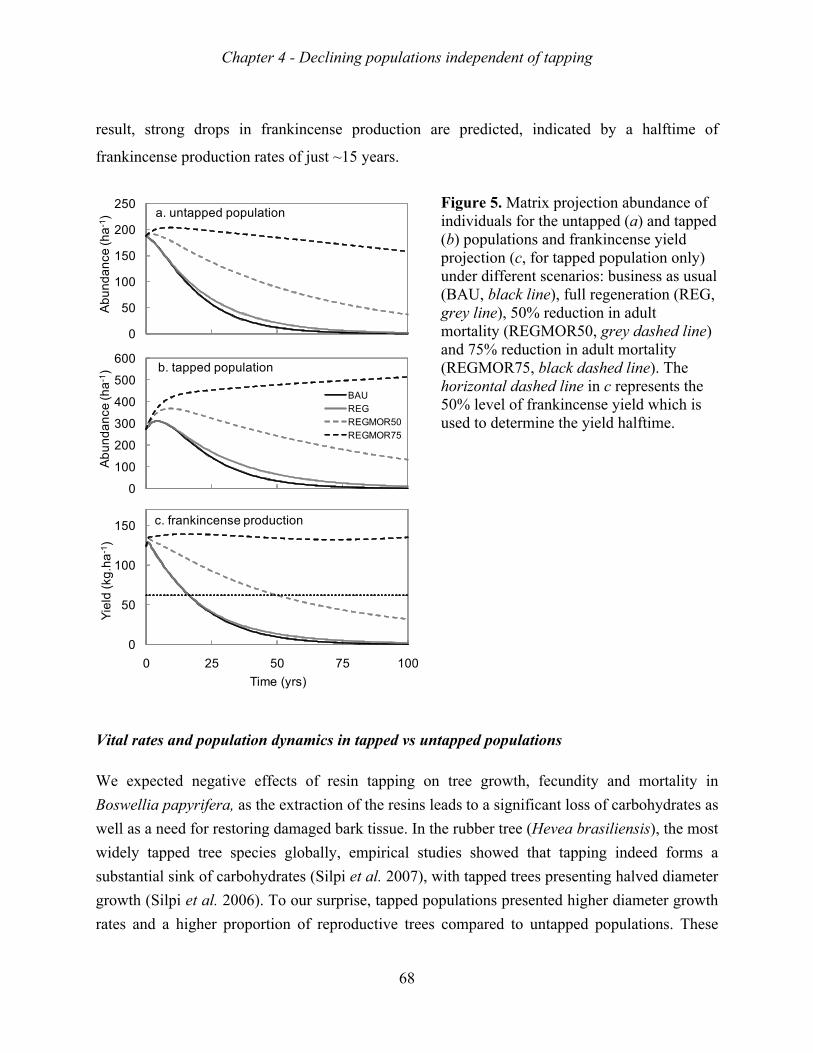
Chapter 4 - Declining populations independent of tapping
68
result, strong drops in frankincense production are predicted, indicated by a halftime of
frankincense production rates of just ~15 years.
Figure 5. Matrix projection abundance of individuals for the untapped (a) and tapped (b) populations and frankincense yield projection (c, for tapped population only) under different scenarios: business as usual (BAU, black line), full regeneration (REG, grey line), 50% reduction in adult mortality (REGMOR50, grey dashed line) and 75% reduction in adult mortality (REGMOR75, black dashed line). The horizontal dashed line in c represents the 50% level of frankincense yield which is used to determine the yield halftime.
Vital rates and population dynamics in tapped vs untapped populations
We expected negative effects of resin tapping on tree growth, fecundity and mortality in
Boswellia papyrifera, as the extraction of the resins leads to a significant loss of carbohydrates as
well as a need for restoring damaged bark tissue. In the rubber tree (Hevea brasiliensis), the most
widely tapped tree species globally, empirical studies showed that tapping indeed forms a
substantial sink of carbohydrates (Silpi et al. 2007), with tapped trees presenting halved diameter
growth (Silpi et al. 2006). To our surprise, tapped populations presented higher diameter growth
rates and a higher proportion of reproductive trees compared to untapped populations. These
0
50
100
150
200
250
Ab
un
da
nce
(ha
-1) a. untapped population
0
100
200
300
400
500
600
Ab
un
da
nce
(ha
-1) b. tapped population
BAU
REG
REGMOR50
REGMOR75
0
50
100
150
0 25 50 75 100
Yie
ld (
kg.h
a-1
)
Time (yrs)
c. frankincense production
Chapter 4 - Declining populations independent of tapping
69
results contrast with experimental studies on the effect of tapping. Rijkers et al. (2006) showed
that tapping of Boswellia had a negative effect on reproduction, reducing flower and fruit
production and increasing the proportion of non-viable seeds.
Why were diameter growth rates in tapped populations higher than those in untapped
populations? There are two potential explanations for this finding. First, higher growth rates in
tapped population may be found if diameter measurements are done close to the tapping spot, as
increased bark formation may take place around the incisions (cf. Silpi et al. 2006). We do not
expect that such measuring biases have influenced our data, as there were no signs of increased
bark thickness or wound tissue at the measurement spots for diameter measurements. Second,
tapped and untapped populations may differ in other respects than just the exploitation. In setting
up our study, we choose to compare the demography of tapped and untapped populations instead
of performing a large-scale tapping experiment in formerly untapped populations. We did so
because such an experiment had been carried out before (Rijkers et al. 2006) and because it
would not allow to evaluate the long-term effects of tapping that we were interested in. Farmers
select populations for resin tapping based on their intuitive judgement of the potential resin
production. This judgement is probably based on the average tree size and tree density but also
on the distance to access roads and drinking water availability during the dry season when
tapping is performed. Therefore, tapped populations constitute a non-random sample of
Boswellia populations in the region and could possibly be located on more productive soils
(Eshete, Sterck & Bongers , 2011) or with higher soil water capacity (Ogbazghi et al. 2006b).
The higher adult tree density and higher diameter growth rates that we observed in tapped
populations is consistent with the pattern that would be found if farmers would select tapping
sites based on nutrient and water availability. We feel that it is likely that the observed
differences are indeed due to the farmers’ non-random selection of tapping populations. In this
case, the more favourable conditions in tapped populations may have masked the negative effects
of tapping.
Mortality rates did not differ significantly between tapped and untapped populations. Rijkers et
al. (2006) suggested that resin tapping does not affect tree mortality, as long as it is performed at
a moderate intensity. Tapping in our exploited populations was conducted in the traditional way,
i.e. at these moderate intensities. More intensive tapping – involving more and deeper incisions
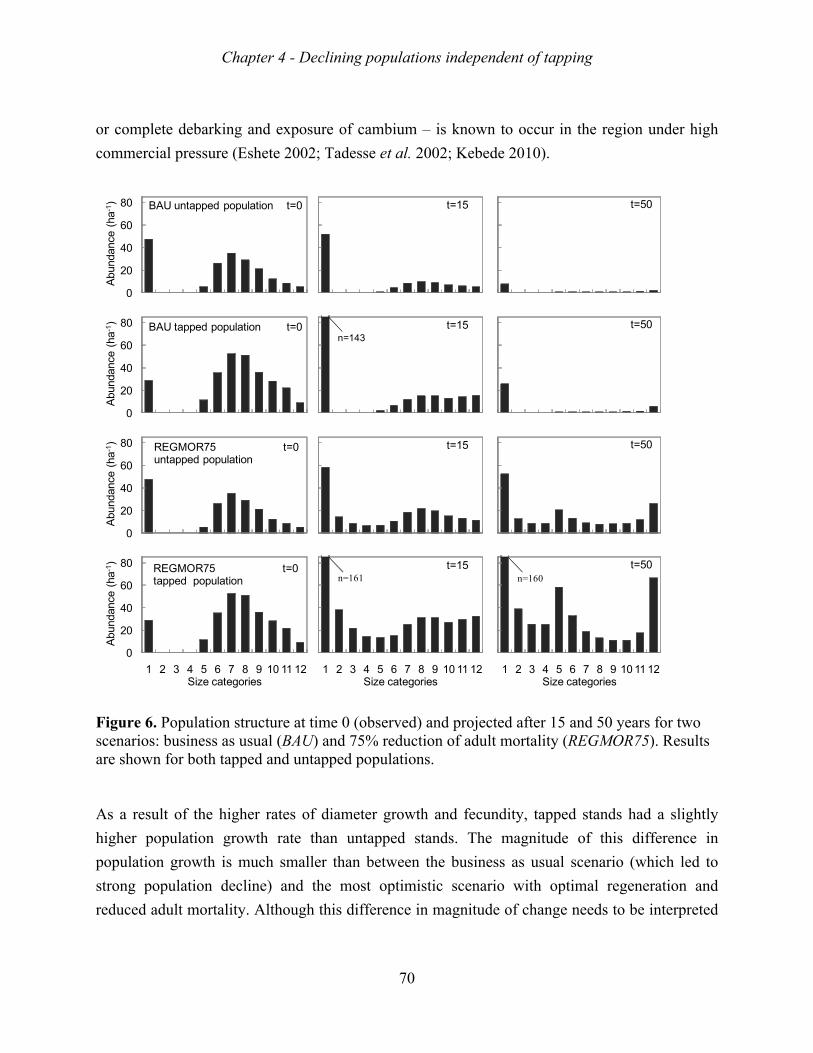
Chapter 4 - Declining populations independent of tapping
70
or complete debarking and exposure of cambium – is known to occur in the region under high
commercial pressure (Eshete 2002; Tadesse et al. 2002; Kebede 2010).
Figure 6. Population structure at time 0 (observed) and projected after 15 and 50 years for two scenarios: business as usual (BAU) and 75% reduction of adult mortality (REGMOR75). Results are shown for both tapped and untapped populations. As a result of the higher rates of diameter growth and fecundity, tapped stands had a slightly
higher population growth rate than untapped stands. The magnitude of this difference in
population growth is much smaller than between the business as usual scenario (which led to
strong population decline) and the most optimistic scenario with optimal regeneration and
reduced adult mortality. Although this difference in magnitude of change needs to be interpreted
0
20
40
60
80
Abu
ndan
ce (
ha-1
) BAU untapped population t=0
0
20
40
60
80
Abu
ndan
ce (
ha-1
) BAU tapped population t=0
0
20
40
60
80
Abu
ndan
ce (
ha-1
) REGMOR75 t=0untapped population
0
20
40
60
80
1 2 3 4 5 6 7 8 9 10 11 12
Abu
ndan
ce (
ha-1
)
Size categories
REGMOR75 t=0tapped population
t=15
t=15
t=15
1 2 3 4 5 6 7 8 9 10 11 12Size categories
t=15n=161
t=50
t=50
t=50
1 2 3 4 5 6 7 8 9 10 11 12Size categories
t=50n=160
n=143
Chapter 4 - Declining populations independent of tapping
71
cautiously, it suggests that factors other than tapping are importantly governing Boswellia
populations in the study region.
Causes and consequences of failing regeneration
There were very clear regeneration bottlenecks in tapped and untapped populations. Population
structures presented gaps in the sapling categories and none of the seedlings followed in our
study (n=2228) grew into permanent saplings. Such gaps in population structure have been
observed for tree species in both humid and dry tropical forests (Walker 1993; Poorter et al.
1996; Wassie et al. 2010b). In our study, only the isolated population (Adi Arkay) contained
saplings and small juvenile trees. Applying the observed growth and survival of saplings of that
population in our matrix models (REG scenario) yielded continuous population structures
(results not shown) but populations were still projected to decline.
What are plausible explanations for the blocked regeneration in our study populations? First,
apparent lack of regeneration may occur if regeneration occurs sporadically, e.g. during periods
of favourable (climatic) conditions (Barton, Swetnam & Baisan 2001; Holmgren et al. 2001).
Such erratic regeneration may be sufficient to replace the standing population and does not
necessarily result in a decline in population viability (Wiegand, Jeltsch & Ward 1999; 2004).
However, in our study region, there is no evidence of differences in temporal climatic variability
between the Metema and Adi Arkay plots. In fact, regeneration events are likely to occur
synchronously in both areas as well as in other sites across northern Ethiopia and Eritrea (cf.
Abiyu et al. 2010). The continuous distribution over size classes in Adi Arkay suggests
conditions have been favourable for regeneration. Thus, there is no evidence that gaps in
population structure are the result of erratic sapling establishment in the other areas.
A second possible cause of regeneration failure is high seedling mortality due to fires or grazing.
Natural fires occur occasionally in dry tropical forests and woodlands (Janzen 2002; Eriksson,
Teketay & Granström 2003), are a major determinant of their dynamics (Swaine 1992;
Chapter 4 - Declining populations independent of tapping
72
Nangendo et al. 2010) and an important source of sapling mortality (Suresh, Dattaraja &
Sukumar 2010). In Boswellia, non-permanent seedlings are likely not affected by fires as they do
not possess aboveground structures at the time of fires (dry season). By contrast, growth and
survival of permanent saplings may be severely impeded by fires as these maintain aboveground
structures during the dry season. Grazing and browsing are known to affect natural regeneration
in Boswellia: significantly higher seedling densities can be found in fenced compared to open
areas (Ogbazghi 2001; Gebrehiwot et al. 2003). As Boswellia flushes just before the start of the
rainy season, its leaves are an important sources of fodder for cattle, leading to severe damage of
seedlings and saplings and high trampling risk (Gebrehiwot et al. 2003).
Farmers customarily burn grasses in the forest understory at the end of the dry season to
stimulate nutrient-rich regrowth. It is likely that the incidence of fires and the intensity of grazing
in our study area has increased over the last couple of decades. The region has seen large-scale
immigration from the Ethiopian highlands (Eshete, Teketay & Hulten 2005) accompanied by an
increase in cattle population. A large share of the forests with Boswellia that were previously
relatively undisturbed, are now grazed and frequently burned. Studying the (changes in) fire
frequency and the effects of fire and grazing on tree populations is of the utmost importance to
assess the demographic changes taking place.
The role of high adult mortality
We observed high rates of adult mortality for Boswellia trees, in both tapped and untapped
populations. Annual mortality rates for trees >10 cm DBH equalled 6-7%. These rates are almost
ten times higher than those in an Indian dry forest (Suresh, Dattaraja & Sukumar 2010) and
likely also substantially higher than in other dry forests. A large proportion of the studied trees
were killed after having been attacked by the long-horn beetle (Idactus spinipennis) or by
windfall (Eshete, A., pers. obs.). High infection rates (up to 85%) of Boswellia trees by larvae of
this beetle have been reported for our study region (Metema) and elsewhere (Tigray, Kebede
2010). In this context, it is interesting to note that adult trees in the remote Adi Arkay population
showed fewer signs of beetle attack (Eshete, A. pers. obs.) and presented lower rates of annual
mortality (~3,6%; n=246). Clearly, there is a strong need to get clarity on the causes of the
elevated adult mortality in Boswellia stands.
Chapter 4 - Declining populations independent of tapping
73
Our simulation results suggest that high adult tree mortality severely limits population growth
and is one of the two main causes of the projected decline of Boswellia populations under the
business-as-usual scenario. The modelling scenario in which adult mortality was reduced by 75%
was the only one that projected growing populations. A high sensitivity of population growth to
changes in adult mortality – as found for Boswellia – is typical for long-lived tree species (i.e.
Zuidema et al. 2010) and forms an important focus point to achieve sustainability. The only
scenarios yielding (theoretically) sustainable populations were those with strongly increased
adult survival rates. Ensuring both the establishment of seedlings and enhancing adult survival
rates are thus crucial steps to achieve sustainable populations and frankincense production.
Implication for management
This is the first study on the effects of frankincense extraction on the population dynamics and
the first projections on the future prospects of frankincense populations. Our results show clear
evidence for a regeneration bottleneck in Boswellia populations, leading to a rapid reduction of
these populations and their potential for frankincense production. We also find indications for
unusually high mortality rates of Boswellia adult trees, which are also projected to cause
population shrinkage and reduced productivity. What can be done to reverse these processes? In
the short run, it is essential to reduce adult mortality rates as this would allow to maintain
existing populations and frankincense production. In the long run, maintaining populations and
productivity requires successful establishment of persistent saplings. Thus, Boswellia
management should focus on stimulating seedling and sapling establishment and reducing adult
mortality. Stronger management incentives are needed to ensure sustainable management of
these populations, and thereby safeguard future frankincense production.
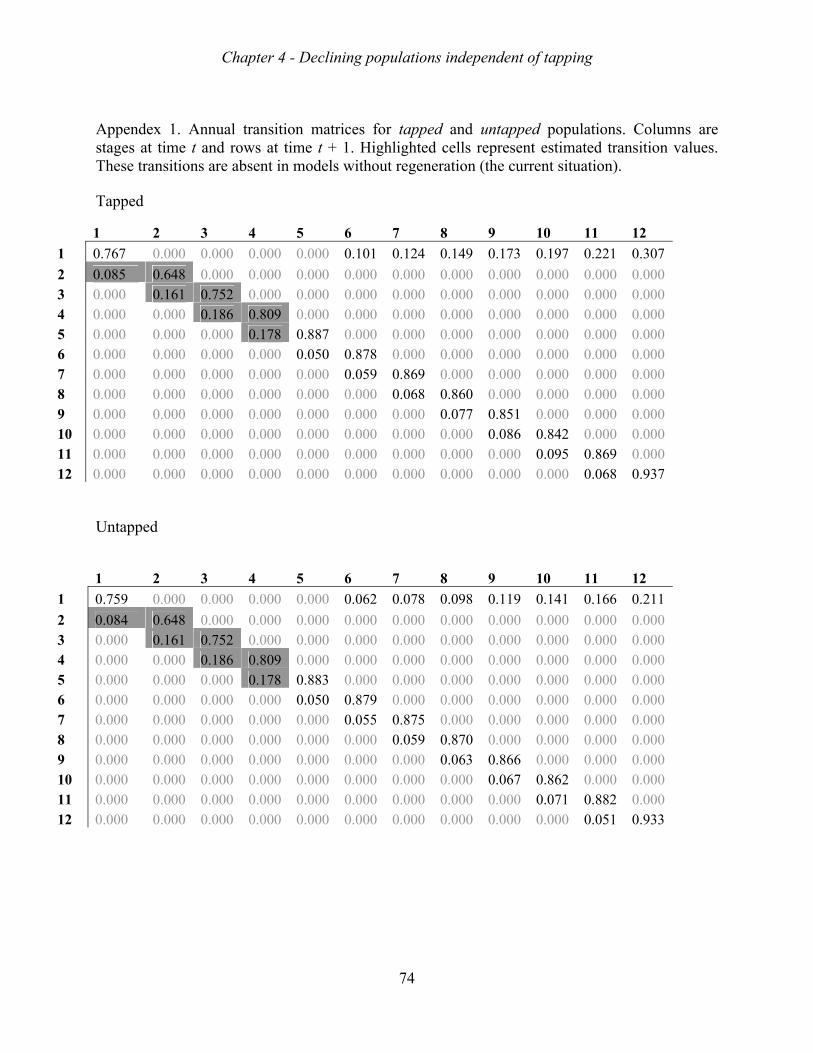
Chapter 4 - Declining populations independent of tapping
74
Appendex 1. Annual transition matrices for tapped and untapped populations. Columns are stages at time t and rows at time t + 1. Highlighted cells represent estimated transition values. These transitions are absent in models without regeneration (the current situation). Tapped
Untapped
1 2 3 4 5 6 7 8 9 10 11 12
1 0.767 0.000 0.000 0.000 0.000 0.101 0.124 0.149 0.173 0.197 0.221 0.307
2 0.085 0.648 0.000 0.000 0.000 0.000 0.000 0.000 0.000 0.000 0.000 0.000 3 0.000 0.161 0.752 0.000 0.000 0.000 0.000 0.000 0.000 0.000 0.000 0.000 4 0.000 0.000 0.186 0.809 0.000 0.000 0.000 0.000 0.000 0.000 0.000 0.000 5 0.000 0.000 0.000 0.178 0.887 0.000 0.000 0.000 0.000 0.000 0.000 0.000 6 0.000 0.000 0.000 0.000 0.050 0.878 0.000 0.000 0.000 0.000 0.000 0.000 7 0.000 0.000 0.000 0.000 0.000 0.059 0.869 0.000 0.000 0.000 0.000 0.000 8 0.000 0.000 0.000 0.000 0.000 0.000 0.068 0.860 0.000 0.000 0.000 0.000 9 0.000 0.000 0.000 0.000 0.000 0.000 0.000 0.077 0.851 0.000 0.000 0.000 10 0.000 0.000 0.000 0.000 0.000 0.000 0.000 0.000 0.086 0.842 0.000 0.000 11 0.000 0.000 0.000 0.000 0.000 0.000 0.000 0.000 0.000 0.095 0.869 0.000 12 0.000 0.000 0.000 0.000 0.000 0.000 0.000 0.000 0.000 0.000 0.068 0.937
1 2 3 4 5 6 7 8 9 10 11 12
1 0.759 0.000 0.000 0.000 0.000 0.062 0.078 0.098 0.119 0.141 0.166 0.211
2 0.084 0.648 0.000 0.000 0.000 0.000 0.000 0.000 0.000 0.000 0.000 0.000 3 0.000 0.161 0.752 0.000 0.000 0.000 0.000 0.000 0.000 0.000 0.000 0.000 4 0.000 0.000 0.186 0.809 0.000 0.000 0.000 0.000 0.000 0.000 0.000 0.000 5 0.000 0.000 0.000 0.178 0.883 0.000 0.000 0.000 0.000 0.000 0.000 0.000 6 0.000 0.000 0.000 0.000 0.050 0.879 0.000 0.000 0.000 0.000 0.000 0.000 7 0.000 0.000 0.000 0.000 0.000 0.055 0.875 0.000 0.000 0.000 0.000 0.000 8 0.000 0.000 0.000 0.000 0.000 0.000 0.059 0.870 0.000 0.000 0.000 0.000 9 0.000 0.000 0.000 0.000 0.000 0.000 0.000 0.063 0.866 0.000 0.000 0.000 10 0.000 0.000 0.000 0.000 0.000 0.000 0.000 0.000 0.067 0.862 0.000 0.000 11 0.000 0.000 0.000 0.000 0.000 0.000 0.000 0.000 0.000 0.071 0.882 0.000 12 0.000 0.000 0.000 0.000 0.000 0.000 0.000 0.000 0.000 0.000 0.051 0.933
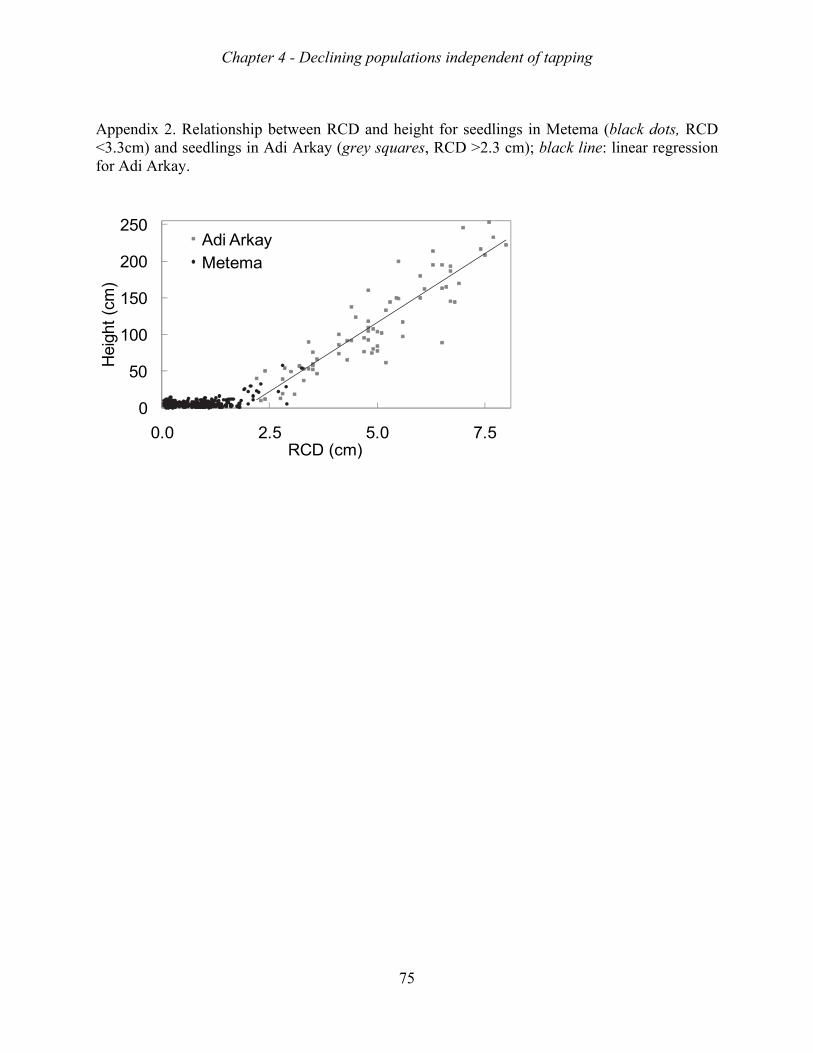
Chapter 4 - Declining populations independent of tapping
75
Appendix 2. Relationship between RCD and height for seedlings in Metema (black dots, RCD <3.3cm) and seedlings in Adi Arkay (grey squares, RCD >2.3 cm); black line: linear regression for Adi Arkay.
0
50
100
150
200
250
0.0 2.5 5.0 7.5
Hei
ght
(cm
)
RCD (cm)
Adi ArkayMetema

Chapter 4 - Declining populations independent of tapping
76
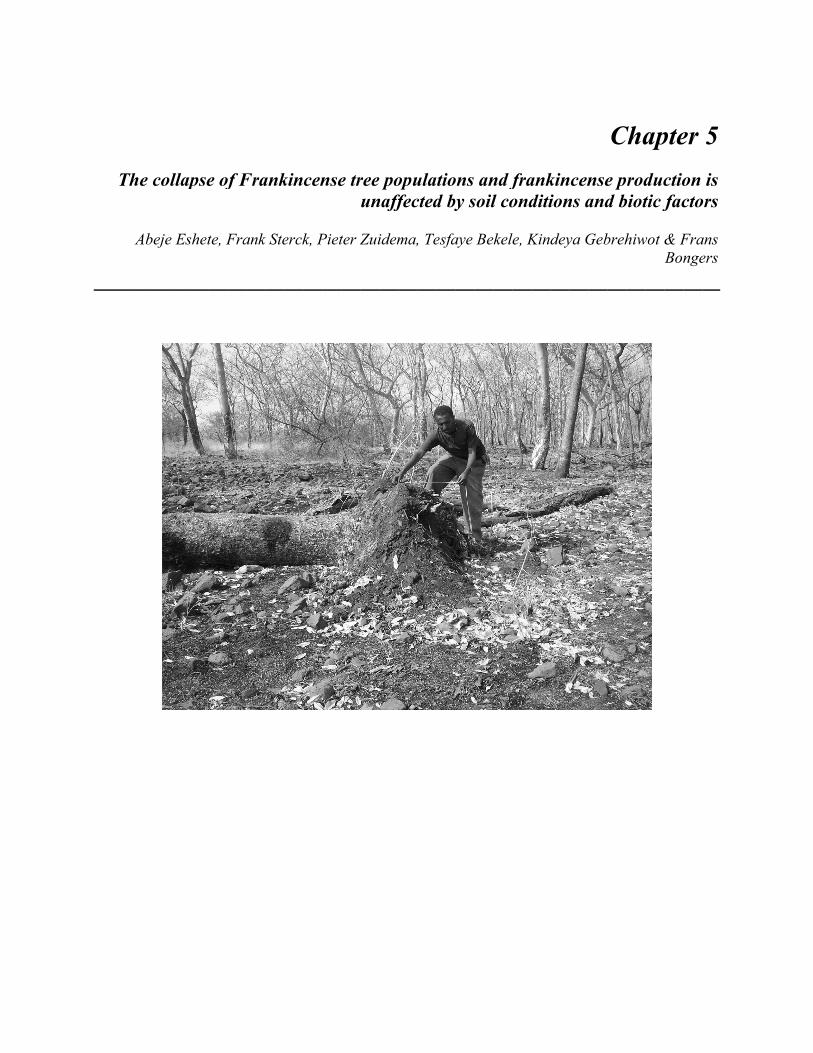
Thhe
Ab
col
beje
llap
e Es
pse
shet
e of
te, F
f F
Fra
Fra
ank
ank
k Ste
kinc
erck
cen
k, P
nse
Piet
e tru
ter Z
ree un
Zui
ponaff
idem
opuffec
ma,
ulacted
, Te
tiod by
esfa
ons y s
aye
ansoil
Bek
nd fl co
kele
fraond
e, K
ankditi
Kind
kinion
dey
cenns a
ya G
nseand
Geb
C
e pd b
breh
Cha
rodbiot
hiw
ap
ductic f
wot &B
pte
ctiofac
& FBon
er
on cto
Frange
5
is ors
ans ers

Chapter 5 - Declining populations independent of soil and biotic factors
78
Abstract
Regeneration of the frankincense producing tree, Boswellia papyrifera (Burseraceae) is scarce, in
many studied populations threatening the dry woodlands and the highly valued frankincense
production. Here we study the role of regeneration in the dynamics of 12 frankincense tree
populations across its habitats in northern Ethiopia using a stage-classified matrix model.
Growth, mortality and recruitment were recorded over two years in 12 permanent plots of 1.6 to
2 ha each. With population growth rates (λ) below 1 all 12 populations were declining. In spite
of the high seedling recruitment in some of the populations none of the seedlings survived and
grew to sapling stage. Overall mortality rate of juveniles and adults (7%) was high. Against our
expectation, the elasticity analyses and scenario analysis showed that high recruitment and fast
transitions of seedlings to saplings would not lead to a growing population. Instead, only higher
large tree survival would imply population increase. The poor recruitment, high adult tree
mortality and resultant low population growth rate were unaffected by soil fertility conditions
and biotic factors (abundance, basal area, stand volume). Overriding disturbances by fire, grazing
or herbivore attacks are probably responsible for the declines in tree abundance and the annual
frankincense production capacity over the coming years.
Key words: Soil conditions, biotic factors, vital rates, population growth, Boswellia papyrifera,
management actions
Chapter 5 - Declining populations independent of soil and biotic factors
79
INTRODUCTION
Non timber forest products (NTFPs) are materials of biological origin derived from forests,
including bark, roots, tubers, corms, leaves, flowers, seeds, fruits, gums, resins, honey, fungi,
animal products and only excluding timber (de Beer & McDermott 1989, Ros-Tonen et al.
1995). NTFPs are a major source of livelihood and cash income for rural and urban households
in developing countries (FAO 1989, Wollenberg & Ingles 1998, Lemenih et al. 2003). The
extraction of NTFPs has been advocated as a land-use practice that integrates forest conservation
and economic development of people living in forest areas (see, e.g., Nepstad and Schwartzman,
1992; Allegretti, 1990; Plotkin and Famolare, 1992). NTFP extraction is often thought to be
economically viable, ecologically sound, and socially acceptable (Barbier 1987, Arnold & Ruiz-
Perez 2001; Ticktin 2004). Unlike logging, the extraction of NTFPs usually shows no or limited
signs of changes in forest structure, and is assumed to maintain forest environmental services and
biological diversity, and provide opportunities of sound forest management (Peters 1996; Ros-
Tonen 2000, Ticktin 2004). More recently, however, it has been shown that exploitation of
NTFPs may not always be sustainable (see a review by Hall and Bawa 1993), particular because
the exploited trees decline in vigour, and recruitment and abundance may go down (e.g. Perez et
al. 2003, Rijkers et al. 2006 ).
Sustainable extraction of non-timber forest resources can be implemented if periodic inventories
show that strong negative impacts of NTFP extraction on tree numbers and NTFP production are
negligible (Peters 1996; Hall and Bawa 1993;). Based on such inventories, matrix models can be
parameterized (Caswell 2001, maybe a recent paper?) to assess the likely effects of various
management strategies on population growth rates (Rist et al. 2010, Pinard & Putz 1992, Waite
and Hutchings 1991, Aplet et al. 1994, Smith and Trout 1994, Maschinski et al. 1997,), or of
natural or anthropogenic disturbances like fire, grazing, or harvesting (Silva et al. 1991, Nault
and Gagnon 1993, O’Connor 1993, Pinard 1993, Bullock et al. 1994, Bastrenta et al. 1995,
Olmstead & Alvarez-Buylla 1995, West 1995, Batista et al. 1998). Matrix models have also been
used to document spatial and temporal variation in a species’ vital rates (e.g., Horvitz and
Schemske 1995, Oostermeijer et al. 1996, Kephart and Paladino 1997, Vavrek et al. 1997,
Zuidema 2000; Svenning & Macia 2002). Sensitivity or elasticity analyses of these models can
identify the life phases and vital rates that are most critical to the population growth (de Kroon et
al. 2000, Zuidema et al. 2010), and these life phases should then receive particular attention in
management programs (see also Verwer et al. 2008). Life table response experiments even more

Chapter 5 - Declining populations independent of soil and biotic factors
80
directly evaluate effects of environmental variation or management regime on the population
(Caswell 2001).
Here we present a study on the effect of habitat characteristics (soil conditions), and biotic
factors (abundance, basal area, standing volume) on population dynamics of the frankincense-
producing tree species Boswellia papyrifera in Ethiopian dry woodlands. B. papyrifera occurs
along a wide altitudinal range of 500-1600 m.a.s.l (Friis et al. 2010, Vollesen 1989, Eshete et al.
2011) in areas varying in geology, soil types, topography, climatic conditions (Gebrehiwot 2003,
ILRI 2005), and in species composition and vegetation structure (Eshete et al. 2011). We
recently showed that the population structure and biomass is mainly driven by variation in soil
conditions, and probably less by the encountered climatic variation (Eshete et al. 2011). These
populations are under pressure because the traditional frankincense tapping activities in the Horn
of Africa have been intensified (Kebede 2010) and lead to reduced tree vigor (Rijkers et al.
2006). Moreover, unregulated grazing and recurrent fires prevent seedling and sapling
establishment (Ogbazghi 2001; Gebrehiwot 2003; Abiyu et al. 2010), and land clearing for
agricultural expansion degraded B. papyrifera dominated woodlands (Lemenih et al. 2007,
Girma et al. inpreparation). These land and tree uses potentially threaten the existence of
remaining populations, as confirmed by the missing recruitment class (Ogbazghi et al 2006a,
Abiyu et al. 2010; Recently, we reported on the projected decline of populations in Northern
Ethiopia, in both tapped and untapped areas (Chapter 4). This chapter examines to what extent
habitat characteristics and biotic factors influence the dynamics of 12 tapped and untapped
populations.
We use matrix models to predict the present growth rates of the twelve populations, and show
how sensitive these population growth rates are to the vital rates in different life phases.
Moreover, we explore whether the expected collapse of B. papyrifera populations is similar for
populations differing in soil fertility or in frankincense tapping regime. More specifically we
addressed the following research questions: (1) How do vital rates (reproduction, stem growth,
survival) and population growth rates of B. papyrifera populations vary among populations
differing in soil conditions? (2) What are the bottlenecks for achieving persistent B. papyrifera
populations? We expect higher growth, survival and reproduction on more productive soils,
which have a higher clay contents and deeper soil (Eshete et al. 2011). Since poor regeneration is
the common feature of B. papyrifera populations (Abiyu et al. 2010), we expect that lack of
recruitment (establishment and survival of seedlings) acts as a major bottleneck for the
Chapter 5 - Declining populations independent of soil and biotic factors
81
persistence of the populations. We will discuss our result in the light of the sustainable
management of this species and the frankincense production, in areas where increasing numbers
of people and organizations get involved in the harvesting, processing and marketing of
frankincense (Lemenih et al. 2007, Eshete et al. 2005).
MATERIALS AND METHODS
Study species
Boswellia papyrifera (Del.) Hochst. (Burseraceae) is a deciduous tree that reaches a height of
approximately 14 m, has a round crown, contains prominent vertical resin ducts in the bark, and
has thick branches tipped with clusters of leaves (Azene Bekele et al. 1993, Eshete et al. 2011).
The species is distributed in hot and arid areas, often on steep or exposed situations and on rocky
slopes or in gullies. In Ethiopia, B. papyrifera is encountered in Combretum-Terminalia
woodlands at altitudes of 600 - 1800 m.a.s.l. (IBC 2007, Friis et al. 2010), average temperature
ranging from 20 to 25o C and annual rainfall of 500 - 1000 mm (Eshete et al. 2011, Ogbazghi et
al. 2006b). Beyond Ethiopia, this species is also encountered in Nigeria, Cameroon, the Central
African Republic, Chad, Eritrea, Sudan, Somalia, and NE Uganda (Vollesen 1989; Azene Bekele
et al. 1993). In Ethiopia, B. papyrifera provides both wood and non-wood forest products. Wood
is important for local people to make household furniture and doors. Leaves are used as fodder
for cattle, and honey is exploited (Eshete 2002). The highest economic value is provided by
frankincense, a resin obtained by wounding the bark during the dry season. The tapping of
frankincense is described elsewhere (Gebrehiwot 2003, Eshete et al. in preparation).
Frankincense from B. papyrifera has been marketed since ancient times (Groom 1981). Ethiopia
was and is still the major producer and exporter of this product. Gebrehiwot (2003) and Lemenih
and Teketay (2003b) described the traditional and modern use of the frankincense.
Study site
The study sites are located in the Metema region in north western Ethiopia (12°33.58' –
12°41.53'N, 36°04.12' – 36°18.84'E). The climate is characterized by > 8 months dry season
(Eshete et al. 2011). According to data from the nearest meteorological station, Shehidi, 25 km
away from the study sites, the mean annual rainfall is 965 mm and the mean monthly minimum
and maximum temperature are 19.6 and 35.7oC, respectively. The altitude of the studied plots
Chapter 5 - Declining populations independent of soil and biotic factors
82
ranged from 595 to 920 m.a.s.l. The sites belong to the lowland dry areas where deciduous tree
species dominate the vegetation. IBC (2007) and Friis et al. (2010) classify the vegetation in the
study site as Combretum-Terminalia woodlands, dominated by gum and resin producing tree
species .
Commercial harvesting of frankincense from B. papyrifera started long ago in Ethiopia, and
since 1996 in the study site (Eshete 2002). We selected 12 populations in 1.6-2.0 ha plots for this
study in August 2007. These plots varied in tree abundance (89–302 trees ha-1 ), basal area (2.5–
11.4 m2 ha-1) and standing volume (7.3–38 m3 ha-1) (Eshete et al. 2011). The plots also varied in
soil texture and composition: the clay content ranges from 11 to 58%, organic matter from <1–
5%, soil depth from 11. to – 58 cm, and available phosphorus from 1.84 to 50.21 ppm (Eshete et
al. 2011). Six of the 12 studied populations were continuously tapped from 1995-2005, but not in
2006. Such a year without tapping is considered a “resting period”. From 2007 onwards the
tapping was continued again. The other 6 populations were never exploited for frankincense
because they were relatively inaccessible, did not provide water sources to workers, or were
considered not sufficiently productive by local tappers (Eshete 2002). Also during our
experiment, these populations remained untapped. Half of the tapped plots and of the untapped
plots were fenced and protected from fire by creating vegetation free corridors.
Data collection
In each plot all individual plants of B. papyrifera (≥ one year old) were tagged and mapped at the
start of the experiment (August 2007). Of all trees less than 1.5 m tall, height and root collar
diameter (RCD) were measured, and of trees ≥ 1.5 m their height and stem diameter at breast
height (DBH). Newly recruited individuals (at least 1 year old) were tagged and mapped. These
new recruits were easy to distinguish from newly emerging seedlings(< 1 year seedlings),
because the newly emerging seedlings had two cotyledons. Two plots (Plots 11 and 12) were
established in October 2007 and thus new recruits were scored only for 2009. All trees and new
recruits were re-measured in August 2008 and August 2009. Mortality was scored every six
months starting at the time the plots were established. Trees were considered dead if they were
debarked along a dry trunk during the dry season, or had no leaves during the rainy season.
These dead trees were monitored also during later censuses to confirm their death. Tree damage
(presence of fire scar or sign of insect attack) and possible death causes (due to fire, human cut,
wind fall or insect attack) were recorded for dead trees.
Chapter 5 - Declining populations independent of soil and biotic factors
83
For each plot the annual fruit production was determined on 5 trees for each of five diameter
classes (diameter class 1 = 10 – 15 cm; 2 = 15 – 20cm; 3 = 20 - 25 cm; 4 = 25 – 30 cm; 5 = ≥ 30
cm). When fruits matured (December – January) the total number of fruit bearing apices per tree
were counted. Of these, five apices were selected (one in each cardinal direction and one at the
center of the crown) to count the number of fruit produced per apex (Rijkers 2006). From each
plot a pooled soil sample (0-20 cm) was taken from three sub-plots (20 x 20 m) and soil physical
and chemical variables were determined. Soil physical variables include, clay (%), sand (%), silt
(%) and soil depth (cm). Soil chemical variables include: organic carbon, nitrogen, available
phosphorus, basic cations (Na+, Ca++, Mg++, K+), cation exchange capacity, and soil pH. The
methods employed to estimate each soil variable are described elsewhere (Eshete et al. 2011,
Chapter 2). In that earlier study, we also showed that the stand volume correlated strongly with
soil depth and clay %.
Data analysis
We divided the population into 4 stages and 18 size classes (Chapter 4, Fig. 1). The four stages
were referred to as seedlings, saplings, juveniles and adults. The seedling stage that contained
only the first size class were characterized by > 1 year age and < 2cm RCD. Plants in this stage
class die back every dry season and do not produce a permanent shoot for at least 8 years.
Seedlings needed about 10 years after establishment to produce permanent shoot and reach 2 cm
RCD (field observation, Birhane, personal communication). The second stage includes the size
classes 2, 3 and 4, and refers to saplings with a RCD of > 2 cm and a DBH of < 6 cm (size class
2= 2- 4cm RCD; 3 = 4 – 6 cm RCD; 4= 6 – 9 cm RCD). Juveniles are non-reproductive
individuals and include only the 5th size class (DBH =6–10 cm). The adult stage includes all
individuals that may fruit (DBH ≥ 10 cm). This stage was subdivided into 13 size classes (size
class 6 = 10 – 12; 7 = 12 – 14; 8 = 14 – 16; 9=16 – 18; 10= 18 – 20; 11= 20 – 22; 12= 22- 24;
13=24 – 26; 14=26- 28; 15= 28 – 30; 16= 30 – 32; 17= 32 – 34; 18 = >34, inclusive of the lower
bound of the interval).
Stand and population structure
Total plot tree abundance, basal area and standing volume were determined for each population.
Abundance was determined as the number of individuals per hectare, basal area (G) was the sum
Chapter 5 - Declining populations independent of soil and biotic factors
84
of stem basal area scaled to a hectare (m2.ha-1), and stand stem volume (V) was estimated
assuming a cone stem shape and tree height H, using the equation,
/3 [1]
Vital rate calculations
For each population the annual vital rates of B. papyrifera were calculated based on the 2007-
2009 field data. We therefore regressed fruiting probabilities, seed production per fruit, growth
rates and survival rates per plot against size.
As mentioned before, the field measurements for fruiting probability and fruit production were
collected from 25 trees in the 5 largest size classes (individual in adult stage) per plot. Proportion
of fruiting trees per plot was calculated as the number of fruiting trees divided by the total
number of study sample trees (i.e. 25). To analyze and determine size specific fruiting
probability as well as fruit production per tree, the fruiting probability was regressed against
DBH using logistic regression model, and the number of fruits per tree as a linear regression.
Survival rates were calculated for all size classes. For individuals in stage and size class 1 we
calculated survival as,
1 [2]
Where m is mortality rate defined as:
m = ln (N0) – ln (Nt)) [3]
t
where ln(N0) is the natural logarithm of individuals at the initial time (2007) and ln(Nt) is the
natural logarithm of individuals at t time (2009) (Condit et al. 1995). A two-way ANOVA was
employed to test the importance of fencing and tapping on survival rate of seedlings. Logistic
regression was used to analyze and determine size specific survival probability of individuals in
all other stages and size classes. This analysis was performed for each plot.
Chapter 5 - Declining populations independent of soil and biotic factors
85
Size specific annual growth rates of individual plants was calculated from growth curves
obtained from the two years of field measurements. The growth curve was obtained using linear
regression models where DBH or RCD and the square of DBH or RCD at year 0 was included as
an independent variable. When no relation was observed between growth rates and tree size,
average growth rates of the population was calculated.
Matrix model construction
Two transition matrices that differ in parameterization of matrix elements were constructed for
each of the 12 populations: Cm and S1. Cm matrices were based on the observed vital rates. It
shows the population growth of each population under the current situation. S1 is a transition
matrix constructed based on important assumptions for some vital rates. First, we made an
important assumption that individuals in the first class would take 10 years to join the second
size class, thus growth rate of individuals in this size class would be 2 cm/10 years = 0.2cm per
year. Second, as indicated in Chapter 4., the individuals in the 2nd, 3rd, and 4th classes were
missing in all plots. But, we need to calculate the transition elements for the missing classes.
Thus, we looked for another site (Adiarkay) where individuals of all size classes were present. In
this site we monitored the survival and growth of individuals with root collar diameter of ≥ 2 cm
to < 6 cm in diameter at breast height for similar number of years. The survival and growth rate
as well as the growth and stasis elements of the these classes were estimated based on the two
year data. The S1 transition matrices were then used to analyze the dynamics of B. papyrifera
populations based on the Cm and with transition elements of the missing classes estimated from
the observed vital rates at Adiarkay site and assumed growth element of the first class (G1 = 0.2).
Each matrix used a stage-classified transition matrix model to analyze the dynamics of B.
papyrifera populations (cf. Caswell 2001). The transition matrix models took the form:
n(t+1) = A n(t) [4]
where n(t) is a vector of the stage abundances at time t, and A is the matrix containing transition
probabilities that describe the contribution of each stage to the population at the next time step.
The intrinsic population growth rate is calculated as the dominant eigenvalue, λ, of the matrix A.
The projection interval (from t to t + 1) was 1 year.
Chapter 5 - Declining populations independent of soil and biotic factors
86
The matrix A contains matrix elements (aij): Pi, Gij, and Fi. Pi describe the probabilities of
surviving and staying in same life stage (stasis), Gij describes the probabilities of surviving and
growing from stage i to stage j during the time interval from t to t + 1; and; Fi describe the
fecundity value of the i stage class. The value of the growth element Gij was calculated as Gij =
gi*i*Ci-1, where gi represents mean annual growth rate recorded in size class i; i the survival
rate of individuals in i class and Ci-1 represents the class width of i class. Pi was calculated as Pi
= i - Gi. Fecundity (Fi) was determined as Fi = i * Pr{f}i * fi, where Pr{f}i is the probability
that an individual in size class i is reproductive and fi the number of offspring produced by a
reproductive individual in size class i. The value of fi was determined as the size-class specific
fruit production, multiplied by the number of seedlings produced that emerged per fruit produced
during the previous year.
To test if the population growth rate, λ, (from S1 transition matrix) of each population is different
from 1, confidence intervals for λ were calculated using the first-order approximation proposed
by Caswell (1989), that depends on the sensitivity and variation of transitions matrix elements.
Elasticity analysis was used to get important information on the extent to which population
growth rate depends on survival, growth and reproduction at different stages in the life cycle (de
Kroon et al. 1986, Caswell 2001). The formula for elasticity, e, is given by:
eij = (aij/λ) (δλ/ δaij) [5]
where δλ/ δaij is the sensitivity of the population growth rate to a small change in each transition
probability. The elasticity analysis was carried for the two kind of matrices: Cm and S1.
Effect of soil conditions and biotic factors on vital rates and population growth of B.
papyrifera
To test the importance of soil conditions for vital rates we regressed different vital rates against
each soil physical and chemical variables and tested for a significant slope. These tests were
performed at two level. The first test was at plot level where the average vital rates per plot were
used for the test. For the second test we used the vital rates of specific size class to avoid the
error that would arise due to difference in size class distribution between plots (chapter 4).
Similarly, vital rates were regressed against biotic factors (abundance, basal area and standing
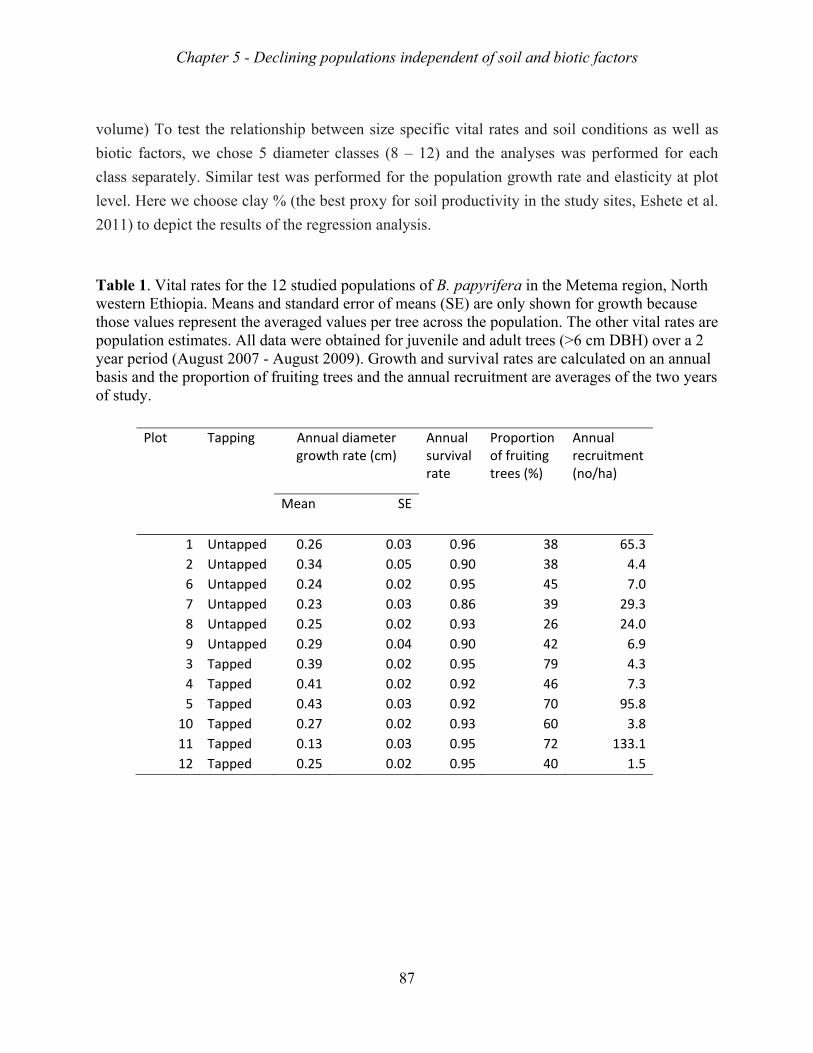
Chapter 5 - Declining populations independent of soil and biotic factors
87
volume) To test the relationship between size specific vital rates and soil conditions as well as
biotic factors, we chose 5 diameter classes (8 – 12) and the analyses was performed for each
class separately. Similar test was performed for the population growth rate and elasticity at plot
level. Here we choose clay % (the best proxy for soil productivity in the study sites, Eshete et al.
2011) to depict the results of the regression analysis.
Table 1. Vital rates for the 12 studied populations of B. papyrifera in the Metema region, North western Ethiopia. Means and standard error of means (SE) are only shown for growth because those values represent the averaged values per tree across the population. The other vital rates are population estimates. All data were obtained for juvenile and adult trees (>6 cm DBH) over a 2 year period (August 2007 - August 2009). Growth and survival rates are calculated on an annual basis and the proportion of fruiting trees and the annual recruitment are averages of the two years of study.
Plot Tapping Annual diameter growth rate (cm)
Annual survival rate
Proportion of fruiting trees (%)
Annual recruitment (no/ha)
Mean SE
1 Untapped 0.26 0.03 0.96 38 65.3
2 Untapped 0.34 0.05 0.90 38 4.4
6 Untapped 0.24 0.02 0.95 45 7.0
7 Untapped 0.23 0.03 0.86 39 29.3
8 Untapped 0.25 0.02 0.93 26 24.0
9 Untapped 0.29 0.04 0.90 42 6.9
3 Tapped 0.39 0.02 0.95 79 4.3
4 Tapped 0.41 0.02 0.92 46 7.3
5 Tapped 0.43 0.03 0.92 70 95.8
10 Tapped 0.27 0.02 0.93 60 3.8
11 Tapped 0.13 0.03 0.95 72 133.1
12 Tapped 0.25 0.02 0.95 40 1.5
Chapter 5 - Declining populations independent of soil and biotic factors
88
RESULTS
Fruiting and recruitment pattern
The percentage of fruiting trees ranged from 26 to 79% among the 12 populations For 6 of the 12
plots, fruiting probability increased with stem diameter and for all plots the number of fruits per
tree increased with stem diameter. Tapped trees had a higher probability of fruit production than
untapped trees (Fig 1). Approximately, 1/3 of all trees produced fruit in both years, ~1/3 in one
of the two years and ~1/3 produced no fruit in both years. Trees of plot 5 produced much higher
amounts of fruits than trees of other plots.
Seedlings recruited every year in all plots. The number of recruits per ha, however, varied from
1.5 (plot 11) to 133 ha-1 (plot 12) (Table 1). The recruiting plants originate from seeds in most
plots. They, however, originated from root suckers in plots 2 and 6, even though trees were
flowering and fruiting proliferically in these plots.
Survival
Survival rate of seedlings in fenced plots ranged between 0.81 and 0.98, and in open plots
between 0.54 and 0.93. The overall average seedling survival rate was 0.85 (± 0.38 SE) across
plots and was not significantly affected by fencing or tapping (t= 0.961, p > 0.05). Survival rate
of saplings at Adiarkay site was 0.87. Initial root collar diameter showed a significant effect on
the survival probability of saplings at Adiarkay site (p < 0.05, R2 = 0.24). At population level
survival rate of juveniles and adult individuals ranged from 0.86 to 0.96. And the overall mean
annual survival rate of juvenile and adult individuals was 0.93 (± 0.01 SE) (Table 1, Fig. 1).
Survival probability of juveniles and adult individuals showed positive (plot 7 and 9), negative
(plot 5 and 8) or no relation (2, 4, 10 and 11) with initial diameter (Table 2, Fig. 1). Plot 1, 3, 6
and 12 showed an increase in survival probability for the first small diameter size then a decrease
in survival probability with diameter size since the square of DBH was negative in the regression
model. Insect attack, windfalls and human cut were the major sources of mortality accounting for
77%, 21% and 2%, respectively, of all deaths among juveniles and adults trees of > 6 cm DBH.

Chapter 5 - Declining populations independent of soil and biotic factors
89
Growth
Seedlings died back during the dry periods of the two study years. The growth of root collar
diameter as well as the height of re-shooting seedlings were not related to the initial root collar
diameter or height (n= , P > 0.05). The linear regression test showed that growth of saplings at
Adiarkay site was independent of initial root collar diameter (p > 0.05). Average growth rate of
saplings was 0.5 cm/year. Average growth rate of juveniles and adults together ranged from 0.13
(plot 11) to 0.43 cm/year (plot 5). In 9 out of the 12 plots growth was affected by DBH, in most
cases growth rates increased linearly with DBH (Fig. 1., Table 2).
Table 2. Stem growth, survival and fruiting probability of B. papyrifera trees as a function of tree size for 12 populations at Metema, northern Ethiopia. Only trees > 6 cm diameter at breast height (DBH) were considered. Multiple linear regression results are shown.
Note: ns = not significant
Matrix model output
The population growth rate λ of the 12 B. papyrifera populations ranged between 0.86 to 0.98
per year (average λ = 0.92 ± 0.03 SD) in the period 2007 – 2009, indicating declining
populations in all studied plots. The elasticity analysis showed that the most important matrix
Growth Survival Fruiting probability (2007)
Fruiting probability (2008)
Constant
DBH DBH2 Constant DBH DBH2 Constant DBH DBH2 Constant DBH DBH2
-0.212 0.053 -0.001 -0.25 0.26 -0.006 -2.143 ns 0.004 -0.944 ns ns 0.31 0.02 Ns 1.493 ns ns -0.095 ns Ns -0.916 ns ns 0.33 0.03 Ns -1.196 0.334 -0.007 0.887 ns Ns 1.946 ns ns -0.14 0.06 -0.001 1.7 ns ns -0.167 ns Ns -0.167 ns ns 0.28 0.02 Ns 2.24 ns -0.001 -1.966 ns 0.007 -1.232 ns 0.004 0.33 0.01 Ns -2.417 0.555 -.015 -0.105 ns Ns -0.318 ns ns 0.23 ns Ns -1.107 0.123 ns 1.224 ns Ns - - - 0.304 0.011 Ns 2.5 ns -0.002 -3.634 0.168 Ns - - - 0.29 ns Ns 0.191 0.048 ns -0.241 ns Ns -2.99 0.11 ns 0.152 0.025 Ns 1.892 ns ns 0 ns Ns 0.847 ns ns 0.13 ns Ns 2.226 ns ns -1.998 0.15 Ns -2.287 0.141 ns 0.201 0.014 Ns -0.712 0.269 -0.006 -0.405 ns Ns -5.473 0.211 ns
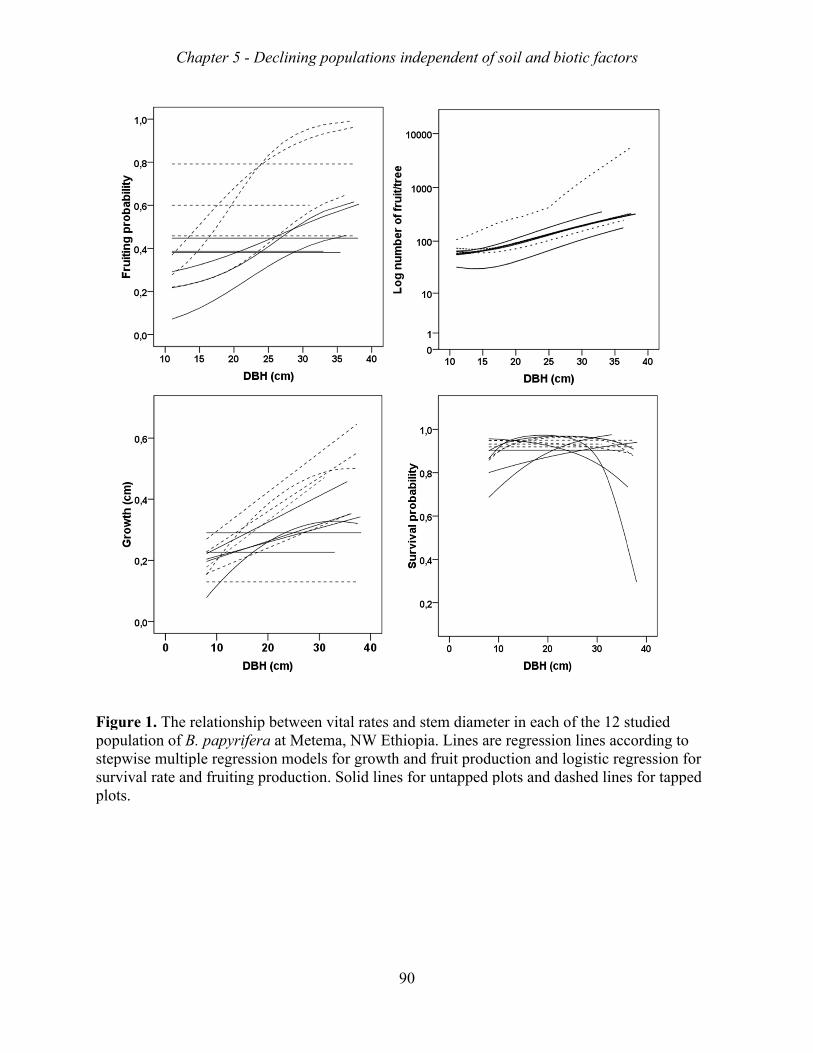
Figpopstepsurplo
gurpulapwrvivots.
re 1atioise
val r
. Thon omurate
Ch
he rof Bultipe an
hap
relaB. pple nd f
pter
atiopapy
regfrui
r 5 -
onshyrifgresiting
- De
hip ferassiog p
ecli
beta aton mrod
inin
twet Mmodduct
ng p
een etemdelstion
pop
vitmas fon. S
pula
tal ra, Nor gSoli
atio
rateNW growd li
ons
es aEth
wthines
ind
90
and hioph ans fo
depe
stepia.
nd fror u
end
em d. Li
fruitunta
dent
diaminest prappe
t of
mets arrodued p
f so
ter re reuctiplot
il a
in eegrion ts a
and
eacessand
and
bio
h oiond loda
otic
of thn linogisshe
c fac
he 1nes sticed li
ctor
12 sacc
c regine
rs
studcordgres fo
dieddinssioor ta
d g toon fapp
o for ped
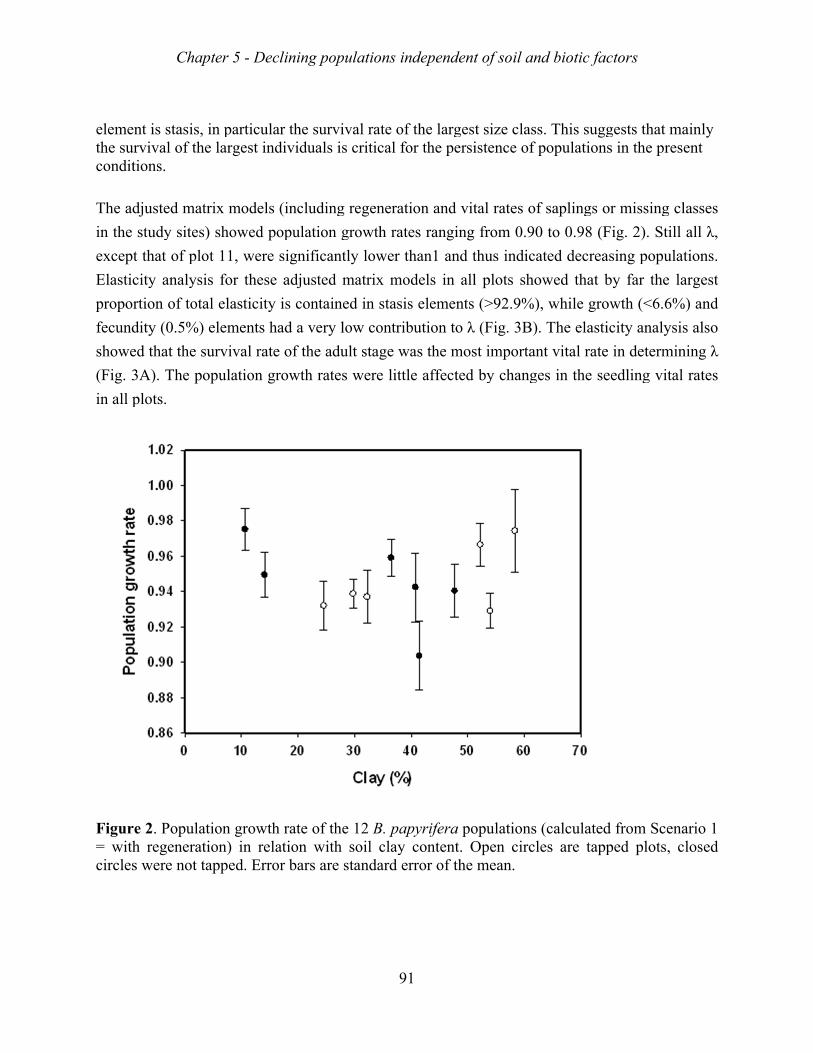
elethecon
Th
in t
exc
Ela
pro
fec
sho
(Fi
in a
Fig= wcirc
mee sundit
e ad
the
cep
astic
opo
cund
owe
ig. 3
all p
gurwithcles
ent iurvivtion
dju
stu
t th
city
rtio
dity
ed t
3A)
plo
re 2h rs w
is sval ns.
usted
udy
hat
y an
on o
y (0
that
). T
ots.
2. Porege
were
Ch
tasiof
d m
y sit
of p
naly
of t
0.5%
t the
The
opuenere no
hap
is, ithe
matr
tes)
plo
ysis
ota
%) e
e su
po
ulatrati
ot ta
pter
in pe lar
rix
) sh
t 1
s fo
al el
elem
urv
opul
tionion)app
r 5 -
partrge
mo
how
1, w
or t
last
men
iva
lati
n gr) ined.
- De
ticust i
odel
wed
wer
thes
ticit
nts
al ra
on
rown re Er
ecli
ularindi
ls (i
pop
re s
se a
ty i
had
ate o
gro
wth relatrror
inin
r theivid
inc
pul
ign
adju
s co
d a
of t
owt
ratetionr ba
ng p
e sudual
lud
latio
nific
uste
ont
ver
the
th r
e ofn wars a
pop
urvils i
ding
on g
can
ed
ain
ry l
adu
rate
f thwithare
pula
ivals cr
g re
gro
tly
ma
ned
low
ult
s w
e 1 sosta
atio
l raritic
egen
owth
low
atrix
in s
w co
stag
were
2 Boil cnda
ons
ate ocal
nera
h ra
wer
x m
stas
ontr
ge w
e lit
B. pclayard
ind
91
of thfor
atio
ates
r tha
mod
sis
ribu
was
ttle
apyy cerr
depe
he r the
on a
s ra
an1
dels
elem
utio
s th
aff
yrifcontror o
end
large pe
and
angi
1 an
in
me
on to
he m
fect
feratentof t
dent
gesersi
d vit
ing
nd t
all
nts
o λ
mos
ted
a pot. Othe
t of
t siiste
tal r
fro
thus
l pl
(>
λ (Fi
st im
by
opuOpeme
f so
ze cence
rate
om
s in
lots
92.
ig.
mpo
y ch
ulatien cean.
il a
clase of
es o
0.9
ndic
s sh
9%
3B
orta
hang
ionscirc.
and
ss. f po
of s
90 t
cate
how
%), w
). T
ant
ges
s (ccles
bio
Thiopu
sapl
to 0
ed d
wed
whi
The
vita
in
calcs ar
otic
is sulati
ling
0.98
dec
tha
ile g
e ela
al r
the
culare t
c fac
suggions
gs o
8 (F
rea
at b
gro
asti
rate
e se
atedtapp
ctor
gess in
or m
Fig.
asin
by
owth
icity
e in
eedl
d froped
rs
ts tn th
miss
. 2)
ng p
far
h (<
y an
det
ling
omd pl
thate pr
sing
. St
popu
the
<6.
naly
term
g vi
m Sclots
t marese
g cl
till
ulat
e la
6%
ysis
min
ital
cenas, c
ainlent
lass
all
tion
arge
%) an
s al
ning
rat
arioclos
ly
ses
λ,
ns.
est
nd
lso
g λ
tes
o 1 ed
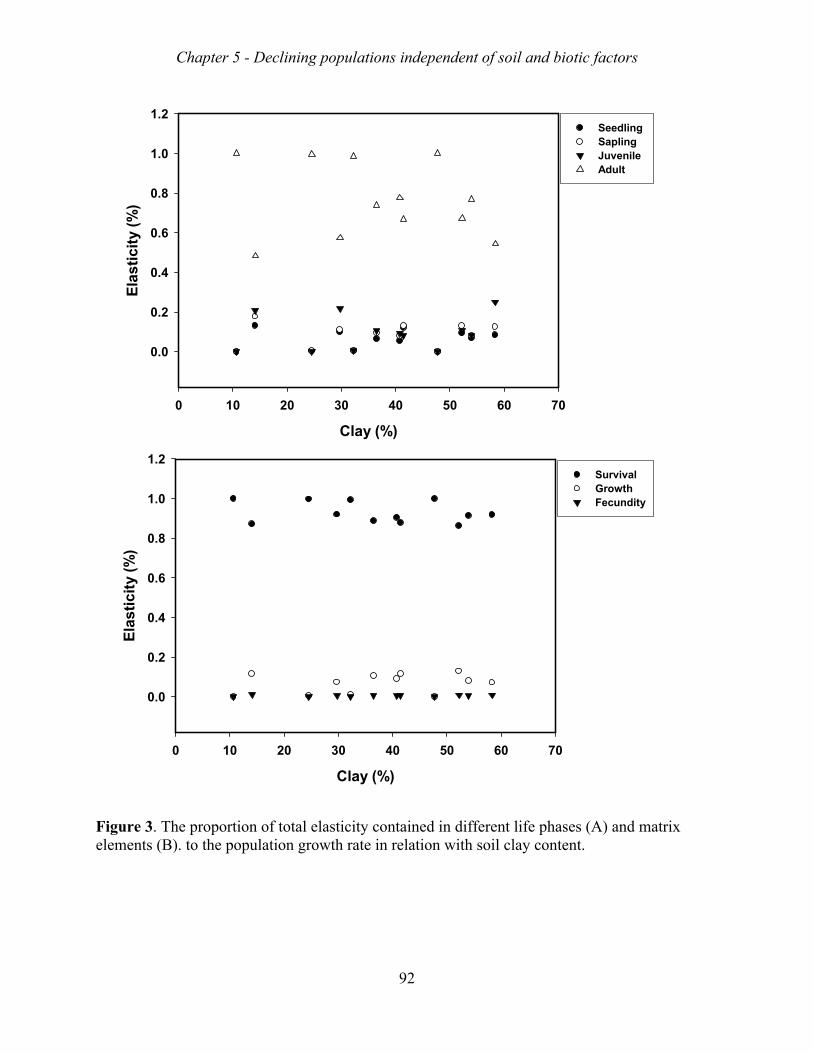
Chapter 5 - Declining populations independent of soil and biotic factors
92
Figure 3. The proportion of total elasticity contained in different life phases (A) and matrix elements (B). to the population growth rate in relation with soil clay content.
Clay (%)
0 10 20 30 40 50 60 70
Ela
stic
ity
(%)
0.0
0.2
0.4
0.6
0.8
1.0
1.2Seedling Sapling Juvenile Adult
Clay (%)
0 10 20 30 40 50 60 70
Ela
stic
ity
(%)
0.0
0.2
0.4
0.6
0.8
1.0
1.2SurvivalGrowthFecundity

Chapter 5 - Declining populations independent of soil and biotic factors
93
Effect of soil conditions and biotic factors on population characteristics
We predicted higher growth rates, survival rates, and fruiting probability in populations growing
on soil conditions with higher clay content, deeper soil depth and better soil fertility. We had also
expected higher population growth rates for populations growing in better soil conditions.
Contrary to our expectations, however, none of the vital rates (growth rate, survival and fruiting
probability) were significantly related to soil conditions (clay content, soil depth and soil
chemicals (Fig. 4) nor to biotic factors (abundance, basal area, and stand volume, data not
shown). Similarly, population growth rates from the first model and elasticity values obtained
from the second model were not also related to both soil conditions and biotic factors (data not
shown).
DISCUSSION
This study evaluates if soil conditions and biotic factors affect demography (vital rates ) of B.
papyrifera. Based on earlier work (Eshete et al. 2011)where we showed that stand volume of B.
papyrifera populations and of the whole woody plant community increased with soil fertility,
we hypothesized that vital rates of B. papyrifera populations respond to soil fertility factors. We
expected higher growth rates, survival and reproduction effort in response to higher soil fertility.
Contrary to our expectations none of the vital rates were related to soil conditions, nor to the
biotic factors evaluated. and biotic factors (abundance, basal area and standing volume).
Irrespective of soil conditions and biotic factors, all populations were characterized by lack of
sapling regeneration and high adult tree mortality rates, and resulting in non-sustainable
populations. We re-hypothesize that these factors are overruled by relatively recent and strong
impacts of disturbance. In chapter 4, we showed that frankincense tapping regime is an unlikely
candidate for explaining the decline in the growth rates of these populations, and fire and grazing
are more likely candidates.
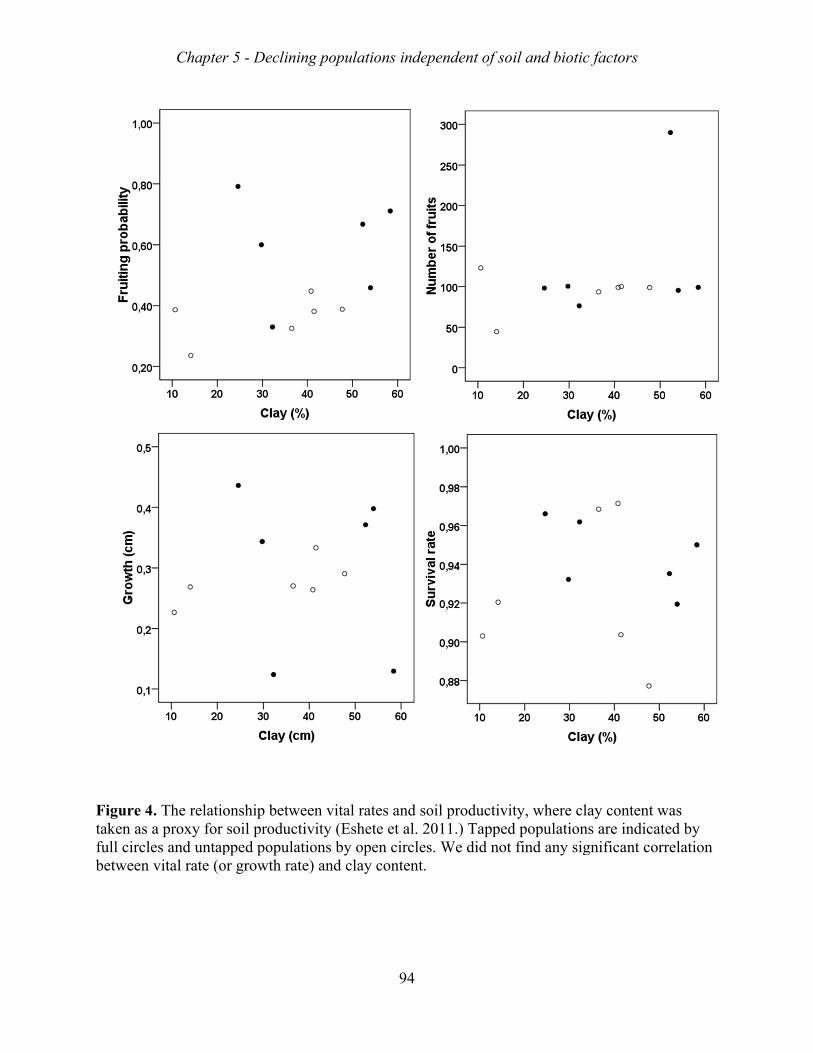
Figtakfullbet
gurken l citwe
re 4as
ircleeen
4. Tha pres avita
Ch
he rroxandal r
hap
relaxy fd unrate
pter
atiofor sntap (or
r 5 -
onshsoil
ppedr gr
- De
hip l prd porow
ecli
betroduopu
wth
inin
tweuctiulatrate
ng p
een ivittione) a
pop
vitty (Ens band
pula
tal rEsh
by ocla
atio
rateheteopenay c
ons
es ae etn cicon
ind
94
and t al.irclten
depe
soi 20les.
nt.
end
il pr011.
W
dent
rod.) Te d
t of
ductTappid n
f so
tivitpednot
il a
ty, d pofin
and
whopund a
bio
hereulatiany
otic
e claionssig
c fac
ay cs ar
gnif
ctor
conre infica
rs
ntenndi
ant c
nt wicatcorr
was ted rela
by atioon
Chapter 5 - Declining populations independent of soil and biotic factors
95
Vital rates of B. papyrifera across its habitat
Phenology
Soil conditions (water and nutrients availability) in tropical dry forests are essential resources
that largely control phenological patterns (Bullock and Solis-Magallanes, 1990;) and seed
production (Ray and Brown 1994). The study populations varied strongly in proportion of
fruiting trees (26 – 79%), but this proportion was not related with soil conditions, in contrast to
other findings. Valdez-Hernández et al. (2009) found differences in phenology within species
between sites, with higher leaf, flower and fruit production at a site with better soil water
conditions. Seghieri et al. (2009) showed fruiting probabilities to decrease with soil moisture in a
dry Sahelian site and to increase in a wetter Sudanian site. That we did not find such
relationships for B. papyrifera trees suggests that fruiting probability might be governed by other
factors not considered here, like availability of pollinators and seed dispersers(Seghieri et al.
2009).
Mortality rate
Germination and regeneration of B. papyrifera seedlings at Metema occur from June to August
during which seedlings have favorable soil water conditions. In the dry season (September to
May) the established seedlings die back, probably to avoid desiccation (Fenshaw & Holman
1999; Rice et al. 2004).The mortality rate of established seedlings in the present study
populations is low compared to the report made by Gebrehiwot (2003) and Ogbazghi (2001) who
reported 86% and 67% of mortality rate of seedlings in Tigray, Ethiopia and Eritrea,
respectively. Low mortality rates have sometimes been considered as an adaptive response to
considerable climatic stress and disturbance (fire and herbivory) in order to enhance long-term
persistence (Sukumar et al., 2005).
Fire and grazing are the commonly reported source of seedlings mortality in dry forests (Zida et
al. 2007, 2009, Hoffmann & Solbrig 2003, Menaut et al. 1995), but we did not find differences in
mortality rates across management regimes. Fencing had no effect on mortality in our
populations, in contrast with findings of Ogbazghi (2001) and Gebrehiwot (2003). Fire also will
not be the driver as it occurs during the dry season during which seedlings shed the aboveground
and recurrent fire thus will not burn the seedlings. This die-back of seedlings is one of the
Chapter 5 - Declining populations independent of soil and biotic factors
96
strategies that dry forest tree species develop to avoid deleterious effect of drought and fire on
their regeneration (Fenshaw & Holman 1999; Rice et al. 2004). Once seedlings grow to sapling
stage and produce a permanent shoot fire and grazing could have negative effects. This confirms
the lack of saplings in all studied populations and elsewhere (see Abiyu et al. 2010) At the
Adiarkay site, sapling are present possibly because grazing and fire pressures are much lower (A.
Eshete personal observation).
Mortality rates of juveniles and adult individuals in our populations (mean 7%, range 4-14%) are
high compared to other dry forests. Annual mortality rates vary from 2.3% in a dry forest in
Ghana (Swaine et al., 1990); via 2.9% in a mixed deciduous forest in Thailand (Marod et al.,
1999) to 6.9% in dry forests in southern India (Suresh et al. 2010). Fire, grazing, drought,
windfall, pest attack and senescence of old stems are considered to be the major causes of tree
mortality in tropical dry forests (Sukumar et al., 2005). Some of these factors are related to soil
moisture or soil water holding capacity (Condit et al., 1995). The mortality rates in our
populations were high across both juveniles and adult stages and survival probability was
independent of tree size in most populations. Insect attack followed by windfall were the main
sources of juvenile and adult mortality. This result is similar to reports of Negussie (2008). He
found that 65% and 85% of tapped B. papyrifera trees in Tigray were attacked by the long horn
beetle named as Idactus spinipennis Gahan. In the present study, particularly insect attack was
unexpectedly very common both in tapped and untapped populations and as a result mortality
rates did not differ (chapter 4). The overall high mortality rates supported earlier speculations on
alarming decline of B. papyrifera populations due to human disturbance (e.g, grazing, human
cut, tapping, fire, insect attack) (Abiyu et al. 2010, Rijkers et al. 2006, Gebrehiwot 2003, Eshete
2002, 2005, and Tadesse et al. 2002)
Stem growth rates of a dry forest species vary among habitats depending on environmental
factors (soil conditions). Water availability and soil conditions that exhibit spatial and temporal
variability are the main drivers of tree growth (Ceccon et al. 2006, Mooney et al. 1995, Nath et
al. 2006). Dry forest species in soil types that store water well (e.g. high clay% and deeper soil
depth) may acquire great stature and biomass (Murphy and Lugo 1990; 1995). Soil fertility can
also affect tree growth rate (Lu, et al. 2002; Malhi et al.2004) with better growth on more
nutrient-rich soils (Russo et al. 2005, Toledo et al. 2011).
Chapter 5 - Declining populations independent of soil and biotic factors
97
The average growth rate of B. papyrifera juveniles and adult individuals (range: 0.13 – 0.43 cm
per year, Table 1) was within the reported range of growth rates of tree species in dry forest of
Bolivia (Villegas et al. 2009). In Chapter 1 we showed that maximum diameter, maximum
height, basal area and standing volume were related to soil conditions associated with water
holding capacity (clay content as well as soil depth) (Eshete et al. 2011). Notwithstanding, tree
growth rates were not related to soil conditions in the B. papyrifera populations examined,
suggesting that stand or soil conditions do not govern tree growth rates, as was shown earlier for
Amazonian forest (Viera et al 2004). This findings, however, contradicts the reports of Radda
and Luukkanen (2006) who found a higher annual growth rate for Acacia senegal in soils with
higher soil clay content. The absence of such relationship might indicate the presence of other
overruling factors responsible for the observed variation in growth rates of B. papyrifera trees
across its habitats.
Population dynamics of B. papyrifera
The population growth rate of B. papyrifera populations under the current situation varied
spatially (range 0.86 to 0.98) but not directly related to soil conditions and biotic factors.
population growth rate lower than 1 indicates population decline if vital rates remain
unchanged. Similar population growth rates have been documented for other slow-growing, long
lived tree species (Kwit et al. 2004, Silvertown et al. 1993). The low λ-values were the result of
high mortality rate of juveniles and adults in all studied populations: the elasticity analysis
showed that survival of adult individuals made the largest contribution to λ in all studied
populations (Fig. 4). In contrast to our predictions B. papyrifera populations decline even under
simulated successful establishment of seedlings. During the 2 years of study the decline of B.
papyrifera populations in Ethiopia thus is not due to lack of recruitment (establishment and
survival of seedlings), although the absence of sapling individuals suggest that the growth of
established seedlings to sapling stage (< 6 cm DBH) was severely constrained in the recent past.
This may be related to the start of inhabitation of the study area in the 1960s as a result of large
scale re-settlement (Eshete 2002) Since then people living in and around these forest use fire for
various purposes, like clearing for farming, regrowth of new grasses, to walk freely within the
forest, and to keep away dangerous wildlife (Eshete 2002). The forests also became the main
grazing area for the large herds of cattle of both local inhabitants and nearby highlanders (Eshete
et al. 2005, Lemenih et al. 2007). In addition, tapping for frankincense has increased with
negative reproductive effects (Rijkers et al. 2006, but see Chapter 4)
Chapter 5 - Declining populations independent of soil and biotic factors
98
Given the results emphasized above, the question arises as to whether B. papyrifera populations
may persist for long periods of time across its habitats. Our analysis does not allow a straight
forward answer to this question given the limitations of our data set (only one area and two years
were considered). However, our result showed that all populations experience a demographic
decline through time associated with high mortalities of juveniles and adult individuals. Thus,
the long term success of the species depend upon the reduction of the high mortality of large
individuals and perturbations to seedling establishment, survival and growth would be less
effective than those that target juveniles and adult survival (stasis). These results have important
implications in terms of forest management: the heavy disturbance observed in the study sites
(recurrent fire, heavy and unregulated grazing, improper tapping, Abiyu et al. 2010) that reduced
the survival rate of large individuals could further lead to a decline in the abundance of the
species. This information is needed for proper predictions regarding population dynamics under
different scenarios of human impact, and the results of that for resin production and ecosystem
status. As the first long-term study of tree population dynamics at Metema, our results have
important implications also for the conservation prospects of this tree species. Furthermore, the
nature of disturbance at Metema (e.g. cattle grazing, recurrent fire, improper tapping for
frankincense production) is typical of many B. papyrifera populations and our results may
therefore help inform management decisions in other disturbed B. papyrifera populations as well.
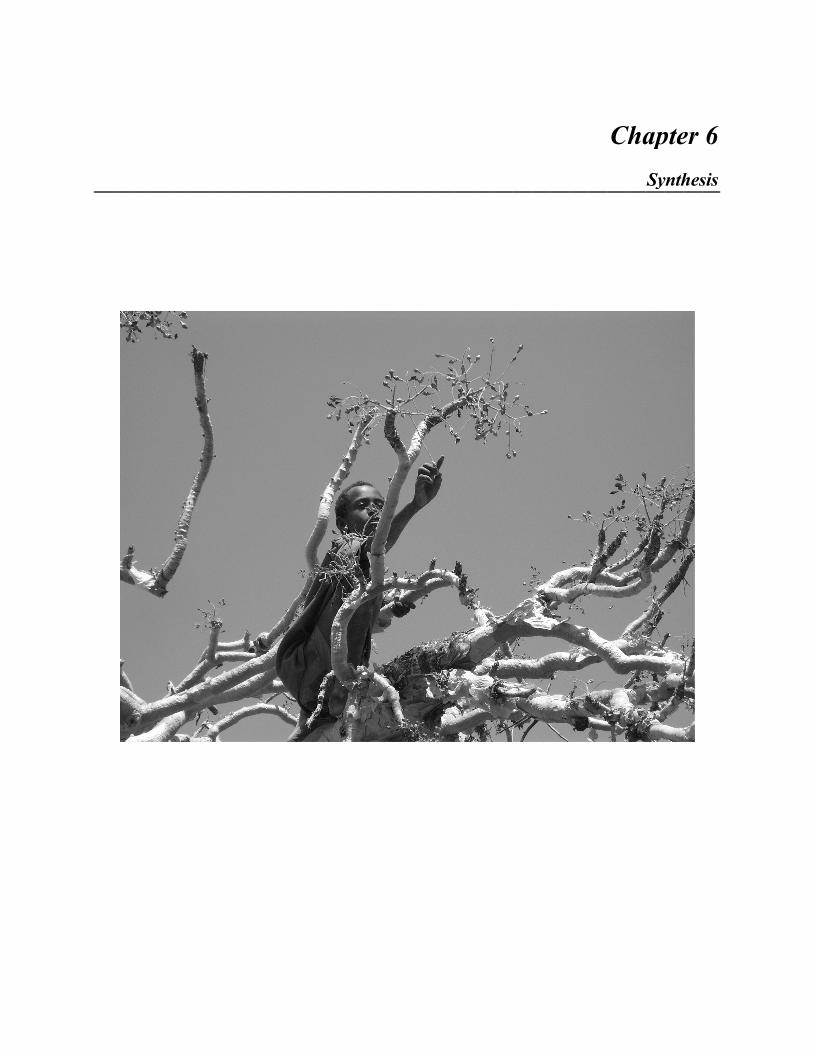
CChaap
Sy
pte
ynth
er
hes
6
sis
Chapter 6 - Synthesis
100
Dry tropical forests once present over 40 % of the tropical forests worldwide, and cover 14
percent of the total African surface (Mayaux et al. 2005) and 71% of the land surface in Ethiopia
(Hawando 1997). Large areas of the Ethiopian dry forests are dominated by the Combretum-
Terminalia and Acacia-Commiphora vegetation (Friis et al. 2010, IBC 2007), where trees and
shrubs of Acacia, Boswellia and Commiphora species produce economically valuable gums
and/or resins, such as arabic gum, frankincense, and myrrh, respectively (Coppen 1995). These
products have been harvested and traded since long in the Horn of Africa including Ethiopia
(Ahmed 1982, EFAP 1993). These woodland resources make up a large part of the national
export revenues in Ethiopia (Lemenih and Teketay, 2003a). With Somalia, Ethiopia acts as the
major producer and trader of Frankincense to the global market (FAO 1995).
The Combretum–Terminalia woodlands and Acacia–Commiphora woodlands are currently
degrading at increasing spatial scale owing to improper land use. These vegetations, and
particularly their Frankincense tree populations are threatened by over-harvesting of gums and
resins, overgrazing by livestock, excessive wood harvesting, lopping for fodder, expansion of
farmlands and recurrent fire. (Ogbazghi 2001, Gebrewihot 2003). This has led to incomplete
populations with missing sapling stages, as shown for Boswellia papyrifera (Ogbazghi 2001,
Gebrewihot 2002, Abiyu et al. 2010). Because saplings are missing, saplings are considered the
key bottleneck for stable population dynamics and sustainable resin yield. The prospects of these
woodlands are also threatened by increasing human and livestock population pressure as a result
of national migration programs, advancing degradation (Lemenih 2007). To come up with
sustainable management strategies for these dry woodlands in general and Boswellia papyrifera
populations in particular, the interactive effects of soil conditions, climate and disturbances by
grazing, fire and human harvest (frankincense production need to be understood.
In this thesis, I studied the current structure, dynamics and resin production of Boswellia
populations in Combretum - Terminalia woodlands, and predict their future based on population
model projections and scenarios. I analysed the effects of potential bottlenecks for sustainable
population dynamics and resin production and, in turn, provide alternative sustainable scenarios
for those populations. I focussed on the possible bottlenecks posed by frankincense tapping, and
grazing for the population dynamics and habitat characteristics (mainly soil conditions) in dry
woodlands of Ethiopia. For this purpose, I established twelve 1.6 - 2.0 ha permanent plots in the
relatively wet lowland of the Metema site, and six of those plots in the drier highlands of the
Abergelle site in August 2007. The two study sites differ in soil conditions and wet season
Chapter 6 - Synthesis
101
length, wherMetema has a longer wet season and a higher annual rainfall than Abergelle. Soil
samples were collected and analyzed. The plots covered gradients in soil conditions. For each
plot, all individuals > 1.5 m in height were identified, tagged and measured for diameter at breast
height (1. 3 m height from the ground) and total height to the top of the crown in August 2007.
All B. papyrifera individuals were re-measured twice per year till August 2009. Matrix
population models were used to analyze the dynamics of B. papyrifera populations.
Stand structure and diversity of Ethiopian dry woodlands
The species composition, species richness and productivity of the dry woodlands of Ethiopia was
addressed in the second chapter. I have shown that species composition of the two study sites
strongly differ: only four common species were found in both sites. In line with the intermediate
abiotic stress hypothesis (Huston, 1979), we predicted that species richness and diversity would
be higher in dry woodlands with a longer wet season and with substrates that are characterized
by higher nutrient supply, deeper soil depth and a better water supply texture. While the
predicted higher species richness and diversity with wet season length was found true, the
increase in species richness with soil fertility conditions was not observed. The findings of the
present study are in agreement with previous studies that showed species richness to increase
with precipitation (Gentry 1982, 1988, 1995, Givnish 1999, O’Brien 1993). The two study sites
also differ in altitude and level of disturbance which are important factors that govern species
richness in tropical forests. Metema is at lower altitude than Abergelle and the longer human
occupation of Abergelle could actually result in a higher disturbance in the dry forests compared
to the recently inhabited Metema forests. Species richness increase with a decrease in altitude
(Givnish 1999). The classical intermediate disturbance hypothesis (stating that species richness
peaks at intermediate levels of disturbance stress, Connell 1978, see also Bongers et al. 2009).
Thus, the higher species richness at Metema might not only be due to the difference in
precipitation (wet season length) but also due to altitude and level of disturbance or the
combined effect of wet season length, altitude and disturbance.
As predicted, wet season length and soil conditions govern tree and stand productivity of
Ethiopian dry woodlands in general and B. papyrifera dominated woodlands in particular. This is
confirmed by the presence of bigger trees and larger stand volumes in Metema than in Abergelle,
suggesting that wet season length and annual rainfall limit tree and stand productivity. The
influence of soil conditions was evaluated in relation to soil water availability, which was

Chapter 6 - Synthesis
102
assumed to increase with increasing soil depth and increasing clay content. Indeed, a positive
relation was observed between stand volume and both soil clay content and soil depth. This trend
was observed for both whole tree communities and for B. papyrifera populations separately.
However, for B. papyrifera, at a given clay content or soil depth we did not observe any
difference in tree size or stand volume between the drier and wetter area. In other words, annual
rainfall and wet season length do apparently not explain the observed variation between those
sites suggesting that differences in stand volumes of B. papyrifera populations are driven by
differences in texture (clay content) and soil depth, which drive soil water availability.
Frankincense production
I employed 500 trees in four populations (125 trees per population) to evaluate the effect of tree
size, tapping intensity and tapping frequency on frankincense production. Tapping intensity
refers to the number of tapping spots per tree while tapping frequency refers to the number of
collection rounds in one production season. Five levels of tapping intensity (3, 6, 9, 12 and 16
tapping spots per tree) and 5 diameter size classes (1: 5 – 10, 2: 15 – 20, 3: 20 – 25, 4: 25 – 30, 5:
> 30 cm DBH) were used for this particular experiment in which 5 trees were assigned for each
treatment combination. The study was continued for two production seasons (from October 2007
to June 2008 and from October 2008 to June 2009). The first production season involves 7
collection rounds while the second season involves 14 collection rounds. I quantified the
frankincense production and evaluated the determinants of frankincense production by naturally
growing B. papyrifera located in 4 populations. Such basic information is important to
understand the production system which is needed for planning sustainable management and
utilization of the species in the natural population. Tapping for frankincense production is done
from trees with > 10 cm DBH while the 95 percentile DBH was 31.3 and 27.6 cm at Metema and
Abergelle, respectively. In chapter 3 the hypothesises were that frankincense production would
initially increase with tree size, tapping intensity and tapping frequency, but would level-off later
on.
The hypotheses were accepted as frankincense production indeed increased with tree size,
tapping intensity and tapping frequency. However, as predicted, no more increase was observed
beyond a tree size of 20 cm DBH, a tapping intensity of 9 spots and after the 10th tapping round.
Similarly, many studies showed that resin production is a function of tree size and amount of
injury applied (Coppen 1995; Lombardero et al. 2000; Rodrigues et al. 2008; Klepzig et al. 2005;
Chapter 6 - Synthesis
103
Lewinsohn et al., 1991; Lombardero et al. 2000). The higher frankincense production from
bigger trees could result from two factors. The first being larger resource acquisition capacities
of bigger trees which in turn depends on the crown size and leaf area of trees (Lambers et al.
1998, Gomez 1983). Resin production in bigger trees is thus facilitated by the presence of large
crown size and leaf area. The second factor is the availability of more resin canals in the trunks
of bigger trees (Coppen 1995; Ella and Tongacan 1992). This is in line with the growth
differentiation balance hypothesis (GDBH) which postulates that production of secondary
producing structures and the metabolites produced, such as frankincense, increase with plant size
(Herms and Mattson 1992; Goralka and Langenheim 1996; Goralka et al. 1996). The levelling of
frankincense production beyond tapping intensity of 9 might be related to the anatomy of resin
producing structure in B. papyrifera and resin production potential of individual trees. Menger
(2010) reported that resin canals in B. papyrifera are interconnected. And production potential of
each individual tree depends on its size suggesting that each tree production potential is limited.
This potential production would be distributed to each tapping spot and thus, the flow of resin to
tapped spots would be constrained by the number of tapping spots, as its anatomy would allow
for drainage frankincense from one spot by the other.
Vital rates of Boswellia papyrifera
Growth
Stem growth rates of dry forest species vary among habitats depending on environmental factors
(soil conditions and water availability). Dry forest species in soil types that store water well (e.g.
high clay% and deeper soil depth) may acquire great stature and biomass (Murphy and Lugo
1990; 1995). Soil fertility can also affect tree growth rate (Lu, Moran & Mausel 2002; Malhi et
al. 2004) with better growth on more nutrient-rich soils (Russo et al. 2005, Toledo et al. 2011).
Thus, soil water availability and soil fertility are the main drivers of tree growth, but their
availability varies spatially and temporally (Ceccon et al. 2006; Mooney et al. 1995; Nath et al.
2006). Despite such established facts no relation was found between soil variables and stem
growth rate of B. papyrifera (Chapter 5). This might result either from the fact that the difference
in the soil variables between habitats is too small to affect tree growth or due to the presence of
other external factors that overruled the effect of soil variables or the combined effect of these
two factors. Similar findings were also reported by Viera et al. (2004), who did not observe
relationships between soil conditions and tree growth rate in Amazon rain forest. Generally, stem
Chapter 6 - Synthesis
104
growth of juvenile and adult individuals of B. papyrifera increased with tree size (Chapter 4 and
5). Root collar diameter was also unimportant for the growth of saplings. Similarly, no effect of
initial root collar diameter was found for the growth of seedlings as they died back during the dry
season (September to June) in the two study periods. Seedlings of B. papyrifera die back for
about 8 – 10 years before they start producing permanent shoots (A. Eshete unpublished data).
Such a strategy is actually considered an adaptation for dry tropical species to avoid deleterious
effect of drought and fire (Fenshaw & Holman 1999; Rice et al. 2004).
Survival
The results of the present study showed that the overall survival rate (0.93) of juvenile (6 – 10
cm DBH) and adult (>10 cm DBH) individuals (range 0.86 – 0.96) was lower than most
commonly reported survival rates of juvenile and adult trees in dry tropical forests (Chapter 4
and 5). The relationship between survival probability of individuals with tree size varied between
populations. In 7 out of 12 populations survival probability was not affected by tree size, in 2
populations survival probability increased with tree size, and in one population it decreased with
tree size. Despite such variation in survival probability among populations, no relation was found
between survival rates and soil conditions nor biotic factors suggesting that factors that govern
survival rate of adult individuals are not site specific. Similarly, no clear pattern was observed
for survival rate of established seedlings.
Reproduction
Boswellia papyrifera reproduced sexually and asexually through root suckers. Trees with a
diameter of >10 cm produce flowers and fruits. At least 26% (range; 26 – 72%) of the adult
individuals actually flowered and fruited in the two years of study. For those reproductive
individuals, the number of fruits produced per year ranged from 111 to 1540 fruits per tree
(chapter 5). Although proportion of fruiting trees in each study population showed high
variation, no relation was observed between proportion of fruiting trees and soil conditions as
well as biotic factors (Chapter 5, Table 1). The relation between tree size and production of fruits
per tree as well as proportion of fruiting trees differed between populations. Number of fruits
produced per tree increased with tree size in all populations while fruiting probability increased
with DBH in four populations (plot 1, 5, 8 and 11) but showed no relation with tree size in the

Chapter 6 - Synthesis
105
rest of the populations. The increase in number of fruits per tree size was similar to reports of the
same species in Eritrea (Ogbazghi 2001, Rijkers et al. 2006).
Seedlings of B. papyrifera recruited every year almost in all study populations although the
number of recruits varied among populations. Despite greater flowering and fruiting, only few
seedlings established within some plots and no clear relation was observed between the
proportion of fruiting trees and the number of recruits (Table 1 and 2). Earlier studies indicated
that B. papyrifera does not enter dormancy (Gebremedihin 1997) and does not form a soil seed
bank (Eshete et al. 2005), thus the current seed rain is the main source of seeds for the
establishment of B. papyrifera seedlings. The lack of seed banks and absence of clear fruit
production – recruitment relationships might be due to large across population variation in seed
viability, abortion, seed predation, or the combination of these factors (Eshete et al (2005),
Gebremedihin and Negash (2001) and Rijkers et al 2006 had reported 17, 19 and 25% of pre-
seed dispersal predation. B. papyrifera seed disperse in the studied population from January to
February. Germination and establishment of seedlings start in June when the rainy season starts.
Dispersed seeds are thus exposed to seed predation for about 3 months, may dry out or may burn
during the regular dry season fire. Seed predation or burning could limit the availability of seed
and could be another reason for the low recruitment of seedlings in some populations (Fenner,
M. & Kitajima, 1999). Moreover, in two of plots seedlings did not originate from seeds but from
root suckers (Chapter 5).
What is the major bottleneck for population growth of B. papyrifera?
Boswellia papyrifera populations experience missing classes, particularly sapling stages in the
regeneration profile (Abiyu et al. 2010 ). Due to this, lack of regeneration becomes a common
feature for B. papyrifera populations in its natural habitat and is usually considered as a major
bottleneck for population growth (Ogbazghi 2001, Gebrehiwot 2003). Population dynamics of B.
papyrifera populations have been investigated using matrix models across the 12 studied
populations in Metema of North Western Ethiopia. Individual plants were categorized into life
stages and diameter size classes to meet the requirements of the model (Chapter 4 and 5). Vital
rates of the species were quantified to estimate matrix elements that are used to construct the
matrix model (Chapter 4 and 5). The outputs of the model were used to project the future
development of the species.
Chapter 6 - Synthesis
106
Our population models based on two years of demographic data project declining B. papyrifera
populations across its habitats (Chapter 5). The populations are therefore expected to be
declining over time. No change in the growth of population was predicted through increasing the
number of recruitments or allowing the growth of seedlings to saplings. Thus, output of the
model contradicts earlier reports that considered lack of regeneration as a major bottleneck for
the growth of population of the species. An elasticity analysis of the model showed that the
survival rate of adult individuals was the most important for the population growth and
contributed 86% to population growth. Thus, the observed low survival rate of adult individuals
(range: 86 to 98%) is currently the major bottleneck for the growth of the studied B. papyrifera
populations. Similar results have been found for other long-lived plant species. Rikhari et al.
(1998) and Kwit et al. (2004) reported that efforts to increase seedling production and survival
didn’t increase population growth as these transitions had the lowest elasticities and minimal
impact on population growth rates of Taxus species.
Many factors potentially influence population growth rates. For our study populations, we
focussed on the possible effects of soil and climate conditions and disturbance by people. We did
not find a significant impact of soil conditions on population growth rates. It can be speculated
that the populations decline as a result of the increasing disturbance. Since the last three to four
decades, these woodlands became re-settlement areas for people from dry and unproductive
areas (Teketay 2000). In these woodlands they were allowed to produce their own food crops and
graze their livestock regularly without any kind of regulation. As a result of these large areas
were and are being converted to farmlands and Boswellia dominated woodlands became the
main grazing area for large livestock populations throughout the year. Deliberate fire is set in the
woodlands for farm clearing, to move freely in the forest, to keep away dangerous animals, to
harvest honey, among others (Eshete 2002). Thus, the observed intensive and unregulated
grazing and recurrent fire might be the responsible factors for the lack of saplings across the
habitats through limiting the growth of seedlings to saplings.
Besides, following the interest of the current government to boost production of gum and resin
products to increase the export, the number of organizations that involve in production,
processing and marketing of the products such as Frankincense increased dramatically, and
introduced more intensive tapping regimes than traditional tapping techniques. No scientific
guideline is available for sustainable production of frankincense by B. papyrifera. Thus,
individual trees are subjected to intensive tapping where each tree is tapped at more number of
Chapter 6 - Synthesis
107
spots beyond the recommended number of spots by traditional tapping techniques. Resin
production through tapping usually weakens the tree and may expose tapped trees for insect
attack. Insect attack is now a common problem of B. papyrifera in both tapped and untapped
populations (Chapter 5, Eshete et al. 2005, Negussie 2008). Insect attack and windfall were the
main causes of adult tree mortality in study populations in which insect attack accounted for, on
average, 65% of juveniles and adult mortality rate. This suggest that insect attack is an important
factor for the death of adult individuals. Negussie (2008) reported similar observations where
>65% of standings trees were affected by the long horn beetle named as Idactus spinipennis
Gahan. in Tigray, Ethiopia. Under the current situation the B. papyrifera population are declining
rapidly: only 50% of the population would remain after 17 years. In line with this the
frankincense production potential of B. papyrifera would be halved in 17 years.
Effect of tapping on vital rates and population dynamics of B. papyrifera
Tapping is expected to divert reserves/resources to frankincense which otherwise could be used
for other sinks (growth, reproduction, etc.) (Rijkers et al. 2006, Mengistu et al. in preparation).
We hypothesized that tapping would decrease the rates of diameter growth, fecundity and
survival compared to untapped populations. Consequently , we predicted lower population
growth rates in tapped populations. We also hypothesized that tapping for frankincense
production would affect regeneration capacity of the species and that tapped populations would
present stronger regeneration bottlenecks.
In contrast to our expectation, we found that individual trees in tapped populations had relatively
higher diameter growth rates and fruiting probability compared to individual trees in untapped
populations (chapter 4). Survival rate of tapped individuals was slightly negatively affected.
Similar positive effects on growth and reproduction potential of tapped trees was found for
Protium copal in Guatemala (Neels 1996). However, Rijkers et al. (2006) reported a strong
negative effect of tapping on reproduction potential of B. papyrifera in Ethiopia. Silpi et al.
(2007) had also reported a strong negative effect of tapping for rubber on diameter growth of
Hevea brasiliensis. The absence of such a negative effect of tapping on vital rates of B.
papyrifera might be due to several reasons. First, the tapping intensity in the present study was
moderate compared to some other populations that were more intensively tapped (> 27 tapping
spots per tree, Kebede 2010). This moderate tapping intensity might have little effect on vital
rates. Secondly, almost all tapped populations are located in a relatively better soil conditions

Chapter 6 - Synthesis
108
(chapter 4) suggesting that producers select Boswellia stands that grow in a better soil
conditions. Thus, such difference in soil conditions could have also precluded to see the effect of
tapping. Thirdly, the cause of mortality in both tapped and untapped population was similar as >
65% of dead trees were insect affected in both populations. Thus, the high insect infestation in
both populations might have overruled the effect of tapping on survival rate of individual trees.
Matrix populations model were constructed to assess the impact of tapping on the population
growth of B. papyrifera. Six populations from tapped stands and 6 populations from untapped
populations were used for the present study. The results showed that population growth rates of
tapped populations were higher than those for untapped populations, but population growth rates
of both populations were < 1 suggesting that B. papyrifera populations are declining under the
current situation irrespective of management regimes. In both populations (tapped and
untapped), the survival rate of adult individuals (which is comparable between the two
populations) was the most important element for the maintenance and growth of B. papyrifera
populations. Thus, the higher population growth rate of tapped populations is probably due to the
higher fruiting probability and growth rate of adult trees in tapped than untapped populations.
Sustainable frankincense production scenarios
A number of past research reports documented that B. papyrifera populations are declining as a
result of anthropogenic disturbance. Particularly, the lack of regeneration has been considered as
the major bottleneck for the maintenance and/or growth of B. papyrifera populations. The
outputs of our matrix models, however, indicated that the high mortality of juvenile and adult
individuals were the major bottleneck for maintenance of the populations. The adult stages in
particular contained the largest elasticities (86%). We simulated various management practices
that target an increase in the regeneration as well as growth of seedlings to saplings and
reduction of adult mortality. The reduction of adult mortality was simulated by lowering adult
mortality first to 50% and then to 75% of the current observed mortality rate. The first set of
simulations based on an increase in seedling regeneration and allowing the growth of seedlings
to sapling stage are not likely to increase population growth under the current condition of high
adult mortality. Similar results were reported for Taxus species where an increase in seedling
production didn’t bring change on population growth of the species (Hulme 1996, Rikhari et al.
1998, Kwit et al. 2004). The second set of simulation (seedlings grow to sapling and adult
mortality reduced by 50%) results in a similar decline of B. papyrifera populations. When
Chapter 6 - Synthesis
109
reduction of adult mortality by 75% was simulated, the growth rates of B. papyrifera populations
become close to 1 for tapped and untapped stands (chapter 4) suggesting that B. papyrifera
populations would be maintained or would probably grow if and only if the current mortality rate
of adult individuals is reduced by 75%, i.e. when mortality rate is reduced from 7% to 1.75%.
A multiple-approach management will be needed to maintain B. papyrifera populations which
are predicted to be in rapid decline as a result of anthropogenic disturbance. First, a scientific
guideline for frankincense production shall be developed and implemented. The current intensive
tapping is expected to weaken the tree and exposes them to insect attack. While reducing tapping
intensity might to some extent decrease the mortality of adult individuals, it is certainly not
sufficient to guarantee sustainable populations. Second, establishing enclosures to protect large
areas against disturbance by grazing and fire would increase the chances of growth of most
seedlings to sapling stage. Third, proactive management efforts that focus on generating
environmental conditions that increase the survival and growth of established seedlings should
be introduced. The low elasticities associated with seedlings and saplings should not preclude a
long-term management focus on these stages. We propose that rapid actions are needed for
sustainable production and conservation, since Boswellia populations are rapidly degrading to a
state from which recovery might not be possible anymore.

Chapter 6 - Synthesis
110
RRefefeereencees

112
Abiyu, A., Bongers, F., Eshete, A., Gebrehiwot, K., Kindu, M., Lemenih, M., Moges, Y.,
Ogbazghi, W. and Sterck, F, 2010. Incense woodlands in Ethiopia and Eritrea:
Regeneration problems and restorations possibilities. In: Bongers, F., Tennigkeit, T.
(eds.). Degraded forests in Eastern Africa: Management and restoration. Earthscan
Ltd, London, UK, pp. 133 – 152.
Ahmed, T. 1982. The Swiss, Italian and Finnish Markets for Ethiopian Gum Olibanum. Program
for development cooperation, Market research report No. 5. The Helsinki School of
Economics, Helsinki.
Aiba, S., and Kitayama, K. 1999. Structure, composition and species diversity in an altitude-
substrate matrix of rain forest tree communities on Mount Kinabalu, Borneo. Plant
Ecology 140: 139–157.
Allegretti, M. 1990. Extractive reserves: an alternative for reconciling development and
environmental conservation in Amazonia. In: A.B. Anderson (ed.). Alternatives to
deforestation: steps toward sustainable use of Amazonian rain forests. Colombia
University Press, New York, USA.
Aplet, G., Laven, R. D. and Shaw, R. B. 1994. Application of projection matrix models to the
recovery of the rare Hawaiian shrub, Tetramolopium arenarium (Asteraceae). Natural
Areas Journal 14: 99 – 106.
Arnold, E. M. & M. Ruiz Perez, M. R. 2001. Can non-timber forest products match tropical
forest conservation and development objectives? Ecological Economics 39: 437–447
Ashton, P. S. 1992. Species richness in plant communities. In: P. Fiedler, P. and Jain. S.
(eds.).Conservation Biology. Chapman & Hall, London. pp. 3- 22.
Awas, T., 2007. Plant diversity inWestern Ethiopia: ecology, ethnobotany and conservation. PhD
thesis. University of Oslo, Oslo, Norway.
Ballal, M. E., Siddig, E. A. Elfadl, M. A. & Luukkanen, O. 2005. Relationship between
environmental factors, tapping dates, tapping intensity and gum arabic yield of an
Acacia senegal plantation in Western Sudan. Journal of Arid Environments 63: 379 –
389.
Barbier 1987 Barbier, E.B. 1987. The concept of sustainable economic development.
Environmental Conservation 14: 101-110.
Barton, A.M., Swetnam, T.W. and Baisan, C. H. 2001. Arizona pine (Pinus arizonica) stand
dynamics: Local and regional factors in a fire-prone madrean gallery forest of
Southeast Arizona, USA. Landscape Ecology 16: 351-369.
113
Bastrenta, B., J.-D. Lebreton, and J. D. Thompson. 1995. Predicting demographic change in
response to herbivory: a model of the effects of grazing and annual variation on the
population dynamics of Anthyllis vulneraria. Journal of Ecology 83:603–611.
Batista, W. B., W. J. Platt, and R. E. Machiavelli. 1998. Demography of a shade-tolerant tree
(Fagus grandiflora) in a hurricane-disturbed forest. Ecology: 79:38–53.
Bekele, A., Birnie, A. and Tengas, B. 1993. Useful trees and shrubs of Ethiopia, identification,
propagation, and management of agricultural and pastoral communities. Technical
Hand Book No 5. Nairobi Regional Soil Conservation Unit, Nairobi. Pp. 474.
Belsky, A.J. and Blumenthal, D.M., 1997. Effects of livestock grazing on stand dynamics and
soils in upland forests of the interiorwest. Review. Conservation Biology 11 (2): 315–
327.
Bongers, F., Poorter, L., Hawthorne,W., and Sheil, D., 2009. The intermediate disturbance
hypothesis applies to tropical forests, but disturbance contributes little to tree diversity.
Ecology Letters 12 (8): 798–805.
Bongers, F.,Wassie, A., Sterck, F.J., Bekele, T., and Teketay, D., 2006. Ecological restoration
and church forests in northern Ethiopia. Journal of the Drylands 1 (1): 35–44.
Boot, R.G. and Gullison, R.E. 1995. Approaches to developing sustainable extraction systems
for tropical forest products. Ecological Applications 5: 896-903.
Bryant, J.P., Chapin III, F.S. and Klein, D. R. 1983. Carbon/nutrient balance of boreal plants in
relation to vertebrate herbivory. Oikos 40: 357-367.
Bullock, J. M., B. Clear Hill, and J. Silvertown. 1994. Demography of Cirsium vulgare in a
grazing experiment. Journal of Ecology 82:101–111.
Bullock, S. H. and Solis-Magallanes, J. A. 1990. Phenology of canopy trees of a tropical
deciduous forest in Mexico. Biotropica 22: 22-35.
Bullock, S.T., Mooney, H. A., and Medina, E., 1995. Seasonally Dry Tropical Forests.
Cambridge University Press, Cambridge, UK.
Caswell, H. 1989. Matrix population models. Sinauer Associates, Sunderland, Massachusetts,
USA.
Caswell, H. 2001. Matrix population models. Construction, analysis, and interpretation. –
Sinauer Associates, Inc. Publishers, Sunderland, Massachusetts.
Ceccon, E., Huante P. and Rincón, E. 2006. Abiotic factors influencing tropical dry forests
regeneration. Brazilian Archives of Biology and Technology 49:305–312.
Cecil, J. and Mitchell, P. 2003. Processing of Natural Rubber. FAO, Rome Italy.
114
Chaudhari, D.C., Sheel, S.K., Uniyal, D.N. and Bist, R.S. 1996. Supplementing resin production
by retapping healed up channels. Indian Forester 122: 746 - 750.
Chikamai, B.N. (ed). 2002. Review and Synthesis on the State of Knowledge of Boswellia
Species and Commercialization of Frankincense in the Drylands of Eastern Africa.
KEFRI, Nairobi.
Christiansen, E., Waring, R.H. and Berryman, A. A. 1987. Resistance of conifers to bark beetle
attack: Searching for general relationships. Forest Ecology and Management 22: 89-
106.
Clark, D.B., Clark, D.A., and Read, J.M. 1998. Edaphic variation and the mesoscale distribution
of tree species in a Neotropical rain forest. Journal of Ecology 86:101–112.
Colwell, R. K. 2006. EstimateS: Statistical Estimation of Species Richness and Shared Species
from samples. Version 8, Persistent URL<purl.oclc.org/estimates>.
Condit, R., S. P. Hubbell, and R. B. Foster. 1995. Mortality rates of 205 neotropical tree and
shrub species and the impact of a severe drought. Ecological Monographs 65:419–439.
Connell, J.H., 1978. Diversity in tropical rain forests and coral reefs. Science 199: 1302–1310.
Coppen, J. J. 1995. Flavors and fragrances of plant origin. In: Non-wood forest products No. 1.
Natural Resources Institute, FAO, Rome, Italy.
Coppen, J.J. and Hone, G.A. 1995. Gum naval stores: turpentine and rosin from pine resin. In:
Non-wood forest products no. 2. Natural Resources Institute, FAO, Rome, 158p.
Crisp, M.D. 1978. Demography and survival under grazing of three Australian semi-desert
shrubs. Oikos 30: 520-528.
de Beer J. H. and McDermott, M. 1989. The Economic Value of Non-Timber Forest Products in
South- East Asia. Amsterdam, The Netherlands Committee for IUCN
de Kroon, H., Plaisier, A., van Groenendael, J. and Caswell, H. 1986. Elasticity: the relative
contribution of demographic parameters to population growth rate. Ecology 67: 1427-
1431.
de Kroon, H., van Groenendael, J. and Ehrlen, J. 2000. Elasticities: a review of methods and
model limitations. Ecology 81: 607–618.
Demissew, S and Nordal, I. 2010. Aloes and Lilies of Ethiopia and Eritrea. Shama Books, Addis
Ababa, Ethiopia.
Dufournaud, C.M., Quinn, J.T., Harrington J.J. and co-workers. 1995. “A model of sustainable
extraction of non-timber forest products in subsistence societies”. Environment and
Planning, Vol. A 27: 1667-1676.
115
Edwards, S., Demissew, S. and Hedberg, I. (Eds.), 1997. Flora of Ethiopia and Eritrea.
Hydrocharitaceae to Arecaceae, vol. 6. The National Herbarium, Addis Ababa
University, Addis Ababa, Department of systematic Botany, Uppsala University
Uppsala.
Edwards, S., Tadesse, M., and Hedberg, I. (Eds.), 1995. Flora of Ethiopia and Eritrea.
Canellaceae to Euphorbiaceae, vol. 2 (2). The National Herbarium, Addis Ababa
University, Addis Ababa, Department of systematic Botany, Uppsala University
Uppsala.
Edwards, S., Tadesse, M., Demsew, S., and Hedberg, I. (Eds.), 2000. Flora of Ethiopia and
Eritrea, Part 1, vol. 2. National Herbarium, Addis Ababa University, Addis Ababa,
Department of systematic Botany, Uppsala University Uppsala.
Ella, A.B. & Tongacan, A.L. 1987. Tapping of palosapis [Anisoptera thurifera (Blanco) Blume
subsp. thurifera]. Forest Products Research and Development Institute Journal 16:15-
26.
Elliott, K., Boring, L. R., Swank, W. T. and Haines, B. R. 1997. Successional changes in plant
speies diversity and composition after clear cutting a Southern Appalachian watershed.
Forest ecology and Management 92: 67-85.
Eriksson, I., Teketay, D. and Granström, A. 2003. Response of plant communities to fire in an
Acacia woodland and a dry afromontane forest, Southern Ethiopia. Forest Ecology and
Management 177: 39-50.
Eshete, A. 2002. Regeneration status, soil seed banks and socio-economic importance of
Boswellia papyrifera in two woredas of North Gondar Zone, northern Ethiopia. MSc
thesis, Swedish University of Agricultural Sciences, Skinnskatteberg, Sweden..
Eshete, A. Sterck, F. and Bongers, F. 2011. Diversity and production of Ethiopian dry woodlands
explained by climate - and soil - stress gradients. Forest Ecology and Management
doi:10.1016/j.foreco.2011.01.021.
Eshete, A., Teketay, D. Hulten, H., 2005. The socio-economic importance and status of
populations of Boswellia papyrifera (Del.) Hochst. In northern Ethiopia: the case of
north Gondar zone. Forests, trees and Livelihoods 15: 55-74.
Fagg, C. W. & Allison, G. E. 2004. Acacia senegal and the gum Arabic trade. Tropical Forestry
Papers 42, Oxford, Oxford Forestry Institute.
FAO 1989. Forestry and Nutrition: A Reference Manual. Bangkok: FAO.
FAO 1995. Flavors and Fragrance of Plant Origin.Non-wood Forest Products I, Rome, Italy.
116
FAO 1996. Ethiopia: country report to the FAO International Technical Conference on Plant
Genetic Resources. Plant Genetic Resources Center, Leipzig.
Fenner, M. and Kitajima, K. 1999. Seed and seedling ecology. In: Pugnaire, F. I. & Valladares,
F. (eds.), Handbook of functional plant ecology. Marcel Dekker, INC. PP 589 – 611.
Fensham, R. J. and J. E. Holman 1999 Temporal and spatial patterns in drought-related tree
dieback in Australian savanna. Journal of Applied Ecology 1999, 36, 1035-1050
Fernadez-Illescas, C.P., Porporato, A., Laio, F., and Rodriguez-Iturbe, I., 2001. The
ecohydrological role of soil texture in a water-limited ecosystem. Water Resource
Research 37, 2863–2872.
Fichtl, R. and Admasu, A. 1994. Honeybee flora of Ethiopia. Margraf Verlag, Weikersheim.
Fischer, J., Stott, J., Zerger, A., Warren, G., Sherren, K., and Forrester, R. 2009. Reversing a tree
regeneration crisis in an endangered ecoregion. Proceedings ofthe National Academy
of Sciences of the United States of America 106 (25): 10386–10391.
Fitwi, G. 2000. The status of gum arabic and resins in Ethiopia. In: Report of the meeting of the
network for natural gums and resins in Africa (NGARA): Proceeding 29-31 May,
Nairobi, Kenya.
Friis, B. I., Demissew, S. & Breugel, P. 2010. Atlas of the potential vegetation of Ethiopia. The
Royal Danish Academy of Sciences and Letters.
Gebrehiwot, K., 2003. Ecology and management of Boswellia papyrifera (Del.). Hochst. Dry
forests in Tigray, Northern Ethiopia. PhD thesis. Georg-August-University of
Göttingen, Germany.
Gebrehiwot, K., Muys, B., Haile, M., and Mitloehner, R., 2003. Introducing Boswellia
papyrifera (Del.) Hochst. and its non-timber forest product, frankincense. International
Forestry Review 5, 348–353.
Gebremedhin, T. & Negash, L. 1999. The effect of different pre sowing seed treatments on the
germination of Boswellia papyrifera, a key dry land tree. Ethiopian Journal of Natural
Resources 1: 57 – 75.
Gebremedhin, T. 1997. Boswellia papyrifera (Del.) Hochst. from western Tigray. Opportunities,
Constraints and seed germination responses. MSC. Thesis, Swedish University of
Agricultural Sciences, Skinnskatteberg.
Gentry, A. H. 1995. Diversity and floristic composition of neotropical dry forests. In: Bullock, S.
H., Mooney, H. . & Medina, E. (eds.). Seasonally dry tropical forests. Pp 146 – 194.
Cambrideg University Press, Cmbridge.
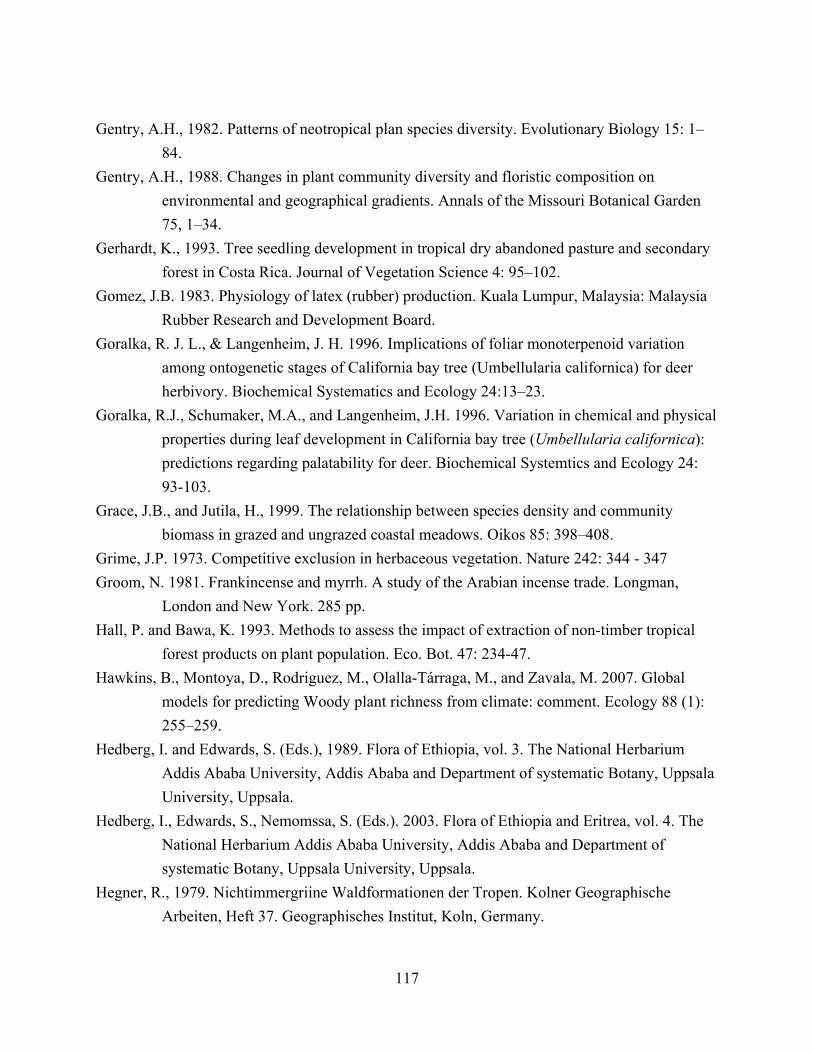
117
Gentry, A.H., 1982. Patterns of neotropical plan species diversity. Evolutionary Biology 15: 1–
84.
Gentry, A.H., 1988. Changes in plant community diversity and floristic composition on
environmental and geographical gradients. Annals of the Missouri Botanical Garden
75, 1–34.
Gerhardt, K., 1993. Tree seedling development in tropical dry abandoned pasture and secondary
forest in Costa Rica. Journal of Vegetation Science 4: 95–102.
Gomez, J.B. 1983. Physiology of latex (rubber) production. Kuala Lumpur, Malaysia: Malaysia
Rubber Research and Development Board.
Goralka, R. J. L., & Langenheim, J. H. 1996. Implications of foliar monoterpenoid variation
among ontogenetic stages of California bay tree (Umbellularia californica) for deer
herbivory. Biochemical Systematics and Ecology 24:13–23.
Goralka, R.J., Schumaker, M.A., and Langenheim, J.H. 1996. Variation in chemical and physical
properties during leaf development in California bay tree (Umbellularia californica):
predictions regarding palatability for deer. Biochemical Systemtics and Ecology 24:
93-103.
Grace, J.B., and Jutila, H., 1999. The relationship between species density and community
biomass in grazed and ungrazed coastal meadows. Oikos 85: 398–408.
Grime, J.P. 1973. Competitive exclusion in herbaceous vegetation. Nature 242: 344 - 347
Groom, N. 1981. Frankincense and myrrh. A study of the Arabian incense trade. Longman,
London and New York. 285 pp.
Hall, P. and Bawa, K. 1993. Methods to assess the impact of extraction of non-timber tropical
forest products on plant population. Eco. Bot. 47: 234-47.
Hawkins, B., Montoya, D., Rodriguez, M., Olalla-Tárraga, M., and Zavala, M. 2007. Global
models for predicting Woody plant richness from climate: comment. Ecology 88 (1):
255–259.
Hedberg, I. and Edwards, S. (Eds.), 1989. Flora of Ethiopia, vol. 3. The National Herbarium
Addis Ababa University, Addis Ababa and Department of systematic Botany, Uppsala
University, Uppsala.
Hedberg, I., Edwards, S., Nemomssa, S. (Eds.). 2003. Flora of Ethiopia and Eritrea, vol. 4. The
National Herbarium Addis Ababa University, Addis Ababa and Department of
systematic Botany, Uppsala University, Uppsala.
Hegner, R., 1979. Nichtimmergriine Waldformationen der Tropen. Kolner Geographische
Arbeiten, Heft 37. Geographisches Institut, Koln, Germany.
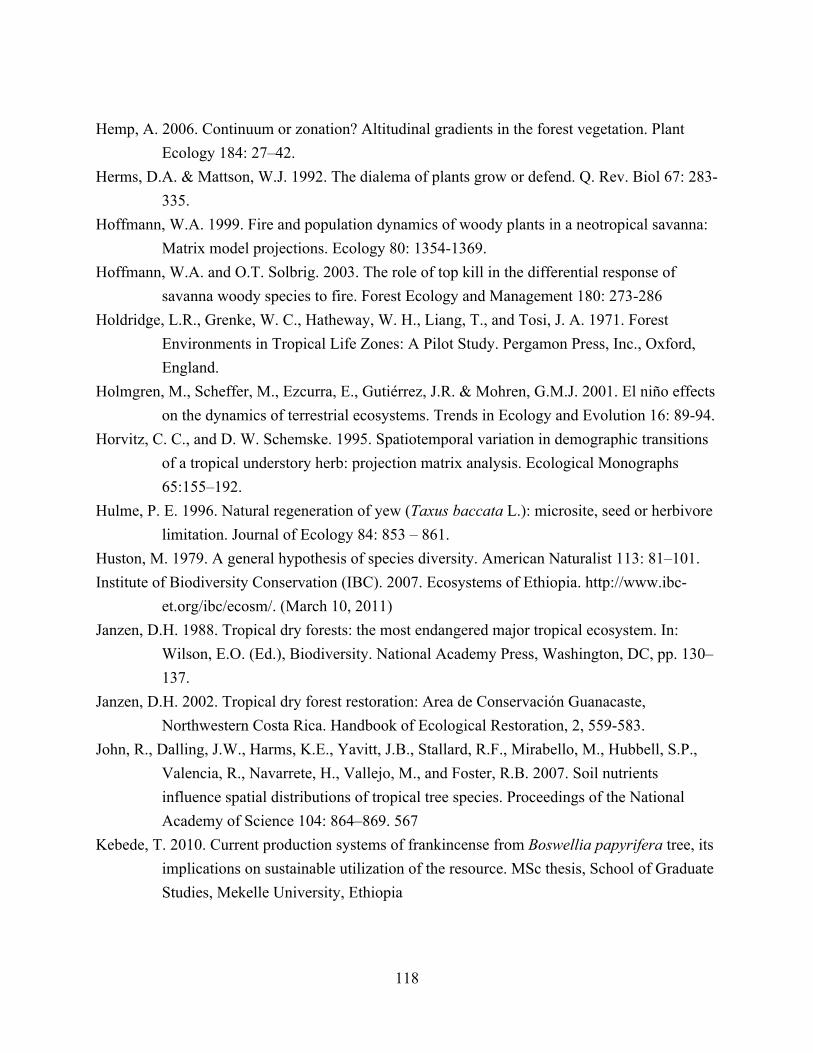
118
Hemp, A. 2006. Continuum or zonation? Altitudinal gradients in the forest vegetation. Plant
Ecology 184: 27–42.
Herms, D.A. & Mattson, W.J. 1992. The dialema of plants grow or defend. Q. Rev. Biol 67: 283-
335.
Hoffmann, W.A. 1999. Fire and population dynamics of woody plants in a neotropical savanna:
Matrix model projections. Ecology 80: 1354-1369.
Hoffmann, W.A. and O.T. Solbrig. 2003. The role of top kill in the differential response of
savanna woody species to fire. Forest Ecology and Management 180: 273-286
Holdridge, L.R., Grenke, W. C., Hatheway, W. H., Liang, T., and Tosi, J. A. 1971. Forest
Environments in Tropical Life Zones: A Pilot Study. Pergamon Press, Inc., Oxford,
England.
Holmgren, M., Scheffer, M., Ezcurra, E., Gutiérrez, J.R. & Mohren, G.M.J. 2001. El niño effects
on the dynamics of terrestrial ecosystems. Trends in Ecology and Evolution 16: 89-94.
Horvitz, C. C., and D. W. Schemske. 1995. Spatiotemporal variation in demographic transitions
of a tropical understory herb: projection matrix analysis. Ecological Monographs
65:155–192.
Hulme, P. E. 1996. Natural regeneration of yew (Taxus baccata L.): microsite, seed or herbivore
limitation. Journal of Ecology 84: 853 – 861.
Huston, M. 1979. A general hypothesis of species diversity. American Naturalist 113: 81–101.
Institute of Biodiversity Conservation (IBC). 2007. Ecosystems of Ethiopia. http://www.ibc-
et.org/ibc/ecosm/. (March 10, 2011)
Janzen, D.H. 1988. Tropical dry forests: the most endangered major tropical ecosystem. In:
Wilson, E.O. (Ed.), Biodiversity. National Academy Press, Washington, DC, pp. 130–
137.
Janzen, D.H. 2002. Tropical dry forest restoration: Area de Conservación Guanacaste,
Northwestern Costa Rica. Handbook of Ecological Restoration, 2, 559-583.
John, R., Dalling, J.W., Harms, K.E., Yavitt, J.B., Stallard, R.F., Mirabello, M., Hubbell, S.P.,
Valencia, R., Navarrete, H., Vallejo, M., and Foster, R.B. 2007. Soil nutrients
influence spatial distributions of tropical tree species. Proceedings of the National
Academy of Science 104: 864–869. 567
Kebede, T. 2010. Current production systems of frankincense from Boswellia papyrifera tree, its
implications on sustainable utilization of the resource. MSc thesis, School of Graduate
Studies, Mekelle University, Ethiopia

119
Kent, M. and Coker, P. 1992. Vegetation Description and Analysis: A Practical Approach. John
Wiley & Sons, Chichester. Knoop, W.T., Walker, B.H., 1985. Interactions of woody
and herbaceous vegetation in a southern African savanna. Journal of Ecology 73: 235–
253.
Kephart, S. R., and C. Paladino. 1997. Demographic change and microhabitat variability in a
grassland endemic, Silene douglasii var. oraria (Caryophyllaceae). American Journal
of Botany 82: 179–189.
Klepzig, K.D., Robison, D.J., Fowler, G., Minchin, P.R., Hain, F.P. and Allen, H.L. 2005.
Effects of mass inoculation on induced oleoresin response in intensively managed
loblolly pine. Tree physiology 25: 681 - 688.
Krokene, P., Christiansen, E., Solheim, H., Franceschi, V. R., & Berryman, A. A. 1999. Induced
resistance to pathogenic fungi in Norway spruce. Plant Physiol. 121: 565-569.
Kwit, C, Horvitz, C. and Platt, W. 2004. Conserving slow-growing, long-lived tree species: input
from the demography of a rare understory Conifer, Taxus floridana. Conservation
Biology 18: 432 – 443.
Lambers, H., Chapin, F.S. and Pons, T.L. 1998. Plant physiological ecology. Springer-Verlag,
New York, USA.
Langenheim, J. H. 2003. Plant resins: chemistry, evolution, ecology and ethnobotany. Timber
Press, Portland, Cambridge.
Lemenih, M. and Kassa, H. 2008. Opportunities and challenges for Sustainable production and
marketing of gums and resins in Ethiopia: Proceedings of a national workshop held on
December 5, 2007 in Addis Ababa, Ethiopia. CIFOR SIDA
Lemenih, M. and Teketay, D. 2003a. Frankincense and myrrh resources of Ethiopia. I.
Distribution, Production, Opportunities for dry land economic development and
research needs. Ethiopian Journal of Science, SINET 26 (1): 63-72.
Lemenih, M. and Teketay, D. 2003b. Frankincense and myrrh resources of Ethiopia: II
Medicinal and industrial uses. SINET, Ethiopian Journal of Science 26 (2): 161- 172.
Lemenih, M., Abebe, T. & Olsson, M. 2003. Gum and resin resources from some
Acacia,Boswellia and Commiphora species and their economic contributions in Liban,
South-East Ethiopia. Journal of Arid Environments 55: 465-482.
Lemenih, M., Feleke, S. and Tadesse, W. 2007. Constraints to smallholders production of
frankincense in Metema district, North-western Ethiopia. Journal of Arid
Environments 71: 393–403. 577
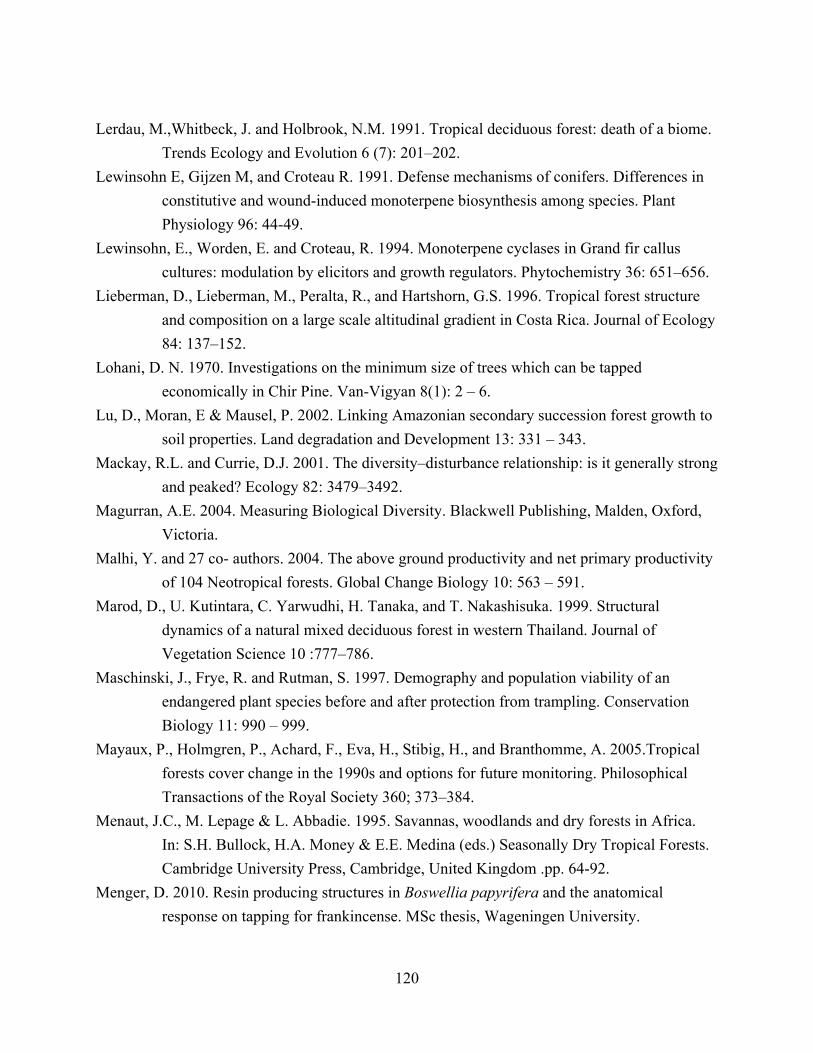
120
Lerdau, M.,Whitbeck, J. and Holbrook, N.M. 1991. Tropical deciduous forest: death of a biome.
Trends Ecology and Evolution 6 (7): 201–202.
Lewinsohn E, Gijzen M, and Croteau R. 1991. Defense mechanisms of conifers. Differences in
constitutive and wound-induced monoterpene biosynthesis among species. Plant
Physiology 96: 44-49.
Lewinsohn, E., Worden, E. and Croteau, R. 1994. Monoterpene cyclases in Grand fir callus
cultures: modulation by elicitors and growth regulators. Phytochemistry 36: 651–656.
Lieberman, D., Lieberman, M., Peralta, R., and Hartshorn, G.S. 1996. Tropical forest structure
and composition on a large scale altitudinal gradient in Costa Rica. Journal of Ecology
84: 137–152.
Lohani, D. N. 1970. Investigations on the minimum size of trees which can be tapped
economically in Chir Pine. Van-Vigyan 8(1): 2 – 6.
Lu, D., Moran, E & Mausel, P. 2002. Linking Amazonian secondary succession forest growth to
soil properties. Land degradation and Development 13: 331 – 343.
Mackay, R.L. and Currie, D.J. 2001. The diversity–disturbance relationship: is it generally strong
and peaked? Ecology 82: 3479–3492.
Magurran, A.E. 2004. Measuring Biological Diversity. Blackwell Publishing, Malden, Oxford,
Victoria.
Malhi, Y. and 27 co- authors. 2004. The above ground productivity and net primary productivity
of 104 Neotropical forests. Global Change Biology 10: 563 – 591.
Marod, D., U. Kutintara, C. Yarwudhi, H. Tanaka, and T. Nakashisuka. 1999. Structural
dynamics of a natural mixed deciduous forest in western Thailand. Journal of
Vegetation Science 10 :777–786.
Maschinski, J., Frye, R. and Rutman, S. 1997. Demography and population viability of an
endangered plant species before and after protection from trampling. Conservation
Biology 11: 990 – 999.
Mayaux, P., Holmgren, P., Achard, F., Eva, H., Stibig, H., and Branthomme, A. 2005.Tropical
forests cover change in the 1990s and options for future monitoring. Philosophical
Transactions of the Royal Society 360; 373–384.
Menaut, J.C., M. Lepage & L. Abbadie. 1995. Savannas, woodlands and dry forests in Africa.
In: S.H. Bullock, H.A. Money & E.E. Medina (eds.) Seasonally Dry Tropical Forests.
Cambridge University Press, Cambridge, United Kingdom .pp. 64-92.
Menger, D. 2010. Resin producing structures in Boswellia papyrifera and the anatomical
response on tapping for frankincense. MSc thesis, Wageningen University.
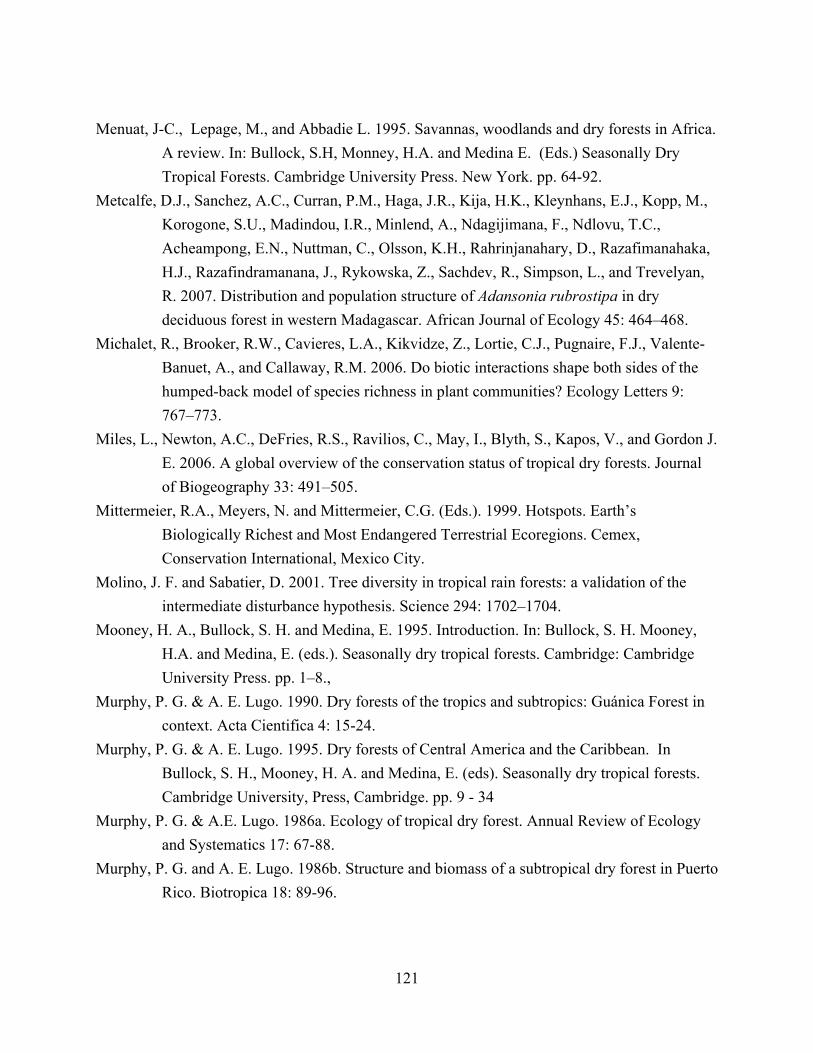
121
Menuat, J-C., Lepage, M., and Abbadie L. 1995. Savannas, woodlands and dry forests in Africa.
A review. In: Bullock, S.H, Monney, H.A. and Medina E. (Eds.) Seasonally Dry
Tropical Forests. Cambridge University Press. New York. pp. 64-92.
Metcalfe, D.J., Sanchez, A.C., Curran, P.M., Haga, J.R., Kija, H.K., Kleynhans, E.J., Kopp, M.,
Korogone, S.U., Madindou, I.R., Minlend, A., Ndagijimana, F., Ndlovu, T.C.,
Acheampong, E.N., Nuttman, C., Olsson, K.H., Rahrinjanahary, D., Razafimanahaka,
H.J., Razafindramanana, J., Rykowska, Z., Sachdev, R., Simpson, L., and Trevelyan,
R. 2007. Distribution and population structure of Adansonia rubrostipa in dry
deciduous forest in western Madagascar. African Journal of Ecology 45: 464–468.
Michalet, R., Brooker, R.W., Cavieres, L.A., Kikvidze, Z., Lortie, C.J., Pugnaire, F.J., Valente-
Banuet, A., and Callaway, R.M. 2006. Do biotic interactions shape both sides of the
humped-back model of species richness in plant communities? Ecology Letters 9:
767–773.
Miles, L., Newton, A.C., DeFries, R.S., Ravilios, C., May, I., Blyth, S., Kapos, V., and Gordon J.
E. 2006. A global overview of the conservation status of tropical dry forests. Journal
of Biogeography 33: 491–505.
Mittermeier, R.A., Meyers, N. and Mittermeier, C.G. (Eds.). 1999. Hotspots. Earth’s
Biologically Richest and Most Endangered Terrestrial Ecoregions. Cemex,
Conservation International, Mexico City.
Molino, J. F. and Sabatier, D. 2001. Tree diversity in tropical rain forests: a validation of the
intermediate disturbance hypothesis. Science 294: 1702–1704.
Mooney, H. A., Bullock, S. H. and Medina, E. 1995. Introduction. In: Bullock, S. H. Mooney,
H.A. and Medina, E. (eds.). Seasonally dry tropical forests. Cambridge: Cambridge
University Press. pp. 1–8.,
Murphy, P. G. & A. E. Lugo. 1990. Dry forests of the tropics and subtropics: Guánica Forest in
context. Acta Cientifica 4: 15-24.
Murphy, P. G. & A. E. Lugo. 1995. Dry forests of Central America and the Caribbean. In
Bullock, S. H., Mooney, H. A. and Medina, E. (eds). Seasonally dry tropical forests.
Cambridge University, Press, Cambridge. pp. 9 - 34
Murphy, P. G. & A.E. Lugo. 1986a. Ecology of tropical dry forest. Annual Review of Ecology
and Systematics 17: 67-88.
Murphy, P. G. and A. E. Lugo. 1986b. Structure and biomass of a subtropical dry forest in Puerto
Rico. Biotropica 18: 89-96.
122
Nangendo, G., Bongers, F., ter Steege, H. and de Gier, A. 2010. Vegetation variation in forest-
woodland-savannah mosaics in Uganda and its implications for conservation. In: F.
Bongers & T. Tennigkeit (eds.). Degraded Forests in Eastern Africa: Management and
Restoration. Earthscan Ltd. London, UK. pp. 153-170.
Nath, D. C., Dattaraja, H. S., Suresh, H. S., Joshi, N. V., and Sukumar, R. 2006. Patterns of tree
growth in relation to environmental variability in the tropical dry deciduous forest at
Mudumalai, southern India. Journal of Biosciences 31: 651 – 669.
National Conservation Strategy Secretariat (NCSS), 1993. National Conservation Strategy, vol.
1. National Policy on the Resources Base, its Utilization and Planning for
Sustainability, Addis Ababa, Ethiopia.
Nault, A., and D. Gagnon. 1993. Ramet demography of Allium tricoccum, a spring ephemeral,
perennial forest herb. Journal of Ecology 81: 101–119.
Neels, S. 1996. Yield, sustainable harvest and cultural uses of resin from the Copal tree (Protium
copal; BURSERACEAE) in the Carmelita community forest concession, Peten,
Guatemala. MSc. Thesis, The University of British.
Negussie, A. 2008. The damage of long horn beetle (Idactus spinipennis Gahan) on dry
deciduous Boswellia woodlands in central and western Tigray, Ethiopia. MSc thesis,
Mekelle University.
Nepstad, D. & S. Schwartzman (eds.). 1992. Non-timber products from tropical forests:
Evaluation of a conservation and development strategy. Advances in Economic
Botany 9: 23-32. New York Botanical Garden, USA.
Nussinovitch, A. 2010. Plant gum exudates of the World. Sources, distribution, properties, and
applications. CRC Press, Florida.
O' Brien, E. M. 1993. Climatic gradients in woody plant species richness: towards an explanation
based on an analysis of southern Africa's woody flora. Journal of Biogeography 20:
181-198.
O’Connor, T. G. 1993. The influence of rainfall and grazing on the demography of some African
savanna grasses: a matrix modeling approach. Journal of Applied Ecology 30(1): 119–
132.
Ogbazghi, W. 2001. The distribution and regeneration of Boswellia papyrifera (Del.) Hochst. in
Eritrea. PhD thesis, Wageningen University.
Ogbazghi, W., Bongers, F., Rijkers, T., and Wessel, M. 2006a. Population structure and
morphology of the frankincense tree Boswellia papyrifera along an altitude gradient in
Eritrea. Journal of Drylands 1: 85–94.
123
Ogbazghi, W., Rijkers, T., Wessel, M. and Bongers, F. 2006b. Distribution of the frankincense
tree Boswellia papyrifera in Eritrea: The role of environment and land use. Journal of
Biogeography 33: 524-535.
Olmstead, I., and E. R. Alvarez-Buylla. 1995. Sustainable harvesting of tropical trees:
demography and matrix models of two palm species in Mexico. Ecological
Applications 5: 484–500.
Oostermeijer, J. G. B., M. L. Brugmann, E. R. DeBoer, and H. C. M. DenNijs. 1996. Temporal
and spatial variation in the demography of Gentiana pneumonanthe, a rare perennial
herb. Journal of Ecology 84: 153–166.
Pearce, D.W. and Turner, R.K. 1990. Economics of Natural Resources and the Environment,
Harvester Wheatsheaf, New York and London.
Peres, C. A., C. Baider, P. A. Zuidema, L. H. O. Wadt, .K. A. Kainer, D. A. P. Gomes-Silva, R.
P. Salomao, L. L. Simoes, E. R. N. Franciosi, F. C. Valverde, R. Gribel, G. H.
Shepard Jr, M. Kanashiro, P. Coventry, D. W. Yu, A. R. Watkinson and R. P.
Freckleton. 2003. Demographic threats to the sustainability of Brazil nut exploitation.
Science 302: 2112 – 2114.
Peters, C.M. 1996. The ecology and management of non-timber forest resources. World Bank
technical paper No 322.Washington DC. 157 pp.
Pinard, M. 1993. Impacts of stem harvesting on populations of Iriartea deltoidea (Palmae) in an
extractive reserve in Acre, Brazil. Biotropica 25(1): 2–14.
Pinard, M. A. and Putz, F. E. 1992. Population matrix models and palm resource management.
Bulletin de l’Institut Franc¸ ais d’Etudes Andines 21: 637–649.
Plotkin, M.J. and Famolare, L.M. (eds). 1992. Sustainable harvest and marketing of rain forest
products. Conservation International, Island Press, Washington DC, USA.
Poorter, L., Bongers, F., Van Rompaey, R.S.A.R. and De Klerk, M. 1996. Regeneration of
canopy tree species at five sites in West African moist forest. Forest Ecology and
Management, 84: 61-69.
Radda, E. A. & Luukkanen, O. 2006. Adaptive genetic variation in water-use efficiency and gum
yield in Acacia senegal provenances grown on clay soil in the Blue Nile region,
Sudan. Forest Ecology and Management 226: 219 – 229.
Ray, G. J. and Brown, B. J. 1994. Seed Ecology of woody species in a Caribbean dry forest.
Restoration Ecology 2 : 156-163.
124
Rice, K. J., Steven L., Byer, M. W. and Brown, J. R. 2004. Patterns of tree dieback in
Queensland, Australia: the importance of drought stress and the role of resistance to
cavitation. Oecologia 139: 190-198
Rijkers, T., Ogbazghi, W., Wessel, M. and Bongers, F. 2006. The effect of tapping for
frankincense on sexual reproduction in Boswellia papyrifera. Journal of Applied
Ecology, 43, 1188-1195.
Rikhari, H. C., Palni, L. M. S., Sharma, S. and Nandi, K. 1998. Himalayan yew: stand structure,
canopy damage, regeneration and conservation strategy. Environmental Conservation
25: 334 – 341.
Rist, L., Kaiser-Bunburyb, C. N., Fleischer-Dogleyd, F., Edwardsb, P. Bunburyd, N. and
Ghazoulc, J. 2010. Sustainable harvesting of coco de mer, Lodoicea maldivica, in the
Vallée de Mai, Seychelles. Forest Ecology and Management 260: 2224 - 2231
Rodrigues, K.C.S., Azevedo, P.C.N., Sobreiro, L.E., Pelissari, P. and Fett- Neto, A.G. 2008.
Oleoresin yield of Pinus elliottii plantations in a subtropical climate: effect of tree
diameter, wound shape and concentration of active adjuvants in resin stimulating
paste. Industrial Crops and Products 27: 322 -327.
Ros-Tonen, M. A. F. 2000. The role of non-timber forest products in sustainable tropical forest
management. Holz als Roh- und Werkstoff 58: 196-201.
Ros-Tonen, M., W. Dijkman and E. L. van Bueren. 1995. Commercial and Sustainable
Extraction of Non-timber Forest Products. Towards a Policy and Management
Oriented Research Strategy. The Tropenbos Foundation, Wageningen.
Russo, S. E., Davies, S. J., King, D. A. and Tan, S. 2005. Soil related performance variation and
distributions of tree species in a Bornean rain forest. Journal of ecology 93: 879 – 889.
Sagar, A., Raghubanshi, S., and Singh, J.S. 2003. Tree species composition, dispersion and
diversity along a disturbance gradient in a dry tropical forest region of India. Forest
Ecology and Management 186: 61–71.
Seghieri, J., Vescovo A., Padel K., Soubie R., Arjounin M., Boulain N., de Rosnay P., Galle S.,
Gosset M., Mouctar A.H., Peugeot C., and Timouk F. 2009 Relationships between
climate, soil moisture and phenology of the woody cover in two sites located along the
West African latitudinal gradient. Journal of Hydrology: 375, 78-89.
Sethuraj, M.R., and Mathew, N.M. 1992. Natural rubber: biology, cultivation and technology in
Crop science. Elsevier, Amsterdam.
Shorrocks, B. 2007. The Biology of African Savannahs. Oxford University Press Inc., New
York.
125
Silpi, U., Lacointe, A., Kasempsap, P., Thanysawanyangkura, S., Chantuma, P., Gohet, E.,
Musigamart, N., Clément, A., Améglio, T. and Thaler, P. 2007. Carbohydrate reserves
as a competing sink: Evidence from tapping rubber trees. Tree Physiology 27: 881-
889.
Silpi, U., Thaler, P., Kasemsap, P., Lacointe, A., Chantuma, A. Adam, B., Gohet, E.,
Thanisawanyangkura, S. & Ameglio, T. 2006. Effect of tapping activity on the
dynamics of radial growth of Hevea brasiliensis trees. Tree Physiology, 26, 1579 –
1587.
Silva, J. F., J. Raventos, H. Caswell, and M. C. Trevisan. 1991. Population responses to fire in a
tropical savanna grass, Andropogon semiberbis: a matrix model approach. Journal of
Ecology 79: 345–356.
Silvertown, J., Franco, M., Pisanty, I. and Mendoza, A. 1993. Comparative plant demography:
relative importance of life-cycle components to the finite rate of increase in woody and
herbaceous perennials. Journal of Ecology 81: 591 – 597.
Smith, G. C. and Trout, R. C. 1994. Using Leslie matrices to determine wild rabbit population
growth and the potential for control. Journal of Applied Ecology 31: 223 – 230.
Staver, A., Bond, W., Stock, W., Van Rensburg, W., and Waldram, M., 2009. Browsing and fire
interact to suppress tree density in an African savanna. Ecological Applications 19 (7):
1909–1919.
Sterck, F., Couralet, C., Nangendo, G., Wassie, A., Sahle, Y., Sass-Klaassen, U., Markesteijn, L.,
Bekele, T., Bongers, F., 2010. Juniperus procera (Cupressaceae) in Afromontane
Forests in Ethiopia: from tree growth and population dynamics to sustainable forest
use. In: Bongers, F., Tennigkeit, T. (Eds.), Degraded Forests in Eastern Africa:
Management and Restoration. Earthscan Ltd, London, UK. pp. 291–303.
Stevens, G. C. 1992. The elevational gradient in altitudinal range: an extension of Rapoport’s
latitudinal rule to altitude. American Naturalist 140, 893–911.
Sukumar, R., Suresh, H. S., Dattaraja, H. S., Srinidhi, S. & Nath, C. 2005. The dynamics of a
tropical dry forest in India: Climate, fire, elephants and the evolution of life-history
strategies. In: Hartley, S. (ed.) Biotic Interactions in the Tropics: Their role in the
maintenance of species diversity. Cambridge University Press, Cambridge. pp. 510-
529.
Suresh, H. S., Dattaraja, H. S. & Sukumar, R. 2010. Relationship between annual rainfall and
tree mortality in a tropical dry forest: Results of a 19-year study at Mudumalai,
Southern India. Forest Ecology and Management 259: 762-769.
126
Svenning, J. C. and Macia, M .J. 2002. Harvesting of Geonoma macrostachys Mart. leaves for
thatch: an exploration of sustainability. Forest Ecology and Management 167: 251–
262.
Swaine, M. D. 1992. Characteristics of dry forest in West Africa and the influence of fire.
Journal of Vegetation Science 3: 365-374.
Swaine, M. D., Lieberman, D. and Hall, J. B. 1990. Structure and dynamics of tropical dry forest
in Ghana. Vegetatio 88: 31–51.
Tadesse, W, Getachew, D. and Alia, R. 2007. Natural gum and resin bearing species of Ethiopia
and their potential applications. Investigación Agraria: Sistemas y Recursos Forestales
16(3): 211-221.
Tadesse, W., Teketay, W., Lemenih, M. and Fitwi, G . 2002. Country report for Ethiopia. In:
Chikamai, B. (ed.). Review and synthesis on the state of knowledge of Boswellia
species and commercialization of frankincense in the drylands of Eastern Africa.
Kenya Forestry Research Institute, Kenya.
Tamire, H. 1997. Desertification in Ethiopian highlands. RALA report No. 200. Norwegian
Church Aid, Addis Ababa, Ethiopia.
Tedla, S. and Lemma, K. 1998. Environmental Management in Ethiopia: Have the National
Conservation Plans Worked? OSSREA, Addis Ababa, Ethiopia.
Teketay, D. 2000. Vegetation types and forest fire management in Ethiopia. In: MOA, GTZ
(Eds.), Proceedings of the Round Table Conference on Integrated Forest Fire
Management in Ethiopia. Ministry of Agriculture (MOA) & Deutsche Gesellschaft fòr
Technische Zusammenarbeit (GTZ), Addis Ababa, Ethiopia, pp. 1–35.
Teketay, D., Lemenih, M., Bekele, T., Yemshaw, Y., Feleke, S., Tadesse, W., Moges, Y., Hunde,
T. & Nigussie, D. 2010. Forest resources and challenges of sustainable forest
management and conservation in Ethiopia. In: Bongers, F. & T. Tennigkeit (eds.).
Degraded forests in eastern Africa: Management and restoration. Earthscan, London,
UK. pp. 19 – 64.
ter Steege, H., S. Sabatier, H. Castellanos, T. van Andel, J.Duivenvoorden, A. A. de Oliveira, R.
C. Ek, R. Lilwah, P.J. M. Maas, and S. A. Mori. 2000. An analysis of Amazonian
floristic composition, including those of the Guiana Shield. Journal of Tropical
Ecology 16: 801–828.
Tesfaye, G., Teketay, D., and Fetene, M., 2004. Regeneration of fourteen tree species in Harenna
forest, southeastern Ethiopia. Flora 197: 461–474.

127
Tesfaye, G., Teketay, D., Fetene, M., and Beck, E., 2010. Regeneration of seven indigenous tree
species in a dry Afromontane for southern Ethiopia. Flora 205: 135–143.
Tewolde, E. 1991. Diversity of Ethiopian Flora. In: Engels, J. M. M., Hawkes, J. G. and Worede,
M. (eds.). Plant Genetic Resources of Ethiopia. Cambridge University Press, UK, pp.
75 – 81.
Thomas, G.W. 1982. Exchangeable cations. In: Klute, A. (Ed.), Methods of Soil Analysis. Part 2.
Agron. Monogr. 9. , 2nd ed. ASA and SSSA, Madison, WI, pp. 159–165.
Ticktin, T. 2004. The ecological implications of harvesting non-timber forest products. Journal
of Applied Ecology 41: 11-21.
Tilman, D. 1982. Resource Competition and Community Structure. Princeton University Press,
Princeton
Tingey, D. T., Manning, M., Grothaus, L. C. & Burns, W. F. 1980. Influence of light and
temperature on monoterpene emission rates from Slash Pine. Plant Physiology 65:
797- 801.
Toledo M., Poorter, L. Peña-Claros, M., Alarcon, A., Balcazar, J., Leaño, C., Licona, J. C.,
Llanque, O., Vroomans, V., Zuidema, P. and Bongers, F. 2011. Climate is a stronger
driver of tree and forest growth rates than soil and disturbance. Journal of Ecology:
doi: 10.1111/j.1365-2745.2010.01741.x.
Trapp, S. & Croteau, R. 2001. Defensive resin biosynthesis in conifers. Annu. Rev. Plant
Physiol. Plant Molecular Biology 52: 689 - 724.
Valdez-Hernández, M., Andrade, J. L., Jackson, P. C. and Rebolledo-Vieyra., M. 2009.
Phenology of five tree species of a tropical dry forest in Yucatan, Mexico: effects of
environmental and physiological factors. Plant and soil 329: 155 – 171.
Vavrek, M. C., J. B. McGraw, and H. S. Yang. 1997. Within population variation in demography
of Taraxacum officinale: season- and size-dependent survival, growth, and
reproduction. Journal of Ecology 85: 277–287.
Vázquez, J., and Givnish, T. 1998. Altitudinal gradients in tropical forest composition, structure,
and diversity in the Sierra de Manantlán. Journal of Ecology 86 (6): 999–1020.
Verwer, C., M. Pena-Claros, D. van der Staak, K. Ohlson-Kiehn, and F. J. Sterck. 2008.
Silviculture enhances the recovery of overexploited mahogany Swietenia macrophylla.
Journal of Applied Ecology 45: 1770–1779.
Vieira, S., Barbosa de Camargo,P., Selhorst, D., da Silva, R. Hutyra, L. Chambers, J. Q., Brown,
I F., Higuchi, N., dos Santos, J., Wofsy, S. C., Trumbore, S. E. and Martinelli, L. A.
128
2004. Forest structure and carbon dynamics in Amazonian tropical rain forests.
Oecologia 140: 468 – 479.
Villegas, Z., Peña-Claros, M., Mostacedo, B., Alarcón, A., Licona, J. C., Leaño, C., Pariona, W.
and Choque, U. 2009. Silvicultural treatments enhance growth rates of future crop
trees in a tropical dry forest. Forest Ecology and Management 258: 971 – 977.
Vollesen, K. 1989. Burseraceae. In: Hedberg, I., and Edwards, S. (eds.) Flora of Ethiopia,
volume 3. the National Herbarium, Addis Ababa University, Ethiopia and The
Department of Systematic Botany, Uppsala University, Sweden, pp. 442-47.
Waite, S. & Hutchings, M.J. 1991. The effects of different management regimes on the
population dynamics of Ophrys sphegodes: analysis and description using matrix
models. Population Ecology of Terrestrial Orchids (eds T.C.E. Wells, J. H. Willems),
pp. 161–175. SPB Publishing, The Hague, the Netherlands.
Walker, B.H. (1993) Rangeland ecology: Understanding and managing change. Ambio 22: 80-
87.
Walter, H, 1971. Ecology of Tropical and Subtropical vegetation. Van Nostrand Reinhold Co.,
New York.
Walter, J., Charon, J. Marpeau A. and Launay, J. 1989. Effects of wounding on the terpene
content of twigs of maritime pine (Pinus pinaster Ait.). Trees 4: 210 – 219.
Wang, Z., Calderon, M.M. & Caradang, M.G. 2006. Effects of resin tapping on optimal rotation
age of pine plantation. Journal of Forest Economics 11: 245–260.
Wassie, A., Bongers, F., Sterck, F.J. & Teketay, D. 2010a. Church forests – relics of dry
afromontane forests of Northern Ethiopia: Opportunities and challenges for
conservation and restauration. In: Bongers, F. & T. Tennigkeit (eds.). Degraded
Forests in Eastern Africa: Management and Restoration. Earthscan Ltd. London, UK,
pp. 123-132.
Wassie, A., Sterck, F., and Bongers, F. 2010b. Species and structural diversity of church forests
in a fragmented Ethiopian highland landscape. Journal of Vegetation Science 21: 938–
948.
Wekesa, C., Makenzi, P., Chikamai, B.N., Lelon, J.K., Luvanda, A.M. & Muga, M. 2009. Gum
arabic yield in different varieties of Acacia senegal (L.) Willd in Kenya. African
Journal of Science 3(11): 263 - 276.
West, C. J. 1995. Sustainability of Beilschmiedia tawa-dominated forest in New Zealand—
population predictions based on transition matrix model analysis. Australian Journal of
Botany 43(1): 51–71.
129
White, F. 1983. The vegetation of Africa. A descriptive memoir to accompany the
UNESCO/AETFAT/UNSO Vegetation map of Africa. United Nations, UNESCO,
Switzerland.
Wiegand, K., Jeltsch, F. & Ward, D. 1999. Analysis of the population dynamics of Acacia trees
in the Negev desert, Israel with a spatially-explicit computer simulation model.
Ecological Modelling 117: 203-224.
Wiegand, K., Jeltsch, F. & Ward, D. 2004. Minimum recruitment frequency in plants with
episodic recruitment. Oecologia 141: 363-372.
Wink, M. 1988. Plant breeding: importance of plant secondary metabolites for protection against
pathogens and herbivores. Theor Appl Genet 75: 225-233.
Wollenberg. E. and Ingles, A. (eds.). 1998. Incomes from the forest. Methods for the
development and conservation of forest products for local communities. Bogor,
Indonesia: CIFOR.
Yates, C.J., Norton, D.A., and Hobbes, R.J. 2000. Grazing effects on plant cover, soil and
microclimate in fragmented woodlands in south western Australia: implications for
restoration. Austral Ecology 25: 36–47.
Zida, D., L. Sawadogo, M. Tigabu, D. Tiveau & P.C. Oden. 2007. Dynamics of sapling
population in savanna woodlands of Burkina Faso subjected to grazing, early fire and
selective tree cutting for a decade. Forest Ecology and Management 243: 102- 115.
Zuidema, P. A., Jongejans, E., Chien, P. D., During, H. J. and Schieving, F. 2010. Integral
Projection Models for trees: a new parameterization method and a validation of model
output. Journal of Ecology 98: 345-355.
Zuidema, P.A. 2000. Demography of exploited tree species in the Bolivian Amazon. PhD Thesis.
PROMAB Scientific Series No. 2. Ultrecht University, Ultrecht, the Netherlands.


131
Summary Tropical dry forests cover large areas in the tropics, and 14% of the total African surface. Dry
land areas of Ethiopia amount to 71% of the Ethiopian landmass, and are dominated by the
Combretum–Terminalia and Acacia–Commiphora woodland types. Several tree and shrub
species that inhabit these woodlands yield economically valuable products such as gum,
frankincense (resin) and myrrh. Boswellia papyrifera provides the widely traded frankincense,
which accounts for > 80% of the export revenues that the country is earning from gum and resin
resources. Unfortunately, the Ethiopian dry woodlands and the B. papyrifera populations are
disappearing rapidly due to the combined effect of over-harvesting gums and resins, overgrazing
by livestock, recurrent fires and excessive wood harvesting. The lack of small saplings in
populations of Boswellia suggests that these populations are not sustained for the future. The
main objective of this thesis was to determine the diversity and production patterns in Ethiopian
dry woodlands and the regeneration status of B. papyrifera in these woodlands. Moreover, the
effects of climate, soil, harvesting and grazing for the population dynamics of B. papyrifera were
evaluated. The following main research questions are addressed: (1) how do environmental
conditions affect the tree/shrub species richness and productions of Ethiopian woodlands? (2)
how do tree size and tapping regime influence the frankincense production by B. papyrifera
trees? (3) how do the population dynamics of B. papyrifera vary across sites characterized by
different environmental conditions, resin tapping regimes, and grazing levels? (4) What are the
most important bottlenecks in the life cycle of the trees for achieving sustainable populations?
Tree species richness, diversity and production of dry woodlands as well as the production of
frankincense by B. papyrifera was studied in the lowlands of Metema and the highlands of
Abergelle, both in northern Ethiopia. The two study sites also differ in soil conditions and
Metema has a longer wet season and higher annual rainfall than Abergelle. Soil samples were
collected and analysed. In total eighteen 1.6-2.0-ha permanent plots were selected and
established in August 2007, i.e. 12 plots in Metema and 6 plots in Abergelle. The plots were
distributed along gradients in soil conditions. For each plot, all individuals >1.5 m in height were
identified, tagged and measured for diameter at breast height (1.3 m height from the ground) and
for total height to the top of the crown. All B. papyrifera individual were re-measured twice per
year between August 2007 and 2009. For a subsample, fruit production was recorded. Matrix
population models were used to analyse the population dynamics of the B. papyrifera
populations.

132
In chapter 2, I address the question how climate and soil conditions affect woody plant species
richness and production in Ethiopian woodlands. A total of 36 and 22 tree and shrub species
representing 20 and 9 families were recorded in Metema and Abergelle woodlands, respectively.
The most dominant plant families were the Burseraceae, Fabaceae, Combretaceae and
Anacardiaceae. The vegetation at both sites were dominated by a single species, i.e. B.
papyrifera. Metema, i.e. the site with a longer wet season, was characterized by a higher species
richness, diversity and production than Abergelle. The production of woodlands increased with
soil clay content and soil depth, but species richness was unaffected by soil conditions. This
suggests that climate driven constraints (wet season length) and not soil conditions set the limits
to species richness. Tree size distributions of the communities showed bi-modal distributions
with relatively large numbers of individuals in the lowest and in the middle diameter size classes.
The size distribution for B. papyrifera was hump-shaped without individuals in the lowest
classes. Such distributions result from the disturbance history and indicate that many populations
are locally disappearing.
In chapter 3 I determine the factors that affect frankincense production by B. papyrifera trees.
Frankincense production by B. papyrifera increased with tree size, tapping intensity and tapping
frequency. The increase in production, however, levelled-off beyond 20 cm diameter, 9 spots
(tapping intensity) and 10 tapping rounds. The result of this particular study suggests that tapping
for frankincense production at higher intensity and frequency doesn’t pay off. Instead, such high
tapping intensities and frequencies might weaken the tapped trees and make them more sensitive
to diseases and insect attack.
In Chapter 4 I investigate the impact of tapping for frankincense production on the vital rates and
growth of B. papyrifera populations. Additionally, I analysed the effects of human interventions
on the future of B. papyrifera populations. Grazing and tapping had no influence on the
establishment and survival of seedlings. Population matrix model output showed that tapped
populations had a slightly higher population growth rate than untapped populations suggesting
that tapping is not the major driving force for the rapid decrease of B. papyrifera populations.
Human interventions that target an increase in seedling regeneration and allowing the growth of
seedlings to sapling stage are not sufficient to increase the population growth to sustainable
levels under the current conditions. Rather, the management actions should also reduce the
current high adult mortality by 75% to maintain B. papyrifera populations.
133
In Chapter 5, I analysed the effects of soil conditions on the vital rates and growth of B.
papyrifera populations. Growth rate, survival rate and fruiting probability of B. papyrifera
population vary across sites, but no correlations were found between vital rates and physical or
chemical soil variables, or between vital rates and the abundance, basal area and stand volume.
Population growth rates of the Metema 12 populations ranged from 0.86 to 0.98 suggesting that
B. papyrifera populations are declining in all studied plots. Matrix models also indicated that the
contribution of survival of adult individuals (> 10 cm DBH) to the population growth rate was
higher than the contribution of other stages and vital rates. This suggest that survival of adult
individuals is crucial for the growth and maintenance of B. papyrifera populations. These
findings contradict earlier reports that considered lack of regeneration as a single major
bottleneck for the maintenance and growth of B. papyrifera populations. Reducing mortality of
adult individuals and restoring sapling establishment are both urgently needed to maintain B.
papyrifera populations.
In conclusion, climate (wet season length) is the driving factor for species richness and
production of Ethiopian dry woodlands. Soil conditions affect production but not species
richness. Tree size, tapping intensity and frequency are the main factors that determine
frankincense production by B. papyrifera. B. papyrifera populations are decreasing in all studied
plots irrespective of the variation in soil conditions and management regimes. Tapping had no
negative effect on vital rates nor on population growth rates indicating that other factors might be
responsible for the decrease of the populations. Despite a lack of saplings in the populations, the
survival rate of adult individuals is the most critical bottleneck for the maintenance of the
populations. B. papyrifera is expected to locally disappear in the near future if the current
situation continues. Increasing regeneration and reducing mortality rates of juvenile and adult
individuals should both be achieved to maintain B. papyrifera populations and frankincense
production for the future.

135
Samenvatting
Tropische droge bossen domineren in grote delen van de tropen en bedekken 14% van het
Afrikaanse landoppervlak en 71% van Ethiopië. In Ethiopië domineren de Combretum-
Terminalia en Acacia-Commiphora bostypen. Verschillende inheemse boom- en struik- soorten
leveren er economisch waardevolle producten. Boswellia papyrifera levert er hars dat als basis
dient voor wierook. Wierook levert >80% van de export inkomsten uit rubber en hars in
Ethiopië. Het areaal van de Ethiopisch droge bossen en de populaties van B. papyrifera nemen
echter snel af als gevolg van de overexploitatie van hars, de overbegrazing door vee, en het
frequenter voorkomen van bosbranden en houtkap. Jonge boompjes van Boswellia komen
nauwelijks nog voor, en het lijkt erop dat de populaties niet duurzaam zijn.
De doelstellingen van dit proefschrift zijn de beschrijving van de diversiteit en productie van
deze droge bossen van Ethiopië, het beschrijven van de status van de populaties van B.
papyrifera en van de jonge bomen in het bijzonder, en het analyseren van de effecten van
klimaat, bodem, harsoogst- en begrazing op de dynamiek van deze soort. De vragen zijn: (1) Wat
zijn de effecten van klimaat en bodem op de rijkdom van boom- en struik- soorten en de
productie in Ethiopisch droge bossen? (2) Hoe beïnvloedt de boomgrootte en het tapprotocol de
productie van wierook door B. papyrifera bomen? (3) Hoe varieert de populatie dynamiek tussen
gebieden die verschillen in klimaat, bodem, begrazing en tapprotocol? (4) Wat zijn de
belangrijkste fases (“bottlenecks”) in de levenscyclus die het voorbestaan van de populaties
bedreigen?
Het onderzoek is verricht in populaties in de hooglanden van Abergelle en de laaglanden van
Metema. Metema heeft ook een natter klimaat en langer regenseizoen dan Abergelle, en de
verschillen in bodemcondities zijn ook onderzocht. In totaal zijn er 18 1.6-2.0 ha- permanente
onderzoek locaties uitgezet, 12 in Metema en 6 in Abergelle. Deze locaties zijn gesitueerd langs
een bodemgradiënt. Voor elk plot zijn alle individuen (hoger dan 1.5 m) geïdentificeerd, gelabeld
en gemeten op diameter op borsthoogte (1.3 meter boven de grond, ‘DBH’) en totale hoogte.
136
Voor steekproeven van bomen is ook de reproductie (bloeiwijzen, vruchten en zaden) bepaald,
en in subplots zijn alle kleinere individuen gevolgd. Alle individuen van B. papyrifera zijn twee
keer per jaar gemeten tussen augustus 2007 en augustus 2009. Matrix populatie modellen zijn
gebruikt om de populatie dynamiek van B. papyrifera populaties te analyseren.
In hoofdstuk 2 ga ik in op de vraag hoe klimaat en bodemgesteldheid de rijkdom van
boomsoorten en de productie beïnvloeden in Ethiopisch droge bossen. In totaal zijn er 36 en 22
boom- en struik- soorten geregistreerd die 20 en 9 families vertegenwoordigen, respectievelijk in
Metema en Abergelle. De dominante plantenfamilies zijn de Fabaceae, Burseraceae,
Combretaceae en Anacardiaceae. Vegetaties op beide locaties worden door B. papyrifera
gedomineerd. De bossen van Metema, met het langste regenseizoen, hebben een hogere
soortenrijkdom, diversiteit en productie dan Abergelle. De productie van bossen neemt toe met
kleigehalte en bodemdiepte, maar soortenrijkdom wordt niet door de bodem beïnvloed. De
boomgrootte verdeling voor B. papyrifera laat zien dat er geen kleine individuen voorkomen.
Deze verdeling duidt op verstoringen in het verleden en op het risico dat populaties gaan
verdwijnen in de toekomst.
In hoofdstuk 3 bepaal ik de factoren die de productie van wierook door B. papyrifera
beïnvloeden. Wierook productie door B. papyrifera neemt toe met boomgrootte, met de
intensiteit van het tappen van wierook en de frequentie van het tappen. De toename in productie
stabiliseert echter boven een stamdiameter van 20 cm. De productie neemt niet meer toe bij meer
dan 9 littekens om te tappen, en vlakt af bij meer dan 10 taprondes per jaar. De resultaten van
deze studie suggereren hoe de tapschade binnen de perken gehouden kan worden, terwijl de
productie op niveau blijft. We kunnen echter niet uitsluiten dat ook deze lagere tapintensiteiten
de bomen verzwakt en bloot stelt aan ziektes en insectenaanvallen.
In hoofdstuk 4 onderzoek ik de invloed van het wierook tappen van B. papyrifera op de
populatie dynamiek. Begrazing en tappen lijken nauwelijks de vestiging of overleving van
zaailingen te beïnvloeden. Populatie modellen geven aan dat getapte populaties van B. papyrifera

137
iets hogere groei hebben dan niet getapte populaties. De simulaties laten ook zien dat alle
populaties binnen minder dan 2 decennia halveren. Om deze situatie te keren zou de regeneratie
van zaailingen en de groei van zaailingen tot kleine boompjes bespoedigd moeten worden, en
moet de hoge sterfte bij volwassen bomen terug gebracht worden.
In hoofdstuk 5 analyseer ik het effect van bodemgesteldheid op de dynamiek van de populaties
van B. papyrifera in Metema. Er werden echter geen effecten gevonden. De groei van de 12
onderzochte populaties in Metema varieerde tussen de 0.86 en 0.98. Dit suggereert dat de
populaties geleidelijk aan afnemen in dichtheid en wierookproductie. De populaties blijken
vooral zeer gevoelig te zijn voor de hoge sterfte van de volwassen bomen. Dat wijst erop dat de
overleving van de volwassen bomen, naast de regeneratie van zaailingen, de kritische bottleneck
is voor het behoud en de groei van B. papyrifera populaties.
Het klimaat beïnvloedt de soortenrijkdom en productie van de Ethiopisch droge bossen, en
bodemgesteldheid heeft invloed op de productie maar niet op soortenrijkdom. Boom grootte,
tapintensiteit en tapfrequentie zijn de belangrijke factoren die de productie van wierook door B.
papyrifera bepalen. De populaties van B. papyrifera dunnen uit in alle onderzoeklocaties,
ongeacht de verscheidenheid in bodemgesteldheid en beheer. Tappen heeft geen aantoonbare
effecten op de populatie groei, wat aangeeft dat andere factoren verantwoordelijk kunnen zijn
voor de afname van de populaties. B. papyrifera populaties zullen waarschijnlijk binnenkort
verdwijnen wanneer de huidige situatie aanhoudt. Verbetering van de aanwas van jonge bomen
en het drastisch verminderen van sterfte bij jonge en volwassen individuen zijn noodzakelijk om
B. papyrifera populaties en de wierook productie te behouden voor de toekomst.


139
Acknowledgments To almighty GOD: for manifold blessings, guidance and protection up to now and in the future.
This dissertation would not have been in this shape without the hearty contribution of my
promoter Professor Frans Bongers. He has patiently advised and guided me, during writing the
proposal, field work, data analysis and thesis writing and gave me continuous encouragement,
meticulous inputs and constructive criticism. Without his assistance this thesis wouldn’t be
completed. I would also like to thank him for giving me the chance to visit several interesting
conferences. I learned a lot during this time and I am convinced that this knowledge will help me
in the future. I will also always remember the warm hospitality given by his family when I was
invited to their house at different occasions. I would also like to express my sincere gratitude to
my co–promoter and daily supervisor Dr. Frank Sterck for his guidance and support in every
stage of my PhD program. He forwarded precious comments and suggestions that helped me to
improve the thesis. He showed me different statistical software and programs. Thank you for
your great help. I am very grateful to my supervisor Dr. Pieter Zuidema for his scientific advice,
particularly for teaching and assisting me about matrix population models. I am also indebted to
my local supervisors Dr. Kindeya Gebrehiwot and Dr. Tesfaye Bekele who gave me invaluable
comments and suggestions during field work. Special thanks are due to Dr. Demel Teketay for
his input, support and encouragement at various stages of my carrier and this PhD study.
I also wish to extend my thanks to the staff members and PhD students at the Forest Ecology and
Forest Management Group, Wageningen University. I would like to thank all the staff: Frits
Mohren, Lourens Poorter, Jan den Ouden, Leo Goudzwaard, Ute Sass-Klaassen, Marielos Pena
Claros, Ellen Wilderink, Joke Jansen, Hans Jansen, Hans Polman and Patrick Jansen. And all
students: Corneille Ewango, Marisol Toledo, Geovana Carreno, Lars Markesteijn, Paul Copini,
Motuma Tolera, Emiru Birhane, Tefera Mengistu, Addisalem Bekele, Gabriel Muturi, Jean
Damascene, Cesar Perez-Cruzdo, Alemayehu Wassie, and Gustavo Schwartz. This thesis is a
product of the teachings and exchange of scientific ideas with staff members and PhD student at

140
Forest Ecology and Forest Management Group. I would like also to thank the members of the
FRAME team: Prof. Frans Bongers, Dr. Frank Sterck, Dr. Freerk Wiersum, Dr. Pieter Zuidema,
Prof. Thom Kuyper, Prof. Bas Arts, Prof. Masresha Fetene, Dr. Tesfaye Bekele, Dr. Kindeya
Gebrehiwot, Dr. Wubalem Tadesse, Dr. Mulugeta Lemenih, Teshale Habebo, Atkilt Girma,
Emiru Hizikias, Tefera Mengistu, Dr. Niels Anten, Prof. Andrew Skidmore and Dr. de Bie. I am
grateful for your input and assistance. It was a pleasure to work with all these people and to
benefit from their knowledge. I would like to show my gratitude to Mesfin Tilahun (Mekele
University) for his assistance in data collection and field work assistance at Abergelle.
During my study, I got support and encouragement from many organizations and people. I would
like to express my deepest gratitude to the Forestry Research Center of Ethiopian Institute of
Agriculture for their support in getting a field car and allowing me to use the laboratory facilities.
In particular I thank Dr. Alemu Gezahigne and the laboratory technicians Amelework Zenebe,
Tiruye Tesfa, Etetu Maruta, Saba Aliye, Yeshi Ketema, Bilhatu Dirar, Mesfin Woji for their
support in a number of ways. Thanks also go to staff of the Forestry Research Center working at
the Seed Processing Unit: Kebebush and Ayelech and their colleagues for their help in
processing seeds of Boswellia papyrifera.
I thank the people of the North Gondar Department of Agriculture, Office of Food Security,
Sustainable Resources Management Program in North Gondar (SRMPNG), Natural Gum
Processing and Marketing Enterprise (Gondar Branch Office), Gondar Soil Research Center, the
Amhara Regional Agricultural Research Institute (ARARI) and Mekelle University for providing
a field car, green house, laboratory and laboratory facilities. In particular I thank Ato Teshome
Mulu Head of SRMPNG, who provided me a field car and covered associated costs. I also thank
Emiru Birhane for his special effort to get a field car. I also wish to acknowledge the Metema
and Tanqua Abergelle Woreda Offices of Agriculture for their help in getting access to the
studied vegetation resources. I thank Meseret, Abel, Nurhussien, Shumet Gobeze of the Metema
Office of Agriculture, Eyob Sitotaw, Kibruyisfa Sisay of the Gondar Agricultural Research
Center, Abadi Tesfay and Redai Tadesse of Mekelle University, Asmamaw Alemu of the

141
University of Gondar, and Tatek Dejene and Bezuayehu of ARARI. I also acknowledge the Msc
students Yasmijn van der Knaap and Peter Groenendijk for their support during data collection. I
thank Elsabeth Birku for data encoding. My special thanks go to the staff of the Sustainable
Natural Resources Program in North Gondar, North Gondar Department of Agriculture, Forestry
Research Center and other colleagues and friends, too many to mention here, for their
encouragement and friendly welcome. I thank Emiru Birhane, W/o Atrkilt Bekele, Alemayehu
Negasa, Birhane Kidane, Degsaw Melak and Dagnew Yebeyen for their continuous support,
encouragement and for the interesting discussions we occasionally had on a wide range of issues.
I would like to thank the residents of the villages Lemlem Terara (Metema) and Jijike
(Abergelle), and the people I have worked with in the field. Almost all villagers were willing to
participate in the field work and helped me for example with fencing, measuring, counting fruits,
fruit collection, fire break construction and soil sample collections. Without their support my
field work would have been more difficult, if not impossible in some cases. I wish to thank Jemal
Seid and Dejene Yirdaw who reside at the Metema site in particular: their support like protecting
the permanent plots, organizing labourers, etc. were invaluable over the years, and I look forward
to continuing the collaboration with them in the future.
Last but not least, I wish to thank my family for their continuous support and concern about my
education. My particular thanks go to my mother (W/o Bosena Alemu) who did more than
enough in supporting me. Many thanks mom. Many thanks go to my brothers and sisters for their
encouragement, moral support and concerns about my well-being. I extend my gratitude to all
my extended family. My elder brother Ato Wondyifraw Eshete deserves special thanks, not only
for his unfailing helpfulness but also for taking care of my family while I was away. I thank his
family for making me feel at home while I was in Addis.
This thesis has been supported by NWO-WOTRO (Netherlands Organization for Scientific
Research- Science for Global Development) through the Integrated Program FRAME

142
(Frankincense, myrrh and gum Arabic: sustainable use of dry woodlands resources in Ethiopia),
grant nr W01.65.220.00. This support is gratefully acknowledged.
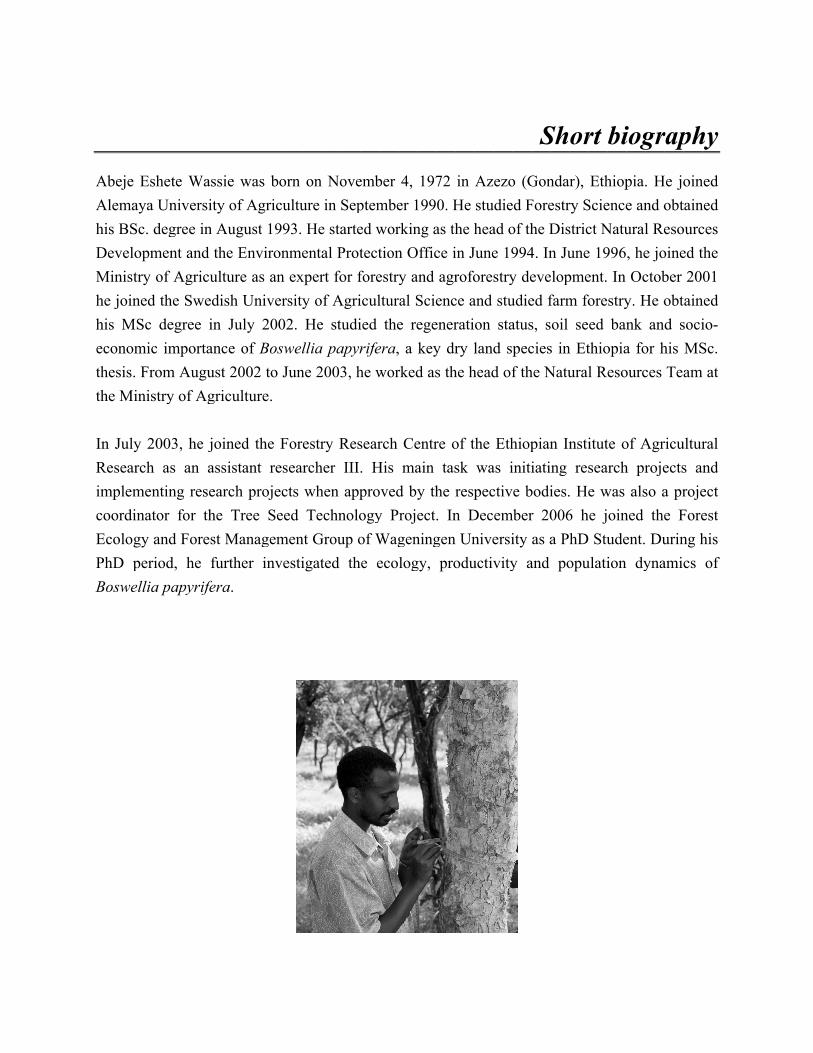
Ab
Ale
his
De
Mi
he
his
eco
the
the
In
Re
imp
coo
Eco
PhD
Bos
beje
ema
BS
vel
inis
join
M
ono
esis
e M
Jul
sea
plem
ordi
olo
D p
swe
e Es
aya
Sc.
lopm
try
ned
MSc
omic
. Fr
Minis
ly 2
arch
men
inat
gy
per
ellia
shet
a Un
deg
men
of
d th
de
c im
rom
stry
200
h as
ntin
tor
and
riod
a p
te W
nive
gree
nt a
Ag
he S
egre
mpo
m A
y of
3, h
s a
ng r
fo
d F
d, h
apy
Wa
ersi
e in
and
gric
Swe
ee
orta
Augu
f Ag
he j
an a
res
r th
ore
he
yrif
assie
ity
n Au
d the
cultu
edis
in
anc
ust
gric
join
assi
ear
he
est M
fur
fera
e w
of A
ugu
e E
ure
sh U
July
e o
200
cult
ned
ista
rch
Tre
Man
rthe
a.
was
Agr
ust
Envi
as
Uni
y 2
of B
02 t
ture
d th
ant
pro
ee
nag
er i
bo
ricu
199
iron
an
iver
200
Bosw
to J
e.
he F
res
ojec
See
gem
inve
orn
ultu
93.
nme
ex
rsity
02.
wel
Jun
Fore
sear
cts
ed
ment
esti
on
ure
He
enta
xper
y o
He
llia
ne 2
estr
rch
wh
Te
t G
igat
No
in S
e sta
al P
rt fo
f A
e stu
pa
2003
ry R
er
hen
chn
Grou
ted
ove
Sep
arte
Prot
or f
Agri
udi
apyr
3, h
Res
III.
app
nolo
up o
th
emb
ptem
ed w
tect
fore
icul
ied
rife
he w
sear
. H
pro
ogy
of W
e e
ber
mbe
wor
tion
estry
ltur
the
era,
wor
rch
His
oved
y P
Wag
eco
4,
er 1
rkin
n O
y a
ral S
e re
a
rked
Ce
ma
d by
roje
gen
log
197
199
ng a
Offic
and
Scie
ege
key
d as
entr
ain
y th
ect.
ning
gy,
72
0. H
as th
ce i
agr
enc
ener
y dr
s th
re o
tas
he r
. In
gen
pro
in
He
he h
in J
rofo
ce a
rati
ry l
he h
of t
sk
resp
n D
Un
odu
Az
stu
hea
June
ores
and
on
land
head
he
wa
pec
Dec
nive
uctiv
ezo
die
ad o
e 19
stry
stu
sta
d sp
d of
Eth
as i
ctiv
em
ersi
vity
o (G
ed F
of th
994
y de
udie
atus
pec
f th
hiop
initi
e b
mber
ity
y a
S
Gon
Fore
he D
4. In
eve
ed f
s, s
cies
he N
pian
iati
bodi
r 20
as a
and
Sh
ndar
estr
Dis
n Ju
elop
farm
oil
s in
Natu
n In
ng
ies.
006
a Ph
po
or
r),
ry S
stric
une
pme
m fo
se
n Et
ural
nsti
res
He
6 h
hD
opu
rt b
Eth
Scie
ct N
e 19
ent.
fore
ed
thio
l Re
itut
sea
e w
e j
Stu
ulati
bi
hiop
ence
Natu
996
In
stry
ban
opia
eso
te o
arch
was
oin
ude
ion
iog
pia.
e an
ural
, he
Oc
y. H
nk
a fo
ourc
of A
h pr
als
ned
ent.
dy
gr
. H
nd o
l Re
e jo
ctob
He o
and
or h
ces
Agr
roje
so a
the
Du
yna
rap
He jo
obt
eso
oine
ber
obt
d s
his
Tea
ricu
ects
a pr
e F
urin
amic
ph
oin
tain
ourc
ed t
20
ain
soci
MS
am
ultur
s an
roje
Fore
ng h
cs
hy
ned
ned
ces
the
01
ned
io-
Sc.
at
ral
nd
ect
est
his
of

144
145
Publications Eshete, A., Teketay, D. Hulten, H., 2005. The socio-economic importance and status of
populations of Boswellia papyrifera (Del.) Hochst. In northern Ethiopia: the case of north
Gondar zone. Forests, trees and Livelihoods 15: 55-74.
Eshete, A. Sterck, F. and Bongers, F. 2011. Diversity and production of Ethiopian dry
woodlands explained by climate - and soil - stress gradients. Forest Ecology and
Management 262:1499-1509.
Abiyu, A., Bongers, F., Eshete, A., Gebrehiwot, K., Kindu, M., Lemenih, M., Moges, Y.,
Ogbazghi, W. and Sterck, F, 2010. Incense woodlands in Ethiopia and Eritrea:
Regeneration problems and restorations possibilities. In: Bongers, F., Tennigkeit, T.
(eds.). Degraded forests in Eastern Africa: Management and restoration. Earthscan Ltd,
London, UK, pp. 133 – 152.
Eshete, A. and Alemu, A. 2005. Forestry Research Abstracts No. 1. Tree Seed Technology
Research Abstracts No. 1. Forestry Research Centre, Ethiopian Institute of Agricultural
Research, Addis Ababa, Ethiopia.
Teketay, D. and Eshete, A. 2004. Status of indigenous fruits in Ethiopia. In: Chikamai, B.;
Eyog-Matig, O.; Mbogga, M. (eds.): Review and Appraisal on the status of Indigenous
fruits in Eastern Africa. A synthesis report for IPGRI - SAFORGEN.
Eshete, A. 2005. Forest seed system of Ethiopia. Forestry Research Newsletter. Vol.2, no.1.

146

PE
WieduEcoof Re
Wr
Po
De
Co
PE
Dis
Int
Sup
E&RC
ith thucatiolog32 E
eview-
ritin-
st-g- - - - -
eficie-
ompe- -
E&RC
- - -
scus
- - - -
tern
- - -
perv
- -
CPh
he eiona
gy anECT
w of Fd
ng ofF
raduSMICE
encyE
etenPW
CAn
PPP
ssion
ENNT
natio
ASA
visio
PP
hDE
ducaal rend R
TS (=
literFrankdyna
f proFrank
uateSurvMultIntroComEcop
y, refEcolo
nce sPhD Writi
nnua
PE&PE&PE&
ngr
EcoloNatioNatioTrain
onal
AssoStudAsso
ono
PopuProd
Educ
ationquir
Resou= 22
ratukinc
amic
ojeckinc
e couvival tivaroduct
mmunphys
fresogic
strenComing g
alm
&RC &RC &RC
roup
ogiconal onal ning
lsym
ociatent C
ociat
of2M
ulatioductio
catio
nal aremeurcewee
ure (censes
t prcense
urseana
riate tion nity iolog
h, bcal m
ngthmpetgran
meeti
WeeDayDay
ps/
cal TWoworon g
mpo
ion oConfion o
MSc
on don sy
onC
activents e Coeks o
(5 ECe tre
opose tre
s (7.lysisanalto Recolgy o
rushmetho
henintence
nt pro
ings
ekeny (20y (20
loca
Theororkshrkshgum
osia,
of Tferenof tr
cstu
dynamyste
Certif
vitiesset
onserof ac
CTSe of
sal (e of
.1 ECs (20lysis
R (20logy of pla
h-upods I
ng / e assopos
s,se
nd (2009) 010
alse
ry anhop ohop om pro
,wo
Tropince oropic
uden
micsms o
ifica
s listby
rvatictivit
S) f Eth
(5 ECf Eth
CTS007) s (20009)(20
ants
p couI (20
skillsessmsal (2
emin
2007
emin
nd Aon Fon woduct
orksh
ical Bon Ccal B
nts;1
s of Bof fr
ate
ted bthe
ion (ties)
iopi
CTSiopi
S)
007) 09) (20
urse007)
ls comen2010
nars
7)
nars
AppliFRAMwild f
tion
hop
BiolConsBiolo
130
Boswranki
belowC.T
(PE&)
a: ec
S) a: ec
10)
es (3
oursnt (200)
sand
s/o
icatiME fruit (200
san
logy servaogy a
0day
wellincen
w thT. de&RC
colog
colog
EC
es (3007)
dth
other
ion (Progtree
09)
ndco
andationand
ys
lia panse a
he Phe WiC) w
gy, p
gy, p
TS)
3.7 E)
ePE
rsci
(200gram
es (20
onfe
d Conn SciCon
apyrand
hD cit G
which
prod
prod
ECT
E&R
ient
7-20m (20009)
eren
nservience
nserv
riferamar
candGraduh com
ducti
ducti
TS)
RCw
tific
010)008))
nces
vatioe (or
vatio
a rket c
didateuate mpri
vity
vity
week
mee
)
s(9E
on (oral p
on (o
chain
e haSch
ises
and
and
end
eting
ECTS
oral preseoral p
n an
as cohool of a
d pop
d pop
d(1.5
ngs(
TS)
presentatprese
nalys
E
omplfor
a min
pulat
pulat
5EC
(3.6
sentation)entat
sis
Edu
lied wr Pronimu
tion
tion
CTS)
ECT
ation); Cation)
uc
withoducum t
dyn
)
TS)
n); Bambr); Ar
cat
h thectiontotal
namic
Bali, ridgerush
tio
e n l
cs
Indoe, UK
ha, T
on
onesK (2anza
n C
sia (22011ania
Ce
2010) (201
ert
0)
11)
tifificaatee

148
149
The FRAME project FRAME: Frankincense, Myrrh and gum arabic: sustainable use of dry woodland resources in Ethiopia More than half of the total land area in Ethiopia is covered by arid to semiarid woodlands with marginal agricultural potential. These woodlands are commonly overexploited for their natural resources, which reduces the local livelihood options for a rapidly expanding population. Climate change (e.g. drought) may intensify this negative trend. Consequently, there is an urgent need for improved land-use strategies that will make the vast arid and semiarid woodland resources optimally contribute to the livelihoods of local people and national development goals.
The dry woodlands in Ethiopia are not resource poor as they host several woody species that hold economically well recognized aromatic products such as gum arabic, frankincense and myrrh, which are widely used locally and in several of today’s commercial industries such as cosmetic, pharmacological and food industries. Frankincense and myrrh are among the oldest internationally traded commercial tree products. Ethiopia is worldwide the main producer of frankincense and myrrh, and exports much gum arabic. Gum/resin production could significantly contribute towards sustainable development of these dry woodland areas. However, the overexploitation of natural resources by intensive grazing and intensive resin/gum harvesting and the lack of land management threatens the sustainability of the woody vegetation, and as a result of that also the long-term gum/resin production. Local communities may also enhance the productive capacity of the natural vegetation by establishing protected enclosures and by cultivation of trees. Such production systems may have a lower status regarding biodiversity and natural ecosystem functioning, but maintain ecological buffering capacity and improve production for human benefit.
The FRAME program addresses the following main research question: in what way dry land forests in Ethiopia can be made productive while maintaining ecosystem integrity in terms of sustainability of production and vegetation cover, with special attention to resin and gum resources?
FRAME uses a multidisciplinary approach involving scientific disciplines ranging from landscape-level geo-information studies to village-level socio-economic studies, plot level ecological and harvesting technology studies to tree-level ecophysiological studies with a strong contribution of local knowledge in answering the central research question. FRAME thus establishes a scientific basis for the sustainable management, including cultivation, of gum and resin yielding tree species and their habitat, the dry woodlands in the Horn of Africa. FRAME is actually involved in development of long-term scenarios for proper use and selection of suitable areas of dry woodland resources in Ethiopia.
The current PhD thesis is part of this FRAME program. A large part of this integrated FRAME research program was financially supported by NWO-WOTRO (Netherlands Organization for Scientific Research- Science for Global Development), grant W01.65.220.00.