Embed Size (px)
Citation preview
Aberystwyth University
Post-1850 changes in Glacier Benito, North Patagonian Icefield, ChileWinchester, Vanessa; Sessions, Martin; Valdivia Cerda, Jammie; Wuendrich, Olaf; Clemmens, Samuel; Glasser,Neil F.; Nash, Megan
Published in:Geografiska Annaler: Series A, Physical Geography
DOI:10.1111/geoa.12027
Publication date:2014
Citation for published version (APA):Winchester, V., Sessions, M., Valdivia Cerda, J., Wuendrich, O., Clemmens, S., Glasser, N. F., & Nash, M.(2014). Post-1850 changes in Glacier Benito, North Patagonian Icefield, Chile. Geografiska Annaler: Series A,Physical Geography, 96(1), 43-59. https://doi.org/10.1111/geoa.12027
General rightsCopyright and moral rights for the publications made accessible in the Aberystwyth Research Portal (the Institutional Repository) areretained by the authors and/or other copyright owners and it is a condition of accessing publications that users recognise and abide by thelegal requirements associated with these rights.
• Users may download and print one copy of any publication from the Aberystwyth Research Portal for the purpose of private study orresearch. • You may not further distribute the material or use it for any profit-making activity or commercial gain • You may freely distribute the URL identifying the publication in the Aberystwyth Research Portal
Take down policyIf you believe that this document breaches copyright please contact us providing details, and we will remove access to the work immediatelyand investigate your claim.
tel: +44 1970 62 2400email: [email protected]
Download date: 09. Jul. 2020
brought to you by COREView metadata, citation and similar papers at core.ac.uk
provided by Aberystwyth Research Portal
1
POST-1850s CHANGES IN GLACIER BENITO, NORTH PATAGONIAN ICEFIELD, CHILE 1
2
VANESSA WINCHESTER1, MARTIN SESSIONS2, JAMMIE VALDIVIA CERDA3, OLAF 3
WÜNDRICH4, SAMUEL CLEMMENS5, MEGAN NASH6, NEIL F GLASSER5 4
1. Oxford University Centre for the Environment, University of Oxford, OX1 3QY, UK. 5
2. 9 Eliza St, Amaroo, ACT 2914, Australia. 7
3 Universidad Tecnologica Metropolitana (UTEM) Santiago, Chile 8
4. Colibri Ventura, Casilla 113, Coyhaique, XI Region de Aysén, Chile 9
5. Institute of Geography & Earth Sciences, Aberystwyth University, Llandinam Building, 10
Penglais Campus, Aberystwyth, SY23 3DB, UK. 11
6. Australian National University, ACT 12
13
2
Abstract 14
In southern South America field studies validating glacier recession are scant and of brief duration. 15
This studyusing field data from 1972/73, 2007 and 2001, presents the longest glacier study yet 16
undertaken in the region. Rates of thinning of Glacier Benito, a temperate outlet glacier on the 17
west side of the North Patagonian Icefield (NPI), were derived using data collected by the British 18
Joint Services Expedition in 1972/73 and subsequent data collected in 2007 and 2011.. Rates of 19
recession are based on dendrochronological dating for the terminal moraines; these dates indicate 20
that the last cold period reached its maximum in the 1850s: the earliest date yet estimated for the 21
beginning of “Little Ice Age” glacier retreat around the NPI. Estimated ice front recession from the 22
LIA (1858) to 2002 is almost 2 km, with rates increasing dramatically from 17.7 m yr-1 between 23
1975-1998, to almost 170 m yr-1, 1998-2002. Over the 34-year period between xxxx and yyyy from 24
the first survey in 1972/73, the lower glacier thinned by nearly 150 m. 25

3
Introduction 26
There is now compelling evidence that climate warming is impacting glaciers worldwide (EPICA 27
Community Members 2006), with glacier fluctuations widely acknowledged as relatively reliable 28
indicators of climate change (Rosenblüth et al. 1997). However, warming varies spatially and 29
temporally between regions and the magnitude of changes can be difficult to determine especially 30
in climatically critical regions in southern South America such as the North and South Patagonian 31
Icefields (NPI and SPI) where, due to challenging weather conditions, instrument records are few, 32
widely separated, often incomplete and of relatively short duration; thus proxy records are required 33
to fill the gap. Proxy indicators of climatic change in this region have included lichenometry and 34
dendrochronology (Winchester and Harrison 1994, 1996; Villalba et al. 2003, Koch 2009), pollen 35
analysis and sediment cores (Bennett et al. 2000; Markgraf, et al. 2007), radiocarbon and 36
cosmogenic dating of moraines (Glasser et al. 2002; Harrison et al. 2008) and ice cores (Matsuoka 37
and Naruse 1999; http://www.glaciologia.cl/spi.html#index 2002; Vimeux et al. 2008). Together 38
with geomorphological mapping, these indicators present a picture of icefields highly sensitive to 39
climate change (Glasser at al. 2004; 2011). 40
The climate on the west coast of southern South America is mediated by three ocean-41
atmosphere systems: the cold Humboldt Current flowing northwards from the circumpolar 42
Southern Ocean, the westerly winds that, rising over the Andes, create a steep west-east climatic 43
gradient, and a teleconnection with the equatorial El Niño/Southern Oscillation (ENSO) 44
(Winchester et al, 1999; Daniels and Veblen 2000); east of the Andes inputs from continental 45
sources from the E–NE are sometimes mixed with circumpolar air masses (Vimeux et al. 2008). 46
Together the NPI and SPI cover some 16,950 km2 (Barcaza et al. 2009), and of this the total 47
ice area of the NPI in 2001 was 3953 km2 (Rivera et al, 2007). Separated today by a 100 km gap 48
the two Icefields form the largest temperate ice mass in the Southern Hemisphere stretching from 49
460.28’S to 510.35’S, but they are now shrinking due to changes in temperature and precipitation 50

4
affected by latitudinal migration of the westerlies (Cai 2006; Sallée et al. 2010; Shevenell et al. 51
2011) and altered storm tracks (Lamy et al. 2010). 52
The shrinking Icefields are globally important owing to their contribution to sea-level rise 53
(Rignot et al. 2003; Glasser et al. 2011). Locally, the famous calving San Rafael Glacier 54
descending the western flank of the NPI is a focus for tourism and, of national importance on the 55
east side of the Andes, new hydroelectric dams are projected for Rio Baker (Vince 2010): this 56
river, the main drainage channel for the NPI’s eastern glaciers, empties into the Pacific between 57
the Icefields. Hence, measurements of rates of change on the Icefield and its outlet glaciers are of 58
interest not only with regard to quantifying sea-level rise, but the prospects for tourism and, more 59
importantly, the water supply for Rio Baker lying in the rain shadow east of the Andes (Dussaillant 60
et al. 2011). 61
Glaciological mass balance is controlled by difference between the rate of accumulation in the 62
source area and ablation, with ablation dependent on temperature, debris cover and calving at the 63
terminus, especially where there is tidal activity that may obscure the link between glacier retreat 64
and climate (Warren et al.1995; Glasser et al.2002; Aniya 2007). Besides climate, individual 65
glacier dynamics can be attributed to a range of variables including basal lubrication and 66
topographic features, ice thickness, slope, moraine shoals (Powell 1991) and tectonic events, in 67
particular with regard to the NPI, those associated with the Liquiñe-Ofqui fault that here defines the 68
western margin of the Andes. 69
To date, rates of glacier retreat around the NPI have been estimated for twenty-one of the 70
twenty-eight larger outlet glaciers. Although the behavior of individual glaciers has varied, the 71
overall trend has been of retreat since the mid-nineteenth century (Harrison et al. 2007). Extensive 72
glacier studies around the NPI have also been carried out based on aerial surveys and satellite 73
imagery derived from Landsat images (Aniya op. cit.), ASTER-derived digital elevation models and 74
Shuttle Radar Topography Mission information (Rignot et al. 2003; Barcaza et al. 2009). A further 75
5
study of snow cover on the NPI (2000-2006) using Moderate Resolution Imaging Spectro-76
radiometer (MODIS) images found that snow cover fluctuated not only inter-seasonally but also 77
intra-seasonally especially on the western side of the Icefield in winter where it has been 78
concluded that temperature determines the extent of snow cover whereas on the east side both 79
temperature and precipitation are implicated (Lopez et al. 2008). Studies have produced proxy 80
estimates for ice thinning, ice-front retreat rates, area loss and snow cover, but there is as yet 81
scant field evidence (Ohata et al. 1985) to substantiate estimates. Thus, longer-term field studies 82
are required. 83
This study focuses on Glacier Benito, a temperate outlet glacier on the west side of the NPI 84
within the Laguna San Rafael National Park. Glacier Benito was first surveyed by the British Joint 85
Services Expedition in the austral summer 1972-1973 (Sessions unpublished) and this study has 86
extended this record with additional surveyscarried out in March 2007 and 2011, providing the 87
longest repeat field study of any glacier around the NPI. with. Our aim is to supply comparative 88
data for estimation of the lower glacier’s changes in ice thickness over the 34-year period; supply 89
ice surface movement and ablation rates for comparison with 1972-1973 data, and provide glacier 90
recession rates since the start of retreat at the end of the ‘Little Ice Age’ (LIA) a period 91
conventionally regarded as culminating in maximum positions sometime between AD 1550 and 92
1890. Additionally in 2007, a bathymetric map of the proglacial lake was constructed and 93
dendrochronology and aerial photography were used to provide minimum dates for the moraines 94
and rates of ice front recession. 95
96
Site description 97
Glacier Benito (47°02’S, 73°53’W) lying 10.5 km inland from Abra (inlet) Kelly on the Pacific 98
foreshore descends to approximately 14 m a.s.l. from a maximum elevation of 2500 m (Figure 1). 99
Its surface is largely free from debris with a surface area of 169 km2 and an estimated ratio of 100

6
accumulation to ablation areas of 1:0.7 and an ELA averaging 908 m a.s.l. (Rivera et al. 2007) 101
compared with the start of partially-compacted névé at 850 m a.s.l ± 10 m (observed on 10/03/73, 102
Sessions unpublished). The glacier terminates in a proglacial lake that discharges into Rio Benito 103
flowing southwest down a glaciofluvial channel to meet the ocean at an inlet on the Golfo de 104
Peñas. 105
Previously there was another outlet flowing northwest down a wide valley to join Rio Andre 106
discharging into Abra Kelly. This former outlet is now closed 0.54 km from the current lakeshore on 107
the northern corner of a prominent terminal moraine that describes a 1.5 km arc across the valley 108
floor. The moraine has a maximum ridge height of 10 meters and, at the northern end three ridge 109
crests diminish in height towards the lake. A stream, running along the proximal edge of the 110
terminal moraine has incised a channel in the outwash plain. Other dry or intermittent channels 111
also cross the plain and at its northern end there are a number of kettle holes and boggy areas. A 112
series of moraines fringe the lakeshore. Large southern beech trees (Nothofagus nitida) up to 20 113
m tall grow on the main terminal moraine and smaller trees and bushes (Pernettya mucronata) 114
grow on or near the crest of the moraines within the complex. The moraine fronting the 115
southwestern shore of the lake re-emerges as an island in the middle of Rio Benito’s outlet 116
channel. On the island there are two trees at approximately 5 m and 9 m above lake level, one on 117
the proximal side of the moraine and the other close to the crest on the distal side. 118
A forest trimline, visible as a sudden change in vegetation characteristics, cuts across the 119
northern valley wall. The trimline occupies a broad, glacier-cut bench sloping longitudinally across 120
the side of the mountain and ending in a steeper slope above the terminal moraine (Figure 2). On 121
the glacier-cut bench, rounded cobbles line the flat bed of a former lateral channel. Up-slope from 122
the channel a small, deeply incised stream flows between the mountain wall and small moraines 123
fragments. The trimline on the southern valley wall, due to the more broken nature of the terrain, is 124
only distinguishable in its lower reaches. 125
7
126
Methods 127
Starting in December 1972, a network of three fixed survey stations was established on the valley 128
side (Figure 3, Camp, Boulder and Cairn); from these four stakes (Figure 3, st1 tp st4) were 129
positioned in the lower ablation zone using a Wild T2 theodolite. The baseline was determined 130
from a chained distance on the outwash plain whilst the datum altitude was estimated from 131
pressure corrected altimeter readings over four months. The positions of the four stakes were re-132
measured 71 days later. Ablation readings were taken over a 112 day period involving up to 16 133
visits to some stakes. A fifth stake was added for ablation measurement later in the expedition 134
(Figure 3, point 2). The theodolite survey produced results that could be recalculated in 2007 and 135
2011, with the baseline re-surveyed using new, in this case Differential Global Position System 136
(DGPS) technology. 137
In 2007, two new base stations (Figure 3, Stn1 and Stn2) were measured using a Trimble 138
5700 Series DGPS base station with a rover station. Satellite observations over several days were 139
used to establish the positions of Stn1 and Stn2. Using the rover with both real time and post 140
survey processing, two of the 1972/1973 fixed stations (Figure 3, Boulder and Camp) were re-141
occupied so that the 1972/1973 survey observations could be corrected both for position and 142
altitude to fit the 2007 network. The rover was then used in February 2007, on three occasions, to 143
measure the positions of six stakes inserted into the ice (Figure 3, Sb, S1 to S5). Contours were 144
measured on the glacier and the terminal moraines and other features were mapped. 145
As a crosscheck of the 2007 survey work, Sessions, Wündrich and Dowling revisited the 146
glacier in 2011. With a Hiperlite + and a Sokia GRX-1, they re-measured Stn1 and Stn2 using 147
three times as many satellites as in 2007. They also revisited three of the 2007 ice measurement 148
positions. Post processing using Automatic Precise Positioning System (APPS) from JPL/NASA 149
enabled survey errors to be further reduced. 150

8
Ice front retreat rates and distances were calculated based on the survey network measured 151
during the 2007 expedition and two overlapping 1998 vertical aerial photographs (N°12529 and 152
N°12530, scale approximately 1:70,000) purchased from Servicio Aerofotogrametrico, Fuerza 153
Aerea de Chile (www.saf.cl). Orthorectification of the images was carried out using PCI Geomatic 154
software and based on ground-control points taken from data provided by Google Earth. The 155
outline of the glacier in 2002 was also taken from Google Earth imagery and likewise 156
superimposed over the 1998 base map. An unrectified vertical 1974 aerial photograph (8V 58WRS 157
USAF 9-28-74 10DEC74 - AF75-1 R19B No 1235/6), was used to approximate the 1974 outline of 158
the glacier tongue. The location of the glacier tongue in 1944 was estimated from the trimetrogon 159
oblique aerial photographs (US Airforce, Sortie 91-PC-5M-4028). 160
Depths of the proglacial lake were taken using a portable eco sounder (a Garmin Fishfinder 161
90) enabling construction of a bathymetric contour map with positions fixed using the GPS (Figure 162
4). Panoramas were photographed to include sites photographed in 1972-1973. 163
We collected 63 tree cores and stem cross sections from Nothofagus nitida (Phil.) Krasser, 164
(Southern Beech) and noted their GPS coordinates. The cores were mounted on wood supports 165
and polished to a shine to reveal their annual rings; these were then counted both in the field and 166
later under a microscope. The sampled trees were growing on moraines, the lake foreshore, the 167
island and on the forest trimline on the northern flank of the glacier. 168
The samples were later located by their GPS coordinates on a map constructed from an 169
orthorectified, oblique 1944 aerial photograph of the moraines, lake shore and glacier ice front, 170
superimposed over satellite imagery (also orthorectified) from 1974 and 2002. Moraine dates and 171
rates of glacier recession were derived from tree age and distances to the glacier ice-front 172
positions shown on the map are dated as described below. 173
174

9
Dating parameters 175
Dates for surface exposure of recently de-glaciated terrain are derived from the sum of a tree 176
core’s annual ring count to pith + estimate of number of years growth below the core + an estimate 177
of the delay before germination and establishment (ecesis). 178
Annual-ring counts only give the age of a tree above coring height; age below the core is 179
unknown: the missing age was obtained by sectioning seven small trees just above ground level 180
and dividing the annual ring counts by tree heights to establish the average annual growth rate for 181
young N. nitida on the Benito moraines (Table 1). Thus, moraine-dating estimates are based on 182
core height divided by the average annual growth of seedling trees plus core-ring count 183
(Winchester and Harrison 2000) plus estimate of delay before ecesis (representing the time taken 184
for the freshly exposed ground to stabilize become fertile and seed to germinate after ice retreat). 185
This value was deduced from the age of three trees: two on the island (shown on figure x?) and 186
one on the continuation of the island moraine on the southern lakeshore moraine, with their ages 187
then compared with the date the island emerged from the ice as shown in two aerial photographs: 188
one taken in 1973 showing the ice front touching the shoreline at the northern end of the lake and 189
the other in 1974 showing the glacier ice-front retreated a little from the shore with the future island 190
just visible as a dark area emerging from the ice some 80 m offshore (Figure 5). 191
192
Results 193
Surveys 194
Table 2 shows the corrected altitude of stakes measured in 1972/1973 to the 2007 datum. Each 195
stake observation in 1972/1973 involved at least three sightings to determine altitude. The 196
maximum difference in altitude measurement at a stake was 0.67 m with a mean difference of 197
0.38 m. The altitudes of the stakes measured in February 1973 were cross-correlated with the 198

10
December 1972 measurements, taking into account ablation and movement down slope, as a 199
further check to confirm that the altitudes are within a ±0.5 m error margin. 200
In 2007, the observed error on each occasion was 0.1 m with respect to the datum. As the 201
baseline of the 1972/1973 network could not be established until the last day of the 2007 202
expedition, the stakes inserted in 2007 do not correspond exactly to the 1972/1973 stake 203
positions. Table 3a shows the corrected altitudes for the 2007 network of 1972/1973 stakes. In 204
summary, the glacier thinned by an average of 148.5 m ±5 m in 34 years amounting to 4.37 m yr-1 205
±0.18 m yr-1 (Figure 6). The results of the 2011 revisit are shown in Table 3b. Over the interval, 206
the glacier surface lowered on average 24.4 m ±3 m as measured near three of the 2007 stake 207
positions. The thinning rate of 6.1 m yr-1 ±0.5 m yr-1 is a significant increase on the rate for the 208
previous 34 years. 209
In 1972/1973 the average down-glacier surface movement was 0.48 m d-1 ±0.01 m d-1 (175 210
m yr-1). In 2007 the average measured movement was 0.44 m d-1 ±0.01 m d-1 (161 m yr-1). Given 211
that the rate of movement of a temperate glacier can change significantly both inter and intra-212
annually, the difference is probably not significant. Average surface ablation rate for the measured 213
period in 1972/1973 was 0.051 m d-1 and in 2007 it was 0.059 m d-1. Given that the 1972/1973 214
observed ablation rates range from 0.033 to 0.068 m d-1 for the lower four stakes and that local 215
meteorological data were not available for either survey, no conclusions can be drawn from this 216
comparison. 217
218
Dendrochronology 219
Ecesis estimates are derived from tree age on the island (as from the austral 2006 growing 220
season). On the island’s distal side tree age was 16 years and 13 years on the proximal side 221
below the ridge top. A further small tree on the proximal side of the equivalent moraine on the 222
southern shore of the lake was also 13 years. These ages supply dates of 1993 and 1990, which 223
11
subtracted from the 1974 aerial exposure date indicates maximum possible ecesis delays of 19 224
and 16 years on the proximal and distal sides of the island respectively. 225
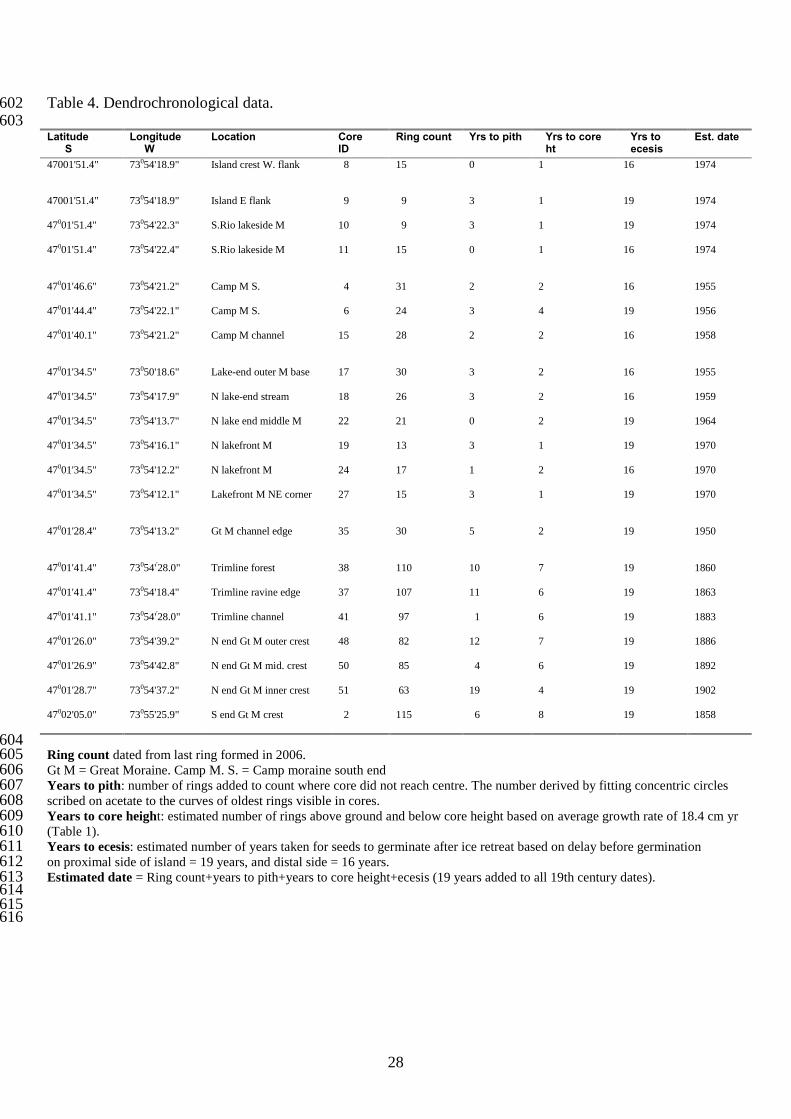
Dendrochronological dating (Table 4) for the southern end of the arcuate terminal moraine 226
suggests an 1858 exposure date for the beginning of glacier retreat from its LIA maximum and an 227
1859 date for the northern valley-wall trimline; the age of trees growing in the adjacent run-off 228
channel imply that the ice surface had downwasted leaving the channel dry by 1881. The dating of 229
three moraines on the outwash plain shows that the downwasting glacier retreated in phases at 230
the northern end of the terminal arc over a distance of about 50 m from 1886 to 1901. 231
The 1944 oblique aerial photograph shows the northwest channel still flowing out towards Inlet 232
Kelly: tree dates in a channel running along the proximal foot of the terminal moraine indicate 233
channel activity prior to 1950. Trees on the outermost of the recent suite of lakeshore moraines 234
supplied minimum tree-ring dates of 1955/1956. Stillstands produced two further moraines 235
marking the present northern lakeshore dating to 1966 and 1970, and finally the 1974 moraine 236
was deposited appearing as an island half way across Rio Benito’s outlet and reappearing on the 237
lake’s southern shore. The course of this latter moraine is further defined by the bathymetric 238
survey showing the lake shallowing as it crosses the neck of the Rio’s outlet (Figure 4). The 239
continued existence of a moraine here, rather than being washed away by the outgoing flood, is 240
likely due to debris deposited by stranded melting icebergs. The following estimates for average 241
recession rates and distances covered between dated glacier positions are measured along a 242
notional centre line of the glacier passing through the island (Figure 7). Potential measurement 243
errors are discussed below. 244
1858-1886 glacier thinning with minimal retreat. 245
1886-1944 recession over a distance of 519 m at a rate of ~9 m yr-1. 246
1945 -1974, recession over 426 m, averaging 14.7 m yr-1. 247
1975–1998 recession over 407 m, averaging 17.7 m yr-1. 248

12
1999-2002 recession increased over a distance of 509 m averaging 169.7 m yr-1. 249
Total retreat 1858-2002 was 1935 m. 250
Tree-ring dating during the first 28 years suggest that there was major ice-loss in the vertical 251
dimension as the glacier thinned, with retreat on the horizontal axis at the southern end of the 252
terminal moraine starting around 1858 and at the northern end in 1886. Initial slow downwasting 253
(1859-1881) is evidenced by 148 and 126-year old trees growing above and in, respectively, a 254
meltwater channel on the northern mountainside bench (Figure 7). The extent of thinning to the 255
present is shown by the change in terminal-surface gradient from ~13.50 in the 1850s, as shown 256
by the angle of the trimline on the valley-side (Figure 2), to between 30 and 40 by 1973 (Figure 6); 257
the slope of the glacier terminus in 2007 was under 10, although three km up glacier the slope was 258
still 30 between stakes S1, S5 and S3 (Figure 4) similar to the slope in that area in 1973. 259
260
Discussion 261
Errors and dating estimates 262
The exact dates, distances and rates of retreat are approximations owing to a number of potential 263
error sources both in approaches to measurement and to dating. Since ice-front configurations are 264
highly variable, retreat values depend on where precisely on the glacier terminus measurements 265
are taken. The arbitrary choice of an approximate centre line on Glacier Benito passing through 266
the island thus only provides a relative measure of ice loss between periods. The dating of surface 267
exposure from tree ages can also be problematic since older un-cored trees may exist and simple 268
tree-ring counting without any cross dating to identify missing or extra (false) rings could affect 269
dating accuracy (Fritts 1976; Koch 2009). Additionally, growth below core height may vary for 270
individual trees (Winchester and Harrison 2000; Winchester et al.2001) 271
Several factors point to a more remote date, nearer 1850 than 1860, for the beginning of 272
glacier retreat here: our estimated delay before ecesis is based on differences in tree ages on the 273

13
proximal and distal sides of the island in 2007 (with differences implying that trees are sensitive to 274
microclimatic variations) whereas ecesis is likely to have taken longer during the harsher mid-275
nineteenth century; further, a sensitive response to local climatic and topographic conditions is 276
indicated by the 19-year ecesis delay at Glacier Benito as compared with 6-years at San Rafael 277
(Winchester and Harrison 1996). A difference that could be explained by Benito’s terminus being 278
10-km from the sea and enclosed by a moraine arc, with icy down-glacier katabatic winds forming 279
a frost pocket in the sheltering bowl of forest-clad moraines; compared with the termini of the much 280
bigger San Rafael and San Quintin Glaciers (Figure 1) where prevailing winds have a much 281
greater influence due to less shelter from surrounding ridges. The ecesis error is likely to be small 282
where values are closely controlled by aerial photography as at Benito, with secure 1970s dating 283
for the lakeside-moraines (photographs show them bare of vegetation in 1973) and aerial 284
photographic evidence showing the island just emerging in 1974. 285
Other intrinsic error sources lie in orthorectification of aerial images, with the accuracy of the 286
process depending on the quality of the Digital Elevation Model and the correction formula. Potere 287
(2008) describes Google Earth horizontal positional accuracy as effectively 50 m. This would 288
invalidate our retreat-rate estimates if it were not for the dendrochronological and photographic 289
evidence that provides secure dating for the recent moraines including an absolute date for the 290
island. Additionally, the resolution of the Google Earth images of Glacier Benito for 2011 has 291
increased significantly since 2007. The 2011 expedition was able to measure nine ground control 292
points, visible in Google Earth, and determine that the difference in position of the features in the 293
Google Earth imagery was 17 m ± 3 m on a bearing of 200° and 7 m ± 8 m higher compared to the 294
measured points. The glacier position in 1944 is the most approximate of the orthorectified images 295
since it is derived from a Trimetrogon oblique photograph of poor quality and no 1944 trees were 296
found (Figure 5). Thus the estimated 14m yr-1 rate of retreat 1945-1974 is an approximation. 297
298
14
Climate, ice movement and ablation and ice-surface thinning 299
Assessing climate change around the Icefields is hampered by the scarcity of continuous longer-300
term meteorological records. Existing records on the western seaboard (Rosenblüth et al. 1995; 301
Villalba et al. 2009) together with tree-ring reconstructions (Villalba et al. 2003), filling in the areal 302
instrument gap on the eastern side of the Andes, show that temperature trends differ north of 460S 303
compared with south of that latitude; precipitation also differs being higher to the north during the 304
austral winter months whereas at Isla San Pedro due west of the NPI precipitation is highest 305
during the summer (Winchester and Harrison 1996). We propose that the position of the northern 306
limit of the NPI at 46030’S is sensitively dependent on climate. 307
Incomplete records from stations at Cabo Raper and Isla San Pedro due west of the NPI show 308
a tendency for rainfall decrease during the 20th century (Rivera and Casassa 1999) with 309
temperatures increasing southwards from 1976 by 0.40C at latitude 460S to 1.40C at 530S. By 310
contrast, north of 460S (between 410S-430S) there was no trend over the period (Rosenblüth et 311
al.1995). Villalba et al. (2003: 177) observe, based on tree-rings, that south of latitude 460S “the 312
rate of temperature increase from 1850 to 1920 was the highest over the past 360 years” including 313
“a notable increase in the warming trend after 1976, with summer warming responsible for much of 314
the increase”. These findings support our estimate of an 1850s retreat from Benito’s LIA moraine; 315
they also highlight the importance of seasonality in melting and discharge rates. 316
Concerning seasonal variability (Vimeux et al. 2008), it should be noted that Benito’s surface 317
movement rates will be higher in summer during periods of peak meltwater discharge and ablation 318
than in winter and thus average annual movement will be rather less than the rates given here for 319
1973 (0.48 m d-1) and 2007 (0.44 m d-1): a potential scale for the error is suggested by differences 320
in ablation at Glacier Soler on the warmer, eastern side of the NPI where mean mid-summer rates 321
are as high as 0.131 m d-1 (Kobayashi and Saito 1985b) while spring rates are only 0.03 m d-1 322
(Fukami and Naruse 1987). Ablation rates in 1972 and 2007 at Benito, 0.051 and 0.059 m d-1 323

15
respectively (Table 2) are close to those near the terminus of San Rafael where there was a 324
measured loss of 0.068 m d-1 water equivalent in 1983/84 (Ohata et al.1985c). 325
Surface thinning, averaging 4.37 m yr-1 (1973-2007) on Benito Glacier, 3.76 km from the island 326
(Figure 3), exceeds that of all other NPI glaciers measured by Rivera et al. (2007): a contributing 327
factor may be the additional six years (2001-2007) of possibly dramatic ice-surface wasting. 328
Between stakes st1 and st2 (Figure 3) our data indicates that the surface gradient was 3.50, in 329
1973 (close to Aniya’s 1988 estimate of 3.80). The average gradient between similar stakes in 330
2007 was 30 with the glacier surface flattening considerably below stake Sb (Figure 3). 331
332
Calving and frontal retreat 333
Calving credited as a major control on glacier dynamics (Warren and Aniya 1999) is not a feature 334
of Benito Glacier despite Aniya’s (2007: 67) assertion, based on aerial surveys, that Benito was a 335
calving glacier between 1986 and 1991, but for calving to take place an ice front needs to be free 336
floating: the shallow lakebed profile (Figure 4) suggests that the ice was grounded over the period. 337
A problem in identification of calving from aerial photography is that it may be difficult to distinguish 338
calved icebergs from floating, melting ice initially fractured by impact against a shelving lake floor. 339
Changes in the size of ‘icebergs’ (commented on by Aniya op. cit.) could be the result of an 340
increase in the depth of the lakebed profile as the glacier recedes. 341
The dendrochronological dating that supplies the earliest date for retreat on the southwestern 342
corner of the terminal moraine and a later date of 1886 at its northern extremity is consistent with 343
the asymmetrical valley profile revealed by the bathymetric survey (Figure 4). The deepened 344
trough along the northeastern valley side signals maximal erosion at this point due to glacier 345
dynamics influenced by the bend in the ice stream (see ice contours Figure 3). Hence, although 346
surface thinning began in the 1850s on the southern side of the glacier front, on the northern 347
mountainside the dating evidence shows that the lateral channel fed by the melting glacier did not 348
16
cease to flow until 1881 implying that downwasting was initially very slow on the northern valley 349
side with the ice still level with the trimline bench until then. 350
Benito’s retreat rate, 1999-2002, of 169.7 m yr-1 can be compared with the larger San Rafael 351
Glacier that between 1990-2002 retreated at an average rate of 84 m yr-1 while the northern part of 352
San Quintin’s tongue retreated, 1997-2003, approximately 338 m yr-1 (as measured from the 353
Google Earth image, 2002) or 33 km2 of ice (Rivera et al. 2007). Since these three glaciers are 354
very different in many respects including source area, size, and debris cover (Benito’s debris cover 355
is among the lowest of all the NPI glaciers; Rivera et al. op. cit.) and since the evidence for 356
changes in precipitation is equivocal, we propose that increasing retreat rates from 1974 and 357
especially since the 1990s (Table 2) are a response to climate warming (Glasser et al. 2011). 358
The bathymetric data (Figure 4) were collected to provide information on the current depth of 359
the lake, the non-calving status of the glacier and the maximum thickness of its terminus. The 360
lakebed’s slope, northeastwards from the island moraine, is also of interest with respect to the 361
asymmetrical response of the ice front which, taken with the 1944 oblique view of the glacier front, 362
strongly infers that the glacier front has been grounded over most of its width for the whole 150-363
year period. 364
365
Conclusions 366
The extent of thinning since the LIA maximum to the present is revealed by differences between 367
the terminal-surface gradient on the northern valley side from ~13.50 in the 1850s, as shown by 368
the angle of the LIA trimline (Figure 2), to an average of 30 by 1974 reducing to less than 10 by 369
2007 (Figure 6). Although our data show that neither the down-glacier movement rates nor surface 370
ablation in 1972 and 2007 differed significantly over the period, total ice surface thinning of 148.5 371
m in the lower ablation zone was substantial, proceeding at an average rate of nearly 4.4 m yr-1, 372
with results from the visit in 2011 showing an increasing rate. This pattern of downwasting has 373
17
resulted in the typical concave terminal profile of a fast retreating glacier, with terminal recession 374
rates increasing from ~9 m yr-1, for the period 1886-1944, to almost 170 m yr-1 between 1999-375
2002. Ice-front retreat at the terminus has been non-uniform over the period due to an 376
asymmetrical valley profile. 377
The early onset of retreat from the southern end of the terminal moraine in the 1850s suggests 378
that Benito Glacier is highly sensitive to warming and among the most reactive of other NPI 379
glaciers previously studied, with this dating placing the LIA maximum on the NPI two decades 380
earlier than previously recorded (Glasser et al 2011) coinciding with the start of glacier retreat in 381
the western USA (Bradley and Jones 1993; Hall and Fagre 2003) and the majority of glaciers 382
elsewhere (Glasser op. cit.). Our results highlight accelerating climate warming in southern South 383
America south of the current northern margin of the NPI. We propose that this margin describes a 384
climatic boundary responsive to changes in the westerly winds, their related storm tracks and 385
ocean/atmosphere warming. 386
More long-term field studies on the NPI are still required and reliable forecasts of Icefield 387
dynamics in a climate-warming scenario must wait until studies of mass wasting, glacier retreat 388
and ice-surface topography can be combined with data showing the ice-bed interface. 389
390

18
Acknowledgements 391
We thank CONAF (Corporación Nacional Forestal, Chile) for permission to carry out this research. 392
The expedition was initiated, organized and led by Martin Sessions. In Chile, Graham Hornsey 393
supplied vital logistics and radio contact. Participants other than the authors, during phase one of 394
the expedition were Stuart Harron (also a member of the British Joint Services Expedition), Aase 395
Richter and Susie Russell. During the second phase team members were: Garth Coghlan, 396
Stephanie Goodrick and Michael John; all are warmly thanked for their valiant support. The 397
University of Aberystwyth loaned us a Trimble DGPS. Funding for V. Winchester was received 398
from The Linnean Society, Percy Sladen Memorial Fund and John Fell Fund, University of Oxford. 399
Funding for equipment hire and transportation in Chile, including sea transport between Tortel and 400
Kelly Inlet, was provided by legacies from Patrick and Barney Sessions. Professor Neil Glasser is 401
thanked for his critical comments on a draft. 402
403
404
405
Vanessa Winchester, School of Geography and the Environment, OUCE, University of Oxford, 406
Oxford, OX1 3QY, UK. E-mail: [email protected] 407
Martin Sessions, 9 Eliza St, Amaroo, ACT 2914, Australia. [email protected]). 408
Jammie Valdivia, Universidad Tecnologica Metropolitana (UTEM) Santiago, Chile. 409
Olaf Wüendrich, Colibri Ventura, Casilla 113, Coyhaique, XI Region de Aysén, Chile 411
Sam Clemmens and Neil Glasser, Institute of Geography & Earth Sciences, Aberystwyth 413
University, Llandinam Building, UK. [email protected] 414
Megan Nash, Australian National University, ACT, Australia. [email protected]
19
References 416
Aniya, M., 1988: Glacier inventory for the Northern Patagonia Icefield, Chile, and variations 417
1944/45 to 1985/86. Arctic and Alpine Research, 20: 179-187. 418
Aniya, M., 2007: Glacier variations of Hielo Patagonico Norte, Chile, for 1944/45-2004/05. Bulletin 419
of Glaciological Research, Japanese Society of Snow and Ice, 24: 59-70. 420
Barcaza, G., Aniya, M., Matsumoto, T. and Aoki, T., 2009: Satellite-derived equilibrium lines in 421
Northern Patagonia Icefield, Chile and their implications to glacier variations. Arctic Antarctic 422
and Alpine Research, 41(2): 174-182. 423
Bradley, R. S. and Jones, P. D., 1993: ‘Little Ice Age Summer Temperature Variations: their 424
Nature and Relevance to Recent Global Warming Trends’, The Holocene, 3: 367–376. 425
Bennett, K. D., Haberle, S. G. and Lumley, S. H., 2000: The last Glacial-Holocene transition in 426
southern Chile. Science, 290: 325–328. 427
Cai, W., 2006: Antarctic ozone depletion causes an intensification of the Southern Ocean super- 428
gyre circulation. Geophysical Research Letters, 33, L03712, 4 p. 429
Daniels, L. D. and Veblen, T. T., 2000: ENSO effects on temperature and precipitation of the 430
Patagonian-Andean region: implications for biogeography. Physical Geography, 21: 223–243. 431
Dussaillant A. and Meier, C., and Wright, S., 2011: Dams in Patagonia: More Studies Are Needed. 432
Science published online 10 February 2011. 433
EPICA Community Members, 2006: One-to-one coupling of glacial climate variability in Greenland 434
and Antarctica. Nature, 444: 195-198. 435
Fritts, H. C., 1976: Tree rings and climate. Academic Press. London, 567 p. 436
Fukami, H. and Naruse, R., 1987: Ablation of ice and heat balance on Soler Glacier, Patagonia. 437
Bulletin of Glacier Research, 4: 37-42. 438
Glasser, N., Hambrey, M. J. and Aniya, M., 2002: An advance of Soler Glacier, North Patagonian 439
Icefield, at c. AD 1222–1342. The Holocene, 12(1): 113-120. 440
Glasser, N. F., Harrison, S., Winchester V., and Aniya, M., 2004: Late Pleistocene and Holocene 441
20
paleoclimate and glacier fluctuations in Patagonia. Global and Planetary Change, 43: 79-101. 442
Glasser N. F., Harrison, S., Jansson, K. N., Anderson, K. and Cowley, A., 2011. Global sea-level 443
contribution from the Patagonian Icefields since the Little Ice Age maximum. Nature 444
Geoscience, 4, 303-307. 445
Hall, M. H. P. and Fagre, D. B., 2003: Modeled Climate-Induced Glacier Change in Glacier 446
National Park,1850–2100. BioScience, 53 (2): 131-140. 447
Harrison, S., Winchester, V. and Glasser, N. F., 2007: The timing and nature of recession of outlet 448
glaciers of Hielo Patagónico Norte, Chile, from their Neoglacial IV (Little Ice Age) maximum 449
positions. Global and Planetary Change; 59, 67-78. 450
Harrison, S. Glasser, N., Winchester, V., Haresign, E., Warren, C., Duller, G.A.T., Bailey, R., Ivy-451
Ochs, S., Jansson, K. and Kublik, P., 2008: Glaciar León, Chilean Patagonia: late-Holocene 452
chronology and geomorphology. The Holocene: 18 (4): 643-652. 453
http://www.glaciologia.cl/spi.html#index. 2003: Southern Patagonia Icefield (Campo de Hielo 454
Sur). Laboratorio de Glaciologia. 455
Kobayashi, S and Saito, T., 1985b: Heat balance on Soler Glacier, In: Nakajima, C. (ed) 456
Glaciological Studies in Patagonia Northern Icefield. 1983-1984. Data Centre for Glacier 457
Research, Japanese Society of Snow and Ice: 46-51. 458
Koch, K., 2009: Improving age estimates for late Holocene glacial landforms using 459
dendrochronology – Some examples from Garibaldi Provincial Park, British Columbia. 460
Quaternary Geochronology, 4: 130–139. 461
Lamy, F., Kilian, R., Arz, H.W., Francois, J-P., Kaiser, J., Prange, M., and Steinke, T. 2010. 462
Holocene changes in the position and intensity of the southern westerly wind belt. Nature 463
Geoscience: 695-699. 464
Lopez, P., Sirguey, P., Arnaud, Y., Pouyard, B., and Chevallier, P., 2008: Snow cover monitoring 465
in the Northern Patagonia Icefield using MODIS satellite images (2000–2006). Global and 466
Planetary Change, 61 (3-4): 103-116. 467

21
Markgraf, V., Whitlock, C. and Haberle, S., 2007: Vegetation and fire history during the last 468
18,000 cal yr B.P. in Southern Patagonia: Mallín Pollux, Coyhaique, Province Aisén (45°41′30″ 469
S, 71°50′30″ W, 640 m elevation). Palaeogeography, Palaeoclimatology, Palaeoecology, 254, 470
(3-4): 492-507. 471
Matsuoka, K., and Naruse, R., 1999: Mass balance features derived from a firn core at Hielo 472
Patagonico Norte (2000). Recent thinning of Soler Glacier, northern Patagonia, South 473
America. Glaciological Studies, 89: l50-l55. 474
Ohata, T., Kondo, H. and Enomoto, H., 1985c: Characteristics of ablation at San Rafael. In: 475
Nakajima, C. (ed), Glaciological Studies in Patagonia Northern Icefield. 1983-1984. Data 476
Centre for Glacier Research, Japanese Society of Snow and Ice: 37-45. 477
Potere, P., 2008: Horizontal Positional Accuracy of Google Earth’s High-Resolution Imagery 478
Archive. Sensors, 8: 7973-7981. 479
Powell, R. D., 1991: Grounding-line systems as second-order controls on fluctuations of tidewater 480
termini of temperate glaciers. In: Anderson, J. B., Ashley, G. M. (eds), Glacial Marine 481
Sedimentation: Palaeoclimatic Significance. Geolological Society of America Special Paper, 482
261, 75 – 93. 483
Rignot,, E., Rivera, A., and Casassa, G., 2003: Contribution of the Patagonia Icefields of South 484
America to Sea Level Rise. Science, 302: 434-437. 485
Rivera, A., and Casassa, G., 1999: Volume Changes on Glaciar Pio XI, Patagonia: 1975-1995. 486
Global and Planetary Change, 22 (1-4): 233-244. 487
Rivera, A., Benham, T., Casassa, G., Bamber, J., Dowdwswell, J. A., 2007: Ice elevation changes 488
of glaciers from the Northern Patagonia Icefield, Chile. Global and Planetary Change, 59: 126-489
137. 490
Rosenblüth, B., Casassa, G., Fuenzalida, H., 1995: Recent climatic changes in western 491
Patagonia. Bulletin of Glacier Research, 13: 127–132. 492

22
Rosenblüth, B. , Fuenzalida, H. A. and Aceituno, P., 1997: Recent temperature variations in 493
Southern South America. International Journal of Climatology, 17: 67–85. 494
Sallée, J-B., Speer, K. G. and Rintoul, S. R., 2010: Zonally asymmetric response of the Southern 495
Ocean mixed-layer depth to the Southern Annular Mode. Nature Geoscience, 3: 273 – 279. 496
Sessions, M. P. N., 1999: Report on Glacier Benito. Unpublished (Available from Author 497
[email protected]). 498
Shevenell, A. E., Ingalls, A. E., Domack, W. and Kelly, C., 2011: Holocene Southern Ocean 499
surface temperature variability west of the Antarctic Peninsula. Nature, 470: 250. 500
Villalba, R., Lara, A., Boninsegna, J. A., Masiokas, M., Delgado, S., Aravena, J. C., Roig, 501
F. A., Schmelter, A., Wolodarsky, A. and Ripalta, A., 2003: Large-scale temperature 502
changes across the Southern Andes: 20th century variations in the context of the past 503
400 years. Climatic Change: 59, 177–232. 504
Villalba, R., Grosjean, M. and Kiefer, T., 2009: Long-term multi-proxy climate reconstructions and 505
dynamics in South America (LOTRED-SA): State of the art and perspectives. 506
Palaeogeography, Palaeoclimatology, Palaeoecology, 281: 175–179. 507
Vimeux, F., de Angelis, M., Ginot, P., Magand, O., Casassa, G., Pouyaud, B., Falourd, S., 508
Johnsen, S. 2008. A promising location in Patagonia for paleoclimate and paleoenvironmental 509
reconstructions revealed by a shallow firn core from Monte San Valentín (Northern Patagonia 510
Icefield, Chile), Journal of Geophysical Research. 113 (D16): 20pp 511
Vince, G., 2010. Energy Dams for Patagonia. Science, 329: 382-385. 512
Warren, C.R. 1993. Rapid recent fluctuations of the calving San Rafael Glacier, Chilean 513
Patagonia: climatic or non-climatic? Geografiska Annaler, 75a: 111-125. 514
Warren, C. R., Glasser, N. F., Harrison, S., Winchester, V., Kerr, A. and Rivera, A., 1995: 515
Characteristics of tide-water calving at Glaciar San Rafael, Chile. Journal of Glaciology, 516
41(138): 273-289. 517
23
Warren, C. R. and Aniya, M., 1999: The calving glaciers of Southern South America. Global 518
and Planetary Change, 22: 59-77. 519
Winchester, V. Harrison, S., 1994: A development of the lichenometric method applied to 520
the dating of glacially influenced debris flows in Southern Chile. Earth Surface Processes 521
and Landforms, 19: 137-151. 522
Winchester, V. and Harrison, S., 1996: Recent oscillations of the San Quintin and San 523
Rafael Glaciers, Patagonian Chile. Geografiska Annaler, 78A(1): 35-49. 524
Winchester, V., Harrison, S., Washington, R. and Warren, C. R., 1999: Austral summer of 525
1998: observations on El Niño and the North Patagonian Icefield. Weather, 54(9): 287- 526
293. 527
Winchester, V. and Harrison S., 2000: Dendrochronology and lichenometry: an 528
investigation into colonization, growth rates and dating on the east side of the North 529
Patagonian Icefield, Chile. Geomorphology, 34 (1-2): 181-194. 530
Winchester, V., Harrison S., Warren, C. R., 2001: Recent Retreat Glaciar Nef, Chilean Patagonia, 531
dated by Lichenometry and Dendrochronology. Arctic, Antarctic and Alpine Research, 33(3): 532
266-273. 533
534

24
List of Figures 535
Figure 1: Location of Icefield and glaciers previously studied (adapted from Warren 1993). 536
537
Figure 2: Northern valley-wall trimline picked out by sunlight, photographed from the island (Photo 538
V. Winchester). 539
540
Figure 3: The 1972/73 stake network (st1 to st4): connected circles showing movement over 70-541
days. The 2007 network (S1 to S5): open single circles show movement over 13 days. Triangles 542
mark base survey-stations. The line between survey points represents the profile shown in 543
Figure 6. 544
545
Figure 4: Bathymetric survey with recent moraines and, below, A-B profile of proglacial lake and 546
glacier foreland in 2007. The deepest area of the lake on the northeastern valley side accounts for 547
the asymmetry of the ice front until it lost contact with its terminal shoreline. 548
549
Figure 5: Benito Glacier: Oblique trimetrogon aerial view (1944), satellite image (1974), and 550
Google Earth views (1998 and 2002). 551
552
Figure 6: Glacier surface lowering between 1972 and 2007 with stake survey measurement 553
stations marked. 554
555
Figure 7: Tree-ring dates mapped on to superimposed glacier positions extrapolated from a 1944 556
orthorectified aerial photograph, satellite image acquired in1974 and Google Earth Images from 557
1998 and 2002. measured recession rates between A * and * B are shown. 558
559
25
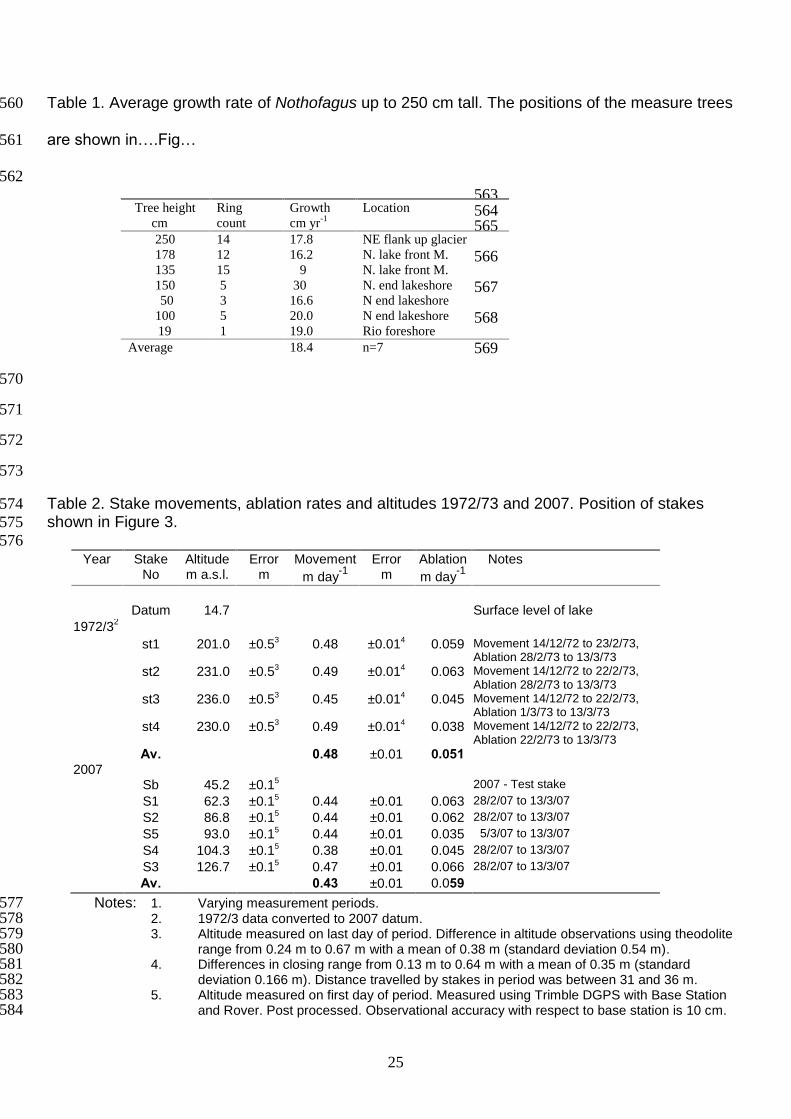
Table 1. Average growth rate of Nothofagus up to 250 cm tall. The positions of the measure trees 560
are shown in….Fig… 561
562
563 564 565
566
567
568
569
570
571
572
573
Table 2. Stake movements, ablation rates and altitudes 1972/73 and 2007. Position of stakes 574
shown in Figure 3. 575
576 Year Stake
No Altitude m a.s.l.
Error m
Movement
m day-1
Error m
Ablation
m day-1
Notes
Datum 14.7 Surface level of lake
1972/32
st1 201.0 ±0.53 0.48 ±0.014 0.059 Movement 14/12/72 to 23/2/73, Ablation 28/2/73 to 13/3/73
st2 231.0 ±0.53 0.49 ±0.014 0.063 Movement 14/12/72 to 22/2/73, Ablation 28/2/73 to 13/3/73
st3 236.0 ±0.53 0.45 ±0.014 0.045 Movement 14/12/72 to 22/2/73, Ablation 1/3/73 to 13/3/73
st4 230.0 ±0.53 0.49 ±0.014 0.038 Movement 14/12/72 to 22/2/73, Ablation 22/2/73 to 13/3/73
Av. 0.48 ±0.01 0.051
2007
Sb 45.2 ±0.15 2007 - Test stake
S1 62.3 ±0.15 0.44 ±0.01 0.063 28/2/07 to 13/3/07
S2 86.8 ±0.15 0.44 ±0.01 0.062 28/2/07 to 13/3/07
S5 93.0 ±0.15 0.44 ±0.01 0.035 5/3/07 to 13/3/07
S4 104.3 ±0.15 0.38 ±0.01 0.045 28/2/07 to 13/3/07
S3 126.7 ±0.15 0.47 ±0.01 0.066 28/2/07 to 13/3/07
Av. 0.43 ±0.01 0.059
Notes: 1. Varying measurement periods. 577 2. 1972/3 data converted to 2007 datum. 578 3. Altitude measured on last day of period. Difference in altitude observations using theodolite 579
range from 0.24 m to 0.67 m with a mean of 0.38 m (standard deviation 0.54 m). 580 4. Differences in closing range from 0.13 m to 0.64 m with a mean of 0.35 m (standard 581
deviation 0.166 m). Distance travelled by stakes in period was between 31 and 36 m. 582 5. Altitude measured on first day of period. Measured using Trimble DGPS with Base Station 583
and Rover. Post processed. Observational accuracy with respect to base station is 10 cm. 584
Tree height
cm Ring
count
Growth
cm yr-1
Location
250 14 17.8 NE flank up glacier
178 12 16.2 N. lake front M.
135 15 9 N. lake front M.
150 5 30 N. end lakeshore
50 3 16.6 N end lakeshore
100 5 20.0 N end lakeshore
19 1 19.0 Rio foreshore
Average 18.4 n=7

26
585
586

27
Table 3a Comparative data for glacier surface elevation changes of the stake network 1973-2007. 587
3b: surface elevation changes of the stake network 2007-2011 (data reduced to 2007 datum). 588
Stake positions shown in Figure 3. 589
a 590
Stake ID 1973
Stake Altitude
1
m a s l
Error m
Closest Stake 2007
Stake Altitude
1
m a s l
Error m
Altitude from contour map
2
m a s l
Error3
m Change 1973 to 2007
m
Error m
st1 201 ±0.5 S1 62.3 ±0.1 50 ±4.5 151 ±5.0
Sb 45.2 ±0.1
st4 230 ±0.5 S2 86.8 ±0.1 84 ±1.5 146 ±2.0
st2 231 ±0.5 S5 83.5 ±1.2 79 ±1.5 151 ±2.0
st3 236 ±0.5 S4 104.3 ±0.1 90 ±4.5 146 ±5.0
Average 148.5 ±5.0
Annual change 4.37
±0.18
591
592
593 b 594
Stake ID 2007
Stake Altitude 2007
1
m a s l
Error m
Position Altitude 2011
m a s l
Error m
Distance from 2007
stake m
Topographic Error
2, 4
m
Change 2007 to 2011
m
Error m
S2 86.8 ±0.1 61.1 ±0.1 22 ±3.0 25.6
S3 126.7 ±0.1 100.8 ±0.1 23 ±3.0 25.8
S4 104.3 ±0.1 82.4 ±0.1 35 ±2.0 21.9
Average 24.4 ±3.0
Annual change 6.1 ±0.5
595 Notes 3a, 3b 596 1. Data from Table 2. 597 2. Derived from 2007 Expedition Map, created from DGPS “Rover” readings. 598 3 Error when correcting the 1973 ice surface elevation to the 2007 position. 599 4. Error when correcting the 2011 ice surface elevation to the 2007 position. 600
601
28
Table 4. Dendrochronological data. 602 603 Latitude S
Longitude W
Location
Core ID
Ring count Yrs to pith Yrs to core ht
Yrs to ecesis
Est. date
47001'51.4"
73054'18.9"
Island crest W. flank 8 15 0 1 16 1974
47001'51.4" 73054'18.9"
Island E flank 9 9 3 1 19 1974
47001'51.4"
73054'22.3"
S.Rio lakeside M
10 9 3 1 19 1974
47001'51.4"
73054'22.4"
S.Rio lakeside M
11 15 0 1 16 1974
47001'46.6"
73054'21.2"
Camp M S.
4 31 2 2 16 1955
47001'44.4"
73054'22.1"
Camp M S.
6 24 3 4 19 1956
47001'40.1"
73054'21.2"
Camp M channel
15 28 2 2 16 1958
47001'34.5"
73050'18.6"
Lake-end outer M base 17 30 3 2 16 1955
47001'34.5"
73054'17.9"
N lake-end stream 18 26 3 2 16 1959
47001'34.5"
73054'13.7"
N lake end middle M 22 21 0 2 19 1964
47001'34.5"
73054'16.1"
N lakefront M
19 13 3 1 19 1970
47001'34.5"
73054'12.2"
N lakefront M
24 17 1 2 16 1970
47001'34.5"
73054'12.1"
Lakefront M NE corner 27 15 3 1 19 1970
47001'28.4"
73054'13.2"
Gt M channel edge 35 30 5 2 19 1950
47001'41.4"
73054''28.0"
Trimline forest
38 110 10 7 19 1860
47001'41.4" 73054'18.4" Trimline ravine edge 37 107 11 6 19 1863
47001'41.1" 73054''28.0" Trimline channel 41 97 1 6 19 1883
47001'26.0"
73054'39.2"
N end Gt M outer crest 48 82 12 7 19 1886
47001'26.9"
73054'42.8"
N end Gt M mid. crest
50 85 4 6 19 1892
47001'28.7"
73054'37.2"
N end Gt M inner crest 51 63 19 4 19 1902
47002'05.0"
73055'25.9"
S end Gt M crest
2 115 6 8 19 1858
604 Ring count dated from last ring formed in 2006. 605 Gt M = Great Moraine. Camp M. S. = Camp moraine south end 606 Years to pith: number of rings added to count where core did not reach centre. The number derived by fitting concentric circles 607 scribed on acetate to the curves of oldest rings visible in cores. 608 Years to core height: estimated number of rings above ground and below core height based on average growth rate of 18.4 cm yr 609 (Table 1). 610 Years to ecesis: estimated number of years taken for seeds to germinate after ice retreat based on delay before germination 611 on proximal side of island = 19 years, and distal side = 16 years. 612 Estimated date = Ring count+years to pith+years to core height+ecesis (19 years added to all 19th century dates). 613 614 615 616