Embed Size (px)
Citation preview
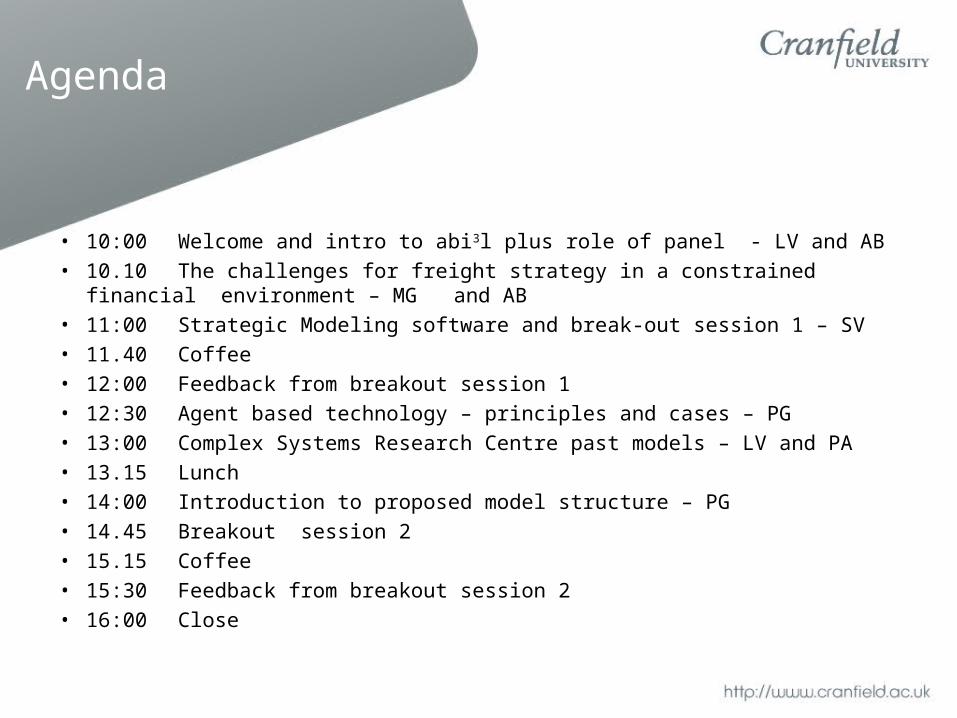
Agenda
• 10:00 Welcome and intro to abi3l plus role of panel - LV and AB• 10.10 The challenges for freight strategy in a constrained financial environment – MG
and AB• 11:00 Strategic Modeling software and break-out session 1 – SV• 11.40 Coffee• 12:00 Feedback from breakout session 1• 12:30 Agent based technology – principles and cases – PG• 13:00 Complex Systems Research Centre past models – LV and PA• 13.15 Lunch• 14:00 Introduction to proposed model structure – PG• 14.45 Breakout session 2 • 15.15 Coffee• 15:30 Feedback from breakout session 2• 16:00 Close

AGENT BASED INTELLIGENT LOGISTICS abi3l
209083_presentation251110
Partners
MDS Transmodal - lead
Cranfield University
LCP Consulting
Barloworld Supply Chain Software
Part funded by the Technology Strategy Board
What is abi3l?
• - an attempt to employ agent based modelling to the freight industry
• What is Agent Based Modelling?
• forecasting on the basis of the behaviour of decision makers
• Why try?
• because existing methods are normally optimisation exercises for individual actors
• but the freight industry is far more complex

Defining the freight industry
• All those companies & authorities facilitating and initiating the movement of freight• Infrastructure owners & operators• Equipment owners & operators• End users
• In practice• Retailers & wholesalers• Ports• Shipping lines• Hauliers• Train operators• Forwarders• 3PLs• Road and rail network providers• Developers
• The decisions each make define the opportunities available to the rest• Freight almost entirely in the private sector

The challenge for freight investment policy
• Carbon reduction and freight’s contribution

The challenge for freight investment policy …
• Economic value from freight and logistics
• 5% of the total vehicle parc create 25% of emissions
• 5% of the vehicle parc creates up to 50% of the congestion on the national network
• Tonne-kms have decoupled but more will be needed

The challenge for freight investment policy …
• Radical solutions are needed and will not be enough
• Will need to re-design networks to reduce T-kms

The challenge for freight investment policy …
• Network investment will be increasingly private as public spending commitments are reduced
Department for Transport
£ billion
2010-11 2011-12 2012-13 2013-14 2014-15
Resource DEL1 5.1 5.3 5.0 5.0 4.4
Capital DEL 7.7 7.7 8.1 7.5 7.5
Total DEL 12.8 13.0 13.1 12.5 12.0

Policy elements
• …to drive change
• Regulation
• Fiscal measures
• Planning
• Private investment
• Public investment
• Complex interactions – difficult choices
Arguments for modelling & forecasting
• For the State• To get policies on taxation & investment• To regulate• To satisfy international agreements re climate change• To promote economic efficiency• Only achievable through understanding private sector
business decisions• For the private sector
• To make optimum investment decisions based on the behaviour of the other actors
• To accelerate pace of change by understanding how other actors behave, reducing risk

Illustrating interactions
• The more deep sea port development in the South East• The better the case for rail freight terminals in Northern England
• The more rail freight activity • The better the case for warehouse development on rail linked
sites• The more rail linked sites
• The more skeletal trailers required• The more rail network capacity required
• The faster imports grow from the Far East• The more deep sea port development• But where should be?
• A complex system!

Our process
• To establish interactions within the industry• A matrix of relationships• Populated by companies
• To populate those relationships with data• Synthetic cargo flows• Transport costs
• To model interactions• Modify parameters
• To produce a calibrated model
Data sources
• Through GB Freight Model/State
• Continuing Survey Road Goods Transport
• Network Rail
• Maritime Statistics
• Customs & Intrastat
• Privately sourced
• Generic data on production & consumption

Our offer to the Panel
• In exchange for advice on interactions in the industry
• To provide insight into the outcomes of our modelling and the applicability of the tool
• Our goal is to produced a suite of pilot models for different actors in the chain

Agenda
• 10:00 Welcome and intro to abi3l plus role of panel - LV and AB• 10.10 The challenges for freight strategy in a constrained financial environment – MG
and AB• 11:00 Strategic Modeling software and break-out session 1 – SV• 11.40 Coffee• 12:00 Feedback from breakout session 1• 12:30 Agent based technology – principles and cases – PG• 13:00 Complex Systems Research Centre past models – LV and PA• 13.15 Lunch• 14:00 Introduction to proposed model structure – PG• 14.45 Breakout session 2 • 15.15 Coffee• 15:30 Feedback from breakout session 2• 16:00 Close
Strategy and software
• Strategic Software modeling
• Strategic, Tactical & Operational Models
• Software Approaches
• Strategy Formulation –
Optimization Vs Robustness
• Breakout Session – Format for response

Freight Software Document Inclusion
Existing modelling software
Software Approaches
• Evaluation/Simulation – Base position – Prescribing alternative Solution
• Optimization – Optimization Engine
*Based on internal data and evaluated after the event

Strategy Formulation
• Optimization Vs RobustnessOptimization may drive seemingly appropriate strategic decisions
in the form of capital investment yet does not mitigate risk
• 3663 Example 18.5 ton vehicles purchased to consolidate distribution (right
decision at time) Category growth in the Chilled product group
*In an uncertain world – awareness the whole picture matters!!

Strategy
• Matching Capabilities – Against Environment
Understanding the environment
(today & tomorrow)
is fundamental to success

Break Out SessionStrategic Decision Making Process
• External Factors
• Identification
• Incorporation
• Of ‘knowledge’
• Simulation of impact
• Consultancy
• applicable to your business?
• how, where, for what?
Briefing Documentfor breakout session – Strategic Modelling Software
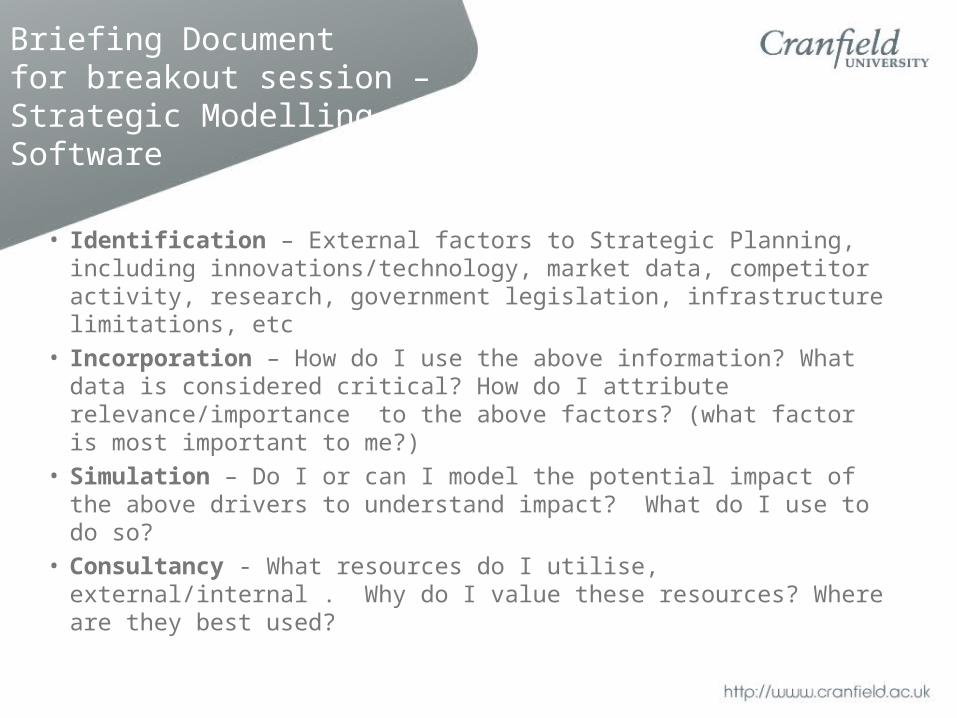
• Identification – External factors to Strategic Planning, including innovations/technology, market data, competitor activity, research, government legislation, infrastructure limitations, etc
• Incorporation – How do I use the above information? What data is considered critical? How do I attribute relevance/importance to the above factors? (what factor is most important to me?)
• Simulation – Do I or can I model the potential impact of the above drivers to understand impact? What do I use to do so?
• Consultancy - What resources do I utilise, external/internal . Why do I value these resources? Where are they best used?

Agenda
• 10:00 Welcome and intro to abi3l plus role of panel - LV and AB• 10.10 The challenges for freight strategy in a constrained financial environment – MG
and AB• 11:00 Strategic Modeling software and break-out session 1 – SV• 11.40 Coffee• 12:00 Feedback from breakout session 1• 12:30 Agent based technology – principles and cases – PG• 13:00 Complex Systems Research Centre past models – LV and PA• 13.15 Lunch• 14:00 Introduction to proposed model structure – PG• 14.45 Breakout session 2 • 15.15 Coffee• 15:30 Feedback from breakout session 2• 16:00 Close

Challenges & opportunities of complex environments
• How do we recognize complexity and why do we need to approach it differently?
• Why bother?
• What’s been done so far?
• What does good look like?
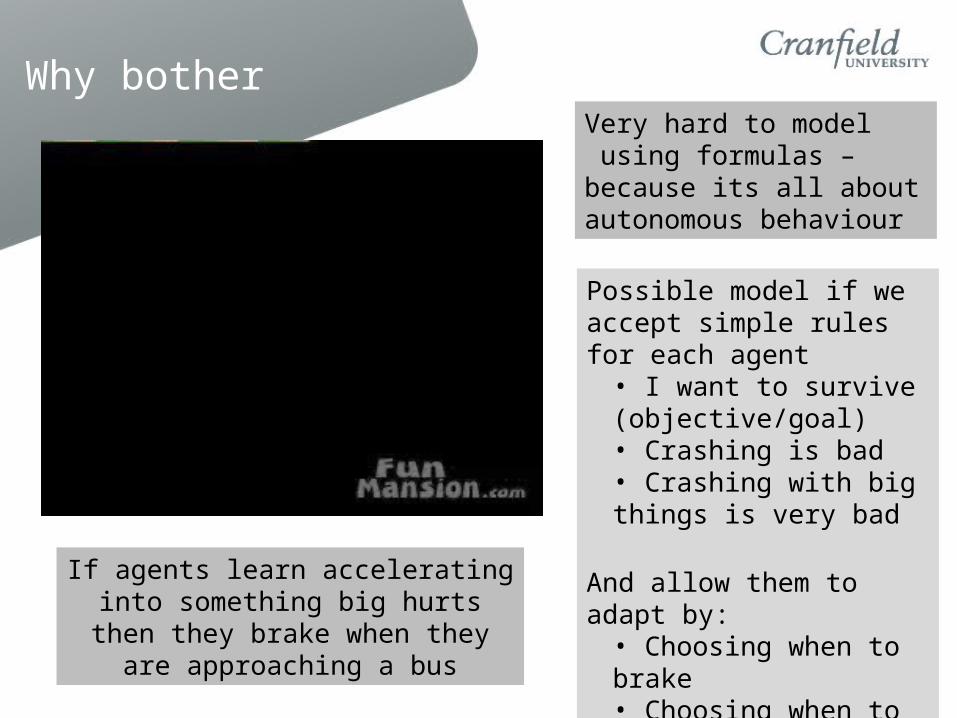
Why botherVery hard to model using formulas – because its all about autonomous behaviour
Possible model if we accept simple rules for each agent
• I want to survive (objective/goal)• Crashing is bad• Crashing with big things is very bad
And allow them to adapt by:• Choosing when to brake• Choosing when to accelerate
If agents learn accelerating into something big hurts then they brake when they are approaching a bus

Freight networks are similar
• The network is “self-organising”
• Warehouses are built without co-ordination
• Rail, road, and port investments are not co-ordinated
• Freight movements at a national level are not co-ordinated
• Policy is modally focused
Outcomes are therefore not predicted but emergent

Interdependencies
Transport Policy
Modal Investments
Modal Capacity
Modal Choices
Ship RailRoad
CO-EVOLUTIO
N
Some examples of ABM & Freight

Collaboration in Freight
Cost 1
Cost 2
Cost 3Adapted from: Krajewska & Kopfer (2006)

Collaboration in Freight
Cost 1
Cost 2/2 < Cost 1
Cost 3
Trivial until : • Large no of manufacturers• Large no of freight consolidators • Capacity constraints• Accumulation of benefits• Different contract lengths• Negotiation• Different pricing strategies
Optimal number of freight forwarders ?• Too many and scale effects are minimal• To few and power influences pricing strategy
Adapted from: Krajewska & Kopfer (2006)
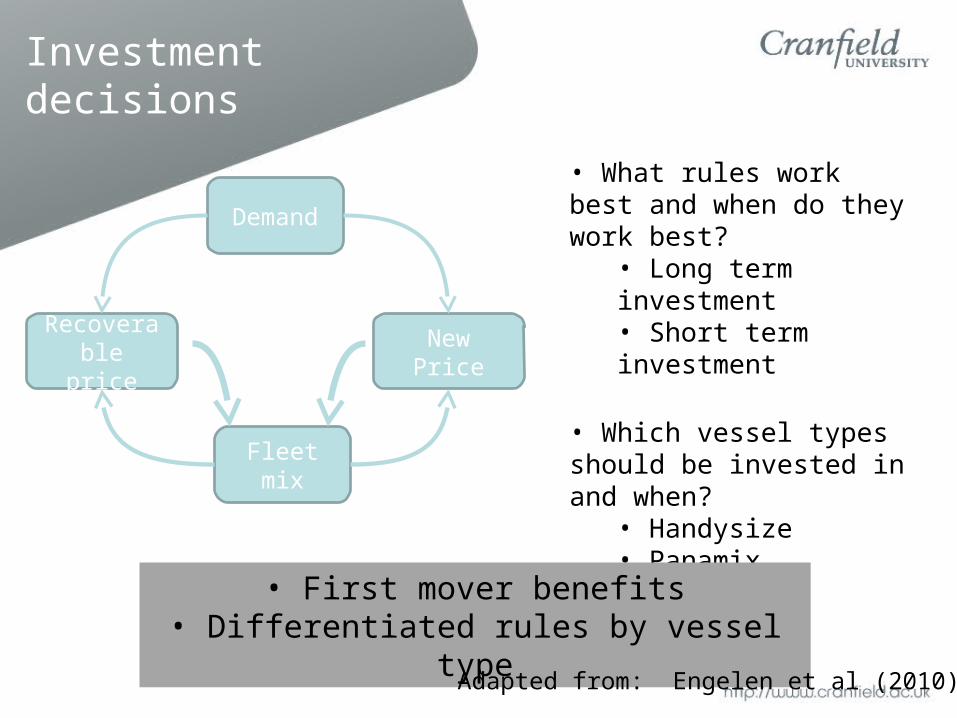
Investment decisions
Demand
Fleet mix
New PriceRecoverabl
e price
• What rules work best and when do they work best?
• Long term investment• Short term investment
• Which vessel types should be invested in and when?
• Handysize• Panamix• Capesize
• First mover benefits• Differentiated rules by vessel type
Adapted from: Engelen et al (2010)

Behaviour and policy interactions
Agents allowed to plan routes under different policies – motorway charging and no charging
Agents that were allowed to make mistakes learned faster and outperformed those that didn’t make mistakes
Policy frameworks that incorporate learning are
more likely to achieve their objectives
Adapted from: Liedtke (2009)
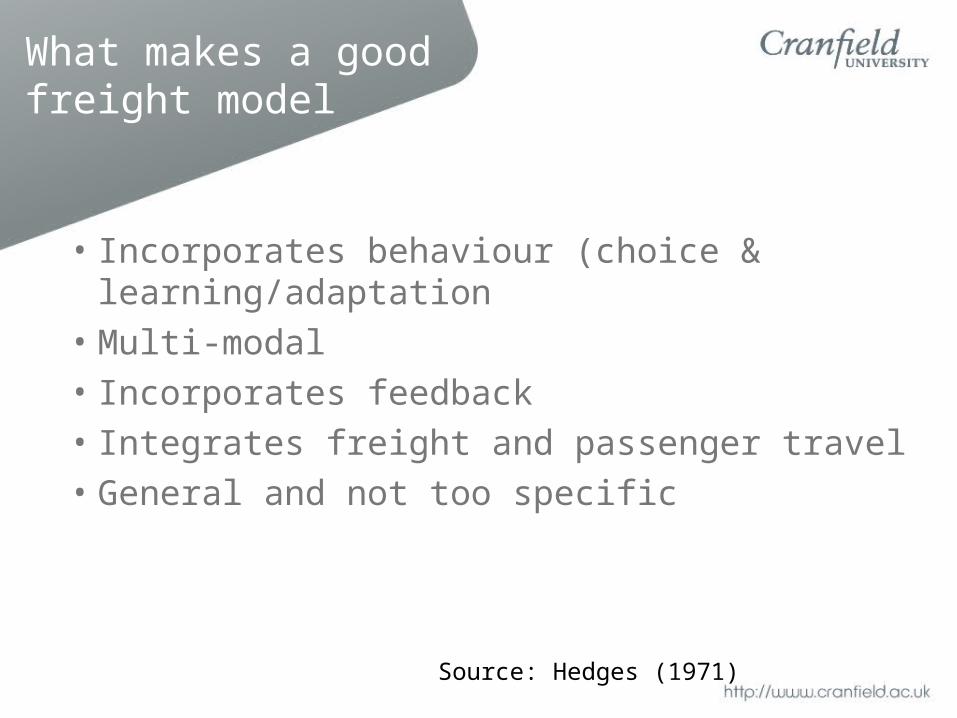
What makes a good freight model
• Incorporates behaviour (choice & learning/adaptation
• Multi-modal
• Incorporates feedback
• Integrates freight and passenger travel
• General and not too specific
Source: Hedges (1971)

Literature review
Purpose of Model Source
Freight and passenger interactions
Zhang et al (2005); Peeta et al (2005)
Evaluate policy impact Liedtke (2009)
Minimise system cost Krajewska & Kopfer (2006)
Optimise location of infrastructure
Van Dam et al (2007); Wang & Jiang (2007);
Frameworks van Dam et al (2003); Roorda et al (2010); Hendher & Puckett (2005); Dong & Li (2003);
Asset Investment Engelen et al (2007)
Most of the literature describes frameworks

Modelling frameworks (single Layer)
Business Unit Agent
Attributes Assets Processes
Business Unit Agent
Attributes Assets Processes
1 Level of inter-agent relationship
Each Agent has a set of:• Assets
• Attributes • Processes
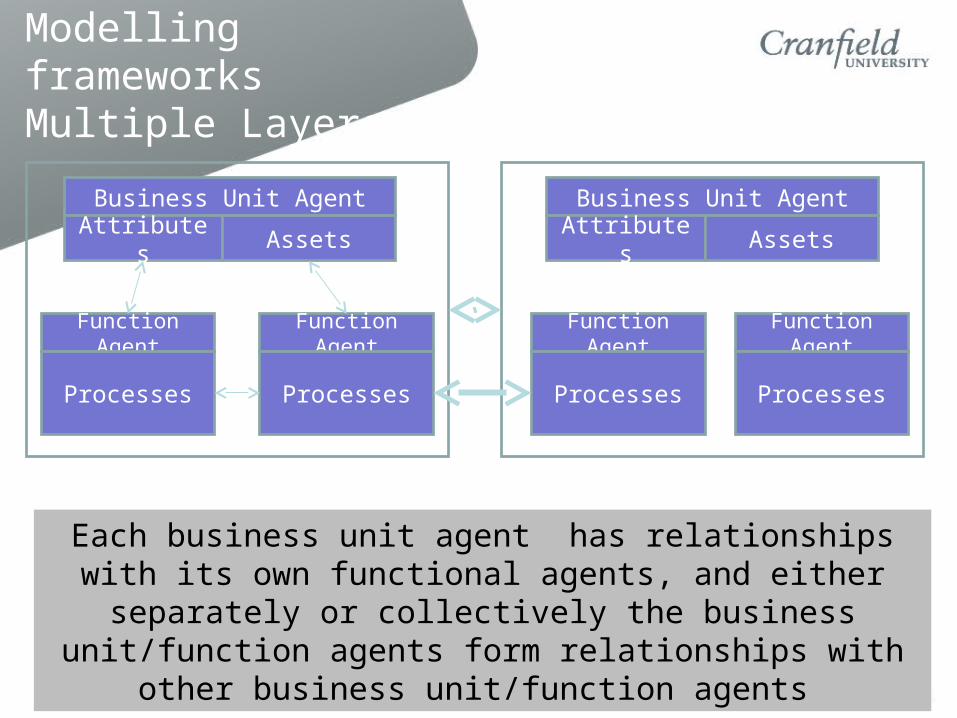
Modelling frameworks Multiple Layers
Each business unit agent has relationships with its own functional agents, and either separately or collectively the business unit/function agents form relationships with other
business unit/function agents
Business Unit Agent
Attributes Assets
Function Agent
Processes
Function Agent
Processes
Business Unit Agent
Attributes Assets
Function Agent
Processes
Function Agent
Processes

Summary
• Freight movement plays out on a rich landscape incorporating many agent types
• The freight landscape incorporates many dependencies
• Freight agents make autonomous decisions with limited knowledge of the big picture
• Limited visibility requires constant adaptation to an ever changing environment

Agenda
• 10:00 Welcome and intro to abi3l plus role of panel - LV and AB• 10.10 The challenges for freight strategy in a constrained financial environment – MG
and AB• 11:00 Strategic Modeling software and break-out session 1 – SV• 11.40 Coffee• 12:00 Feedback from breakout session 1• 12:30 Agent based technology – principles and cases – PG• 13:00 Complex Systems Research Centre past models – LV and PA• 13.15 Lunch• 14:00 Introduction to proposed model structure – PG• 14.45 Breakout session 2 • 15.15 Coffee• 15:30 Feedback from breakout session 2• 16:00 Close

Logistics, Complexity and Modelling
• Cranfield’s Complex Systems Research Centre

• In reality - National is sum of Regional – which is sum of local etc. Structure is
multi-scaled!
• Structure is driven by decisions and policies concerning factors such as: Economic activities, salaries, rents and taxes. Industry, commerce, manufacturing, retail, services, finance….
• Logistics reflect and affect the distribution of people, ages, employment, education, crime, travel, patterns of demand, family size, health, lifestyle, unemployment etc.
Overall Development depends on Multiple Scales

Can we build an “emergent” distribution system?
• Can we build a system that will itself design and adapt its structure over time?
• It will need to represent the way that the many actors in the system operate, and how their actions affect each other.
Cost of production
Costs of transportTo Showroom
Costs of Showrooms
Costs of gettingTo Customer

Simple Case Study:Photocopiers across the UK
1
7
13
19
25
S1 S5 S9
S13
-10-50510152025303540455055
Av.No.Machines/day
Distribution of Demand
50-55
45-50
40-45
35-40
30-35
25-30
20-25
15-20
10-15
5-10
0-5
-5-0
-10--5
We can model the emergence of distribution centresThese might be warehouses or depots or might be centres of
repairs, spare parts etc.

Actual Photocopier Distribution Centres
1
6
11
16
21S
1 S5 S9
-100102030405060708090100110120
Machines/day
Actual Locations ofDistribution Centres
110-120
100-110
90-100
80-90
70-80
60-70
50-60
40-50
30-40
20-30
10-20
0-10
-10-0
The Case Study modelled had actual distribution centres as aboveThe questions asked are: How many Centres should there be?
Are the ones we have in the right places?

What goes into the model?
• Factory Gate prices
• Costs of distribution to showrooms
• Costs of showrooms (Fixed and variable) – with unit costs falling with volume
• Road Network distance to customers

A Self-OrganizingModel
•Demand is considered to be proportional to the population
•Distances are calculated using road networks that can provide both distance and time of travel
•Costs of warehousing depends on density of land-use
•Cost/unit of goods transfer depends on volume

Mathematics……..
k
ljk
lji
A
AjilAttraction
,
,),(
),(*)((Pr*exp, jiDostsTransportCiiceRAl ji
Attractionl(i,j) = attraction of Centre i as viewed by customer of type l located at j.R = Rationality (linked to homogeneity of customers l,
information…)Price(i) = Factory Gate Price(k) + Transport Costs to Centre i from k + costs at i.Factory Gate Price (k) = Capital costs, land, labour at kCosts at Centre i = Capital Costs, land, labour at i
Customer lat j
Centre iProductionat k

Can use a Model to create “emergent structure”:
RandomBehaviours
Attractors,Routines
Running Modelforward
Knowledge GenerationUnder different levels of disturbance
-5 -5 -5 -5
-5
0
5
10
15
20
Self-Organising LogisticsThe Initial Condition
15-20
10-15
5-10
0-5
-5-0
Each Cell is a small distribution centre
1
5
9
13
17
21S
1 S3 S5 S7 S9
S11
-100102030405060708090100110120
Machines/day
Location of CentresSuggested by Model
110-120
100-110
90-100
80-90
70-80
60-70
50-60
40-50
30-40
20-30
10-20
0-10
-10-0
CustomersChoice
NodeVolume
Price+
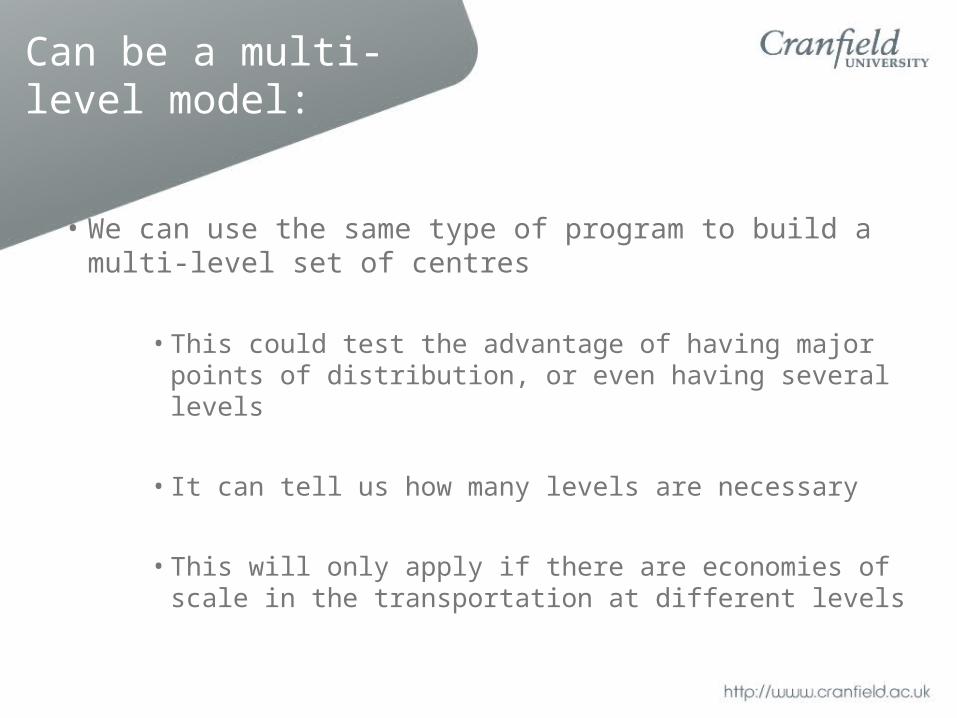
Can be a multi-level model:
• We can use the same type of program to build a multi-level set of centres
• This could test the advantage of having major points of distribution, or even having several levels
• It can tell us how many levels are necessary
• This will only apply if there are economies of scale in the transportation at different levels

Improved Transport Infrastructure for West Bengal
• Work with Asian Development Bank for West Bengal
• Survey by Halcrow Consultants of the current flows of goods on the roads
• Transport Infrastructure projects: effects on transport costs.
• Economic gains lead to increased consumption and production. Spatial multipliers on jobs created allows calculation of the “impact on poverty” – where and how much extra employment and wealth created

Application to West Bengal
market and costs
migration attraction
comparativeadvantage
comparativeadvantage
resourceuse
resourcesuse
potantialdegradation
investmentpopulationgrowth
spatial pattern of
natural resources
spatial pattern of
population economic activity
spatial pattern of
householdincome
demand
migrationattractivity
supplysupply
price
profit
investment
costscostsproductivity
vacancy
jobs
wages
population
water supply
adult
availableland
population
+
+
+-
+
- +
+
+
+
+
+
+
-
++
+
+
+ +
-
-
-
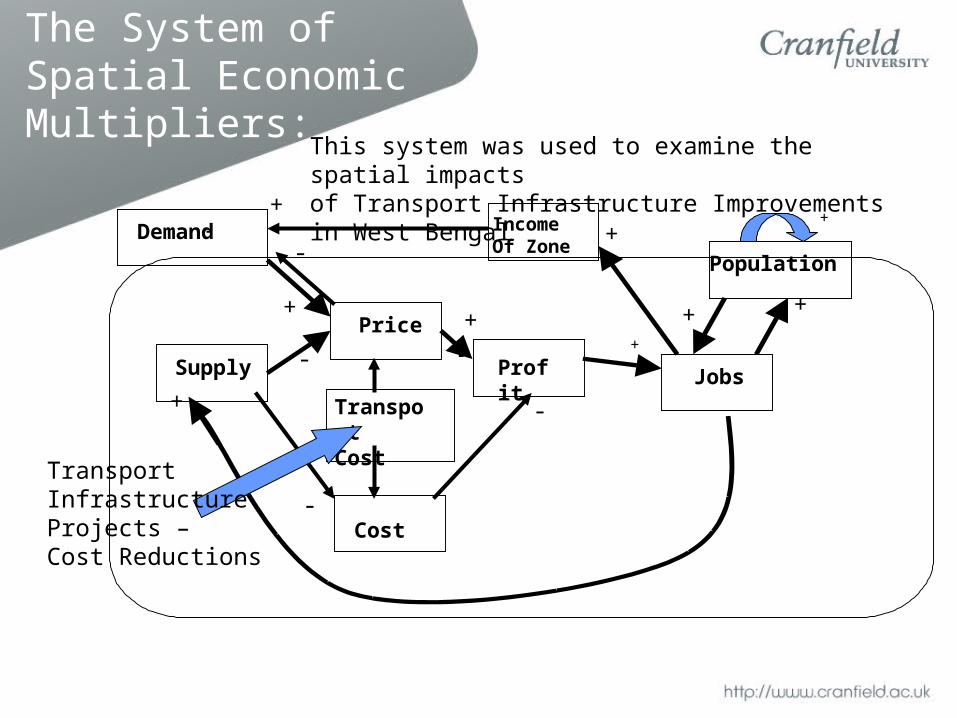
The System of Spatial Economic Multipliers:
Demand
Supply
Price
Cost
Profit Jobs
IncomeOf Zone
Population
TransportCost
+
-
- +
Transport InfrastructureProjects – Cost Reductions
-
-
-
-
++
+
++
++
This system was used to examine the spatial impactsof Transport Infrastructure Improvements in West Bengal

2025 – Jobs Created – Poverty Reduction….
Jobs in Agriculture, Industry and Services
Savings made by Poor, Medium and Rich

Effects of Investments:
Adding 50Million$ - 2 Scenarios
Scenario 1- equiv 26%, Scenario 2 - equiv 28%
0
50,000,000,000
100,000,000,000
150,000,000,000
200,000,000,000
250,000,000,000
300,000,000,000
350,000,000,000
400,000,000,000
1998
2000
2002
2004
2006
2008
2010
2012
2014
2016
Ad
de
d G
DP
Np
rps
Scenario 2-1
Interest 1
Scenario 3-1
Interest 2
0.00
100.00
200.00
300.00
400.00
500.00
600.00
1 2 3 4 5
Gross Regional Products (BnNprps) 3 Scenarios 2017
GRP1
GRP2
GRP3
),(
),(),((Pr*
)(
),(*),(Pr*exp(
ilCost
ilCostilice
lSum
ilJobilyrityAttractiviInvestment
Is it worth investing in Nepal?

Spatial Implications by Sector:
0
200
400
600
800
1 2 3 4 5
New Agricultural Jobs 1997-2017
Scenario 1
Scenario 2
Scenario 3
0
50000
100000
150000
200000
250000
300000
1 2 3 4 5
New Industrial Jobs 1997-2017
Scenario 1
Scenario 2
Scenario 3
0
10000
20000
30000
40000
50000
60000
70000
1 2 3 4 5
New Service jobs 1997-2017
Scenario 1
Scenario2
Scenario 3
-300
-250
-200
-150
-100
-50
0
DjobAg DjobInd DjobSer
Region 1
Region 1
-400
-300
-200
-100
0
1 2 3
Region 2
Region 2
-600
-500
-400
-300
-200
-100
0
1 2 3
Region 3
Region 3
-20000
0
20000
40000
60000
80000
100000
120000
1 2 3
Region 4
Region 4
-1200
-1000
-800
-600
-400
-200
0
1 2 3
Region 5
Region 5
-300
-250
-200
-150
-100
-50
0
1 2 3
Region 1
Region 1
-400
-300
-200
-100
0
1 2 3
Region 2
Region 2
-200-150-100
-500
50100150
1 2 3
Region 3
Region 3
-20000
0
20000
40000
60000
80000
100000
120000
1 2 3
Region 4
Region 4
-200
0
200
400
600
800
1 2 3
Region 5
Region 5
Jobs -Scenario 2
Jobs – Scenario 3

Conclusions:
• This preliminary and simple model showed how infrastructure decisions and the changed patterns of freight distribution can re-structure the whole regional economy
• The models are based on the decisions of agents within the system and can explore the potential impacts of changed investments.

Agenda
• 10:00 Welcome and intro to abi3l plus role of panel - LV and AB• 10.10 The challenges for freight strategy in a constrained financial environment – MG
and AB• 11:00 Strategic Modeling software and break-out session 1 – SV• 11.40 Coffee• 12:00 Feedback from breakout session 1• 12:30 Agent based technology – principles and cases – PG• 13:00 Complex Systems Research Centre past models – LV and PA• 13.15 Lunch• 14:00 Introduction to proposed model structure – PG• 14.45 Breakout session 2 • 15.15 Coffee• 15:30 Feedback from breakout session 2• 16:00 Close
abi3l approach
• A new framework – why and what is it
• DNA approach
• Model purpose
• Data and relationships

Why not a single layer approach?
What processes to include in each agent type?
Can a retailer also be a service provider?
End up with a lot of programming – which is
difficult to control, validate and verify !
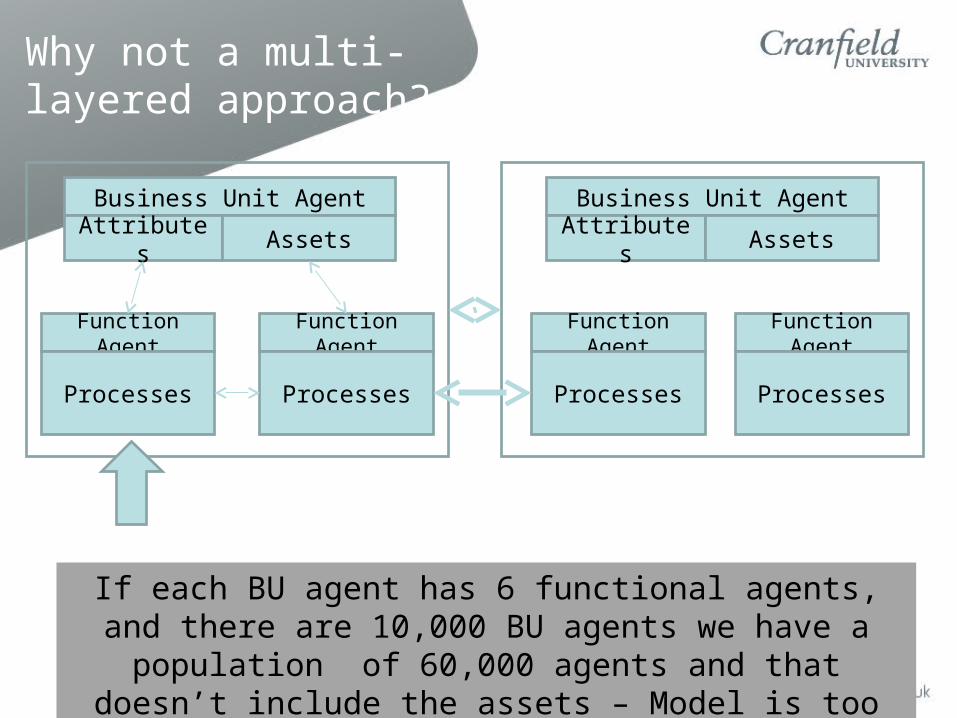
Why not a multi-layered approach?
Business Unit Agent
Attributes Assets
Function Agent
Processes
Function Agent
Processes
Business Unit Agent
Attributes Assets
Function Agent
Processes
Function Agent
Processes
If each BU agent has 6 functional agents, and there are 10,000 BU agents we have a population of 60,000 agents and that doesn’t include the assets – Model is too big!!!!

DNA approach
• Each BU has a DNA which determines:• What it does e.g. Retailer and road transport provider
[agent type chromosome]• What commodities it deal with [commodities
chromosome ]• What types of Assets it owns [Asset chromosome]• Infrastructure ownership [infrastructure ownership]• A description of its strategy mix [strategy
chromosome]• What processes it can access [process chromosome]

Genetic structure
Chromosome No of genes
Genetic influence
Agent type 12 Defines process template required to function
Commodity type
33 Determines what sort of agents it can form relationships with
Assets 10 Used in conjunction with agent type to define what assets are required to support the process template
Infrastructure 8 Determines who the agent forms relationships with and what processes are accessed
Processes 29 What process the agent carries out
Strategy 5 How the agent measures performance and its attitude to the environment
In theory this approach would allow in excess of 16,000 agent types and characters in excess of 7000 for each agent type

An example
The Agent chromosome
Retailer
Freight service provider by Rd
Warehousing service provider
•What sort of retailer?
•What sort of product?
•What sort of warehouses?
•What sort of vehicles?

An example (continued)
• Commodity chromosome indicates
• Grocery
• Clothing
• Asset Chromosome indicates
• Ambient HGVs & warehousing
• Chilled HGV’s & warehousing
• Frozen HGVs & warehousing

An example a bit more
• Strategy Chromosome
• Cost
• Collaboration
• Fast learning
• Innovative
• Sources domestically & imports
Prioritise partners who are low cost and have propensity to collaborate
Frequently measure performance and adapt to changes in performance
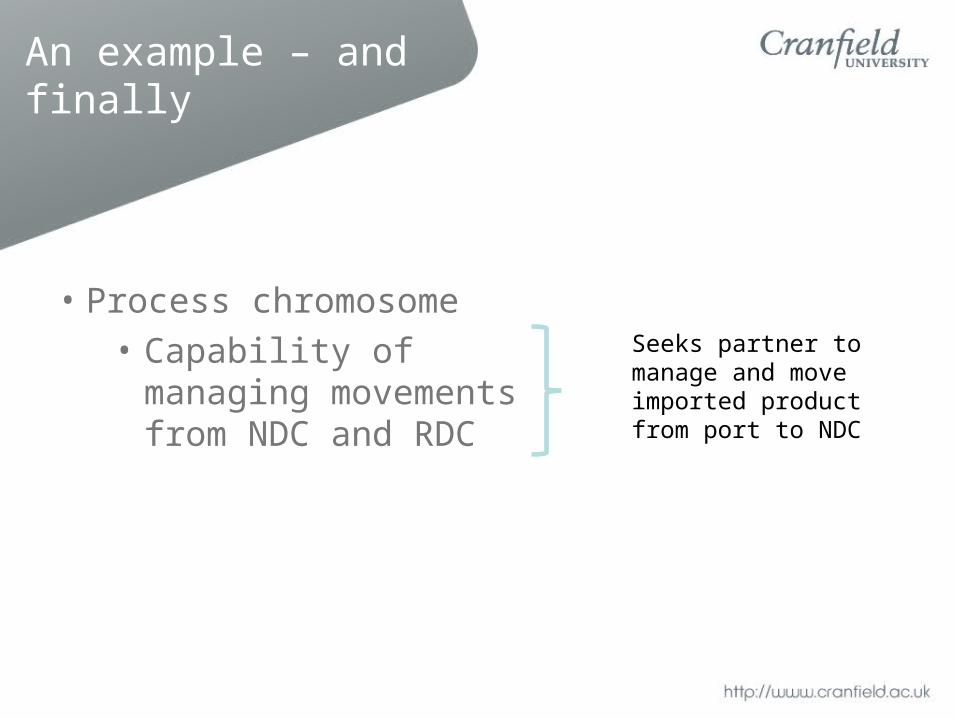
An example – and finally
• Process chromosome
• Capability of managing movements from NDC and RDC
Seeks partner to manage and move imported product from port to NDC

Summary
1
0
1
0
0
0
1
0
0
0
What I am
What infrastructure I have
What I move
What I assets I have
What process capability I have
What strategies I use
What don’t I do

Process Template
Man
age
impo
rts
Exe
cute
por
t m
ovem
ents
Sto
re c
onta
iner
s
Man
age
mov
emen
ts
Exe
cute
mov
emen
ts
At
port
At
hub
At
ND
C
At
RD
C
At
Dep
ot
Who
lesa
le
Mov
e fr
om D
epot
Mov
e fr
om R
DC
Mov
e fr
om N
DC
Mov
e fr
om h
ub
Mov
e fr
om W
hale
sale
Man
age
Mov
emen
ts
Gen
erat
e O
rder
s
For
mul
ate
Pol
icy
Freight Owner op op 0 op 0 0 0 0 0 0 0 0 0 0 0 0 op 1
Freight Mover op 1 0 op 1 0 0 0 0 0 0 1 1 1 1 1 1 1
Infrastucture Owner 0 0 1 op 0 1 1 1 1 1 1 0 0 0 0 0 0 1
Policy Maker 0 0 0 0 0 0 0 0 0 0 0 0 0 0 0 0 0 1
Compare with the processes I do and based on what I am identify what sort of relationship(s) I need to form
Relationship choices are conditioned by need [capacity], commodity and strategy

Data Structure
Freight Movements
Cost Data
Origin - destination
Infra - structure
Operating costs
Ship
Road
Rail
Ship
Road
Rail
Ship
Road
Rail
Assets

Data Challenges
• European Movements – not captured and will need to be populated based on assumptions
• Origin-Destination data does not make clear the degree (primary, secondary or tertiary)
• Data Maintenance

Data Use
• Data inputs will set the initial conditions for the model
• “Old” data can be used to seed model and “current data” to calibrate/validate the model

Purpose
• To inform the design of policy (what impact)
• To validate policy (intended vs actual outcomes)
• To inform organizational strategy (robust vs optimised strategy)
• Risk management and mitigation
• System carbon and economic optimisation

Finally back to where we started
Agenda
• 10:00 Welcome and intro to abi3l plus role of panel - LV and AB• 10.10 The challenges for freight strategy in a constrained financial environment – MG
and AB• 11:00 Strategic Modeling software and break-out session 1 – SV• 11.40 Coffee• 12:00 Feedback from breakout session 1• 12:30 Agent based technology – principles and cases – PG• 13:00 Complex Systems Research Centre past models – LV and PA• 13.15 Lunch• 14:00 Introduction to proposed model structure – PG• 14.45 Breakout session 2 • 15.15 Coffee• 15:30 Feedback from breakout session 2• 16:00 Close