Embed Size (px)
Citation preview
First quarter 2017
Quarterly Report
ABN AMRO Group N.V.
27
Risk, funding & capital informationKey developments 28
Credit risk 30
Liquidity risk 37
Funding 39
Capital management 41
45
OtherNotes to the reader 46
Enquiries 47
2
IntroductionFigures at a glance 2
Message from the CEO 3
ABN AMRO shares 4
5
BusinessEconomic environment 6
Business update 7
Financial review 9
Results by segment 13
Additional financial information 24
Table of contents IntroductionBusiness
Risk, funding & capital inform
ationOther
4
8
12
16
20
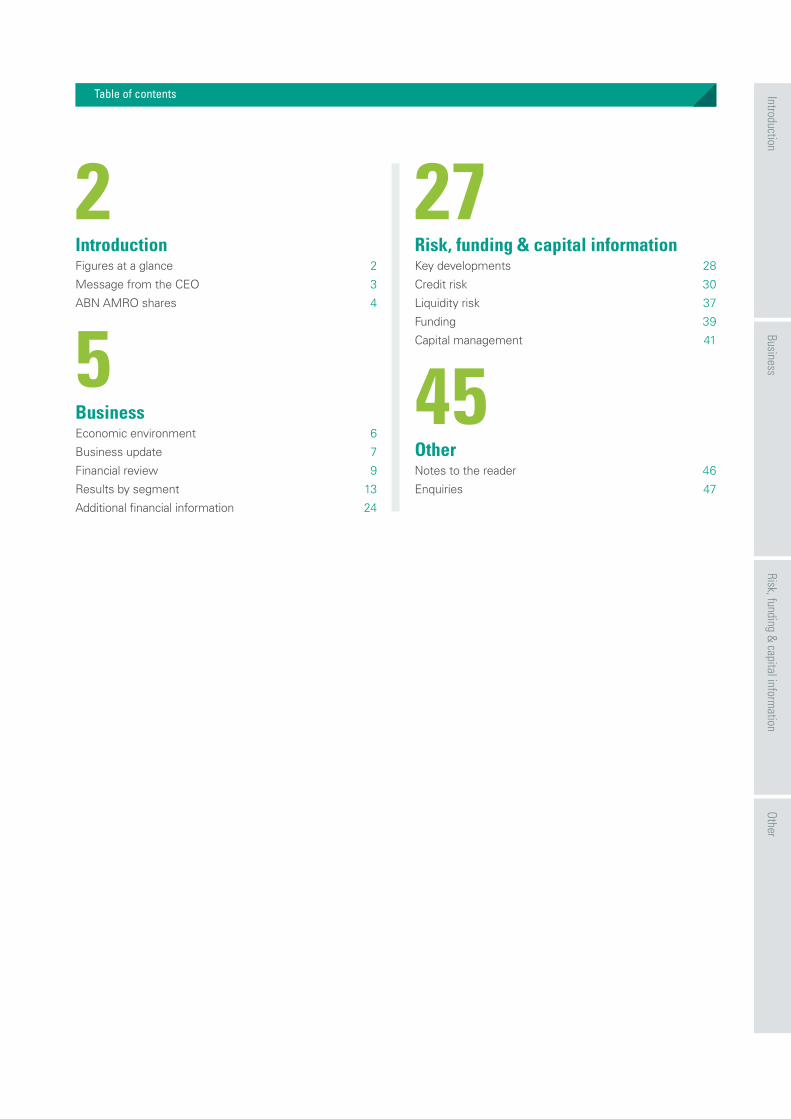
11.1
15.113.8
7.3
13.2
Underlying return on equity Target range is 10-13 (in %)
Q3 16 Q4 16 Q1 17Q1 16 Q2 16
5
10
15
20
25
15.8 16.2 16.6 17.0 16.9
CET1 (fully-loaded)(end-of-period, in %)Target range is 11.5-13.5 (in %)
Q3 16 Q4 16 Q1 17Q1 16 Q2 16
Underlying earnings per share(in EUR)
1.0
0.8
0.6
0.4
0.2
0.49
0.690.63
0.34
0.64
Q3 16 Q4 16 Q1 17Q1 16 Q2 16
750
600
450
300
150
Underlying net profit(in millions)
475
662607
333
615
Q3 16 Q4 16 Q1 17Q1 16 Q2 16
25
20
15
10
5
Underlying cost of risk1
(in bps)
0
9
3
6
9
Q3 16 Q4 16 Q1 17Q1 16 Q2 16
66.957.2
61.8
77.7
60.2
100
80
60
40
20
Underlying cost/income ratio2020 target range is 56-58 (in %)
Q3 16 Q4 16 Q1 17Q1 16 Q2 16
175
160
145
130
115
Underlying net interest margin1
(in bps)
151 152 150 153 156
Q3 16 Q4 16 Q1 17Q1 16 Q2 16
20.322.1 22.5 23.1 24.1
5
10
15
20
25
Total capital ratio (fully-loaded)(end-of-period, in %)
Q3 16 Q4 16 Q1 17Q1 16 Q2 16
1
2
3
4
5
3.7 3.7 3.7 3.9 3.7
Leverage ratio (fully-loaded, CDR)(end-of-period, in %)
Q3 16 Q4 16 Q1 17Q1 16 Q2 16
1 For management view purposes the historical periods before 31 December 2016 have not been adjusted for the revised accounting relating to the netting. Further details are provided in the Notes to the reader section of this report.
ABN AMRO Group Quarterly Report first quarter 2017
2
BusinessRisk, funding &
capital information
OtherIntroduction
Introduction / Figures at a glance
Figures at a glance
Figures at a glance
Introduction
ABN AMRO Group Quarterly Report first quarter 2017
3
BusinessRisk, funding &
capital information
OtherIntroduction
Introduction / Message from the CEO
Message from the CEOThe 2017 first-quarter results are good, with net profit coming
to EUR 615 million. We have been able to offset the low and
negative interest rate environment by growing all major loan
books (mortgages, SME and corporate loans) and lowering
deposit rates. Fees were stable and other operating income
was higher. The cost/income ratio improved to 60.2% (Q1
2016: 66.9%) and the return on equity increased to 13.2%
(Q1 2016: 11.1%). Our capital position remained strong with
a fully-loaded CET1 ratio of 16.9% at the end of March 2017
(31 December 2016: 17.0%).
I would like to take this opportunity to share some of my
priorities as the new CEO of ABN AMRO. The core of our
strategy is to be a relationship-driven bank while ranking
among the best on the digital front; a bank with a strong
position in Northwest Europe and serving selected sectors
globally. We are client-driven, we invest in the future, we have
a moderate risk profile and we are committed to sustainable
growth. One of our main objectives is to deliver convenience
to our clients, both by offering innovative products digitally
and by bringing them expertise and new insights. We also
seek to deliver our products and services fast.
In executing our strategic goals, we need a culture and
management structure that makes our bank more client-
focused, agile and efficient. Senior management should be
able to dedicate more time to the business and have a
stronger client focus. I therefore announced in early
February a new top management structure for the bank,
consisting of a much smaller Executive Board (three people)
with a statutory responsibility and an Executive Committee
with far greater business responsibility. The former top
two levels of the bank (seven Managing Board members
and 12 Senior Managing Directors) have been merged
into the Executive Committee, a reduction in size of more
than 50%. In addition, the management layer below
the Executive Committee has been reduced from 90 to
63 people, a decrease of 30%. In total, 29 senior
executives (including the Managing Board) have left
the bank or will leave in the next twelve months.
With the intended appointments of Mr Clifford Abrahams
as CFO and of Ms Tanja Cuppen as future CRO, we are
increasing the level of international banking experience in the
Executive Board. Furthermore, we are significantly increasing
gender diversity at senior management level from 23%
of senior management positions filled by women to 40%.
In addition, we have created a group called Challenger
40 (C40), consisting of 40 employees from across the
organisation (with an international, digital and/or client
focus) who will challenge and support the Executive
Committee - solicited and unsolicited - on strategically
relevant issues, new developments and culture.
We are committed to creating sustainable value for our
clients, for society and for our shareholders. In fact, in the
new management structure, Strategy and Sustainability
are my direct responsibility. Environmental, social and
governance risks are also addressed in our financing and
investment services. With over 50% of our loan portfolio in
housing and real estate, we are in a good position to make
a meaningful contribution to the transition to sustainable
properties in the Netherlands. At the end of 2016, we
introduced a discount for mortgages for newly built and
energy-efficient homes. We are the market leader in this
segment in the Netherlands. We have also financed the
redevelopment of more than 200,000 square metres of
unused commercial real estate into sustainable real estate.
All of our branches in the Netherlands are already ‘green’,
and we aim to be a climate-neutral company by 2020.
We are committed to delivering speed and convenience to
our clients. Our Florius label can now offer a mortgage loan
within 24 hours, and we are the first mortgage provider to
do so in the Dutch market. Similarly, Commercial Banking
clients who submit a digital application for a loan of up to
EUR 1 million can now obtain a credit decision from the
bank within 48 hours.
I firmly believe that we are on the right track to achieve
our strategic goals and targets.
Kees van DijkhuizenCEO of ABN AMRO Group N.V.
Message from the CEO
ABN AMRO Group Quarterly Report first quarter 2017
4
BusinessRisk, funding &
capital information
OtherIntroduction
Introduction / ABN AMRO shares
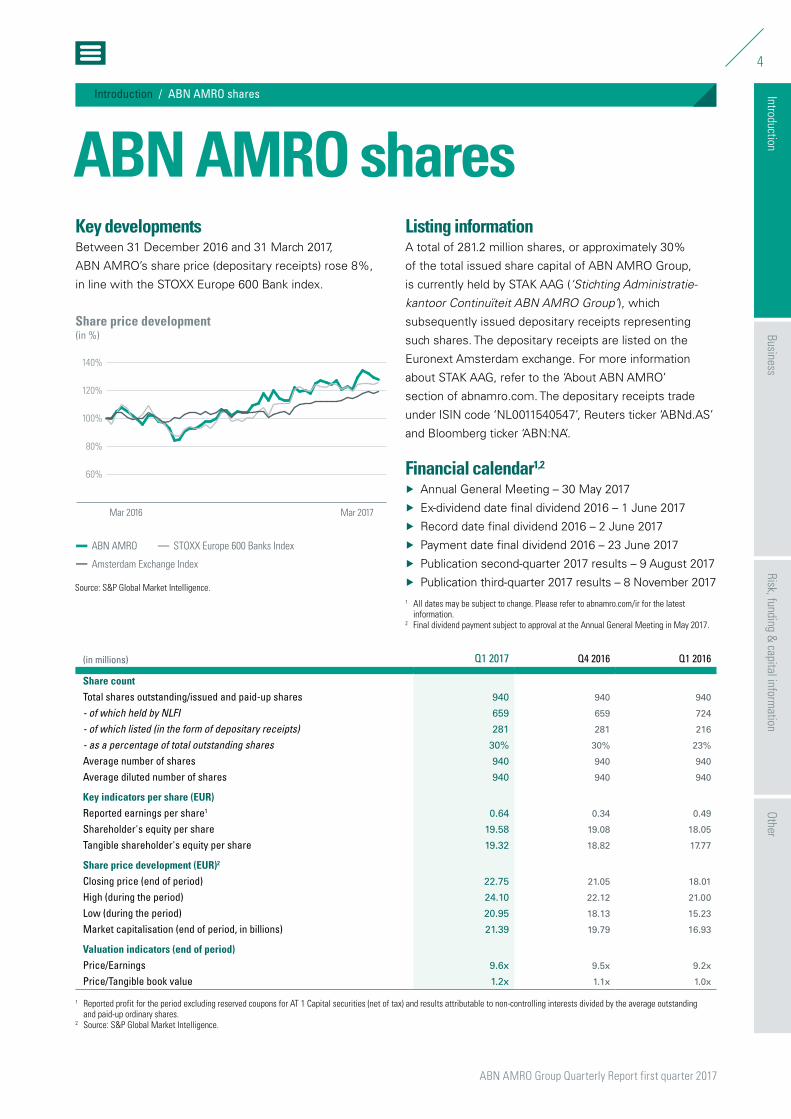
ABN AMRO sharesKey developmentsBetween 31 December 2016 and 31 March 2017,
ABN AMRO’s share price (depositary receipts) rose 8%,
in line with the STOXX Europe 600 Bank index.
Listing informationA total of 281.2 million shares, or approximately 30%
of the total issued share capital of ABN AMRO Group,
is currently held by STAK AAG (‘Stichting Administratie
kantoor Continuïteit ABN AMRO Group’), which
subsequently issued depositary receipts representing
such shares. The depositary receipts are listed on the
Euronext Amsterdam exchange. For more information
about STAK AAG, refer to the ‘About ABN AMRO’
section of abnamro.com. The depositary receipts trade
under ISIN code ‘NL0011540547’, Reuters ticker ‘ABNd.AS’
and Bloomberg ticker ‘ABN:NA’.
Financial calendar1,2 Å Annual General Meeting – 30 May 2017
Å Ex-dividend date final dividend 2016 – 1 June 2017
Å Record date final dividend 2016 – 2 June 2017
Å Payment date final dividend 2016 – 23 June 2017
Å Publication second-quarter 2017 results – 9 August 2017
Å Publication third-quarter 2017 results – 8 November 20171 All dates may be subject to change. Please refer to abnamro.com/ir for the latest
information.2 Final dividend payment subject to approval at the Annual General Meeting in May 2017.
(in millions) Q1 2017 Q4 2016 Q1 2016
Share countTotal shares outstanding/issued and paid-up shares 940 940 940
- of which held by NLFI 659 659 724
- of which listed (in the form of depositary receipts) 281 281 216
- as a percentage of total outstanding shares 30% 30% 23%
Average number of shares 940 940 940
Average diluted number of shares 940 940 940
Key indicators per share (EUR)Reported earnings per share1 0.64 0.34 0.49
Shareholder's equity per share 19.58 19.08 18.05
Tangible shareholder's equity per share 19.32 18.82 17.77
Share price development (EUR)2
Closing price (end of period) 22.75 21.05 18.01
High (during the period) 24.10 22.12 21.00
Low (during the period) 20.95 18.13 15.23
Market capitalisation (end of period, in billions) 21.39 19.79 16.93
Valuation indicators (end of period)Price/Earnings 9.6x 9.5x 9.2x
Price/Tangible book value 1.2x 1.1x 1.0x
1 Reported profit for the period excluding reserved coupons for AT 1 Capital securities (net of tax) and results attributable to non-controlling interests divided by the average outstanding and paid-up ordinary shares.
2 Source: S&P Global Market Intelligence.
60%
80%
100%
120%
140%
Mar 2016 Mar 2017
Share price development(in %)
ABN AMRO STOXX Europe 600 Banks Index
Amsterdam Exchange Index
Source: S&P Global Market Intelligence.
ABN AMRO shares
IntroductionRisk, funding &
capital information
OtherBusiness
6
Economic environment
7
Business update
9
Financial reviewResults 9
Balance sheet 11
13
Results by segmentRetail Banking 13
Private Banking 16
Commercial Banking 18
Corporate & Institutional Banking 20
Group Functions 22
24
Additional financial information
Business
Business
ABN AMRO Group Quarterly Report first quarter 2017
6
IntroductionRisk, funding &
capital information
Other
Business / Economic environment
Business
Economic environmentThe first quarter saw a remarkable strengthening of economic indicators globally. Nevertheless, economic growth in the US slowed to 0.2% quarter-on-quarter due to temporary factors. Growth in China accelerated slightly (year-on-year). The eurozone economy has been gaining some momentum, with economic growth running at well above trend rates. The eurozone is benefiting from slightly accelerating world trade as well as last year’s depreciation of the euro. Growth amounted to 0.5% quarter-on-quarter in Q1.
In 2016, the Dutch economy outperformed that of the
eurozone. GDP growth was firm throughout 2016 and in the
beginning of this year. Dutch GDP rose by 0.4% quarter-on-
quarter in Q1, roughly equal to eurozone growth figure.
Recent sentiment indicators suggest that the economy’s
momentum was still strong at the beginning of Q2.
The economic environment has become more benign for
ABN AMRO in recent quarters. However, there are still
foreign risks. Elections in several European countries may
cause unrest (also after Mr Macron’s victory in France),
especially if the outcomes are anti-EU. An earlier-than-
expected exit from quantitative easing by the ECB may
unsettle financial markets, and geo-political developments
in North Korea may also seriously harm confidence.
As international trade is very important for the Netherlands,
the Dutch economy may be hit especially hard.
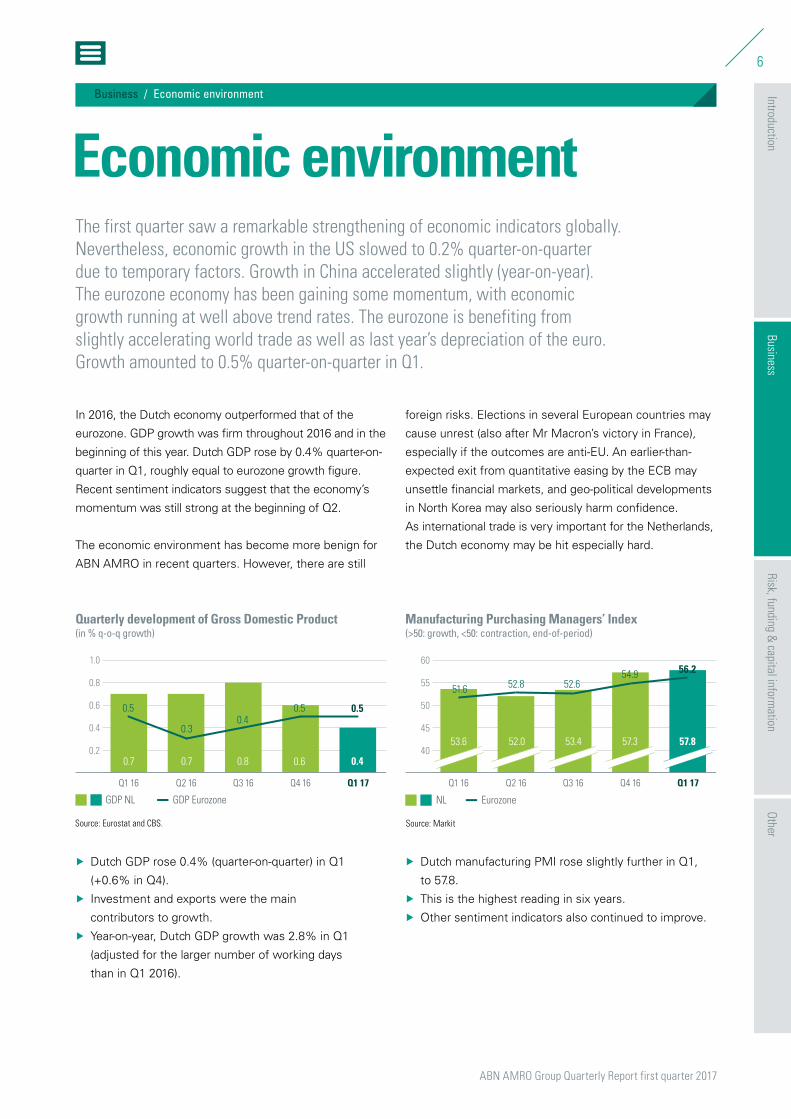
Quarterly development of Gross Domestic Product (in % q-o-q growth)
1.0
0.8
0.6
0.4
0.2
Q3 16 Q4 16 Q1 17Q1 16 Q2 16
0.5
0.7
0.3
0.7 0.8
0.4
0.6
0.5
0.4
0.5
GDP NL GDP Eurozone
Source: Eurostat and CBS.
52.0
52.8
53.4
52.6
57.3
54.9
57.8
56.2
53.6
51.6
NL Eurozone
Manufacturing Purchasing Managers’ Index(>50: growth, <50: contraction, end-of-period)
60
55
50
45
40
Q3 16 Q4 16 Q1 17Q1 16 Q2 16
Source: Markit
Å Dutch GDP rose 0.4% (quarter-on-quarter) in Q1
(+0.6% in Q4).
Å Investment and exports were the main
contributors to growth.
Å Year-on-year, Dutch GDP growth was 2.8% in Q1
(adjusted for the larger number of working days
than in Q1 2016).
Å Dutch manufacturing PMI rose slightly further in Q1,
to 57.8.
Å This is the highest reading in six years.
Å Other sentiment indicators also continued to improve.
Economic environment (Engels)Economic environment
ABN AMRO Group Quarterly Report first quarter 2017
7
IntroductionRisk, funding &
capital information
Other
Business / Business update
Business
Business updateThe core of our strategy is to be a relationship-driven bank while ranking among the best on the digital front; a bank with a strong position in Northwest Europe and serving selected sectors globally. In line with our long-term strategic foundation, we are client-driven, we invest in the future, we have a moderate risk profile and we are committed to sustainable growth. Four medium-term priorities – bring expertise, enhance the client experience, innovate & grow, and deliver fast – support us in pursuing our strategy.
Our strategy revolves around our clients, and one of our
main objectives is to deliver convenience and ease of use
in the products we offer them.
We developed several new products in the first few
months of 2017. Our aim is to deliver innovative products
fast – in some cases within 24 or 48 hours – and to offer
products digitally (mobile and online). All of our products
and services are provided in conjunction with our sector
knowledge and expertise.
Our Florius label can now deliver a mortgage loan – a key
product for many clients – within 24 hours, and we are
the first mortgage provider to do so in the Dutch market.
This service supports our position as market leader in
new mortgage origination. Similarly, Commercial Banking
clients who submit a digital application for a loan of up to
EUR 1 million can now obtain a credit decision from the
bank within 48 hours. And we can now onboard small
business clients (part of Retail Banking) via a mobile
device in five minutes, including all ‘know your customer’
procedures.
Our digital offering continues to expand, reaching a
growing number of clients. Having introduced mobile
banking in 2011, we now have over 2 million active users
of our ABN AMRO app and an average of 65 million
logins every month. Our Tikkie app - enabling users with
a current account at any Dutch bank to send payment
requests via WhatsApp – was introduced less than a
year ago and now has over 500,000 users. It is now
being piloted by corporate clients such as Transavia.
The Grip app - which gives clients insight into their
spending and includes a range of financial planning
features - has registered over 200,000 users within
a year. We developed this app together with the
Swedish fintech start-up Tink.
Innovation comes in many forms. ABN AMRO is the first
bank in the Netherlands to have launched a mortgage
chatbot on Facebook messenger. The chatbot can give
clients real-time mortgage advice online; when finished,
the client receives a copy of the advice. Another example
is the use of artificial intelligence. We have set up a pilot
with a select group of corporate clients to forecast their
future funding needs by analysing their financial data.
If the model predicts a shortage of liquidity in the future,
we approach the client. Initial results show that clients
appreciate our proactiveness, and the pilot has already
resulted in several deals.
We have further expanded our sector focus. For larger
and international corporates, we are deepening our
sector knowledge, expanding into adjacent sectors
such as renewable energy, utilities, and metal & minerals.
This has already resulted in several transactions with new
clients in these subsectors. Our focus is on controlled
growth, from a business point of view as well as from
a risk point of view. In natural resources, in addition to
collateralised trade financing, we are also focusing on
larger clients with a higher credit quality by offering
more corporate-style financing. In sectors such as
commodities and transportation, we continue to focus
on asset-based financing.
Business update Business update (Engels)
ABN AMRO Group Quarterly Report first quarter 2017
8
IntroductionRisk, funding &
capital information
Other
Business / Business update
Business
Our pledge is to be a better bank contributing to a better
world. With well over 50% of our loan portfolio in housing
and real estate, we are in a good position to make a
meaningful contribution to the transition to sustainable
properties in the Netherlands. We encourage all clients
to accelerate this change and will facilitate their efforts.
In the past twelve months we have financed the
redevelopment of more than 200,000 square metres
of unused commercial real estate into sustainable real
estate, and we also introduced a discount for mortgages
for newly built and energy-efficient homes at the end
of 2016. Our market share in this part of the mortgage
market increased to 27%1 in the first quarter of this year.
We also aim to be a climate-neutral company by 2020.
All of our branches in the Netherlands are already ‘green’,
and we are currently building a circular pavilion; we also
use our own experience in this field when developing
client propositions.
We have set up a Sustainable Finance Desk within
Commercial Banking, focusing on financing investments
in power generation from wind and solar sources in the
Dutch market, and specifically on investments worth
between EUR 2.5 million and EUR 25 million. This desk
also facilitates knowledge-sharing and provides deal
expertise. By launching the Sustainable Finance Desk,
we are meeting a growing demand in the area of energy
transition in the mid-market segment.
In executing our strategic goals, we need a culture
and management structure that makes our bank more
client-focused, agile and efficient. A new top management
structure for the bank was announced in February,
including a much smaller Executive Board and an
Executive Committee.
In addition, the management layer below the Executive
Committee has been reduced significantly. In total,
29 senior executives (including the Managing Board)
have left the bank or will leave in the next twelve months.
They will receive a total of EUR 11-12 million in severance
payments, based on either the maximum of one year’s
fixed salary or a contractually agreed amount set and
frozen since 2009, as agreed with the Dutch Ministry
of Finance2. The highest amount paid is EUR 1 million
for a senior executive based outside the Netherlands.
These severance payments are in addition to the
EUR 348 million taken for personnel restructuring in 2016.
We are significantly increasing gender diversity at senior
management level from 23% of senior management
positions filled by women to 40%.
The new management structure has led to a slightly
amended reporting structure. Going forward we will have
five reporting segments: Retail Banking, Private Banking,
Commercial Banking (formerly Commercial Clients),
Corporate & Institutional Banking (a combination of the
former International Clients and Capital Market Solutions)
and Group Functions.
In addition to introducing a new management structure
and as part of a changing culture, we seek an alternative
voice and more input from within the organisation on
what we need to do differently. We have therefore
created a group called Challenger 40 (C40), consisting
of 40 employees from across the organisation who will
challenge and support the Executive Committee on
strategically relevant issues, with whom dilemmas can
be shared and who will bring forward topics for discussion
on their own initiative.
A strategy focused on innovation and a much broader
digital offering also requires more digital talent. More
than a year ago we started promoting the bank as a digital
employer. As a result, ABN AMRO was nominated as
Favourite Employer in the Netherlands in 2017 in the
category Banks & Accountants3. We recruited almost
400 ‘digital natives’ in 2016 and 110 in Q1 2017.
1 Source: Dutch Land Registry (Kadaster).2 Kamerbrief FIN/2009/1021.Kamerbrief FIN/2009/1021.3 Intermediair 2017.
ABN AMRO Group Quarterly Report first quarter 2017
9
IntroductionRisk, funding &
capital information
Other
Business / Financial review
Business
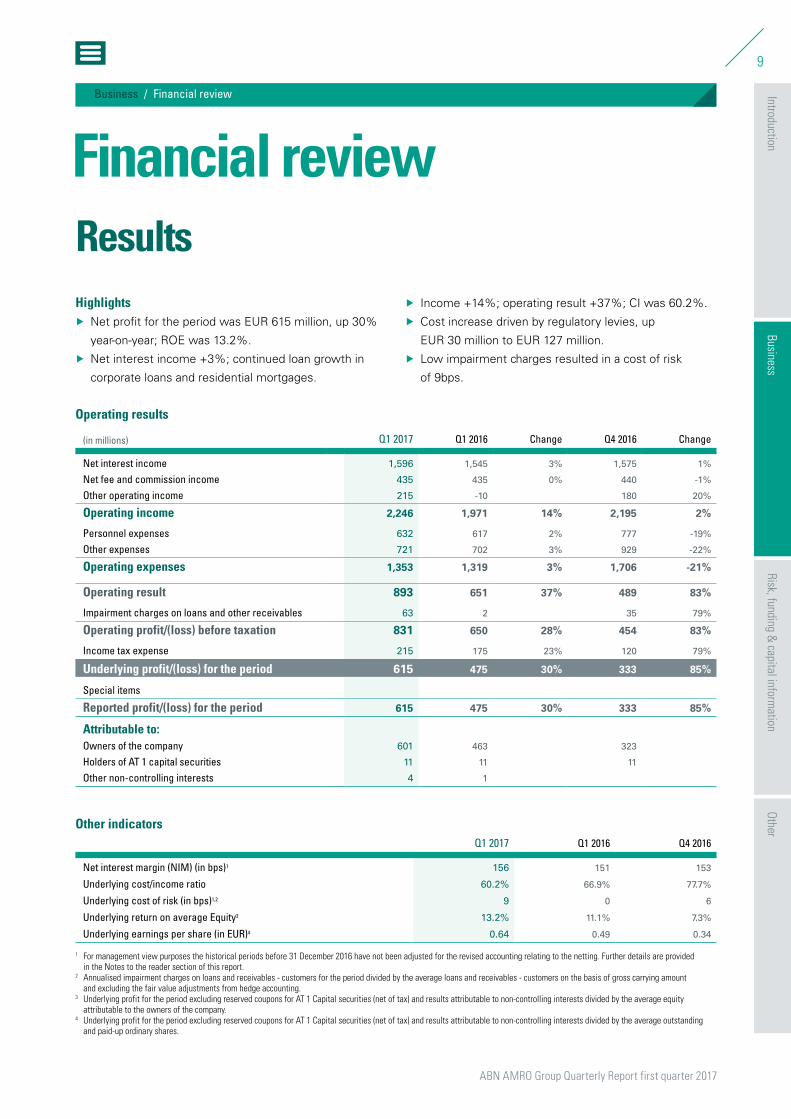
Results Highlights
Å Net profit for the period was EUR 615 million, up 30%
year-on-year; ROE was 13.2%.
Å Net interest income +3%; continued loan growth in
corporate loans and residential mortgages.
Å Income +14%; operating result +37%; CI was 60.2%.
Å Cost increase driven by regulatory levies, up
EUR 30 million to EUR 127 million.
Å Low impairment charges resulted in a cost of risk
of 9bps.
Operating results
(in millions) Q1 2017 Q1 2016 Change Q4 2016 Change
Net interest income 1,596 1,545 3% 1,575 1%
Net fee and commission income 435 435 0% 440 -1%
Other operating income 215 -10 180 20%
Operating income 2,246 1,971 14% 2,195 2%
Personnel expenses 632 617 2% 777 -19%
Other expenses 721 702 3% 929 -22%
Operating expenses 1,353 1,319 3% 1,706 -21%
Operating result 893 651 37% 489 83%
Impairment charges on loans and other receivables 63 2 35 79%
Operating profit/(loss) before taxation 831 650 28% 454 83%
Income tax expense 215 175 23% 120 79%
Underlying profit/(loss) for the period 615 475 30% 333 85%
Special items
Reported profit/(loss) for the period 615 475 30% 333 85%
Attributable to:Owners of the company 601 463 323
Holders of AT 1 capital securities 11 11 11
Other non-controlling interests 4 1
Other indicatorsQ1 2017 Q1 2016 Q4 2016
Net interest margin (NIM) (in bps)1 156 151 153
Underlying cost/income ratio 60.2% 66.9% 77.7%
Underlying cost of risk (in bps)1,2 9 0 6
Underlying return on average Equity3 13.2% 11.1% 7.3%
Underlying earnings per share (in EUR)4 0.64 0.49 0.34
1 For management view purposes the historical periods before 31 December 2016 have not been adjusted for the revised accounting relating to the netting. Further details are provided in the Notes to the reader section of this report.
2 Annualised impairment charges on loans and receivables - customers for the period divided by the average loans and receivables - customers on the basis of gross carrying amount and excluding the fair value adjustments from hedge accounting.
3 Underlying profit for the period excluding reserved coupons for AT 1 Capital securities (net of tax) and results attributable to non-controlling interests divided by the average equity attributable to the owners of the company.
4 Underlying profit for the period excluding reserved coupons for AT 1 Capital securities (net of tax) and results attributable to non-controlling interests divided by the average outstanding and paid-up ordinary shares.
Financial review
Financial review Financial review (Engels)
ABN AMRO Group Quarterly Report first quarter 2017
10
IntroductionRisk, funding &
capital information
Other
Business / Financial review
Business
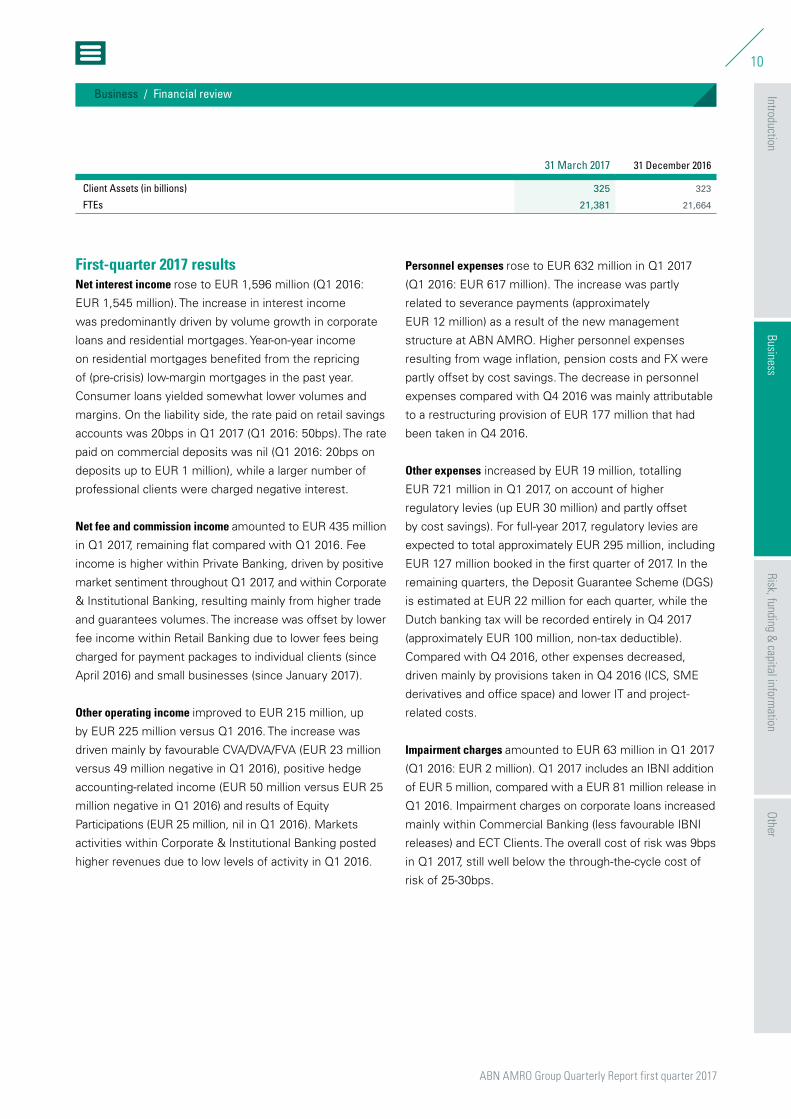
31 March 2017 31 December 2016
Client Assets (in billions) 325 323
FTEs 21,381 21,664
First-quarter 2017 resultsNet interest income rose to EUR 1,596 million (Q1 2016:
EUR 1,545 million). The increase in interest income
was predominantly driven by volume growth in corporate
loans and residential mortgages. Year-on-year income
on residential mortgages benefited from the repricing
of (pre-crisis) low-margin mortgages in the past year.
Consumer loans yielded somewhat lower volumes and
margins. On the liability side, the rate paid on retail savings
accounts was 20bps in Q1 2017 (Q1 2016: 50bps). The rate
paid on commercial deposits was nil (Q1 2016: 20bps on
deposits up to EUR 1 million), while a larger number of
professional clients were charged negative interest.
Net fee and commission income amounted to EUR 435 million
in Q1 2017, remaining flat compared with Q1 2016. Fee
income is higher within Private Banking, driven by positive
market sentiment throughout Q1 2017, and within Corporate
& Institutional Banking, resulting mainly from higher trade
and guarantees volumes. The increase was offset by lower
fee income within Retail Banking due to lower fees being
charged for payment packages to individual clients (since
April 2016) and small businesses (since January 2017).
Other operating income improved to EUR 215 million, up
by EUR 225 million versus Q1 2016. The increase was
driven mainly by favourable CVA/DVA/FVA (EUR 23 million
versus 49 million negative in Q1 2016), positive hedge
accounting-related income (EUR 50 million versus EUR 25
million negative in Q1 2016) and results of Equity
Participations (EUR 25 million, nil in Q1 2016). Markets
activities within Corporate & Institutional Banking posted
higher revenues due to low levels of activity in Q1 2016.
Personnel expenses rose to EUR 632 million in Q1 2017
(Q1 2016: EUR 617 million). The increase was partly
related to severance payments (approximately
EUR 12 million) as a result of the new management
structure at ABN AMRO. Higher personnel expenses
resulting from wage inflation, pension costs and FX were
partly offset by cost savings. The decrease in personnel
expenses compared with Q4 2016 was mainly attributable
to a restructuring provision of EUR 177 million that had
been taken in Q4 2016.
Other expenses increased by EUR 19 million, totalling
EUR 721 million in Q1 2017, on account of higher
regulatory levies (up EUR 30 million) and partly offset
by cost savings). For full-year 2017, regulatory levies are
expected to total approximately EUR 295 million, including
EUR 127 million booked in the first quarter of 2017. In the
remaining quarters, the Deposit Guarantee Scheme (DGS)
is estimated at EUR 22 million for each quarter, while the
Dutch banking tax will be recorded entirely in Q4 2017
(approximately EUR 100 million, non-tax deductible).
Compared with Q4 2016, other expenses decreased,
driven mainly by provisions taken in Q4 2016 (ICS, SME
derivatives and office space) and lower IT and project-
related costs.
Impairment charges amounted to EUR 63 million in Q1 2017
(Q1 2016: EUR 2 million). Q1 2017 includes an IBNI addition
of EUR 5 million, compared with a EUR 81 million release in
Q1 2016. Impairment charges on corporate loans increased
mainly within Commercial Banking (less favourable IBNI
releases) and ECT Clients. The overall cost of risk was 9bps
in Q1 2017, still well below the through-the-cycle cost of
risk of 25-30bps.
ABN AMRO Group Quarterly Report first quarter 2017
11
IntroductionRisk, funding &
capital information
Other
Business / Financial review
Business
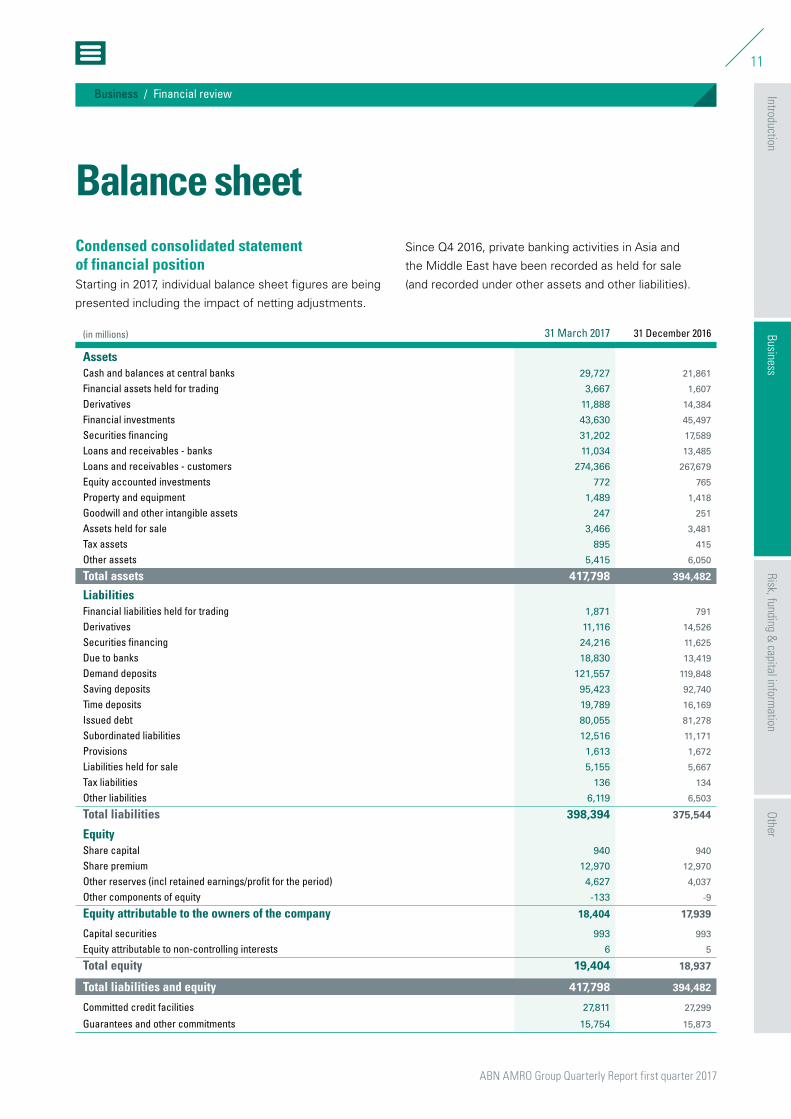
Balance sheet Condensed consolidated statement of financial positionStarting in 2017, individual balance sheet figures are being
presented including the impact of netting adjustments.
Since Q4 2016, private banking activities in Asia and
the Middle East have been recorded as held for sale
(and recorded under other assets and other liabilities).
(in millions) 31 March 2017 31 December 2016
AssetsCash and balances at central banks 29,727 21,861
Financial assets held for trading 3,667 1,607
Derivatives 11,888 14,384
Financial investments 43,630 45,497
Securities financing 31,202 17,589
Loans and receivables - banks 11,034 13,485
Loans and receivables - customers 274,366 267,679
Equity accounted investments 772 765
Property and equipment 1,489 1,418
Goodwill and other intangible assets 247 251
Assets held for sale 3,466 3,481
Tax assets 895 415
Other assets 5,415 6,050
Total assets 417,798 394,482
LiabilitiesFinancial liabilities held for trading 1,871 791
Derivatives 11,116 14,526
Securities financing 24,216 11,625
Due to banks 18,830 13,419
Demand deposits 121,557 119,848
Saving deposits 95,423 92,740
Time deposits 19,789 16,169
Issued debt 80,055 81,278
Subordinated liabilities 12,516 11,171
Provisions 1,613 1,672
Liabilities held for sale 5,155 5,667
Tax liabilities 136 134
Other liabilities 6,119 6,503
Total liabilities 398,394 375,544
EquityShare capital 940 940
Share premium 12,970 12,970
Other reserves (incl retained earnings/profit for the period) 4,627 4,037
Other components of equity -133 -9
Equity attributable to the owners of the company 18,404 17,939
Capital securities 993 993
Equity attributable to non-controlling interests 6 5
Total equity 19,404 18,937
Total liabilities and equity 417,798 394,482
Committed credit facilities 27,811 27,299
Guarantees and other commitments 15,754 15,873
ABN AMRO Group Quarterly Report first quarter 2017
12
IntroductionRisk, funding &
capital information
Other
Business / Financial review
Business
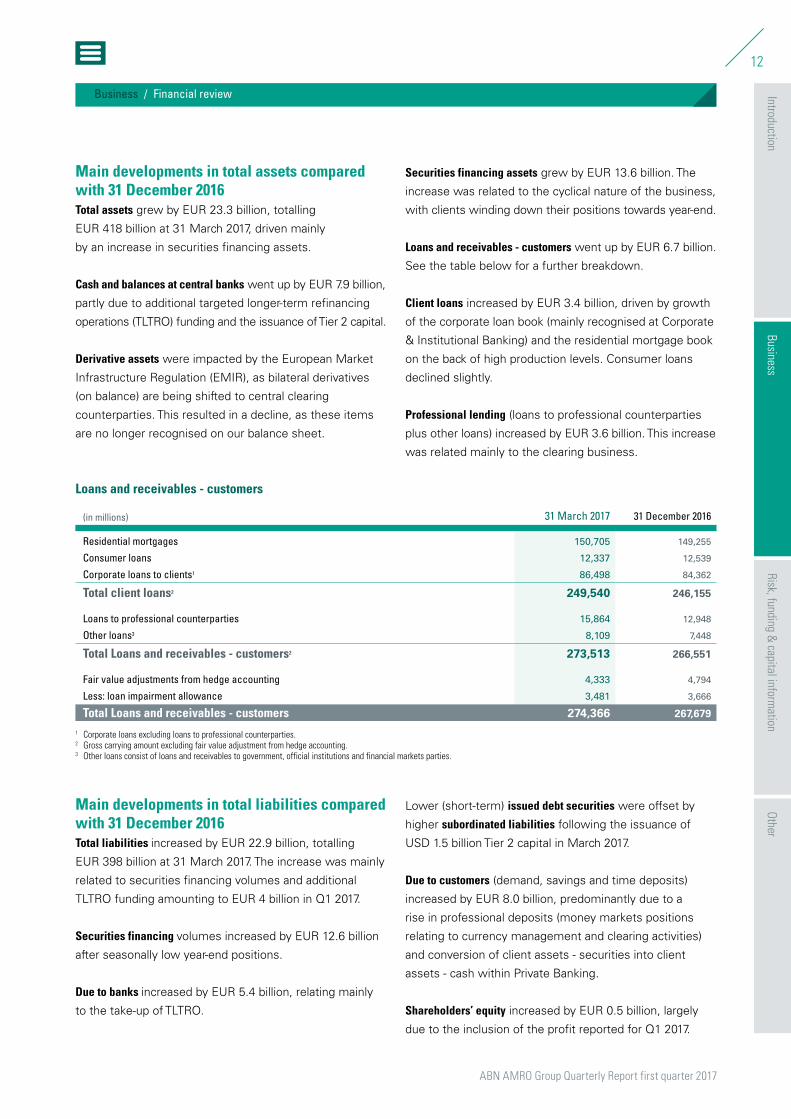
Main developments in total assets compared with 31 December 2016Total assets grew by EUR 23.3 billion, totalling
EUR 418 billion at 31 March 2017, driven mainly
by an increase in securities financing assets.
Cash and balances at central banks went up by EUR 7.9 billion,
partly due to additional targeted longer-term refinancing
operations (TLTRO) funding and the issuance of Tier 2 capital.
Derivative assets were impacted by the European Market
Infrastructure Regulation (EMIR), as bilateral derivatives
(on balance) are being shifted to central clearing
counterparties. This resulted in a decline, as these items
are no longer recognised on our balance sheet.
Securities financing assets grew by EUR 13.6 billion. The
increase was related to the cyclical nature of the business,
with clients winding down their positions towards year-end.
Loans and receivables - customers went up by EUR 6.7 billion.
See the table below for a further breakdown.
Client loans increased by EUR 3.4 billion, driven by growth
of the corporate loan book (mainly recognised at Corporate
& Institutional Banking) and the residential mortgage book
on the back of high production levels. Consumer loans
declined slightly.
Professional lending (loans to professional counterparties
plus other loans) increased by EUR 3.6 billion. This increase
was related mainly to the clearing business.
Loans and receivables - customers
(in millions) 31 March 2017 31 December 2016
Residential mortgages 150,705 149,255
Consumer loans 12,337 12,539
Corporate loans to clients1 86,498 84,362
Total client loans2 249,540 246,155
Loans to professional counterparties 15,864 12,948
Other loans3 8,109 7,448
Total Loans and receivables - customers2 273,513 266,551
Fair value adjustments from hedge accounting 4,333 4,794
Less: loan impairment allowance 3,481 3,666
Total Loans and receivables - customers 274,366 267,679
1 Corporate loans excluding loans to professional counterparties.2 Gross carrying amount excluding fair value adjustment from hedge accounting.3 Other loans consist of loans and receivables to government, official institutions and financial markets parties.
Main developments in total liabilities compared with 31 December 2016Total liabilities increased by EUR 22.9 billion, totalling
EUR 398 billion at 31 March 2017. The increase was mainly
related to securities financing volumes and additional
TLTRO funding amounting to EUR 4 billion in Q1 2017.
Securities financing volumes increased by EUR 12.6 billion
after seasonally low year-end positions.
Due to banks increased by EUR 5.4 billion, relating mainly
to the take-up of TLTRO.
Lower (short-term) issued debt securities were offset by
higher subordinated liabilities following the issuance of
USD 1.5 billion Tier 2 capital in March 2017.
Due to customers (demand, savings and time deposits)
increased by EUR 8.0 billion, predominantly due to a
rise in professional deposits (money markets positions
relating to currency management and clearing activities)
and conversion of client assets - securities into client
assets - cash within Private Banking.
Shareholders’ equity increased by EUR 0.5 billion, largely
due to the inclusion of the profit reported for Q1 2017.
ABN AMRO Group Quarterly Report first quarter 2017
13
IntroductionRisk, funding &
capital information
Other
Business / Results by segment
Business
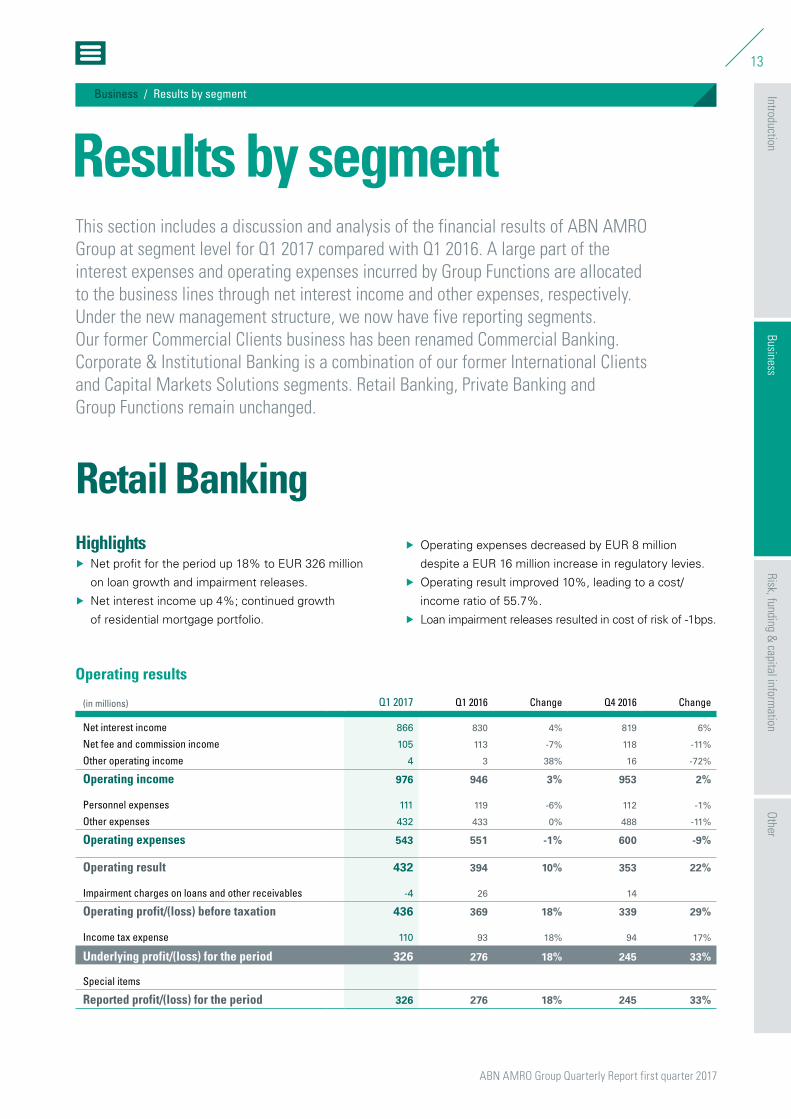
This section includes a discussion and analysis of the financial results of ABN AMRO Group at segment level for Q1 2017 compared with Q1 2016. A large part of the interest expenses and operating expenses incurred by Group Functions are allocated to the business lines through net interest income and other expenses, respectively. Under the new management structure, we now have five reporting segments. Our former Commercial Clients business has been renamed Commercial Banking. Corporate & Institutional Banking is a combination of our former International Clients and Capital Markets Solutions segments. Retail Banking, Private Banking and Group Functions remain unchanged.
Retail Banking Highlights
Å Net profit for the period up 18% to EUR 326 million
on loan growth and impairment releases.
Å Net interest income up 4%; continued growth
of residential mortgage portfolio.
Å Operating expenses decreased by EUR 8 million
despite a EUR 16 million increase in regulatory levies.
Å Operating result improved 10%, leading to a cost/
income ratio of 55.7%.
Å Loan impairment releases resulted in cost of risk of -1bps.
Operating results
(in millions) Q1 2017 Q1 2016 Change Q4 2016 Change
Net interest income 866 830 4% 819 6%
Net fee and commission income 105 113 -7% 118 -11%
Other operating income 4 3 38% 16 -72%
Operating income 976 946 3% 953 2%
Personnel expenses 111 119 -6% 112 -1%
Other expenses 432 433 0% 488 -11%
Operating expenses 543 551 -1% 600 -9%
Operating result 432 394 10% 353 22%
Impairment charges on loans and other receivables -4 26 14
Operating profit/(loss) before taxation 436 369 18% 339 29%
Income tax expense 110 93 18% 94 17%
Underlying profit/(loss) for the period 326 276 18% 245 33%
Special items
Reported profit/(loss) for the period 326 276 18% 245 33%
Results by segment
Results by segment Results by segment (Engels)
ABN AMRO Group Quarterly Report first quarter 2017
14
IntroductionRisk, funding &
capital information
Other
Business / Results by segment
Business
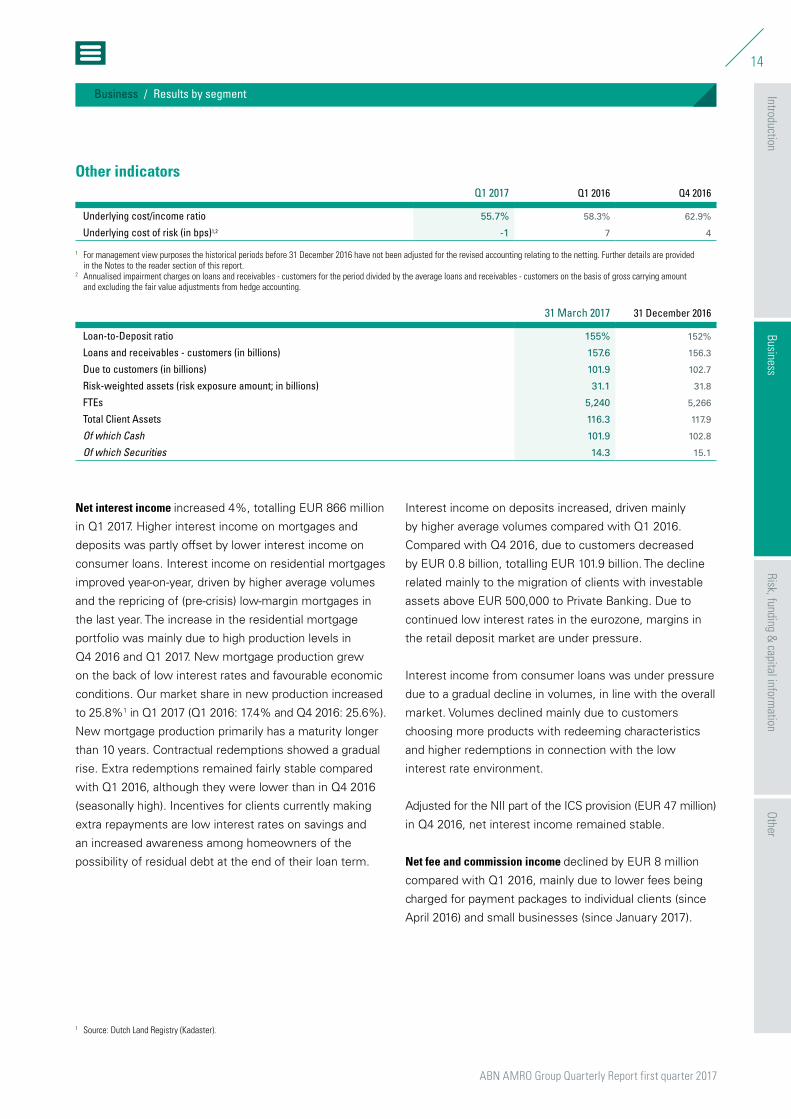
Other indicatorsQ1 2017 Q1 2016 Q4 2016
Underlying cost/income ratio 55.7% 58.3% 62.9%
Underlying cost of risk (in bps)1,2 -1 7 4
1 For management view purposes the historical periods before 31 December 2016 have not been adjusted for the revised accounting relating to the netting. Further details are provided in the Notes to the reader section of this report.
2 Annualised impairment charges on loans and receivables - customers for the period divided by the average loans and receivables - customers on the basis of gross carrying amount and excluding the fair value adjustments from hedge accounting.
31 March 2017 31 December 2016
Loan-to-Deposit ratio 155% 152%
Loans and receivables - customers (in billions) 157.6 156.3
Due to customers (in billions) 101.9 102.7
Risk-weighted assets (risk exposure amount; in billions) 31.1 31.8
FTEs 5,240 5,266
Total Client Assets 116.3 117.9
Of which Cash 101.9 102.8
Of which Securities 14.3 15.1
Net interest income increased 4%, totalling EUR 866 million
in Q1 2017. Higher interest income on mortgages and
deposits was partly offset by lower interest income on
consumer loans. Interest income on residential mortgages
improved year-on-year, driven by higher average volumes
and the repricing of (pre-crisis) low-margin mortgages in
the last year. The increase in the residential mortgage
portfolio was mainly due to high production levels in
Q4 2016 and Q1 2017. New mortgage production grew
on the back of low interest rates and favourable economic
conditions. Our market share in new production increased
to 25.8%1 in Q1 2017 (Q1 2016: 17.4% and Q4 2016: 25.6%).
New mortgage production primarily has a maturity longer
than 10 years. Contractual redemptions showed a gradual
rise. Extra redemptions remained fairly stable compared
with Q1 2016, although they were lower than in Q4 2016
(seasonally high). Incentives for clients currently making
extra repayments are low interest rates on savings and
an increased awareness among homeowners of the
possibility of residual debt at the end of their loan term.
Interest income on deposits increased, driven mainly
by higher average volumes compared with Q1 2016.
Compared with Q4 2016, due to customers decreased
by EUR 0.8 billion, totalling EUR 101.9 billion. The decline
related mainly to the migration of clients with investable
assets above EUR 500,000 to Private Banking. Due to
continued low interest rates in the eurozone, margins in
the retail deposit market are under pressure.
Interest income from consumer loans was under pressure
due to a gradual decline in volumes, in line with the overall
market. Volumes declined mainly due to customers
choosing more products with redeeming characteristics
and higher redemptions in connection with the low
interest rate environment.
Adjusted for the NII part of the ICS provision (EUR 47 million)
in Q4 2016, net interest income remained stable.
Net fee and commission income declined by EUR 8 million
compared with Q1 2016, mainly due to lower fees being
charged for payment packages to individual clients (since
April 2016) and small businesses (since January 2017).
1 Source: Dutch Land Registry (Kadaster).
ABN AMRO Group Quarterly Report first quarter 2017
15
IntroductionRisk, funding &
capital information
Other
Business / Results by segment
Business
Personnel expenses decreased by 6% to EUR 111 million,
as the average number of employees was reduced.
Internal FTEs decreased to 5,240 (Q1 2016: 5,725)
following a further reduction in the number of branches
and a transfer of employees (September 2016) and clients
to Private Banking after the threshold had been lowered.
The number of branches was reduced to 216 in Q1 2017
(Q1 2016: 252) while the volume of mobile banking grew
by 12% in the same period.
Other expenses include regulatory levies of EUR 53 million
in Q1 2017 (Q1 2016: EUR 37 million). Excluding regulatory
levies, other expenses decreased by EUR 17 million. This
was attributable to lower allocated costs, mainly resulting
from announced saving programmes.
Impairment charges decreased, coming to a EUR 4 million
release in Q1 2017 (Q1 2016: EUR 26 million charge).
Underlying loan impairments decreased further as a result
of the continued improvement of the Dutch economy.
An IBNI release of EUR 8 million was recorded in Q1 2017
(Q1 2016: EUR 23 million). Residential mortgages and
consumer loans showed small impairment releases in
Q1 2017. The cost of risk of residential mortgages improved
from 7bps to -1bps, well below the through-the-cycle levels.
ABN AMRO Group Quarterly Report first quarter 2017
16
IntroductionRisk, funding &
capital information
Other
Business / Results by segment
Business
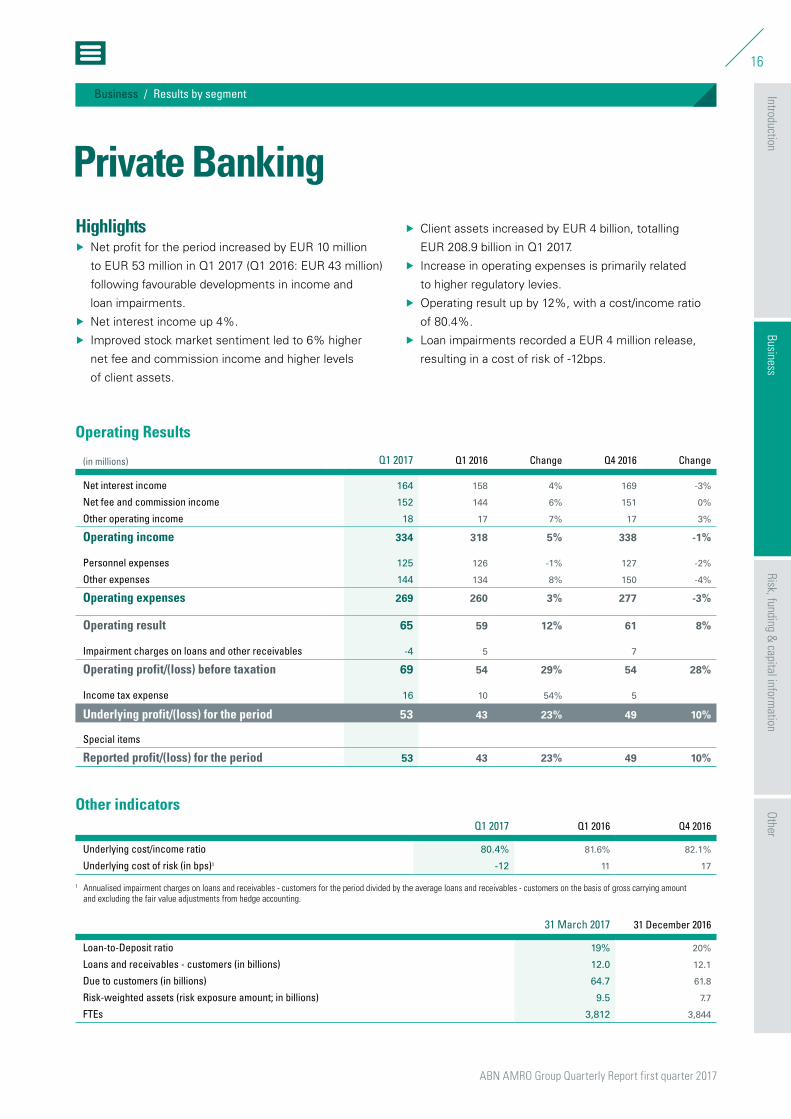
Highlights Å Net profit for the period increased by EUR 10 million
to EUR 53 million in Q1 2017 (Q1 2016: EUR 43 million)
following favourable developments in income and
loan impairments.
Å Net interest income up 4%.
Å Improved stock market sentiment led to 6% higher
net fee and commission income and higher levels
of client assets.
Å Client assets increased by EUR 4 billion, totalling
EUR 208.9 billion in Q1 2017.
Å Increase in operating expenses is primarily related
to higher regulatory levies.
Å Operating result up by 12%, with a cost/income ratio
of 80.4%.
Å Loan impairments recorded a EUR 4 million release,
resulting in a cost of risk of -12bps.
Operating Results
(in millions) Q1 2017 Q1 2016 Change Q4 2016 Change
Net interest income 164 158 4% 169 -3%
Net fee and commission income 152 144 6% 151 0%
Other operating income 18 17 7% 17 3%
Operating income 334 318 5% 338 -1%
Personnel expenses 125 126 -1% 127 -2%
Other expenses 144 134 8% 150 -4%
Operating expenses 269 260 3% 277 -3%
Operating result 65 59 12% 61 8%
Impairment charges on loans and other receivables -4 5 7
Operating profit/(loss) before taxation 69 54 29% 54 28%
Income tax expense 16 10 54% 5
Underlying profit/(loss) for the period 53 43 23% 49 10%
Special items
Reported profit/(loss) for the period 53 43 23% 49 10%
Other indicatorsQ1 2017 Q1 2016 Q4 2016
Underlying cost/income ratio 80.4% 81.6% 82.1%
Underlying cost of risk (in bps)1 -12 11 17
1 Annualised impairment charges on loans and receivables - customers for the period divided by the average loans and receivables - customers on the basis of gross carrying amount and excluding the fair value adjustments from hedge accounting.
31 March 2017 31 December 2016
Loan-to-Deposit ratio 19% 20%
Loans and receivables - customers (in billions) 12.0 12.1
Due to customers (in billions) 64.7 61.8
Risk-weighted assets (risk exposure amount; in billions) 9.5 7.7
FTEs 3,812 3,844
Private Banking
ABN AMRO Group Quarterly Report first quarter 2017
17
IntroductionRisk, funding &
capital information
Other
Business / Results by segment
Business
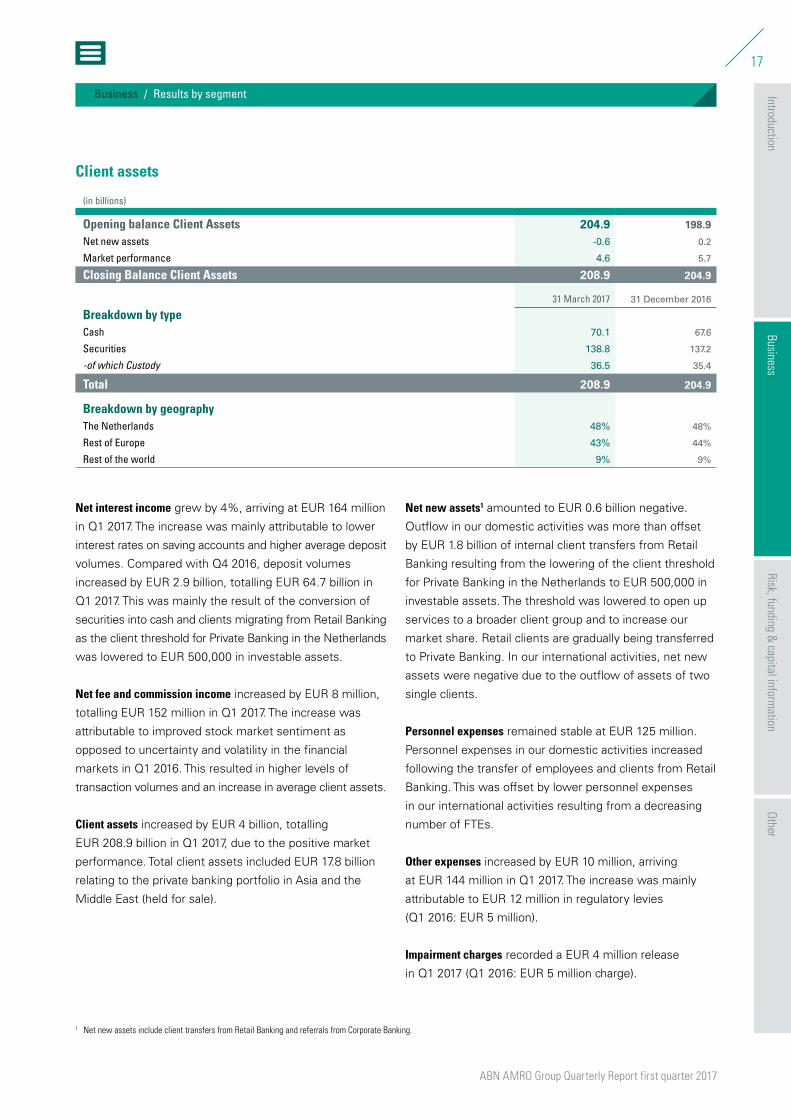
Client assets
(in billions)
Opening balance Client Assets 204.9 198.9
Net new assets -0.6 0.2
Market performance 4.6 5.7
Closing Balance Client Assets 208.9 204.9
31 March 2017 31 December 2016
Breakdown by typeCash 70.1 67.6
Securities 138.8 137.2
-of which Custody 36.5 35.4
Total 208.9 204.9
Breakdown by geographyThe Netherlands 48% 48%
Rest of Europe 43% 44%
Rest of the world 9% 9%
Net interest income grew by 4%, arriving at EUR 164 million
in Q1 2017. The increase was mainly attributable to lower
interest rates on saving accounts and higher average deposit
volumes. Compared with Q4 2016, deposit volumes
increased by EUR 2.9 billion, totalling EUR 64.7 billion in
Q1 2017. This was mainly the result of the conversion of
securities into cash and clients migrating from Retail Banking
as the client threshold for Private Banking in the Netherlands
was lowered to EUR 500,000 in investable assets.
Net fee and commission income increased by EUR 8 million,
totalling EUR 152 million in Q1 2017. The increase was
attributable to improved stock market sentiment as
opposed to uncertainty and volatility in the financial
markets in Q1 2016. This resulted in higher levels of
transaction volumes and an increase in average client assets.
Client assets increased by EUR 4 billion, totalling
EUR 208.9 billion in Q1 2017, due to the positive market
performance. Total client assets included EUR 17.8 billion
relating to the private banking portfolio in Asia and the
Middle East (held for sale).
Net new assets1 amounted to EUR 0.6 billion negative.
Outflow in our domestic activities was more than offset
by EUR 1.8 billion of internal client transfers from Retail
Banking resulting from the lowering of the client threshold
for Private Banking in the Netherlands to EUR 500,000 in
investable assets. The threshold was lowered to open up
services to a broader client group and to increase our
market share. Retail clients are gradually being transferred
to Private Banking. In our international activities, net new
assets were negative due to the outflow of assets of two
single clients.
Personnel expenses remained stable at EUR 125 million.
Personnel expenses in our domestic activities increased
following the transfer of employees and clients from Retail
Banking. This was offset by lower personnel expenses
in our international activities resulting from a decreasing
number of FTEs.
Other expenses increased by EUR 10 million, arriving
at EUR 144 million in Q1 2017. The increase was mainly
attributable to EUR 12 million in regulatory levies
(Q1 2016: EUR 5 million).
Impairment charges recorded a EUR 4 million release
in Q1 2017 (Q1 2016: EUR 5 million charge).
1 Net new assets include client transfers from Retail Banking and referrals from Corporate Banking.
ABN AMRO Group Quarterly Report first quarter 2017
18
IntroductionRisk, funding &
capital information
Other
Business / Results by segment
Business
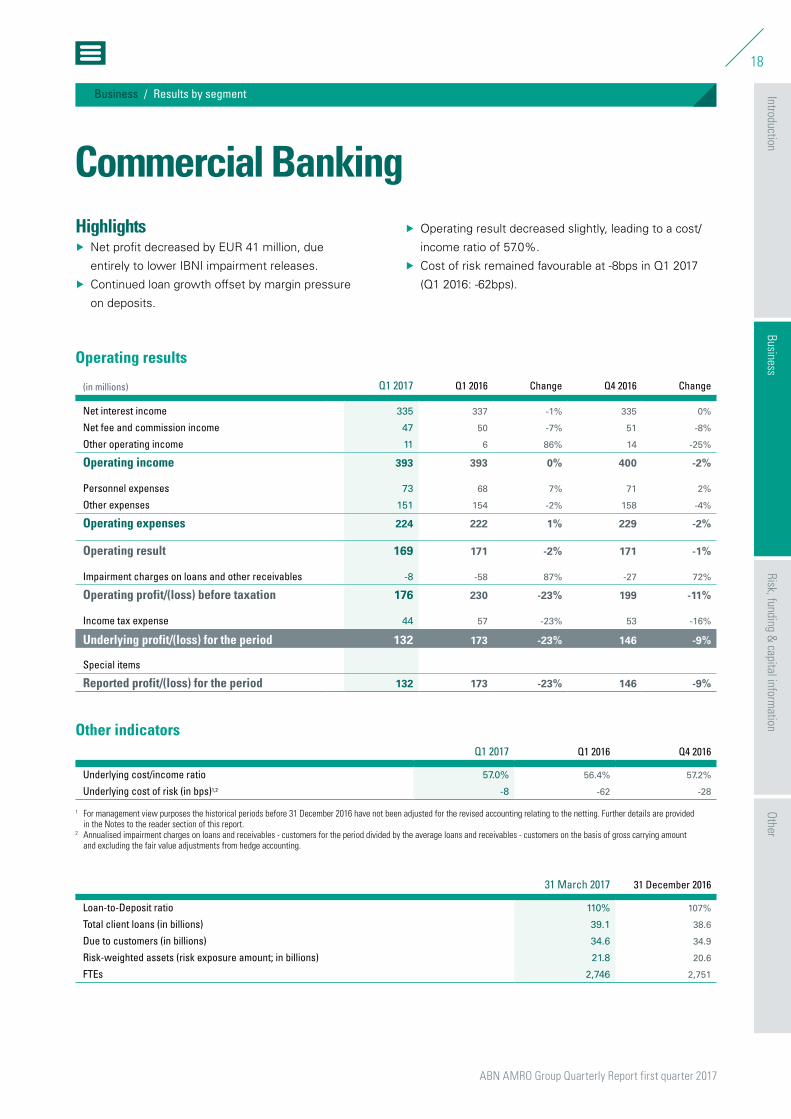
Highlights Å Net profit decreased by EUR 41 million, due
entirely to lower IBNI impairment releases.
Å Continued loan growth offset by margin pressure
on deposits.
Å Operating result decreased slightly, leading to a cost/
income ratio of 57.0%.
Å Cost of risk remained favourable at -8bps in Q1 2017
(Q1 2016: -62bps).
Operating results
(in millions) Q1 2017 Q1 2016 Change Q4 2016 Change
Net interest income 335 337 -1% 335 0%
Net fee and commission income 47 50 -7% 51 -8%
Other operating income 11 6 86% 14 -25%
Operating income 393 393 0% 400 -2%
Personnel expenses 73 68 7% 71 2%
Other expenses 151 154 -2% 158 -4%
Operating expenses 224 222 1% 229 -2%
Operating result 169 171 -2% 171 -1%
Impairment charges on loans and other receivables -8 -58 87% -27 72%
Operating profit/(loss) before taxation 176 230 -23% 199 -11%
Income tax expense 44 57 -23% 53 -16%
Underlying profit/(loss) for the period 132 173 -23% 146 -9%
Special items
Reported profit/(loss) for the period 132 173 -23% 146 -9%
Other indicatorsQ1 2017 Q1 2016 Q4 2016
Underlying cost/income ratio 57.0% 56.4% 57.2%
Underlying cost of risk (in bps)1,2 -8 -62 -28
1 For management view purposes the historical periods before 31 December 2016 have not been adjusted for the revised accounting relating to the netting. Further details are provided in the Notes to the reader section of this report.
2 Annualised impairment charges on loans and receivables - customers for the period divided by the average loans and receivables - customers on the basis of gross carrying amount and excluding the fair value adjustments from hedge accounting.
31 March 2017 31 December 2016
Loan-to-Deposit ratio 110% 107%
Total client loans (in billions) 39.1 38.6
Due to customers (in billions) 34.6 34.9
Risk-weighted assets (risk exposure amount; in billions) 21.8 20.6
FTEs 2,746 2,751
Commercial Banking
ABN AMRO Group Quarterly Report first quarter 2017
19
IntroductionRisk, funding &
capital information
Other
Business / Results by segment
Business
Net interest income decreased slightly, coming to
EUR 335 million in Q1 2017 (Q1 2016: EUR 337 million).
The low interest environment is putting pressure on
interest income on client deposits. Most client rates are
zero, while negative interest rates are charged to a
selected group of clients. Interest income on assets
improved as client lending grew on the back of improving
economic conditions in the Netherlands. Growth in client
lending was predominantly driven by asset-based finance
and real estate. Part of the real estate growth is related to
an ABN AMRO programme helping commercial real estate
clients make the transition to sustainable real estate.
Net fee and commission income decreased by EUR 3 million,
totalling EUR 47 million in Q1 2017, mainly on account
of incidental fee expenses in Q1 2017.
Other operating income increased to EUR 11 million in
Q1 2017 (Q1 2016: EUR 6 million) as Q1 2017 included
a favourable revaluation result.
Personnel expenses increased by EUR 5 million, attributable
to wage inflation and a higher number of FTEs (compared
with Q1 2016) to enable growth in asset-based financing
and to execute duty of care projects. The number of FTEs
declined compared with Q4 2016.
Other expenses decreased by EUR 3 million, despite a
EUR 4 million increase in regulatory levies in Q1 2017
(EUR 20 million versus EUR 16 million in Q1 2016).
This was attributable to lower allocated costs, partly
resulting from the announced savings programmes.
Impairment charges amounted to a release of EUR 8 million
in Q1 2017 (Q1 2016: a release of EUR 58 million). Lower
impairment releases were the result of a lower IBNI
release (EUR 1 million in Q1 2017 versus EUR 61 million
in Q1 2016). Apart from IBNI releases, impairment charges
decreased slightly due to the ongoing broad improvement
of the Dutch economy. The underlying cost of risk was
-8bps (Q1 2016: -62bps).
ABN AMRO Group Quarterly Report first quarter 2017
20
IntroductionRisk, funding &
capital information
Other
Business / Results by segment
Business
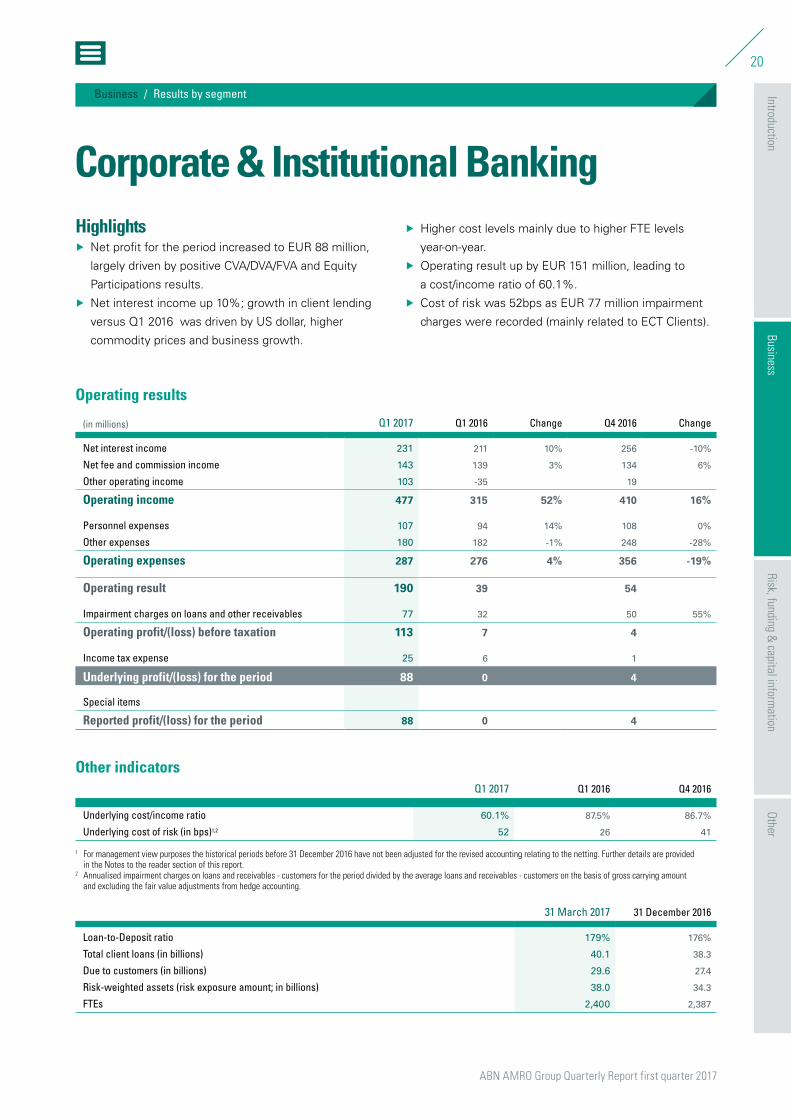
Highlights Å Net profit for the period increased to EUR 88 million,
largely driven by positive CVA/DVA/FVA and Equity
Participations results.
Å Net interest income up 10%; growth in client lending
versus Q1 2016 was driven by US dollar, higher
commodity prices and business growth.
Å Higher cost levels mainly due to higher FTE levels
year-on-year.
Å Operating result up by EUR 151 million, leading to
a cost/income ratio of 60.1%.
Å Cost of risk was 52bps as EUR 77 million impairment
charges were recorded (mainly related to ECT Clients).
Operating results
(in millions) Q1 2017 Q1 2016 Change Q4 2016 Change
Net interest income 231 211 10% 256 -10%
Net fee and commission income 143 139 3% 134 6%
Other operating income 103 -35 19
Operating income 477 315 52% 410 16%
Personnel expenses 107 94 14% 108 0%
Other expenses 180 182 -1% 248 -28%
Operating expenses 287 276 4% 356 -19%
Operating result 190 39 54
Impairment charges on loans and other receivables 77 32 50 55%
Operating profit/(loss) before taxation 113 7 4
Income tax expense 25 6 1
Underlying profit/(loss) for the period 88 0 4
Special items
Reported profit/(loss) for the period 88 0 4
Other indicatorsQ1 2017 Q1 2016 Q4 2016
Underlying cost/income ratio 60.1% 87.5% 86.7%
Underlying cost of risk (in bps)1,2 52 26 41
1 For management view purposes the historical periods before 31 December 2016 have not been adjusted for the revised accounting relating to the netting. Further details are provided in the Notes to the reader section of this report.
2 Annualised impairment charges on loans and receivables - customers for the period divided by the average loans and receivables - customers on the basis of gross carrying amount and excluding the fair value adjustments from hedge accounting.
31 March 2017 31 December 2016
Loan-to-Deposit ratio 179% 176%
Total client loans (in billions) 40.1 38.3
Due to customers (in billions) 29.6 27.4
Risk-weighted assets (risk exposure amount; in billions) 38.0 34.3
FTEs 2,400 2,387
Corporate & Institutional Banking
ABN AMRO Group Quarterly Report first quarter 2017
21
IntroductionRisk, funding &
capital information
Other
Business / Results by segment
Business
Net interest income was EUR 231 million in Q1 2017, up
10% (Q1 2016: EUR 211 million). Interest growth was
predominantly recorded within ECT Clients on the back of
increased client lending. The rise in client loans was driven
by a combination of the appreciation of the USD, higher
commodity prices and business growth. Compared with
Q4 2016, continued loan growth within Commodities was
slightly offset by a weakening of the USD and a decrease
within Energy. Interest income was down 10% q-o-q,
partly due to favourable one-offs (in Q4 2016) in the area
of collateral management at Sales & Trading. Net interest
income on liabilities remained stable. A larger number of
professional parties are being charged negative interest
on liabilities.
Net fee and commission income amounted to EUR 143 million
in Q1 2017, up 3% (Q1 2016: EUR 139 million). Higher
off-balance volumes relating to trade and guarantees within
ECT Clients resulted in higher fee income. Corporate
Finance fees increased. Clearing reported lower fee levels in
Q1 2017 as Q1 2016 was characterised by high volatility in
the financial markets (high volumes of cleared transactions).
Other operating income increased by EUR 138 million
to EUR 103 million in Q1 2017 (Q1 2016: a loss of
EUR 35 million). CVA/DVA/FVA amounted to EUR 23 million
in Q1 2017 (Q1 2016: EUR 49 million negative). Equity
Participations results amounted to EUR 25 million in
Q1 2017 (nil in Q1 2016). Furthermore, other operating
income improved as Q1 2016 included a EUR 15 million
provision for SME derivative-related issues, while favourable
business-as-usual results were recorded at Sales & Trading
in Q1 2017.
Personnel expenses increased by EUR 13 million, mainly due
to an increase in FTEs (domestic and foreign branches)
in line with ambitions to support growth and a stronger
USD throughout Q1 2017.
Other expenses amounted to EUR 180 million, remaining
flat compared with Q1 2016. Compared with Q4 2016,
other expenses decreased significantly, due mainly
to EUR 55 million in provision for SME costs recorded
in Q4 2016.
Impairment charges amounted to EUR 77 million in Q1 2017
(Q1 2016: EUR 32 million), partly due to a EUR 14 million
IBNI charge in Q1 2017 (Q1 2016: EUR 1 million addition).
The underlying cost of risk was 52bps (Q1 2016: 26bps).
Impairment charges within ECT Clients increased to
EUR 59 million (48 million in Q1 2016).
ABN AMRO Group Quarterly Report first quarter 2017
22
IntroductionRisk, funding &
capital information
Other
Business / Results by segment
Business
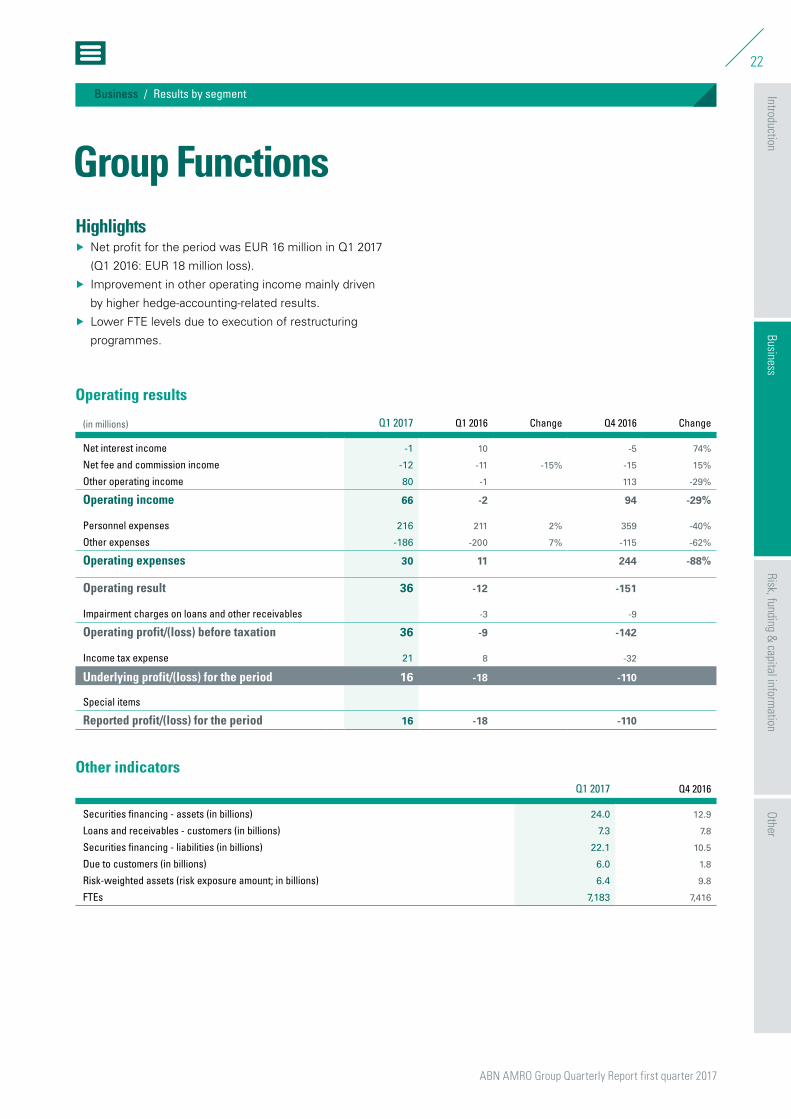
Group FunctionsHighlights
Å Net profit for the period was EUR 16 million in Q1 2017
(Q1 2016: EUR 18 million loss).
Å Improvement in other operating income mainly driven
by higher hedge-accounting-related results.
Å Lower FTE levels due to execution of restructuring
programmes.
Operating results
(in millions) Q1 2017 Q1 2016 Change Q4 2016 Change
Net interest income -1 10 -5 74%
Net fee and commission income -12 -11 -15% -15 15%
Other operating income 80 -1 113 -29%
Operating income 66 -2 94 -29%
Personnel expenses 216 211 2% 359 -40%
Other expenses -186 -200 7% -115 -62%
Operating expenses 30 11 244 -88%
Operating result 36 -12 -151
Impairment charges on loans and other receivables -3 -9
Operating profit/(loss) before taxation 36 -9 -142
Income tax expense 21 8 -32
Underlying profit/(loss) for the period 16 -18 -110
Special items
Reported profit/(loss) for the period 16 -18 -110
Other indicatorsQ1 2017 Q4 2016
Securities financing - assets (in billions) 24.0 12.9
Loans and receivables - customers (in billions) 7.3 7.8
Securities financing - liabilities (in billions) 22.1 10.5
Due to customers (in billions) 6.0 1.8
Risk-weighted assets (risk exposure amount; in billions) 6.4 9.8
FTEs 7,183 7,416
ABN AMRO Group Quarterly Report first quarter 2017
23
IntroductionRisk, funding &
capital information
Other
Business / Results by segment
Business
Other operating income was EUR 80 million in Q1 2017
(Q1 2016: EUR 1 million loss). The rise in other operating
income was mainly driven by hedge accounting-related
results (EUR 50 million versus EUR 25 million loss in
Q1 2016).
Personnel expenses went up by EUR 5 million. The rise
was mainly driven by severance payments (approximately
EUR 12 million) as a result of the introduction of the new
management structure at ABN AMRO. The number of
FTEs decreased by 233, totalling 7,183 FTEs in Q1 2017.
The decline in FTEs was due mainly to the existing
restructuring programme TOPS 2020 and Retail
Digitalisation and the restructuring announced in Q3 2016
relating to the support and control activities.
Other expenses increased by EUR 14 million as fewer
costs were allocated to the commercial segments.
Expenses incurred directly by Group Functions decreased
due to stringent cost control. Compared with Q4 2016,
costs decreased mainly due to lower IT and project-related
costs.
Due to customers increased significantly, compared with both
Q1 2016 and Q4 2016, driven by higher foreign deposits
for the purpose of currency management (instead of swaps).
ABN AMRO Group Quarterly Report first quarter 2017
24
IntroductionRisk, funding &
capital information
Other
Business / Additional financial information
Business
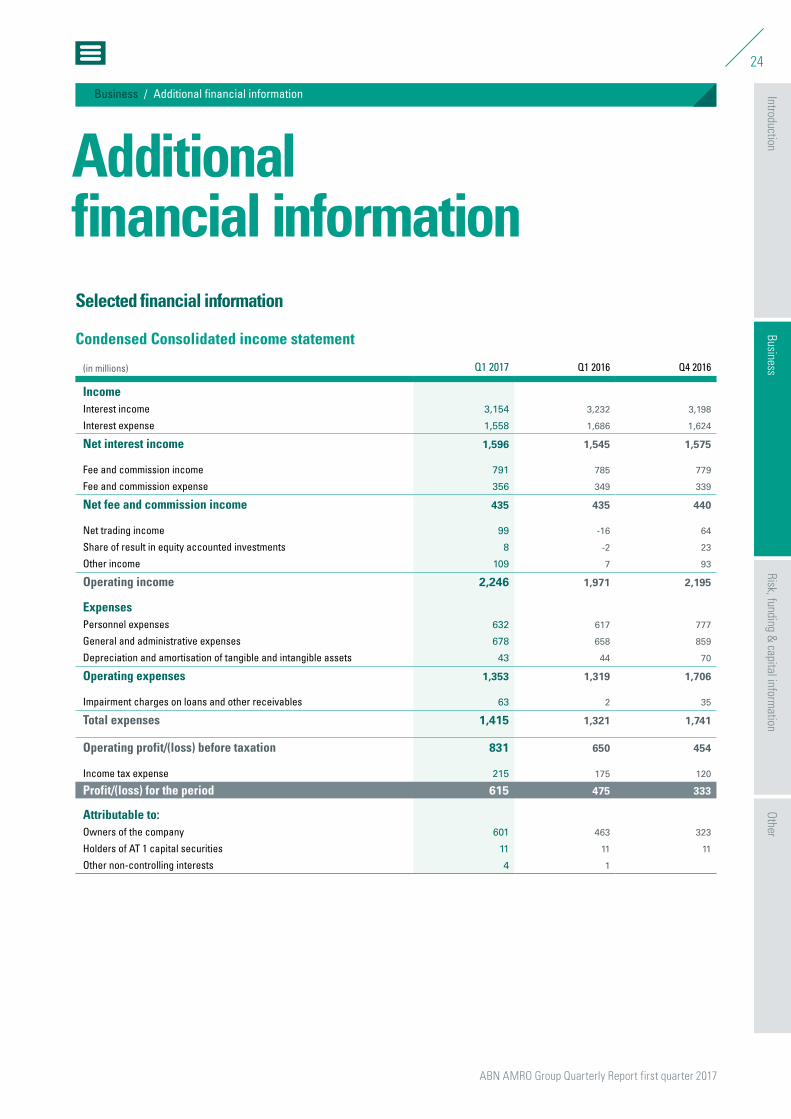
Additional financial informationSelected financial information
Condensed Consolidated income statement
(in millions) Q1 2017 Q1 2016 Q4 2016
IncomeInterest income 3,154 3,232 3,198
Interest expense 1,558 1,686 1,624
Net interest income 1,596 1,545 1,575
Fee and commission income 791 785 779
Fee and commission expense 356 349 339
Net fee and commission income 435 435 440
Net trading income 99 -16 64
Share of result in equity accounted investments 8 -2 23
Other income 109 7 93
Operating income 2,246 1,971 2,195
ExpensesPersonnel expenses 632 617 777
General and administrative expenses 678 658 859
Depreciation and amortisation of tangible and intangible assets 43 44 70
Operating expenses 1,353 1,319 1,706
Impairment charges on loans and other receivables 63 2 35
Total expenses 1,415 1,321 1,741
Operating profit/(loss) before taxation 831 650 454
Income tax expense 215 175 120
Profit/(loss) for the period 615 475 333
Attributable to:Owners of the company 601 463 323
Holders of AT 1 capital securities 11 11 11
Other non-controlling interests 4 1
Additional financial information Additional financial information (Engels)
ABN AMRO Group Quarterly Report first quarter 2017
25
IntroductionRisk, funding &
capital information
Other
Business / Additional financial information
Business
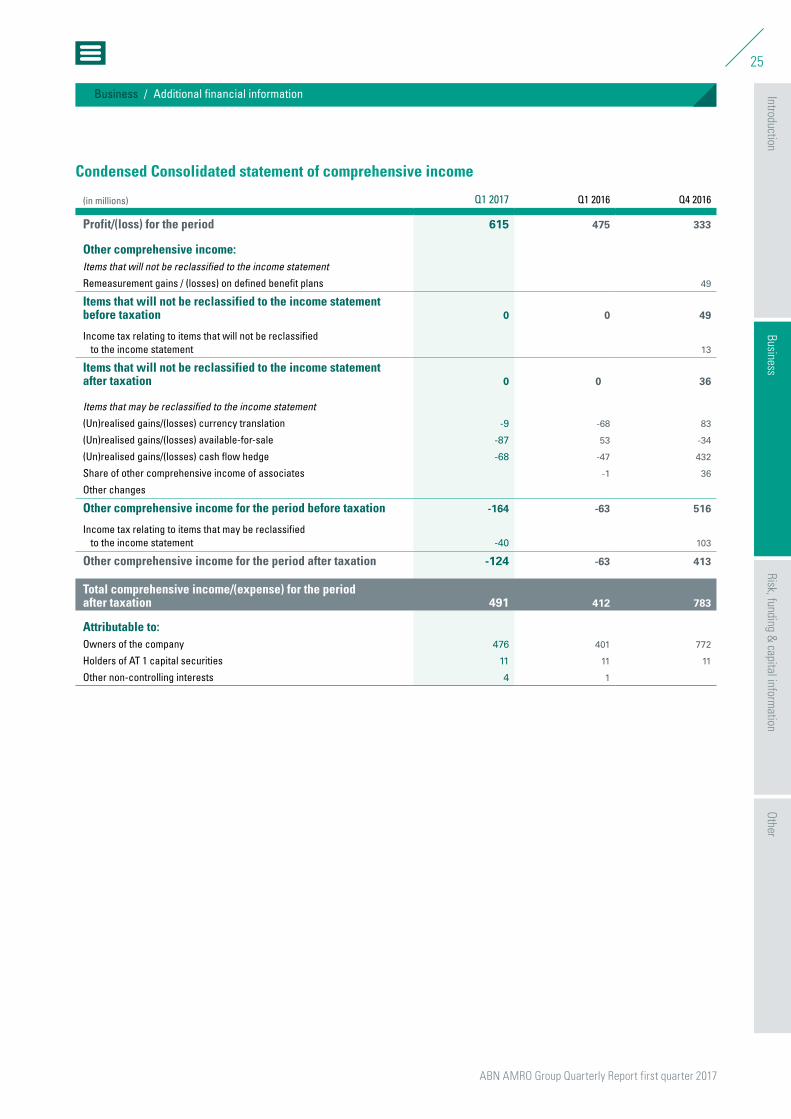
Condensed Consolidated statement of comprehensive income
(in millions) Q1 2017 Q1 2016 Q4 2016
Profit/(loss) for the period 615 475 333
Other comprehensive income:Items that will not be reclassified to the income statementRemeasurement gains / (losses) on defined benefit plans 49
Items that will not be reclassified to the income statement before taxation 0 0 49
Income tax relating to items that will not be reclassified to the income statement 13
Items that will not be reclassified to the income statement after taxation 0 0 36
Items that may be reclassified to the income statement(Un)realised gains/(losses) currency translation -9 -68 83
(Un)realised gains/(losses) available-for-sale -87 53 -34
(Un)realised gains/(losses) cash flow hedge -68 -47 432
Share of other comprehensive income of associates -1 36
Other changes
Other comprehensive income for the period before taxation -164 -63 516
Income tax relating to items that may be reclassified to the income statement -40 103
Other comprehensive income for the period after taxation -124 -63 413
Total comprehensive income/(expense) for the period after taxation 491 412 783
Attributable to:Owners of the company 476 401 772
Holders of AT 1 capital securities 11 11 11
Other non-controlling interests 4 1
ABN AMRO Group Quarterly Report first quarter 2017
26
IntroductionRisk, funding &
capital information
Other
Business / Additional financial information
Business
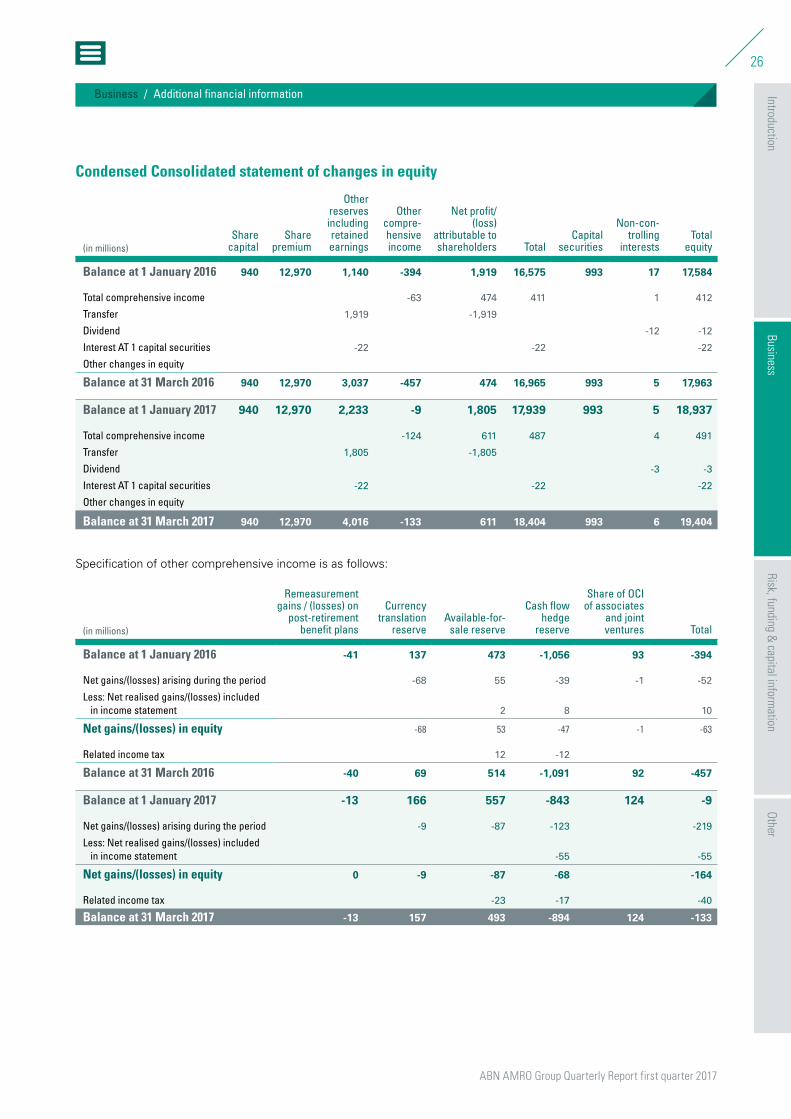
Condensed Consolidated statement of changes in equity
(in millions)Share
capitalShare
premium
Other reserves including retained earnings
Other compre-hensive income
Net profit/(loss)
attributable to shareholders Total
Capital securities
Non-con-trolling
interestsTotal
equity
Balance at 1 January 2016 940 12,970 1,140 -394 1,919 16,575 993 17 17,584
Total comprehensive income -63 474 411 1 412
Transfer 1,919 -1,919
Dividend -12 -12
Interest AT 1 capital securities -22 -22 -22
Other changes in equity
Balance at 31 March 2016 940 12,970 3,037 -457 474 16,965 993 5 17,963
Balance at 1 January 2017 940 12,970 2,233 -9 1,805 17,939 993 5 18,937
Total comprehensive income -124 611 487 4 491
Transfer 1,805 -1,805
Dividend -3 -3
Interest AT 1 capital securities -22 -22 -22
Other changes in equity
Balance at 31 March 2017 940 12,970 4,016 -133 611 18,404 993 6 19,404
Specification of other comprehensive income is as follows:
(in millions)
Remeasurement gains / (losses) on
post-retirement benefit plans
Currency translation
reserveAvailable-for-
sale reserve
Cash flow hedge
reserve
Share of OCI of associates
and joint ventures Total
Balance at 1 January 2016 -41 137 473 -1,056 93 -394
Net gains/(losses) arising during the period -68 55 -39 -1 -52
Less: Net realised gains/(losses) included in income statement 2 8 10
Net gains/(losses) in equity -68 53 -47 -1 -63
Related income tax 12 -12
Balance at 31 March 2016 -40 69 514 -1,091 92 -457
Balance at 1 January 2017 -13 166 557 -843 124 -9
Net gains/(losses) arising during the period -9 -87 -123 -219
Less: Net realised gains/(losses) included in income statement -55 -55
Net gains/(losses) in equity 0 -9 -87 -68 -164
Related income tax -23 -17 -40
Balance at 31 March 2017 -13 157 493 -894 124 -133
27
IntroductionBusiness
OtherRisk, funding &
capital information
28
Key developments
30
Credit riskDevelopments in specific portfolios 34
37
Liquidity risk
39
Funding
41
Capital management
Risk, funding & capital information
Risk, funding & capital information
ABN AMRO Group Quarterly Report first quarter 2017
28
IntroductionBusiness
OtherRisk, funding &
capital information
Risk, funding & capital information / Key developments
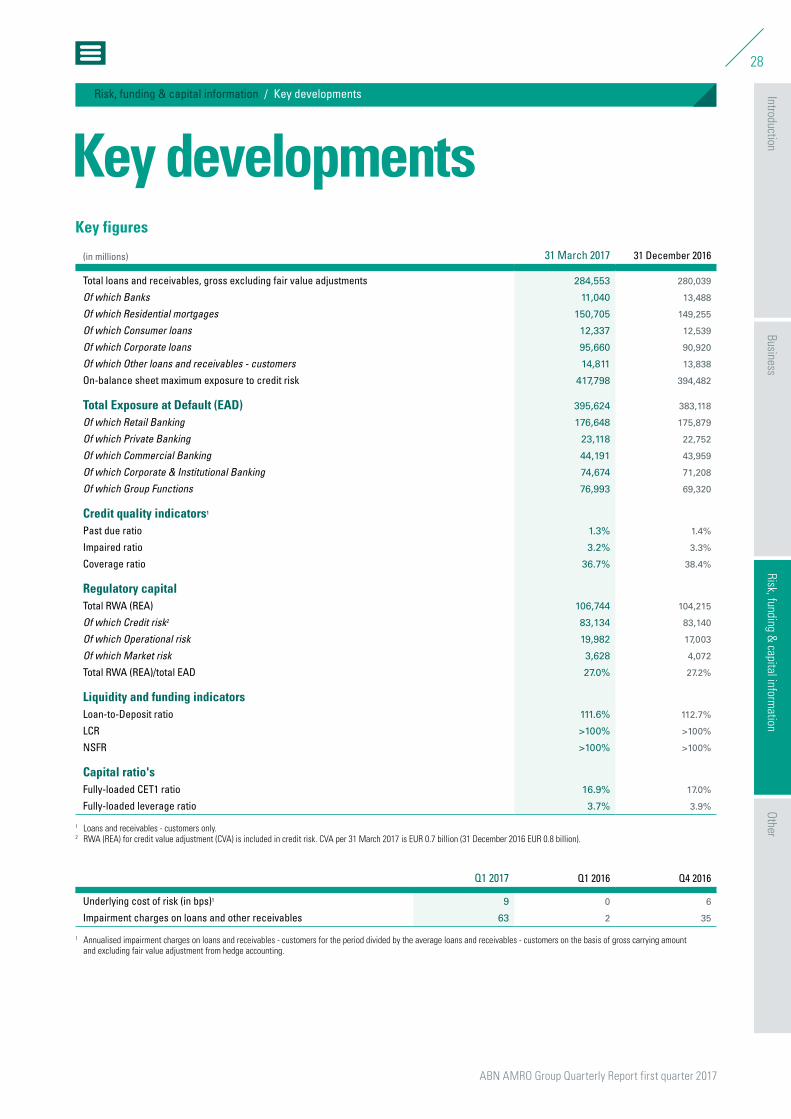
Key developmentsKey figures
(in millions) 31 March 2017 31 December 2016
Total loans and receivables, gross excluding fair value adjustments 284,553 280,039
Of which Banks 11,040 13,488
Of which Residential mortgages 150,705 149,255
Of which Consumer loans 12,337 12,539
Of which Corporate loans 95,660 90,920
Of which Other loans and receivables - customers 14,811 13,838
On-balance sheet maximum exposure to credit risk 417,798 394,482
Total Exposure at Default (EAD) 395,624 383,118
Of which Retail Banking 176,648 175,879
Of which Private Banking 23,118 22,752
Of which Commercial Banking 44,191 43,959
Of which Corporate & Institutional Banking 74,674 71,208
Of which Group Functions 76,993 69,320
Credit quality indicators1
Past due ratio 1.3% 1.4%
Impaired ratio 3.2% 3.3%
Coverage ratio 36.7% 38.4%
Regulatory capitalTotal RWA (REA) 106,744 104,215
Of which Credit risk2 83,134 83,140
Of which Operational risk 19,982 17,003
Of which Market risk 3,628 4,072
Total RWA (REA)/total EAD 27.0% 27.2%
Liquidity and funding indicatorsLoan-to-Deposit ratio 111.6% 112.7%
LCR >100% >100%
NSFR >100% >100%
Capital ratio'sFully-loaded CET1 ratio 16.9% 17.0%
Fully-loaded leverage ratio 3.7% 3.9%
1 Loans and receivables - customers only.2 RWA (REA) for credit value adjustment (CVA) is included in credit risk. CVA per 31 March 2017 is EUR 0.7 billion (31 December 2016 EUR 0.8 billion).
Q1 2017 Q1 2016 Q4 2016
Underlying cost of risk (in bps)1 9 0 6
Impairment charges on loans and other receivables 63 2 35
1 Annualised impairment charges on loans and receivables - customers for the period divided by the average loans and receivables - customers on the basis of gross carrying amount and excluding fair value adjustment from hedge accounting.
Key developments Key developments (Engels)
ABN AMRO Group Quarterly Report first quarter 2017
29
IntroductionBusiness
OtherRisk, funding &
capital information
Risk, funding & capital information / Key developments
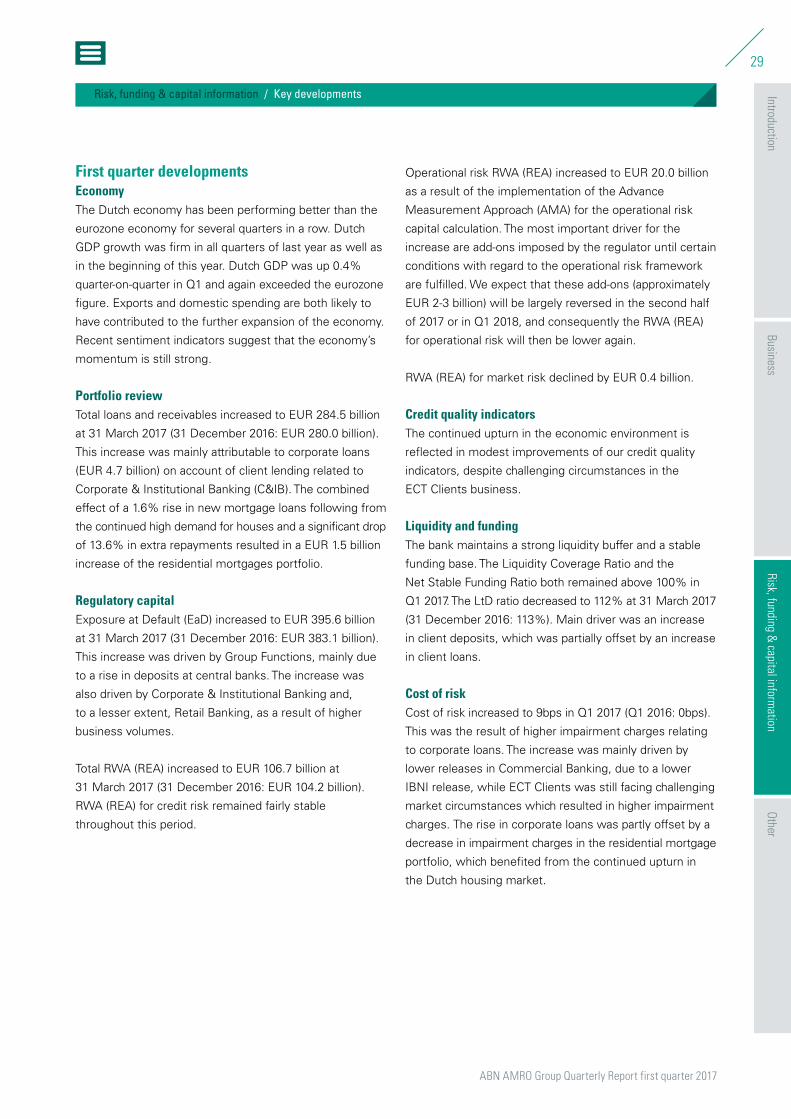
First quarter developmentsEconomyThe Dutch economy has been performing better than the
eurozone economy for several quarters in a row. Dutch
GDP growth was firm in all quarters of last year as well as
in the beginning of this year. Dutch GDP was up 0.4%
quarter-on-quarter in Q1 and again exceeded the eurozone
figure. Exports and domestic spending are both likely to
have contributed to the further expansion of the economy.
Recent sentiment indicators suggest that the economy’s
momentum is still strong.
Portfolio reviewTotal loans and receivables increased to EUR 284.5 billion
at 31 March 2017 (31 December 2016: EUR 280.0 billion).
This increase was mainly attributable to corporate loans
(EUR 4.7 billion) on account of client lending related to
Corporate & Institutional Banking (C&IB). The combined
effect of a 1.6% rise in new mortgage loans following from
the continued high demand for houses and a significant drop
of 13.6% in extra repayments resulted in a EUR 1.5 billion
increase of the residential mortgages portfolio.
Regulatory capitalExposure at Default (EaD) increased to EUR 395.6 billion
at 31 March 2017 (31 December 2016: EUR 383.1 billion).
This increase was driven by Group Functions, mainly due
to a rise in deposits at central banks. The increase was
also driven by Corporate & Institutional Banking and,
to a lesser extent, Retail Banking, as a result of higher
business volumes.
Total RWA (REA) increased to EUR 106.7 billion at
31 March 2017 (31 December 2016: EUR 104.2 billion).
RWA (REA) for credit risk remained fairly stable
throughout this period.
Operational risk RWA (REA) increased to EUR 20.0 billion
as a result of the implementation of the Advance
Measurement Approach (AMA) for the operational risk
capital calculation. The most important driver for the
increase are add-ons imposed by the regulator until certain
conditions with regard to the operational risk framework
are fulfilled. We expect that these add-ons (approximately
EUR 2-3 billion) will be largely reversed in the second half
of 2017 or in Q1 2018, and consequently the RWA (REA)
for operational risk will then be lower again.
RWA (REA) for market risk declined by EUR 0.4 billion.
Credit quality indicatorsThe continued upturn in the economic environment is
reflected in modest improvements of our credit quality
indicators, despite challenging circumstances in the
ECT Clients business.
Liquidity and fundingThe bank maintains a strong liquidity buffer and a stable
funding base. The Liquidity Coverage Ratio and the
Net Stable Funding Ratio both remained above 100% in
Q1 2017. The LtD ratio decreased to 112% at 31 March 2017
(31 December 2016: 113%). Main driver was an increase
in client deposits, which was partially offset by an increase
in client loans.
Cost of riskCost of risk increased to 9bps in Q1 2017 (Q1 2016: 0bps).
This was the result of higher impairment charges relating
to corporate loans. The increase was mainly driven by
lower releases in Commercial Banking, due to a lower
IBNI release, while ECT Clients was still facing challenging
market circumstances which resulted in higher impairment
charges. The rise in corporate loans was partly offset by a
decrease in impairment charges in the residential mortgage
portfolio, which benefited from the continued upturn in
the Dutch housing market.
ABN AMRO Group Quarterly Report first quarter 2017
30
IntroductionBusiness
OtherRisk, funding &
capital information
Risk, funding & capital information / Credit risk
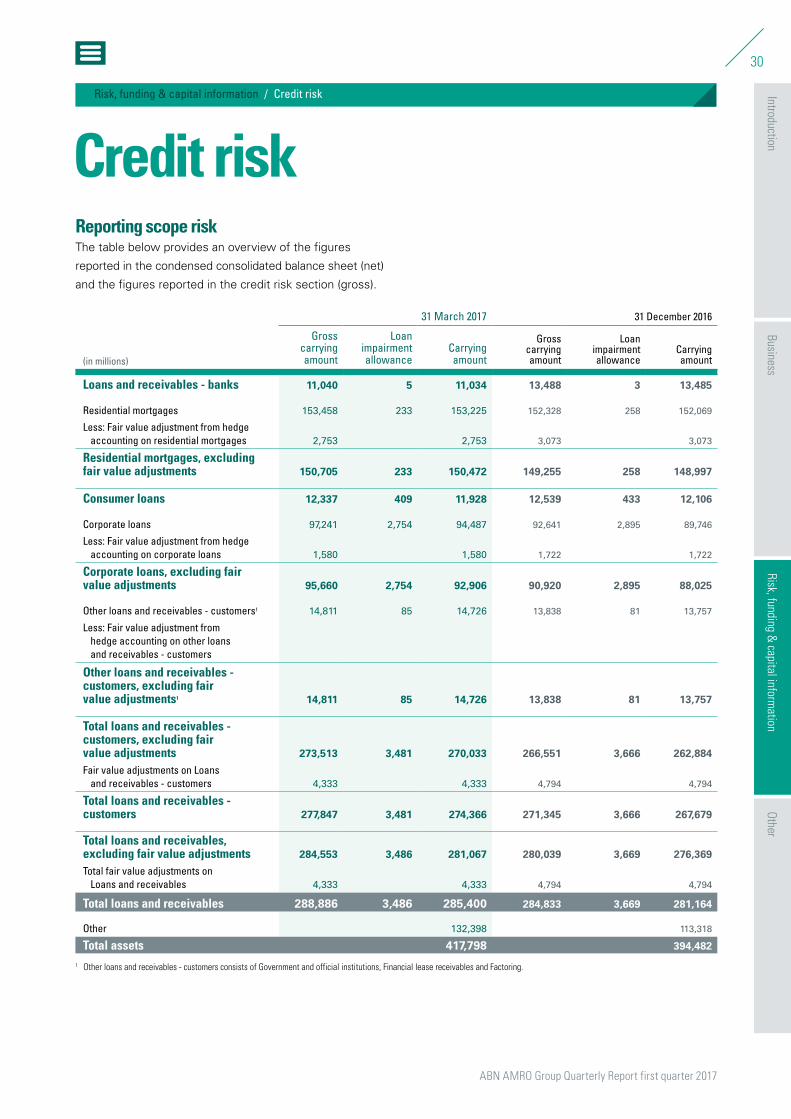
Credit riskReporting scope riskThe table below provides an overview of the figures
reported in the condensed consolidated balance sheet (net)
and the figures reported in the credit risk section (gross).
31 March 2017 31 December 2016
(in millions)
Gross carrying amount
Loan impairment allowance
Carrying amount
Gross carrying amount
Loan impairment allowance
Carrying amount
Loans and receivables - banks 11,040 5 11,034 13,488 3 13,485
Residential mortgages 153,458 233 153,225 152,328 258 152,069
Less: Fair value adjustment from hedge accounting on residential mortgages 2,753 2,753 3,073 3,073
Residential mortgages, excluding fair value adjustments 150,705 233 150,472 149,255 258 148,997
Consumer loans 12,337 409 11,928 12,539 433 12,106
Corporate loans 97,241 2,754 94,487 92,641 2,895 89,746
Less: Fair value adjustment from hedge accounting on corporate loans 1,580 1,580 1,722 1,722
Corporate loans, excluding fair value adjustments 95,660 2,754 92,906 90,920 2,895 88,025
Other loans and receivables - customers1 14,811 85 14,726 13,838 81 13,757
Less: Fair value adjustment from hedge accounting on other loans and receivables - customers
Other loans and receivables - customers, excluding fair value adjustments1 14,811 85 14,726 13,838 81 13,757
Total loans and receivables - customers, excluding fair value adjustments 273,513 3,481 270,033 266,551 3,666 262,884
Fair value adjustments on Loans and receivables - customers 4,333 4,333 4,794 4,794
Total loans and receivables - customers 277,847 3,481 274,366 271,345 3,666 267,679
Total loans and receivables, excluding fair value adjustments 284,553 3,486 281,067 280,039 3,669 276,369
Total fair value adjustments on Loans and receivables 4,333 4,333 4,794 4,794
Total loans and receivables 288,886 3,486 285,400 284,833 3,669 281,164
Other 132,398 113,318
Total assets 417,798 394,482
1 Other loans and receivables - customers consists of Government and official institutions, Financial lease receivables and Factoring.
Credit risk Credit risk (Engels)
ABN AMRO Group Quarterly Report first quarter 2017
31
IntroductionBusiness
OtherRisk, funding &
capital information
Risk, funding & capital information / Credit risk
Developments over the first quarterHighlights
Å Limited impairment charges
Å Past due exposure continued the declining trend
Å Impaired exposures continued to decline
Past dueTotal past due exposure on loans and receivables -
customers declined slightly, totalling EUR 3.5 billion at
31 March 2017 (31 December 2016: EUR 3.6 billion).
Combined with an increased loan portfolio, the past due
ratio improved slightly, reaching 1.3% in the first quarter
of 2017.
At sub-portfolio level, the past due exposure on residential
mortgages increased marginally. This was mainly the result
of the alignment of reporting procedures for some of our
smaller mortgage labels. Corporate loans past due in C&IB
increased (mainly attributable to the <30 days past due
category), partly on account of ECT Clients. Consumer
loans and other loans and receivables improved in line
with the continuous improvement of the Dutch economy.
Coverage and impaired loansImpaired exposures and allowances for impairments for
the loans and receivables - customers portfolio continued
to decline. The coverage ratio decreased slightly to 36.7%
at 31 March 2017 (31 December 2016: 38.4%). The impaired
ratio improved slightly in Q1 2017.
Impaired corporate loans decreased as a combined result
of write-offs and clients returning to the performing
portfolio within Commercial Banking. The decrease was
offset by a rise of the impaired portfolio relating to ECT
Clients (mainly Transportation). Overall, the impaired ratio
improved to 6.9% at 31 March 2017 (31 December 2016:
7.4%) and the coverage ratio decreased to 39.4% at
31 March 2017 (31 December 2016: 41.2%).
Impaired residential mortgages continued to decline, in
line with the improved Dutch economy. Combined with
higher collateral values following from the upward trend in
housing prices, the allowances for impairments decreased
by 11.5%. This resulted in a coverage ratio of 15.6% at 31
March 2017 (31 December 2016: 16.7%).
Other loans and receivables - customers was impacted by
several new impaired files, resulting in a coverage ratio of
24.3% and an impaired ratio of 2.0% at the end of Q1 2017.
Impairment chargesAt EUR 63 million, impairment charges in Q1 2017
were quite limited. In Q1 2016, the impairment charges
benefited from an IBNI release of EUR 81 million (mainly
in favour of Commercial Banking and, to lesser extent,
Retail Banking), while in Q1 2017 there was a small IBNI
addition of EUR 5 million.
The rise in impairment charges was driven by corporate
loans, where these charges rose by EUR 93 million,
mainly on account of Commercial Banking and ECT
Clients. Within Commercial Banking, lower IBNI releases
were recorded (EUR 61 million in Q1 2016 as opposed to
EUR 1 million in Q1 2017). Excluding IBNI, the Commercial
Banking portfolio recorded a release, compared with an
addition in Q1 2016, in line with positive developments
in the Dutch economy.
The residential mortgage portfolio recorded a small release
in Q1 2017, compared with an addition of EUR 25 million
in Q1 2016. This is in line with the continuous improvement
of the Dutch economy, where the housing market has
been positively impacted by housing prices, resulting in
faster settlement and lower losses.
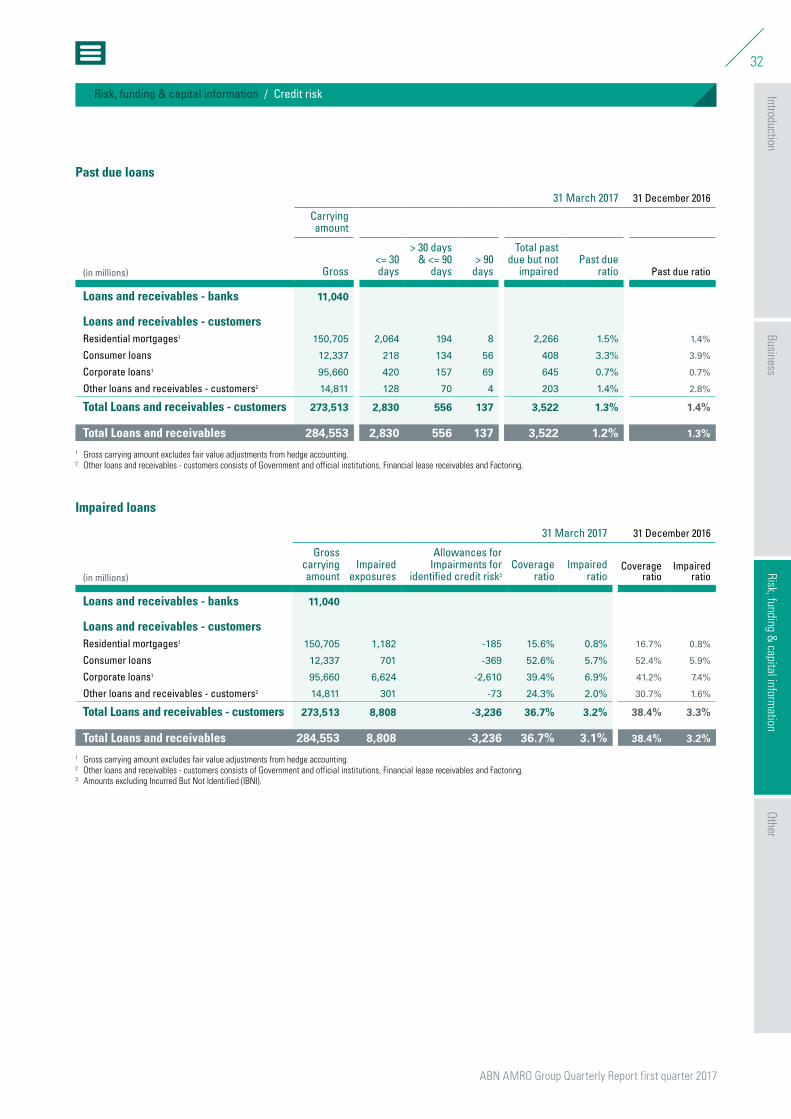
ABN AMRO Group Quarterly Report first quarter 2017
32
IntroductionBusiness
OtherRisk, funding &
capital information
Risk, funding & capital information / Credit risk
Past due loans
31 March 2017 31 December 2016
Carrying amount
(in millions) Gross<= 30 days
> 30 days & <= 90
days> 90
days
Total past due but not
impairedPast due
ratio Past due ratio
Loans and receivables - banks 11,040
Loans and receivables - customersResidential mortgages1 150,705 2,064 194 8 2,266 1.5% 1.4%
Consumer loans 12,337 218 134 56 408 3.3% 3.9%
Corporate loans1 95,660 420 157 69 645 0.7% 0.7%
Other loans and receivables - customers2 14,811 128 70 4 203 1.4% 2.8%
Total Loans and receivables - customers 273,513 2,830 556 137 3,522 1.3% 1.4%
Total Loans and receivables 284,553 2,830 556 137 3,522 1.2% 1.3%
1 Gross carrying amount excludes fair value adjustments from hedge accounting.2 Other loans and receivables - customers consists of Government and official institutions, Financial lease receivables and Factoring.
Impaired loans
31 March 2017 31 December 2016
(in millions)
Gross carrying amount
Impaired exposures
Allowances for Impairments for
identified credit risk3
Coverage ratio
Impaired ratio
Coverage ratio
Impaired ratio
Loans and receivables - banks 11,040
Loans and receivables - customersResidential mortgages1 150,705 1,182 -185 15.6% 0.8% 16.7% 0.8%
Consumer loans 12,337 701 -369 52.6% 5.7% 52.4% 5.9%
Corporate loans1 95,660 6,624 -2,610 39.4% 6.9% 41.2% 7.4%
Other loans and receivables - customers2 14,811 301 -73 24.3% 2.0% 30.7% 1.6%
Total Loans and receivables - customers 273,513 8,808 -3,236 36.7% 3.2% 38.4% 3.3%
Total Loans and receivables 284,553 8,808 -3,236 36.7% 3.1% 38.4% 3.2%
1 Gross carrying amount excludes fair value adjustments from hedge accounting.2 Other loans and receivables - customers consists of Government and official institutions, Financial lease receivables and Factoring.3 Amounts excluding Incurred But Not Identified (IBNI).
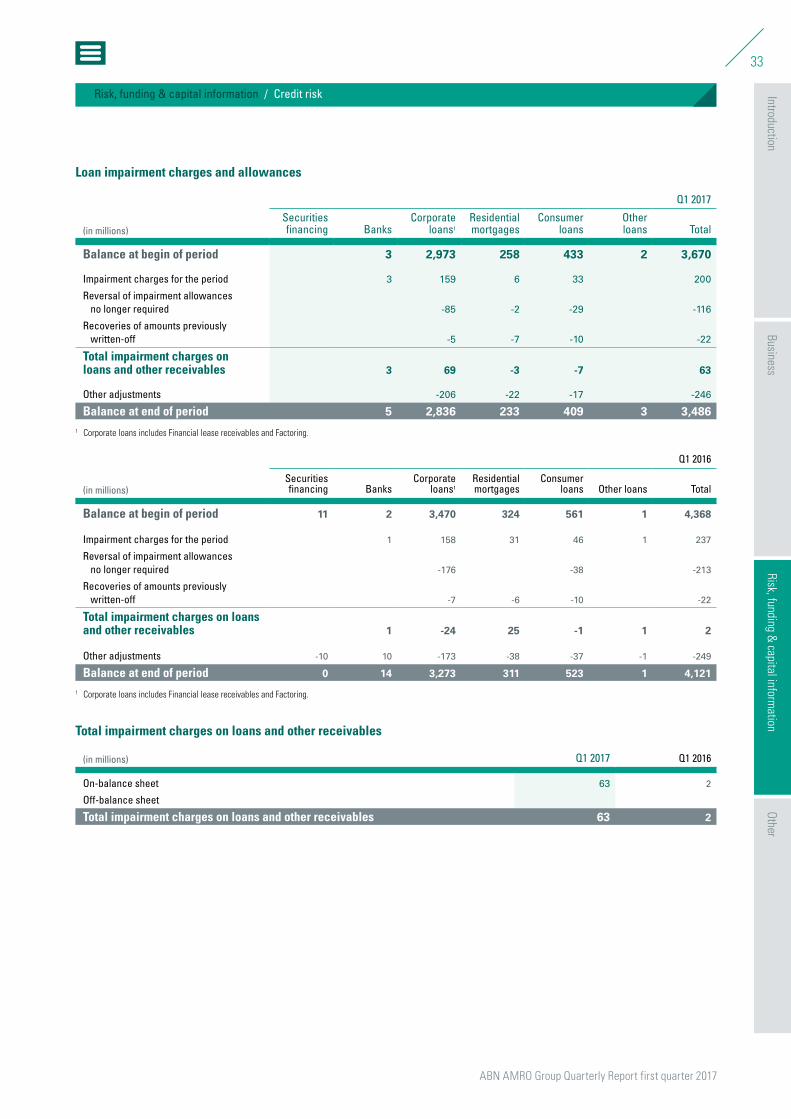
ABN AMRO Group Quarterly Report first quarter 2017
33
IntroductionBusiness
OtherRisk, funding &
capital information
Risk, funding & capital information / Credit risk
Loan impairment charges and allowances
Q1 2017
(in millions)Securities financing Banks
Corporate loans1
Residential mortgages
Consumer loans
Other loans Total
Balance at begin of period 3 2,973 258 433 2 3,670
Impairment charges for the period 3 159 6 33 200
Reversal of impairment allowances no longer required -85 -2 -29 -116
Recoveries of amounts previously written-off -5 -7 -10 -22
Total impairment charges on loans and other receivables 3 69 -3 -7 63
Other adjustments -206 -22 -17 -246
Balance at end of period 5 2,836 233 409 3 3,4861 Corporate loans includes Financial lease receivables and Factoring.
Q1 2016
(in millions)Securities financing Banks
Corporate loans1
Residential mortgages
Consumer loans Other loans Total
Balance at begin of period 11 2 3,470 324 561 1 4,368
Impairment charges for the period 1 158 31 46 1 237
Reversal of impairment allowances no longer required -176 -38 -213
Recoveries of amounts previously written-off -7 -6 -10 -22
Total impairment charges on loans and other receivables 1 -24 25 -1 1 2
Other adjustments -10 10 -173 -38 -37 -1 -249
Balance at end of period 0 14 3,273 311 523 1 4,121
1 Corporate loans includes Financial lease receivables and Factoring.
Total impairment charges on loans and other receivables
(in millions) Q1 2017 Q1 2016
On-balance sheet 63 2
Off-balance sheet
Total impairment charges on loans and other receivables 63 2
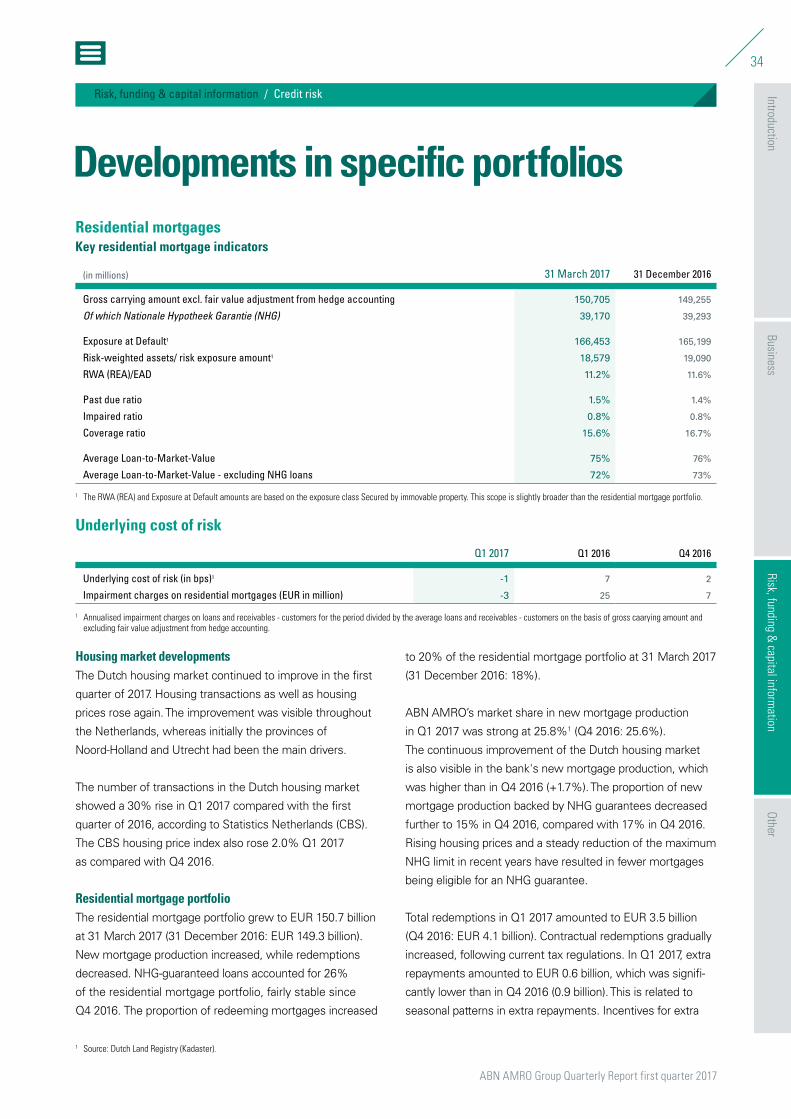
ABN AMRO Group Quarterly Report first quarter 2017
34
IntroductionBusiness
OtherRisk, funding &
capital information
Risk, funding & capital information / Credit risk
Residential mortgagesKey residential mortgage indicators
(in millions) 31 March 2017 31 December 2016
Gross carrying amount excl. fair value adjustment from hedge accounting 150,705 149,255
Of which Nationale Hypotheek Garantie (NHG) 39,170 39,293
Exposure at Default1 166,453 165,199
Risk-weighted assets/ risk exposure amount1 18,579 19,090
RWA (REA)/EAD 11.2% 11.6%
Past due ratio 1.5% 1.4%
Impaired ratio 0.8% 0.8%
Coverage ratio 15.6% 16.7%
Average Loan-to-Market-Value 75% 76%
Average Loan-to-Market-Value - excluding NHG loans 72% 73%
1 The RWA (REA) and Exposure at Default amounts are based on the exposure class Secured by immovable property. This scope is slightly broader than the residential mortgage portfolio.
Underlying cost of risk
Q1 2017 Q1 2016 Q4 2016
Underlying cost of risk (in bps)1 -1 7 2
Impairment charges on residential mortgages (EUR in million) -3 25 7
1 Annualised impairment charges on loans and receivables - customers for the period divided by the average loans and receivables - customers on the basis of gross caarying amount and excluding fair value adjustment from hedge accounting.
Housing market developmentsThe Dutch housing market continued to improve in the first
quarter of 2017. Housing transactions as well as housing
prices rose again. The improvement was visible throughout
the Netherlands, whereas initially the provinces of
Noord-Holland and Utrecht had been the main drivers.
The number of transactions in the Dutch housing market
showed a 30% rise in Q1 2017 compared with the first
quarter of 2016, according to Statistics Netherlands (CBS).
The CBS housing price index also rose 2.0% Q1 2017
as compared with Q4 2016.
Residential mortgage portfolioThe residential mortgage portfolio grew to EUR 150.7 billion
at 31 March 2017 (31 December 2016: EUR 149.3 billion).
New mortgage production increased, while redemptions
decreased. NHG-guaranteed loans accounted for 26%
of the residential mortgage portfolio, fairly stable since
Q4 2016. The proportion of redeeming mortgages increased
to 20% of the residential mortgage portfolio at 31 March 2017
(31 December 2016: 18%).
ABN AMRO’s market share in new mortgage production
in Q1 2017 was strong at 25.8%1 (Q4 2016: 25.6%).
The continuous improvement of the Dutch housing market
is also visible in the bank's new mortgage production, which
was higher than in Q4 2016 (+1.7%). The proportion of new
mortgage production backed by NHG guarantees decreased
further to 15% in Q4 2016, compared with 17% in Q4 2016.
Rising housing prices and a steady reduction of the maximum
NHG limit in recent years have resulted in fewer mortgages
being eligible for an NHG guarantee.
Total redemptions in Q1 2017 amounted to EUR 3.5 billion
(Q4 2016: EUR 4.1 billion). Contractual redemptions gradually
increased, following current tax regulations. In Q1 2017, extra
repayments amounted to EUR 0.6 billion, which was signifi-
cantly lower than in Q4 2016 (0.9 billion). This is related to
seasonal patterns in extra repayments. Incentives for extra
Developments in specific portfolios
1 Source: Dutch Land Registry (Kadaster).
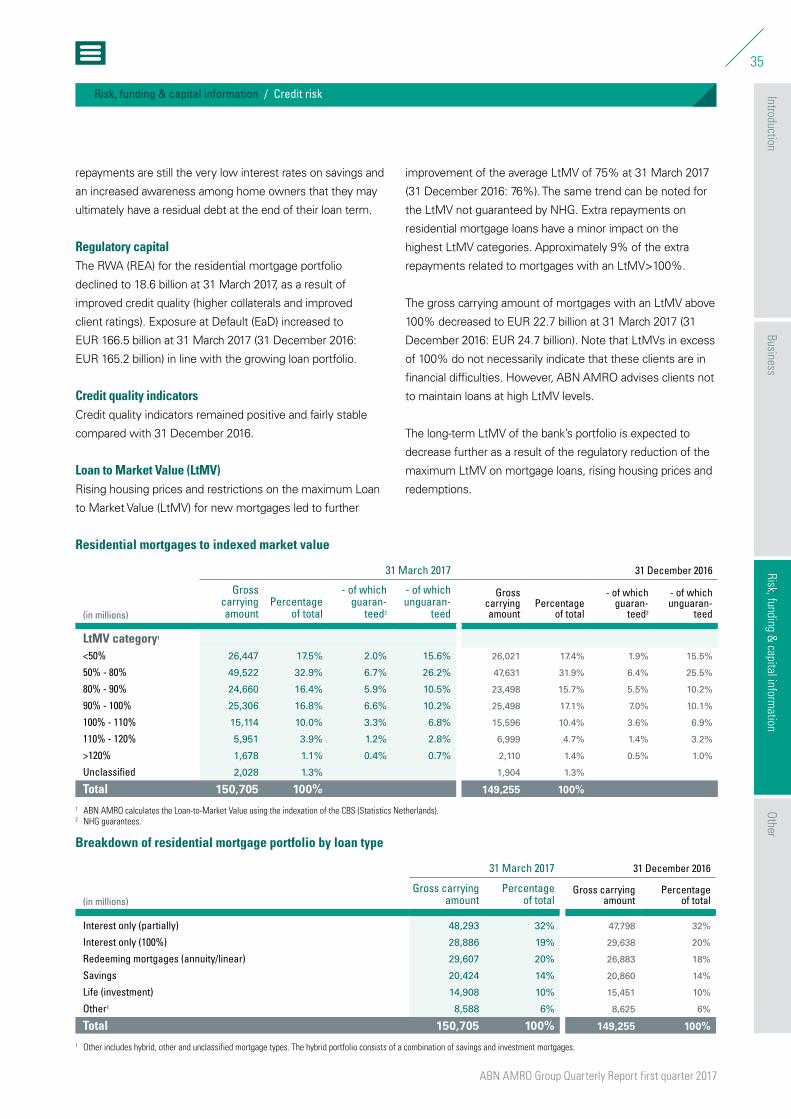
ABN AMRO Group Quarterly Report first quarter 2017
35
IntroductionBusiness
OtherRisk, funding &
capital information
Risk, funding & capital information / Credit risk
repayments are still the very low interest rates on savings and
an increased awareness among home owners that they may
ultimately have a residual debt at the end of their loan term.
Regulatory capitalThe RWA (REA) for the residential mortgage portfolio
declined to 18.6 billion at 31 March 2017, as a result of
improved credit quality (higher collaterals and improved
client ratings). Exposure at Default (EaD) increased to
EUR 166.5 billion at 31 March 2017 (31 December 2016:
EUR 165.2 billion) in line with the growing loan portfolio.
Credit quality indicatorsCredit quality indicators remained positive and fairly stable
compared with 31 December 2016.
Loan to Market Value (LtMV)Rising housing prices and restrictions on the maximum Loan
to Market Value (LtMV) for new mortgages led to further
improvement of the average LtMV of 75% at 31 March 2017
(31 December 2016: 76%). The same trend can be noted for
the LtMV not guaranteed by NHG. Extra repayments on
residential mortgage loans have a minor impact on the
highest LtMV categories. Approximately 9% of the extra
repayments related to mortgages with an LtMV>100%.
The gross carrying amount of mortgages with an LtMV above
100% decreased to EUR 22.7 billion at 31 March 2017 (31
December 2016: EUR 24.7 billion). Note that LtMVs in excess
of 100% do not necessarily indicate that these clients are in
financial difficulties. However, ABN AMRO advises clients not
to maintain loans at high LtMV levels.
The long-term LtMV of the bank’s portfolio is expected to
de crease further as a result of the regulatory reduction of the
maximum LtMV on mortgage loans, rising housing prices and
redemptions.
Residential mortgages to indexed market value
31 March 2017 31 December 2016
(in millions)
Gross carrying amount
Percentage of total
- of which guaran -
teed2
- of which unguaran-
teed
Gross carrying amount
Percentage of total
- of which guaran-
teed2
- of which unguaran-
teed
LtMV category1
<50% 26,447 17.5% 2.0% 15.6% 26,021 17.4% 1.9% 15.5%
50% - 80% 49,522 32.9% 6.7% 26.2% 47,631 31.9% 6.4% 25.5%
80% - 90% 24,660 16.4% 5.9% 10.5% 23,498 15.7% 5.5% 10.2%
90% - 100% 25,306 16.8% 6.6% 10.2% 25,498 17.1% 7.0% 10.1%
100% - 110% 15,114 10.0% 3.3% 6.8% 15,596 10.4% 3.6% 6.9%
110% - 120% 5,951 3.9% 1.2% 2.8% 6,999 4.7% 1.4% 3.2%
>120% 1,678 1.1% 0.4% 0.7% 2,110 1.4% 0.5% 1.0%
Unclassified 2,028 1.3% 1,904 1.3%
Total 150,705 100% 149,255 100%
1 ABN AMRO calculates the Loan-to-Market Value using the indexation of the CBS (Statistics Netherlands).2 NHG guarantees.
Breakdown of residential mortgage portfolio by loan type
31 March 2017 31 December 2016
(in millions)Gross carrying
amountPercentage
of totalGross carrying
amountPercentage
of total
Interest only (partially) 48,293 32% 47,798 32%
Interest only (100%) 28,886 19% 29,638 20%
Redeeming mortgages (annuity/linear) 29,607 20% 26,883 18%
Savings 20,424 14% 20,860 14%
Life (investment) 14,908 10% 15,451 10%
Other1 8,588 6% 8,625 6%
Total 150,705 100% 149,255 100%
1 Other includes hybrid, other and unclassified mortgage types. The hybrid portfolio consists of a combination of savings and investment mortgages.
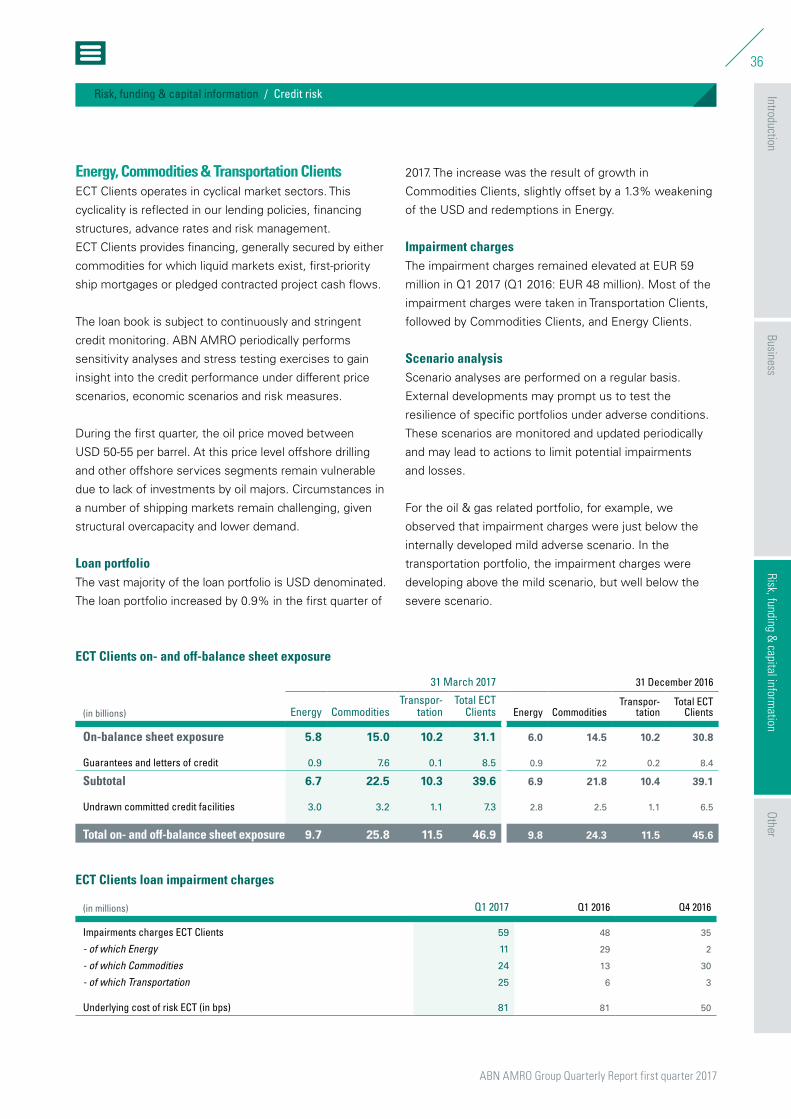
ABN AMRO Group Quarterly Report first quarter 2017
36
IntroductionBusiness
OtherRisk, funding &
capital information
Risk, funding & capital information / Credit risk
Energy, Commodities & Transportation ClientsECT Clients operates in cyclical market sectors. This
cyclicality is reflected in our lending policies, financing
structures, advance rates and risk management.
ECT Clients provides financing, generally secured by either
commodities for which liquid markets exist, first-priority
ship mortgages or pledged contracted project cash flows.
The loan book is subject to continuously and stringent
credit monitoring. ABN AMRO periodically performs
sensitivity analyses and stress testing exercises to gain
insight into the credit performance under different price
scenarios, economic scenarios and risk measures.
During the first quarter, the oil price moved between
USD 50-55 per barrel. At this price level offshore drilling
and other offshore services segments remain vulnerable
due to lack of investments by oil majors. Circumstances in
a number of shipping markets remain challenging, given
structural overcapacity and lower demand.
Loan portfolioThe vast majority of the loan portfolio is USD denominated.
The loan portfolio increased by 0.9% in the first quarter of
2017. The increase was the result of growth in
Commodities Clients, slightly offset by a 1.3% weakening
of the USD and redemptions in Energy.
Impairment chargesThe impairment charges remained elevated at EUR 59
million in Q1 2017 (Q1 2016: EUR 48 million). Most of the
impairment charges were taken in Transportation Clients,
followed by Commodities Clients, and Energy Clients.
Scenario analysisScenario analyses are performed on a regular basis.
External developments may prompt us to test the
resilience of specific portfolios under adverse conditions.
These scenarios are monitored and updated periodically
and may lead to actions to limit potential impairments
and losses.
For the oil & gas related portfolio, for example, we
observed that impairment charges were just below the
internally developed mild adverse scenario. In the
transportation portfolio, the impairment charges were
developing above the mild scenario, but well below the
severe scenario.
ECT Clients on- and off-balance sheet exposure
31 March 2017 31 December 2016
(in billions) Energy CommoditiesTranspor-
tationTotal ECT
Clients Energy CommoditiesTranspor-
tationTotal ECT
Clients
On-balance sheet exposure 5.8 15.0 10.2 31.1 6.0 14.5 10.2 30.8
Guarantees and letters of credit 0.9 7.6 0.1 8.5 0.9 7.2 0.2 8.4
Subtotal 6.7 22.5 10.3 39.6 6.9 21.8 10.4 39.1
Undrawn committed credit facilities 3.0 3.2 1.1 7.3 2.8 2.5 1.1 6.5
Total on- and off-balance sheet exposure 9.7 25.8 11.5 46.9 9.8 24.3 11.5 45.6
ECT Clients loan impairment charges
(in millions) Q1 2017 Q1 2016 Q4 2016
Impairments charges ECT Clients 59 48 35
- of which Energy 11 29 2
- of which Commodities 24 13 30
- of which Transportation 25 6 3
Underlying cost of risk ECT (in bps) 81 81 50
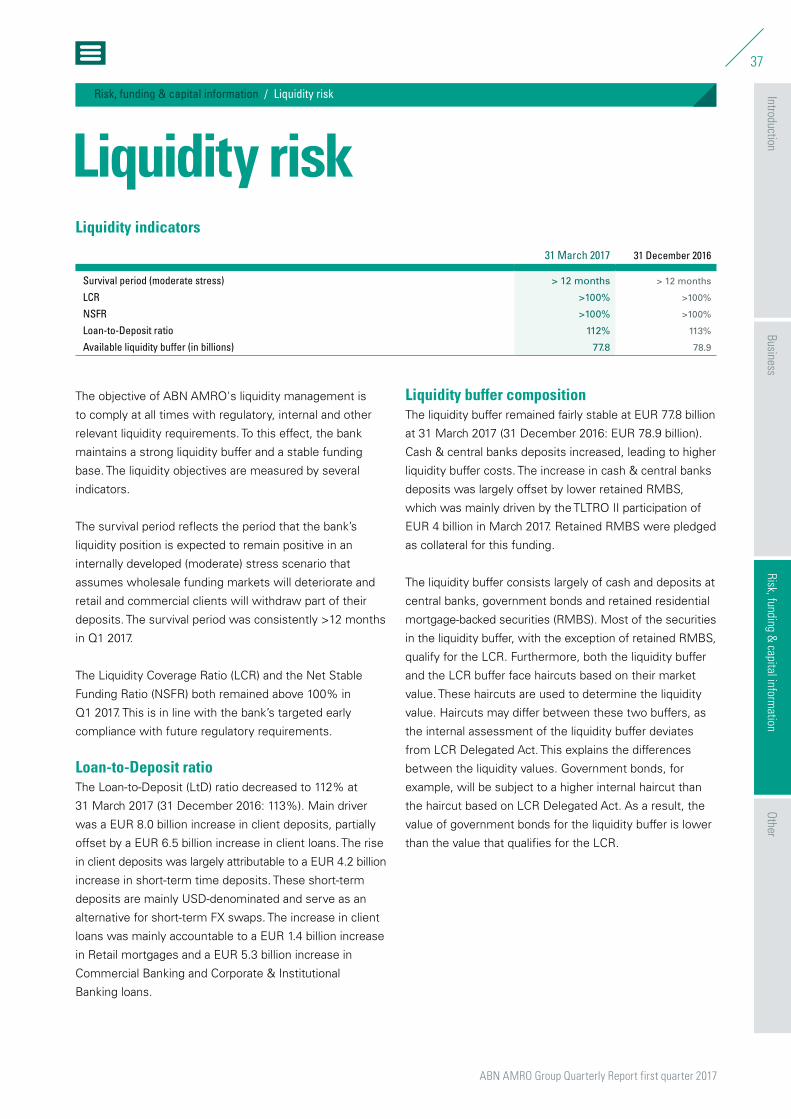
ABN AMRO Group Quarterly Report first quarter 2017
37
IntroductionBusiness
OtherRisk, funding &
capital information
Risk, funding & capital information / Liquidity risk
Liquidity riskLiquidity indicators
31 March 2017 31 December 2016
Survival period (moderate stress) > 12 months > 12 months
LCR >100% >100%
NSFR >100% >100%
Loan-to-Deposit ratio 112% 113%
Available liquidity buffer (in billions) 77.8 78.9
The objective of ABN AMRO's liquidity management is
to comply at all times with regulatory, internal and other
relevant liquidity requirements. To this effect, the bank
maintains a strong liquidity buffer and a stable funding
base. The liquidity objectives are measured by several
indicators.
The survival period reflects the period that the bank’s
liquidity position is expected to remain positive in an
internally developed (moderate) stress scenario that
assumes wholesale funding markets will deteriorate and
retail and commercial clients will withdraw part of their
deposits. The survival period was consistently >12 months
in Q1 2017.
The Liquidity Coverage Ratio (LCR) and the Net Stable
Funding Ratio (NSFR) both remained above 100% in
Q1 2017. This is in line with the bank’s targeted early
compliance with future regulatory requirements.
Loan-to-Deposit ratioThe Loan-to-Deposit (LtD) ratio decreased to 112% at
31 March 2017 (31 December 2016: 113%). Main driver
was a EUR 8.0 billion increase in client deposits, partially
offset by a EUR 6.5 billion increase in client loans. The rise
in client deposits was largely attributable to a EUR 4.2 billion
increase in short-term time deposits. These short-term
deposits are mainly USD-denominated and serve as an
alternative for short-term FX swaps. The increase in client
loans was mainly accountable to a EUR 1.4 billion increase
in Retail mortgages and a EUR 5.3 billion increase in
Commercial Banking and Corporate & Institutional
Banking loans.
Liquidity buffer compositionThe liquidity buffer remained fairly stable at EUR 77.8 billion
at 31 March 2017 (31 December 2016: EUR 78.9 billion).
Cash & central banks deposits increased, leading to higher
liquidity buffer costs. The increase in cash & central banks
deposits was largely offset by lower retained RMBS,
which was mainly driven by the TLTRO II participation of
EUR 4 billion in March 2017. Retained RMBS were pledged
as collateral for this funding .
The liquidity buffer consists largely of cash and deposits at
central banks, government bonds and retained residential
mortgage-backed securities (RMBS). Most of the securities
in the liquidity buffer, with the exception of retained RMBS,
qualify for the LCR. Furthermore, both the liquidity buffer
and the LCR buffer face haircuts based on their market
value. These haircuts are used to determine the liquidity
value. Haircuts may differ between these two buffers, as
the internal assessment of the liquidity buffer deviates
from LCR Delegated Act. This explains the differences
between the liquidity values. Government bonds, for
example, will be subject to a higher internal haircut than
the haircut based on LCR Delegated Act. As a result, the
value of government bonds for the liquidity buffer is lower
than the value that qualifies for the LCR.
Liquidity risk Liquidity risk (Engels)
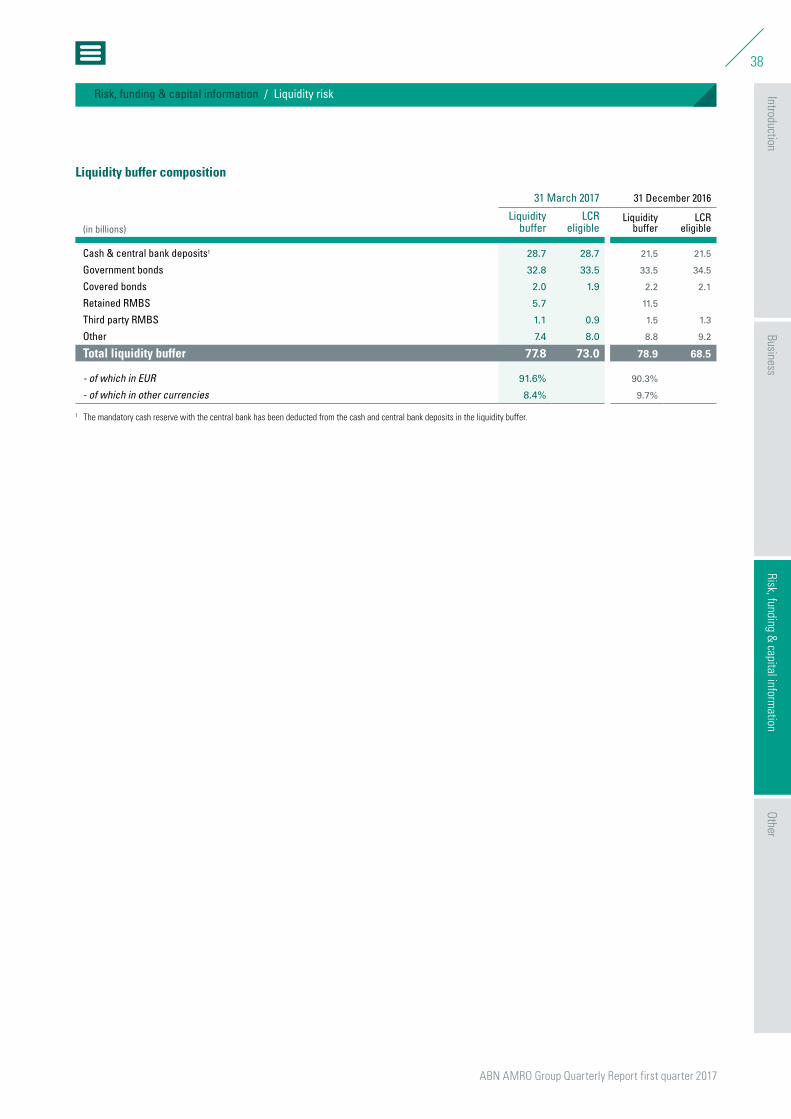
ABN AMRO Group Quarterly Report first quarter 2017
38
IntroductionBusiness
OtherRisk, funding &
capital information
Risk, funding & capital information / Liquidity risk
Liquidity buffer composition
31 March 2017 31 December 2016
(in billions)Liquidity
bufferLCR
eligibleLiquidity
bufferLCR
eligible
Cash & central bank deposits1 28.7 28.7 21.5 21.5
Government bonds 32.8 33.5 33.5 34.5
Covered bonds 2.0 1.9 2.2 2.1
Retained RMBS 5.7 11.5
Third party RMBS 1.1 0.9 1.5 1.3
Other 7.4 8.0 8.8 9.2
Total liquidity buffer 77.8 73.0 78.9 68.5
- of which in EUR 91.6% 90.3%
- of which in other currencies 8.4% 9.7%
1 The mandatory cash reserve with the central bank has been deducted from the cash and central bank deposits in the liquidity buffer.
ABN AMRO Group Quarterly Report first quarter 2017
39
IntroductionBusiness
OtherRisk, funding &
capital information
Risk, funding & capital information / Funding
ABN AMRO's funding strategy aims to optimise and
diversify the bank's funding sources. This strategy leads
to a diverse, stable and cost-efficient funding base. Client
deposits constitute ABN AMRO’s main source of funding.
This is complemented by a well-diversified portfolio of
wholesale funding.
Client deposits increased to EUR 236.0 billion at
31 March 2016 (31 December 2016: EUR 228.0 billion).
Total wholesale funding (defined as issued debt plus
subordinated liabilities) remained stable at EUR 92.6 billion
at 31 March 2017 (31 December 2016: EUR 92.5 billion).
Other long-term funding increased by EUR 4.0 billion, due
to participation in TLTRO II. ABN AMRO's total TLTRO II
participation is EUR 8 billion.
Long-term funding raisedLong-term funding raised in Q1 2017 amounted to
EUR 10.3 billion. The main drivers of the amount raised
were funds needed in relation to maturing funding and
TLTRO II participation. Long-term funding raised included
EUR 3.1 billion of covered bonds, EUR 1.4 billion of Tier 2
capital instruments, EUR 1.9 billion of senior unsecured
funding, and EUR 4.0 billion TLTRO II.
Unsecured funding issued in Q1 2017 is mainly USD-
denominated and supports Commercial Banking and
Corporate & Institutional Banking growth plans. Covered
bond issuance is in line with the growing volume of
mortgages with long-term fixed interest rate periods.
Long-term covered bonds mitigate liquidity repricing risk
resulting from mortgages with long-term fixed interest
rate periods. The average maturity of covered bonds
issued in Q1 2017 is 17 years.
The instruments issued are included in the funding
overview below. More information on capital instruments is
provided in the Capital management section of this report.
Overview of funding typesA key goal of the funding strategy is to diversify funding
sources. Our funding programmes allow us to issue
various instruments in different currencies and markets,
enabling us to diversify our investor base. A description of
capital and funding instruments issued by ABN AMRO is
provided on our website, abnamro.com/ir. We continuously
assess our wholesale funding base in order to optimise
the use of funding sources.
Funding
Funding Funding (Engels)
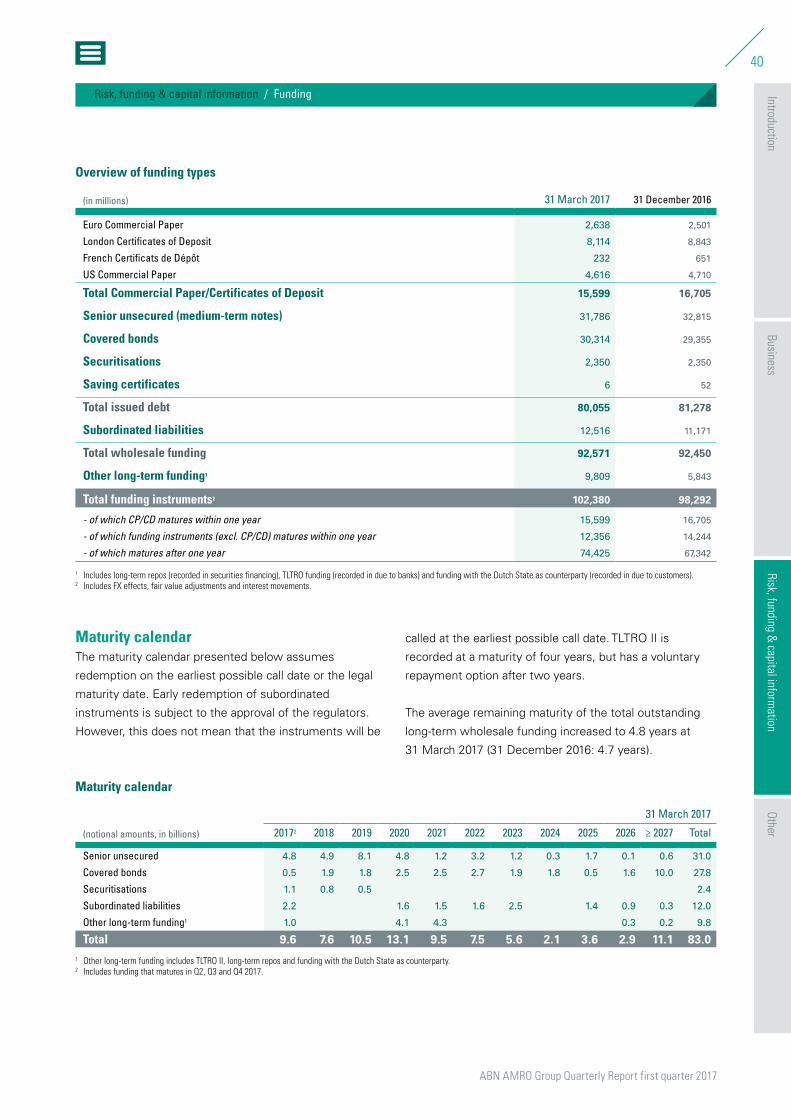
ABN AMRO Group Quarterly Report first quarter 2017
40
IntroductionBusiness
OtherRisk, funding &
capital information
Risk, funding & capital information / Funding
Overview of funding types
(in millions) 31 March 2017 31 December 2016
Euro Commercial Paper 2,638 2,501
London Certificates of Deposit 8,114 8,843
French Certificats de Dépôt 232 651
US Commercial Paper 4,616 4,710
Total Commercial Paper/Certificates of Deposit 15,599 16,705
Senior unsecured (medium-term notes) 31,786 32,815
Covered bonds 30,314 29,355
Securitisations 2,350 2,350
Saving certificates 6 52
Total issued debt 80,055 81,278
Subordinated liabilities 12,516 11,171
Total wholesale funding 92,571 92,450
Other long-term funding1 9,809 5,843
Total funding instruments2 102,380 98,292
- of which CP/CD matures within one year 15,599 16,705
- of which funding instruments (excl. CP/CD) matures within one year 12,356 14,244
- of which matures after one year 74,425 67,342
1 Includes long-term repos (recorded in securities financing), TLTRO funding (recorded in due to banks) and funding with the Dutch State as counterparty (recorded in due to customers).2 Includes FX effects, fair value adjustments and interest movements.
Maturity calendarThe maturity calendar presented below assumes
redemption on the earliest possible call date or the legal
maturity date. Early redemption of subordinated
instruments is subject to the approval of the regulators.
However, this does not mean that the instruments will be
called at the earliest possible call date. TLTRO II is
recorded at a maturity of four years, but has a voluntary
repayment option after two years.
The average remaining maturity of the total outstanding
long-term wholesale funding increased to 4.8 years at
31 March 2017 (31 December 2016: 4.7 years).
Maturity calendar
31 March 2017
(notional amounts, in billions) 20172 2018 2019 2020 2021 2022 2023 2024 2025 2026 ≥ 2027 Total
Senior unsecured 4.8 4.9 8.1 4.8 1.2 3.2 1.2 0.3 1.7 0.1 0.6 31.0
Covered bonds 0.5 1.9 1.8 2.5 2.5 2.7 1.9 1.8 0.5 1.6 10.0 27.8
Securitisations 1.1 0.8 0.5 2.4
Subordinated liabilities 2.2 1.6 1.5 1.6 2.5 1.4 0.9 0.3 12.0
Other long-term funding1 1.0 4.1 4.3 0.3 0.2 9.8
Total 9.6 7.6 10.5 13.1 9.5 7.5 5.6 2.1 3.6 2.9 11.1 83.01 Other long-term funding includes TLTRO II, long-term repos and funding with the Dutch State as counterparty.2 Includes funding that matures in Q2, Q3 and Q4 2017.
ABN AMRO Group Quarterly Report first quarter 2017
41
IntroductionBusiness
OtherRisk, funding &
capital information
Risk, funding & capital information / Capital management
ABN AMRO's solid capital position ensures that the bank
is compliant with the fully-loaded capital requirements
of the Capital Requirements Directive IV (CRD IV) and
Capital Requirements Regulation (CRR). The overall capital
base increased during Q1 2017 due to accumulated profit
and a Tier 2 issuance. The bank strives to optimise its
capital structure in anticipation of pending regulatory
requirements. The capital structure consists mainly of
common equity and loss-absorbing capital to cover
unexpected losses. The subordination of the loss-
absorbing capital instruments provides further protection
to senior creditors.
Developments impacting capital ratiosAt 31 March 2017, the fully-loaded Common Equity Tier 1
(CET1), Tier 1 and Total Capital ratios were 16.9%, 17.8%
and 24.1% respectively. All capital ratios were well above
regulatory minimum requirements and in line with the
bank's risk appetite and strategic ambitions.
ABN AMRO's CET1 ratio and Tier 1 ratio decreased slightly
during Q1 2017, as a result of higher RWA (REA) partly
offset by profit accumulation. ABN AMRO’s Total Capital
ratio increased due to issuance of a Tier 2 USD 1.5 billion
callable instrument in March. This further strengthened
the buffer of loss-absorbing instruments and was done in
anticipation of the announcement to call two disqualified
Tier 2 instruments in full on their prevailing call dates.
The group level RWA (REA) increased to EUR 106.7 billion
at 31 March 2017 (31 December 2016: EUR 104.2 billion).
More information on RWA (REA) is provided in the Key
Developments section of this report.
In 2017, ABN AMRO will be required to meet a minimum
CET1 ratio of 9.0% on a consolidated basis, excluding
a counter-cyclical buffer, but including a 1.25% capital
conservation buffer and a 1.5% systemic risk buffer (SRB).
ABN AMRO is comfortably above the 9.0% minimum,
with a fully-loaded CET1 ratio amounting to 16.9% at
31 March 2017.
The Maximum Distributable Amount (MDA) trigger level
for ABN AMRO Bank N.V. is 9.0% CET1 capital, to be
increased by any Additional Tier 1 (AT1) or Tier 2 capital
shortfall. At 31 March 2017, the AT1 shortfall was 0.6%,
implying an MDA trigger level of 9.6%. Based on full
phase-in of the SRB (from 1.5% in 2017 to 3.0% in 2019)
and the capital conservation buffer (from 1.25% in 2017
to 2.5% in 2019), the fully-loaded MDA trigger level
is expected to increase to 11.75% in 2019, excluding
a counter-cyclical buffer and assuming there is no AT1
or Tier 2 capital shortfall.
ABN AMRO expects its future CET1 capital target to reach
13.5%, which is at the upper end of the current 11.5-13.5%
CET1 target range. This expectation is based on the SREP
requirement, the fully-loaded SRB and capital conservation
buffer, Pillar 2 capital guidance and the management buffer.
It excludes possible implications and consequences of
revisions to the calculation of risk-weighted assets (Basel IV).
Given this uncertainty, ABN AMRO continues to hold
a buffer above the current CET1 target range.
DividendOver the full year of 2017, ABN AMRO intends to pay a
dividend of 50% of the reported net profit after deduction
of AT1 coupon payments. An overview of ABN AMRO’s
dividend policy is provided on our website, abnamro.com/ir.
Capital management
Capital management Capital management (Engels)
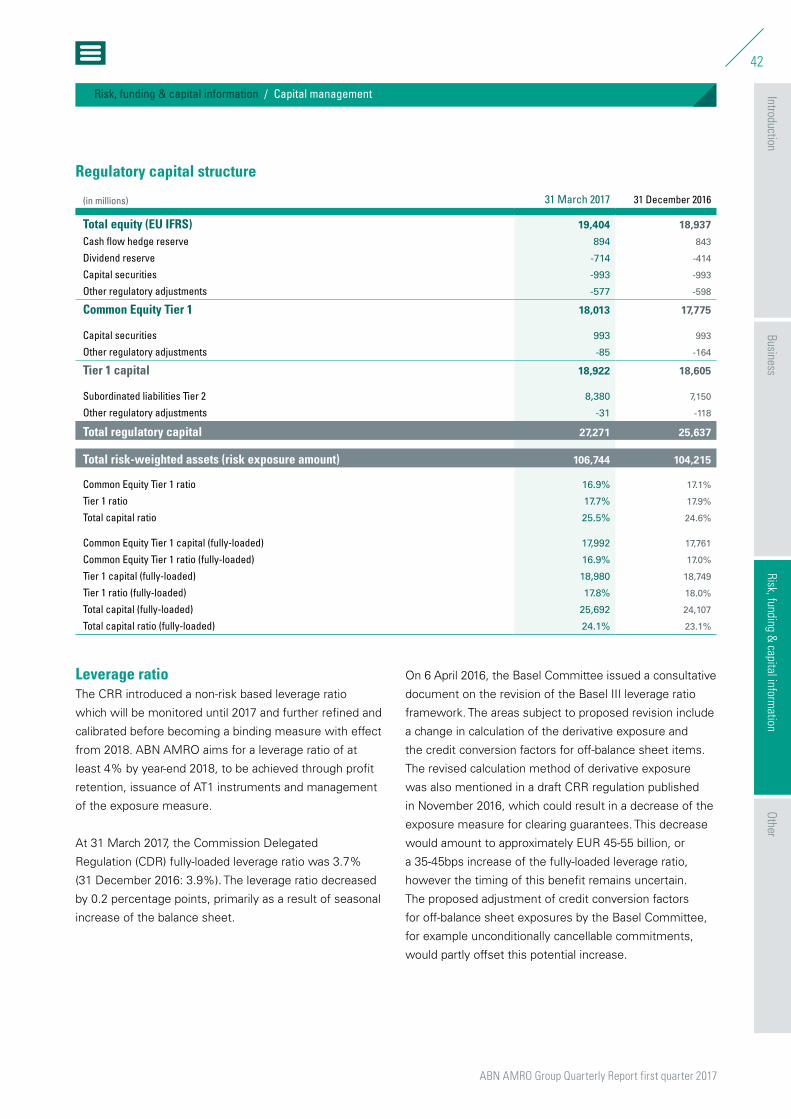
ABN AMRO Group Quarterly Report first quarter 2017
42
IntroductionBusiness
OtherRisk, funding &
capital information
Risk, funding & capital information / Capital management
Regulatory capital structure
(in millions) 31 March 2017 31 December 2016
Total equity (EU IFRS) 19,404 18,937
Cash flow hedge reserve 894 843
Dividend reserve -714 -414
Capital securities -993 -993
Other regulatory adjustments -577 -598
Common Equity Tier 1 18,013 17,775
Capital securities 993 993
Other regulatory adjustments -85 -164
Tier 1 capital 18,922 18,605
Subordinated liabilities Tier 2 8,380 7,150
Other regulatory adjustments -31 -118
Total regulatory capital 27,271 25,637
Total risk-weighted assets (risk exposure amount) 106,744 104,215
Common Equity Tier 1 ratio 16.9% 17.1%
Tier 1 ratio 17.7% 17.9%
Total capital ratio 25.5% 24.6%
Common Equity Tier 1 capital (fully-loaded) 17,992 17,761
Common Equity Tier 1 ratio (fully-loaded) 16.9% 17.0%
Tier 1 capital (fully-loaded) 18,980 18,749
Tier 1 ratio (fully-loaded) 17.8% 18.0%
Total capital (fully-loaded) 25,692 24,107
Total capital ratio (fully-loaded) 24.1% 23.1%
Leverage ratioThe CRR introduced a non-risk based leverage ratio
which will be monitored until 2017 and further refined and
calibrated before becoming a binding measure with effect
from 2018. ABN AMRO aims for a leverage ratio of at
least 4% by year-end 2018, to be achieved through profit
retention, issuance of AT1 instruments and management
of the exposure measure.
At 31 March 2017, the Commission Delegated
Regulation (CDR) fully-loaded leverage ratio was 3.7%
(31 December 2016: 3.9%). The leverage ratio decreased
by 0.2 percentage points, primarily as a result of seasonal
increase of the balance sheet.
On 6 April 2016, the Basel Committee issued a consultative
document on the revision of the Basel III leverage ratio
framework. The areas subject to proposed revision include
a change in calculation of the derivative exposure and
the credit conversion factors for off-balance sheet items.
The revised calculation method of derivative exposure
was also mentioned in a draft CRR regulation published
in November 2016, which could result in a decrease of the
exposure measure for clearing guarantees. This decrease
would amount to approximately EUR 45-55 billion, or
a 35-45bps increase of the fully-loaded leverage ratio,
however the timing of this benefit remains uncertain.
The proposed adjustment of credit conversion factors
for off-balance sheet exposures by the Basel Committee,
for example unconditionally cancellable commitments,
would partly offset this potential increase.
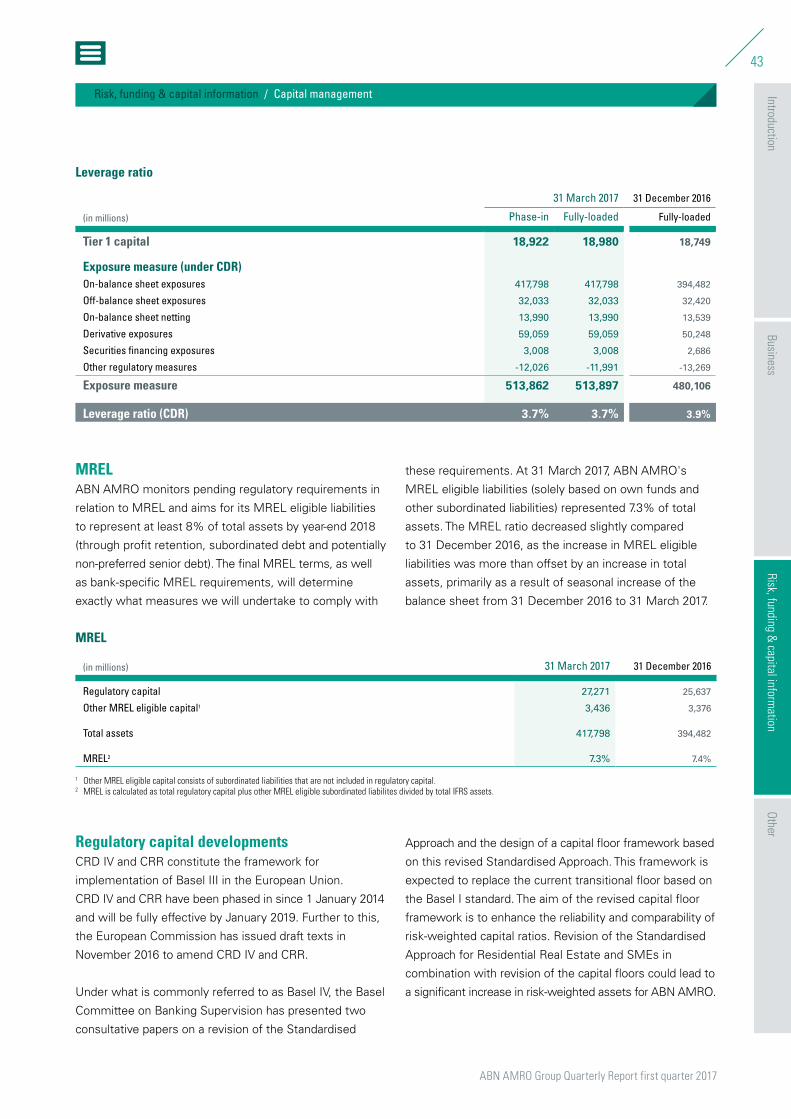
ABN AMRO Group Quarterly Report first quarter 2017
43
IntroductionBusiness
OtherRisk, funding &
capital information
Risk, funding & capital information / Capital management
Leverage ratio
31 March 2017 31 December 2016
(in millions) Phase-in Fully-loaded Fully-loaded
Tier 1 capital 18,922 18,980 18,749
Exposure measure (under CDR)On-balance sheet exposures 417,798 417,798 394,482
Off-balance sheet exposures 32,033 32,033 32,420
On-balance sheet netting 13,990 13,990 13,539
Derivative exposures 59,059 59,059 50,248
Securities financing exposures 3,008 3,008 2,686
Other regulatory measures -12,026 -11,991 -13,269
Exposure measure 513,862 513,897 480,106
Leverage ratio (CDR) 3.7% 3.7% 3.9%
MRELABN AMRO monitors pending regulatory requirements in
relation to MREL and aims for its MREL eligible liabilities
to represent at least 8% of total assets by year-end 2018
(through profit retention, subordinated debt and potentially
non-preferred senior debt). The final MREL terms, as well
as bank-specific MREL requirements, will determine
exactly what measures we will undertake to comply with
these requirements. At 31 March 2017, ABN AMRO's
MREL eligible liabilities (solely based on own funds and
other subordinated liabilities) represented 7.3% of total
assets. The MREL ratio decreased slightly compared
to 31 December 2016, as the increase in MREL eligible
liabilities was more than offset by an increase in total
assets, primarily as a result of seasonal increase of the
balance sheet from 31 December 2016 to 31 March 2017.
MREL
(in millions) 31 March 2017 31 December 2016
Regulatory capital 27,271 25,637
Other MREL eligible capital1 3,436 3,376
Total assets 417,798 394,482
MREL2 7.3% 7.4%
1 Other MREL eligible capital consists of subordinated liabilities that are not included in regulatory capital.2 MREL is calculated as total regulatory capital plus other MREL eligible subordinated liabilites divided by total IFRS assets.
Regulatory capital developmentsCRD IV and CRR constitute the framework for
implementation of Basel III in the European Union.
CRD IV and CRR have been phased in since 1 January 2014
and will be fully effective by January 2019. Further to this,
the European Commission has issued draft texts in
November 2016 to amend CRD IV and CRR.
Under what is commonly referred to as Basel IV, the Basel
Committee on Banking Supervision has presented two
consultative papers on a revision of the Standardised
Approach and the design of a capital floor framework based
on this revised Standardised Approach. This framework is
expected to replace the current transitional floor based on
the Basel I standard. The aim of the revised capital floor
framework is to enhance the reliability and comparability of
risk-weighted capital ratios. Revision of the Standardised
Approach for Residential Real Estate and SMEs in
combination with revision of the capital floors could lead to
a significant increase in risk-weighted assets for ABN AMRO.
ABN AMRO Group Quarterly Report first quarter 2017
44
IntroductionBusiness
OtherRisk, funding &
capital information
Risk, funding & capital information / Capital management
Regulatory developments, such as the Basel proposal
(especially with respect to risk-weighting of mortgages and
corporate loans) and increasingly strict capital requirements
set by the regulators, could have a significant impact
on the bank's capital position going forward. Hence,
ABN AMRO will continue to focus on capital efficiency
and will further strengthen its capital position.
45
IntroductionBusiness
Risk, funding & capital inform
ationOther
Other
46
Notes to the reader
47
Enquiries
Other
ABN AMRO Group Quarterly Report first quarter 2017
46
Introduction
IntroductionBusiness
Risk, funding & capital inform
ation
Other / Notes to the reader
Other
Notes to the readerIntroductionThis Quarterly Report presents ABN AMRO's results
for the first quarter of 2017. The report provides an update
of ABN AMRO's share performance, an economic update,
a quarterly business and financial review, and selected
quarterly risk, funding and capital disclosures.
Presentation of informationThe financial information contained in this Quarterly Report
has been prepared according to the same accounting
policies and methods of computation as our most recent
financial statements, which were prepared in accordance
with EU IFRS. The figures in this document have not been
audited or reviewed by our external auditor. Moreover, to
provide a better understanding of the underlying results,
ABN AMRO has adjusted its reported results for defined
special items.
This report is presented in euros (EUR), which is
ABN AMRO's presentation currency, rounded to the
nearest million (unless otherwise stated). All annual
averages in this report are based on month-end figures.
Management does not believe that these month-end
averages present trends that are materially different
from those that would be presented by daily averages.
Certain figures in this report may not tally exactly due
to rounding. Furthermore, certain percentages in this
document have been calculated using rounded figures.
As a result of an IFRIC rejection notice of 6 April 2016,
ABN AMRO adjusted its accounting policies for offsetting
per Q2 2016. The bank offsets balances if it is legally
entitled to set off the recognised amounts and intends to
settle on a net basis, or realise the asset and settle the
liability simultaneously. The IFRIC rejection notice provides
additional offsetting guidance for cash pooling agreements.
The adjusted offsetting policy is applied consistently to
all assets and liabilities, if applicable. In addition to the
offsetting changes on notional cash pooling, ABN AMRO
concluded that offsetting would no longer be applied to
bank savings mortgages. To ensure a correct historical
interpretation of the bank’s performance, the comparative
figures in the Figures at a glance, as well as the net interest
margin (NIM) and cost of risk (CoR) in the Financial review
section, are presented excluding the impact of these
adjustments and therefore remain in line with previously
disclosed figures.
For a download of this report or more information,
please visit us at abnamro.com/ir or contact us at
[email protected]. In addition to this
report, ABN AMRO provides an analyst and investor
call presentation, an investor presentation and a
factsheet on the Q1 2017 results.
Notes to the reader Notes to the reader (Engels)
ABN AMRO Group Quarterly Report first quarter 2017
47
IntroductionBusiness
Risk, funding & capital inform
ation
Other / Enquiries
Other
EnquiriesABN AMRO Investor [email protected]
+31 20 6282 282
Investor callA conference call will be hosted by the Executive Board
for analysts and investors on Wednesday 17 May 2017
at 11:00 am CET (10:00 GMT).
To participate in the conference call, we strongly advise
analysts and investors to pre-register for the call using
the information provided on the ABN AMRO Investor
Relations website.
More information can be found on our website
abnamro.com/ir.
ABN AMRO Press [email protected]
+31 20 6288 900
ABN AMRO Group N.V.Gustav Mahlerlaan 10, 1082 PP Amsterdam
P.O. Box 283, 1000 EA Amsterdam
The Netherlands
abnamro.com
Information on our website does not form part of this
Quarterly Report, unless expressly stated otherwise.
Disclaimer & cautionary statementsABN AMRO has included in this document, and from
time to time may make certain statements in its public
statements that may constitute "forward-looking
statements". This includes, without limitation, such
statements that include the words "expect", "estimate",
"project", "anticipate", "should", "intend", "plan", "probability",
"risk", "Value-at-Risk ("VaR")", "target", "goal", "objective", "will",
"endeavour", "outlook", "optimistic", "prospects" and similar
expressions or variations on such expressions. In particular,
the document may include forward-looking statements
relating but not limited to ABN AMRO's potential exposures
to various types of operational, credit and market risk.
Such statements are subject to uncertainties.
Forward-looking statements are not historical facts and
represent only ABN AMRO's current views and assumptions
on future events, many of which, by their nature, are
inherently uncertain and beyond our control. Factors that
could cause actual results to differ materially from those
anticipated by forward-looking statements include, but
are not limited to, (macro)-economic, demographic and
political conditions and risks, actions taken and policies
applied by governments and their agencies, financial
regulators and private organisations (including credit rating
agencies), market conditions and turbulence in financial
and other markets, and the success of ABN AMRO
in managing the risks involved in the foregoing.
Any forward-looking statements made by ABN AMRO
are current views as at the date they are made. Subject
to statutory obligations, ABN AMRO does not intend
to publicly update or revise forward-looking statements
to reflect events or circumstances after the date the
statements were made, and ABN AMRO assumes
no obligation to do so.
Enquiries Enquiries (Engels)