Embed Size (px)
Citation preview

June 2015
Abortion Statistics, England and Wales: 2014 Summary information from the abortion notification forms returned to the Chief Medical Officers of England and Wales.

2
You may re-use the text of this document (not including logos) free of charge in any format or medium, under the terms of the Open Government Licence. To view this licence, visit www.nationalarchives.gov.uk/doc/open-government-licence/
© Crown copyright
Published to gov.uk, in PDF format only.
www.gov.uk/dh

3
Contents
Executive Summary ...................................................................................................... 5
Introduction ................................................................................................................... 6
Commentary ............................................................................................................... 10
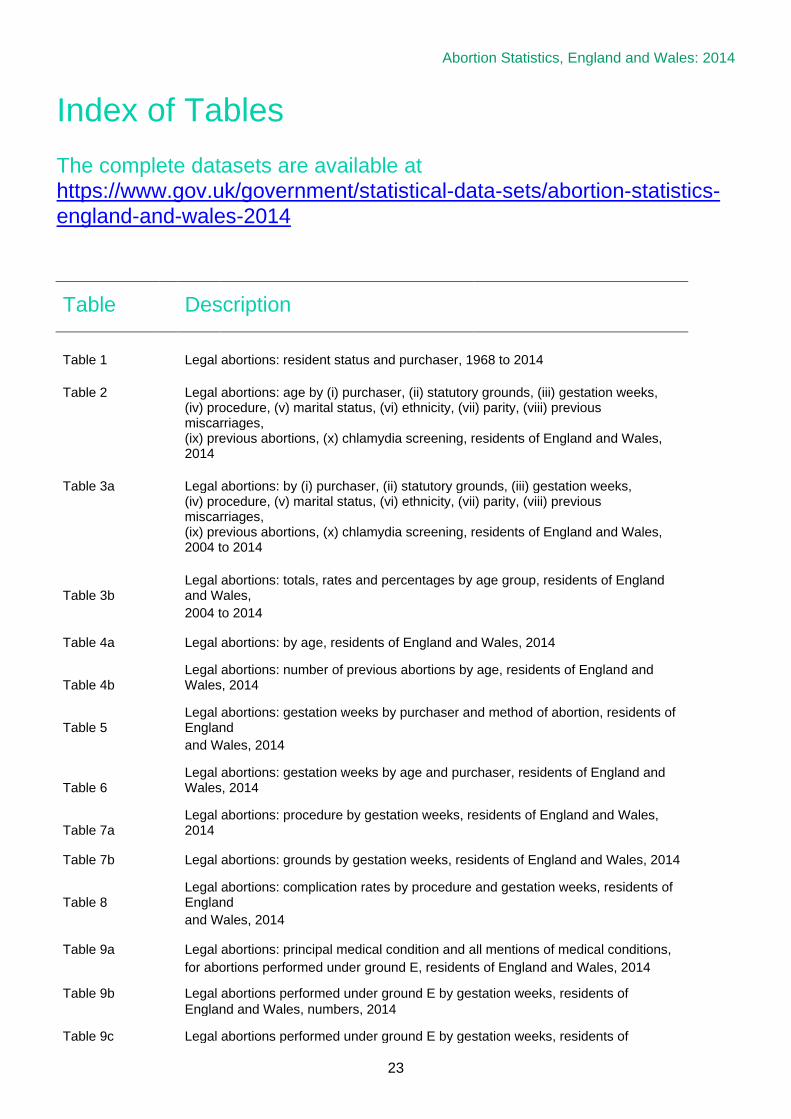
Index to tables ............................................................................................................. 23
Annex A: Data quality and methods ................................................................................ i
Annex B: Further information …………………………………………………………………vi

4

Abortion Statistics, England and Wales: 2014
5
Executive summary This report presents statistics on abortions carried out in England and Wales in 2014. For women resident in England and Wales, 2014: Total number • The total number of abortions was 184,571. This was 0.4% less than in 2013 (185,311) and
0.6% less than in 2004 (185,713).
Abortion rates • The age-standardised abortion rate was 15.9 per 1,000 resident women aged 15-44. This is
0.2% lower than in 2013 and 6.4% lower than in 2004 (17.1); the lowest rate for 16 years. • The abortion rate was highest for women aged 22 (at 28 per 1,000). The highest rate in
2013 was also for women aged 22 (at 30 per 1,000). • The under-16 abortion rate was 2.5 per 1,000 women and the under-18 rate was 11.1 per
1,000 women. Both lower than in 2013 (2.6 and 11.7 per 1,000 women respectively) and in the year 2004 (3.7 and 17.8 per 1,000 women respectively).
Location and funding of abortions • 98% of abortions were funded by the NHS. Of these, two thirds (67%) took place in the
independent sector under NHS contract, up from 64% in 2013 Gestation • 92% of abortions were carried out at under 13 weeks gestation, 80% were at under 10
weeks compared to 79% in 2013 and 60% in 2004. Method of abortion • Medical abortions accounted for 51% of the total. This was slightly higher than in 2013
(49%), and far higher than in 2004 (20%). This is the first year that there have been more medical procedures than surgical procedures.
Ground E abortions • 3,099 abortions (2%) were carried out under ground E (risk that the child would be born
handicapped). Repeat abortions • 37% of abortions in 2014 were to women who had already had one or more abortions. Non-residents: • In 2014, there were 5,521 abortions for non-residents carried out in hospitals and clinics in
England and Wales (5,469 in 2013). The 2013 total was the lowest in any year since 1969 and the 2014 total is slightly higher than in 2013.

6

7
1. Introduction 1.1 This report presents statistics on abortions carried out in England and Wales in 2014. It is
the thirteenth in an annual series published by the Department of Health (DH), the first of which was for abortions in 2002. These are available on the GOV.UK website1. Statistics for years from 1974 to 2001 were published by the Office for National Statistics (ONS) in their Abortion Statistics Series AB, Nos 1 to 28. The reports for 1991 to 2001 are available electronically on request to [email protected]. Statistics for years from 1968 to 1973 were published in the Registrar General’s Statistical Review of England and Wales, Supplement on Abortion.
The legislative context 1.2 The Abortion Act 1967, as amended by the Human Fertilisation and Embryology Act 1990,
permits termination of a pregnancy by a registered medical practitioner subject to certain conditions. Legal requirements apply to the certification and notification of abortion procedures. Within the terms of the Abortion Act, only a registered practitioner can terminate a pregnancy. The doctor taking responsibility for the procedure is legally required to notify the Chief Medical Officer (CMO) of the abortion within 14 days of the termination, whether carried out in the NHS or an approved independent sector place and whether or not the woman is a UK resident. The Department of Health provides form HSA4 for this purpose. Further details are available on the GOV.UK website: https://www.gov.uk/government/organisations/department-of-health/series/abortion-statistics-for-england-and-wales#statistical-data-sets
1.3 Except in an emergency, any treatment for the termination of pregnancy can only be
carried out in an NHS hospital or in a place approved for the purpose by the Secretary of State. After 24 weeks gestation, the abortion can only be carried out in an NHS hospital. Through contractual arrangements with Clinical Commissioning Groups (CCGs), some approved independent sector places perform NHS-funded abortions.
1.4 A legally induced abortion must be certified by two registered medical practitioners as
justified under one or more of the following grounds:
A the continuance of the pregnancy would involve risk to the life of the pregnant woman greater than if the pregnancy were terminated (Abortion Act, 1967 as amended, section 1(1)(c))
1 http://transparency.dh.gov.uk/category/statistics/abortion
8
B the termination is necessary to prevent grave permanent injury to the physical or mental health of the pregnant woman (section 1(1)(b))
C the pregnancy has not exceeded its twenty-fourth week and that the continuance of the pregnancy would involve risk, greater than if the pregnancy were terminated, of injury to the physical or mental health of the pregnant woman (section 1(1)(a))
D the pregnancy has not exceeded its twenty-fourth week and that the continuance of the pregnancy would involve risk, greater than if the pregnancy were terminated, of injury to the physical or mental health of any existing children of the family of the pregnant woman (section 1(1)(a))
E there is a substantial risk that if the child were born it would suffer from such physical or mental abnormalities as to be seriously handicapped (section 1(1)(d))
or, in an emergency, certified by the operating practitioner as immediately necessary:
F to save the life of the pregnant woman (section 1(4))
G to prevent grave permanent injury to the physical or mental health of the pregnant woman (section 1(4))
How the statistics are produced 1.5 The doctor taking responsibility for an abortion is legally required to notify the Chief
Medical Officer (CMO) within 14 days of the termination. Abortion notification forms (HSA4s) can be submitted online or on paper.
1.6 The Department of Health use a thorough process for inspecting and recording the
information received on the forms in order to monitor compliance with the legislation and the extent to which best practice guidance from the Department of Health is followed. The methods used ensure that good quality accurate statistics can be derived from the data. Annex A contains further information about data quality.
1.7 The format of the tables have been revised in the light of the judgment handed down by
the High Court in the case relating to the release of information on principal medical condition for abortions performed under ground E. A more limited degree of suppression has been applied, where necessary, to avoid the disclosure of personal data. This is in line with the Disclosure Control Protocol for Abortion Statistics which was published in June 2015. (See Annex A xvii for more detail.)

Abortion Statistics, England and Wales: 2014
9
1.8 This publication is a National Statistic. It is a statutory requirement that National Statistics
should be produced in accordance with the standards set out in the Code of Practice for Official Statistics. The UK Statistics Authority assesses all National Statistics for compliance with the Code of Practice. The results of the assessment of abortion statistics were published in February 2012 and are available at: http://www.statisticsauthority.gov.uk/assessment/assessment/assessment-reports/index.html.
The Statistics Authority confirmed that the statistics could continue to be designated as National Statistics.
Implementation of the 2013 European Standard Population (ESP)
1.9 The European Standard Population (ESP) is an artificial population structure which is used
in the weighting of mortality or incidence data to produce age standardised rates (ASRs). Eurostat, the statistical institute of the European Union, decided to update the population structure to be more representative of the current population of Europe.
1.10 The 2013 ESP replaces the 1976 ESP used in calculating age standardised rates. Further information about the ESP and the effect on UK age standardised rates is available at http://www.ons.gov.uk/ons/guide-method/user-guidance/health-and-life-events/revised-european-standard-population-2013--2013-esp-/index.html. Annex A gives detail of the effect on abortion age standardised rates from the implementation of the 2013 ESP.
1.11 All age standardised rates presented in this publication are based on the 2013 ESP. The time series for age standardised rates using the 2013 ESP back to 1968 is presented in table 1. To see rates using the 1976 ESP users should refer to earlier publications.
Ground E notifications
1.12 During 2013, it was brought to the Department of Health’s attention that the number of
Ground E HSA4 notifications was lower than the number reported to the congenital anomaly registries. As there is currently no national register, the Department of Health has worked closely with the National Down’s Syndrome Cytogenetic Register (NDSCR) to explore this discrepancy.
1.13 A matching exercise was carried out between the NDSCR data and Department of Health notifications for 2011, 2012 and 2013 data. Results from the matching suggest that a Department of Health notification was made for about 54% of NDSCR records. Hence there is potentially an undercount presented in the ground E notification tables in this publication.
1.14 In response, the Department of Health asked the Royal College of Obstetricians and
Gynaecologists (RCOG) to consider the possible reasons for under-reporting of abortions on the grounds of fetal abnormality and make recommendations for improvement. Results from the matching exercise and RCOG recommendations are published at https://www.gov.uk/government/publications/under-reporting-of-abortions-for-fetal-abnormalities. Between 2011 and 2013, there has been a 17.8% increase in the submission of HSA4 Abortion Notifications for Down’s syndrome. The Department of Health will continue to work closely with RCOG and other organisations in implementing the recommendations where possible.

10
2 . Commentary
Unless specified, the following commentary, charts and tables relate to abortions carried out in England and Wales for residents of England and Wales only, rather than all abortions carried out in England and Wales. Figures in all but Table 13 exclude abortions for residents of England and Wales that are carried out in other parts of the United Kingdom or outside the UK.
Overall number and rate of abortions 2.1 In total, there were 190,092 abortions notified as taking place in England and Wales in
2014. There were 184,571 abortions to residents of England and Wales in 2014. This represents an age-standardised abortion rate of 15.9 per 1,000 resident women aged 15-442. This is the lowest rate since 1997: 0.2% lower than in 2013, 6.4% lower than in 2004 but double the rate of 7.8 per 1,000 resident women aged 15-44 recorded in 1970 (Table 1 and Figure 1).
Figure 1: Age-standardised abortion rate per 1,000 women aged 15-44 (2013 ESP), England and Wales, 1969 to 2014
Age 2.2 There were 2,399 abortions to girls aged under 16. 698 of these were to girls under 15
and 100 of these were to girls aged under 14.
2.3 737 (7%) of abortions to women aged under 18 were to women who had undergone a previous abortions. For women under aged 16, 57 (2%) were repeat abortions.
2 See Annex A for the 2013 ESP and how the rate is derived.
Abortion Statistics, England and Wales: 2014
11
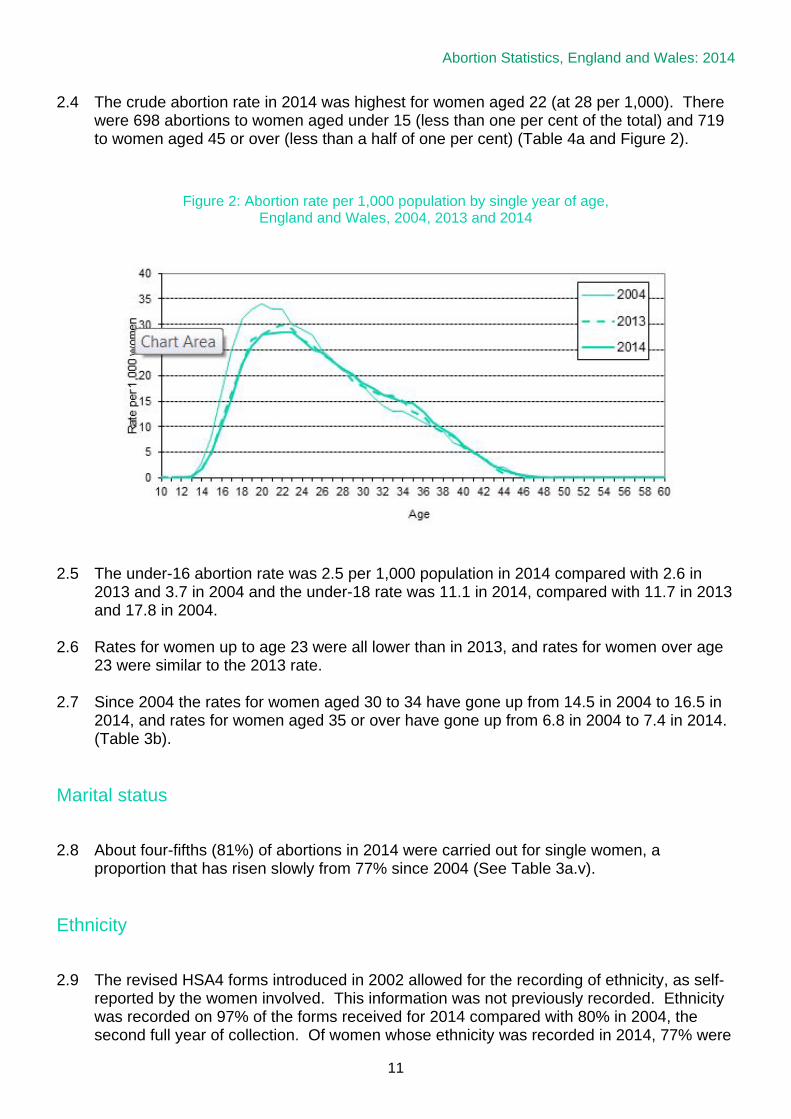
2.4 The crude abortion rate in 2014 was highest for women aged 22 (at 28 per 1,000). There were 698 abortions to women aged under 15 (less than one per cent of the total) and 719 to women aged 45 or over (less than a half of one per cent) (Table 4a and Figure 2).
Figure 2: Abortion rate per 1,000 population by single year of age, England and Wales, 2004, 2013 and 2014
2.5 The under-16 abortion rate was 2.5 per 1,000 population in 2014 compared with 2.6 in
2013 and 3.7 in 2004 and the under-18 rate was 11.1 in 2014, compared with 11.7 in 2013 and 17.8 in 2004.
2.6 Rates for women up to age 23 were all lower than in 2013, and rates for women over age 23 were similar to the 2013 rate.
2.7 Since 2004 the rates for women aged 30 to 34 have gone up from 14.5 in 2004 to 16.5 in
2014, and rates for women aged 35 or over have gone up from 6.8 in 2004 to 7.4 in 2014. (Table 3b).
Marital status 2.8 About four-fifths (81%) of abortions in 2014 were carried out for single women, a
proportion that has risen slowly from 77% since 2004 (See Table 3a.v).
Ethnicity 2.9 The revised HSA4 forms introduced in 2002 allowed for the recording of ethnicity, as self-
reported by the women involved. This information was not previously recorded. Ethnicity was recorded on 97% of the forms received for 2014 compared with 80% in 2004, the second full year of collection. Of women whose ethnicity was recorded in 2014, 77% were

12
reported as White, 9% as Asian or Asian British and 8% as Black or Black British (See Table 3a.vi). This differs from the ethnicity population estimates based on the 2011 census3 where 86% are reported as White, 7.5% as Asian or Asian British and 3.3% as Black or Black British.
2.10 The percentage of women having an abortion in 2014 who had one or more previous
abortions varies by ethnic group. 34% of Asian women having abortions in 2014 had previously had an abortion, compared with 48% of Black women (See Table A below). 36.6% of White women had previously had an abortion.
Table A: Percentage of women who had one, two and three or more previous abortions, by
Ethnic group, England and Wales, 2014
Ethnicity 1 2 3 or more White 27% 7% 2% Mixed 31% 11% 4% Asian or Asian British 26% 6% 2% Black or Black British 32% 11% 5% Chinese 22% 5% 2% Any other ethnic group 25% 8% 3% Not known/not stated 23% 6% 2% All women 27% 8% 3%
Location and funding of abortions 2.11 Table 3a.i and Figure 3 show that in 2014, 32% of abortions were performed in NHS
hospitals and 67% in approved independent sector places under NHS contract (previously named NHS Agency), making a total of 98% of abortions funded by the NHS. The remaining 2% were privately funded. The proportion performed under NHS contract has been rising steadily since this information was collected in 1981, while the proportions of NHS hospital and private abortions have been falling since 1995 and 1988 respectively.
3 http://www.ons.gov.uk/ons/dcp171776_290558.pdf

Abortion Statistics, England and Wales: 2014
13
Figure 3: Abortions by purchaser / provider, England and Wales, 1981 to 2014
Statutory grounds for abortion
2.12 Two medical practitioners must agree upon the grounds under which an abortion can be
performed. For more information about the grounds for abortion see Section 1.4. 2.13 In 2014, the vast majority (98%; 179,967) of abortions were undertaken under ground C. A
further 2% were carried out under ground E (3,099) and a similar proportion (1%: 1,249) under ground D, Grounds A and B together accounted for about a tenth of one per cent of abortions (252). The proportion of ground C abortions has risen steadily with a corresponding reduction in ground D cases (See Table 3a.ii).
2.14 The vast majority (99.93%) of ground C only terminations were reported as being performed because of a risk to the woman’s mental health. No further breakdown for F99 (mental disorder, not otherwise specified) is included in the International Classification of Diseases and therefore no further breakdown is possible within the report.
2.15 Main medical diagnoses for abortions performed under ground C alone which were not
due to mental health (114 cases) were those performed because of; complications of pregnancy (71 cases) including hypertension, excessive vomiting, diabetes, amniotic fluid disorders and premature rupture of membranes; diseases of the circulatory system (15 cases); diseases of the nervous system (2 cases); diseases of the genitourinary or musculoskeletal system (2 cases), and other maternal conditions unrelated to pregnancy such as cancer and epilepsy (24 cases).
2.16 At the time of publication, 170 cases performed under ground C did not have enough
information to allocate a diagnosis code and are being followed up.

14
Legal abortions performed under ground E 2.17 The methods used for abortions performed under ground E are of interest to those working
in fetal anomaly screening and medicine. In 2014, 73% of ground E abortions were performed medically compared to 51% of all abortions (Tables 9c and 7a).
2.18 The average age for a woman who has an abortion performed under ground E is 33.
2.19 Congenital malformations were reported as the principal medical condition in nearly half (46%; 1,441) of the 3,099 cases undertaken under ground E. The most commonly reported malformations were of the nervous system (22% of all ground E cases; 693) and the cardiovascular system (7%; 231). Chromosomal abnormalities were reported as the principal medical condition for just over a third (37%; 1,148) of ground E cases. Down’s syndrome was the most commonly reported chromosomal abnormality (21%; 662) (See Table 9a and Figure 4).
2.20 The Abortion Notification form HSA4 allows the recording of all medical conditions and
other details associated with the ground. Table 9a shows totals for all mentions of any medical condition recorded. For example, there were 2,148 mentions of a congenital malformation within the 3,099 Ground E cases.
2.21 No abortions in 2014 were associated with rubella under ground E. In the past 10 years,
there have been 5 abortions associated with rubella: 3 in 2005, 1 in 2006 and 1 in 2007. Figure 4: Principal medical condition for abortions performed under ground E (percentages)
2.22 Abortions are rarely performed under grounds F or G. In the past 10 years, 8 such abortions have been reported, 1 in each of the years 2006, 2011, 2012 and 2013 and 4 in 2014.

Abortion Statistics, England and Wales: 2014
15
Gestation period 2.23 The vast majority of abortions are performed at under 13 weeks (92% in 2014). There has
been a continuing increase in the proportion of abortions that are performed under 10 weeks since 2004.
2.24 In 2014, 80% of abortions were performed at under 10 weeks, compared to 79% in 2013 and 60% in 2003. In 2014 and 2013, there were similarities in the proportion performed later: in 2014, 12% were performed at 10-12 weeks (compared to 12% in 2013 and 27% in 2004) and 8% at 13 weeks or more (compared to 8% in 2013 and 13% in 2004) (See Table 3a.iii and Figure 5).
2.25 Department of Health policy is that women who are legally entitled to an abortion should
have access to the procedure as soon as possible. Evidence shows that the risk of complications increases the later the gestation.
Figure 5: Abortions by gestation weeks, England and Wales, 2004 to 2014
2.26 Over three quarters (80%) of NHS funded abortions took place at under 10 weeks, ranging
from 54% in the Vale of Glamorgan to 89% in North Staffordshire (See Table 11a).
2.27 Abortions where gestation has exceeded its twenty-fourth week account for less than 0.1% of the total. There were 211 such abortions in 2014 (See Table 5 and Table 9a).
2.28 In previous years a distinction was made between gestations of 24 weeks plus 0 days and
24 weeks plus 1 or more days. In tables, abortions that were 24 weeks plus 0 days were included with gestations of 23 weeks and footnoted as such.
2.29 In 2014, 14 of the 190 abortions that were ‘24 weeks and over’ were for abortions that
were 24 + 0 days.
16
2.30 In 2014, no abortions at 24 weeks gestation were performed under ground C Previous abortions 2.31 In 2014, 37% of women undergoing abortions had one or more previous abortions. The
proportion has risen from 32% in 2004 (See Table 3a.ix and Table 4b).
2.32 27% of abortions to women aged under 25 were to women who had one or more abortions (See Table 11b).
2.33 Repeat unintended pregnancy and subsequent abortion is a complex issue associated
with increased age as it allows longer for exposure to pregnancy risks (See Table B).
Table B: Percentage of women who had one or more previous abortions, by age, England and Wales, 2014
Age 1 or more Under 18 7% 18-19 17% 20-24 34% 25-29 45% 30-34 47% 35 or over 45%
All women 37%
2.34 In 2014, there was some variation across Local Authorities in England in the proportion of
women undergoing abortions who had one or more previous abortions (see Table 11d). The proportion of women undergoing repeat abortions ranged from 27% in Devon to 49% in Croydon.
2.35 This variation across Local Authorities is likely to be due to differences in local practice
relating to post-abortion contraception advice.
Previous obstetric history 2.36 In 2014, 54% of women undergoing abortions had one or more previous pregnancies that
resulted in a live or stillbirth, up from 47% in 2004 (See Table 3a.vii). 18% of women had a previous pregnancy resulting in a miscarriage or ectopic pregnancy, up from 14% in 2004, when the information was first collected (See Table 3a.viii).
Abortion Statistics, England and Wales: 2014
17
2.37 Obstetric history, especially for young women is of interest generally and to those working to reduce unplanned pregnancies however, data provided on the Abortion Notification form is not detailed enough to do further analysis.
Method of abortion 2.38 Different methods may be used to terminate a pregnancy, depending on the duration of
gestation, and other circumstances relating to the individual woman. There is one principal medical method, involving the use of the abortifacient drug Mifegyne (mifepristone, also known as RU486).
2.39 The main surgical methods are: I. vacuum aspiration, recommended at up to 15 weeks gestation II. dilatation and evacuation (D&E) recommended where gestation is greater than 15
weeks D&E may be used in combination with vacuum aspiration; such cases are recorded in the statistics as D&E.
Figure 6: Abortions by method, England and Wales, 2004 to 2014
2.40 Medical abortions accounted for 51% of the total in 2014. The proportion of medical abortions has more than trebled in the last ten years from 20% in 2004 and 2014 is the first year where more medical abortions than surgical abortions took place. There has been a continuing upward trend in medical abortions since 1991 when Mifegyne was licensed for use in the UK, when only 4% of abortions were undertaken using a medical

18
procedure (See Table 3a.iv and Table 5). In 2014, 62% of abortions under nine weeks were medical abortions compared with 28% in 2004. See Figure 6 above.
2.41 The choice of early medical abortion as a method of abortion is likely to have contributed
to the increase in the overall percentage of abortions performed at under ten weeks gestation (60% in 2004 compared with 80% in 2014). Early medical abortion is less invasive than a surgical procedure and does not involve use of anaesthetics.
2.42 The surgical procedure vacuum aspiration was used for 44% of all abortions in 2014; and Dilatation and Evacuation (D&E) alone in about 4% (See Table 3a.iv).
2.43 For abortions at 22 weeks or beyond, feticide is recommended by the Royal College of
Obstetricians and Gynaecologists prior to the evacuation of the uterus to stop the fetal heart. In 2014, of the 1,193 abortions performed at 22 weeks and over, 58% were reported as preceded by a feticide and a further 37% were performed by a method whereby the fetal heart is stopped as part of the procedure. 4% of abortions at 22 weeks or beyond were confirmed as having no feticide. For the remaining 12 cases, at the time of publication, we had not been able to confirm whether feticide had been performed. See Figure 7)
Figure 7: Abortions performed at 22 weeks gestation and over, England and Wales, 2014
Length of stay in hospital/clinic 2.44 In 2014, 317 women (0.2%) were reported as having duration of stay of one or more nights
in a hospital or clinic after their abortion. More than two thirds of these stays were for abortions performed at later gestations of 20 weeks and over (See Table C).
Abortion Statistics, England and Wales: 2014
19
Table C: Abortions requiring a length of stay of one or more nights, percentage breakdown by gestation weeks, England and Wales, 2014
Complications 2.45 Complications were reported in 330 cases in 2014, a rate of about one in every 550
abortions, slightly lower than the rate in 2013 (about one in 800) and 14 per cent lower than in 2004 (See Table 8).
2.46 There were no deaths following abortion reported on form HSA4 in 2014. Deaths related
to pregnancy and abortion will be published in the MBRRACE-UK: Mothers and Babies: Reducing Risk through Audits and Confidential Enquiries across the UK https://www.npeu.ox.ac.uk/mbrrace-uk/programme-of-work
Selective terminations 2.47 Pregnancies following fertility treatments such as in vitro fertilisation (IVF) may result in
more than one embryo implanting in the womb. In such cases, the outcome of the pregnancy may be more successful if the number of fetuses is reduced. This reduction usually occurs at about 12 weeks’ gestation.
2.48 In 2014, there were 132 abortions which involved selective terminations. In 80 cases, two fetuses were reduced to one fetus. In 35 cases, three fetuses were reduced to two fetuses and in 14 cases three fetuses were reduced to one fetus. Over three quarters (83%) of the selective terminations were performed under ground E.
2.49 The number of selective terminations has increased from around 50-80 in each of the last
10 years to 125 in 2013 and to 132 in 2014. The proportions of reductions, for example, 3 fetuses reduced to 2 or 3 fetuses reduced to 1, over the years has stayed roughly the same, see Table D.
Gestation (weeks) % of those requiring a length of stay of one
or more nights (Total = 100%)
% of all abortions
(Total = 100%)
Under 10 11% 80% 10-12 9% 12% 13-19 40% 7% 20 or over 40% 2%

20
Table D Selective reduction abortions by number of original fetuses, residents
of England and Wales, 2010 to 2014.
Original number of fetuses
Total
2 reduced 1
3 reduced to 2
3 reduced to 1
4 *
5 *
2010
85
51
20
9
3
2
2011
72
37
18
9
7
1
2012
82
38
28
11
5
0
2013
125
74
28
10
10
3
2014
132
80
35
14
3
0
*Represents the original number of fetuses prior to any selective reduction.
Numbers are not broken down further for these two groups due to disclosure control.
2.50 Abortions that are selective abortions are more likely to be for women who are married (75%), aged 30 and over (83%) and who are less likely to have had a previous abortions: only 6% of cases reported a previous abortion.
Chlamydia screening 2.51 The revised HSA4 forms introduced in 2002 allowed for the recording of whether
chlamydia screening was offered. The Royal College of Obstetricians and Gynaecologists recommend that all women undergoing an abortion should be screened for C. trachomatis and undergo a risk assessment for other STIs. Chlamydia is the most commonly diagnosed STI in England. Infection of varying degrees of severity may occur after medical or surgical abortion and is usually caused by pre-existing infection. Prophylactic antibiotic use and bacterial screening for lower genital tract infection reduces this risk. Analysis of returned data for 2014 shows that 87% of women having abortions in 2014 were offered chlamydia screening, up from 69% in 2004. (See Table 3a.x). The figure for women aged under 25 is slightly higher (91%)
Place of residence within England and Wales 2.52 The place of residence details provided on the HSA4 form are used to allocate each
record to a Clinical Commissioning Group (CCG) for analysis. For Wales, records are allocated to their equivalents, Local Health Boards. Tables 10a, 10b, 11a and 11b show information for these areas.
2.53 Similarly the place of residence details are used to allocate each record to a Local Authority (LA) and tables 10c, 10d, 11c and 11d show information by LA.

Abortion Statistics, England and Wales: 2014
21
2.54 Rates vary by region with London showing the highest rate at 22 per 1,000 women. See Figure 8.
Figure 8: Abortion rates, per 1,000 women aged 15-44, by CCG region in
England and Wales, 2014
Women resident outside England and Wales 2.55 In 2014, there were 5,521 abortions to women resident outside England and Wales,
compared with 5,469 in 2013. Principally, these non-residents were from the Irish Republic (68%) and Northern Ireland (15%). See Tables 12a, c, d and Figure 9.
2.56 The number of abortions to non-residents has fallen each year since 2003, when the figure was 9,078. The 2014 total is slightly higher than 2013 which was the lowest in any year since 1969 (See Table 1 and Table 12a).
22
Figure 9: Abortions to non-residents in England and Wales, 2004 to 2014
Abortions carried out in Great Britain 2.57 There were 201,567 abortions carried out in Great Britain in 2014, of which 94% took
place in England and Wales and 6% took place in Scotland (See Table 13). Scotland perform the majority of abortions medically 80% compared to those performed in England and Wales where the proportions were surgical 50% and medical 50%. The proportion of women undergoing abortions who had one or more previous abortions was higher for women having abortions in England and Wales (37%) than those having abortions in Scotland (32%).
Abortion Statistics, England and Wales: 2014
23
Index of Tables The complete datasets are available at https://www.gov.uk/government/statistical-data-sets/abortion-statistics-england-and-wales-2014
Table
Description
Table 1
Legal abortions: resident status and purchaser, 1968 to 2014
Table 2
Legal abortions: age by (i) purchaser, (ii) statutory grounds, (iii) gestation weeks,
(iv) procedure, (v) marital status, (vi) ethnicity, (vii) parity, (viii) previous miscarriages,
(ix) previous abortions, (x) chlamydia screening, residents of England and Wales, 2014
Table 3a
Legal abortions: by (i) purchaser, (ii) statutory grounds, (iii) gestation weeks,
(iv) procedure, (v) marital status, (vi) ethnicity, (vii) parity, (viii) previous miscarriages,
(ix) previous abortions, (x) chlamydia screening, residents of England and Wales, 2004 to 2014
Table 3b
Legal abortions: totals, rates and percentages by age group, residents of England and Wales,
2004 to 2014
Table 4a
Legal abortions: by age, residents of England and Wales, 2014
Table 4b
Legal abortions: number of previous abortions by age, residents of England and Wales, 2014
Table 5
Legal abortions: gestation weeks by purchaser and method of abortion, residents of England
and Wales, 2014
Table 6
Legal abortions: gestation weeks by age and purchaser, residents of England and Wales, 2014
Table 7a
Legal abortions: procedure by gestation weeks, residents of England and Wales, 2014
Table 7b
Legal abortions: grounds by gestation weeks, residents of England and Wales, 2014
Table 8
Legal abortions: complication rates by procedure and gestation weeks, residents of England
and Wales, 2014
Table 9a
Legal abortions: principal medical condition and all mentions of medical conditions,
for abortions performed under ground E, residents of England and Wales, 2014
Table 9b
Legal abortions performed under ground E by gestation weeks, residents of
England and Wales, numbers, 2014
Table 9c
Legal abortions performed under ground E by gestation weeks, residents of

24
England and Wales, percentages, 2014
Table 10a
Legal abortions: numbers by Clinical Commissioning Groups (England) and Locality Office
(Wales) of residence, by age, 2014
Table 10b
Legal abortions: rates by Clinical Commissioning Groups (England) and Locality Office (Wales)
of residence, by age, 2014
Table 10c
Legal abortions: numbers by age and Local Authority, England residents, 2014
Table 10d
Legal abortions: rates by age and Local Authority, England residents, 2014
Table 11a
Legal abortions: purchaser, gestation weeks and Sexual Health Indicator by Clinical
Commissioning Group (England) and Locality Office (Wales) of residence, 2014
Table 11b
Legal abortions: method of abortion and repeat abortions, all ages, aged under 25 and 25 and
over, by Clinical Commissioning Group (England) and Locality Office (Wales) of residence, 2014
Table 11c
Legal abortions: purchaser, gestation weeks and Sexual Health Indicator by Local Authority,
England, residents, 2014
Table 11d
Legal abortions: method of abortion and repeat abortions, all ages, aged under 25 and 25 and
over by Local Authority, England, residents, 2014
Table 12a
Legal abortions: non residents of England & Wales by country of residence, 2014
Table 12b
Legal abortions: non residents of England & Wales by (i) age, (ii) statutory grounds and
(iii) gestation weeks, 2014
Table 12c
Legal abortions: country of residence by age and gestation weeks, 2014
Table 12d
Legal abortions: residents of Irish Republic by county, 2014
Table 13
Legal abortions: countries of Great Britain by (i) age, (ii) gestation, (iii) procedure, (iv) parity,
(v) previous abortions, (vi) grounds and (vii) principal medical condition for abortions performed
under ground E, 2014
Abortion Statistics, England and Wales: 2014
Annex A: Data Quality and Methods • Validation i. The Department of Health use a thorough process for inspecting and recording the
information received on the forms in order to monitor compliance with the legislation and the extent to which best practice guidance from the Department of Health is followed. Selected forms are scrutinised by a medical practitioner who may request further detail from the patient’s medical record via the terminating doctor. Further details of the checks that are made on the data are available on the GOV.UK web site at:
https://www.gov.uk/government/publications/abortion-notification-forms-for-england-and-wales
• Data collected
Not all the information collected on form HSA4 is necessary for statistical purposes and some of the information that is used to monitor the Abortion Act is not stored electronically other than on scanned images of the forms. The scanned images of the forms are part of the system for processing the forms and they are kept for three years. The following information is not stored:
• Terminating and certifying doctors’ names • Terminating and certifying doctors’ addresses • Terminating doctor’s GMC number • Patient name • Patient reference including NHS number • Patient address • Detail about any medical conditions other than ICD10 Codes
• Derived fields
Some of the data used in the tables are derived variables. More detail about these calculations is shown below:
• Reported Date of Termination is from the date of the surgical treatment or, for medical abortions, the date of prostaglandin or other medical agent. If a feticide is used, this date takes priority.
• Age at Termination is taken from Reported Date of Termination (see above) minus date of birth. Age at termination is collected in whole years.
• Purchaser is derived from information given about how the abortion was funded (NHS or Privately) together with clinic type (NHS hospital, Independent Sector, Private hospital). For example, a privately funded abortion within an Independent
Abortion Statistics, England and Wales: 2014
ii
Sector organisation will be ‘privately funded’ and an NHS funded abortion within an Independent Sector clinic will be ‘NHS Funded: Independent Sector’.
• Area of residence (CCG/LA/region) is derived from postcode of the woman’s residence.
• Duration of stay is derived from date of discharge minus date of admission.
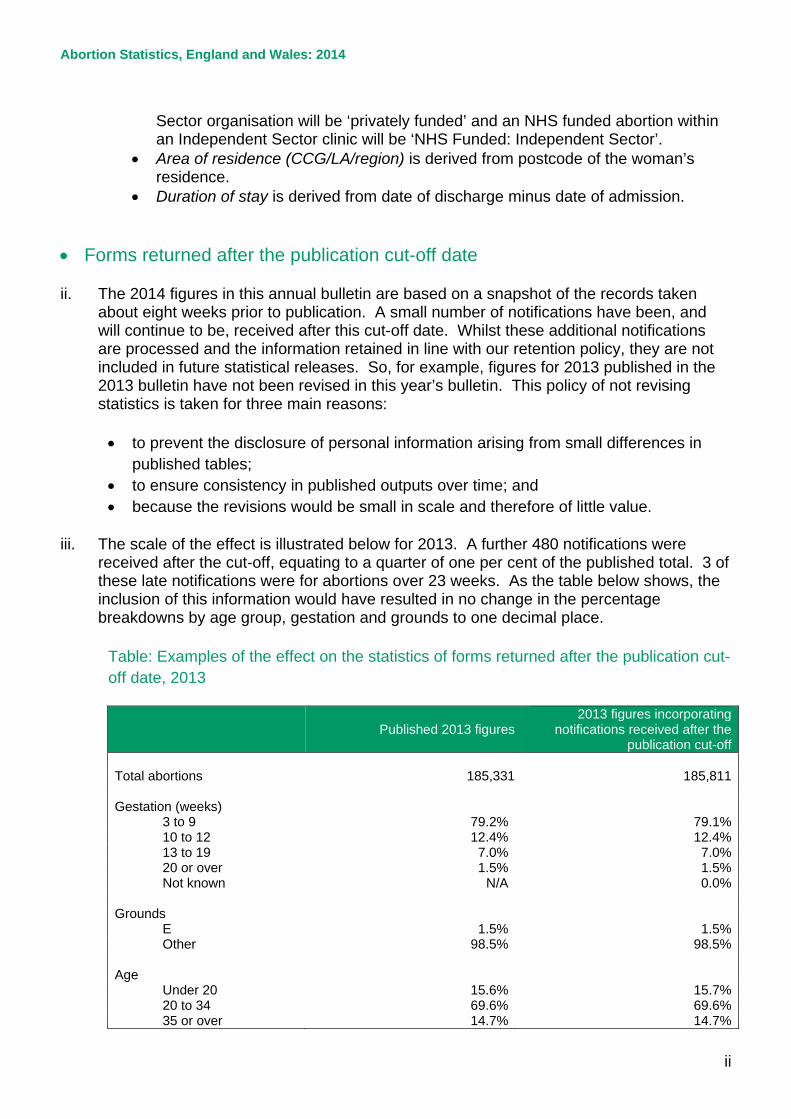
• Forms returned after the publication cut-off date ii. The 2014 figures in this annual bulletin are based on a snapshot of the records taken
about eight weeks prior to publication. A small number of notifications have been, and will continue to be, received after this cut-off date. Whilst these additional notifications are processed and the information retained in line with our retention policy, they are not included in future statistical releases. So, for example, figures for 2013 published in the 2013 bulletin have not been revised in this year’s bulletin. This policy of not revising statistics is taken for three main reasons:
• to prevent the disclosure of personal information arising from small differences in
published tables; • to ensure consistency in published outputs over time; and • because the revisions would be small in scale and therefore of little value.
iii. The scale of the effect is illustrated below for 2013. A further 480 notifications were
received after the cut-off, equating to a quarter of one per cent of the published total. 3 of these late notifications were for abortions over 23 weeks. As the table below shows, the inclusion of this information would have resulted in no change in the percentage breakdowns by age group, gestation and grounds to one decimal place.
Table: Examples of the effect on the statistics of forms returned after the publication cut-off date, 2013
Published 2013 figures 2013 figures incorporating
notifications received after the publication cut-off
Total abortions 185,331 185,811 Gestation (weeks)
3 to 9 79.2% 79.1% 10 to 12 12.4% 12.4% 13 to 19 7.0% 7.0% 20 or over 1.5% 1.5% Not known N/A 0.0%
Grounds
E 1.5% 1.5% Other 98.5% 98.5%
Age
Under 20 15.6% 15.7% 20 to 34 69.6% 69.6% 35 or over 14.7% 14.7%
Abortion Statistics, England and Wales: 2014
iii
• Incomplete information and imputation iv. Incomplete and incorrectly completed forms are returned to practitioners for completion
and clarification. In a very small number of cases (about one-quarter of one percent), the information remains unavailable at the time of publication. Date of birth was missing from 5 records in 2014, gestation information from 37, postcodes from 32 and grounds from 10.
v. For the purposes of constructing statistics, values for missing items are imputed.
Records with missing ages were assigned pro-rata to the 20-24 age group, as this is the modal age group, accounting for 29% of abortions. Missing gestations were imputed as 6, 7, 8, 9 or 10 weeks in equal distribution unless the method of abortion or diagnosis suggested otherwise. Missing postcodes were imputed with a random postcode from within the main local authority of other residents attending the same hospital or clinic. Missing grounds were imputed as ground C
• Population estimates used for rates of abortion vi. Abortion rates are calculated using the conventional age range for women in their child
bearing years, 15 – 44.
vii. Abortion rates per 1,000 women for 2014 at a national level and at CCG level were calculated using the mid-2013 population estimates for England, Wales, England and Wales, Clinical Commissioning Groups and Locality Office, as published at 26th June 20141. Rates for earlier years were calculated using the latest population estimates available at the time the relevant annual reports were produced and have not been revised, either by using population estimates for the year in question or by using updated population estimates.
• Deriving age standardised rates of abortion viii. Age standardised rates allow comparison between populations which may contain
different proportions of people of different ages. The European Standard Population (ESP) is a widely used artificial population structure for the calculation of directly age standardised rates. The replacement of the ESP first used in 1976 with an updated version published in 2013 resulted in an increase of all-cause mortality rates for England and Wales by 85% and all-site cancer incidence rates for England by some 48%. Figures using the 1976 and 2013 ESPs are therefore not comparable. Information about this change in methods can be found on the ONS website at: http://www.ons.gov.uk/ons/guide-method/user-guidance/health-and-life-events/revised-european-standard-population-2013--2013-esp-/index.html
1 Available at http://www.ons.gov.uk/ons/rel/pop-estimate/population-estimates-for-uk--england-and-wales--scotland-and-northern-ireland/2013/stb---mid-2013-uk-population-estimates.html

Abortion Statistics, England and Wales: 2014
iv
ix. The effect of implementing the 2013 ESP for abortion age standardised rates is small. The vast majority of abortions occur within the age range 15-44. The 1976 ESP assumed equal populations at each single age between 15-44 (see Annex table 1 below). The 2013 ESP has made only a small change to the populations within age range 15-44 such that although not equal, it remains fairly uniform. Thus, the 2013 ESP brings the abortion age standardised rates down by about 4% in recent years and 2% in earlier years. The time series using 2013 ESP age standardised rates back dated to 1968 is presented in table 1 of the detailed tables.
x. The formulae used to calculate the age-standardised abortion rates are given below.
For the analysis of trends in abortion rates for England and Wales:
𝐴𝐴𝐴 𝑆𝑆𝑆𝑆𝑆𝑆𝑆𝑆𝑆𝑆𝐴𝑆 𝑅𝑆𝑆𝐴 = ∑ 𝑆𝑆𝑆𝐴𝑖𝐸𝑆𝐸𝑖𝑎𝑎𝑎 𝑎𝑎𝑎𝑎 𝑖
∑ 𝐸𝑆𝐸𝑖44𝑖=15
Where ‘ratei’ is the crude rate for women aged i and ESPi is the population of women aged i in the 2013 European Standard Population.
For the area analyses in table 10b:
𝐴𝐴𝐴 𝑆𝑆𝑆𝑆𝑆𝑆𝑆𝑆𝑆𝑆𝐴𝑆 𝑅𝑆𝑆𝐴 = ∑ 𝑆𝑆𝑆𝐴𝑖𝐸𝑆𝐸𝑖44𝑖=15∑ 𝐸𝑆𝐸𝑖44𝑖=15
where the rate for women aged under 16 (rate 15) =
𝑆𝑛𝑛𝑛𝐴𝑆 𝑜𝑜 𝑆𝑛𝑜𝑆𝑆𝑆𝑜𝑆𝑆 𝑆𝑜 𝑤𝑜𝑛𝐴𝑆 𝑛𝑆𝑆𝐴𝑆 16𝑝𝑜𝑝𝑛𝑝𝑆𝑆𝑆𝑜𝑆 𝑜𝑜 15 𝑦𝐴𝑆𝑆 𝑜𝑝𝑆𝑆
and the rate for women aged 44 and over (rate 44) =
𝑆𝑛𝑛𝑛𝐴𝑆 𝑜𝑜 𝑆𝑛𝑜𝑆𝑆𝑆𝑜𝑆𝑆 𝑆𝑜 𝑤𝑜𝑛𝐴𝑆 𝑆𝐴𝐴𝑆 44 𝑆𝑆𝑆 𝑜𝑜𝐴𝑆
𝑝𝑜𝑝𝑛𝑝𝑆𝑆𝑆𝑜𝑆 𝑜𝑜 44 𝑦𝐴𝑆𝑆 𝑜𝑝𝑆𝑆

Abortion Statistics, England and Wales: 2014
v
Annex table 1: European Standardised Population Age group 1976 ESP 2013 ESP Under 1 1,600 1,000 1-4 6,400 4,000 5-9 7,000 5,500 10-14 7,000 5,500 15-19 7,000 5,500 20-24 7,000 6,000 25-29 7,000 6,000 30-34 7,000 6,500 35-39 7,000 7,000 40-44 7,000 7,000 45-49 7,000 7,000 50-54 7,000 7,000 55-59 6,000 6,500 60-64 5,000 6,000 65-69 4,000 5,500 70-74 3,000 5,000 75-79 2,000 4,000 80-84 1,000 2,500 85 and over 1,000 - 85-89 - 1,500 90-94 - 800 95 and over - 200 Total 100,000 100,00 Source: Eurostat
• Confidence intervals xi. The figures recorded in this report are the outcome of a stochastic process – that is, they
are influenced by chance or random processes such as fertilisation. Each recorded figure is only one of a range of results that could have occurred under the same circumstances if those random processes had led to different outcomes. It is often the underlying circumstances or process that is of interest and the actual value observed gives only an imprecise estimate of this ‘underlying risk’. For example, users are often interested in understanding whether there has been a change in rates of abortion, perhaps reflecting a change in the prevalence of risky sexual behaviour, a change in attitudes towards the options available in pregnancy or a change in access to services. To assess this, it is necessary to determine if the observed change is one that is unlikely to be the result of random fluctuation and therefore offers evidence that a real change has occurred.
xii. A confidence interval can be calculated around each observed value, which gives a range
in which the expected or average value resulting from the underlying process is likely to fall. The 95 per cent confidence intervals have been calculated for some of the observed values in tables 10a, 10b, 10c and 11. These are known as such, because if it were

Abortion Statistics, England and Wales: 2014
vi
possible to repeat the underlying process under the same conditions a large number of times (that is, ‘rerun’ the year over and over again), 95 per cent of the confidence intervals calculated in this way would contain the average value from those runs. When assessing the observed results for the year, it is usual to assume that there is only a 5 per cent chance that the expected or average value falls outside the 95 per cent confidence interval.
xiii. The confidence interval may be used to compare an estimate against a target or
benchmark value. If the target or benchmark value is outside the confidence interval it can be inferred that the difference between the estimate and the target is statistically significant at the 95 per cent confidence level.
xiv. Confidence intervals are also often used to compare two observed values (for example,
abortion rates within two regions.) Sometimes in such cases statistical testing is undertaken by seeing if the two confidence intervals overlap. This is quick and easy to do, but not necessarily conclusive: whilst it is safe to assume that non-overlapping confidence intervals indicate a statistically significant difference, it is not always the case that overlapping confidence intervals do not.
xv. The method for estimating a confidence interval varies depending on whether it is for a
percentage, count, crude rate or standardised rate. The methods used are those detailed in the Association of Public Health Observatories’ Technical Briefing 3: Commonly used public health statistics and their confidence intervals.
xvi. For example, the 95 per cent confidence interval associated with:
• The figure of 184,571 for the total number of abortions of residents in England and Wales is 183,730 – 185,415 (Table 10a);
• The age standardised rate of 15.92 abortions per 1000 resident women aged 15-44 in England and Wales is 15.9 to 16.0 (Table 10b);
• The figure of 84.5 per cent for the percentage of NHS funded abortions in NHS Eastern Cheshire CCG undertaken within 10 weeks gestation is 80.5 per cent to 87.7 per cent (Table 11).
• Disclosure Control xvii. The Data Protection Act 1998 places a statutory obligation on the Department of Health
to ensure that the statistics we release on abortion do not relate to a living individual who can be identified from those data alone or in conjunction with other available information, unless the conditions laid out in the Act are met. In recent years, the Department has attempted to meet this obligation by following the disclosure guidance for abortion statistics developed by the Office for National Statistics in July 2005. A judgment was handed down in 2011 by the High Court in a case relating to the release of information on principal medical condition for abortions performed under Ground E, showed that the disclosure controls set out in the guidance were overly cautious in some circumstances. The format of the tables in the annual report have therefore been revised, with a more limited degree of suppression applied, where still necessary to avoid the disclosure of personal data.
xviii. The Department published the Disclosure Control Protocol for Abortion Statistics in June 2015 which can be found at:

Abortion Statistics, England and Wales: 2014
vii
https://www.gov.uk/government/collections/abortion-statistics-for-england-and-wales • Geographical coding and naming xix. On 1st January 2011, the Government Statistical Service introduced a new coding and
naming policy for statistical geographies. Nine-digit codes have been developed to ensure consistency when comparing geographical areas as the geographical area covered by an NHS organisation is susceptible to change. These unique markers have been added to the relevant tables within this publication.
xx. On the 1st April 2013 Clinical Commissioning Groups assumed commissioning of termination of pregnancy services under the health system reforms. Further information on the Coding and Naming for Statistical Geographies is available at: http://www.ons.gov.uk/ons/guide-method/geography/geographic-policy/coding-and-naming-for-statistical-geographies/index.html
• Rounding xxi. Percentages are subject to rounding and totals may not agree with the sum of the
component figures shown. Rates are also rounded. • Symbols xxii. The following symbols are used in the tables:
. = not applicable
.. = suppressed value to protect patient confidentiality

Abortion Statistics, England and Wales: 2014
viii
Annex B: Further Information • Enquiries Enquiries about the data or requests for further information should be addressed to: Abortion Statistics Department of Health Richmond House 79 Whitehall London SW1A 2NS e-mail: [email protected] Extracts from this publication may be reproduced provided a reference to the source is given. • Links This bulletin for 2014, and previous bulletins for 2002 to 2013, can be found on the Department of Health website: https://www.gov.uk/government/collections/abortion-statistics-for-england-and-wales http://transparency.dh.gov.uk/category/statistics/abortion Data for 1991 to 2001 can be sent by email on request. Information about disclosure control protocol published 9th June 2015 can be found at: https://www.gov.uk/government/publications/abortion-statistics-protocols-on-disclosing-personal-data Information on abortions carried out in Scotland can be found at: http://www.isdscotland.org/Health-Topics/Sexual-Health/Abortions Information about the release of abortion statistics in Scotland can be found at: http://www.isdscotland.org/Products-and-Services/Data-Protection-and-Confidentiality/Disclosure-Protocol-Version-2-2-WEBversion.pdf Facts and figures about abortion in the European Region can be found at: http://www.euro.who.int/en/what-we-do/health-topics/Life-stages/sexual-and-reproductive-health/activities/abortion/facts-and-figures-about-abortion-in-the-european-region Information on the incidence and recent trends in legal abortion worldwide can be found at: http://www.guttmacher.org/pubs/journals/3310607.html Conception statistics for England and Wales are available at: http://www.ons.gov.uk/ons/search/index.html?newquery=conception Statistics on the National Chlamydia Screening Programme are available at: http://www.chlamydiascreening.nhs.uk/ps/data/index.html The British Isles Network of Congenital (BINOCAR) collect and publish data on terminations of pregnancy for fetal anomaly; http://www.binocar.org/Publications/Reports

Abortion Statistics, England and Wales: 2014
ix


![[XLS] · Web viewNumber of women 15 to 50 years old who had a birth in the past 12 months +/-3,949 Unmarried women (widowed, divorced, and never married) +/-2,078 +/-3.6 Per 1,000](https://img.pdfslide.net/doc/110x75/5b336c0b7f8b9aae458cb423/xls-web-viewnumber-of-women-15-to-50-years-old-who-had-a-birth-in-the-past.jpg)