Embed Size (px)
Citation preview
About RHT Health Trust
RHT Health Trust ("RHT") is a registered Business Trust with an investment mandate to investprincipally in medical and healthcare assets and services, in Asia, Australasia and emerging marketsin the rest of the world. RHT may also develop medical and healthcare assets. It is expected that themedical services will be provided directly by RHT or in collaboration with third parties.
Key Information on the PortfolioRHT’s Portfolio as of 30 June 2017 comprises interest in twelve RHT Clinical Establishments, fourGreenfield Clinical Establishments and two Operating Hospitals located across India.
Clinical EstablishmentsAmritsar
Bengaluru, BG RoadChennai, MalarFaridabadJaipurKolkataMohali (including land acquired as anextension)Mumbai, KalyanMumbai, MulundNoidaGurgaon (Associate)New Delhi, Shalimar Bagh (Associate)
Greenfield Clinical EstablishmentsLudhianaChennaiHyderabadGreater Noida
Operating HospitalsBengaluru, NagarbhaviBengaluru, Rajajinagar
Developments in FY18 Q1During the quarter, 73 operating beds were added in Jaipur, Amritsar, Shalimarbagh, Gurgaon, andMohali Clinical Establishments. The increase in operating beds at Jaipur Clinical Establishment is dueto the commencement of operations of Mother and Child as well as Orthopaedics programmes post thecompletion of the expansion project.
In May 2017, the Trustee-Manager refinanced the S$95.0 million of bank borrowings partially throughthe issuance of $60.0 million 4.5% fixed rate notes which are due in July 2018 and payable semi-annually in arrears (the “Series 1 Tranche 2 Notes”). The Series 1 Tranche 2 Notes have beenconsolidated to form a single series with the existing $60.0 million 4.5% fixed rate notes issued on 22July 2015 and due in July 2018. The remaining balance of $35.0 million was refinanced through bankborrowings of $55.0 million in June 2017 for three years, split equally between Siemens Bank GMBHand United Bank Overseas Limited. The additional $20.0 million is being used for capital expenditureand working capital requirements.
Hedging policyCommencing 1 April 2017, the Trustee-Manager hedges a maximum of 50% of the INR cash flow whichis receivable by RHT every 6 months from India. This change in hedging policy was arrived at inconsultation with our stakeholders, and will serve to balance the interests of different stakeholders,while managing risks and costs more efficiently. Prior to this, the Trustee-Manager hedged 100% of theINR cash flow receivable by RHT.
Distribution policyRHT’s policy is to distribute at least 90.0% of its distributable income on a semi-annual basis, for everysix-month period ending 30 September and 31 March. For the year ended 31 March 2018, the Trustee-Manager will distribute 95.0% of its distributable income. The 5.0% which is retained will be used tofund future capital expenditure and growth.
Table of Contents
1 Unaudited Results for the quarter ended 30 June 2017
1(a) Consolidated Statement of Comprehensive Income and Distributable IncomeStatement
1(b)(i) Balance Sheets
1(b)(ii) Group's Borrowings and Debt Securities
1(c) Consolidated Cash Flow Statement
1(d)(i) Statement of Changes in Unitholders' Funds
1(d)(ii) Units in issue
2 Audit
3 Auditors' Report
4 Accounting Policies
5 Changes in Accounting Policies
6 Earnings Per unit ("EPU") and Distribution per unit ("DPU")
7 Net Asset Value (“NAV”)
8 Review of Group’s Performance
9 Variance from Forecast
10 Market and Industry Information
11 Information on Distribution
12 Distribution
13 Interested Person Transactions
14 Confirmation by Board
15 Confirmation by Issuer
1
1 Unaudited Results for the quarter and year ended 30 June 2017
The Board of Directors of the Trustee-Manager announces the following unaudited results of RHT and itssubsidiary companies ("RHT Group") for the quarter and year ended 30 June 2017.
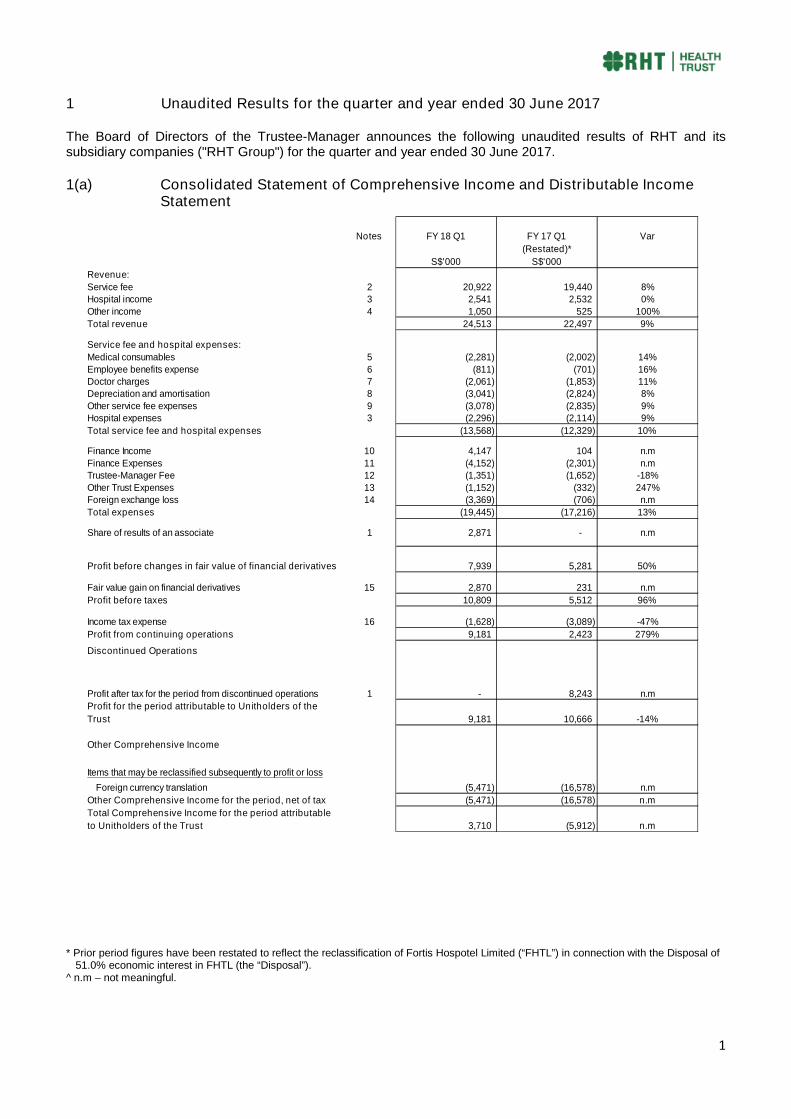
1(a) Consolidated Statement of Comprehensive Income and Distributable IncomeStatement
Notes FY 18 Q1 FY 17 Q1 Var
(Restated)*
S$'000 S$'000
Revenue:
Service fee 2 20,922 19,440 8%Hospital income 3 2,541 2,532 0%
Other income 4 1,050 525 100%
Total revenue 24,513 22,497 9%
Service fee and hospital expenses:
Medical consumables 5 (2,281) (2,002) 14%
Employee benefits expense 6 (811) (701) 16%Doctor charges 7 (2,061) (1,853) 11%Depreciation and amortisation 8 (3,041) (2,824) 8%
Other service fee expenses 9 (3,078) (2,835) 9%Hospital expenses 3 (2,296) (2,114) 9%
Total service fee and hospital expenses (13,568) (12,329) 10%
Finance Income 10 4,147 104 n.m
Finance Expenses 11 (4,152) (2,301) n.mTrustee-Manager Fee 12 (1,351) (1,652) -18%
Other Trust Expenses 13 (1,152) (332) 247%Foreign exchange loss 14 (3,369) (706) n.m
Total expenses (19,445) (17,216) 13%
Share of results of an associate 1 2,871 - n.m
Profit before changes in fair value of financial derivatives 7,939 5,281 50%
Fair value gain on financial derivatives 15 2,870 231 n.m
Profit before taxes 10,809 5,512 96%
Income tax expense 16 (1,628) (3,089) -47%
Profit from continuing operations 9,181 2,423 279%
Discontinued Operations
Profit after tax for the period from discontinued operations 1 - 8,243 n.m
Profit for the period attributable to Unitholders of the
Trust 9,181 10,666 -14%
Other Comprehensive Income
Items that may be reclassified subsequently to profit or loss
Foreign currency translation (5,471) (16,578) n.m
Other Comprehensive Income for the period, net of tax (5,471) (16,578) n.m
Total Comprehensive Income for the period attributable
to Unitholders of the Trust 3,710 (5,912) n.m
* Prior period figures have been restated to reflect the reclassification of Fortis Hospotel Limited (“FHTL”) in connection with the Disposal of51.0% economic interest in FHTL (the “Disposal”).
^ n.m – not meaningful.
2
1(a) Consolidated Statement of Comprehensive Income and Distributable Income Statement
(Cont’d)
Reconciliation to Unitholders Distributable Income
Notes FY 18 Q1 FY 17 Q1
(Restated)*
S$'000 S$'000
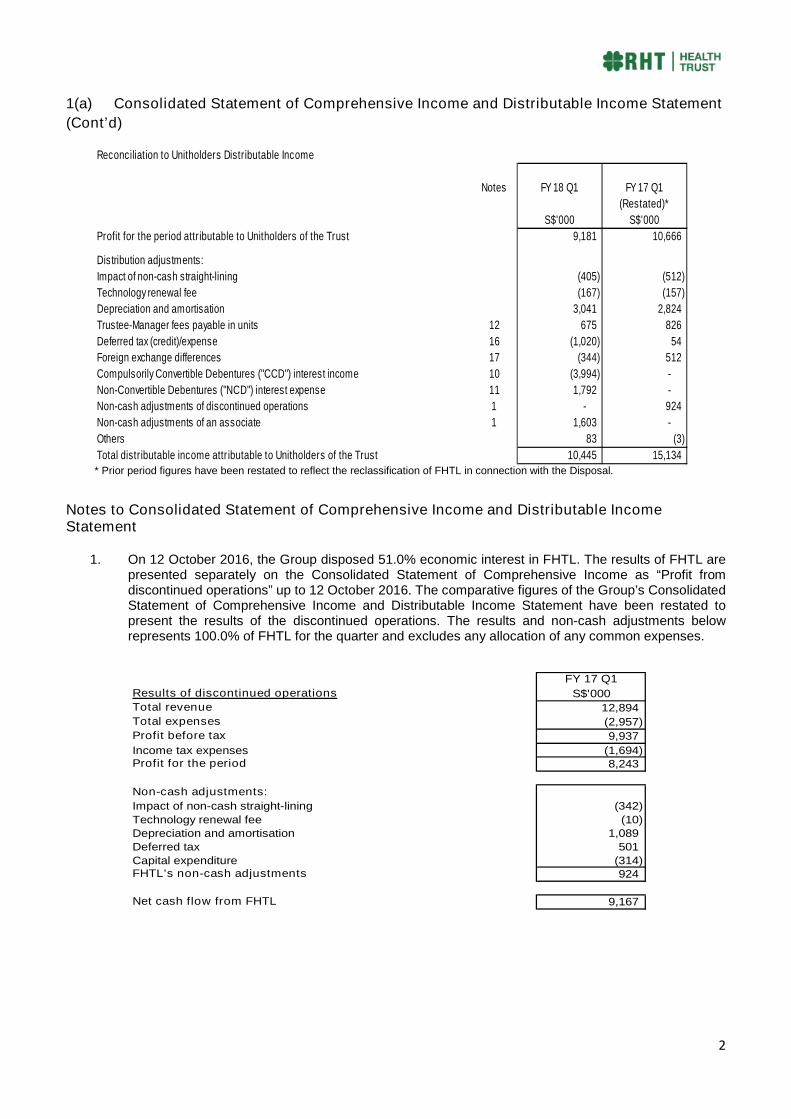
Profit for the period attributable to Unitholders of the Trust 9,181 10,666
Distribution adjustments:
Impact of non-cash straight-lining (405) (512)
Technology renewal fee (167) (157)
Depreciation and amortisation 3,041 2,824
Trustee-Manager fees payable in units 12 675 826
Deferred tax (credit)/expense 16 (1,020) 54
Foreign exchange differences 17 (344) 512
Compulsorily Convertible Debentures ("CCD") interest income 10 (3,994) -
Non-Convertible Debentures ("NCD") interest expense 11 1,792 -
Non-cash adjustments of discontinued operations 1 - 924
Non-cash adjustments of an associate 1 1,603 -
Others 83 (3)
Total distributable income attributable to Unitholders of the Trust 10,445 15,134* Prior period figures have been restated to reflect the reclassification of FHTL in connection with the Disposal.
Notes to Consolidated Statement of Comprehensive Income and Distributable IncomeStatement
1. On 12 October 2016, the Group disposed 51.0% economic interest in FHTL. The results of FHTL arepresented separately on the Consolidated Statement of Comprehensive Income as “Profit fromdiscontinued operations” up to 12 October 2016. The comparative figures of the Group’s ConsolidatedStatement of Comprehensive Income and Distributable Income Statement have been restated topresent the results of the discontinued operations. The results and non-cash adjustments belowrepresents 100.0% of FHTL for the quarter and excludes any allocation of any common expenses.
FY 17 Q1
Results of discontinued operations S$'000Total revenue 12,894Total expenses (2,957)Profit before tax 9,937
Income tax expenses (1,694)Profit for the period 8,243
Non-cash adjustments:
Impact of non-cash straight-lining (342)
Technology renewal fee (10)Depreciation and amortisation 1,089Deferred tax 501
Capital expenditure (314)FHTL's non-cash adjustments 924
Net cash flow from FHTL 9,167
3
Notes to Consolidated Statement of Comprehensive Income and Distributable Income
Statement (Cont’d)
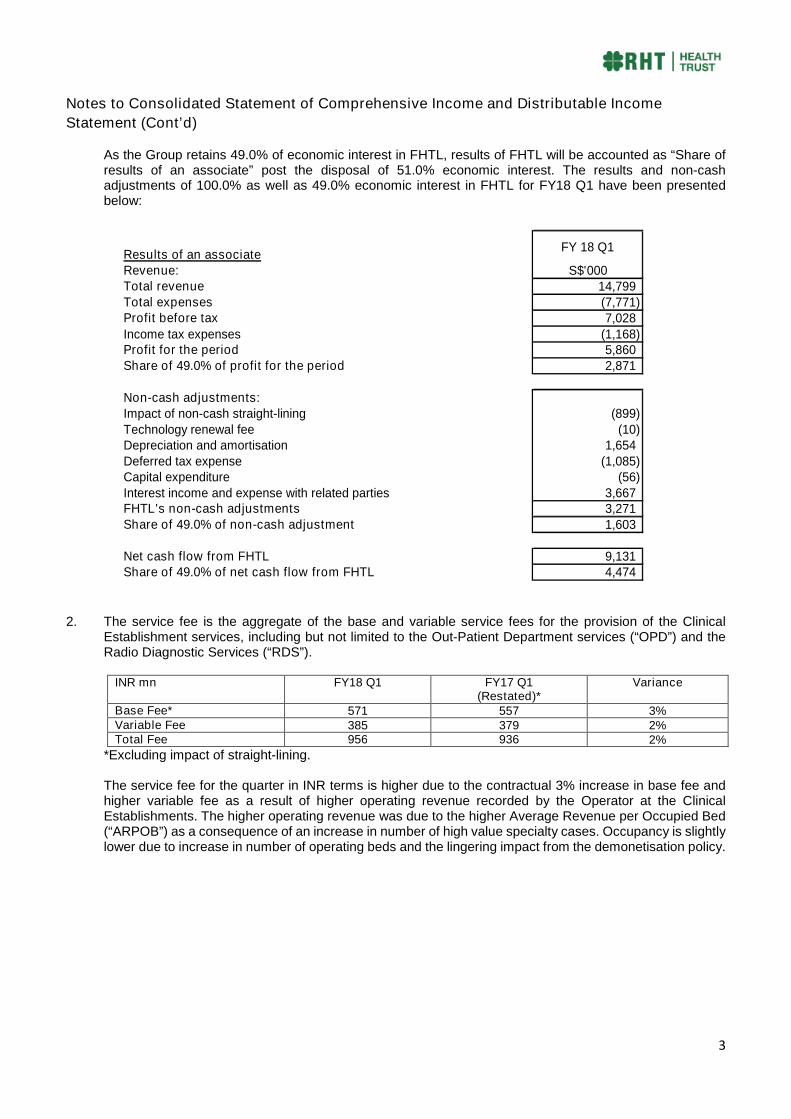
As the Group retains 49.0% of economic interest in FHTL, results of FHTL will be accounted as “Share ofresults of an associate” post the disposal of 51.0% economic interest. The results and non-cashadjustments of 100.0% as well as 49.0% economic interest in FHTL for FY18 Q1 have been presentedbelow:
Results of an associateFY 18 Q1
Revenue: S$'000Total revenue 14,799Total expenses (7,771)Profit before tax 7,028Income tax expenses (1,168)Profit for the period 5,860Share of 49.0% of profit for the period 2,871
Non-cash adjustments:Impact of non-cash straight-lining (899)Technology renewal fee (10)Depreciation and amortisation 1,654Deferred tax expense (1,085)Capital expenditure (56)Interest income and expense with related parties 3,667FHTL's non-cash adjustments 3,271Share of 49.0% of non-cash adjustment 1,603
Net cash flow from FHTL 9,131Share of 49.0% of net cash flow from FHTL 4,474
2. The service fee is the aggregate of the base and variable service fees for the provision of the ClinicalEstablishment services, including but not limited to the Out-Patient Department services (“OPD”) and theRadio Diagnostic Services (“RDS”).
INR mn FY18 Q1 FY17 Q1(Restated)*
Variance
Base Fee* 571 557 3%Variable Fee 385 379 2%Total Fee 956 936 2%
*Excluding impact of straight-lining.
The service fee for the quarter in INR terms is higher due to the contractual 3% increase in base fee andhigher variable fee as a result of higher operating revenue recorded by the Operator at the ClinicalEstablishments. The higher operating revenue was due to the higher Average Revenue per Occupied Bed(“ARPOB”) as a consequence of an increase in number of high value specialty cases. Occupancy is slightlylower due to increase in number of operating beds and the lingering impact from the demonetisation policy.
4
Notes to Consolidated Statement of Comprehensive Income and Distributable Income
Statement (Cont’d)
Note: The following notes do not include a performance analysis of FHTL. Please refer to paragraph 8 on page15 to 17 for FHTL’s performance analysis.
3. RHT has 2 Operating Hospitals, Bengaluru, Rajajinagar Operating Hospital and the Bengaluru, NagarbhaviOperating Hospital. The hospital income and expenses arise solely from the provision of medical servicesat these hospitals.
The lower net hospital income for the quarter in INR terms is attributed to lower ARPOB of INR 8.30 millionas compared to INR 8.47 million in FY17Q1. In addition, the personnel cost has increased due to revisedwages following annual inflationary wage increase. There was also an increase in housekeeping expensesfollowing an increase in purchases of housekeeping supplies before the implementation of Goods andServices Tax (“GST”), which took effect on 1 July 2017. The regulatory cap on coronary stent prices alsoaffected the net hospital income.
4. Other income includes income from pharmacy, cafeteria, bookshop, automated teller machines, and otheramenities in the Clinical Establishments of the Group. Higher other income for the quarter is contributed byrental income from a pharmacy in Mohali Clinical Establishment, subsequent to revised service feearrangement.
5. Medical consumables expense in INR terms was higher for the quarter following management’s decisionto increase the medical consumables purchase before the implementation of GST.
6. Employee benefits in INR terms for the quarter was higher than FY 17 due to an increase in headcountpost FY17 Q1 and annual inflationary wage increases.
7. Doctor charges in INR terms is higher against the corresponding quarter, which in line with the increase inthe variable fee, as a result of higher OPD revenue recorded in the Clinical Establishments as well as anincrease in the doctor headcounts in certain Clinical Establishments post FY 17 Q1.
8. Higher depreciation and amortisation for the quarter was a result of the revaluation of fixed assets at theend of 31 March 2017.
9. Other service fee expenses mainly consist of housekeeping costs, security costs, power and fuel expenses,annual equipment maintenance charges for both medical and non-medical equipment owned by RHTGroup, rent, property taxes and insurance, as well as administrative expenses. The increase in otherservice fee expenses for the quarter is mainly due to higher than expected annual maintenance cost dueto the aging of the equipment. In addition, provision were made for wear-and-tear of fixed assets.
10. At the time of initial public offering, interest bearing Compulsorily Convertible Debentures (“CCDs”) wereissued by entities in the RHT Group including, FHTL to one of the subsidiaries for the infusion of funds tocomplete the acquisition of the initial portfolio by RHT. As FHTL became an associate on 13 October 2016,such interest income of the subsidiary will no longer be eliminated. However, such CCD interest income iscorrespondingly recognised as CCD interest expense in the results of the associate and both the CCDinterest income and expense are added back for distribution purpose.
11. At the time of initial public offering, interest bearing Optionally Convertible Debentures (“OCDs”) wereissued by entities in the RHT Group including, one of the subsidiaries to FHTL for RHT Group’s internalfunding requirements. The OCDs were converted to Non-Convertible Debentures (“NCDs”) as part of thedisposal. As FHTL has become an associate, such interest expense of the subsidiary will no longer beeliminated. However, such NCD interest expense is correspondingly recognised as NCD interest incomein the results of the associate and both the NCD interest expense and income are added back fordistribution purpose.
Excluding the interest expense to a related party, the lower finance expense for the quarter was due to thereplacement of floating interest rate loan facilities with fixed rate bond of 4.5%.
5
Notes to Consolidated Statement of Comprehensive Income and Distributable Income
Statement (Cont’d)
12. The Trustee-Manager fee for the quarter is lower as compared to the corresponding periods due to thereduction in Net Asset Value and Distributable Income post the disposal of 51.0% of economic interest inFHTL.
13. The higher other trust expense relates to the legal and professional fees arising from the refinancingactivities in first quarter of FY18.
14. The foreign exchange differences are on the account of:(i) unrealised differences from interest receivables denominated in INR; and(ii) realised differences from the settlement of forward contracts and interest received.
The foreign exchange loss for the quarter arose from the depreciation in INR against SGD for the INRdenominated net receivables and realised loss from the settlement of forward contracts.
15. RHT Group has entered into forward contracts to manage its INR denominated cash flows from India. Theforward contracts are carried at fair value. The fair value gain recorded during the quarter was the result ofthe depreciation of the expected INR against SGD at the time of settlement compared to the contractedINR/SGD rate.
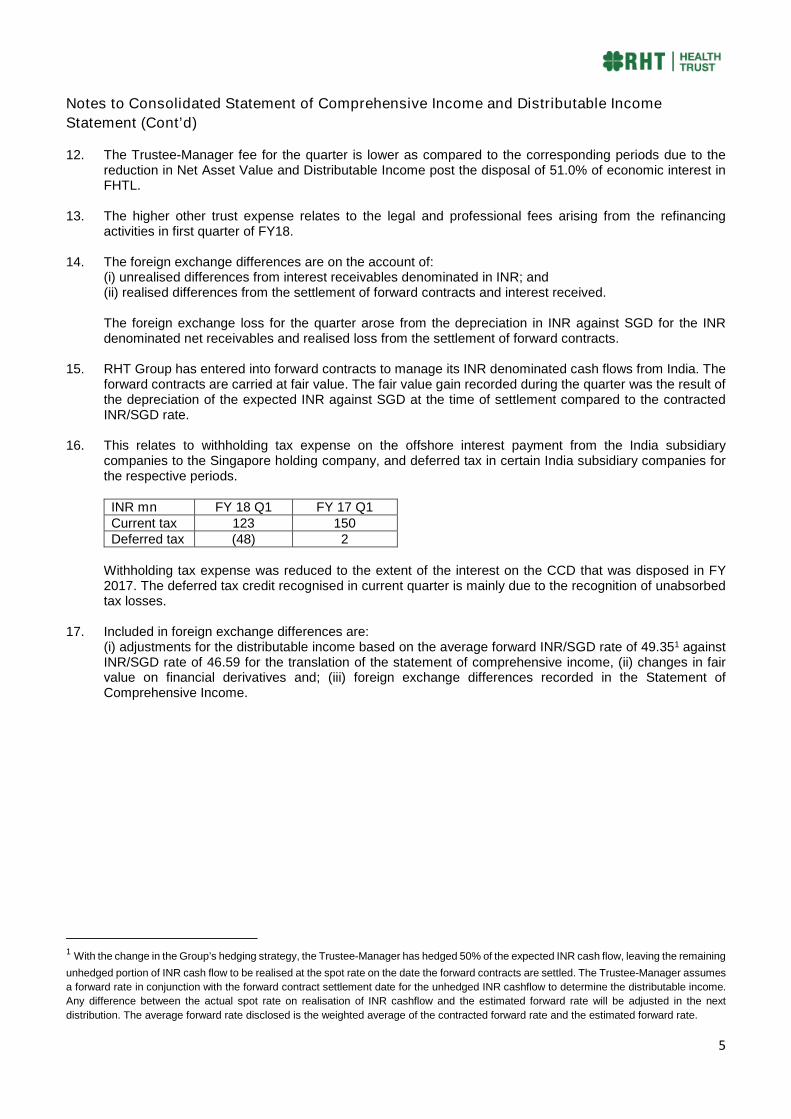
16. This relates to withholding tax expense on the offshore interest payment from the India subsidiarycompanies to the Singapore holding company, and deferred tax in certain India subsidiary companies forthe respective periods.
INR mn FY 18 Q1 FY 17 Q1Current tax 123 150Deferred tax (48) 2
Withholding tax expense was reduced to the extent of the interest on the CCD that was disposed in FY2017. The deferred tax credit recognised in current quarter is mainly due to the recognition of unabsorbedtax losses.
17. Included in foreign exchange differences are:(i) adjustments for the distributable income based on the average forward INR/SGD rate of 49.351 againstINR/SGD rate of 46.59 for the translation of the statement of comprehensive income, (ii) changes in fairvalue on financial derivatives and; (iii) foreign exchange differences recorded in the Statement ofComprehensive Income.
1 With the change in the Group’s hedging strategy, the Trustee-Manager has hedged 50% of the expected INR cash flow, leaving the remaining
unhedged portion of INR cash flow to be realised at the spot rate on the date the forward contracts are settled. The Trustee-Manager assumes
a forward rate in conjunction with the forward contract settlement date for the unhedged INR cashflow to determine the distributable income.
Any difference between the actual spot rate on realisation of INR cashflow and the estimated forward rate will be adjusted in the next
distribution. The average forward rate disclosed is the weighted average of the contracted forward rate and the estimated forward rate.
6
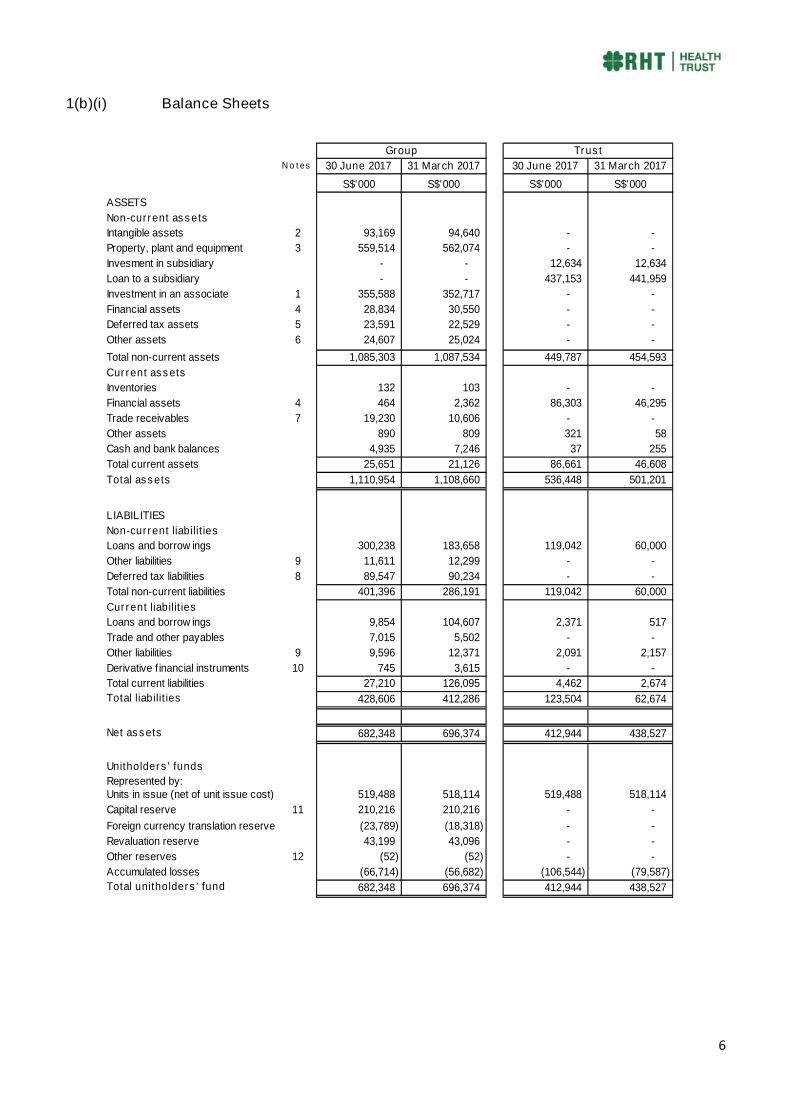
1(b)(i) Balance Sheets
N o tes 30 June 2017 31 March 2017 30 June 2017 31 March 2017
S$'000 S$'000 S$'000 S$'000
ASSETS
Non-current assets
Intangible assets 2 93,169 94,640 - -
Property, plant and equipment 3 559,514 562,074 - -
Invesment in subsidiary - - 12,634 12,634
Loan to a subsidiary - - 437,153 441,959
Investment in an associate 1 355,588 352,717 - -
Financial assets 4 28,834 30,550 - -
Deferred tax assets 5 23,591 22,529 - -
Other assets 6 24,607 25,024 - -
Total non-current assets 1,085,303 1,087,534 449,787 454,593
Current assets
Inventories 132 103 - -
Financial assets 4 464 2,362 86,303 46,295
Trade receivables 7 19,230 10,606 - -
Other assets 890 809 321 58
Cash and bank balances 4,935 7,246 37 255
Total current assets 25,651 21,126 86,661 46,608
Total assets 1,110,954 1,108,660 536,448 501,201
LIABILITIES
Non-current liabilities
Loans and borrow ings 300,238 183,658 119,042 60,000
Other liabilities 9 11,611 12,299 - -
Deferred tax liabilities 8 89,547 90,234 - -
Total non-current liabilities 401,396 286,191 119,042 60,000
Current liabilities
Loans and borrow ings 9,854 104,607 2,371 517
Trade and other payables 7,015 5,502 - -
Other liabilities 9 9,596 12,371 2,091 2,157
Derivative financial instruments 10 745 3,615 - -
Total current liabilities 27,210 126,095 4,462 2,674
Total liabilities 428,606 412,286 123,504 62,674
Net assets 682,348 696,374 412,944 438,527
Unitholders' funds
Represented by:Units in issue (net of unit issue cost) 519,488 518,114 519,488 518,114
Capital reserve 11 210,216 210,216 - -
Foreign currency translation reserve (23,789) (18,318) - -
Revaluation reserve 43,199 43,096 - -
Other reserves 12 (52) (52) - -
Accumulated losses (66,714) (56,682) (106,544) (79,587)
Total unitholders' fund 682,348 696,374 412,944 438,527
- - - -
Group Trust
7
1(b)(i) Balance Sheets (Cont’d)
Notes to Balance Sheets
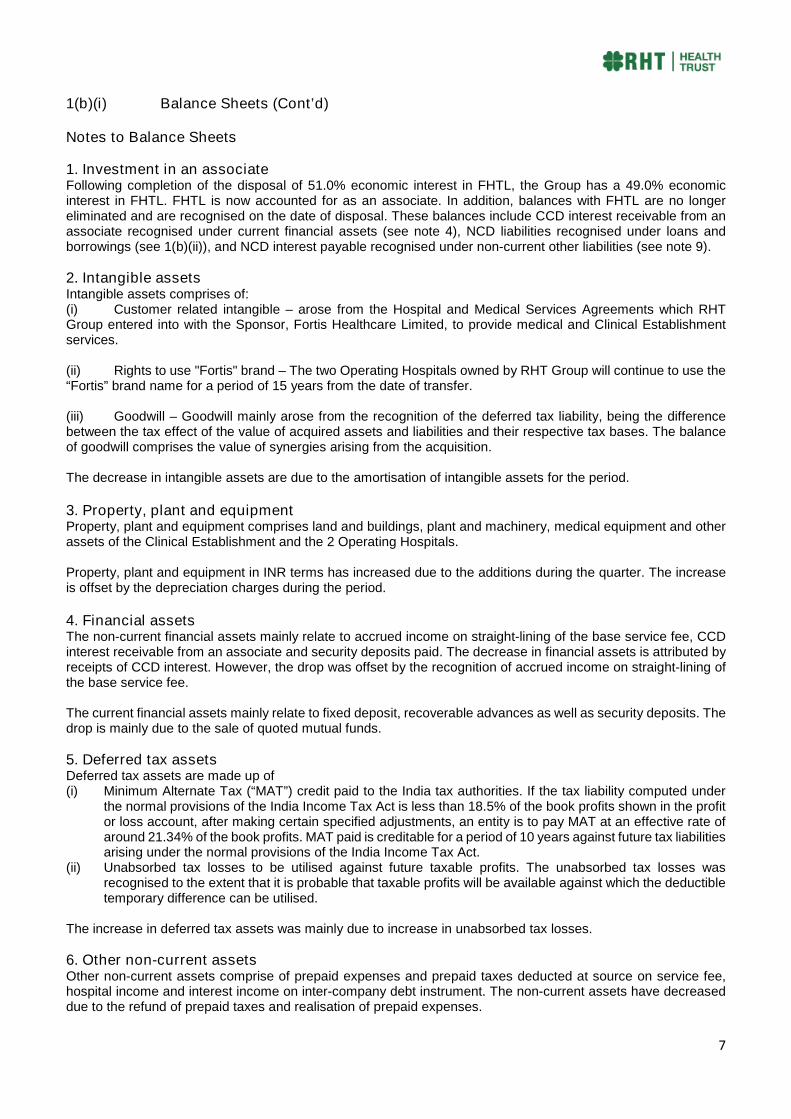
1. Investment in an associateFollowing completion of the disposal of 51.0% economic interest in FHTL, the Group has a 49.0% economicinterest in FHTL. FHTL is now accounted for as an associate. In addition, balances with FHTL are no longereliminated and are recognised on the date of disposal. These balances include CCD interest receivable from anassociate recognised under current financial assets (see note 4), NCD liabilities recognised under loans andborrowings (see 1(b)(ii)), and NCD interest payable recognised under non-current other liabilities (see note 9).
2. Intangible assetsIntangible assets comprises of:(i) Customer related intangible – arose from the Hospital and Medical Services Agreements which RHTGroup entered into with the Sponsor, Fortis Healthcare Limited, to provide medical and Clinical Establishmentservices.
(ii) Rights to use "Fortis" brand – The two Operating Hospitals owned by RHT Group will continue to use the“Fortis” brand name for a period of 15 years from the date of transfer.
(iii) Goodwill – Goodwill mainly arose from the recognition of the deferred tax liability, being the differencebetween the tax effect of the value of acquired assets and liabilities and their respective tax bases. The balanceof goodwill comprises the value of synergies arising from the acquisition.
The decrease in intangible assets are due to the amortisation of intangible assets for the period.
3. Property, plant and equipmentProperty, plant and equipment comprises land and buildings, plant and machinery, medical equipment and otherassets of the Clinical Establishment and the 2 Operating Hospitals.
Property, plant and equipment in INR terms has increased due to the additions during the quarter. The increaseis offset by the depreciation charges during the period.
4. Financial assetsThe non-current financial assets mainly relate to accrued income on straight-lining of the base service fee, CCDinterest receivable from an associate and security deposits paid. The decrease in financial assets is attributed byreceipts of CCD interest. However, the drop was offset by the recognition of accrued income on straight-lining ofthe base service fee.
The current financial assets mainly relate to fixed deposit, recoverable advances as well as security deposits. Thedrop is mainly due to the sale of quoted mutual funds.
5. Deferred tax assetsDeferred tax assets are made up of(i) Minimum Alternate Tax (“MAT”) credit paid to the India tax authorities. If the tax liability computed under
the normal provisions of the India Income Tax Act is less than 18.5% of the book profits shown in the profitor loss account, after making certain specified adjustments, an entity is to pay MAT at an effective rate ofaround 21.34% of the book profits. MAT paid is creditable for a period of 10 years against future tax liabilitiesarising under the normal provisions of the India Income Tax Act.
(ii) Unabsorbed tax losses to be utilised against future taxable profits. The unabsorbed tax losses wasrecognised to the extent that it is probable that taxable profits will be available against which the deductibletemporary difference can be utilised.
The increase in deferred tax assets was mainly due to increase in unabsorbed tax losses.
6. Other non-current assetsOther non-current assets comprise of prepaid expenses and prepaid taxes deducted at source on service fee,hospital income and interest income on inter-company debt instrument. The non-current assets have decreaseddue to the refund of prepaid taxes and realisation of prepaid expenses.
8
1(b)(i) Balance Sheets (Cont’d)
Notes to Balance Sheets (Cont’d)
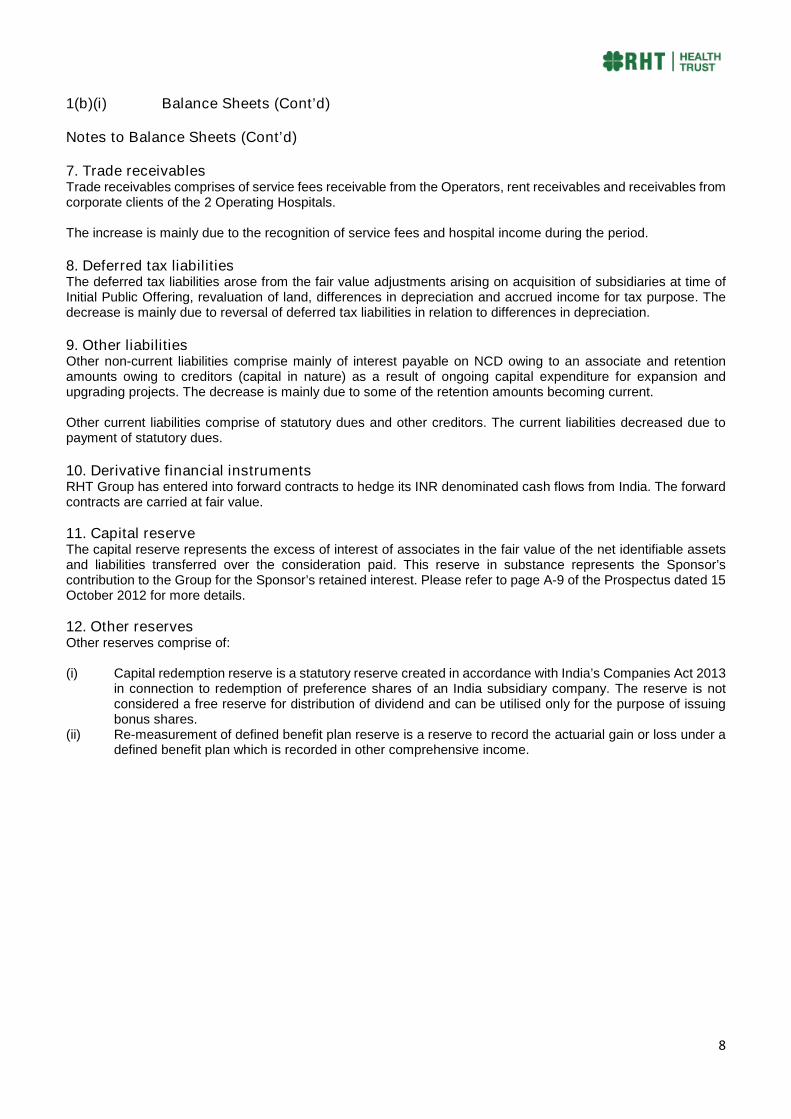
7. Trade receivablesTrade receivables comprises of service fees receivable from the Operators, rent receivables and receivables fromcorporate clients of the 2 Operating Hospitals.
The increase is mainly due to the recognition of service fees and hospital income during the period.
8. Deferred tax liabilitiesThe deferred tax liabilities arose from the fair value adjustments arising on acquisition of subsidiaries at time ofInitial Public Offering, revaluation of land, differences in depreciation and accrued income for tax purpose. Thedecrease is mainly due to reversal of deferred tax liabilities in relation to differences in depreciation.
9. Other liabilitiesOther non-current liabilities comprise mainly of interest payable on NCD owing to an associate and retentionamounts owing to creditors (capital in nature) as a result of ongoing capital expenditure for expansion andupgrading projects. The decrease is mainly due to some of the retention amounts becoming current.
Other current liabilities comprise of statutory dues and other creditors. The current liabilities decreased due topayment of statutory dues.
10. Derivative financial instrumentsRHT Group has entered into forward contracts to hedge its INR denominated cash flows from India. The forwardcontracts are carried at fair value.
11. Capital reserveThe capital reserve represents the excess of interest of associates in the fair value of the net identifiable assetsand liabilities transferred over the consideration paid. This reserve in substance represents the Sponsor’scontribution to the Group for the Sponsor’s retained interest. Please refer to page A-9 of the Prospectus dated 15October 2012 for more details.
12. Other reservesOther reserves comprise of:
(i) Capital redemption reserve is a statutory reserve created in accordance with India’s Companies Act 2013in connection to redemption of preference shares of an India subsidiary company. The reserve is notconsidered a free reserve for distribution of dividend and can be utilised only for the purpose of issuingbonus shares.
(ii) Re-measurement of defined benefit plan reserve is a reserve to record the actuarial gain or loss under adefined benefit plan which is recorded in other comprehensive income.
9
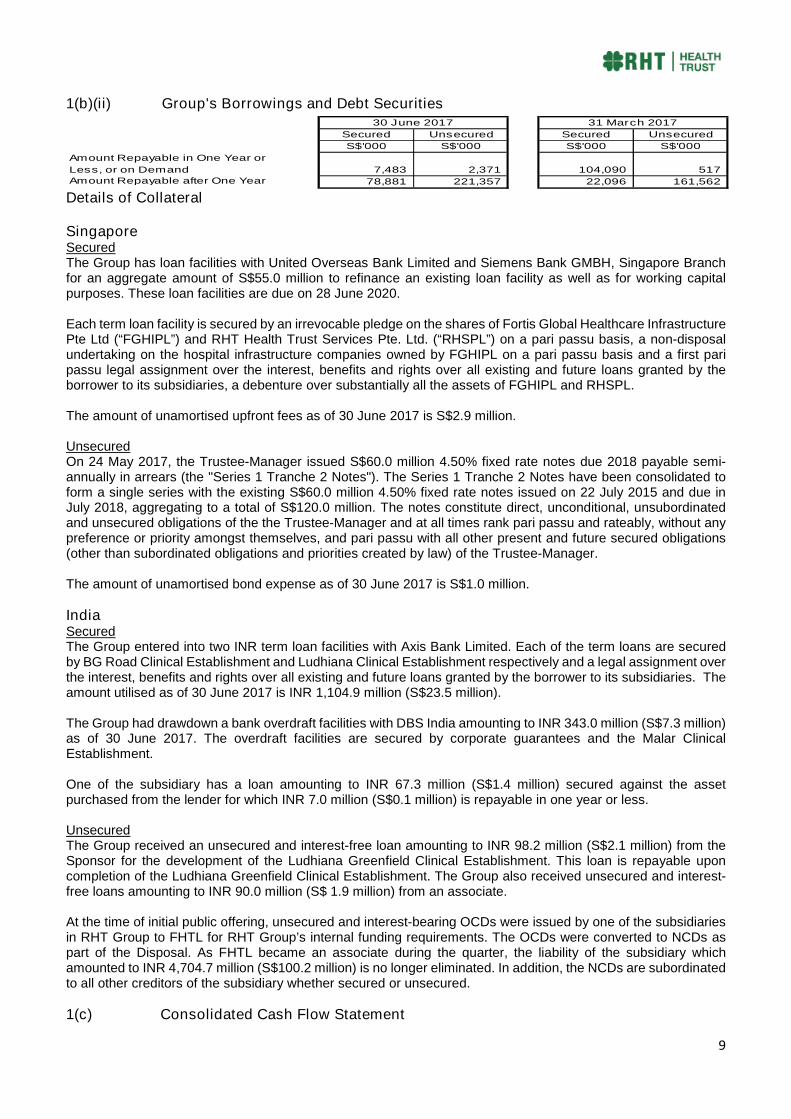
1(b)(ii) Group's Borrowings and Debt Securities
Secured Unsecured Secured Unsecured
S$'000 S$'000 S$'000 S$'000
Amount Repayable in One Year or
Less, or on Demand 7,483 2,371 104,090 517Amount Repayable after One Year 78,881 221,357 22,096 161,562
30 June 2017 31 March 2017
Details of Collateral
SingaporeSecuredThe Group has loan facilities with United Overseas Bank Limited and Siemens Bank GMBH, Singapore Branchfor an aggregate amount of S$55.0 million to refinance an existing loan facility as well as for working capitalpurposes. These loan facilities are due on 28 June 2020.
Each term loan facility is secured by an irrevocable pledge on the shares of Fortis Global Healthcare InfrastructurePte Ltd (“FGHIPL”) and RHT Health Trust Services Pte. Ltd. (“RHSPL”) on a pari passu basis, a non-disposalundertaking on the hospital infrastructure companies owned by FGHIPL on a pari passu basis and a first paripassu legal assignment over the interest, benefits and rights over all existing and future loans granted by theborrower to its subsidiaries, a debenture over substantially all the assets of FGHIPL and RHSPL.
The amount of unamortised upfront fees as of 30 June 2017 is S$2.9 million.
UnsecuredOn 24 May 2017, the Trustee-Manager issued S$60.0 million 4.50% fixed rate notes due 2018 payable semi-annually in arrears (the "Series 1 Tranche 2 Notes"). The Series 1 Tranche 2 Notes have been consolidated toform a single series with the existing S$60.0 million 4.50% fixed rate notes issued on 22 July 2015 and due inJuly 2018, aggregating to a total of S$120.0 million. The notes constitute direct, unconditional, unsubordinatedand unsecured obligations of the the Trustee-Manager and at all times rank pari passu and rateably, without anypreference or priority amongst themselves, and pari passu with all other present and future secured obligations(other than subordinated obligations and priorities created by law) of the Trustee-Manager.
The amount of unamortised bond expense as of 30 June 2017 is S$1.0 million.
IndiaSecuredThe Group entered into two INR term loan facilities with Axis Bank Limited. Each of the term loans are securedby BG Road Clinical Establishment and Ludhiana Clinical Establishment respectively and a legal assignment overthe interest, benefits and rights over all existing and future loans granted by the borrower to its subsidiaries. Theamount utilised as of 30 June 2017 is INR 1,104.9 million (S$23.5 million).
The Group had drawdown a bank overdraft facilities with DBS India amounting to INR 343.0 million (S$7.3 million)as of 30 June 2017. The overdraft facilities are secured by corporate guarantees and the Malar ClinicalEstablishment.
One of the subsidiary has a loan amounting to INR 67.3 million (S$1.4 million) secured against the assetpurchased from the lender for which INR 7.0 million (S$0.1 million) is repayable in one year or less.
UnsecuredThe Group received an unsecured and interest-free loan amounting to INR 98.2 million (S$2.1 million) from theSponsor for the development of the Ludhiana Greenfield Clinical Establishment. This loan is repayable uponcompletion of the Ludhiana Greenfield Clinical Establishment. The Group also received unsecured and interest-free loans amounting to INR 90.0 million (S$ 1.9 million) from an associate.
At the time of initial public offering, unsecured and interest-bearing OCDs were issued by one of the subsidiariesin RHT Group to FHTL for RHT Group’s internal funding requirements. The OCDs were converted to NCDs aspart of the Disposal. As FHTL became an associate during the quarter, the liability of the subsidiary whichamounted to INR 4,704.7 million (S$100.2 million) is no longer eliminated. In addition, the NCDs are subordinatedto all other creditors of the subsidiary whether secured or unsecured.
1(c) Consolidated Cash Flow Statement
10
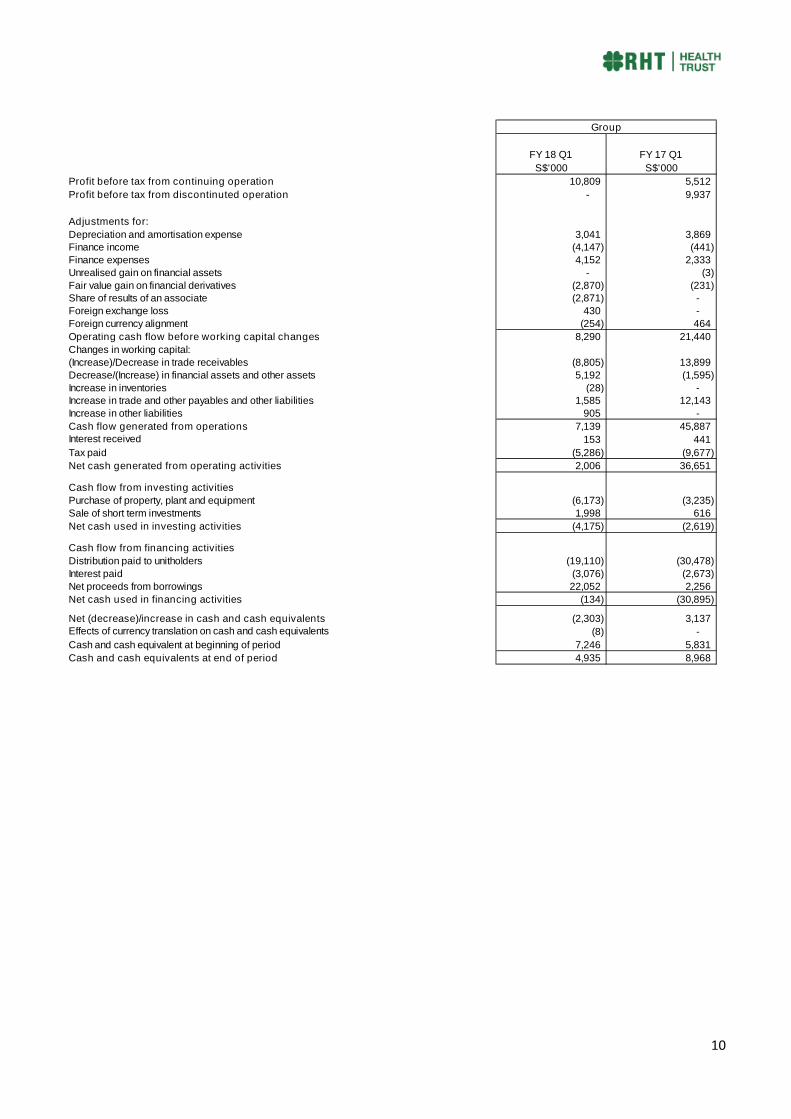
FY 18 Q1 FY 17 Q1
S$'000 S$'000
Profit before tax from continuing operation 10,809 5,512
Profit before tax from discontinuted operation - 9,937
Adjustments for:
Depreciation and amortisation expense 3,041 3,869Finance income (4,147) (441)
Finance expenses 4,152 2,333
Unrealised gain on financial assets - (3)
Fair value gain on financial derivatives (2,870) (231)Share of results of an associate (2,871) -
Foreign exchange loss 430 -
Foreign currency alignment (254) 464
Operating cash flow before working capital changes 8,290 21,440
Changes in working capital:
(Increase)/Decrease in trade receivables (8,805) 13,899
Decrease/(Increase) in financial assets and other assets 5,192 (1,595)
Increase in inventories (28) -Increase in trade and other payables and other liabilities 1,585 12,143
Increase in other liabilities 905 -
Cash flow generated from operations 7,139 45,887Interest received 153 441
Tax paid (5,286) (9,677)
Net cash generated from operating activities 2,006 36,651
Cash flow from investing activities
Purchase of property, plant and equipment (6,173) (3,235)
Sale of short term investments 1,998 616
Net cash used in investing activities (4,175) (2,619)
Cash flow from financing activities
Distribution paid to unitholders (19,110) (30,478)
Interest paid (3,076) (2,673)
Net proceeds from borrowings 22,052 2,256
Net cash used in financing activities (134) (30,895)
Net (decrease)/increase in cash and cash equivalents (2,303) 3,137Effects of currency translation on cash and cash equivalents (8) -
Cash and cash equivalent at beginning of period 7,246 5,831
Cash and cash equivalents at end of period 4,935 8,968
Group
11
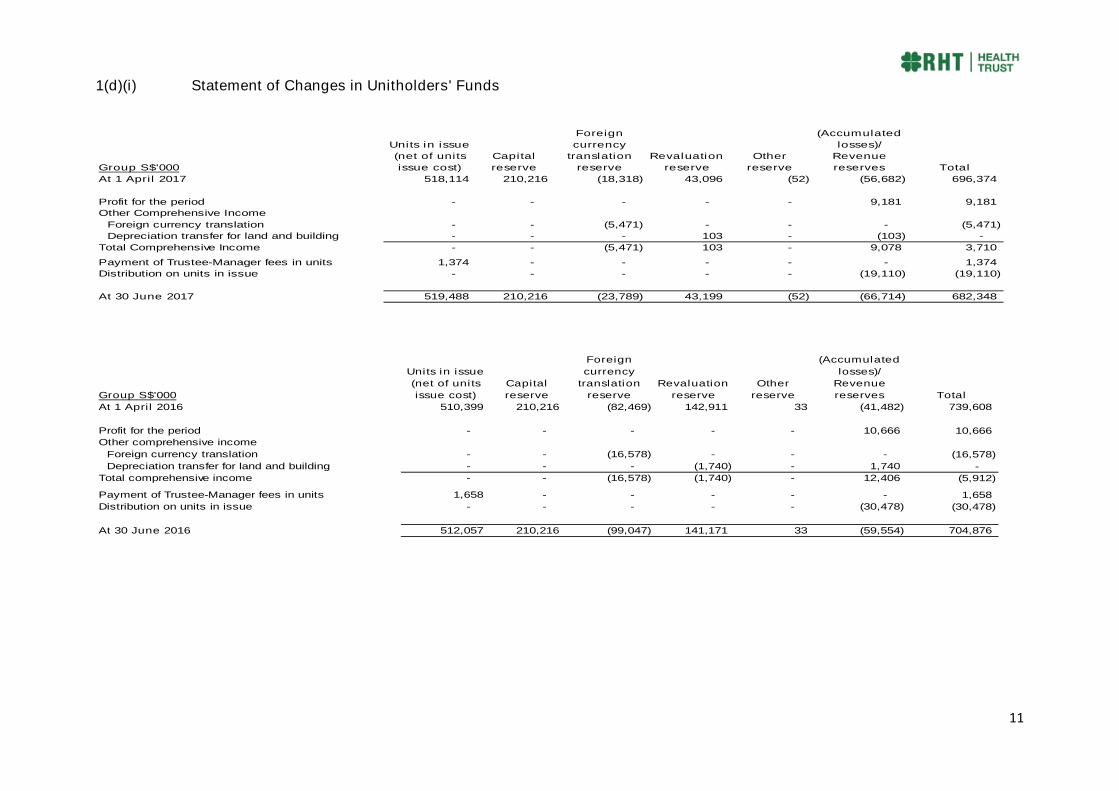
1(d)(i) Statement of Changes in Unitholders' Funds
Group S$'000
Units in issue
(net of units
issue cost)
Capital
reserve
Foreign
currency
translation
reserve
Revaluation
reserve
Other
reserve
(Accumulated
losses)/
Revenue
reserves Total
At 1 April 2017 518,114 210,216 (18,318) 43,096 (52) (56,682) 696,374
Profit for the period - - - - - 9,181 9,181
Other Comprehensive Income
Foreign currency translation - - (5,471) - - - (5,471)
Depreciation transfer for land and building - - - 103 - (103) -
Total Comprehensive Income - - (5,471) 103 - 9,078 3,710
Payment of Trustee-Manager fees in units 1,374 - - - - - 1,374
Distribution on units in issue - - - - - (19,110) (19,110)
At 30 June 2017 519,488 210,216 (23,789) 43,199 (52) (66,714) 682,348
Group S$'000
Units in issue
(net of units
issue cost)
Capital
reserve
Foreign
currency
translation
reserve
Revaluation
reserve
Other
reserve
(Accumulated
losses)/
Revenue
reserves Total
At 1 April 2016 510,399 210,216 (82,469) 142,911 33 (41,482) 739,608
Profit for the period - - - - - 10,666 10,666
Other comprehensive income
Foreign currency translation - - (16,578) - - - (16,578)
Depreciation transfer for land and building - - - (1,740) - 1,740 -
Total comprehensive income - - (16,578) (1,740) - 12,406 (5,912)
Payment of Trustee-Manager fees in units 1,658 - - - - - 1,658
Distribution on units in issue - - - - - (30,478) (30,478)
At 30 June 2016 512,057 210,216 (99,047) 141,171 33 (59,554) 704,876
12
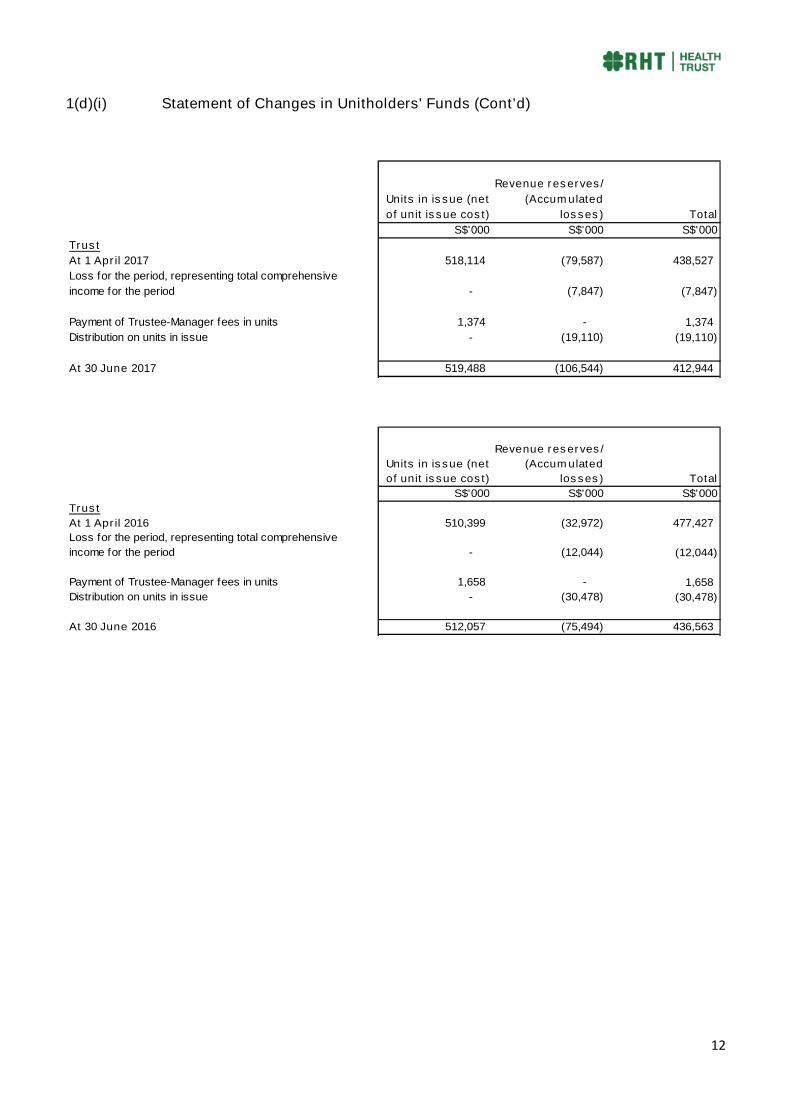
1(d)(i) Statement of Changes in Unitholders' Funds (Cont’d)
Units in issue (net
of unit issue cost)
Revenue reserves/
(Accumulated
losses) Total
S$'000 S$'000 S$'000
Trust
At 1 April 2017 518,114 (79,587) 438,527
Loss for the period, representing total comprehensive
income for the period - (7,847) (7,847)
Payment of Trustee-Manager fees in units 1,374 - 1,374
Distribution on units in issue - (19,110) (19,110)
At 30 June 2017 519,488 (106,544) 412,944
Units in issue (net
of unit issue cost)
Revenue reserves/
(Accumulated
losses) Total
S$'000 S$'000 S$'000
Trust
At 1 April 2016 510,399 (32,972) 477,427
Loss for the period, representing total comprehensive
income for the period - (12,044) (12,044)
Payment of Trustee-Manager fees in units 1,658 - 1,658
Distribution on units in issue - (30,478) (30,478)
At 30 June 2016 512,057 (75,494) 436,563
13
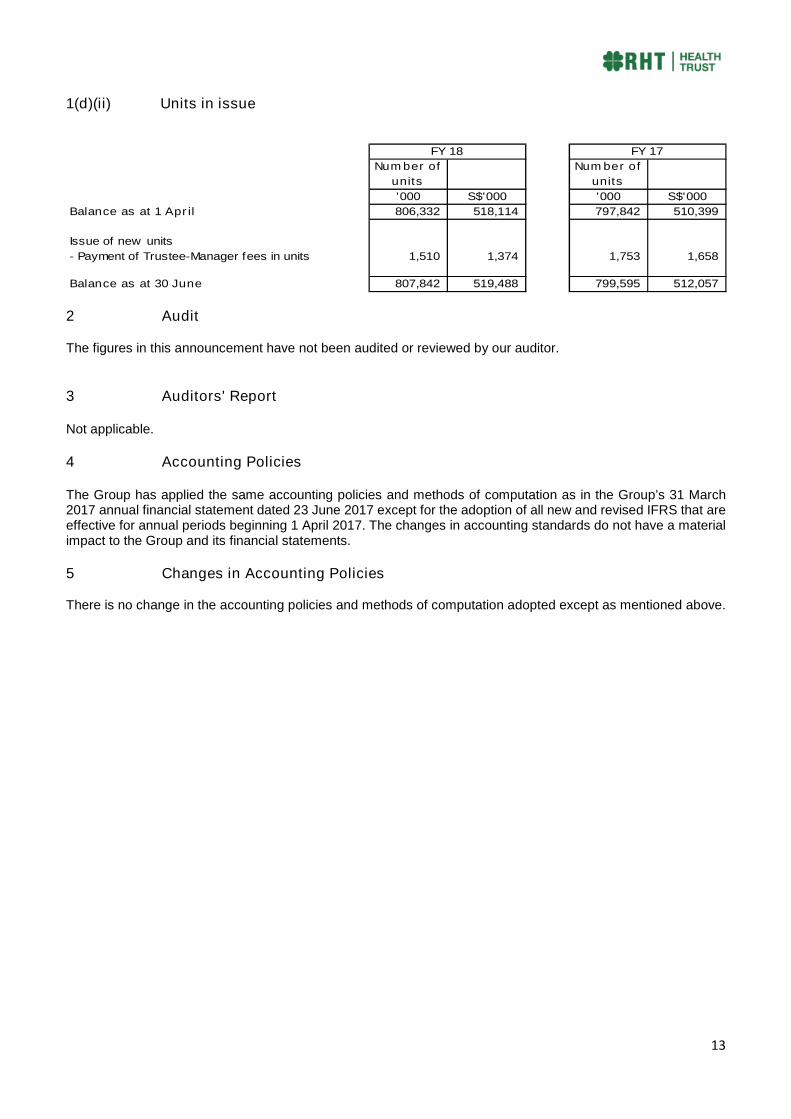
1(d)(ii) Units in issue
Number of
units
Number of
units
'000 S$'000 '000 S$'000
Balance as at 1 April 806,332 518,114 797,842 510,399
Issue of new units
- Payment of Trustee-Manager fees in units 1,510 1,374 1,753 1,658
Balance as at 30 June 807,842 519,488 799,595 512,057
FY 18 FY 17
2 Audit
The figures in this announcement have not been audited or reviewed by our auditor.
3 Auditors' Report
Not applicable.
4 Accounting Policies
The Group has applied the same accounting policies and methods of computation as in the Group’s 31 March2017 annual financial statement dated 23 June 2017 except for the adoption of all new and revised IFRS that areeffective for annual periods beginning 1 April 2017. The changes in accounting standards do not have a materialimpact to the Group and its financial statements.
5 Changes in Accounting Policies
There is no change in the accounting policies and methods of computation adopted except as mentioned above.
14
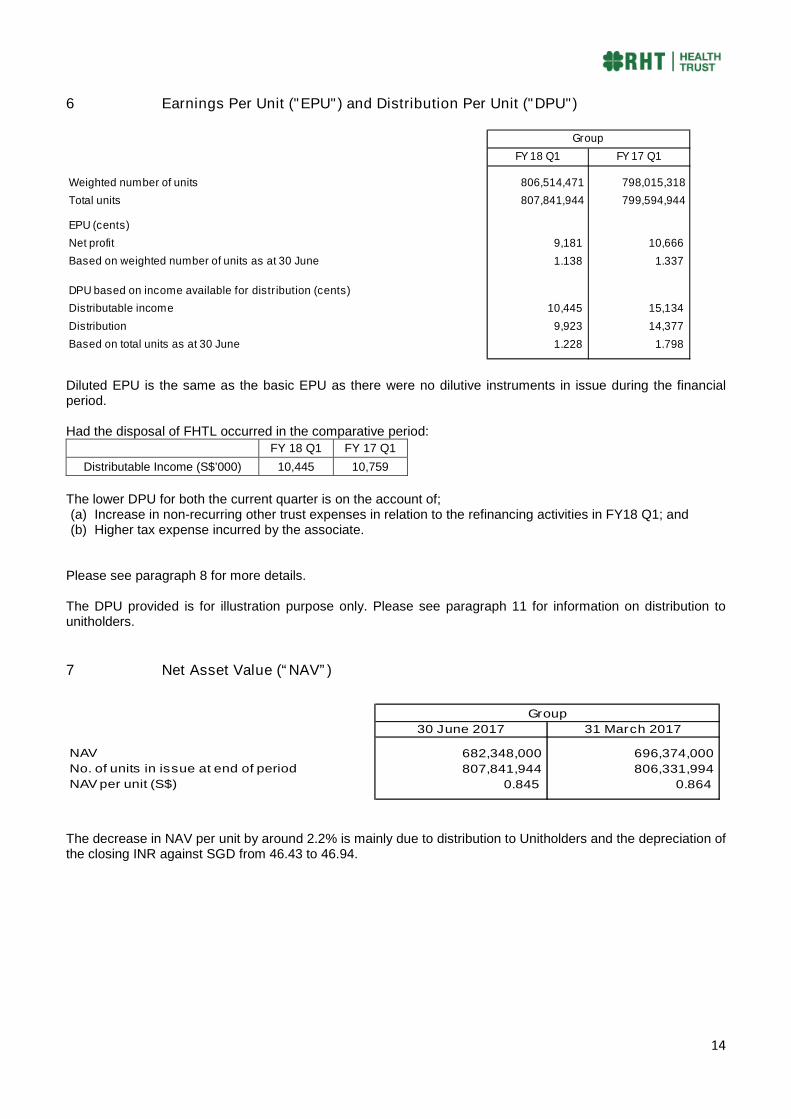
6 Earnings Per Unit ("EPU") and Distribution Per Unit ("DPU")
FY 18 Q1 FY 17 Q1
Weighted number of units 806,514,471 798,015,318
Total units 807,841,944 799,594,944
EPU (cents)
Net profit 9,181 10,666
Based on weighted number of units as at 30 June 1.138 1.337
DPU based on income available for distribution (cents)
Distributable income 10,445 15,134
Distribution 9,923 14,377
Based on total units as at 30 June 1.228 1.798
Group
Diluted EPU is the same as the basic EPU as there were no dilutive instruments in issue during the financialperiod.
Had the disposal of FHTL occurred in the comparative period:FY 18 Q1 FY 17 Q1
Distributable Income (S$’000) 10,445 10,759
The lower DPU for both the current quarter is on the account of;(a) Increase in non-recurring other trust expenses in relation to the refinancing activities in FY18 Q1; and(b) Higher tax expense incurred by the associate.
Please see paragraph 8 for more details.
The DPU provided is for illustration purpose only. Please see paragraph 11 for information on distribution tounitholders.
7 Net Asset Value (“NAV”)
30 June 2017 31 March 2017
NAV 682,348,000 696,374,000
No. of units in issue at end of period 807,841,944 806,331,994
NAV per unit (S$) 0.845 0.864
Group
The decrease in NAV per unit by around 2.2% is mainly due to distribution to Unitholders and the depreciation ofthe closing INR against SGD from 46.43 to 46.94.
15
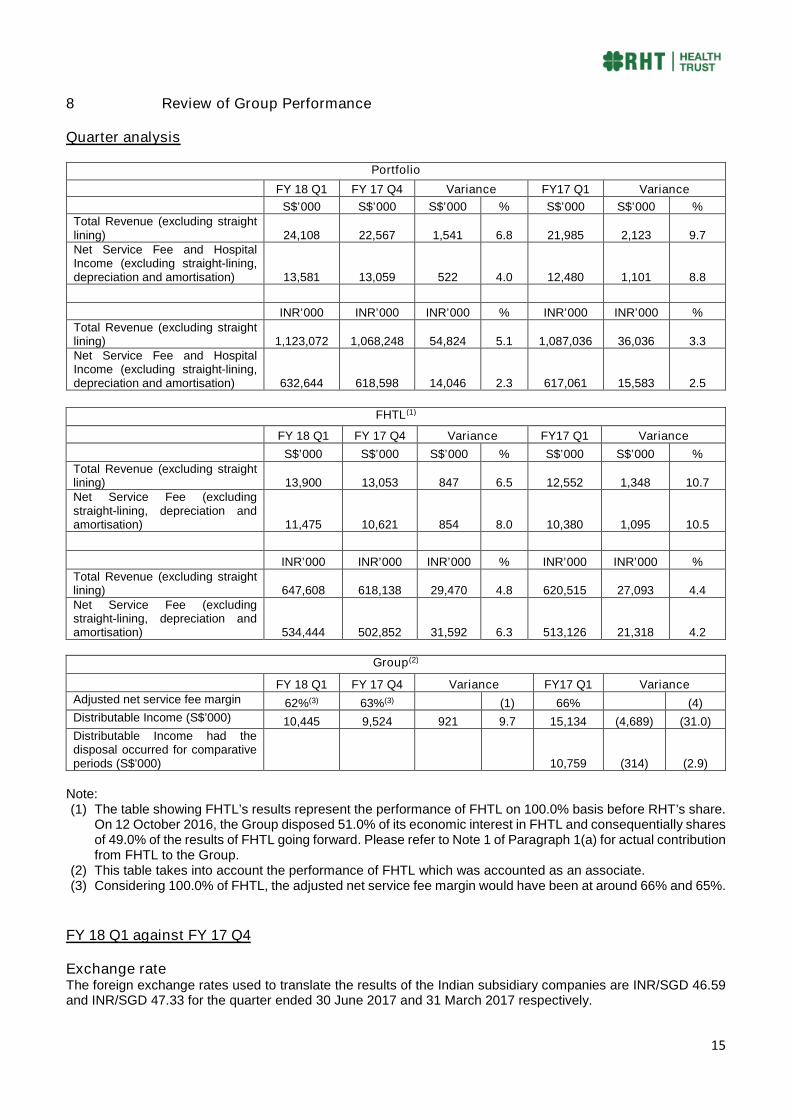
8 Review of Group Performance
Quarter analysis
Portfolio
FY 18 Q1 FY 17 Q4 Variance FY17 Q1 Variance
S$’000 S$’000 S$’000 % S$’000 S$’000 %Total Revenue (excluding straightlining) 24,108 22,567 1,541 6.8 21,985 2,123 9.7Net Service Fee and HospitalIncome (excluding straight-lining,depreciation and amortisation) 13,581 13,059 522 4.0 12,480 1,101 8.8
INR’000 INR’000 INR’000 % INR’000 INR’000 %Total Revenue (excluding straightlining) 1,123,072 1,068,248 54,824 5.1 1,087,036 36,036 3.3Net Service Fee and HospitalIncome (excluding straight-lining,depreciation and amortisation) 632,644 618,598 14,046 2.3 617,061 15,583 2.5
FHTL(1)
FY 18 Q1 FY 17 Q4 Variance FY17 Q1 Variance
S$’000 S$’000 S$’000 % S$’000 S$’000 %Total Revenue (excluding straightlining) 13,900 13,053 847 6.5 12,552 1,348 10.7Net Service Fee (excludingstraight-lining, depreciation andamortisation) 11,475 10,621 854 8.0 10,380 1,095 10.5
INR’000 INR’000 INR’000 % INR’000 INR’000 %Total Revenue (excluding straightlining) 647,608 618,138 29,470 4.8 620,515 27,093 4.4Net Service Fee (excludingstraight-lining, depreciation andamortisation) 534,444 502,852 31,592 6.3 513,126 21,318 4.2
Group(2)
FY 18 Q1 FY 17 Q4 Variance FY17 Q1 VarianceAdjusted net service fee margin 62%(3) 63%(3) (1) 66% (4)Distributable Income (S$’000) 10,445 9,524 921 9.7 15,134 (4,689) (31.0)Distributable Income had thedisposal occurred for comparativeperiods (S$’000) 10,759 (314) (2.9)
Note:(1) The table showing FHTL’s results represent the performance of FHTL on 100.0% basis before RHT’s share.
On 12 October 2016, the Group disposed 51.0% of its economic interest in FHTL and consequentially sharesof 49.0% of the results of FHTL going forward. Please refer to Note 1 of Paragraph 1(a) for actual contributionfrom FHTL to the Group.
(2) This table takes into account the performance of FHTL which was accounted as an associate.(3) Considering 100.0% of FHTL, the adjusted net service fee margin would have been at around 66% and 65%.
FY 18 Q1 against FY 17 Q4
Exchange rateThe foreign exchange rates used to translate the results of the Indian subsidiary companies are INR/SGD 46.59and INR/SGD 47.33 for the quarter ended 30 June 2017 and 31 March 2017 respectively.
16
8 Review of Group’s Performance (Cont’d)
Total RevenueTotal Revenue for FY 18 Q1 in INR terms is higher than FY 17 Q4 mainly due to the contractual 3% increase inbase fees and higher variable fees resulting from higher revenue recorded by the Operator at the ClinicalEstablishments. The higher variable fees is evident by higher ARPOB contributed by the increase in specialtycases. The occupancy for the quarter had remained consistent despite anincrease in operating beds, resultingfrom increase in occupied beds as the healthcare market has slowly recovered from the demonetisation policyintroduced by the India government in November 2016. However, there are still some lingering impact from thedemonetisation policy.
Net Service Fee and Hospital Income (excluding straight-lining, depreciation and amortisation)Net Service Fee and Hospital Income (excluding straight-lining, depreciation and amortisation) increased by 2.3%in INR terms due to an increase in total revenue. However, the margin was slightly lower because of an increasein purchase of medical consumables before the implementation of GST, a higher than expected increase in annualmaintenance cost due to the aging of equipment and provision made for wear-and-tear of fixed assets. The currentquarter margin is consistent with last financial year-to-date margin.
Contribution from FHTLNet Service Fee from FHTL increased against FY17 Q4 mainly due to higher total revenue recorded. The increasein revenue is a combination of the contractual 3% increase in base fees and higher variable fees. The highervariable fee is a result of higher ARPOB and occupancy arising from an increase in specialty cases and recoveryfrom the effect of the demonetisation policy.
Distributable IncomeDistributable Income is higher compared to trailing quarter due to improvements in the forward rate from 52.03 to49.35, higher net service fee and hospital income as well as contribution from FHTL. The increase is offset bynon-recurring other trust expenses in connection with the refinancing activities during the quarter and higher taxexpense incurred by the associate.
FY 18 Q1 against FY 17 Q1
Exchange rateThe foreign exchange rates used to translate the results of the Indian subsidiary companies are SGD/INR 46.59and SGD/INR 49.44 for the quarter 30 June 2017 and 30 June 2016 respectively.
Total RevenueTotal revenue for FY 18 Q1 in INR terms has increased by 3% against FY 17 Q1. This is due to the contractual3% increase in base fee, higher variable fee as a result of higher operating revenue recorded by Fortis as well asthe increase in other income. The higher operating revenue is evident by the increase in ARPOB arising from theincrease in number of specialty cases. Occupancy is slightly lower resulting from the increase in number ofoperating beds and the lingering impact from the demonetisation policy.
Net Service Fee and Hospital Income (excluding straight-lining, depreciation and amortisation)Net Service Fee and Hospital Income (excluding straight-lining, depreciation and amortisation) has increased by2.5% in INR terms as compared to FY17 Q1. The increase is contributed by increase in revenue. The net servicefee margin had remained fairly consistent with FY17 Q1 even though there were increased costs attributed to theincrease in purchase of medical consumables before the implementation of GST, a higher than expected increasein annual maintenance cost due to the aging of equipment and provision were made for wear-and-tear of fixedassets.
Contribution from FHTLNet Service Fee from FHTL increased against FY17 Q1 due to higher total revenue recorded. The increase inrevenue is a combination of the contractual 3% increase in base fees and higher variable fees. The higher variablefee is a result of higher ARPOB and occupancy arising from an increase in specialty cases.
17
8 Review of Group’s Performance (Cont’d)
Distributable Income
Had the disposal taken place in FY17 Q1, Distributable Income for the current quarter is 2.9% lower despite theforward rate remaining consistent. This is mainly attributable to non-recurring other trust expenses in connectionwith the refinancing activities during the quarter and higher tax expense incurred by the associate.
9 Variance from Forecast
No forecast has been provided.
10 Market and Industry Information
A Goods and Services Tax ("GST") was introduced in India on the 1 July 2017. The long awaited GST is a majoroverhaul of India's tax system, and is aimed at reducing tax leakages in India's complex tax system while boostingIndia’s gross domestic product. Under the new GST legislation, healthcare services and education are sectorswhich have been exempted. However, the full impact on RHT remains to be seen. The National PharmaceuticalPricing Authority-India's drug pricing watchdog has implemented pricing controls on two categories of coronarystents. This may have an impact on the revenue of FHL, which may in turn affect RHT's Variable Fee. However,it remains to be seen how significant an impact it may have on RHT. Apart from the aforementioned newdevelopments, there have not been any new material developments.
11 Information on Distribution
Any distribution declared for:
Current financial period
No.
Corresponding period of the immediately preceding year
No.
12 Distribution
Please refer to paragraph 11.
13 Interested Person Transactions
The Group has not obtained any interested person transactions mandate from the Unitholders.
14 Confirmation by Board
The Board of Directors of RHT Health Trust Manager Pte. Ltd. has confirmed that, to the best of their knowledge,nothing has come to their attention which may render these interim financial results to be false or misleading inany material aspect.
15 Confirmation by Issuer
The issuer has procured undertakings from all its directors and executive officers under Rule 720(1).
18
Disclaimer:
This release may contain forward-looking statements that involve risks and uncertainties. Actual futureperformance, outcomes and results may differ materially from those expressed in forward-looking statements asa result of a number of risks, uncertainties and assumptions. You are cautioned not to place undue reliance onthese forward looking statements, which are based on current view of management on future events.
By Order of the BoardRHT Health Trust Manager Pte. Ltd.
Gurpreet Singh DhillonExecutive Director & Chief Executive Officer3 August 2017


![GlossaryOfJobDescriptions RHT 2013[1]](https://img.pdfslide.net/doc/110x75/577cc6bf1a28aba7119f0de2/glossaryofjobdescriptions-rht-20131.jpg)