Embed Size (px)
Citation preview
Mission analytics Data-driven decision making in government
A report from the Deloitte Center for Government Insights
ABOUT THE DELOITTE CENTER FOR GOVERNMENT INSIGHTS
The Deloitte Center for Government Insights shares inspiring stories of government innovation, looking at what’s behind the adoption of new technologies and management practices. We produce cutting-edge re-search that guides public officials without burying them in jargon and minutiae, crystalizing essential insights in an easy-to-absorb format. Through research, forums, and immersive workshops, our goal is to provide public officials, policy professionals, and members of the media with fresh insights that advance an under-standing of what is possible in government transformation.
Mission analytics
MAHESH KELKAR
Mahesh Kelkar, of Deloitte Services LP, is a research manager with the Deloitte Center for Government Insights. He closely tracks the federal and state government sectors, and focuses on conducting in-depth research on the intersection of technology with government operations, policy, and decision making. Connect with him at [email protected] or on LinkedIn, or follow him on Twitter.
PETER VIECHNICKI, PhD
Peter Viechnicki, of Deloitte Services LP, is a strategic analysis manager and data scientist with the Deloitte Center for Government Insights, where he focuses on developing innovative public sector research using geospatial and natural language processing techniques. Connect with him on LinkedIn, or follow him on Twitter.
SEAN CONLIN
Sean Conlin is a principal with Deloitte Consulting LLP’s Strategy & Operations practice. His work focuses on using structured and unstructured data to help clients achieve efficiencies and manage risk. He can be reached on LinkedIn, or at [email protected].
RACHEL FREY
Rachel Frey is a principal with Deloitte Consulting LLP, focusing on analytics and information management primarily for state governments. She can be reached at [email protected] or on LinkedIn.
FRANK STRICKLAND
Frank Strickland is managing director of Mission Analytics services within Deloitte Consulting LLP. He has published widely on how to use data-driven methods to improve operations in the national security sector. He can be reached at [email protected] or on LinkedIn.
ABOUT THE AUTHORS
Data-driven decision making in government
iii
Contents
Management by the numbers | 1
How to survive red-book season | 2
Use smarter analytics to save time, money, and energy | 5
The four stages to becoming a data-centric organization | 8
Obstacles to data-driven mission management | 12
Overcoming the obstacles to data-driven management | 13
Today’s “extraordinary” will become routine | 16
Mission analytics
Management by the numbers
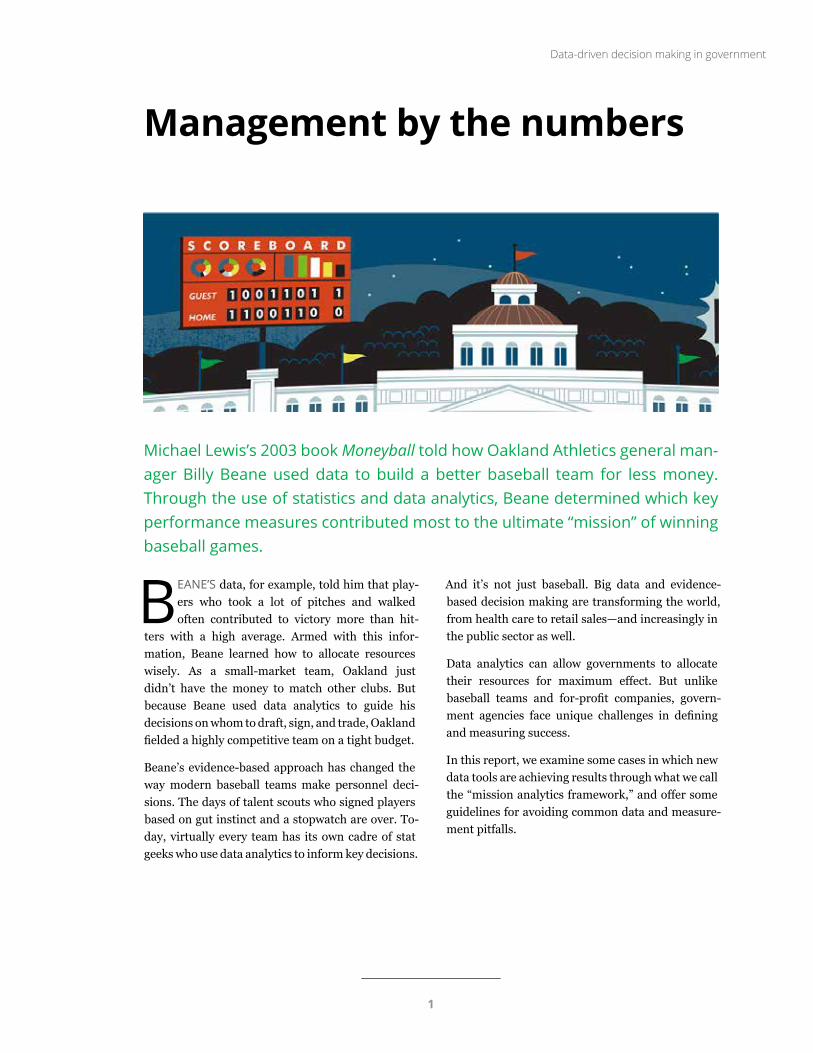
BEANE’S data, for example, told him that play-ers who took a lot of pitches and walked often contributed to victory more than hit-
ters with a high average. Armed with this infor-mation, Beane learned how to allocate resources wisely. As a small-market team, Oakland just didn’t have the money to match other clubs. But because Beane used data analytics to guide his decisions on whom to draft, sign, and trade, Oakland fielded a highly competitive team on a tight budget.
Beane’s evidence-based approach has changed the way modern baseball teams make personnel deci-sions. The days of talent scouts who signed players based on gut instinct and a stopwatch are over. To-day, virtually every team has its own cadre of stat geeks who use data analytics to inform key decisions.
And it’s not just baseball. Big data and evidence-based decision making are transforming the world, from health care to retail sales—and increasingly in the public sector as well.
Data analytics can allow governments to allocate their resources for maximum effect. But unlike baseball teams and for-profit companies, govern-ment agencies face unique challenges in defining and measuring success.
In this report, we examine some cases in which new data tools are achieving results through what we call the “mission analytics framework,” and offer some guidelines for avoiding common data and measure-ment pitfalls.
Michael Lewis’s 2003 book Moneyball told how Oakland Athletics general man-ager Billy Beane used data to build a better baseball team for less money. Through the use of statistics and data analytics, Beane determined which key performance measures contributed most to the ultimate “mission” of winning baseball games.
Data-driven decision making in government
1
How to survive red-book season
AT the Department of Justice’s (DoJ’s) Office of Justice Programs (OJP), winter is a busy time. That’s when OJP distributes most of its
public safety grants, totaling roughly $2 billion each year, to more than 3,000 grantees.1 OJP personnel still call this “red-book season,” a term dating from times when all grant applications were recorded in huge red binders.
Calling it the busy season is an understatement. “Ev-erything stops during those two to three months—it’s all hands on deck to deal with the amount of grant applications that come in that very short timeline,” says Lara Allen, a 15-year veteran at OJP.
During her tenure, Allen has seen a great deal of change in OJP practices. Before 2011, OJP’s grant review process depended heavily on the individual knowledge of grant managers.2
“We had no standard approach to oversight. At the time, we had seven offices in the building all look-ing at grant data differently, collecting it differently, doing different things with it, monitoring it differ-ently with no consistent approach—despite the fact that we all actually share the same grantees,” recalls Allen.3
In Moneyball terms, these grant managers were the old-time baseball scouts, making decisions based largely on their personal judgment and experience.
Around 2011, though, this began to change. Allen realized that OJP already possessed the data it needed to bring some objectivity to grant reviews. Allen and her colleagues within the DoJ began to use operational data for decision support, moving from intuition toward more objective techniques.
OJP began pulling disparate data systems together, and automated its review processes to increase the accuracy and consistency of its decisions while re-ducing the burden on its grant managers. The new processes had demonstrable impacts. Grant reviews can now be performed quarterly rather than annu-ally. The time needed for grant managers to capture grantee data in OJP’s database has been slashed from 30 minutes to almost zero. These improve-ments led to more accurate decisions and gave the entire office more confidence in its actions.4
Resource allocation decisions now are based on hard data rather than subjective opinion. How much grant money should someone receive? What risk does a particular grantee represent? How many grant managers, and which, should be auditing high- and low-risk recipients? These are some of the questions that OJP can answer more effectively.
Lara Allen and her colleagues at OJP aren’t alone in moving to data-driven resource allocation. The desire for more objective mission management has a long history in federal, state, and local govern-ments. Efforts to replace intuition with objectivity span decades and have come from across the politi-cal spectrum.
A significant milestone for these efforts came in 1993, when the Government Performance and Results Act (GPRA) required federal agencies to include performance management as part of their strategic planning. The GPRA was revisited almost two decades later, in 2011, through the GPRA Mod-ernization Act (GPRAMA).5
And at the state and local levels, the past two de-cades provide a number of examples of governments striving to develop a data-driven culture. Some key highlights of these efforts are shown in figure 1.
Mission analytics
2
Graphic: Deloitte University Press | DUPress.com
Sources: The White House, “Government Performance Results Act of 1993”; Jonathan Dienst, “I-Team: NYPD provides unprecedented look at Compstat,” NBC New York, April 15, 2016; Center for American Progress, “The CitiStat model: How data-driven government can increase efficiency and effectiveness,” April 2007; The White House, “The president’s management agenda,” 2002; The White House, “The Program Assessment Rating Tool (PART)”; Peter Orszag, “Building rigorous evidence to drive policy,” The White House, June 8, 2009, Performance.Gov, “FAQ”; Stephen Goldsmith, “Data-driven governance goes mainstream,” Government Technology, September 17, 2015; Jason Miller, “OMB initiates FedStat to home on mission, management issues.” Federal News Radio, May 20, 2015.
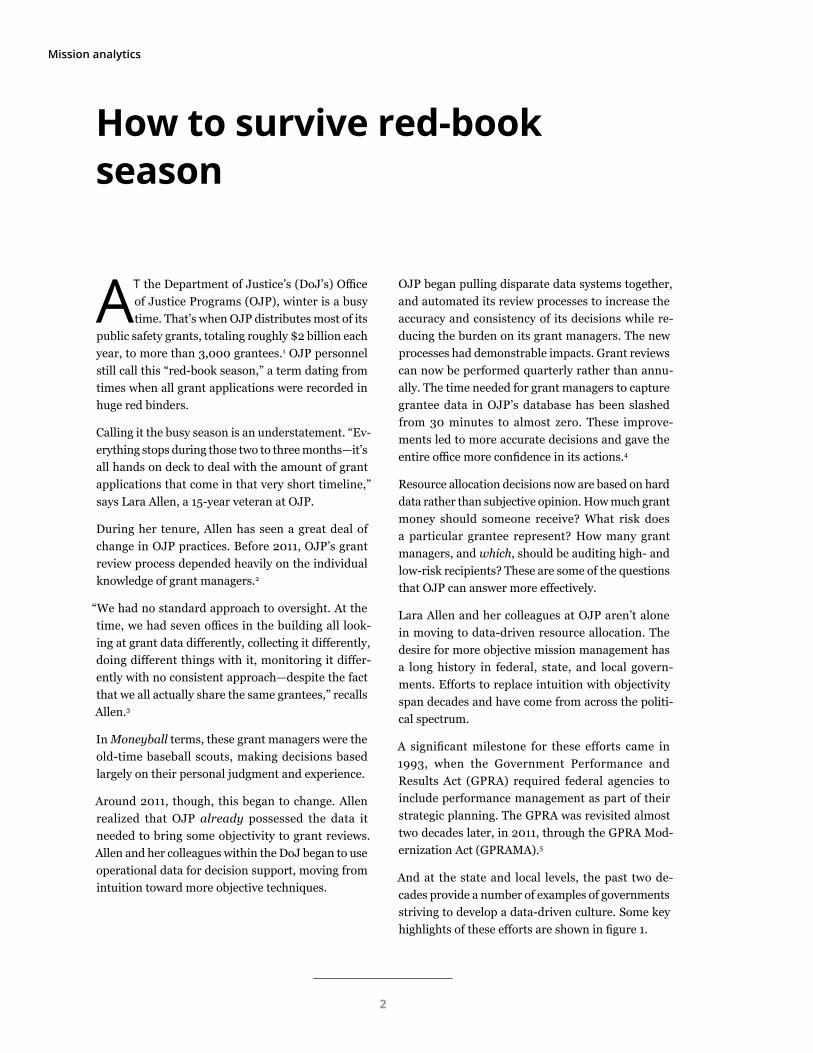
Figure 1. Legislative and executive efforts for data-driven government
1993 GPRAFederal agencies required to include performance management as part of their strategic planning and report on their results6
1994 NYC CompstatNew York Police Department’s statistical system for tracking crime7
1999 Baltimore CitiStatCity of Baltimore’s data-tracking and management tool8
2002 PMA & PARTPMA: Bush Administration’s red/yellow/green scoring system for federal agencies comprising five government-wide and nine agency-specific goals9 PART: Bush Administration’s questionnaire-based methodology for assessing performance of more than 1,000 federal programs10
2007 Maryland StateStatState government performance measurement and management tool11
2009 Obama administration’s evidence-based policy pushOMB’s evidence-based policy push at the start of the Obama administration12
2011 GPRAMAFederal agencies required to publish strategic and performance plans and reports in machine-readable formats13
2013 NYC MODANew York City Mayor’s Office of Data Analytics (MODA) turns data into actionable solutions14
2016 FedStatOMB’s latest data-driven effort to measure mission performance15
Data-driven decision making in government
3
Despite numerous efforts, however, successful data-driven resource allocation processes were still quite rare—until recently. Since around 2010, two factors have rendered data-driven mission management much more achievable: dramatic advances in in-formation technology, and the rise of data science, visualization, and analytics. More and more sophis-ticated IT tools, many of them open-source, have emerged, as have many more individuals skilled in data science.
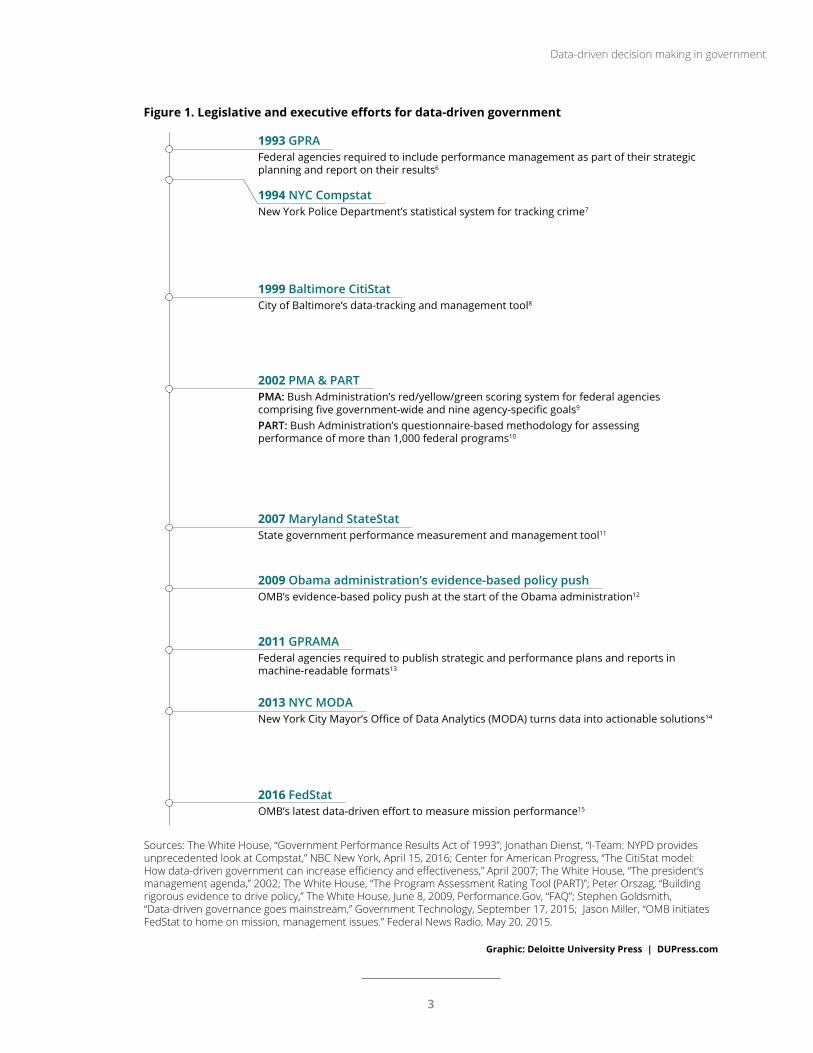
A few statistics illustrate this growth. The number of universities worldwide granting degrees in data science has risen to more than 500 as of June 2016.16 The number of data-science related degrees granted has risen as well (figure 2).
These developments have made it easier for govern-ment officials to access and understand the statistics that illuminate mission success—to make sense of operational data and turn it into usable insights for the critical mission of resource allocation.
Graphic: Deloitte University Press | DUPress.com
Source: US Department of Education, Integrated Post-Secondary Education Statistics.
Figure 2. Data science-related master’s degrees granted, 1970–2014
19701975
19801985
19901995
20002003
20042005
20062007
20082009
20102011
20122013
0
5,000
10,000
15,000
20,000
25,000
Computer and information sciences Mathematics and statistics
Degrees granted
Year
Mission analytics
4
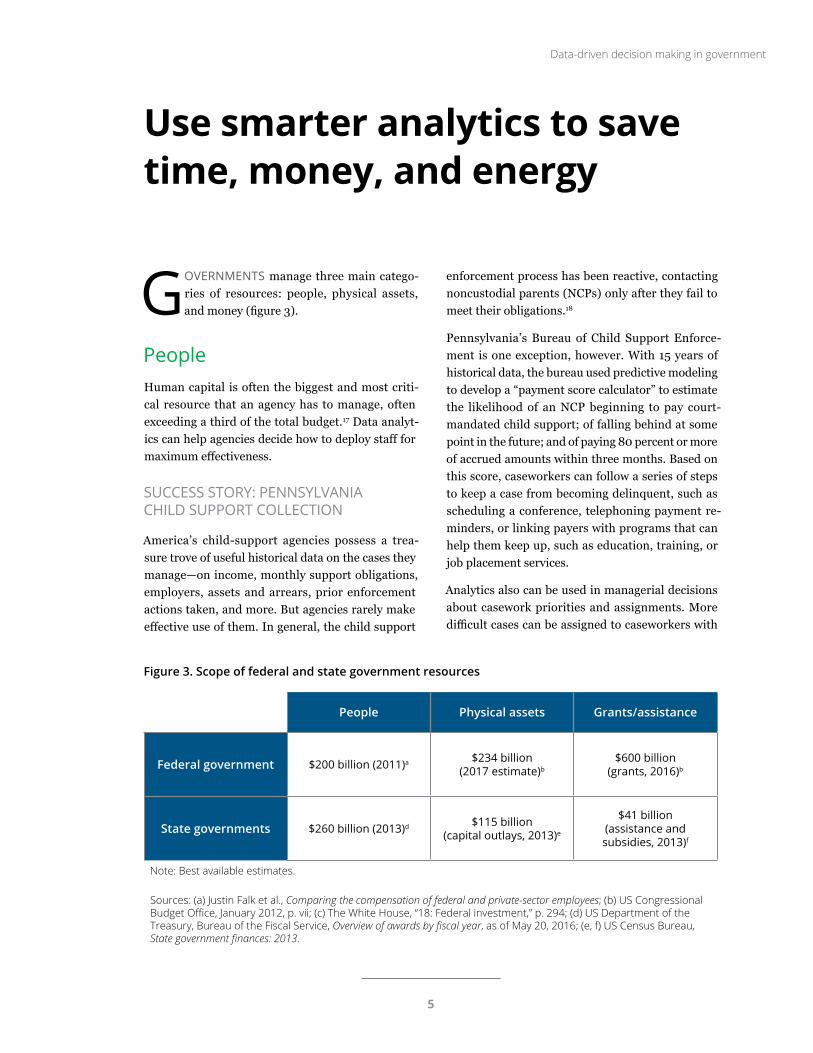
GOVERNMENTS manage three main catego-ries of resources: people, physical assets, and money (figure 3).
PeopleHuman capital is often the biggest and most criti-cal resource that an agency has to manage, often exceeding a third of the total budget.17 Data analyt-ics can help agencies decide how to deploy staff for maximum effectiveness.
SUCCESS STORY: PENNSYLVANIA CHILD SUPPORT COLLECTION
America’s child-support agencies possess a trea-sure trove of useful historical data on the cases they manage—on income, monthly support obligations, employers, assets and arrears, prior enforcement actions taken, and more. But agencies rarely make effective use of them. In general, the child support
enforcement process has been reactive, contacting noncustodial parents (NCPs) only after they fail to meet their obligations.18
Pennsylvania’s Bureau of Child Support Enforce-ment is one exception, however. With 15 years of historical data, the bureau used predictive modeling to develop a “payment score calculator” to estimate the likelihood of an NCP beginning to pay court-mandated child support; of falling behind at some point in the future; and of paying 80 percent or more of accrued amounts within three months. Based on this score, caseworkers can follow a series of steps to keep a case from becoming delinquent, such as scheduling a conference, telephoning payment re-minders, or linking payers with programs that can help them keep up, such as education, training, or job placement services.
Analytics also can be used in managerial decisions about casework priorities and assignments. More difficult cases can be assigned to caseworkers with
Use smarter analytics to save time, money, and energy
People Physical assets Grants/assistance
Federal government $200 billion (2011)a $234 billion (2017 estimate)b
$600 billion (grants, 2016)b
State governments $260 billion (2013)d $115 billion (capital outlays, 2013)e
$41 billion (assistance and subsidies, 2013)f
Note: Best available estimates.
Sources: (a) Justin Falk et al., Comparing the compensation of federal and private-sector employees; (b) US Congressional Budget Office, January 2012, p. vii; (c) The White House, “18: Federal investment,” p. 294; (d) US Department of the Treasury, Bureau of the Fiscal Service, Overview of awards by fiscal year, as of May 20, 2016; (e, f) US Census Bureau, State government finances: 2013.
Figure 3. Scope of federal and state government resources
Data-driven decision making in government
5
more experience or specific skills. Managers can direct workers to focus attention on cases with the most significant potential for collections. And in cases in which the likelihood of prompt payment appears to be very low, caseworkers can intervene early by establishing a nonfinancial obligation or modifying the support amount according to state guidelines.
By using data to inform day-to-day practice, Penn-sylvania is the only state that meets or exceeds the 80 percent standard set by the federal Office of Child Support Enforcement for all five federal child sup-port enforcement performance metrics.19
Equipment and physical assetsThe second major category of resources includes physical assets, from weapons systems to field of-fices. Modern analytic tools support more objective decisions for allocating these assets.
SUCCESS STORY: USING DATA TO BET-TER MANAGE OVERSEAS OFFICES
US Immigration and Customs Enforcement (ICE) enforces federal laws governing border control, cus-toms, trade, and immigration to promote homeland security and public safety.20 ICE maintains more than 60 field offices in 45 nations to assist in border enforcement and the investigation of transnational crimes. Both activities depend on the cooperation of foreign counterparts, including police forces and border control organizations.21 To further this
cooperation and fulfill its mission, ICE chooses the locations and sizes of its offices carefully.
Until 2014, decisions on ICE international offices were made based on anecdotal evidence or periodic surveys of field operatives and headquarters person-nel. But in 2015, ICE leadership decided to apply a more data-driven method, with a system that com-bined the agency’s operational data with public information and qualitative data from the field.
The ICE database allows analysts to compare the workloads and activities of its offices in each nation. ICE officials use it to identify countries where an expanded presence could have a positive impact, or where an office could be closed without sacrificing mission performance.
MoneyThe third critical resource government employs to achieve its mission is funding, such as grants, loans, and guarantees. For the federal government, grant funding is a $600 billion question: How should government agencies decide which organizations should receive a grant?
Establishing connections between goals and out-comes can be a challenge. For instance, measuring the impact of a federal public safety grant on crime rates can be painstaking, inexact, and open to inter-pretation. While entirely objective grant decisions may not be possible, new analytic techniques pro-vide a solid, evidence-based framework.
SUCCESS STORY: GRANTMAK-ING AT THE FEDERAL RAILROAD ADMINISTRATION (FRA)
Until fiscal 2009, the Federal Railroad Adminis-tration (FRA) was a comparatively small operating administration within the US Department of Trans-portation (DOT), with the narrowly focused mission of ensuring safety on the nation’s railways. Its grant-making budget was approximately $30 million per year until fiscal 2008.22 The scope of the FRA’s mis-sion changed dramatically in fiscal 2009, however, with the passage of the American Recovery and Reinvestment Act (ARRA). Overnight, the funds in
“We flipped it around because we had the data and discipline. Data to help us manage funds and discipline to execute it.”
— Corey Hill
Mission analytics
6
the FRA’s purview jumped from $30 million to $8 billion; by 2015, its obligated grants portfolio had risen to $17.7 billion.23
In response, the FRA built an “enterprise data store” containing all relevant information about its high-speed rail grants, for both current projects and future investments. The store’s data allow the FRA to forecast the effect of investments on outcomes.
The FRA considers outcomes important to ordinary citizens, such as peak speeds on busy passenger-rail corridors. As FRA executive director Corey Hill puts it, “So what does [a rail] construction project get you? It doesn’t just get you X new station platforms, Y linear feet of track, or even Z new signal houses.
That’s just stuff. What it really gets you is safety, reliability, better performance, and more access [for] people.” The FRA’s projections for proposed investments along the 304-mile-long Chicago-Detroit-Pontiac rail corridor, for instance, showed that an investment of $500 million could increase the corridor’s top speed from 80 mph to 110 mph, reducing travel time by 30 minutes for the corridor’s 477,000 users.25
Today, the FRA can more clearly communicate the impact of its budgetary decisions to DOT and Con-gress. “We flipped it around because we had the data and discipline,” Hill says. “Data to help us manage funds and discipline to execute it.”26
Data-driven decision making in government
7
The four stages to becoming a data-centric organization
MANY government agencies want to use data to improve their resource decisions, but may lack a clear roadmap for doing so.
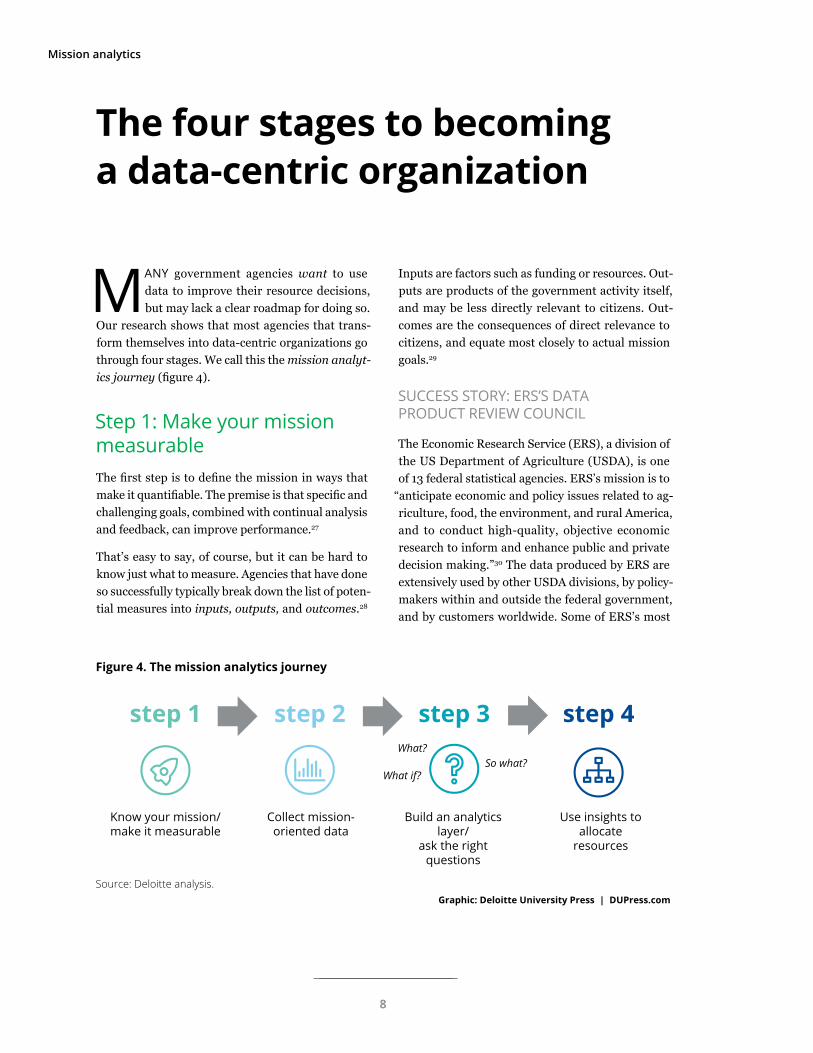
Our research shows that most agencies that trans-form themselves into data-centric organizations go through four stages. We call this the mission analyt-ics journey (figure 4).
Step 1: Make your mission measurable The first step is to define the mission in ways that make it quantifiable. The premise is that specific and challenging goals, combined with continual analysis and feedback, can improve performance.27
That’s easy to say, of course, but it can be hard to know just what to measure. Agencies that have done so successfully typically break down the list of poten-tial measures into inputs, outputs, and outcomes.28
Inputs are factors such as funding or resources. Out-puts are products of the government activity itself, and may be less directly relevant to citizens. Out-comes are the consequences of direct relevance to citizens, and equate most closely to actual mission goals.29
SUCCESS STORY: ERS’S DATA PRODUCT REVIEW COUNCIL
The Economic Research Service (ERS), a division of the US Department of Agriculture (USDA), is one of 13 federal statistical agencies. ERS’s mission is to
“anticipate economic and policy issues related to ag-riculture, food, the environment, and rural America, and to conduct high-quality, objective economic research to inform and enhance public and private decision making.”30 The data produced by ERS are extensively used by other USDA divisions, by policy-makers within and outside the federal government, and by customers worldwide. Some of ERS’s most
Graphic: Deloitte University Press | DUPress.comSource: Deloitte analysis.
Figure 4. The mission analytics journey
Know your mission/make it measurable
step 1
Collect mission-oriented data
step 2
Build an analytics layer/
ask the right questions
step 3
Use insights toallocate
resources
step 4What?
So what?What if?
Mission analytics
8
popular and influential products chart our nation’s food insecurity, dietary choices, and farm economy.
ERS’s more than 350 employees manage a portfolio of about 80 different data products. ERS leadership performed a strategic assessment in 2012 that found that, although its data products were universally valued by customers, it was unclear which products aligned best with the broader agency’s goals.31 As ERS administrator Mary Bohman puts it, “We want-ed to be able to state clearly which data products were most important and respond to Congressional and other stakeholder questions on why we were al-locating our resources to certain products.”32
To tackle this issue, ERS created the Data Product Review Council (DPRC). The Council devised a method of measuring the impact of each ERS data product.33 Through interviews and usage moni-toring, ERS was able to score and rank each of its products into three distinct categories: premier, core, and other.34 Premier products are those that are most influential and clearly linked to the USDA’s five mission goals, while core data products are used by other ERS projects. Once its data products are scored according to mission centrality, ERS can then measure how well it is achieving its mission overall. This new clarity of vision allows ERS to ascertain where to allocate the efforts of its employ-ees and its other resources.
Based on these insights, ERS eliminated or scaled back effort on certain products that were less im-portant to its mission. For instance, ERS archived an atlas of Chinese agricultural production after a
DPRC review, acknowledging that staff resources were better directed elsewhere.35 “The product re-views have helped us to have a more structured approach to our resource allocation decisions,” says DPRC chair Lewrene Glaser, “allowing us to make better decisions about some marginal cases where the benefit may not be worth the investment.”36
In other words, ERS identified outcomes that support USDA’s broader goals, and the DPRC has helped ERS achieve those outcomes more effectively and meet budget reductions as well as allocate resources to new initiatives. A welcome byproduct of the DPRC’s efforts is improvement in data quality procedures: DPRC has helped stan-dardize and codify data quality measurements and improvement plans of all the datasets it reviews. ERS has achieved all these benefits by making its mission measurable.
Step 2: Collect mission- critical dataDefining and refining mission-critical measures is only the first step on the mission analytics journey. The enterprise then must create a platform that allows for the collection, storage, and dissemination of all relevant data. Too often, mission-critical data are trapped in stovepiped databases or organiza-tional silos, or outside the agency entirely. Different datasets may have to be brought together to gain a full picture of mission performance.37
Consider a child welfare agency. To assess how well it is meeting its mission, the agency might wish to measure outputs, such as the number of homes visited by case workers, or outcomes, such as the percentage of children successfully reunited with their families.38 Stovepiped systems can make such reporting difficult. Moreover, the child welfare agen-cy may want to consider data beyond its traditional boundaries, such as dropout rates, arrests, and teen pregnancies, to assess how well their children do as they age. Access to such data should be maintained through processes designed with data quality as an explicit goal, creating what we call a “mission-data ecosystem.”
“The product reviews have helped us to have a more structured approach to our resource allocation decisions.”
— Lewrene Glaser
Data-driven decision making in government
9
SUCCESS STORY: MISSION-DATA ECOSYSTEM AT THE FEDERAL RAIL-ROAD ADMINISTRATION
We noted above how the passage of the ARRA in 2009 and subsequent appropriations made the FRA’s high-speed rail grant budget skyrocket, cre-ating huge challenges for the agency. At the time, the FRA did not have an enterprise system for grant management; data on each project were stored in individual spreadsheets or even on paper in desk drawers.39
To meet the challenge, the FRA developed its Pro-gram Management Tracker (PMT), a comprehensive database including information for all of its grant projects. The database is organized around im-portant components of FRA operations—grant documents (originals and amendments), deliv-erables, status of environmental reviews, grant monitoring reports, and invoices.40
As the FRA began work on the PMT tool, its staff realized that much of the data they needed were al-ready being collected, either by the FRA itself or by other DOT divisions. The challenge was assembling them within a unified central database, an exercise that required data-sharing agreements with other DOT offices and the replacement of legacy data sys-tems with more modern capabilities.41
The FRA completed the first version of the PMT in fiscal 2011. The next stage of the project involved the creation of an operational dashboard to visual-ize data. This dashboard displays the status of the FRA’s entire portfolio of investments, allowing it to make better decisions about which projects to fund and where to focus its organizational attention.42
Step 3: Use analytics to move from data to insightsThe third step in the journey is to build tools to pull meaning out of the data compiled and measured during steps 1 and 2. Performance information has little significance in itself. It should be translated into meaning to become valuable.
But how do we move from data to insight? A pleth-ora of advanced analytical tools purport to do this. Our research, however, shows that the tool is less important than determining the right questions to ask. In fact, three are critical:
• What? “What is current organizational performance?”
• So what? “What does current performance mean for the mission?”
• What if? “If we applied resources or solutions differently, what effect would it have on the mission?”
These questions are really what connects operation-al data to mission outcomes, and what separates the mission analytics framework from more generic business intelligence tools.
When an organization builds solutions to answer these questions from operational data, our research highlights the need to be agile. Agility has become a buzzword in some software development circles, but here it captures a critical concept: the need to start small and iterate continually. Applying analyt-ics to mission management and execution requires agencies to tackle questions and generate meaning-ful answers rapidly. Though these answers may not be perfect, they will help guide further refinement of data collection and analysis. Over time, the analytics solution will converge on something maximally use-ful for the organization.
Performance information has little significance in itself. It should be translated into meaning to become valuable.
Mission analytics
10
SUCCESS STORY: IDENTIFY-ING AT-RISK CHILDREN IN THE DISTRICT OF COLUMBIA
Reunification—returning children in foster care to their families of origin—is a critical mission objec-tive for child welfare agencies. Nationally, more than 400,000 children are in foster care. Nearly 30,000 more children enter the system each year than exit it, and that gap has been widening since 2012. Child welfare agencies across the nation typically struggle to return children to their parents quickly (reunifi-cation) and help them remain there (stability).43
The District of Columbia’s Child and Family Servic-es Agency (CFSA) decided to tackle reunification by learning from its own successes and failures. It built a statistical model that, based on the specific facts of a client’s case, would predict the extent to which a successful reunification was probable or unlikely. The predictive model can segment children into dif-ferent groups, flagging those least likely to have a timely and stable reunification. More importantly, the model identifies why children face these risks, and which factors are under the CFSA’s control.44
Step 4: Translate insights into organizational actionInsights without actions are of little value. Agencies that successfully use data analytics to improve their operations rely on feedback mechanisms to trans-late insights into concrete operational changes.45 But of course, the best feedback mechanism in the world is worthless unless it’s used. This is the fourth and
final step of the mission analytics framework, and the final link connecting data to agency missions.
SUCCESS STORY: REDUCING PEND-ING BENEFIT APPLICATIONS
Virginia, like many other states, has an integrated system for benefits eligibility. It allows residents seeking multiple services (such as medical assis-tance and the Supplemental Nutrition Assistance Program) to apply just once for all. The offices that process these eligibility applications, however, are often understaffed and overworked.46
In 2015, Virginia’s Department of Social Services (DSS) took a different approach to the problem, centered on “managing by the numbers.” The DSS gathered existing administrative data on the prog-ress of applications and claims through its systems. Analytical reports on these data helped map how applications flowed from office to office and even from worker to worker. These diagnostic reports showed outliers, both positive and negative; the pos-itive instances could provide best practices, while the negative outliers required interventions. Virgin-ia further used the information to understand which offices could benefit most from additional training.
The DSS took the final step of the journey to data-driven mission management by applying insights from analytics to reallocate its resources, introduc-ing special training to reduce bottlenecks in key offices. Using these insights, the agency reduced processing time and thus wait times for benefit ap-plicants. By August 2015, Virginia had reduced its average application processing times from 24 days (before implementation) to 18 days.47
Data-driven decision making in government
11
Obstacles to data-driven mission management
WHILE these success stories are inspiring, the journey to data-driven mission man-agement is not without challenges.
Obstacle 1: It’s hard to know what’s importantMeasures of success can be difficult to define. Con-sider an urban police department. While it’s easy to measure its activities and outputs, from patrol hours to arrests, how can its leaders identify which aspects of its mission most need improvement? And if more arrests come at the cost of hostility in the community, for instance, is an increase in arrests an
“improvement”?
In government, challenges in defining success and identifying the measures that contribute to it can make it difficult to develop key performance indi-cators, or KPIs.
Obstacle 2: Departmental objectives may not align with the overall agency missionState and federal agency structures can make it difficult to link departmental goals with larger ob-jectives. Every federal national security agency, for instance, has a Freedom of Information Act (FOIA) office, charged with responding to FOIA requests in a timely and accurate way. Some of these offices may have improved their performance dramatically, perhaps cutting response times for customers or in-creasing customer satisfaction.
But how do those improvements relate to overall agency performance? It can be difficult to measure the overarching impact of such improvements, though surely an FOIA office does have an impor-tant role to play within the overall mission.
Obstacle 3: Self-assessments are ambiguous and subjectiveIt is unreasonable to expect agency officials to deliver objective self-assessments on their own performance, as the desire to highlight success could introduce ambiguity and subjectivity into the data. A recent GAO report on six federal agencies included ample evidence of this problem, finding that only one out of the six reported on the quality of its performance information in detail. The other five simply described their process without further details.48
Obstacle 4: Storage formats can impede the use of operational dataSome data highly relevant to the optimization of re-source allocation—important details on why agency actions succeed or fail—are stored in formats that make them difficult to access. The documents may be scanned copies of handwritten notes or free-text fields in unstructured formats. For example, law enforcement case files may contain extensive notes that shed light on why individual cases take more or less time, the associated outcomes, and what sort of investigators are most effective. Without such data, a performance measurement system seeking to in-form resourcing may give poor results.
One of the notions that should be debunked here is that one needs “perfect” data to proceed with analyt-ics.49 More often than not, agencies are surprised to see the valuable insights they can gain from imper-fect or seemingly insufficient data. And in all of the examples cited in this report, agencies worked with their internal data first before expanding their view to outside data sources.
Mission analytics
12
Overcoming the obstacles to data-driven management
OUR research has uncovered four approach-es that can help government agencies over-come common obstacles to data-driven
mission management.
Solution 1: Identify the most useful measuresThe time needed to identify which measures are most informative and most closely connected to mis-sion success is well spent. Measures should first be grouped into inputs, outputs, and outcomes. Inputs and outputs should be further grouped to separate the ones that are under the agency’s control from those that are not. Only then can the hard work of building a statistical model connecting inputs, out-puts, and outcomes begin.
This is how Washington DC’s Child and Family Services Agency approached its efforts to boost per-formance. The CFSA selected the inputs and outputs it could control and built a predictive model connect-ing them to important child outcomes such as the reunification rate.50 Without understanding which metrics drive mission success, agencies risk wasting effort on metrics that fail to gauge what matters most.
Solution 2: Create a “line of sight” from every employee to at least one top-level agency goalIt’s very helpful for employees to understand how their work contributes to the overall agency mis-sion. To promote this link, government agencies can
disseminate “line of sight” information connecting each employee’s role to one or more high-level goals.
The US military is a helpful model. The United States’ armed forces do pretty well at conveying to all per-sonnel their individual contribution to the overall mission. After all, it’s safe to say that most cooks in the US armed forces know that good, healthy food has a positive impact on troop morale. 51
At the federal level, the GPRAMA recently required each agency to identify its most important perfor-mance goals, or Agency Priority Goals (APG). 52 Agencies are also required to appoint a goal leader for each APG. This helps ensure that agency mis-sions and priorities cascade down the hierarchy. A recent GAO review found that a majority of agency goal leaders believe their roles have positive effects on performance. They further noted that such positions provided “greater visibility for the goal, fa-cilitated coordination, heightened focus on the goal, and improved access to resources.”53
Data-driven decision making in government
13
Graphic: Deloitte University Press | DUPress.comSource: Deloitte analysis.
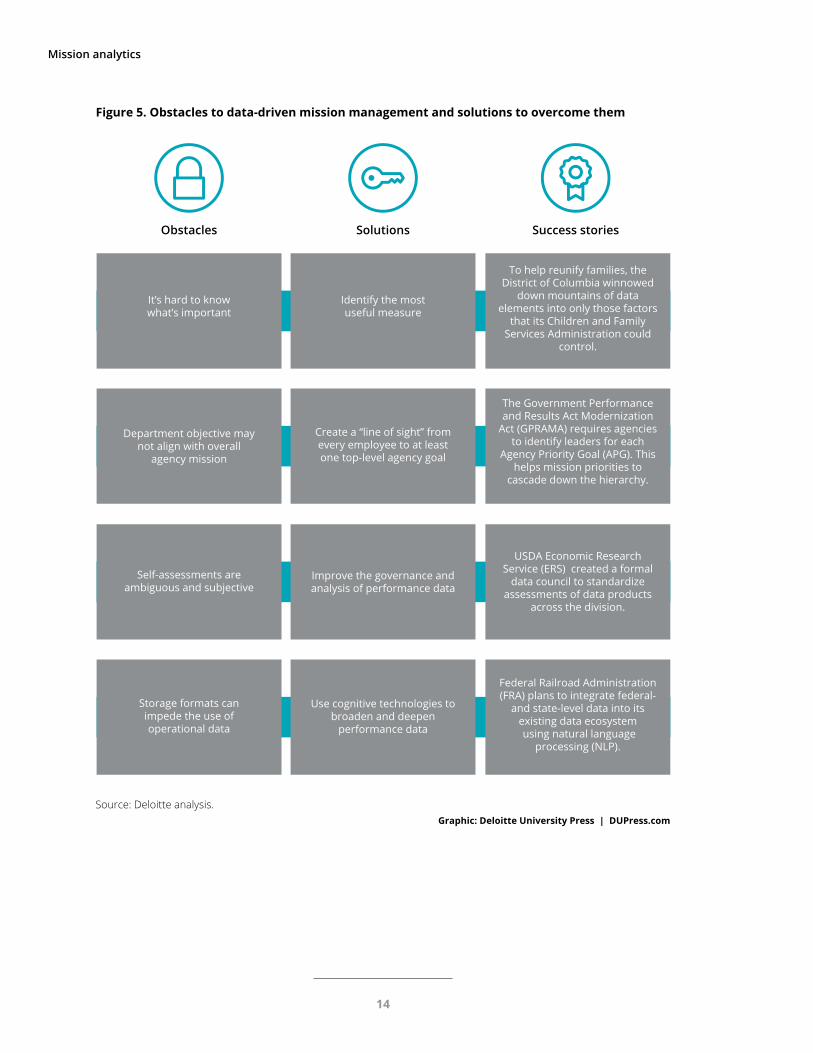
Figure 5. Obstacles to data-driven mission management and solutions to overcome them
Obstacles Solutions Success stories
It’s hard to know what’s important
Identify the most useful measure
To help reunify families, the District of Columbia winnowed
down mountains of data elements into only those factors
that its Children and Family Services Administration could
control.
Department objective may not align with overall
agency mission
Create a “line of sight” from every employee to at least one top-level agency goal
The Government Performance and Results Act Modernization
Act (GPRAMA) requires agencies to identify leaders for each
Agency Priority Goal (APG). This helps mission priorities to
cascade down the hierarchy.
Self-assessments are ambiguous and subjective
Improve the governance and analysis of performance data
USDA Economic Research Service (ERS) created a formal
data council to standardize assessments of data products
across the division.
Storage formats can impede the use of operational data
Use cognitive technologies to broaden and deepen
performance data
Federal Railroad Administration (FRA) plans to integrate federal-
and state-level data into its existing data ecosystem using natural language
processing (NLP).
Mission analytics
14
Solution 3: Improve the governance and analysis of performance data In many cases, the entity responsible for operations is also responsible for reporting on success, essen-tially acting as its own scorekeeper. Human nature being what it is, this encourages subjectivity in per-formance assessment. Instead, agencies may wish to move responsibility for collecting and reporting on performance measures to an independent entity, potentially under the direction of a chief data officer (CDO). Alternatively, they may consider increased investment in technological solutions to ensure per-formance data quality.
The past few years have seen a steady uptick in the number of government CDOs.54 Most of the current crop are focused on centralizing data and making it machine-readable and accessible to all users. More importantly, perhaps, CDOs are trying to change agency cultures by showing the value of operational data.
Unsurprisingly, such initiatives should be driven from the top. Barbara Cohn, who ran New York City’s data interoperability initiative between 2009 and 2012 and is currently CDO for the state of New York, notes the importance of political leadership to a data-driven culture. “There was an executive order
from the mayor, there was strong leadership, there was structure, there were processes in place and standards that had to be met, and there were very clear objectives,” says Cohn.55
Solution 4: Use cognitive technologies to broaden and deepen performance dataCognitive technologies are information-processing techniques that can perform specific tasks that, until recently, required human labor.56 Some of these technologies, such as natural language processing, speech recognition, and robotics, are seeing wide-spread adoption and making rapid progress.
Government often has “unstructured” forms of data that, if converted into machine-readable formats, could provide important performance insights—for example, the handwritten notes of field operatives or scanned eligibility documents often contain im-portant information. Cognitive technologies such as optical character recognition (OCR) and natural language processing (NLP) can be used to convert such data and integrate them with existing data-bases.57 The use of cognitive technologies is still new in government, but as these techniques continue to improve and costs continue to fall, they will play an increasingly important role in data-driven manage-ment, tapping previously “hidden” sources of data.
Data-driven decision making in government
15
THE journey toward data-driven resource allocation requires political leadership, a commitment to sustained technological prog-
ress, and a willingness to measure and report on success transparently. Done right, it can dramati-cally boost performance.
We’ve seen a number of pioneering government organizations achieve significant results through data-driven mission management. While it is still the exception rather than the rule in government, the adoption of data analytics is likely to increase rapidly. It’s reasonable to expect that most agencies will report key performance indicators in near-real time via transparency portals. Citizens, should they choose to make use of these portals, should be able to view these KPIs.
Data-driven mission management is poised to fol-low the pattern of other innovations in government. Consider shared services. When the concept of sharing management functions was first imported
from the private sector into federal institutions in the early 1980s, it was seen as a radical notion and faced stiff resistance.58 Today, shared functions such as payroll services have been widely implemented. In 1980, for instance, virtually every federal depart-ment maintained its own payroll; today, just four payroll agencies serve all federal employees.59 As more agencies saw the benefits of shared services, and more successful examples of implementation could be seen, the innovation spread.
Mission-driven analytics have the similar poten-tial to allow government agencies to do more with limited resources. The technology has advanced to the point at which data can be captured, collected, and analyzed efficiently. Linking data to an organi-zation’s mission may soon become commonplace. More and more public leaders, like those described in this paper, will work to create a data-driven culture that promotes agency missions and the ful-fillment of public purpose.
Today’s “extraordinary” will become routine
Mission analytics
16
1. US Department of Justice, Office of Justice Programs, “FY 2016 budget request,” January 2015, https://www.justice.gov/sites/default/files/jmd/pages/attachments/2015/01/30/31_bs_section_ii_chapter_-_ojp.pdf.
2. Lara Allen, interview with the authors, Washington, DC, May 5, 2016.
3. Ibid.
4. Lara Allen, email interview with the authors, June 6, 2016.
5. Performance.Gov, “FAQ,” https://www.performance.gov/faq#Q5.
6. The White House, “Government Performance Results Act of 1993,” https://www.whitehouse.gov/omb/mgmt-gpra/gplaw2m, accessed August 8, 2016.
7. Jonathan Dienst, “I-Team: NYPD provides unprecedented look at Compstat,” NBC New York, April 15, 2016, http://www.nbcnewyork.com/news/local/Compstat-New-York-NYPD-Police-Tour-375761141.html.
8. Center for American Progress, “The CitiStat model: How data-driven government can increase efficiency and effectiveness,” April 2007, https://www.americanprogress.org/wp-content/uploads/issues/2007/04/pdf/citistat_report.pdf.
9. The White House, “The President’s management agenda,” 2002, https://www.whitehouse.gov/sites/default/files/omb/assets/omb/budget/fy2002/mgmt.pdf.
10. The White House, “The Program Assessment Rating Tool (PART),” https://www.whitehouse.gov/sites/default/files/omb/assets/omb/expectmore/part.html, accessed August 8, 2016.
11. Center for American Progress, “The CitiStat model.”
12. Peter Orszag, “Building rigorous evidence to drive policy,” the White House, June 8, 2009, https://www.whitehouse.gov/omb/blog/09/06/08/BuildingRigorousEvidencetoDrivePolicy.
13. Performance.Gov, “FAQ.”
14. Stephen Goldsmith, “Data-driven governance goes mainstream,” Government Technology, September 17, 2015, http://www.govtech.com/data/Data-Driven-Governance-Goes-Mainstream.html.
15. Jason Miller, “OMB initiates FedStat to home on mission, management issues,” Federal News Radio, May 20, 2015, http://federalnewsradio.com/management/2015/05/omb-initiates-fedstat-to-hone-in-on-mission-management-issues/.
16. It’s fitting that the evidence for this claim is a GitHub page initiated by Ryan Swanstrom and developed by the data science community. See https://github.com/ryanswanstrom/awesome-datascience-colleges/blob/master/data_science_colleges.csv.
17. Elizabeth McNichol, “ Some basic facts on state and local government workers, ” Center on Budget and Policy Priorities, June 15, 2012, http://www.cbpp.org/research/some-basic-facts-on-state-and-local-government-workers.
ENDNOTES
Data-driven decision making in government
17
18. B. J. Walker and Tiffany Fishman, Rethinking human services delivery: Using data-driven insights for transformational outcomes, Deloitte University Press, September 18, 2015, http://dupress.com/articles/human- services-delivery-data-driven-insights/.
19. Ibid.
20. US Immigration and Customs Enforcement, “Who we are: Overview,” https://www.ice.gov/about.
21. US House of Representatives, “Statement of Lev J. Kubiak on potential terrorist threats: Border security challenges in Latin America and Carribean,” March 22, 2016, pp. 2–3, http://docs.house.gov/meetings/FA/FA07/20160322/ 104726/HHRG-114-FA07-Wstate-KubiakL-20160322.pdf.
22. US Government Accountability Office, Rail grant oversight: Greater adherence to leading practices needed to improve grants management, May 2016, p. 4, http://www.gao.gov/assets/680/677606.pdf.
23. US Federal Railroad Administration, “Working for FRA,” https://www.fra.dot.gov/Page/P0174.
24. Corey Hill, interview with the authors, Washington, DC, June 27, 2016.
25. US Federal Railroad Administration, “Corridor map: Chicago—Detroit—Pontiac,” June 8, 2016, https://www.fra.dot.gov/eLib/details/L17494#p1_z25_gD_lPF.
26. Corey Hill interview, June 27, 2016.
27. Performance.Gov, “Driving federal performance,” https://www.performance.gov/.
28. See, for instance, The White House, “Performance measurement challenges and strategies,” June 18, 2003, pp. 3–4, https://www.whitehouse.gov/sites/default/files/omb/part/challenges_strategies.pdf.
29. Two further types of metrics, both ratios, can be useful as well. Outputs per dollar spent measures the efficiency of a government unit. Outcomes per dollar spent measures government effectiveness.
30. Economic Research Service, “About ERS,” http://www.ers.usda.gov/about-ers.aspx.
31. Economic Research Service, “Strategic plan: FY 2013-18,” http://www.ers.usda.gov/media/1100663/strategic-plan- 2013-18.pdf.
32. Mary Bohman and Lewrene Glaser, interview with the authors, August 5, 2016.
33. United States Department of Agriculture, “ERS data product quality,” http://www.ers.usda.gov/about-ers/information-quality/ers-data-product-quality.aspx, accessed September 6, 2016.
34. CIO.gov, “Products over data: U.S. Department of Agriculture, Economic Research Service,” September 3, 2015, https://cio.gov/products-over-data-u-s-department-of-agriculture-economic-research-service/.
35. Mary Bohman and Lewrene Glaser interview, August 5, 2016.
36. Ibid.
37. Eamonn Kelly, Introduction: Business ecosystems come of age, Deloitte University Press, April 15, 2015, http://dupress.com/articles/business-ecosystems-come-of-age-business-trends/.
38. Bob Behn, “On the philosophical and practical: Resistance to measurement,” Bob Behn’s Public Management Report, November 2005, http://thebehnreport.hks.harvard.edu/files/thebehnreport/files/november2005.pdf.
39. Corey Hill interview, June 27, 2016.
40. Genevieve Oudar, telephone interview with the authors, April 6, 2016.
41. Genevieve Oudar, telephone interview with the authors, May 17, 2016.
42. Corey Hill interview, June 27, 2016.
Mission analytics
18
43. US Department of Health and Human Services, Administration for Children and Families, Trends in foster care and adoption: FY 2005–FY 2014, http://www.acf.hhs.gov/sites/default/files/cb/trends_fostercare_adoption2014.pdf.
44. Kevin Bingham et al., “Help them get home: How predictive modeling can improve outcomes in child welfare,” Contingencies Online, June 2016, http://www.contingenciesonline.com/contingenciesonline/may_june_2016?pg=22#pg22.
45. See, for instance, Stephen Goldsmith, “How Louisville, Ky., is using a ‘stat’ program to transform the culture of government,” Governing, June 19, 2013, http://www.governing.com/blogs/bfc/col-efficiency-louisville-louiestat-performance-metrics-improvement-transform-government-culture.html.
46. Michael Martz, “Ineligible recipients received millions in Virginia Medicaid benefits,” Richmond Times-Dispatch, November 9, 2015, http://www.richmond.com/news/virginia/government-politics/article_24dfdb37-b5ef-5fcf-9ffc-dcbf6b726b03.html.
47. Catesby Beck, telephone interview with the authors, May 19, 2016.
48. US Government Accountability Office, Greater transparency needed in public reporting on the quality of performance information for selected agencies’ priority goals, September 2015, p. 9, http://www.gao.gov/assets/ 680/672425.pdf.
49. James Guszcza, “You don’t need ‘perfect’ data for analytics,” Wall Street Journal, February 4, 2016, http://deloitte.wsj.com/cio/2016/02/04/you-dont-need-perfect-data-for-analytics-analytics/.
50. Bingham et al., “Help them get home.”
51. Mary Scott, “Dining facility boosts soldier morale in Iraq,” US Army, October 24, 2006, https://www.army.mil/article/409/Dining_facility_boosts_Soldier_morale_in_Iraq.
52. US Government Accountability Office, Implementation of GPRA Modernization Act has yielded mixed progress in addressing pressing governance challenges, September 2015, http://www.gao.gov/assets/680/672862.pdf.
53. Ibid., p. 51.
54. Project Open Data, “Chief data officers and chief data scientists,” https://project-open-data.cio.gov/chief- data-officers/.
55. Adam Stone, “Chief data officers: Shaping one of the newest positions in government,” Government Technology, March 4, 2015, http://www.govtech.com/data/Chief-Data-Officers-Shaping-One-of-the-Newest-Positions-in-Government.html.
56. David Schatsky, Craig Muraskin, and Ragu Gurumurthy, Demystifying artificial intelligence: What business leaders need to know about cognitive technologies, Deloitte University Press, November 4, 2014, http://dupress.com/articles/what-is-cognitive-technology/.
57. Robert W. Walker, “Georgia solves campaign finance data challenge via OCR,” Information Week, April 15, 2014, http://www.informationweek.com/government/cloud-computing/georgia-solves-campaign-finance-data- challenge-via-ocr/d/d-id/1204471.
58. US Government Accountability Office, Streamlining government: Questions to consider when evaluating proposals to consolidate physical infrastructure and management functions, May 2012, p. 27, http://www.gao.gov/assets/600/591084.pdf.
59. Partnership for Public Service, Building a shared services marketplace: Recommendations from the Shared Services Roundtable, March 2015, https://www.fiscal.treasury.gov/fstraining/events/Building-a-Shared Services-Maketplaceroundtable.pdf; Gautham Nagesh, “OPM claims victory in huge e-payroll system consolidation,” NextGov, October 21, 2009, http://www.nextgov.com/defense/2009/10/opm-claims-victory-in-huge-e-payroll- system-consolidation/45086/.
Data-driven decision making in government
19
A number of colleagues within Deloitte member firms generously contributed their time and insights to this report. In no particular order, the authors would like to thank Tina Mendelson, Geoff Bieger, Scott Klisures, K. K. Pruitt, Juergen Klenk, and Joseph Bakkal for shedding light on challenges in managing the federal public health mission. Kevin Bingham, B. J. Walker, and Kevin Bell provided valuable insights on using analytics to improve human services. Genevieve Oudar, Benjamin Goldman, Erin McDermott, Jim Ziglar, Paul Rich, and Trent Williams all gave us important information about challenges in managing transportation objectives. Nate Jackson helped us understand nuances of the art and science of grant-making. Catesby Beck and Natalie Mazza helped show us the promise of analytics for improving opera-tions within state government agencies. Kalli Simon and Emily Gilbert charted the landscape of existing mission analytics service offerings for us. Bill Roberts, Shawnice Hawthrone, Peter Liu, Brian Hutchin-son, Ryan Donnally, Vaden Ball, and Dave Thomas graciously shared their wealth of knowledge about federal efforts at a wide range of agencies.
William Eggers and John O’Leary from the Deloitte Center for Government Insights provided valuable inputs and critical editorial help at important junctures.
The authors would also like to thank James Hildebrand for his thoughtful review, feedback, and support throughout the research and drafting process.
In addition, the authors would like to thank Lara Allen of the Office of Justice Programs (OJP), Corey Hill of the Federal Railroad Administration (FRA), Julie Fishman from the US Centers for Disease Control and Prevention (CDC), and Mary Bohman and Lewrene Glaser of the USDA Economic Research Service (ERS) for sharing their agencies’ data-driven decision making journeys. Their inputs, insights, and reviews helped the story come to life.
ACKNOWLEDGEMENTS
Mission analytics
20
Sean ConlinPrincipalDeloitte Consulting LLP+1 571 814 [email protected]
Rachel FreyPrincipalDeloitte Consulting LLP+1 916 288 [email protected]
Sundhar SekharPrincipalDeloitte Consulting LLP+1 717 651 [email protected]
Frank StricklandManaging directorDeloitte Consulting LLP+1 571 814 [email protected]
Chris WhitlockManaging directorDeloitte Consulting LLP+1 404 942 [email protected]
William EggersExecutive director, Deloitte Center for Government InsightsDeloitte Services LP+1 571 882 6585 [email protected]
Cathryn MarcuseManager, Deloitte Center for Government Insights Deloitte Services LP+1 571 882 [email protected]
CONTACTS
Data-driven decision making in government
21
In the digital era, organizations can increasingly leverage data specific to their core mission to improve performance. Deloitte’s Mission Analytics offering applies contemporary data science approaches, largely in the context of existing client technology architectures, to deliver insight on current performance or to make important operational predictions. Robust open-source tools enable teams to work quickly with minimal technology resourcing for many projects. In other projects, teams configure and use leading statistical analytical packages to create results with robust enterprise support. Either way, organizations can leverage mission analytics to put their data to work and gain useful insights. Please reach out to any of the contacts listed in this article for more information.
Mission analytics
22

Data-driven decision making in government
About Deloitte University Press Deloitte University Press publishes original articles, reports and periodicals that provide insights for businesses, the public sector and NGOs. Our goal is to draw upon research and experience from throughout our professional services organization, and that of coauthors in academia and business, to advance the conversation on a broad spectrum of topics of interest to executives and government leaders.
Deloitte University Press is an imprint of Deloitte Development LLC.
About this publication This publication contains general information only, and none of Deloitte Touche Tohmatsu Limited, its member firms, or its and their affiliates are, by means of this publication, rendering accounting, business, financial, investment, legal, tax, or other professional advice or services. This publication is not a substitute for such professional advice or services, nor should it be used as a basis for any decision or action that may affect your finances or your business. Before making any decision or taking any action that may affect your finances or your business, you should consult a qualified professional adviser.
None of Deloitte Touche Tohmatsu Limited, its member firms, or its and their respective affiliates shall be responsible for any loss whatsoever sustained by any person who relies on this publication.
About Deloitte Deloitte refers to one or more of Deloitte Touche Tohmatsu Limited, a UK private company limited by guarantee, and its network of member firms, each of which is a legally separate and independent entity. Please see www.deloitte.com/about for a detailed description of the legal structure of Deloitte Touche Tohmatsu Limited and its member firms. Please see www.deloitte.com/us/about for a detailed description of the legal structure of Deloitte LLP and its subsidiaries. Certain services may not be available to attest clients under the rules and regulations of public accounting.
Copyright © 2016 Deloitte Development LLC. All rights reserved. Member of Deloitte Touche Tohmatsu Limited
Follow @DU_Press
Sign up for Deloitte University Press updates at DUPress.com.