Embed Size (px)
Citation preview

About the Florida Chamber Foundation The Florida Chamber Foundation is a research organization and problem solver, working in partnership with state business leaders to advance and fund activities in public policy research that promote the future of Florida. Founded 42 years ago by the Florida Chamber of Commerce, the Foundation is a critical voice for improving the state's pro-business climate to enable Florida to grow and prosper. The Foundation produces innovative research, with long term results, by advancing public policy, research, and leadership development; promoting a statewide community; and, serving as a resource and catalyst for creative solutions to statewide challenges.
Supported by Foundation research, a clear vision for Florida was developed and a framework created to help move Florida forward. That vision set three simple goals: to achieve prosperity and high-paying jobs, to support vibrant communities, and to advance global competitiveness. The framework to accomplish this vision is known simply as the “Six Pillars”. The product of years of collaboration and more than a million dollars in research, the Six Pillars identify the critical factors determining Florida’s future:
Talent Supply and Education
Innovation and Economic Development
Infrastructure and Growth Leadership
Business Climate and Competitiveness
Civic and Governance Systems
Quality of Life and Quality Places
The Six Pillars framework serves as an organizing force for strategic planning at the local, regional, and state levels. Its power is in the efficiency of harnessing disparate viewpoints into a common and consistent conversation. Building on the widespread adoption of the Six Pillars framework and previous Cornerstone research series, the Foundation’s current objective is to develop a dynamic statewide strategic plan for Florida in 2030. This ongoing effort will require a commitment to measuring current status and progress toward stated goals. To this end, the Foundation offers a dynamic online tool – the Florida Scorecard (www.thefloridascorecard.com) – to track metrics within each of the Six Pillars.
To learn more about the Foundation and the vision for 2030, visit our web site at www.FLFoundation.org. If you would like copies of this report or more information, please contact:
Florida Chamber of Commerce Foundation Post Office Box 11309 Tallahassee, Florida 32302-3309 Phone: 850.521.1200 www.FLFoundation.org
Cover credit: European Commission Joint Research Centre 2010

Florida Chamber of Commerce Foundation, Inc. 2010-2011 Board of Trustees
Chair Jane A. Adams University of Florida Immediate Past Chair Jeffrey J. Lyash Progress Energy, Inc. Trustees Clarence E. Anthony Anthony Government Solutions, Inc. William Carlson, Jr. Tucker/Hall, Inc. Diane Carr Hopping Green & Sams, P.A. Jennifer Chapman Fidelity Investments, Inc. Marshall M. Criser III AT&T Florida Pam Dana Institute for Human and Machine Cognition Jacob DiPietre Walt Disney Attractions, Inc. Vincent M. Dolan Progress Energy Florida, Inc. Eric J. Eikenberg Holland & Knight, LLP Michael P. Gallagher SantaFe HealthCare, Inc. Bill Goede Bank of America Timothy M. Goldfarb Shands HealthCare Teri A. Hansen Gulf Coast Community Foundation of Venice Charles Harris Treman, Kemker, Scharf Chris Hart IV Workforce Florida, Inc. M. Clayton Hollis, Jr. Publix Super Markets, Inc. Lila Jaber Gunster, Yoakley & Stewart, P.A. Belinda Keiser Keiser University
Dr. Larry Lake Bay View Healthcare Steven J. Lezman PepsiCo. Tropicana Products, Inc. Cindi Marsiglio Wal-Mart Stores, Inc. Carl Miller, Jr. Wachovia Bank, N.A. David Odahowski Edyth Bush Charitable Foundation Bill Perry Gunster Law Firm Todd Powell Plum Creek Real Estate Division Rick R. Qualman IBM Corporation Pam Rauch Florida Power & Light Company Gina Reynolds Columbia County Industrial Development Authority Michelle Robinson Verizon, Inc. Stuart L. Rogel Tampa Bay Partnership John M. Sebree Florida Realtors Dr. Barbara Sloan Tallahassee Community College Jacob V. Stuart Central Florida Partnership Pam Tedesco The Arland Affiliation Bentina C. Terry Gulf Power Company Chris Thompson VISIT FLORIDA Susan Towler Blue Cross Blue Shield Florida (Currently Vacant) Florida’s Great Northwest, Inc. Mark Wilson Florida Chamber of Commerce John F. Wines Maglev Development Corp.
Florida Trade and Logistics Study
Commissioned by:
Florida Chamber of Commerce Foundation
Florida Department of Transportation
Study Partners:
The Foundation gratefully acknowledges the efforts of the organizations and individuals providing guidance and support for this study.
A. Duda & Sons, Inc.
AT&T Florida. Inc.
Bryant, Miller & Olive
Chamber of Commerce of The Palm Beaches
Charlotte County Economic Development Office
Collins Center for Public Policy
Columbia County Industrial Development Authority
CSX Transportation, Inc.
Economic Development Council of Collier County
Enterprise Florida, Inc.
Florida Airports Council
Florida Council of 100
Florida Economic Development Council
Florida Land Council
Florida Ports Council
Florida Trucking Association
Gulf Power Company
Littlejohn, Mann & Associates
Lykes Bros., Inc.
Norfolk Southern Corp.
The PBSJ Corporation
Plum Creek Timber Company, Inc.
Publix Super Markets, Inc.
Rockefeller Group Development Corporation
United States Sugar Corporation
Wren Group LLC
Technical Support:
Prepared by: Cambridge Systematics, Inc.
With: Martin Associates, Inc.
Table of Contents
Executive Summary
1.0 Introduction ................................................................................................ 1
2.0 Global Trade Trends .................................................................................. 3 Shifting Global Economic Growth ......................................................... 3 Changing U.S. Economy .......................................................................... 5 Changing Global Trade Lanes ................................................................ 7 Changing Logistics Patterns ................................................................... 8 What Are Other States Doing? ............................................................... 9 Implications for Florida ......................................................................... 10
3.0 Trade and Logistics in Florida ................................................................ 11 Florida Trade Flows Today ................................................................... 11 Florida Trade and Logistics Industry .................................................. 12 Future Florida Trade Flows .................................................................. 12
4.0 Florida’s Opportunities ............................................................................ 14 Florida’s Competitive Position ............................................................. 14 Future Opportunities ............................................................................. 17 Summary .................................................................................................. 22
5.0 Strategies ................................................................................................... 23 Talent Supply and Education ............................................................... 24 Innovation and Economic Development............................................. 25 Infrastructure and Growth Leadership ............................................... 26 Business Climate and Competitiveness .............................................. 30 Civic and Governance Systems ............................................................ 30 Quality of Life and Quality Places ....................................................... 31
6.0 Call to Action ............................................................................................ 32
Glossary of Terms .............................................................................................. 34
Endnotes ............................................................................................................. 36
2nd printing February 2011
This document has been revised since initial publication to include updated data and provide minor corrections.

List of Tables
Table 2.1 Depth of U.S. Atlantic and Gulf Coast Seaports ................................ 8
Table 3.1 Projected Florida Trade by Mode and Cargo Type .......................... 13
Table 4.1 Estimated Cost of Moving a Container from Hong Kong to Serve the Florida Import Market, using Alternative Ports of Entry and Florida Distribution Center Locations ............................. 19
Table 5.1 Employment in Fast Growing Trade and Logistics Occupations in Florida ..................................................................... 24
Table 6.1 Summary of Recommended Strategies, Organized by the Six Pillars ................................................................................................ 33
List of Figures
Figure 2.1 Major Global Economies, 2010 and 2060 .......................................... 4
Figure 2.2 Emerging U.S. Megaregions .............................................................. 5
Figure 2.3 Global Shipping Lanes and Gateways ................................................ 6
Figure 2.4 Emerging Opportunities for Florida ................................................. 10
Figure 3.1 Total Freight Flows to, from, and within Florida, 2009 ................... 11
Figure 3.2 Total Freight Flows by Mode, 2009 (in millions of tons) ................ 11
Figure 3.3 Trade and Logistics Jobs by State .................................................... 12
Figure 4.1 Florida’s Freight Transportation System .......................................... 15
Figure 4.2 Florida Origin Exports ...................................................................... 19
Figure 4.3 Global Air Routes and Cargo Hubs .................................................. 22
Figure 5.1 Six Pillars of Florida’s Future Economy .......................................... 23
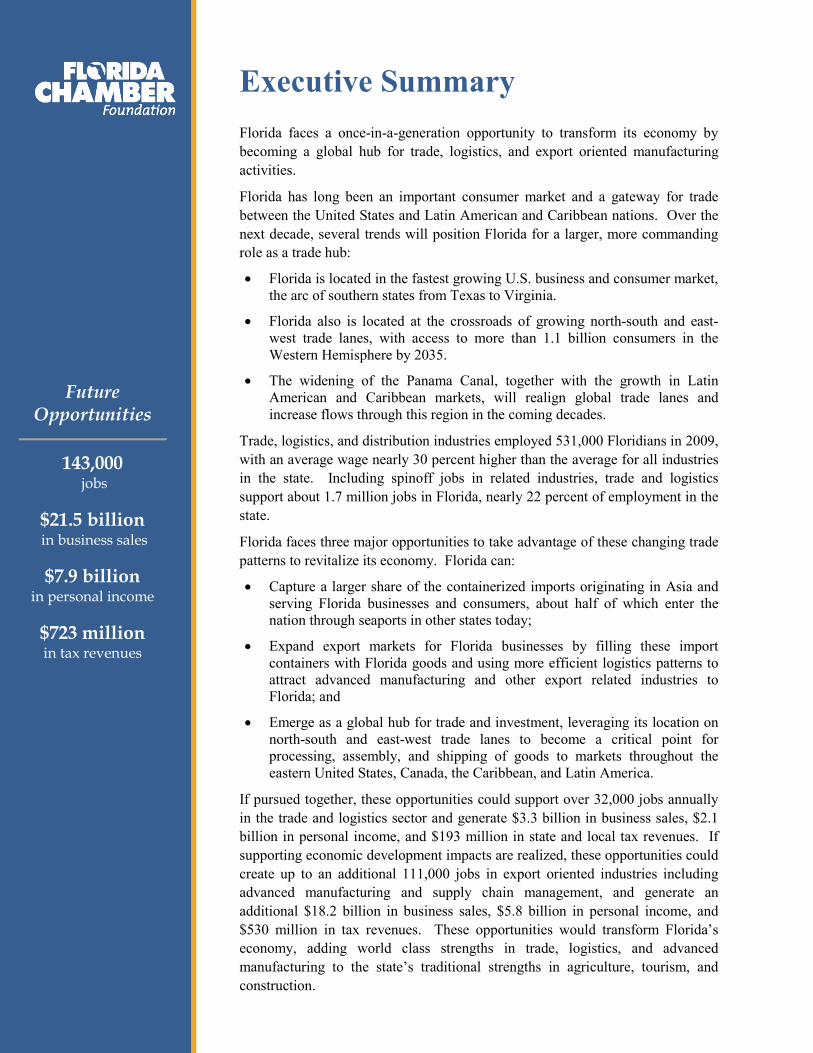
Executive Summary Florida faces a once-in-a-generation opportunity to transform its economy by becoming a global hub for trade, logistics, and export oriented manufacturing activities.
Florida has long been an important consumer market and a gateway for trade between the United States and Latin American and Caribbean nations. Over the next decade, several trends will position Florida for a larger, more commanding role as a trade hub:
• Florida is located in the fastest growing U.S. business and consumer market, the arc of southern states from Texas to Virginia.
• Florida also is located at the crossroads of growing north-south and east-west trade lanes, with access to more than 1.1 billion consumers in the Western Hemisphere by 2035.
• The widening of the Panama Canal, together with the growth in Latin American and Caribbean markets, will realign global trade lanes and increase flows through this region in the coming decades.
Trade, logistics, and distribution industries employed 531,000 Floridians in 2009, with an average wage nearly 30 percent higher than the average for all industries in the state. Including spinoff jobs in related industries, trade and logistics support about 1.7 million jobs in Florida, nearly 22 percent of employment in the state.
Florida faces three major opportunities to take advantage of these changing trade patterns to revitalize its economy. Florida can:
• Capture a larger share of the containerized imports originating in Asia and serving Florida businesses and consumers, about half of which enter the nation through seaports in other states today;
• Expand export markets for Florida businesses by filling these import containers with Florida goods and using more efficient logistics patterns to attract advanced manufacturing and other export related industries to Florida; and
• Emerge as a global hub for trade and investment, leveraging its location on north-south and east-west trade lanes to become a critical point for processing, assembly, and shipping of goods to markets throughout the eastern United States, Canada, the Caribbean, and Latin America.
If pursued together, these opportunities could support over 32,000 jobs annually in the trade and logistics sector and generate $3.3 billion in business sales, $2.1 billion in personal income, and $193 million in state and local tax revenues. If supporting economic development impacts are realized, these opportunities could create up to an additional 111,000 jobs in export oriented industries including advanced manufacturing and supply chain management, and generate an additional $18.2 billion in business sales, $5.8 billion in personal income, and $530 million in tax revenues. These opportunities would transform Florida’s economy, adding world class strengths in trade, logistics, and advanced manufacturing to the state’s traditional strengths in agriculture, tourism, and construction.
Future Opportunities
143,000 jobs
$21.5 billion in business sales
$7.9 billion in personal income
$723 million in tax revenues

Summary of Critical Near Term Actions
Achieving this vision will require a coordinated effort involving economic development, transportation, land use, workforce, and related investments. Critical near term action is needed in the following areas:
1. Support the leadership of the Governor as Florida’s economic development officer and trade ambassador to market Florida as a trade and logistics hub and to attract business investment to the state.
2. Expedite plans to create at least one seaport with 50 feet of channel depth and with an on dock or near dock rail connection by 2014, the scheduled completion of the Panama Canal expansion. This seaport would be able to serve as a first port of call for the largest container ships using the Panama Canal. The investment should be coordinated with a focused trade mission to help Florida pursue first call services from Asian container lines, as well as strategic investments in international distribution centers.
3. Identify global trade and logistics as a statewide targeted industry and a focus area for Enterprise Florida, Workforce Florida, the Florida Department of Transportation, and other state agencies. The state must strengthen existing marketing, incentives, and support services to meet the needs of this cluster.
4. Continue efforts to double the value of Florida origin exports over the next five years by pursuing opportunities to place Florida goods in the many containers and other vehicles which currently enter Florida full and leave empty.
5. Identify investments needed to maintain and expand Miami International Airport’s role as a global hub, as well as the potential benefits of creating a second tier air cargo hub elsewhere in Florida.
6. Advance planning for an integrated statewide network of trade gateways, logistics centers, and transportation corridors through Florida’s Strategic Intermodal System. The Florida Department of Transportation should work with partners to identify and address critical bottlenecks and connectivity gaps in this system.
7. Provide sufficient and reliable funding for future state investments in Florida’s trade, transportation, and economic development systems.

1.0 Introduction Florida’s economy is in a period of transition. Six decades of nearly uninterrupted growth have yielded to the state’s deepest recession and first year of population loss since World War II. Florida faces significant economic challenges – yet its economic opportunities remain bright.
The Florida Chamber Foundation is leading a statewide initiative to develop an economic blueprint for the next two decades. This effort will position Florida for prosperity and high paying jobs, vibrant communities, and global competitiveness by focusing on the Six Pillars of Florida’s future economy. A critical element is diversifying Florida’s economic base and identifying new drivers of Florida’s economy.
Six Pillars of Florida’s Future Economy
At the same time, the Florida Department of Transportation over the past few years has worked closely with more than 80 statewide partners to update statewide plans covering the statewide Strategic Intermodal System, aviation, rail, and seaports, and to develop the 2060 Florida Transportation Plan, the state’s first ever 50 year transportation policy framework. All of these initiatives pointed to the need to prepare for anticipated growth in domestic and international trade.
Building on these two initiatives, the Foundation convened a statewide partnership of public and private organizations to explore Florida’s opportunities as a global hub for trade and logistics. In partnership with the Florida Department of Transportation, economic development organizations, and other statewide transportation and business stakeholders, the Foundation conducted a comprehensive study of trade flows and logistics in Florida.
1 1
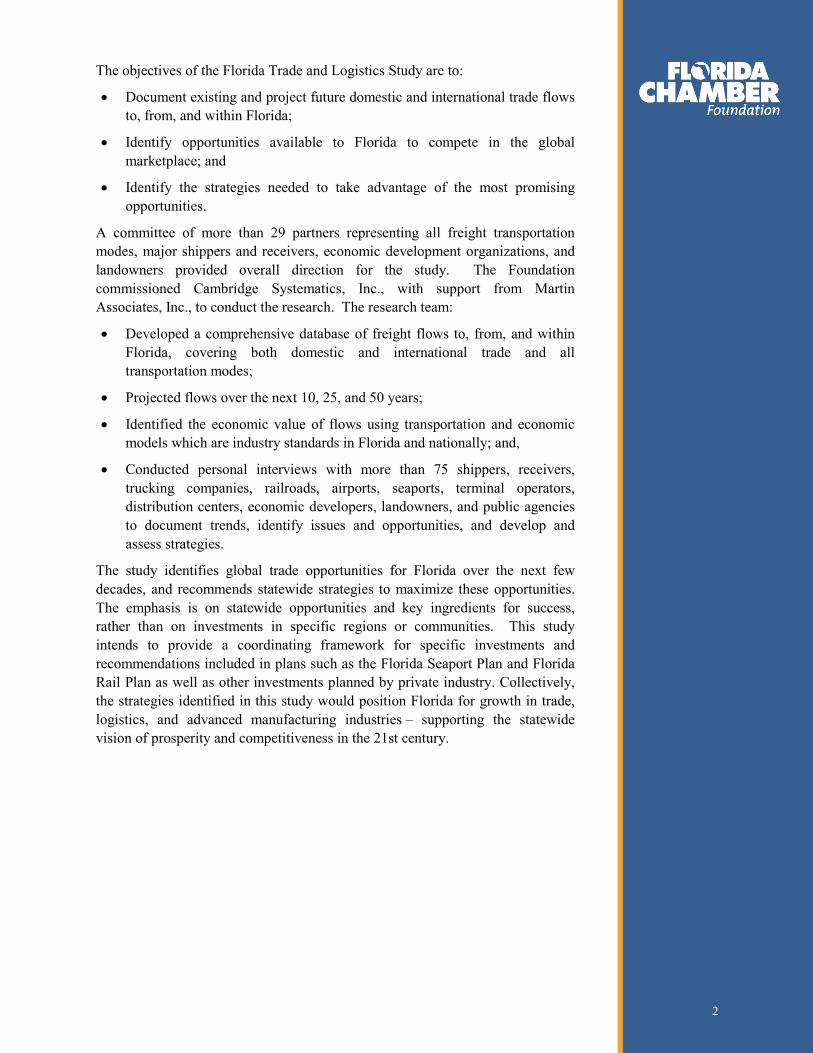
The objectives of the Florida Trade and Logistics Study are to:
• Document existing and project future domestic and international trade flows to, from, and within Florida;
• Identify opportunities available to Florida to compete in the global marketplace; and
• Identify the strategies needed to take advantage of the most promising opportunities.
A committee of more than 29 partners representing all freight transportation modes, major shippers and receivers, economic development organizations, and landowners provided overall direction for the study. The Foundation commissioned Cambridge Systematics, Inc., with support from Martin Associates, Inc., to conduct the research. The research team:
• Developed a comprehensive database of freight flows to, from, and within Florida, covering both domestic and international trade and all transportation modes;
• Projected flows over the next 10, 25, and 50 years;
• Identified the economic value of flows using transportation and economic models which are industry standards in Florida and nationally; and,
• Conducted personal interviews with more than 75 shippers, receivers, trucking companies, railroads, airports, seaports, terminal operators, distribution centers, economic developers, landowners, and public agencies to document trends, identify issues and opportunities, and develop and assess strategies.
The study identifies global trade opportunities for Florida over the next few decades, and recommends statewide strategies to maximize these opportunities. The emphasis is on statewide opportunities and key ingredients for success, rather than on investments in specific regions or communities. This study intends to provide a coordinating framework for specific investments and recommendations included in plans such as the Florida Seaport Plan and Florida Rail Plan as well as other investments planned by private industry. Collectively, the strategies identified in this study would position Florida for growth in trade, logistics, and advanced manufacturing industries – supporting the statewide vision of prosperity and competitiveness in the 21st century.
2 2
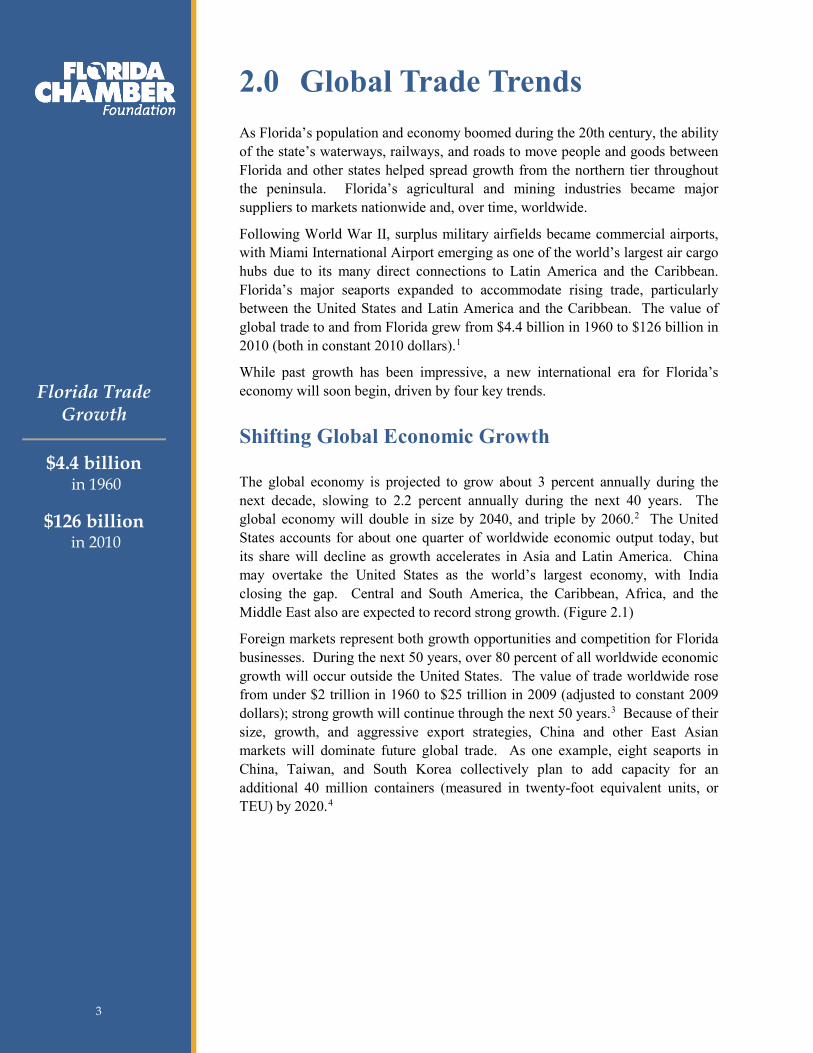
2.0 Global Trade Trends As Florida’s population and economy boomed during the 20th century, the ability of the state’s waterways, railways, and roads to move people and goods between Florida and other states helped spread growth from the northern tier throughout the peninsula. Florida’s agricultural and mining industries became major suppliers to markets nationwide and, over time, worldwide.
Following World War II, surplus military airfields became commercial airports, with Miami International Airport emerging as one of the world’s largest air cargo hubs due to its many direct connections to Latin America and the Caribbean. Florida’s major seaports expanded to accommodate rising trade, particularly between the United States and Latin America and the Caribbean. The value of global trade to and from Florida grew from $4.4 billion in 1960 to $126 billion in 2010 (both in constant 2010 dollars).1
While past growth has been impressive, a new international era for Florida’s economy will soon begin, driven by four key trends.
Shifting Global Economic Growth
The global economy is projected to grow about 3 percent annually during the next decade, slowing to 2.2 percent annually during the next 40 years. The global economy will double in size by 2040, and triple by 2060.2
Foreign markets represent both growth opportunities and competition for Florida businesses. During the next 50 years, over 80 percent of all worldwide economic growth will occur outside the United States. The value of trade worldwide rose from under $2 trillion in 1960 to $25 trillion in 2009 (adjusted to constant 2009 dollars); strong growth will continue through the next 50 years.
The United States accounts for about one quarter of worldwide economic output today, but its share will decline as growth accelerates in Asia and Latin America. China may overtake the United States as the world’s largest economy, with India closing the gap. Central and South America, the Caribbean, Africa, and the Middle East also are expected to record strong growth. (Figure 2.1)
3 Because of their size, growth, and aggressive export strategies, China and other East Asian markets will dominate future global trade. As one example, eight seaports in China, Taiwan, and South Korea collectively plan to add capacity for an additional 40 million containers (measured in twenty-foot equivalent units, or TEU) by 2020.4
Florida Trade Growth
$4.4 billion in 1960
$126 billion in 2010
3 3
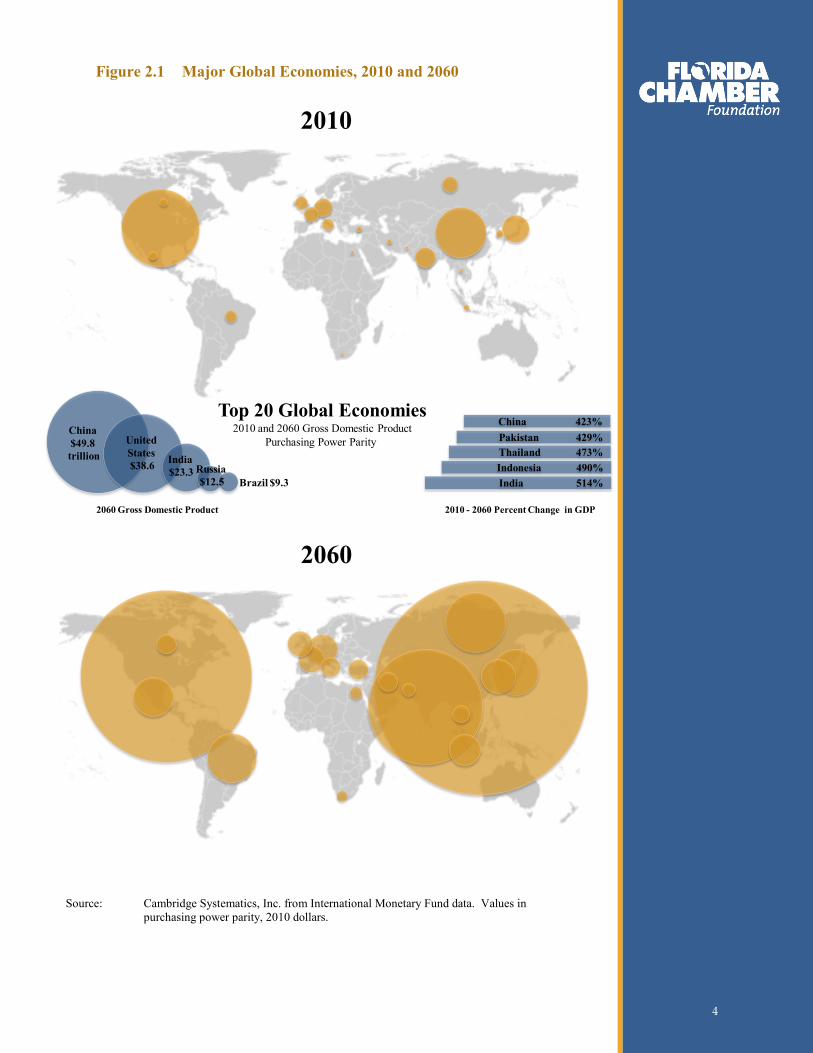
Figure 2.1 Major Global Economies, 2010 and 2060
China $49.8 trillion
United States $38.6 India
$23.3 Russia$12.5 Brazil $9.3
Top 20 Global Economies2010 and 2060 Gross Domestic Product
Purchasing Power Parity
2010
2060
China 423%Pakistan 429%Thailand 473%Indonesia 490%India 514%
2060 Gross Domestic Product 2010 - 2060 Percent Change in GDP
Source: Cambridge Systematics, Inc. from International Monetary Fund data. Values in
purchasing power parity, 2010 dollars.
4 4
Changing U.S. Economy
Following the recession, the U.S. gross domestic product is projected to grow about 2.3 percent per year through 2020, with slightly lower rates thereafter.5 The demand for freight transportation will increase as the economy grows. Total U.S. freight volumes are projected to grow from 18.6 billion tons in 2007 to 27.1 billion tons in 2040, or about 1.2 percent per year. The value of freight will grow 2.7 percent per year during this period, reflecting more rapid growth in high value cargo typically carried in containers.6
The U.S. economy will continue its shift to services, information, and technology as key sources of jobs. Even with a decline in manufacturing jobs, productivity gains will increase manufacturing output and generate more freight. The United States will look to other nations as markets for agricultural and manufactured goods – particularly technology products – as well as sources of raw materials and basic manufactured goods.
Between the 1860s and the 1960s, international trade grew slowly, accounting for a relatively small portion of U.S. economic activity. After the 1960s, international trade grew, exceeding 24 percent of the U.S. economy today. The combined value of U.S. imports and exports is expected to quadruple by 2035, reaching 55 percent of gross domestic product.7
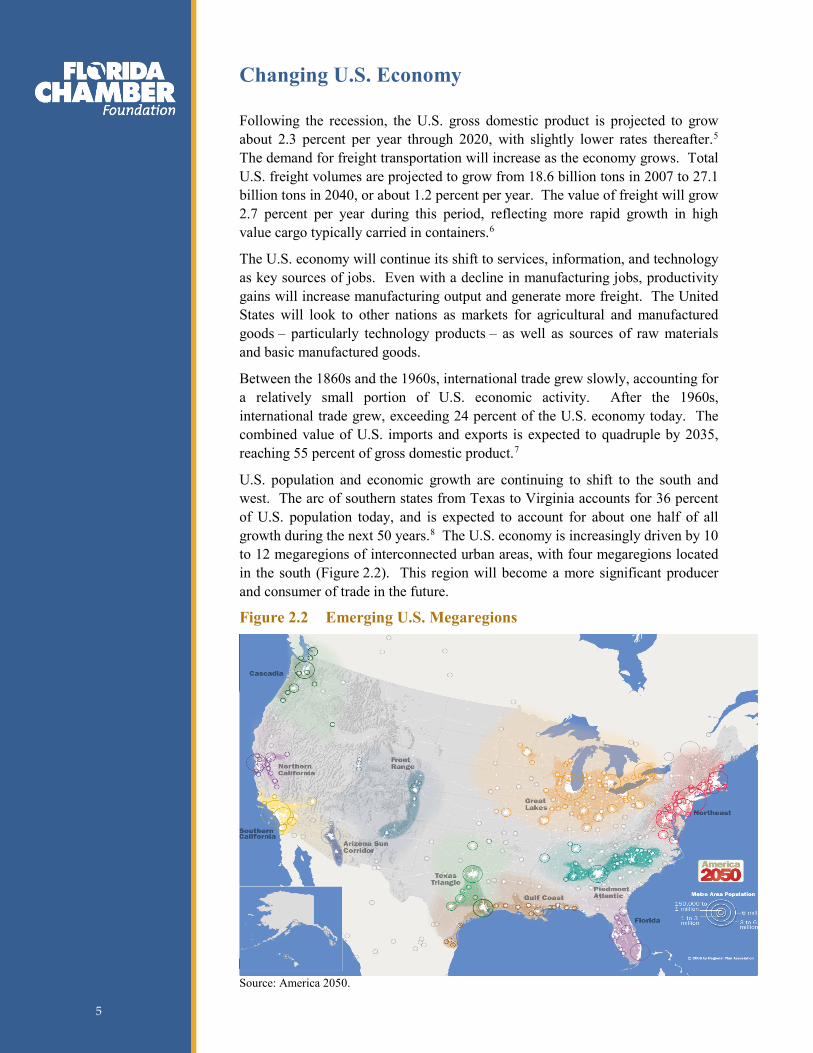
U.S. population and economic growth are continuing to shift to the south and west. The arc of southern states from Texas to Virginia accounts for 36 percent of U.S. population today, and is expected to account for about one half of all growth during the next 50 years.
8
Figure 2.2 Emerging U.S. Megaregions
The U.S. economy is increasingly driven by 10 to 12 megaregions of interconnected urban areas, with four megaregions located in the south (Figure 2.2). This region will become a more significant producer and consumer of trade in the future.
1
- 3 -
Source: America 2050.
5 5
Changing Global Trade Lanes
Historically, the major trade flows to and from the United States have been over the surface borders with Canada and Mexico, across the Atlantic Ocean with Europe, and across the Pacific Ocean with Asia (Figure 2.3). These trade patterns are rapidly realigning in response to several trends:
• Strong population and economic growth in the southern United States is drawing more trade to this region;
• A series of labor disputes and rail service disruptions, along with rising congestion, increased costs, more stringent environmental policies, and increasing security concerns have prompted steamship lines to reduce reliance on Pacific Coast seaports and spread cargo to the Atlantic and Gulf Coasts;
• The widening of the Panama Canal will reduce ocean carrier costs and the time associated with an all water route between east Asia and the U.S. Atlantic and Gulf Coasts;
• Increased production and export activity in India – which today accounts for only a fraction of U.S. imports – and other parts of south and southeast Asia may favor trade lanes to the eastern United States through the Suez Canal;
• More stable economic growth and a shift in low cost production to eastern and southern Africa is creating new trade lanes across the south Atlantic Ocean; and
• Continued growth among Florida’s traditional trading partners in Latin America and the Caribbean, and the potential reopening of relations with Cuba, will increase north-south trade through the Atlantic Ocean, Caribbean Sea, and Gulf of Mexico.
Figure 2.3 Global Shipping Lanes and Gateways
Top 30 Global Container Seaports2009 Volume in Twenty-Foot Equivalentswith Commercial Shipping Lane Density
30 million
10 m
5 m
Source: Container volume from American Association of Port Authorities, 2009. Commercial shipping activity from National Center for Ecological Analysis and Synthesis.
6 6

Panama Canal Expansion: Implications for Florida The expansion of the Panama Canal, which is planned for completion by the Canal’s 100th anniversary in 2014, will reshape trade flows worldwide. Because trade with China has become the single largest driver of U.S. waterborne container volumes, and because the Panama Canal is a key route for China-U.S. trade, its expansion is critical.
The Canal’s current dimensions allow passage of container ships with up to 4,400 TEU, known as Panamax vessels. The expansion will accommodate larger, post-Panamax vessels carrying up to 12,600 TEU, which require 50 feet of draft in fresh water (equivalent to 48 feet in salt water).9 Industry estimates suggest post-Panamax vessels account for about 30 percent of all ships today, but a large majority of all ships on order. Over 150 post-Panamax ships currently call on west coast seaports, and some can be redirected to the Panama Canal route if their owners believe the overall economics warrant the change.10
Even with the Canal’s current dimensions, there has been a noticeable increase in all water services between East Asia and the U.S. Atlantic and Gulf Coasts. All water services are replacing traditional services with U.S. Pacific Coast seaports and cross country intermodal rail shipments. In 2006, the transpacific route accounted for 75 percent of Asian imports to the United States, with an average shipping time of 18.3 days. The Panama Canal route accounted for 19 percent of Asian imports and an average time of 21.6 days.
11
Seaports desiring to serve the largest ships transiting the Canal must provide navigation channels with 50 feet of depth. Only one U.S. Atlantic Coast seaport, Norfolk, has at least 50 foot depth for both its channel and berths today (Table 2.1).
The Canal widening will reduce costs and time by enabling larger ships and reducing congestion at the locks, making Asian service to the Gulf or Atlantic Coast seaports competitive with service to the Pacific Coast and a transcontinental rail shipment. Ocean carriers may choose to share their cost reductions with shippers to increase volumes through the Canal route, but this will be balanced against reducing volumes in their existing East Asia to the west coast routes.
12
Some Panama Canal traffic may be on smaller ships, or may be transloaded through seaports in Panama and the Caribbean, so U.S. seaports offering less than 50 feet of depth also will benefit from Panama Canal traffic. Larger container ports will continue to focus on developing container trade with Asia; midsize and developing container ports will pursue regional carriers as well as Asian feeder service. Growth in non-China container trade, and in general cargo and bulk commodity trade, also is expected. The factors driving seaport selection today – terminal capacity, efficiency, and operating costs; proximity to customers, markets, and distribution centers; and landside truck and rail services and infrastructure – will continue to play a key role in determining which seaports attract and retain the greatest share of traffic.
Miami and New York have federal authorization to reach this depth but need funding to complete their projects. Plans to deepen harbors and channels at Port Everglades, Savannah, Jacksonville, and Charleston are in various stages of review and study by the U.S. Army Corps of Engineers.
7 7
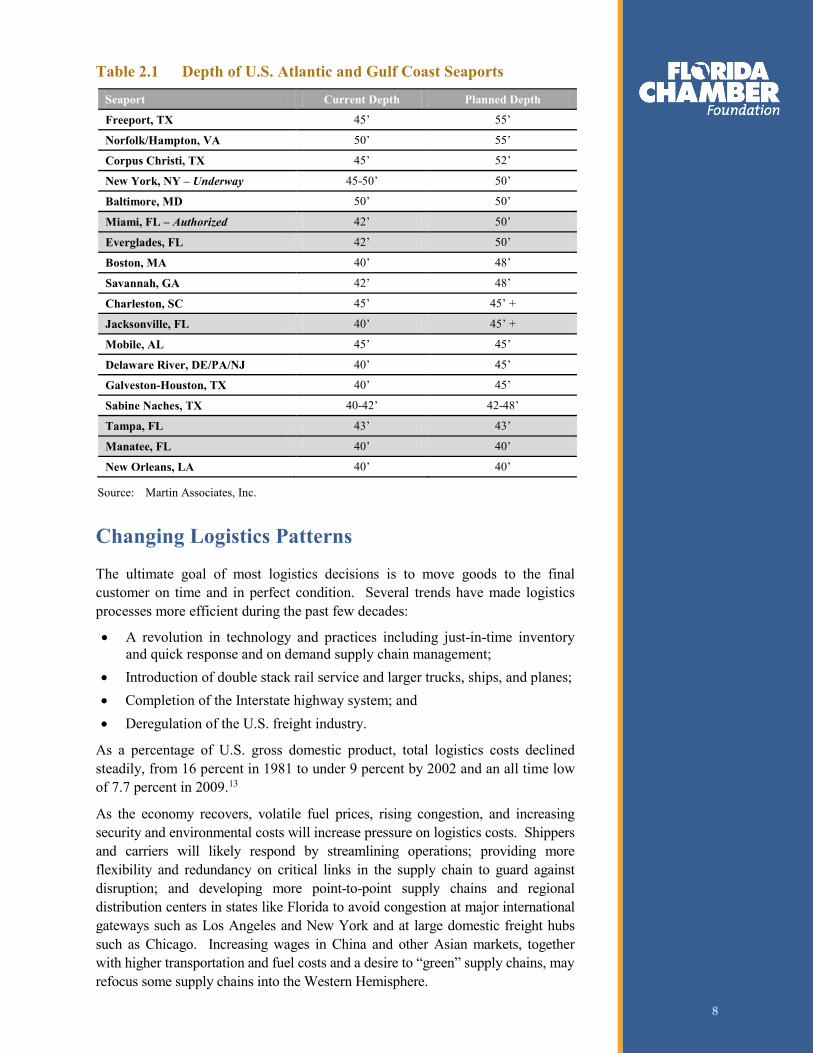
Table 2.1 Depth of U.S. Atlantic and Gulf Coast Seaports
Seaport Current Depth Planned Depth
Freeport, TX 45’ 55’
Norfolk/Hampton, VA 50’ 55’
Corpus Christi, TX 45’ 52’
New York, NY – Underway 45-50’ 50’
Baltimore, MD 50’ 50’
Miami, FL – Authorized 42’ 50’
Everglades, FL 42’ 50’
Boston, MA 40’ 48’
Savannah, GA 42’ 48’
Charleston, SC 45’ 45’ +
Jacksonville, FL 40’ 45’ +
Mobile, AL 45’ 45’
Delaware River, DE/PA/NJ 40’ 45’
Galveston-Houston, TX 40’ 45’
Sabine Naches, TX 40-42’ 42-48’
Tampa, FL 43’ 43’
Manatee, FL 40’ 40’
New Orleans, LA 40’ 40’
Source: Martin Associates, Inc.
Changing Logistics Patterns
The ultimate goal of most logistics decisions is to move goods to the final customer on time and in perfect condition. Several trends have made logistics processes more efficient during the past few decades:
• A revolution in technology and practices including just-in-time inventory and quick response and on demand supply chain management;
• Introduction of double stack rail service and larger trucks, ships, and planes; • Completion of the Interstate highway system; and • Deregulation of the U.S. freight industry.
As a percentage of U.S. gross domestic product, total logistics costs declined steadily, from 16 percent in 1981 to under 9 percent by 2002 and an all time low of 7.7 percent in 2009.13
As the economy recovers, volatile fuel prices, rising congestion, and increasing security and environmental costs will increase pressure on logistics costs. Shippers and carriers will likely respond by streamlining operations; providing more flexibility and redundancy on critical links in the supply chain to guard against disruption; and developing more point-to-point supply chains and regional distribution centers in states like Florida to avoid congestion at major international gateways such as Los Angeles and New York and at large domestic freight hubs such as Chicago. Increasing wages in China and other Asian markets, together with higher transportation and fuel costs and a desire to “green” supply chains, may refocus some supply chains into the Western Hemisphere.
8 8
What Are Other States Doing?
Many of Florida’s competitors are preparing for growth in international and domestic trade.
Alabama – The Alabama State Port Authority is improving marine terminals, intermodal rail yards, warehouse infrastructure, and intermodal connections to help the Port of Mobile expand its activities. A new privately developed container terminal at Choctaw Point has increased the port’s capacity. The port is served by several Class I railroads and is improving these connections. Companies which locate or expand operations on Port Authority property are eligible for a corporate income tax credit calculated at five percent of capital costs of the project for up to 20 years. The Alabama Industrial Development Training program provides on-site training for newly hired and incumbent workers in targeted industries.
Georgia – The Georgia Ports Authority has made significant investments in its seaports over the last few decades. The Port of Savannah is studying the deepening of the Savannah River to 48 feet. A decision on federal authorization is anticipated in 2011. Savannah aggressively expanded container facilities during the past decade and supported extensive distribution center development. The Georgia Ports Authority has attracted 19 distribution centers totaling 15 million square feet. Georgia and South Carolina are exploring a new container port facility at Jasper Island. The Georgia Department of Transportation is leading development of a statewide freight and logistics plan and studying the feasibility of truck only lanes serving the ports. The Georgia Port Authority Tax Bonus is available to industries locating or expanding in the state and using Georgia’s ports.
Kansas/Missouri – The states of Kansas and Missouri are two of several partners supporting the development of the Kansas City SmartPort, which promotes and enhances the 18 county, bistate Kansas City region’s potential as a leading North American logistics hub. The SmartPort focuses on three key activities: economic development, trade data exchange, and business services. The SmartPort is intended to be a major hub for rail, trucking, and air cargo activity for domestic and international products. Partners include the Greater Kansas City Chamber of Commerce, the Kansas City Area Development Council, and the Mid-America Regional Council.
Michigan – Several communities from Detroit to Ann Arbor are targeting growth of air cargo-related industries, drawing upon the many transcontinental flights which hub through Detroit. The Detroit Regional Aerotropolis will coordinate and market investments over a 60,000 acre region to attract trade and international business. The Next Michigan Development Act empowers regional economic development entities with incentives to attract businesses to the state, including the aerotropolis. In addition, the state is working on ongoing improvements to international border crossings, including a new bridge to Canada.
Texas – Texas has a history of investing in its trade and transportation infrastructure, including recent investments in seaports, inland ports, border crossings, and highway, rail, and waterway trade corridors. The Port of Houston Authority has expanded facilities at Bayport and Barbours Cut. The Bayport facility has capacity for 2.3 million TEU. Through partnerships with the Texas Department of Transportation (TxDOT) and Harris County, the port has modernized and continues to improve highway and rail access. Alliance is home to one of the most successful combinations of manufacturing and transportation facilities in the U.S, which provides Class I rail service, air cargo service, and highway access to major manufacturers and regional and national shippers. TxDOT continues to make targeted improvements to major trade corridors, including Interstate 35 and the planned extension of Interstate 69 from Indianapolis to Laredo. In addition, TxDOT is also leading the development of border master plans in El Paso and Laredo to facilitate international trade.
Virginia – Virginia has invested significantly in its transportation and logistics infrastructure. The Port of Virginia, with harbor depth exceeding 50 feet, has deepened one berth to 50 feet and is planning to deepen others. A private container terminal has opened in Portsmouth and the port is planning a massive new container terminal at Craney Island. In addition, the Virginia Inland Port near Front Royal provides an inland distribution hub to connect the port to markets in Virginia and other states throughout the mid Atlantic region with service from Norfolk Southern Railroad. Norfolk Southern has partnered with federal and state entities through the Heartland Corridor to raise tunnel clearances, allowing operation of double-stack service from Norfolk to Chicago. 9 9
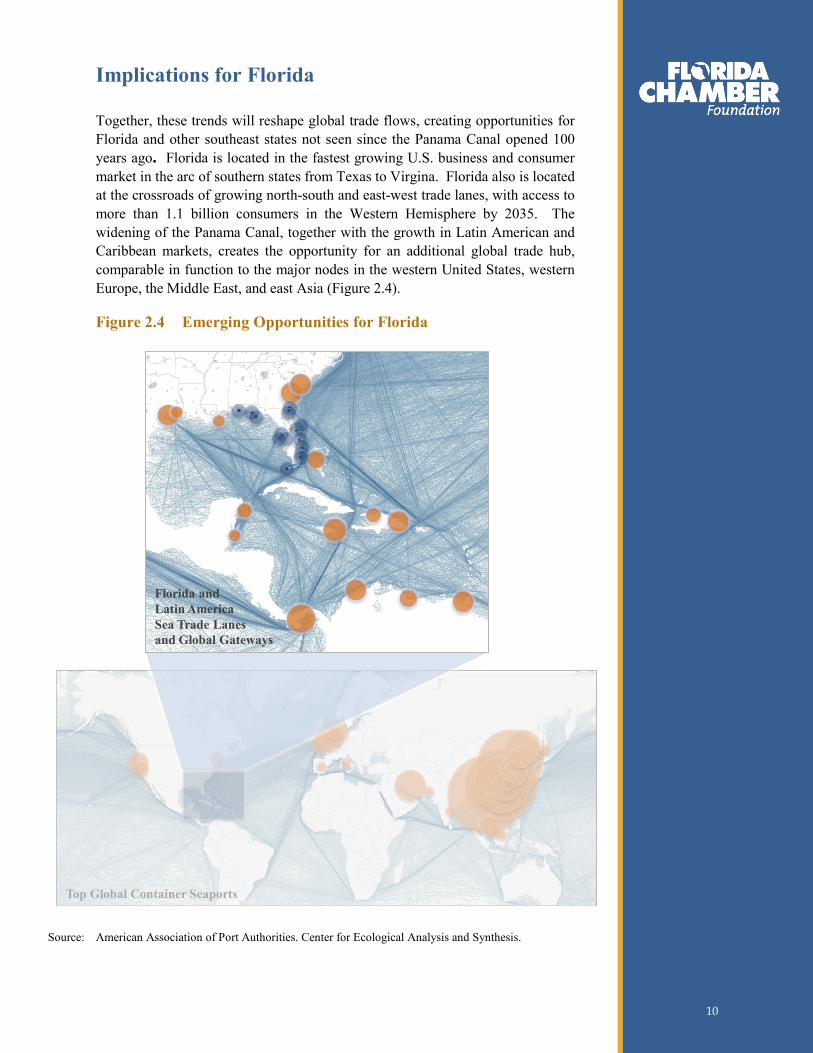
Implications for Florida
Together, these trends will reshape global trade flows, creating opportunities for Florida and other southeast states not seen since the Panama Canal opened 100 years ago. Florida is located in the fastest growing U.S. business and consumer market in the arc of southern states from Texas to Virgina. Florida also is located at the crossroads of growing north-south and east-west trade lanes, with access to more than 1.1 billion consumers in the Western Hemisphere by 2035. The widening of the Panama Canal, together with the growth in Latin American and Caribbean markets, creates the opportunity for an additional global trade hub, comparable in function to the major nodes in the western United States, western Europe, the Middle East, and east Asia (Figure 2.4).
Figure 2.4 Emerging Opportunities for Florida
Top Global Container Seaports
Florida and Latin America Sea Trade Lanes and Global Gateways
Source: American Association of Port Authorities. Center for Ecological Analysis and Synthesis.
10 10
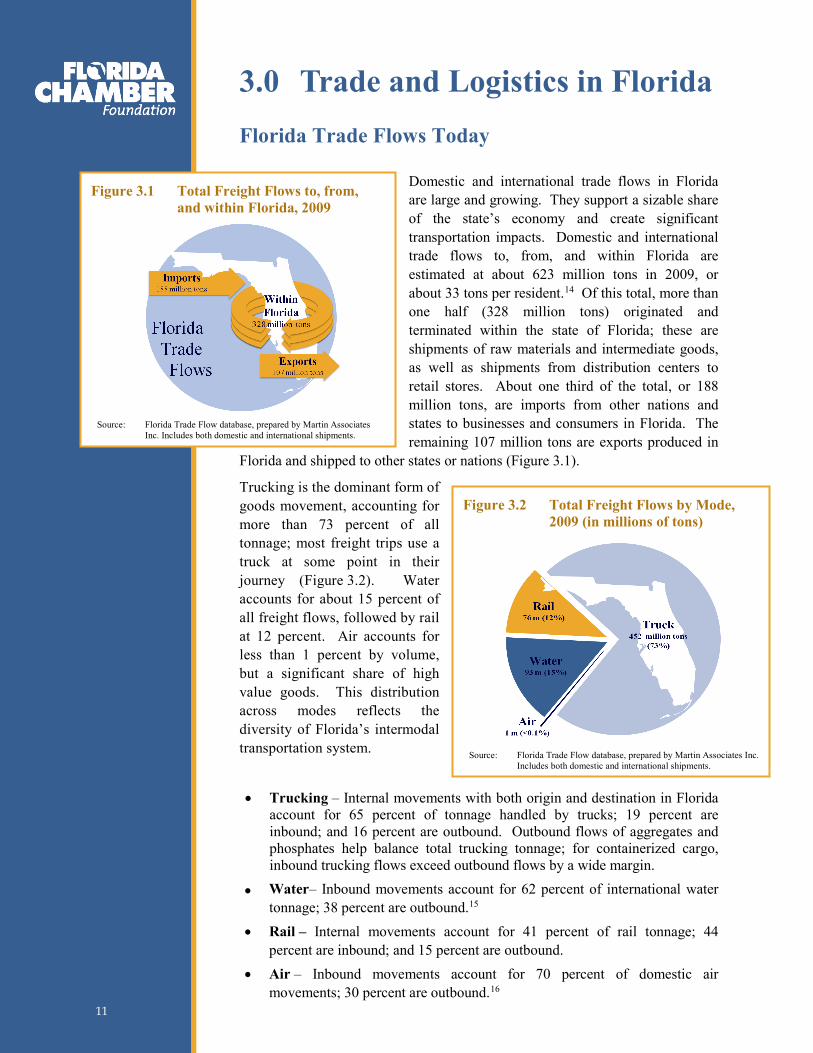
3.0 Trade and Logistics in Florida Florida Trade Flows Today
Domestic and international trade flows in Florida are large and growing. They support a sizable share of the state’s economy and create significant transportation impacts. Domestic and international trade flows to, from, and within Florida are estimated at about 623 million tons in 2009, or about 33 tons per resident.14
Trucking is the dominant form of goods movement, accounting for more than 73 percent of all tonnage; most freight trips use a truck at some point in their journey (Figure 3.2). Water accounts for about 15 percent of all freight flows, followed by rail at 12 percent. Air accounts for less than 1 percent by volume, but a significant share of high value goods. This distribution across modes reflects the diversity of Florida’s intermodal transportation system.
Of this total, more than one half (328 million tons) originated and terminated within the state of Florida; these are shipments of raw materials and intermediate goods, as well as shipments from distribution centers to retail stores. About one third of the total, or 188 million tons, are imports from other nations and states to businesses and consumers in Florida. The remaining 107 million tons are exports produced in
Florida and shipped to other states or nations (Figure 3.1).
• Trucking – Internal movements with both origin and destination in Florida
account for 65 percent of tonnage handled by trucks; 19 percent are inbound; and 16 percent are outbound. Outbound flows of aggregates and phosphates help balance total trucking tonnage; for containerized cargo, inbound trucking flows exceed outbound flows by a wide margin.
• Water– Inbound movements account for 62 percent of international water tonnage; 38 percent are outbound.15
• Rail – Internal movements account for 41 percent of rail tonnage; 44 percent are inbound; and 15 percent are outbound.
• Air – Inbound movements account for 70 percent of domestic air movements; 30 percent are outbound.16
Figure 3.1 Total Freight Flows to, from, and within Florida, 2009
Source: Florida Trade Flow database, prepared by Martin Associates
Inc. Includes both domestic and international shipments.
Figure 3.2 Total Freight Flows by Mode, 2009 (in millions of tons)
Source: Florida Trade Flow database, prepared by Martin Associates Inc.
Includes both domestic and international shipments.
11 11
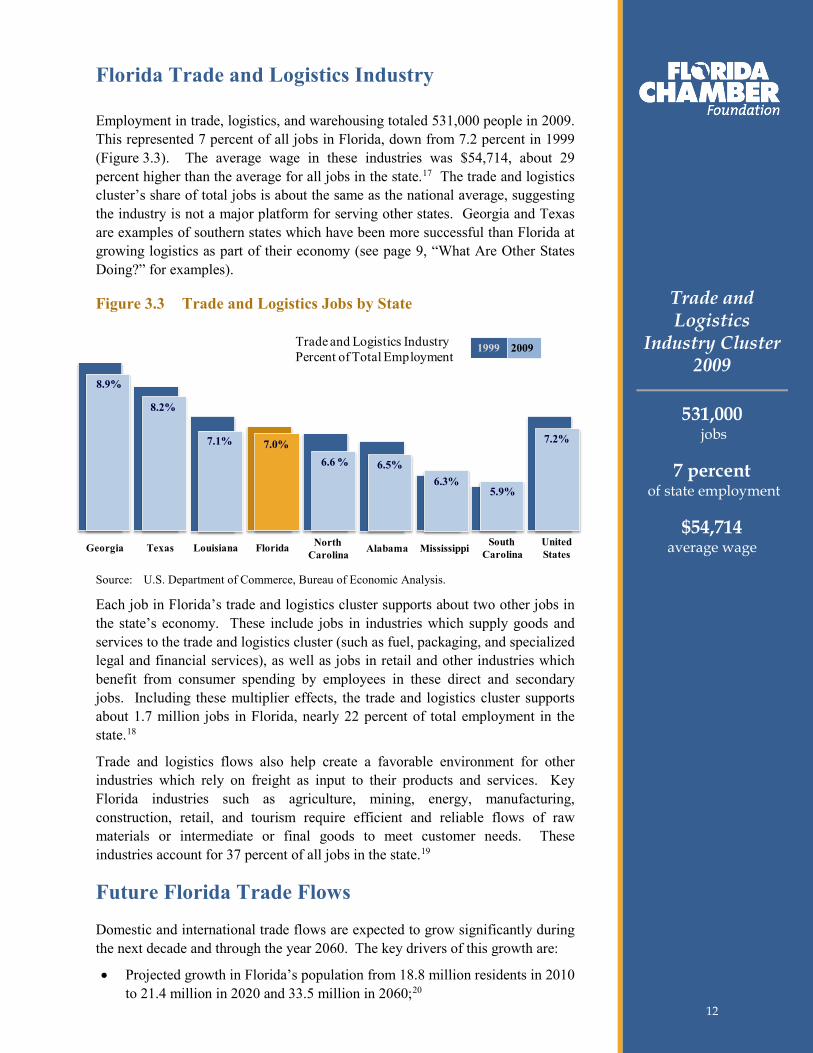
Florida Trade and Logistics Industry
Employment in trade, logistics, and warehousing totaled 531,000 people in 2009. This represented 7 percent of all jobs in Florida, down from 7.2 percent in 1999 (Figure 3.3). The average wage in these industries was $54,714, about 29 percent higher than the average for all jobs in the state.17
Figure 3.3 Trade and Logistics Jobs by State
The trade and logistics cluster’s share of total jobs is about the same as the national average, suggesting the industry is not a major platform for serving other states. Georgia and Texas are examples of southern states which have been more successful than Florida at growing logistics as part of their economy (see page 9, “What Are Other States Doing?” for examples).
Source: U.S. Department of Commerce, Bureau of Economic Analysis.
Each job in Florida’s trade and logistics cluster supports about two other jobs in the state’s economy. These include jobs in industries which supply goods and services to the trade and logistics cluster (such as fuel, packaging, and specialized legal and financial services), as well as jobs in retail and other industries which benefit from consumer spending by employees in these direct and secondary jobs. Including these multiplier effects, the trade and logistics cluster supports about 1.7 million jobs in Florida, nearly 22 percent of total employment in the state.18
Trade and logistics flows also help create a favorable environment for other industries which rely on freight as input to their products and services. Key Florida industries such as agriculture, mining, energy, manufacturing, construction, retail, and tourism require efficient and reliable flows of raw materials or intermediate or final goods to meet customer needs. These industries account for 37 percent of all jobs in the state.
19
Future Florida Trade Flows
Domestic and international trade flows are expected to grow significantly during the next decade and through the year 2060. The key drivers of this growth are:
• Projected growth in Florida’s population from 18.8 million residents in 2010 to 21.4 million in 2020 and 33.5 million in 2060;20
Trade and Logistics Industry Percent of Total Employment
20091999
FloridaGeorgia Texas Louisiana NorthCarolina Alabama Mississippi South
CarolinaUnitedStates
8.9%
8.2%
7.2%7.1% 7.0%6.6 % 6.5%
6.3%5.9%
Trade and Logistics
Industry Cluster 2009
531,000 jobs
7 percent of state employment
$54,714 average wage
12 12
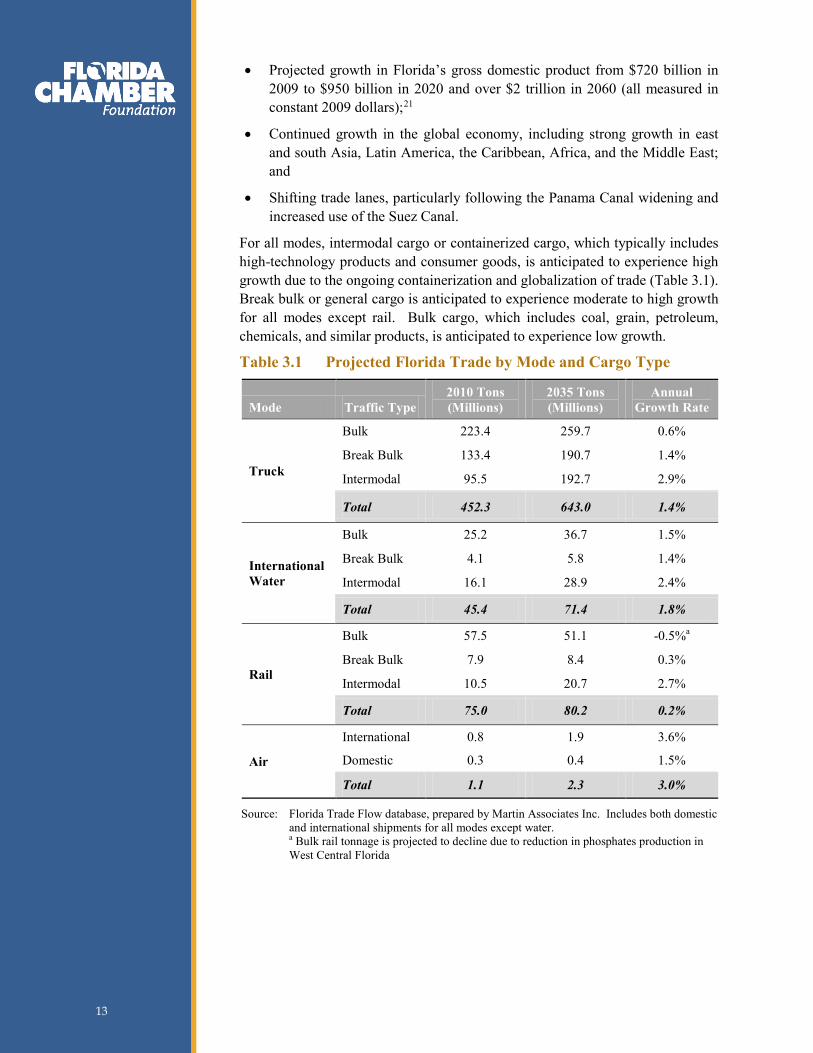
• Projected growth in Florida’s gross domestic product from $720 billion in 2009 to $950 billion in 2020 and over $2 trillion in 2060 (all measured in constant 2009 dollars);21
• Continued growth in the global economy, including strong growth in east and south Asia, Latin America, the Caribbean, Africa, and the Middle East; and
• Shifting trade lanes, particularly following the Panama Canal widening and increased use of the Suez Canal.
For all modes, intermodal cargo or containerized cargo, which typically includes high-technology products and consumer goods, is anticipated to experience high growth due to the ongoing containerization and globalization of trade (Table 3.1). Break bulk or general cargo is anticipated to experience moderate to high growth for all modes except rail. Bulk cargo, which includes coal, grain, petroleum, chemicals, and similar products, is anticipated to experience low growth.
Table 3.1 Projected Florida Trade by Mode and Cargo Type
Mode Traffic Type 2010 Tons (Millions)
2035 Tons (Millions)
Annual Growth Rate
Truck
Bulk 223.4 259.7 0.6%
Break Bulk 133.4 190.7 1.4%
Intermodal 95.5 192.7 2.9%
Total 452.3 643.0 1.4%
International Water
Bulk 25.2 36.7 1.5%
Break Bulk 4.1 5.8 1.4%
Intermodal 16.1 28.9 2.4%
Total 45.4 71.4 1.8%
Rail
Bulk 57.5 51.1 -0.5%a
Break Bulk 7.9 8.4 0.3%
Intermodal 10.5 20.7 2.7%
Total 75.0 80.2 0.2%
Air
International 0.8 1.9 3.6%
Domestic 0.3 0.4 1.5%
Total 1.1 2.3 3.0%
Source: Florida Trade Flow database, prepared by Martin Associates Inc. Includes both domestic and international shipments for all modes except water. a Bulk rail tonnage is projected to decline due to reduction in phosphates production in West Central Florida
13 13
4.0 Florida’s Opportunities
Florida’s Competitive Position
Florida enjoys many competitive strengths in trade and logistics, but also faces significant challenges.
Strengths
• Large consumer market. Florida’s population, nearly 19 million residents in 2010, will soon rank 3rd among the states. Florida also hosted nearly 83 million out of state visitors last year, another large market for consumer goods.
• Strategic location. Florida is located near the intersection of growing east-west and north-south trade lanes. This location has allowed Florida to establish a dominant position for north-south trade, accounting for more than 25 percent of the value of all U.S. trade with the Caribbean, and more than 35 percent with Central and South America. These well established trade lanes are a critical foundation for Florida trade.
• Transportation infrastructure. Florida’s extensive transportation system moves freight to, from, and within the state. The system includes (Figure 4.1):22
– 21 commercial service airports, including the Miami International Airport, which ranked 12th worldwide (and 4th in the United States) for cargo volumes in 2009;
– The nation’s largest commercial spaceport at Cape Canaveral (and newly licensed spaceport under development at Cecil Field near Jacksonville), which position Florida for future growth in the emerging commercial space industry;
– 14 deepwater seaports, including 4 of the nation’s 25 largest container seaports;
– More than 3,475 miles of shipping, intracoastal and inland navigable waterways, including the Atlantic and Gulf Intracoastal Waterways and major inland waterways including the Escambia, Miami, and St. Johns’ Rivers;
– Nearly 2,800 miles of rail lines, with 48 large freight rail terminals (those handling at least 500,000 tons per year), including 9 intermodal freight rail terminals; and
– More than 12,000 centerline miles of State Highways, of which nearly one third are designated as part of Florida’s Strategic Intermodal System.
• Extensive global ties. Florida’s population is one of the most diverse among the states, with a large percentage of residents who are foreign born or have cultural ties to other nations, especially Latin America and the
Florida provides shippers with access to the
largest and fastest growing region of the United States, the arc of southern
states from Virginia to Texas.
14 14
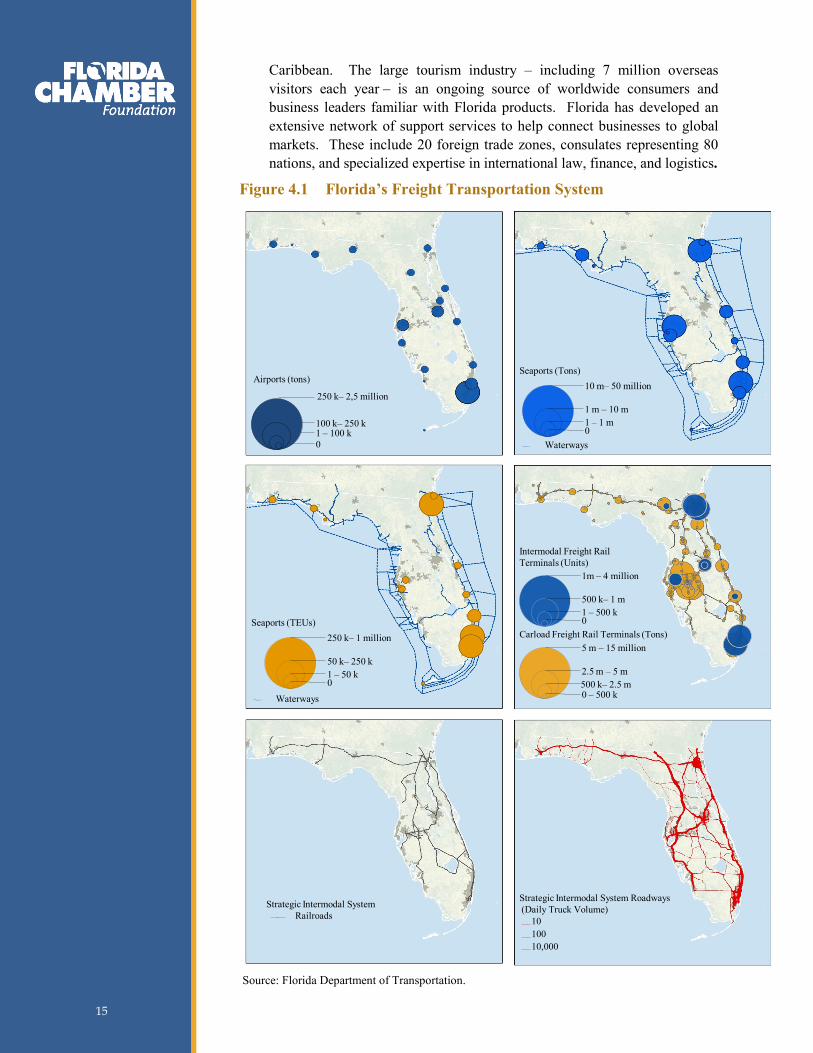
Caribbean. The large tourism industry – including 7 million overseas visitors each year – is an ongoing source of worldwide consumers and business leaders familiar with Florida products. Florida has developed an extensive network of support services to help connect businesses to global markets. These include 20 foreign trade zones, consulates representing 80 nations, and specialized expertise in international law, finance, and logistics.
Figure 4.1 Florida’s Freight Transportation System
Airports (tons)
250 k– 2,5 million
100 k– 250 k1 – 100 k0
Seaports (TEUs)250 k– 1 million
50 k– 250 k1 – 50 k0
Seaports (Tons)10 m– 50 million
1 m – 10 m1 – 1 m0
Intermodal Freight Rail Terminals (Units)
1m – 4 million
500 k– 1 m1 – 500 k0
Carload Freight Rail Terminals (Tons)5 m – 15 million
2.5 m – 5 m500 k– 2.5 m 0 – 500 k
Strategic Intermodal SystemRailroads
Waterways
Strategic Intermodal System Roadways(Daily Truck Volume)
1010010,000
Waterways
Source: Florida Department of Transportation.
15 15
Challenges
• Imbalance of trade flows. The combination of a large consumer market and a small manufacturing base create an imbalance of trade flows. The trade flow analysis indicate inbound freight tonnage (from other states or nations) is nearly 80 percent larger than outbound freight tonnage. This suggests nearly one half of all trucks, rail cars, ships, and cargo planes which bring goods to Florida return empty – adding to the cost of delivering goods in the state.23
• Poor location for domestic distribution. Florida traditionally has been a poor location for distributing goods to other parts of the United States because of its location on a peninsula in the southeast corner of the nation. For example, when traveling 500 miles by highway, 27 percent of the U.S. population is reachable from Atlanta, but only 14 percent from Orlando. When traveling 1,000 miles by rail, 74 percent of the U.S. population is reachable from Atlanta, but only 29 percent from Orlando. This poor domestic location has reinforced the small size of Florida’s manufacturing industry.
• Limited penetration of Asian and European trade lanes. Despite its large size, Florida remains a small player in U.S. trade with Asia and Europe. Florida accounts for less than 5 percent of U.S. trade by value with Europe and Asia, as well as Canada and Mexico, which tend to use the surface border with the United States.
• Transportation system capacity. Florida’s seaports must deepen channels, expand terminals, and improve road and rail connections to accommodate growth in freight and passenger flows. Air passenger and cargo travel may exceed available capacity at Florida’s airports by 2060, unless significant investments are made. The freight rail system does not currently serve all regions of the state, and available rail capacity may not be sufficient for a significant increase in intermodal freight volumes as well as planned expansion of passenger rail service. Most major urban and interregional highway corridors will likely be heavily congested during peak periods by 2035, even after planned investments are made.
• Limited funding. Public sector funding for transportation and economic development at the state, regional, and local levels in Florida remains constrained. Economic development funding traditionally has been smaller as a percentage of gross state product than competitor states, and funding levels are not predictable from year to year. Available transportation funding will not be sufficient to pay for all needed transportation capacity improvements, and the funding gap is likely to grow as demand increases.
Nearly half of the trucks, rail
cars, ships, and cargo planes bound for Florida return empty – adding to
the cost of delivering goods in
the state.
16 16
Future Opportunities
Florida is well positioned to significantly expand its role in domestic and international trade and logistics. Florida has three major opportunities to enhance its competitive position.
1. Maximize Florida’s Ability to Serve its Businesses and Consumers through Florida Gateways
A significant share of international imports destined for Florida markets do not enter the state through Florida trade gateways – rather, they enter the country through seaports and airports in other states, and then move to Florida via truck or rail. Likewise, a large share of the international exports produced by Florida businesses do not exit the state through Florida gateways. Other states are generating jobs and economic activity by importing/exporting, consolidating/deconsolidating, and otherwise managing/adding value to the flow of goods destined for (or produced in) Florida. Florida has an immediate opportunity to expand trade and logistics activity simply by capturing cargo ultimately consumed or generated in Florida.
The key opportunity is to capture a larger share of imported containers, particularly Asian cargo consumed in Florida but moving via other seaports. In 2009, Florida seaports handled 55 percent of the containerized waterborne imports ultimately consumed in Florida – 38 percent of containerized cargo originating in Asia, and 70 percent of cargo originating in other continents. This represents a loss of 1.4 million tons of Asian cargo and 0.9 million tons of non-Asian cargo to other states in that year. Of the Asian imported cargo moving through seaports and then directly to market in Florida, 38 percent entered the United States through a Florida seaport, 36 percent through Los Angeles/Long Beach, 13 percent through Savannah, and 4 percent through New York/ New Jersey.24
In addition, an estimated 8.8 million tons of cargo enter the United States through seaports in other states, are consolidated through distribution centers in other states, and then move via truck to Florida for final consumption. Major distribution center regions serving Florida include Atlanta, New Orleans, and Memphis.
These seaports also are key competitors for non-Asian cargo.
In total, the volume of imports handled through other states’ seaports and consumed in Florida is more than 11 million tons – equivalent to about 12 percent of all waterborne freight in Florida today. This represents about 1.3 million fully loaded containers and about 3.1 million total containers including exports and empty containers. Capturing all of this import flow (and associated returns) directly through Florida seaports essentially would double the total number of containers moving through Florida’s system.
The study analyzed the transportation and logistics costs involved in moving an imported container from Hong Kong to distribution centers located in northeast, central, or southeast Florida via three paths for entering the United States: Florida seaports, the Port of Savannah, and the Port of Los Angeles/Long Beach (Table 4.1) The cost of moving an imported container from Hong Kong into via a direct all water service, to a Florida seaport, to a Florida distribution center is
Of containerized imports from Asia
arriving via a seaport and
moving directly to market…
38 percent
enter through Florida seaports…
36 percent
through Los Angeles…
13 percent
though Savannah…
4 percent
through New York.
17 17
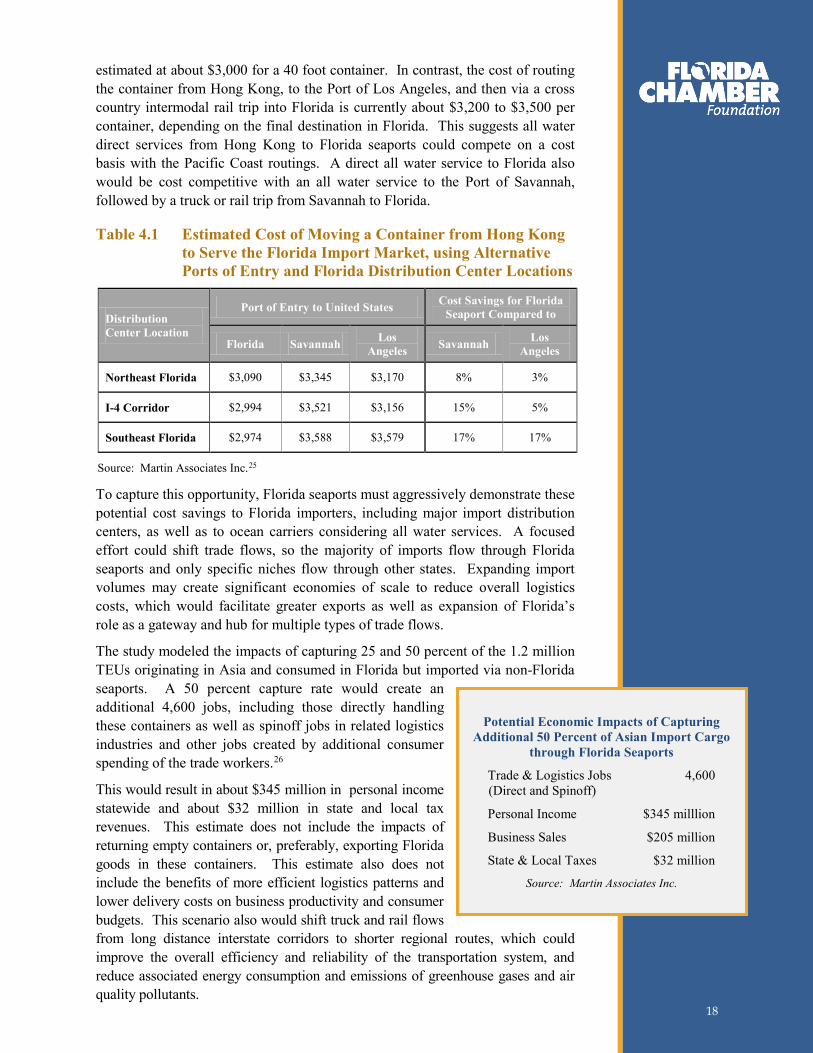
estimated at about $3,000 for a 40 foot container. In contrast, the cost of routing the container from Hong Kong, to the Port of Los Angeles, and then via a cross country intermodal rail trip into Florida is currently about $3,200 to $3,500 per container, depending on the final destination in Florida. This suggests all water direct services from Hong Kong to Florida seaports could compete on a cost basis with the Pacific Coast routings. A direct all water service to Florida also would be cost competitive with an all water service to the Port of Savannah, followed by a truck or rail trip from Savannah to Florida.
Table 4.1 Estimated Cost of Moving a Container from Hong Kong to Serve the Florida Import Market, using Alternative Ports of Entry and Florida Distribution Center Locations
Distribution Center Location
Port of Entry to United States Cost Savings for Florida Seaport Compared to
Florida Savannah Los Angeles Savannah Los
Angeles
Northeast Florida $3,090 $3,345 $3,170 8% 3%
I-4 Corridor $2,994 $3,521 $3,156 15% 5%
Southeast Florida $2,974 $3,588 $3,579 17% 17%
Source: Martin Associates Inc.25
To capture this opportunity, Florida seaports must aggressively demonstrate these potential cost savings to Florida importers, including major import distribution centers, as well as to ocean carriers considering all water services. A focused effort could shift trade flows, so the majority of imports flow through Florida seaports and only specific niches flow through other states. Expanding import volumes may create significant economies of scale to reduce overall logistics costs, which would facilitate greater exports as well as expansion of Florida’s role as a gateway and hub for multiple types of trade flows.
The study modeled the impacts of capturing 25 and 50 percent of the 1.2 million TEUs originating in Asia and consumed in Florida but imported via non-Florida seaports. A 50 percent capture rate would create an additional 4,600 jobs, including those directly handling these containers as well as spinoff jobs in related logistics industries and other jobs created by additional consumer spending of the trade workers.26
This would result in about $345 million in personal income statewide and about $32 million in state and local tax revenues. This estimate does not include the impacts of returning empty containers or, preferably, exporting Florida goods in these containers. This estimate also does not include the benefits of more efficient logistics patterns and lower delivery costs on business productivity and consumer budgets. This scenario also would shift truck and rail flows from long distance interstate corridors to shorter regional routes, which could improve the overall efficiency and reliability of the transportation system, and reduce associated energy consumption and emissions of greenhouse gases and air quality pollutants.
Potential Economic Impacts of Capturing Additional 50 Percent of Asian Import Cargo
through Florida Seaports
Trade & Logistics Jobs 4,600 (Direct and Spinoff)
Personal Income $345 milllion
Business Sales $205 million
State & Local Taxes $32 million
Source: Martin Associates Inc.
18 18

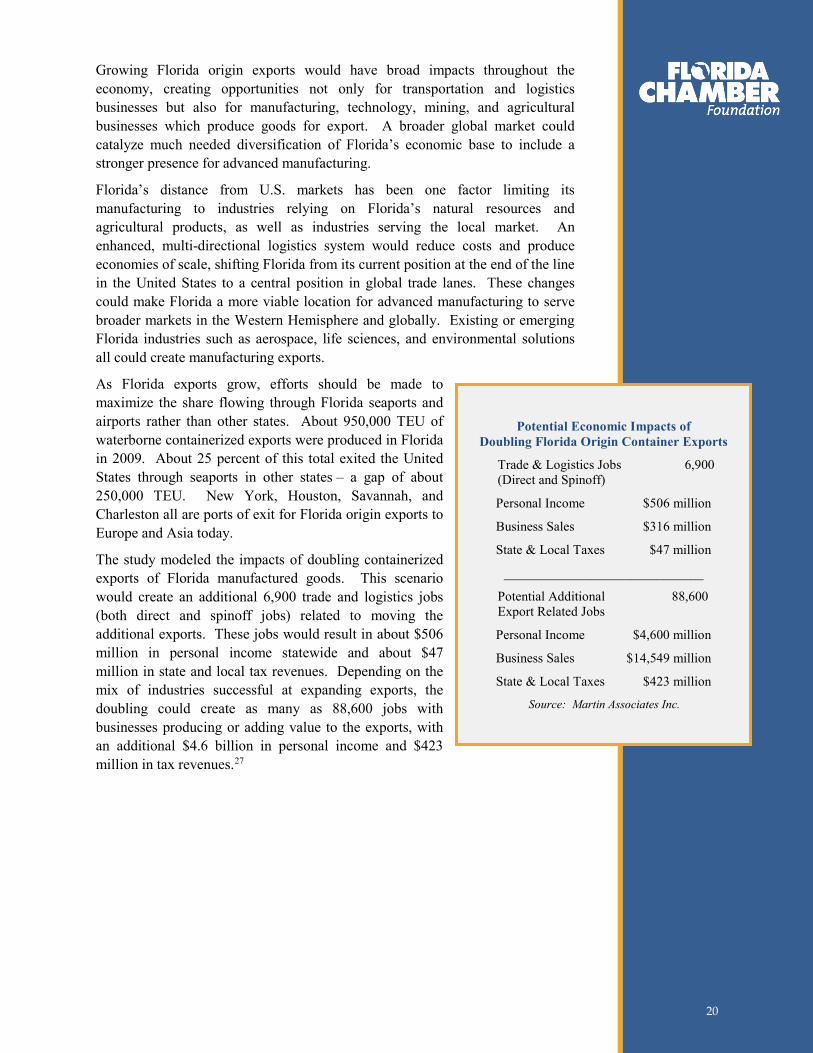
2. Grow Florida Origin Exports The second opportunity is to grow exports of goods produced in Florida, expanding markets for more businesses worldwide and creating more balanced trade flows.
Florida exported $55.2 billion of Florida produced goods in 2010, a total which ranks 4th among the states. The Florida Chamber of Commerce, Enterprise Florida, and other partners have called for the state to double the value of Florida origin exports during the next five years. This would repeat the recent past, when Florida origin exports surged from an inflation adjusted $37.3 billion in 2005 to a record $55.2 billion in 2010 (Figure 4.2). Florida origin exports account for 7.3 percent of the state’s gross domestic product, below the 9.2 percent average nationally.
Florida’s recent export growth has been led by technology and manufactured goods, including computers, machinery, transportation equipment, and fabricated metal products. High-technology exports totaled $14.6 billion in 2009, representing 30 percent of all exports in the state. Florida exports are underrepresented in some of these goods, so there is room to grow. Florida origin exports have been strong to most of Latin America, western Europe, Canada, and Japan. Brazil, Asia (especially China and India), Australia, and the Middle East are relatively untapped markets for Florida origin exports.
Figure 4.2 Florida Origin Exports
Source: U.S. Department of Commerce, U.S. Census Bureau.
(billions of 2010 dollars)
20102008200620042002200019981996
3.3%
4.3%$28.8
$32.7
$33.6 $29.7
$33.5
$41.7
$54.9
$55.2
Value of FloridaOrigin Exports
Florida Share of USTrade Export Value
19 19
Growing Florida origin exports would have broad impacts throughout the economy, creating opportunities not only for transportation and logistics businesses but also for manufacturing, technology, mining, and agricultural businesses which produce goods for export. A broader global market could catalyze much needed diversification of Florida’s economic base to include a stronger presence for advanced manufacturing.
Florida’s distance from U.S. markets has been one factor limiting its manufacturing to industries relying on Florida’s natural resources and agricultural products, as well as industries serving the local market. An enhanced, multi-directional logistics system would reduce costs and produce economies of scale, shifting Florida from its current position at the end of the line in the United States to a central position in global trade lanes. These changes could make Florida a more viable location for advanced manufacturing to serve broader markets in the Western Hemisphere and globally. Existing or emerging Florida industries such as aerospace, life sciences, and environmental solutions all could create manufacturing exports.
As Florida exports grow, efforts should be made to maximize the share flowing through Florida seaports and airports rather than other states. About 950,000 TEU of waterborne containerized exports were produced in Florida in 2009. About 25 percent of this total exited the United States through seaports in other states – a gap of about 250,000 TEU. New York, Houston, Savannah, and Charleston all are ports of exit for Florida origin exports to Europe and Asia today.
The study modeled the impacts of doubling containerized exports of Florida manufactured goods. This scenario would create an additional 6,900 trade and logistics jobs (both direct and spinoff jobs) related to moving the additional exports. These jobs would result in about $506 million in personal income statewide and about $47 million in state and local tax revenues. Depending on the mix of industries successful at expanding exports, the doubling could create as many as 88,600 jobs with businesses producing or adding value to the exports, with an additional $4.6 billion in personal income and $423 million in tax revenues.27
Potential Economic Impacts of Doubling Florida Origin Container Exports
Trade & Logistics Jobs 6,900 (Direct and Spinoff)
Personal Income $506 million
Business Sales $316 million
State & Local Taxes $47 million
______________________________
Potential Additional 88,600 Export Related Jobs
Personal Income $4,600 million
Business Sales $14,549 million
State & Local Taxes $423 million
Source: Martin Associates Inc.
20 20
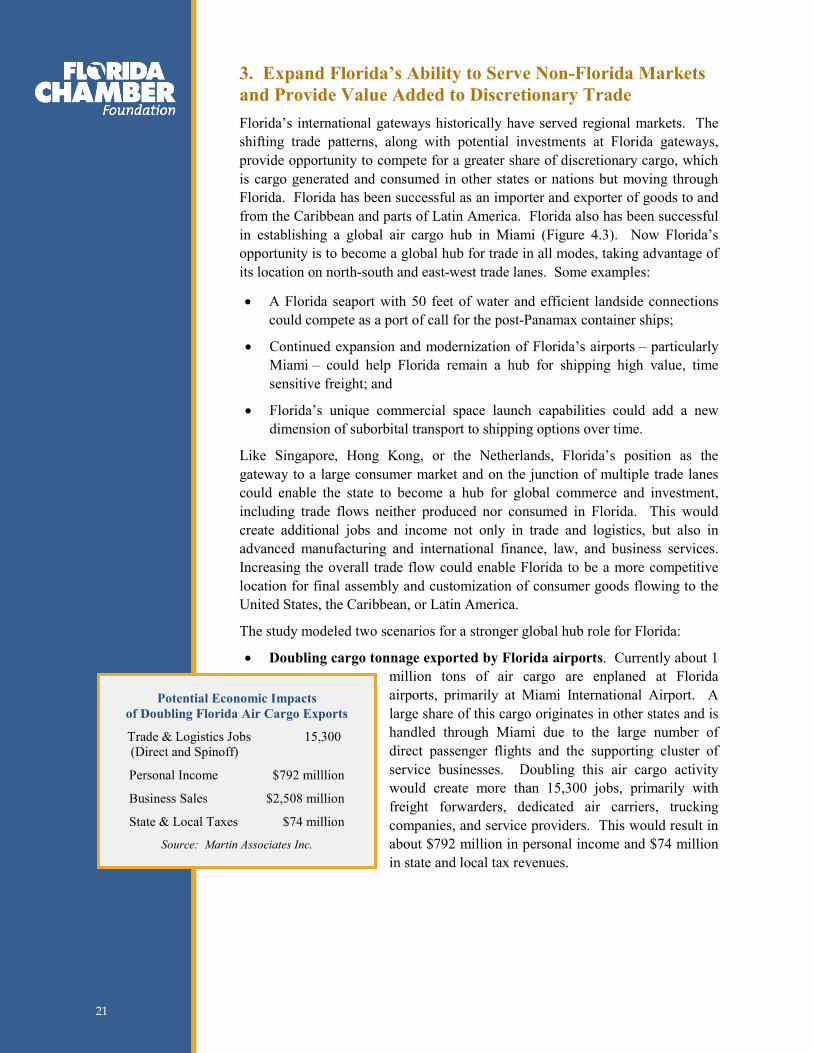
3. Expand Florida’s Ability to Serve Non-Florida Markets and Provide Value Added to Discretionary Trade Florida’s international gateways historically have served regional markets. The shifting trade patterns, along with potential investments at Florida gateways, provide opportunity to compete for a greater share of discretionary cargo, which is cargo generated and consumed in other states or nations but moving through Florida. Florida has been successful as an importer and exporter of goods to and from the Caribbean and parts of Latin America. Florida also has been successful in establishing a global air cargo hub in Miami (Figure 4.3). Now Florida’s opportunity is to become a global hub for trade in all modes, taking advantage of its location on north-south and east-west trade lanes. Some examples:
• A Florida seaport with 50 feet of water and efficient landside connections could compete as a port of call for the post-Panamax container ships;
• Continued expansion and modernization of Florida’s airports – particularly Miami – could help Florida remain a hub for shipping high value, time sensitive freight; and
• Florida’s unique commercial space launch capabilities could add a new dimension of suborbital transport to shipping options over time.
Like Singapore, Hong Kong, or the Netherlands, Florida’s position as the gateway to a large consumer market and on the junction of multiple trade lanes could enable the state to become a hub for global commerce and investment, including trade flows neither produced nor consumed in Florida. This would create additional jobs and income not only in trade and logistics, but also in advanced manufacturing and international finance, law, and business services. Increasing the overall trade flow could enable Florida to be a more competitive location for final assembly and customization of consumer goods flowing to the United States, the Caribbean, or Latin America.
The study modeled two scenarios for a stronger global hub role for Florida:
• Doubling cargo tonnage exported by Florida airports. Currently about 1 million tons of air cargo are enplaned at Florida airports, primarily at Miami International Airport. A large share of this cargo originates in other states and is handled through Miami due to the large number of direct passenger flights and the supporting cluster of service businesses. Doubling this air cargo activity would create more than 15,300 jobs, primarily with freight forwarders, dedicated air carriers, trucking companies, and service providers. This would result in about $792 million in personal income and $74 million in state and local tax revenues.
Potential Economic Impacts of Doubling Florida Air Cargo Exports
Trade & Logistics Jobs 15,300 (Direct and Spinoff)
Personal Income $792 milllion
Business Sales $2,508 million
State & Local Taxes $74 million
Source: Martin Associates Inc.
21 21
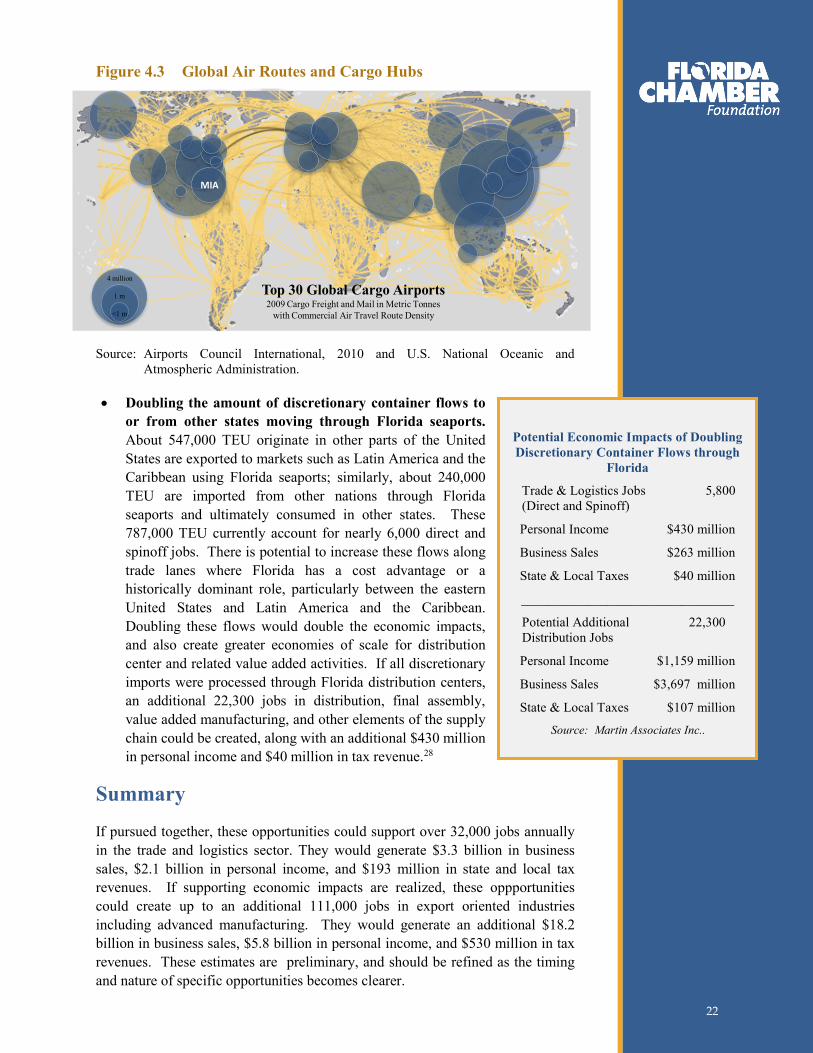
Figure 4.3 Global Air Routes and Cargo Hubs
MIA
Top 30 Global Cargo Airports2009 Cargo Freight and Mail in Metric Tonnes
with Commercial Air Travel Route Density
4 million
1 m
<1 m
Source: Airports Council International, 2010 and U.S. National Oceanic and Atmospheric Administration.
• Doubling the amount of discretionary container flows to or from other states moving through Florida seaports. About 547,000 TEU originate in other parts of the United States are exported to markets such as Latin America and the Caribbean using Florida seaports; similarly, about 240,000 TEU are imported from other nations through Florida seaports and ultimately consumed in other states. These 787,000 TEU currently account for nearly 6,000 direct and spinoff jobs. There is potential to increase these flows along trade lanes where Florida has a cost advantage or a historically dominant role, particularly between the eastern United States and Latin America and the Caribbean. Doubling these flows would double the economic impacts, and also create greater economies of scale for distribution center and related value added activities. If all discretionary imports were processed through Florida distribution centers, an additional 22,300 jobs in distribution, final assembly, value added manufacturing, and other elements of the supply chain could be created, along with an additional $430 million in personal income and $40 million in tax revenue.28
Summary
If pursued together, these opportunities could support over 32,000 jobs annually in the trade and logistics sector. They would generate $3.3 billion in business sales, $2.1 billion in personal income, and $193 million in state and local tax revenues. If supporting economic impacts are realized, these oppportunities could create up to an additional 111,000 jobs in export oriented industries including advanced manufacturing. They would generate an additional $18.2 billion in business sales, $5.8 billion in personal income, and $530 million in tax revenues. These estimates are preliminary, and should be refined as the timing and nature of specific opportunities becomes clearer.
Potential Economic Impacts of Doubling Discretionary Container Flows through
Florida
Trade & Logistics Jobs 5,800 (Direct and Spinoff)
Personal Income $430 million
Business Sales $263 million
State & Local Taxes $40 million
________________________________
Potential Additional 22,300 Distribution Jobs
Personal Income $1,159 million
Business Sales $3,697 million
State & Local Taxes $107 million
Source: Martin Associates Inc..
22 22

5.0 Strategies Evolving global markets, trade flows, and logistics patterns create multiple opportunities for Florida over the next decade and beyond. Florida can emphasize providing better service to its businesses and consumers and maximizing its pivotal role in Latin American and Caribbean trade. Florida also can expand its role as a global trade hub by exporting more goods and handling more discretionary cargo.
These opportunities are related and integrated. Florida’s success in serving its own market could help create a larger, more dynamic, and more efficient trade and logistics cluster, including related infrastructure – which, in turn, could make Florida more competitive as a platform for exports and discretionary cargo.
Florida’s public and private partners must undertake a comprehensive international trade and logistics initiative to take advantage of the most promising opportunities. Coordinated statewide leadership is needed in multiple areas ranging from marketing to transportation investment, from workforce development to land use coordination.
The Florida Chamber Foundation has defined “Six Pillars” or critical elements of Florida’s future economy, to serve as a visioning platform for moving Florida forward (Figure 5.1). The strategies recommended in this study are organized by the Six Pillars to facilitate integration with the state’s broader economic blueprint.
Figure 5.1 Six Pillars of Florida’s Future Economy
Florida’s public and private
partners must undertake a
comprehensive trade initiative
to take advantage of
promising opportunities.
23 23
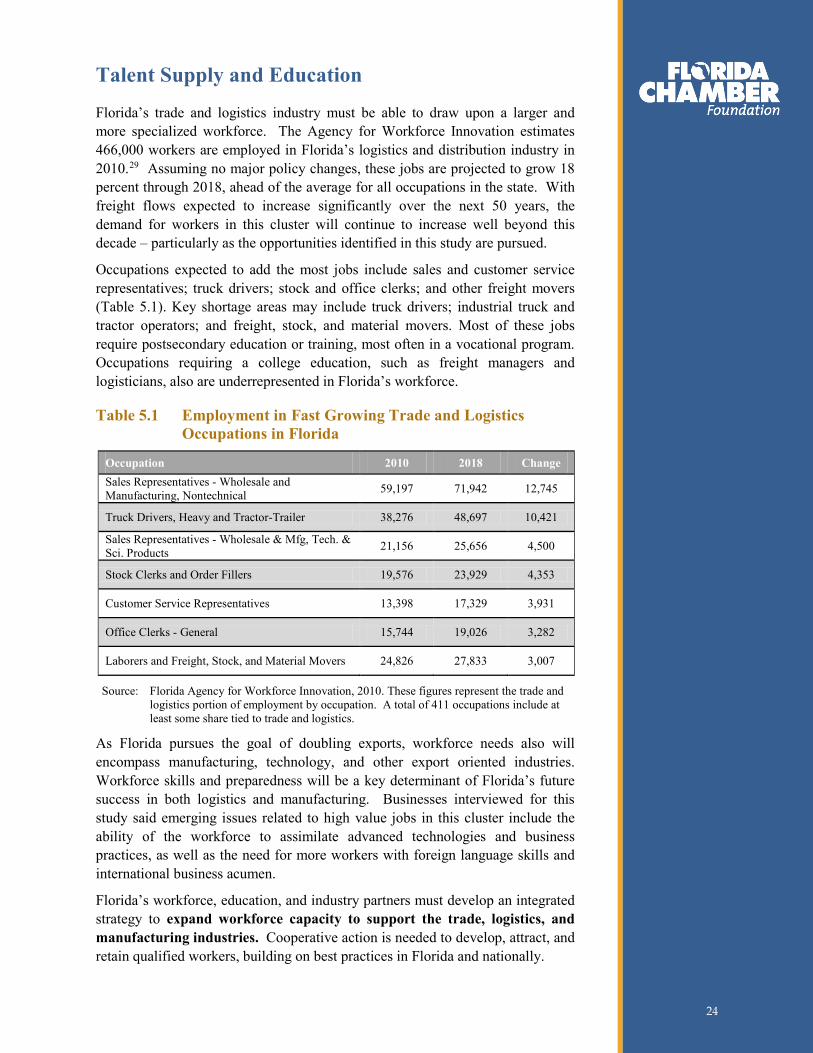
Talent Supply and Education
Florida’s trade and logistics industry must be able to draw upon a larger and more specialized workforce. The Agency for Workforce Innovation estimates 466,000 workers are employed in Florida’s logistics and distribution industry in 2010.29
Occupations expected to add the most jobs include sales and customer service representatives; truck drivers; stock and office clerks; and other freight movers (Table 5.1). Key shortage areas may include truck drivers; industrial truck and tractor operators; and freight, stock, and material movers. Most of these jobs require postsecondary education or training, most often in a vocational program. Occupations requiring a college education, such as freight managers and logisticians, also are underrepresented in Florida’s workforce.
Assuming no major policy changes, these jobs are projected to grow 18 percent through 2018, ahead of the average for all occupations in the state. With freight flows expected to increase significantly over the next 50 years, the demand for workers in this cluster will continue to increase well beyond this decade – particularly as the opportunities identified in this study are pursued.
Table 5.1 Employment in Fast Growing Trade and Logistics Occupations in Florida
Occupation 2010 2018 Change Sales Representatives - Wholesale and Manufacturing, Nontechnical 59,197 71,942 12,745
Truck Drivers, Heavy and Tractor-Trailer 38,276 48,697 10,421
Sales Representatives - Wholesale & Mfg, Tech. & Sci. Products 21,156 25,656 4,500
Stock Clerks and Order Fillers 19,576 23,929 4,353
Customer Service Representatives 13,398 17,329 3,931
Office Clerks - General 15,744 19,026 3,282
Laborers and Freight, Stock, and Material Movers 24,826 27,833 3,007
Source: Florida Agency for Workforce Innovation, 2010. These figures represent the trade and logistics portion of employment by occupation. A total of 411 occupations include at least some share tied to trade and logistics.
As Florida pursues the goal of doubling exports, workforce needs also will encompass manufacturing, technology, and other export oriented industries. Workforce skills and preparedness will be a key determinant of Florida’s future success in both logistics and manufacturing. Businesses interviewed for this study said emerging issues related to high value jobs in this cluster include the ability of the workforce to assimilate advanced technologies and business practices, as well as the need for more workers with foreign language skills and international business acumen.
Florida’s workforce, education, and industry partners must develop an integrated strategy to expand workforce capacity to support the trade, logistics, and manufacturing industries. Cooperative action is needed to develop, attract, and retain qualified workers, building on best practices in Florida and nationally.
24 24

Key strategies include:
• Identify global trade and logistics as a qualified targeted industry for the state’s Quick Response Training and Incumbent Worker Training programs. Florida must ensure its offerings are comparable with other southeast states.
• Expand vocational, associate degree, and workforce training programs to support skill requirements for trade, logistics, and manufacturing industries. Specialized training in logistics needs for specific sectors such as life sciences also is important.
• Expand targeted programs for global trade, logistics, and manufacturing in the state’s four year colleges and universities. The Employ Florida Banner Center for Global Logistics, led by Florida Gateway College, the University of North Florida, and Polk State College in cooperation with seven other colleges and universities, is an example of a collaborative approach to meeting future workforce needs.
• Build international business and foreign language skills and experience among the Florida workforce.
Innovation and Economic Development
Florida’s economy often is described as a three legged stool of agriculture; tourism; and real estate, construction, and other industries which serve the influx of new residents. Trade flows create the opportunity to add two more legs to the stool: a world class cluster of global trade and logistics, and an export oriented, advanced manufacturing cluster. Both of these opportunities would create high value jobs and new opportunities for Florida businesses. Strengthening these opportunities will require coordinated actions to:
• Market Florida’s advantages as a trade gateway and hub. Florida should continue to promote its role as the gateway to Latin America and the Caribbean as well as its potential to serve east-west trade lanes, especially with Asia. Florida’s current and potential cost advantages should be documented and marketed to cargo owners and carriers. Trade missions and marketing material should promote Florida as a business friendly location with an efficient supply chain infrastructure. The Governor can play a critical role in this effort as the state’s chief economic development officer.
• Identify global trade and logistics as a statewide targeted industry. This designation would make global trade and logistics eligible for all state incentive programs and a key emphasis for Enterprise Florida, Workforce Florida, the Florida Department of Transportation, and other state agencies.
• Attract international distribution centers to reinforce Florida’s location and cost advantages. Florida’s existing distribution centers primarily serve regional consumption markets. Florida receives and ships a significant percent of its freight via out of state seaports, often consolidated in other states. To capture more of this traffic as well as imports destined for other states, Florida must aggressively recruit international distribution centers to locate in the state.
Florida’s “three legged
stool” of agriculture,
tourism, and construction can add two
more legs: global trade
and logistics, and export oriented, advanced
manufacturing.
25 25

• Provide support for export oriented manufacturing businesses. Florida must continue to give high priority to helping attract, retain, and expand export oriented manufacturing businesses through marketing, trade missions, training, and support services. The state should provide this support to existing Florida targeted industries, and identify additional export oriented industries based on sourcing decisions and manufacturing trends. The state should increase funding for trade capacity grants and other counseling and international support services offered by Enterprise Florida. A key aspect of this support should be helping develop Florida-based supply chains.
• Enhance incentive programs for Florida-based distribution, manufacturing, and other export-oriented businesses. Attracting international distribution centers and expanding manufacturing may require incentives to help these industries develop critical mass. Florida’s incentives in these industries should be regularly reviewed to ensure they are competitive with those offered in other southeast states, particularly Georgia and Alabama. Adjustments may be needed to existing programs such as the Qualified Targeted Industry Tax Refund and High Impact Performance Incentive Grant to stimulate capital investments, which may have modest job impact but significant supply chain impacts. Additional funding and flexibility also may be needed in the Closing Fund and the Economic Development Transportation Fund. The state also should consider introducing incentives for Florida seaports and airports. Port use incentives, such as tax credits for shippers using home ports, are becoming prevalent in other states such as Alabama, Georgia, and South Carolina.
• Promote trade policies to support Florida’s role in the global marketplace. The state should develop a comprehensive trade policy agenda for Florida and ensure the federal government, Florida elected officials and business leaders, and Florida residents understand the importance of trade agreements to their economic future.
Infrastructure and Growth Leadership
A statewide system of trade gateways, logistics and distribution centers, and transportation corridors must link all regions of Florida and connect Florida to markets nationwide and worldwide. Florida’s Strategic Intermodal System (SIS) provides a statewide system for identifying and enhancing the most critical transportation facilities. Florida must provide sufficient capacity at key gateways and along key corridors to accommodate the anticipated increase in trade flows; seamless connectivity among transportation modes and facilities so they function as a system to move goods to market reliably and efficiently; and compatibility of transportation investments and surrounding land uses to enable the entire system to function effectively. These “3 Cs” are key to achieving Florida’s opportunities as a global hub, and must be infused into all state infrastructure and growth leadership initiatives. The Florida Department of Transportation, working with transportation partners statewide, is incorporating these strategies into implementation of the 2060 Florida Transportation Plan and the Strategic Intermodal System, as well as into its statewide aviation, seaport, and rail plans.
Florida’s future trade
opportunities will not be
realized without proactive
investment and planning for trade related development.
26 26
Seaports: Florida’s seaports must be viewed as a statewide system serving containers, general cargo, bulk cargo, and cruise passenger markets. The baseline forecast projects international waterborne freight tonnage to increase 57 percent over the next 25 years, with even more rapid gains in containers. The opportunities identified in this study would more than double container flows over the next five years if fully realized. Most (although not all) seaports report a common set of constraints: navigation channel, turning basin, and berth capacity; terminal space; available land; truck and rail access; and connectivity with inland markets. Many of Florida’s seaports have reached or are approaching the end of the life span of core infrastructure such as bulkheads, berths, wharfs, and slips. Increasing seaport system capacity must be a critical emphasis for the Governor, Legislature, and business leaders. Key strategies include:
• Develop at least one first port of call in conjunction with the Panama Canal expansion. This would be a seaport capable of handling the largest post-Panamax vessels, which carry 8,500 to 12,000 TEU. This seaport would be able to be the first stop for Asian container ships after they exit the Panama Canal. Such a seaport would require 50 feet of depth and on or near dock rail service. A first port of call would benefit the entire state by expanding Asian trade and helping preserve the current trade with the Caribbean. Assuming weekly service from a vessel carrying 8,500 TEU, the additional containers would support about 800 direct and spinoff jobs at or near the seaport and could also leverage distribution center activity. Public and private partners must build consensus around and expedite deepening of at least one seaport as a statewide resource.
• Expand capacity at seaports to serve container, break bulk, and bulk markets. Not all seaports need 50 feet of water, but all need the capacity and flexibility to accommodate growth in the markets best suited for their location and facilities as the entire region between Florida and Panama becomes a crossroads for trade. The state and seaports should collaborate to identify and prioritize capacity investments for bulk, break bulk, and container flows in key regions to serve niche, state, and national markets. Immediate capacity needs appear to be most significant for containers and transloading. Many Florida seaports may be able to handle more freight using existing facilities through automation, densification, and longer or more flexible work hours. Florida’s container seaports generally handle about 3,000 TEU per acre per year – fewer than those in New York, Los Angeles, and Long Beach and well behind global leaders.
• Maximize the use of inland waterways and smaller seaports. Florida’s intracoastal and inland waterways also offer potential to move freight. The Port of Miami River is one example of a shallow draft waterway which has successfully developed niche markets in international freight. Many other smaller seaports and waterways serve particular businesses and markets and could become more significant elements of a statewide system over time.
• Support acquisition and redevelopment of new waterfront land or inland locations for seaport operations. Land constraints can hinder capacity growth at some seaports. Five seaports interviewed for this study reported no land available for terminal expansions, and six seaports said available acreage existed at nearby inland locations.
27 27
Airports: The long term projections indicate the need to expand air cargo capacity to maintain Miami International Airport’s global role and to provide more options in other regions of the state. Future investments in runway and terminal capacity, airport transfer and distribution center capacity, and groundside cargo access will help Florida’s air cargo industry position for the future.
Rail Terminals: Florida has 48 major freight rail terminals today, most of which developed to serve mining, agriculture, and other bulk shipments. Additional intermodal capacity will be needed, including direct rail access to the major container seaports.
International trade relies on an efficient, intermodal transportation system with connectivity between hubs, warehouses and distribution centers, and markets. From a shipper or receiver perspective, the critical need is to move goods from door to door, regardless of the specific mode or route used. Connectivity is critical at three levels:
• Improve landside connectivity to airports, seaports, and rail terminals. The “last mile” often is the weak spot in the intermodal system, involving local roads or rail spurs not designed for today’s freight volumes. Through the Strategic Intermodal System, the state should maintain its emphasis on improving intermodal connectors between seaports and airports and major highway and rail corridors, including on dock or near dock rail service and dedicated, secure truck access routes serving major container seaports.
• Maintain and enhance regional distribution networks to move goods between ports and terminals and distribution centers and other markets efficiently. Regional distribution networks are critical to maximizing the ability of Florida’s seaports and airports to serve local consumption and locally generated exports. Urban congestion and limited options for freight routes is a constraint in many parts of the state.
• Maintain and enhance high capacity rail, water, and truck corridors to move goods from seaports and airports to other states. This long distance connectivity is critical to grow Florida’s role serving cargo to and from other states. Highways are the primary option for long distance travel in many of Florida’s regions today, and most interregional highway corridors will be heavily congested during peak periods by 2035 if current patterns continue. The rail system has available capacity but may not be able to support growth in both freight and passenger flows as plans move forward for a statewide intercity passenger rail system and commuter rail systems in many Florida regions. Key strategies include:
– Improve port-to-port feeder services and transshipment activity by creating “marine highways” between major seaports. The federal government provided initial funding to multiple Florida seaports in 2010 to support development of marine highways along both the Atlantic and Gulf Coasts.
– Enhance rail connectivity between Florida and the northeast and midwest United States, potentially using an inland north-south route through Florida.
28 28
– Improve Florida’s major Interstate highway and other long distance truck corridors to handle increased truck traffic, including potential use of truck only lanes or development of a small number of long distance truck corridors able to carry heavier loads in a safe and secure manner.
– Ensure adequate freight connectivity to regional employment centers in Florida’s rural areas.
– Explore the potential for a north-south multimodal freight transportation corridor, with east-west connectors, to move goods into and out of Florida while avoiding congested urban areas on the Atlantic and Gulf Coasts.
– Promote the use of technology and innovative practices to enhance the mobility and productivity of trade and logistics in Florida, such as redesigned vehicles able to carry larger loads with less impact on infrastructure or information systems able to track shipments on a real time basis.
– Ensure the ability for passenger and freight traffic to safely coexist on key highway, rail, and water corridors.
Proactive planning and coordination of transportation, land use, and economic development decisions is needed to ensure sufficient capacity for freight related development, to minimize the impacts of congestion on freight flows, and to minimize the impacts of freight related activities on residential or commercial development. Key strategies include:
• Expand distribution center capacity in appropriate locations. Economic development, land use, and transportation decisions should be coordinated to locate international distribution centers close to major seaports; to expand air cargo warehousing capacity around Miami International Airport and smaller air cargo facilities; and to develop integrated logistics centers at urban and rural locations as markets dictate.
• Adopt land use plans supporting freight intensive activities. Local government land use decisions and regional visions should give greater attention to freight and logistics needs. Regional partners should identify, screen, and incorporate into adopted plans potential sites for catalytic industrial developments and integrated logistics centers. Local land use plans should give greater emphasis to preserving industrial lands with good access to seaports, airports, and rail terminals, as well as to reducing encroachment of incompatible land uses around major trade gateways.
29 29
Business Climate and Competitiveness
A competitive business climate will help Florida’s freight, logistics, and distribution businesses expand. The state must pursue specific strategies to improve the business climate for trade and logistics industries, while also improving the overall business climate for manufacturing and other export oriented sectors. Key strategies include:
• Reduce the cost of doing business for logistics, distribution, and manufacturing in Florida. Florida can no longer compete as a low cost state. Florida must continue to work to reduce electricity, insurance, and other business costs. Florida also must ensure its regulations and processes are business friendly compared to key southeast competitors. Companies interviewed for this study cited the liability system, permitting processes, and differences in regulations across communities as challenges for Florida’s business climate.
• Assess potential tax changes to support targeted growth in logistics, distribution, and manufacturing. Florida’s tax burden is low overall due to the absence of a personal income tax, but property, sales, excise, and gross receipt tax burdens are concerns for businesses. Businesses interviewed for this study said Florida’s tax structure may not be optimized for logistics and manufacturing businesses. The Legislature should examine the potential benefits and costs of eliminating the sales tax on manufacturing equipment, accelerating depreciation rates on capital equipment, providing tax incentives for privately funded transportation projects, and enabling an optional shift in Florida’s corporate income tax apportionment to a single factor (sales based in Florida) from the current three factors (sales, payroll, and property). There also may be a need to expand the number and capacity of foreign trade zones in the future.
• Remove redundant or unnecessary state security requirements and harmonize state requirements with federal requirements. Florida should implement efficient federal and state security protocols without impeding mobility. The existence of dual federal and state driver and worker identification and criminal history vetting programs has added complexity and cost to drivers accessing Florida’s seaports in the past. Cargo inspection and immigration processes also have been concerns at some seaports and airports.
Civic and Governance Systems
Florida must coordinate public and private planning and investments to achieve the vision and goals for its trade and logistics system. Florida, like other states, has tended to make transportation, land use, economic development, and other decisions at the local level, closest to specific problems and opportunities. In contrast, major employers and shippers in Florida – in particular, those selling their goods and services outside of the state and bringing income into our economy – view their Florida offices and factories as just one link in an increasingly national and global supply chain and distribution network. Florida must strengthen trade and economic development planning at three levels:
Florida must reduce the cost
of doing business for
logistics, distribution, and manufacturing
industries.
30 30
• Continue the statewide partnership among transportation, economic development, and business organizations assembled for this study to coordinate overall implementation by public and private entities. These partners should integrate and coordinate statewide economic development, transportation, and related plans, and encourage greater state visibility and support for trade related economic development.
• Strengthen regional trade planning and implementation. More detailed studies may be necessary to translate the statewide trends, opportunities, and recommendations into regional actions. Efforts should be made to increase participation of airport, seaport, economic development, and freight industry partners in metropolitan and rural planning and regional visioning processes. Greater collaboration among seaports, airports, railroads, other modal providers, and economic development organizations at the regional and interregional levels also is needed.
• Represent Florida’s interests in federal and multistate trade planning. Florida should work with other states to enhance existing or develop new freight and logistics planning processes for trade corridors and megaregions. The state also should prepare for and actively participate in potential federal freight infrastructure investment initiatives, including the upcoming authorization of the federal transportation program.
Finally, high priority must be given to identifying reliable funding sources to carry out the multi-year, coordinated investments needed to position Florida as a global trade, logistics, and manufacturing hub.
Quality of Life and Quality Places
Florida’s communities and environment help attract residents, visitors, and businesses to the state. Future trade, logistics, and related activities should be planned in a way which minimizes the impacts on Florida’s communities and environment. Well planned freight development and related infrastructure investments can improve the livability of communities by creating jobs, reducing consumer costs, and grouping together compatible land uses. Poorly planned freight development and related infrastructure investments can create noise, degrade air and water quality, disrupt residential communities, or encroach on sensitive environmental areas. A collaborative, forward looking approach can avoid potential conflicts and identify solutions balancing economic competitiveness with livability. Key strategies include:
• Minimize negative impacts of freight activities on Florida’s communities and environment. Proactive planning can help target freight related investments in appropriate locations, and avoid or minimize impacts on neighborhoods, historic and cultural resources, ecological systems, and other resources.
• Plan and develop freight systems to reduce energy consumption, improve air quality, and reduce greenhouse gas emissions. Energy consumption and emissions can be reduced through improvements to vehicle technologies, use of alternative fuels, more efficient transportation operations, and greater use of rail and water for moving long distance loads.
Florida’s government, business, and civic leaders
must view trade related
infrastructure, economic
development, and workforce development as
strategic investments in
Florida’s future.
31 31
6.0 Call to Action Florida faces a once-in-a-generation opportunity to fundamentally transform its economy. The shift in U.S. population growth to the south, the Panama Canal widening, the resurgence of Latin American and Caribbean trade, and the continued revolution in logistics practices create the opportunity for Florida to become a global trade and logistics hub. Florida faces three major opportunities to take advantage of this trade flow:
• Maximize its ability to serve Florida businesses and consumers, primarily through attracting Asian container imports directly to Florida seaports;
• Grow the value of Florida origin exports, and leverage more efficient logistics patterns to attract advanced manufacturing and other export related industries to Florida; and
• Emerge as a global hub for trade and investment, leveraging its location on north-south and east-west trade lanes to become the Singapore of the Western Hemisphere.
These opportunities would expand markets and reduce costs for Florida businesses and consumers; create high paying jobs in trade, logistics, and manufacturing; and position Florida as a global leader. This vision will require a coordinated effort linking investments in transportation, economic development, workforce, and related systems. Key strategies are consistent with the “Six Pillars” of Florida’s future economy (Table 6.1). The Governor and Legislature should begin implementation of key recommendations with the support of public and private organizations statewide.
Critical near term action is needed in the following areas:
1. Support the leadership of the Governor as Florida’s economic development officer and trade ambassador to help market Florida as a trade and logistics hub.
2. Expedite plans to create at least one seaport with 50 feet of channel depth with an on dock or near dock rail connection by 2014. Link this investment to a focused trade mission to help Florida pursue first call services from Asian container lines, as well as strategic investments in international distribution centers.
3. Identify global trade and logistics as a statewide targeted industry and a focus area for Enterprise Florida, Workforce Florida, the Florida Department of Transportation, and other state agencies. Strengthen existing marketing, incentives, and support services to meet the needs of these industries.
4. Continue efforts to double the value of Florida origin exports over the next five years. Pursue opportunities to place Florida goods in the many containers and other vehicles which currently enter Florida full and leave empty.
5. Identify investments needed to maintain and expand Miami International Airport’s role as a global hub, as well as the potential benefits of creating a second tier air cargo hub elsewhere in Florida.
6. Advance planning for an integrated statewide network of trade gateways, logistics centers, and transportation corridors through Florida’s Strategic Intermodal System. Address critical bottlenecks and connectivity gaps in this system.
7. Provide sufficient and reliable funding for future state investments in Florida’s trade, transportation, and economic development systems.
32 32
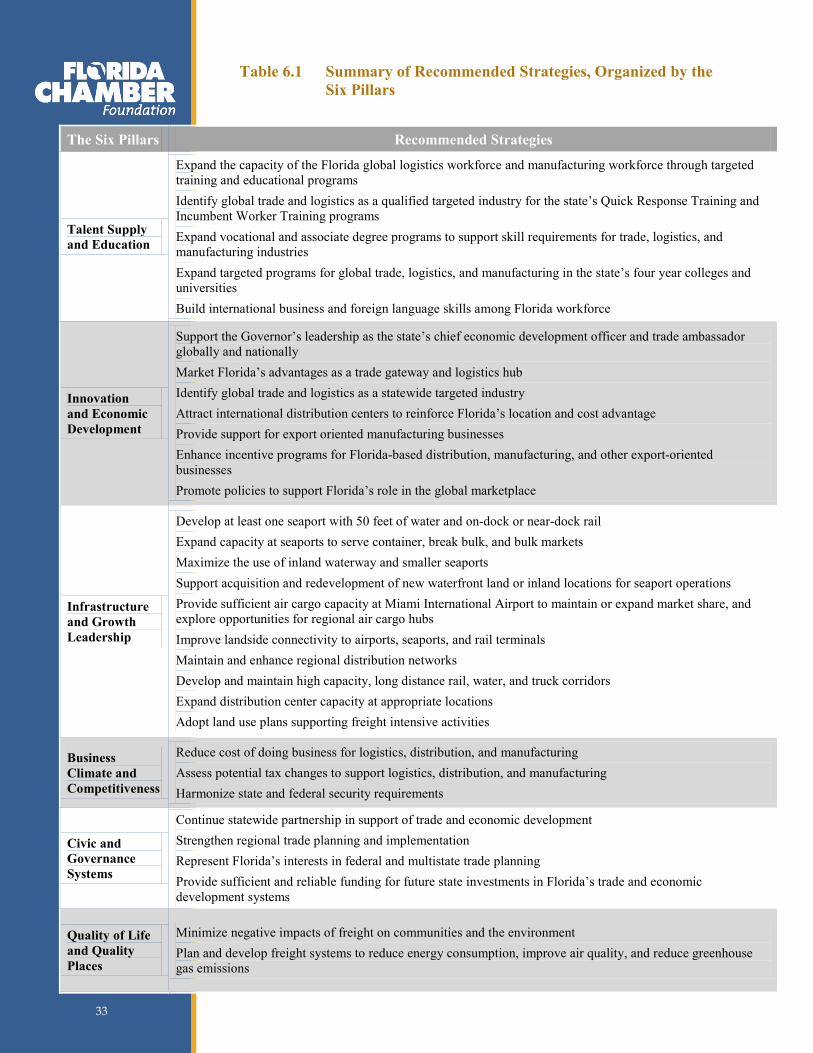
Table 6.1 Summary of Recommended Strategies, Organized by the Six Pillars
The Six Pillars Recommended Strategies
Talent Supply and Education
Expand the capacity of the Florida global logistics workforce and manufacturing workforce through targeted training and educational programs Identify global trade and logistics as a qualified targeted industry for the state’s Quick Response Training and Incumbent Worker Training programs Expand vocational and associate degree programs to support skill requirements for trade, logistics, and manufacturing industries Expand targeted programs for global trade, logistics, and manufacturing in the state’s four year colleges and universities Build international business and foreign language skills among Florida workforce
Innovation and Economic Development
Support the Governor’s leadership as the state’s chief economic development officer and trade ambassador globally and nationally Market Florida’s advantages as a trade gateway and logistics hub Identify global trade and logistics as a statewide targeted industry Attract international distribution centers to reinforce Florida’s location and cost advantage Provide support for export oriented manufacturing businesses Enhance incentive programs for Florida-based distribution, manufacturing, and other export-oriented businesses Promote policies to support Florida’s role in the global marketplace
Infrastructure and Growth Leadership
Develop at least one seaport with 50 feet of water and on-dock or near-dock rail Expand capacity at seaports to serve container, break bulk, and bulk markets Maximize the use of inland waterway and smaller seaports Support acquisition and redevelopment of new waterfront land or inland locations for seaport operations Provide sufficient air cargo capacity at Miami International Airport to maintain or expand market share, and explore opportunities for regional air cargo hubs Improve landside connectivity to airports, seaports, and rail terminals Maintain and enhance regional distribution networks Develop and maintain high capacity, long distance rail, water, and truck corridors Expand distribution center capacity at appropriate locations Adopt land use plans supporting freight intensive activities
Business Climate and Competitiveness
Reduce cost of doing business for logistics, distribution, and manufacturing Assess potential tax changes to support logistics, distribution, and manufacturing Harmonize state and federal security requirements
Civic and Governance Systems
Continue statewide partnership in support of trade and economic development Strengthen regional trade planning and implementation Represent Florida’s interests in federal and multistate trade planning Provide sufficient and reliable funding for future state investments in Florida’s trade and economic development systems
Quality of Life and Quality Places
Minimize negative impacts of freight on communities and the environment Plan and develop freight systems to reduce energy consumption, improve air quality, and reduce greenhouse gas emissions
33 33
Glossary of Terms Advanced manufacturing – There is no one comprehensive, widely accepted definition of advanced manufacturing. The phrase is used by many organizations in different ways. One of the most widely used definitions of advanced manufacturing involves the use of technology to improve products and/or processes, with the relevant technology being described as “advanced,” “innovative,” or “cutting edge.” Aerotropolis – A new type of urban form comprising aviation-intensive businesses and related enterprises extending up to 25 kilometers (15.5 miles) outward from major airports. Breakbulk cargo – Miscellaneous goods packed in boxes, bales, crates, cases, bags, cartons, barrels, or drums; may also include lumber, motor vehicles, pipe, steel, and machinery. Bulk cargo – Loose cargo is loaded directly into a ship’s hold; often includes grain, coal, petroleum, chemicals, aggregates, and similar products. Containerization – Stowage of general or special cargoes in a container for transport in the various modes. Discretionary cargo – Cargo handled by a gateway or hub in a geographic location other than the cargo’s point of origin or destination. Distribution center – A warehouse or other specialized building, often with refrigeration or air conditioning, which is stocked with products to be re-distributed to retailers, to wholesalers or directly to consumers. A distribution center is a principal part, the order processing element, of the entire order fulfillment process. A distribution center can also be called a warehouse, a fulfillment center, a cross-dock facility, a bulk break center, and a package handling center. Double-stack – The movement of containers on rail cars which enable one container to be stacked on another container for better car utilization. First port of call – The first seaport where a ship discharges or receives traffic. Florida origin exports – Products and services exported from Florida which were grown, mined, or manufactured in the state. Foreign trade zone – A port designated by the government for duty-free entry of any non-prohibited goods. Merchandise may be stored, displayed, and used for manufacturing within the zone and re-exported without duties being paid. Duties are imposed only when the original goods or items manufactured from those goods pass from the zone into an area of the country subject to customs authority. Also called a Free Trade Zone. Gateway – A point through which freight commonly moves from one territory or carrier to another. Gross domestic product (GDP) – the total market values of goods and services produced by workers and capital within a nation’s borders during a given period (usually 1 year). Gross regional product (GRP) – A region, state, or metropolitan area‘s gross regional product is one of several measures of the size of its economy. Similar to GDP, GRP is defined as the market value of all final goods and services produced within a region in a given period of time. Hub – A place where cargo is exchanged between vehicles or between transport modes, as well as moves through value added activities (logistics, manufacturing, assembly). Freight hubs include classification yards, seaports, truck terminals, warehouses, plants, or combinations of these. Industry cluster – A geographic concentration of interconnected businesses, customers, suppliers, and associated institutions in a particular field. Clusters are considered to increase the productivity with which companies can compete, nationally and globally. Inland port – an inland site carrying out some functions of a seaport. Intermodal – Denotes the seamless movement of people or cargo between transport modes. 34 34
Intermodal Connector – The leg of passenger and freight trips connecting nodes to corridors and different modes within the same corridor. Connectors can be highways, rail lines, transit lines, or waterways. Intermodal logistics center – an industrial site with warehouse/distribution center capacity, intermodal rail yard, and trucking facilities; similar to an inland port, but not necessarily linked to a seaport; Intermodal terminal – A railroad facility designed for the loading and unloading of containers and trailers to and from flat cars for movement on the railroad and subsequent movement on the street or highway. International distribution center – A distribution center (see above definition) specializing in import/export products; facilities provide services customized for international shipments and often have a greater market reach than regional distribution centers. Just in time – In this method of inventory control, warehousing is minimal or non-existent; the container is the movable warehouse and must arrive “just in time;” not too early nor too late. Logistics – Logistics is the part of the supply chain process which plans, implements, and controls the efficient, effective flow and storage of goods, services, and related information from the point of origin to the point of consumption to meet customer’s requirements. Marine highway – A coastal waterway connecting two markets developed in part to help alleviate congestion on landside highway and rail corridors. Megaregion – Large networks of metropolitan regions. The five major categories of relationships that define megaregions are: environmental systems and topography; infrastructure systems; economic linkages; settlement patterns and land use; and shared culture and history. On dock rail – Direct shipside rail service. Includes the ability to load and unload containers/breakbulk directly from rail car to vessel. Panamax/Post-Panamax – Terms are used to differentiate between vessels able to meet existing Panama Canal draft and width restrictions, and those not able to meet these restrictions. Six Pillars – The Florida Chamber Foundation’s “Six Pillars” serve as a visioning platform for moving Florida forward. The Six Pillars identify the critical factors determining Florida’s future: Talent and Education; Innovation and Economic Development; Infrastructure and Growth Leadership; Business Climate and Competitiveness; Civic and Government Systems; and Quality of Life and Quality Places. Strategic Intermodal System (SIS) – A transportation system comprised of facilities and services of statewide and interregional significance, including appropriate components of all modes. Supply chain – A logistical management system which integrates the sequence of activities from delivery of raw materials to the manufacturer through to delivery of the finished product to the customer into measurable components. “Just in time” is a typical value-added example of supply chain management. Targeted industry – Enterprise Florida, Inc. identifies types of businesses and industries which are targeted for development in Florida; these targeted industries qualify for a defined set of incentives not available to other businesses. TEU – A twenty-foot equivalent unit (6.1m). A standard unit for counting containers of various lengths and for describing container ship or terminal capacity. A standard 40 foot container equals 2 TEUs. Transload – To physically transfer product from one transportation vehicle to another. Transshipment – The transfer of a shipment from one carrier to another in international trade, most frequently from one ship to another.
35 35
Endnotes 1 U.S. Department of Commerce, Bureau of the Census, Foreign Trade Division, U.S. Merchandise
Trade Statistics. 2 Cambridge Systematics Inc., developed from International Monetary Fund and U.S. Census
Bureau forecasts. The base GDP forecast is based on foreign exchange rates and adjusted to 2008 dollars as foreign trade is conducted using established terms of monetary exchange. However, GDP levels using purchasing power parity are more representative of overall economic size, correcting for the differences in buying power between the domestic markets of different countries.
3 World Trade Organization for historic trade data. The continuation of robust growth in world trade is widely anticipated according to a number of organizations and economic forecasting companies, including the World Bank’s “Global Outlook Summary” (medium-term forecast) and IHS Global Insight.
4 Reece F. Shaw, P.E., Vice President, Ports and Maritime Group, CH2M HILL, “A Primer on the Effect of the Panama Canal Expansion on World Commerce,” presentation to the AAPA Facilities Engineering Seminar, San Diego, California, November 7, 2007
5 Cambridge Systematics Inc., developed from International Monetary Fund and U.S. Census Bureau forecasts. Long term economic growth assumes an robust growth in expanding markets such as China but due to the length of the forecast horizon also makes the assumption that growth rates will not sustain the boom levels currently being experienced indefinitely. The forecast also assumes a worldwide economic recovery from the current downturn during the 2011-2020 period, according to a number of organizations and economic forecasting companies, including the World Bank’s Global Outlook Summary (medium-term forecast) and IHS Global Insight.
6 U.S. Department of Transportation, Federal Highway Administration, Freight Analysis Framework.
7 IHS Global Insight, April 2009 long term forecast. 8 U.S. Department of Commerce, Bureau of the Census, 2005 forecast and Cambridge Systematics,
Inc., estimates. 9 Because of salt water’s greater buoyancy, a 50 foot draft in fresh water is roughly equivalent to
48 feet in salt water. The specific depth needed by an individual seaport requires detailed analysis. For the purposes of this study, 50 feet cited as the depth required to handle post-Panamax vessels.
10 TTX from Drewry Consultants, April 2009 analysis. 11 U.S. Department of Agriculture, Impact of Panama Canal Expansion on the U.S. Intermodal
Transportation System, January 2010. Interviews conducted for this project with steamship lines suggest the time for serving the East Coast may range from 21 to 26 days, depending on the Asian port of origin and U.S. port of destination.
12 Halifax, Nova Scotia also has 50 feet of water. Baltimore’s harbor exceeds 50 feet, but its berths are not at that depth today.
13 Council of Supply Chain Management Professionals, 21st Annual State of Logistics Report. 14 Custom forecasts developed by Martin Associates, based on data from TRANSEARCH, Port
Import Export Reporting Survey (PIERS), and Surface Transportation Board Rail Waybill. This total differs from other published estimates from TRANSEARCH and the Freight Analysis Framework due to attempts to reduce double counting of internal truck shipments. Domestic waterborne tonnage for 2010 is based upon data presented in the Florida Seaport Transportation and Economic Development Council’s FY08/09 Seaport Mission Plan (http://www.flaports.org/archive/2010_ch2.pdf); domestic water flows were not forecast.
15 Directional data are not available for domestic water tonnage. 16 International air cargo data are not available in a comparable format. 17 Calculation using U.S. Department of Commerce, Bureau of Economic Analysis data. Trade and
logistics industries include transportation, warehousing, and wholesale trade. 18 Cambridge Systematics, Inc. estimates developed using Miami-Dade County Impact Analysis for
Planning (IMPLAN) model. 19 U.S. Department of Commerce, Bureau of Economic Analysis wage and salary employment data. 20 Florida Department of Transportation extrapolation of University of Florida, Bureau of Economic
and Business Research 2035 forecast.
36 36

21 Cambridge Systematics, Inc. projection based on Florida’s share of the U.S. economy and
population using Bureau of Economic Analysis historical trend data and International Monentary Foundation and U.S. Census Bureau forecasts.
22 Florida Department of Transportation data. 23 Martin Associates calculations for Florida Trade and Logistics Study. 24 Martin Associates calculations for Florida Trade and Logistics Study. 25 Martin Associates calculations using data from the U.S. Army Corps of Engineers Deep Draft
Self Propelled Vessel Cost Database; bunker fuel prices from Bunker World; port specific stevedoring costs, terminal costs, port charges, and pilotage and towing costs; commercial lease rate information from CBRE MarketView reports; mileage from PC Miler; drayage and trucking rates from interviews with motor carriers; and intermodal rail rates from the Surface Transportation Board 1 Percent Waybill Sample, Intermodal Department of Ocean Carriers, and CSX Transportation. The analysis compares the costs of moving a container from Hong Kong to distribution center sites in Jacksonville, Orlando, and Hialeah. The trip chains analyzed included 1) entering the United States through the Port of Los Angeles and using intermodal rail to bring the container to Florida; 2) entering the United States through the Port of Savannah and using trucking to bring the container to Jacksonville or Orlando, or rail to bring the container to Hialeah; 3) or entering the United States through the nearest Florida container port (Jacksonville, Tampa, or Miami) and using trucking to bring the container to its final destination. The table does not include inventory and safety stock costs, which can be anywhere from $180 to $500 per load higher for the all -water route, given its longer time duration.
26 For the purposes of this report, the logistics related jobs include three types of impacts: direct jobs (for example, employment at airports, seaports, railroads, trucking companies, and other businesses directly involved in moving freight); indirect impacts (for example, jobs supported by purchases of fuel, supplies, warehousing, and other services to support the direct jobs); and induced impacts (for examples, jobs in retail trade or restaurants supported by increased consumer spending from the employees at the direct and indirect jobs).
27 This estimate assumes the existing allocation of Florida origin exports among manufacturing industries continues in the future. This estimate does not include a comprehensive analysis of the induced impacts of these additional jobs on consumer spending.
28 This estimate does not include a comprehensive analysis of the induced impacts of these additional jobs on consumer spending.
29 Agency for Workforce Innovation data are based on occupations, rather than industry classifications. The precise definition of the industry cluster cited elsewhere in this report could not be replicated using this data source.
37 37


![[X] EXPEDITE](https://img.pdfslide.net/doc/110x75/6290ebe975ad8d306424d00c/x-expedite.jpg)