Embed Size (px)
Citation preview
0
Published by Investor Relations Unit – Republic of Indonesia
Contact: Wiwit Widyastuti K. (International Department - Bank Indonesia, Phone: +6221 2981 8279)
Abdurohman (Fiscal Policy Office – Ministry of Finance, Phone: +6221 384 6379)
Subhan Noor (Debt Management Office - Ministry of Finance, Phone: +6221 381 0175)
E-mail: [email protected]
ABOUT THE REPUBLIC OF INDONESIA INVESTOR RELATIONS UNIT
The Republic of Indonesia Investor Relations Unit (IRU) has been established as the joint effort between the Coordinating Ministry of Economic Affairs,
Ministry of Finance and Bank Indonesia since 2005. The main objective of IRU is to actively communicate Indonesian economic policy and address
concerns of investors, especially financial market investors. IRU is expected to serve as a single point of contact for the financial market participants.
As an important part of its communication measures, IRU maintains a website under Bank Indonesia website which is being administrated by the
International Department of Bank Indonesia. However, investor relations activities involve a coordinated efforts which are supported by all relevant
government agencies, i.e. Bank Indonesia, the Ministry of Finance, the Coordinating Ministry for Economic Affairs, Investment Coordinating Board,
Ministry of Trade, Ministry of Industry, State Ministry of State Owned Enterprises, State Asset Management Company, and the Central Bureau of
Statistics.
IRU also holds an investor conference call on a quarterly basis, answers questions through email, telephone and may arrange direct visit of
banks/financial institutions to Bank Indonesia and other relevant government offices.
About Investor Relations Unit (IRU)
1

Table of Content
Executive Summary
Preserved Macroeconomic Stability
Improved International Perception and Rising Investment
Prudent Fiscal Management
Government Debt Performance
2

Executive Summary
3
Executive Summary
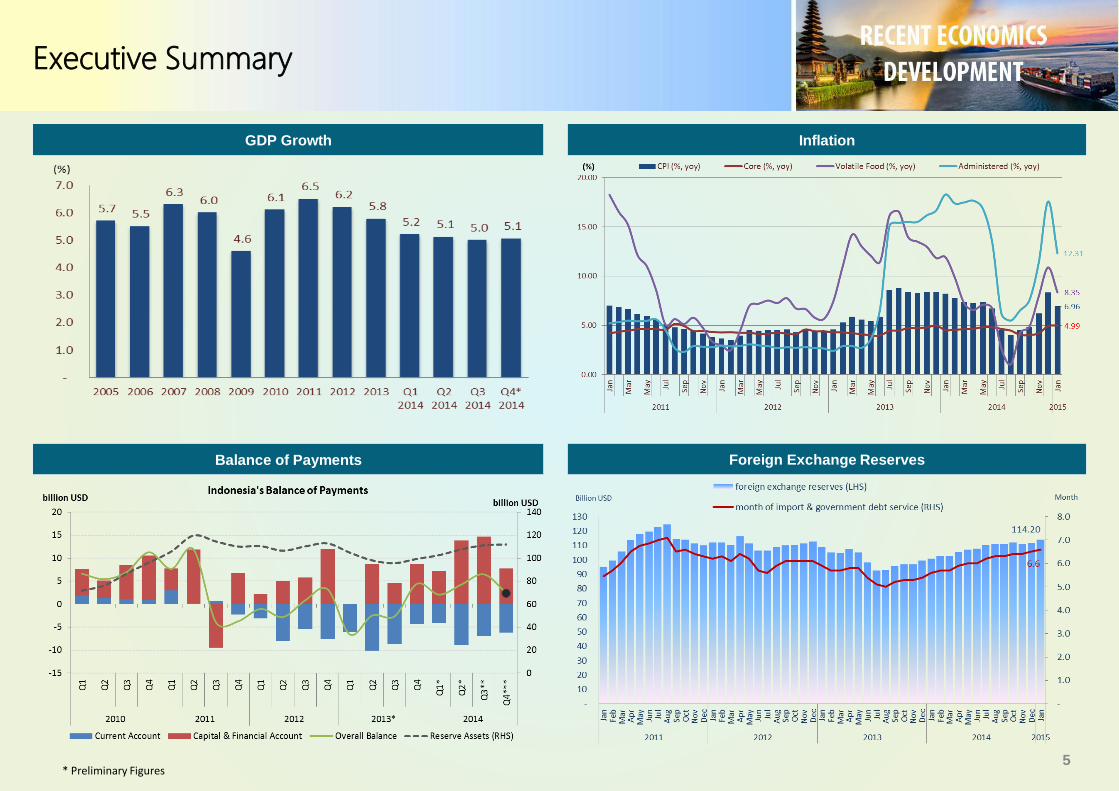
Economic growth accelerated in Indonesia during the fourth quarter of 2014 in comparison to the preceding quarter, despite annual growth
for 2014 slowing down. The Indonesian economy achieved 5.01% (yoy) growth in the fourth quarter, up from 4.92% (yoy) in the previous period.
Despite early signs of improvement during the fourth quarter of 2014, annual growth slowed in 2014 to 5.02%, which is lower than that posted in the
preceding year, consistent with weaker global economic growth and macroeconomic stabilization policy. Stronger economic growth is projected in
2015, in the range of 5.4-5.8%, bolstered by expansive government investment as fiscal capacity expands to catalyze productive economic activity,
including infrastructure development as approved in the 2015 budget.
The Indonesia balance of payments (BOP) improved in the fourth quarter of 2014, primarily due to a smaller current account deficit. The
current account deficit totaled US$6.2 billion (2.81% of GDP) in the fourth quarter, down from US$7 billion (2.99% of GDP) in the third. A growing non-
oil/gas trade surplus, together with a decreasing oil and gas deficit, helped boost current account performance. Meanwhile, the financial and capital
account recorded a large surplus, backed predominantly by foreign direct investment (FDI) congruent with the positive perception investors hold
concerning the domestic economic outlook. In January 2015, the trade surplus totaled US$0.7 billion, exceeding that posted in the preceding quarter,
bolstered by a smaller oil and gas deficit.
Inflation remained under control, thus supporting the prospect of achieving the 2015 inflation target, namely 4±1%. The Consumer Price
Index (CPI) experienced deflation of 0.24% (mtm) in January 2015 as a tangible outcome of lower fuel prices and less intense inflationary pressures on
volatile foods. In addition, core inflation was controlled at a level of 0.61% (mtm) or 4.99% (yoy).
Financial system stability was maintained with the support of steadfast banking system resilience and relatively sound financial market
performance. Banking industry resilience remained solid with credit risk, liquidity risk and market risk well mitigated and the support of a healthy
capital base. At the end of the reporting quarter, the Capital Adequacy Ratio soared to 19.40%, well above the statutory minimum of 8%, while non-
performing loans (NPL) were low and stable at around 2.0%.
On 17th February 2015, the Bank Indonesia Board of Governors decided to lower the BI Rate 25 bps to 7.50%, with the Deposit Facility rate
also reduced 25 bps to 5.50% and the Lending Facility rate maintained at 8.00%, effective 18th February 2015. Such policy measures were
instituted based on Bank Indonesia’s conviction that inflation will remain under control at the lower end of the 4±1% range in 2015 and 2016.
Bank Indonesia will continue to strengthen its monetary and macroprudential policy mix, bolster the payment system and intensify
coordination with the Government in terms of controlling inflation, reducing the current account deficit and promoting structural reforms in order to
support higher economic growth.
On the fiscal front, Indonesia will continue its prudent fiscal management in 2015 with strong commitment to fiscal consolidation. Recent
reform policy represents an essential step and integral part of structural reforms to strengthen economic fundamentals in Indonesia. 2015 revised
budget deficit is projected at a safe level of 1.91% of GDP.4
Executive Summary
GDP Growth Inflation
Foreign Exchange ReservesBalance of Payments
5* Preliminary Figures
6
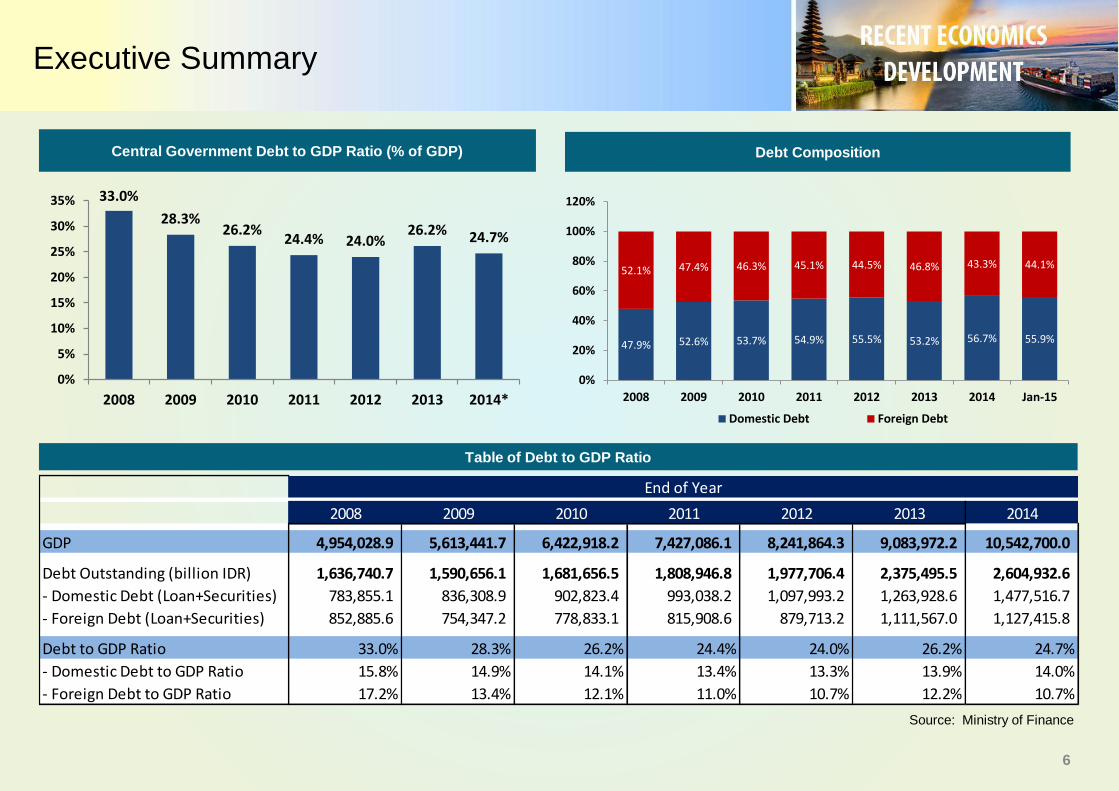
Source: Ministry of Finance
Debt Composition
Table of Debt to GDP Ratio
Central Government Debt to GDP Ratio (% of GDP)
47.9% 52.6% 53.7% 54.9% 55.5% 53.2% 56.7% 55.9%
52.1% 47.4% 46.3% 45.1% 44.5% 46.8% 43.3% 44.1%
0%
20%
40%
60%
80%
100%
120%
2008 2009 2010 2011 2012 2013 2014 Jan-15
Domestic Debt Foreign Debt
33.0%
28.3%26.2%
24.4% 24.0%26.2% 24.7%
0%
5%
10%
15%
20%
25%
30%
35%
2008 2009 2010 2011 2012 2013 2014*
2008 2009 2010 2011 2012 2013 2014
GDP 4,954,028.9 5,613,441.7 6,422,918.2 7,427,086.1 8,241,864.3 9,083,972.2 10,542,700.0
Debt Outstanding (billion IDR) 1,636,740.7 1,590,656.1 1,681,656.5 1,808,946.8 1,977,706.4 2,375,495.5 2,604,932.6
- Domestic Debt (Loan+Securities) 783,855.1 836,308.9 902,823.4 993,038.2 1,097,993.2 1,263,928.6 1,477,516.7
- Foreign Debt (Loan+Securities) 852,885.6 754,347.2 778,833.1 815,908.6 879,713.2 1,111,567.0 1,127,415.8
Debt to GDP Ratio 33.0% 28.3% 26.2% 24.4% 24.0% 26.2% 24.7%
- Domestic Debt to GDP Ratio 15.8% 14.9% 14.1% 13.4% 13.3% 13.9% 14.0%
- Foreign Debt to GDP Ratio 17.2% 13.4% 12.1% 11.0% 10.7% 12.2% 10.7%
End of Year
Executive Summary
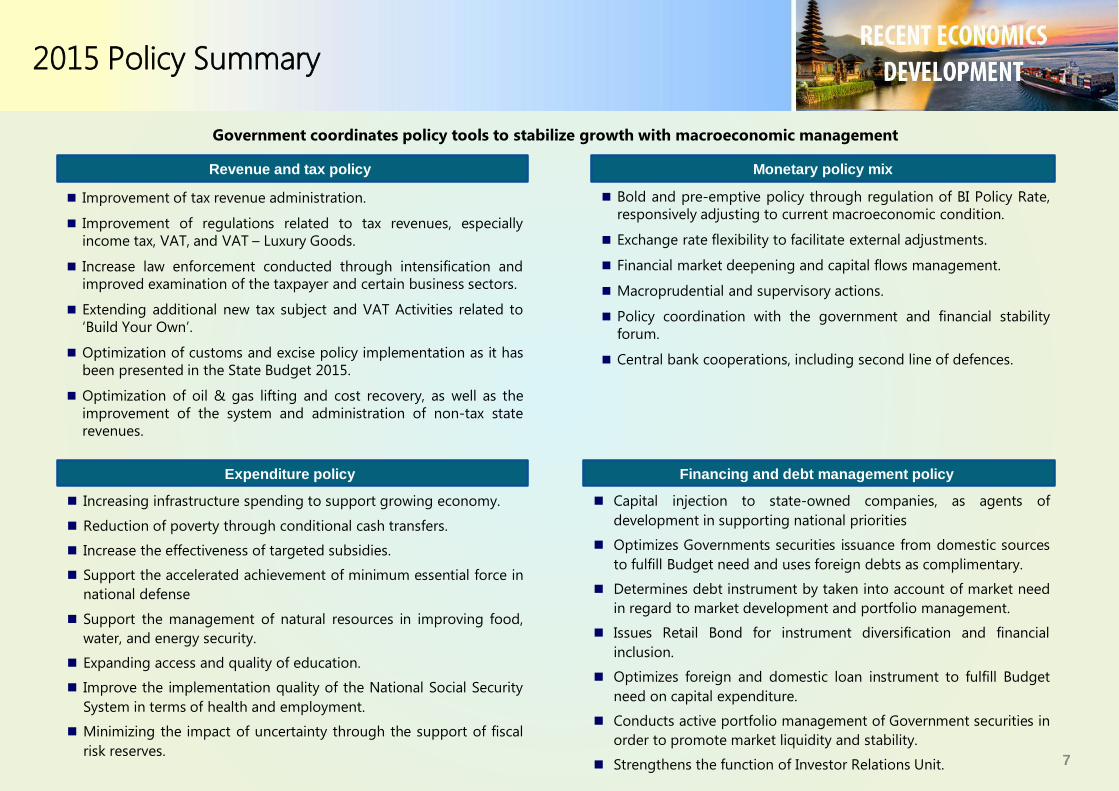
2015 Policy Summary
Government coordinates policy tools to stabilize growth with macroeconomic management
Capital injection to state-owned companies, as agents of
development in supporting national priorities
Optimizes Governments securities issuance from domestic sources
to fulfill Budget need and uses foreign debts as complimentary.
Determines debt instrument by taken into account of market need
in regard to market development and portfolio management.
Issues Retail Bond for instrument diversification and financial
inclusion.
Optimizes foreign and domestic loan instrument to fulfill Budget
need on capital expenditure.
Conducts active portfolio management of Government securities in
order to promote market liquidity and stability.
Strengthens the function of Investor Relations Unit.
Revenue and tax policy
Financing and debt management policyExpenditure policy
Monetary policy mix
Bold and pre-emptive policy through regulation of BI Policy Rate,
responsively adjusting to current macroeconomic condition.
Exchange rate flexibility to facilitate external adjustments.
Financial market deepening and capital flows management.
Macroprudential and supervisory actions.
Policy coordination with the government and financial stability
forum.
Central bank cooperations, including second line of defences.
7
Improvement of tax revenue administration.
Improvement of regulations related to tax revenues, especially
income tax, VAT, and VAT – Luxury Goods.
Increase law enforcement conducted through intensification and
improved examination of the taxpayer and certain business sectors.
Extending additional new tax subject and VAT Activities related to
‘Build Your Own’.
Optimization of customs and excise policy implementation as it has
been presented in the State Budget 2015.
Optimization of oil & gas lifting and cost recovery, as well as the
improvement of the system and administration of non-tax state
revenues.
Increasing infrastructure spending to support growing economy.
Reduction of poverty through conditional cash transfers.
Increase the effectiveness of targeted subsidies.
Support the accelerated achievement of minimum essential force in
national defense
Support the management of natural resources in improving food,
water, and energy security.
Expanding access and quality of education.
Improve the implementation quality of the National Social Security
System in terms of health and employment.
Minimizing the impact of uncertainty through the support of fiscal
risk reserves.
Improved International Perception
and Rising Investment
8
Ma
r-99
Dec-9
9
Se
p-0
0
Jun-0
1
Ma
r-02
Dec-0
2
Au
g-0
3
Ma
y-0
4
Feb-0
5
Nov-0
5
Au
g-0
6
Ma
y-0
7
Jan-0
8
Oct-
08
Jul-09
Ap
r-10
Jan-1
1
Oct-
11
Jul-12
Ma
r-13
Dec-1
3
Fitch
Ma
r-99
Dec-9
9
Se
p-0
0
Jun-0
1
Ma
r-02
Dec-0
2
Au
g-0
3
Ma
y-0
4
Feb-0
5
Nov-0
5
Au
g-0
6
Ma
y-0
7
Jan-0
8
Oct-
08
Jul-09
Ap
r-10
Jan-1
1
Oct-
11
Jul-12
Ma
r-13
Dec-1
3
S&P
Ma
r-99
Dec-9
9
Se
p-0
0
Jun-0
1
Ma
r-02
Dec-0
2
Au
g-0
3
Ma
y-0
4
Feb-0
5
Nov-0
5
Au
g-0
6
Ma
y-0
7
Jan-0
8
Oct-
08
Jul-09
Ap
r-10
Jan-1
1
Oct-
11
Jul-12
Ma
r-13
Dec-1
3
Moody's
Mo
od
y’s
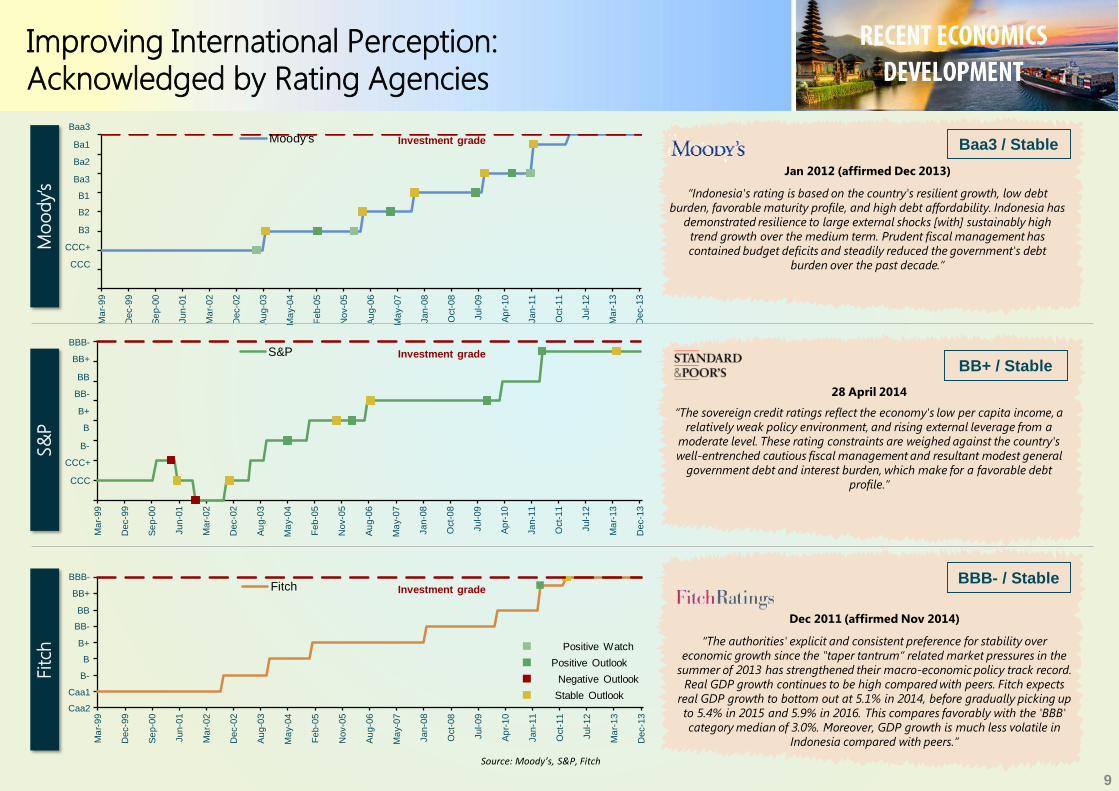
Dec 2011 (affirmed Nov 2014)
“The authorities' explicit and consistent preference for stability over
economic growth since the "taper tantrum“ related market pressures in the
summer of 2013 has strengthened their macro-economic policy track record.
Real GDP growth continues to be high compared with peers. Fitch expects
real GDP growth to bottom out at 5.1% in 2014, before gradually picking up
to 5.4% in 2015 and 5.9% in 2016. This compares favorably with the 'BBB'
category median of 3.0%. Moreover, GDP growth is much less volatile in
Indonesia compared with peers.”
Jan 2012 (affirmed Dec 2013)
“Indonesia's rating is based on the country's resilient growth, low debt
burden, favorable maturity profile, and high debt affordability. Indonesia has
demonstrated resilience to large external shocks [with] sustainably high
trend growth over the medium term. Prudent fiscal management has
contained budget deficits and steadily reduced the government's debt
burden over the past decade.”
28 April 2014
“The sovereign credit ratings reflect the economy's low per capita income, a
relatively weak policy environment, and rising external leverage from a
moderate level. These rating constraints are weighed against the country's
well-entrenched cautious fiscal management and resultant modest general
government debt and interest burden, which make for a favorable debt
profile.”
BBB- / Stable
Baa3 / Stable
BB+ / Stable
Source: Moody’s, S&P, Fitch
Improving International Perception: Acknowledged by Rating Agencies
S&
PFitch
Investment grade
Baa3
B3
B2
B1
Ba3
Ba2
Ba1
CCC+
CCC
Positive Outlook
Negative Outlook
Stable Outlook
Positive Watch
B-
B
B+
BB-
BB
BB+
BBB-
CCC+
CCC
B-
B
B+
BB-
BB
BB+
BBB-
Caa1
Caa2
Investment grade
Investment grade
9
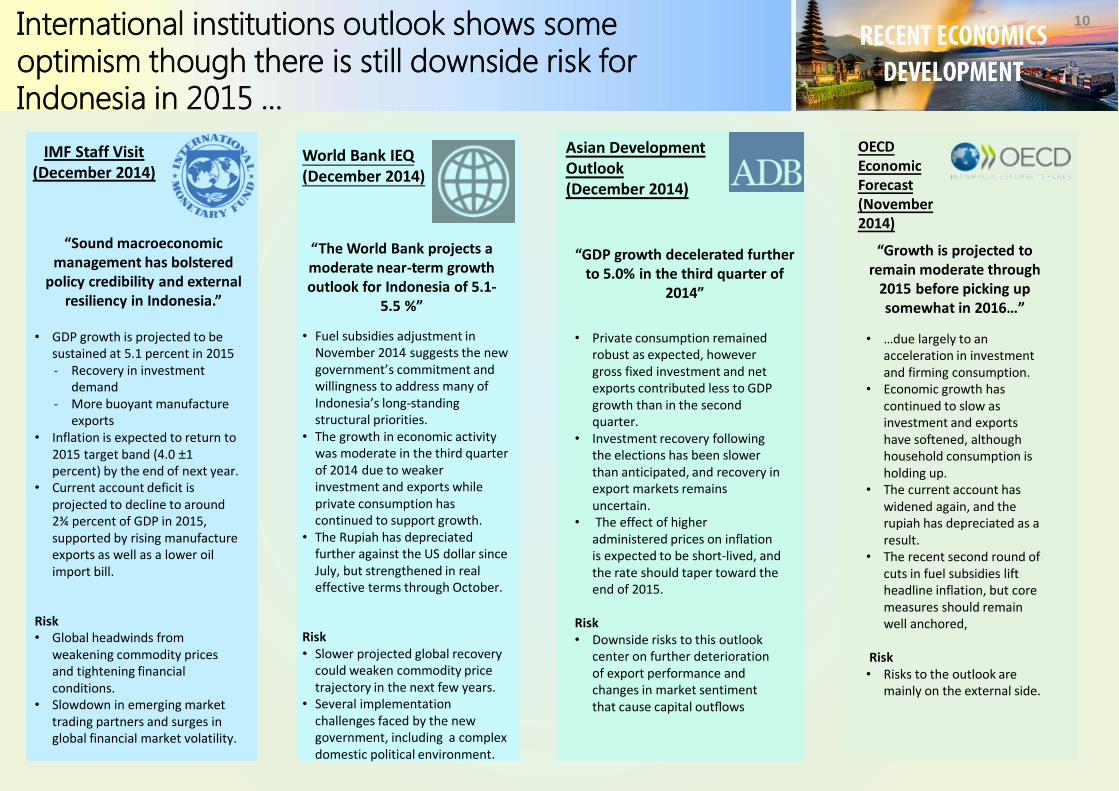
International institutions outlook shows some optimism though there is still downside risk for Indonesia in 2015 …
10
`
IMF Staff Visit (December 2014)
World Bank IEQ (December 2014)
“Sound macroeconomic management has bolstered
policy credibility and external resiliency in Indonesia.”
• GDP growth is projected to be sustained at 5.1 percent in 2015- Recovery in investment
demand - More buoyant manufacture
exports• Inflation is expected to return to
2015 target band (4.0 ±1 percent) by the end of next year.
• Current account deficit is projected to decline to around 2¾ percent of GDP in 2015, supported by rising manufacture exports as well as a lower oil import bill.
Risk• Global headwinds from
weakening commodity prices and tightening financial conditions.
• Slowdown in emerging market trading partners and surges in global financial market volatility.
“The World Bank projects a moderate near-term growth outlook for Indonesia of 5.1-
5.5 %”
• Fuel subsidies adjustment in November 2014 suggests the new government’s commitment and willingness to address many of Indonesia’s long-standing structural priorities.
• The growth in economic activity was moderate in the third quarter of 2014 due to weaker investment and exports while private consumption has continued to support growth.
• The Rupiah has depreciated further against the US dollar since July, but strengthened in real effective terms through October.
Risk• Slower projected global recovery
could weaken commodity price trajectory in the next few years.
• Several implementation challenges faced by the new government, including a complex domestic political environment.
Asian Development Outlook (December 2014)
“GDP growth decelerated further to 5.0% in the third quarter of
2014”
• Private consumption remained robust as expected, however gross fixed investment and net exports contributed less to GDP growth than in the second quarter.
• Investment recovery following the elections has been slower than anticipated, and recovery in export markets remains uncertain.
• The effect of higher administered prices on inflation is expected to be short-lived, and the rate should taper toward the end of 2015.
Risk• Downside risks to this outlook
center on further deterioration of export performance and changes in market sentiment that cause capital outflows
OECD Economic Forecast (November 2014)
“Growth is projected to remain moderate through
2015 before picking up somewhat in 2016…”
• …due largely to an acceleration in investment and firming consumption.
• Economic growth has continued to slow as investment and exports have softened, although household consumption is holding up.
• The current account has widened again, and the rupiah has depreciated as a result.
• The recent second round of cuts in fuel subsidies lift headline inflation, but core measures should remain well anchored,
Risk• Risks to the outlook are
mainly on the external side.
Preserved Macroeconomic Stability
11
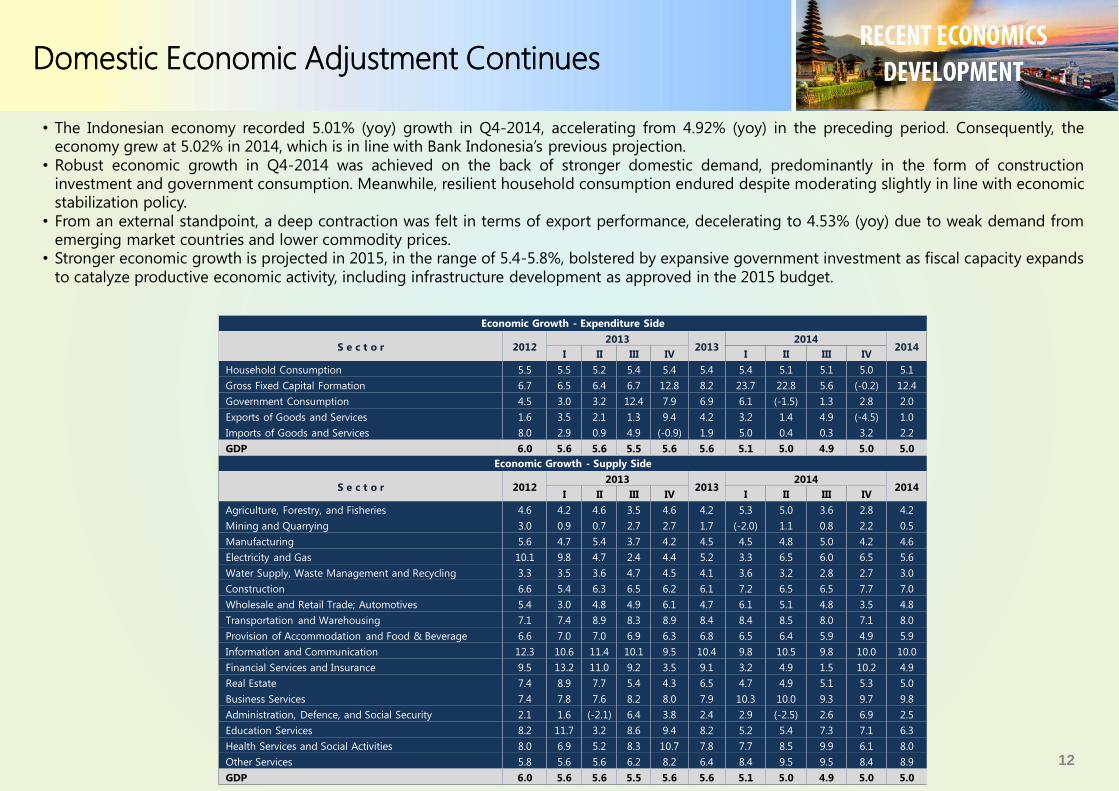
Domestic Economic Adjustment Continues
• The Indonesian economy recorded 5.01% (yoy) growth in Q4-2014, accelerating from 4.92% (yoy) in the preceding period. Consequently, theeconomy grew at 5.02% in 2014, which is in line with Bank Indonesia’s previous projection.
• Robust economic growth in Q4-2014 was achieved on the back of stronger domestic demand, predominantly in the form of constructioninvestment and government consumption. Meanwhile, resilient household consumption endured despite moderating slightly in line with economicstabilization policy.
• From an external standpoint, a deep contraction was felt in terms of export performance, decelerating to 4.53% (yoy) due to weak demand fromemerging market countries and lower commodity prices.
• Stronger economic growth is projected in 2015, in the range of 5.4-5.8%, bolstered by expansive government investment as fiscal capacity expands
to catalyze productive economic activity, including infrastructure development as approved in the 2015 budget.
12
Economic Growth - Expenditure Side
S e c t o r 20122013
20132014
2014I II III IV I II III IV
Household Consumption 5.5 5.5 5.2 5.4 5.4 5.4 5.4 5.1 5.1 5.0 5.1
Gross Fixed Capital Formation 6.7 6.5 6.4 6.7 12.8 8.2 23.7 22.8 5.6 (-0.2) 12.4
Government Consumption 4.5 3.0 3.2 12.4 7.9 6.9 6.1 (-1.5) 1.3 2.8 2.0
Exports of Goods and Services 1.6 3.5 2.1 1.3 9.4 4.2 3.2 1.4 4.9 (-4.5) 1.0
Imports of Goods and Services 8.0 2.9 0.9 4.9 (-0.9) 1.9 5.0 0.4 0.3 3.2 2.2
GDP 6.0 5.6 5.6 5.5 5.6 5.6 5.1 5.0 4.9 5.0 5.0
Economic Growth - Supply Side
S e c t o r 20122013
20132014
2014I II III IV I II III IV
Agriculture, Forestry, and Fisheries 4.6 4.2 4.6 3.5 4.6 4.2 5.3 5.0 3.6 2.8 4.2
Mining and Quarrying 3.0 0.9 0.7 2.7 2.7 1.7 (-2.0) 1.1 0.8 2.2 0.5
Manufacturing 5.6 4.7 5.4 3.7 4.2 4.5 4.5 4.8 5.0 4.2 4.6
Electricity and Gas 10.1 9.8 4.7 2.4 4.4 5.2 3.3 6.5 6.0 6.5 5.6
Water Supply, Waste Management and Recycling 3.3 3.5 3.6 4.7 4.5 4.1 3.6 3.2 2.8 2.7 3.0
Construction 6.6 5.4 6.3 6.5 6.2 6.1 7.2 6.5 6.5 7.7 7.0
Wholesale and Retail Trade; Automotives 5.4 3.0 4.8 4.9 6.1 4.7 6.1 5.1 4.8 3.5 4.8
Transportation and Warehousing 7.1 7.4 8.9 8.3 8.9 8.4 8.4 8.5 8.0 7.1 8.0
Provision of Accommodation and Food & Beverage 6.6 7.0 7.0 6.9 6.3 6.8 6.5 6.4 5.9 4.9 5.9
Information and Communication 12.3 10.6 11.4 10.1 9.5 10.4 9.8 10.5 9.8 10.0 10.0
Financial Services and Insurance 9.5 13.2 11.0 9.2 3.5 9.1 3.2 4.9 1.5 10.2 4.9
Real Estate 7.4 8.9 7.7 5.4 4.3 6.5 4.7 4.9 5.1 5.3 5.0
Business Services 7.4 7.8 7.6 8.2 8.0 7.9 10.3 10.0 9.3 9.7 9.8
Administration, Defence, and Social Security 2.1 1.6 (-2.1) 6.4 3.8 2.4 2.9 (-2.5) 2.6 6.9 2.5
Education Services 8.2 11.7 3.2 8.6 9.4 8.2 5.2 5.4 7.3 7.1 6.3
Health Services and Social Activities 8.0 6.9 5.2 8.3 10.7 7.8 7.7 8.5 9.9 6.1 8.0
Other Services 5.8 5.6 5.6 6.2 8.2 6.4 8.4 9.5 9.5 8.4 8.9
GDP 6.0 5.6 5.6 5.5 5.6 5.6 5.1 5.0 4.9 5.0 5.0
Source: KPMG, Ernst and Young, Jefferies Economist Intelligence Unit, Ministry of Finance, BPS and CIA World Factbook
(1) Working age defined as being between 15-54 years old
13
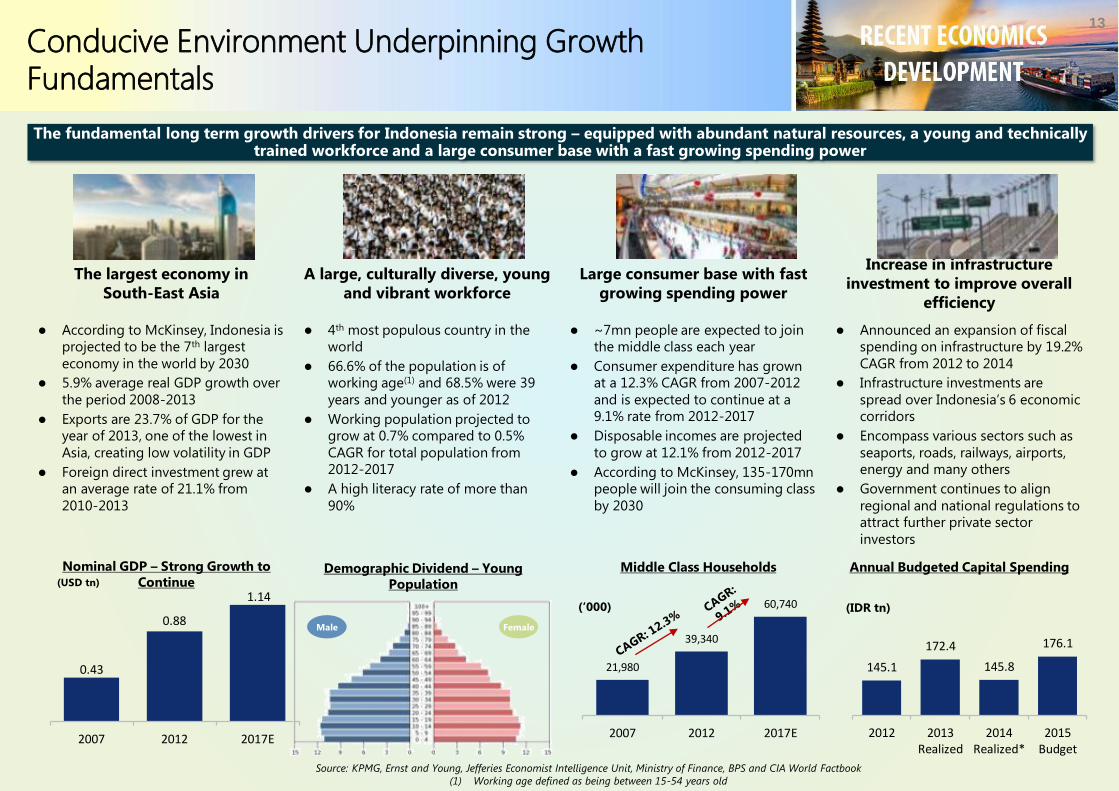
The largest economy in
South-East Asia
A large, culturally diverse, young
and vibrant workforce
Large consumer base with fast
growing spending power
Increase in infrastructure
investment to improve overall
efficiency
According to McKinsey, Indonesia is
projected to be the 7th largest
economy in the world by 2030
5.9% average real GDP growth over
the period 2008-2013
Exports are 23.7% of GDP for the
year of 2013, one of the lowest in
Asia, creating low volatility in GDP
Foreign direct investment grew at
an average rate of 21.1% from
2010-2013
4th most populous country in the
world
66.6% of the population is of
working age(1) and 68.5% were 39
years and younger as of 2012
Working population projected to
grow at 0.7% compared to 0.5%
CAGR for total population from
2012-2017
A high literacy rate of more than
90%
~7mn people are expected to join
the middle class each year
Consumer expenditure has grown
at a 12.3% CAGR from 2007-2012
and is expected to continue at a
9.1% rate from 2012-2017
Disposable incomes are projected
to grow at 12.1% from 2012-2017
According to McKinsey, 135-170mn
people will join the consuming class
by 2030
Announced an expansion of fiscal
spending on infrastructure by 19.2%
CAGR from 2012 to 2014
Infrastructure investments are
spread over Indonesia’s 6 economic
corridors
Encompass various sectors such as
seaports, roads, railways, airports,
energy and many others
Government continues to align
regional and national regulations to
attract further private sector
investors
(USD tn)
Nominal GDP – Strong Growth to
ContinueMiddle Class Households Annual Budgeted Capital Spending
(IDR tn)
145.1
172.4
145.8
176.1
2012 2013Realized
2014Realized*
2015Budget
21,980
39,340
60,740
2007 2012 2017E
(‘000)
Demographic Dividend – Young
Population
0.43
0.88
1.14
2007 2012 2017E
Male Female
The fundamental long term growth drivers for Indonesia remain strong – equipped with abundant natural resources, a young and technically trained workforce and a large consumer base with a fast growing spending power
Conducive Environment Underpinning Growth Fundamentals
Globally Competitive and a Top Investment Destination
Source: Global Competitiveness Index 2014-2015, WEF
(1) Countries with sovereign ratings in the Eaa1-Baa1 category and population larger than 40 million
(2) Rank among 144 countries
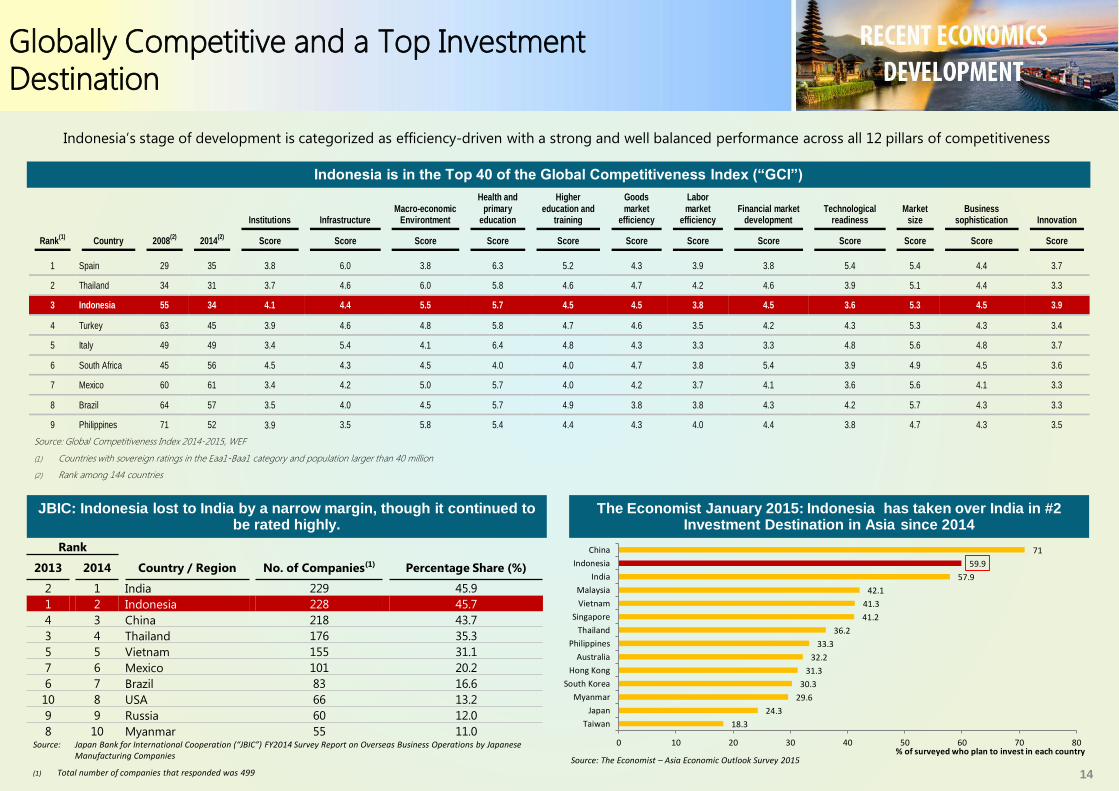
Indonesia’s stage of development is categorized as efficiency-driven with a strong and well balanced performance across all 12 pillars of competitiveness
Source: The Economist – Asia Economic Outlook Survey 2015
Indonesia is in the Top 40 of the Global Competitiveness Index (“GCI”)
JBIC: Indonesia lost to India by a narrow margin, though it continued to be rated highly.
The Economist January 2015: Indonesia has taken over India in #2 Investment Destination in Asia since 2014
Source: Japan Bank for International Cooperation (“JBIC”) FY2014 Survey Report on Overseas Business Operations by Japanese Manufacturing Companies
(1) Total number of companies that responded was 499 14
Rank(1)
Country 2008(2)
2014(2)
Institutions Infrastructure Macro-economic
Environtment
Health and primary
education
Higher education and
training
Goods market
efficiency
Labor market
efficiency Financial market
development Technological
readiness Market
size Business
sophistication Innovation
Score Score Score Score Score Score Score Score Score Score Score Score
1 Spain 29 35 3.8 6.0 3.8 6.3 5.2 4.3 3.9 3.8 5.4 5.4 4.4 3.7
2 Thailand 34 31 3.7 4.6 6.0 5.8 4.6 4.7 4.2 4.6 3.9 5.1 4.4 3.3
3 Indonesia 55 34 4.1 4.4 5.5 5.7 4.5 4.5 3.8 4.5 3.6 5.3 4.5 3.9
4 Turkey 63 45 3.9 4.6 4.8 5.8 4.7 4.6 3.5 4.2 4.3 5.3 4.3 3.4
5 Italy 49 49 3.4 5.4 4.1 6.4 4.8 4.3 3.3 3.3 4.8 5.6 4.8 3.7
6 South Africa 45 56 4.5 4.3 4.5 4.0 4.0 4.7 3.8 5.4 3.9 4.9 4.5 3.6
7 Mexico 60 61 3.4 4.2 5.0 5.7 4.0 4.2 3.7 4.1 3.6 5.6 4.1 3.3
8 Brazil 64 57 3.5 4.0 4.5 5.7 4.9 3.8 3.8 4.3 4.2 5.7 4.3 3.3
9 Philippines 71 52 3.9 3.5 5.8 5.4 4.4 4.3 4.0 4.4 3.8 4.7 4.3 3.5
18.3
24.3
29.6
30.3
31.3
32.2
33.3
36.2
41.2
41.3
42.1
57.9
59.9
71
0 10 20 30 40 50 60 70 80
Taiwan
Japan
Myanmar
South Korea
Hong Kong
Australia
Philippines
Thailand
Singapore
Vietnam
Malaysia
India
Indonesia
China
% of surveyed who plan to invest in each country
Rank
2013 2014 Country / Region No. of Companies(1) Percentage Share (%)
2 1 India 229 45.9
1 2 Indonesia 228 45.7
4 3 China 218 43.7
3 4 Thailand 176 35.3
5 5 Vietnam 155 31.1
7 6 Mexico 101 20.2
6 7 Brazil 83 16.6
10 8 USA 66 13.2
9 9 Russia 60 12.0
8 10 Myanmar 55 11.0
Strong Investment Underpinned by Competitivenessand Stability
Investment Realization Progress Q4-2014
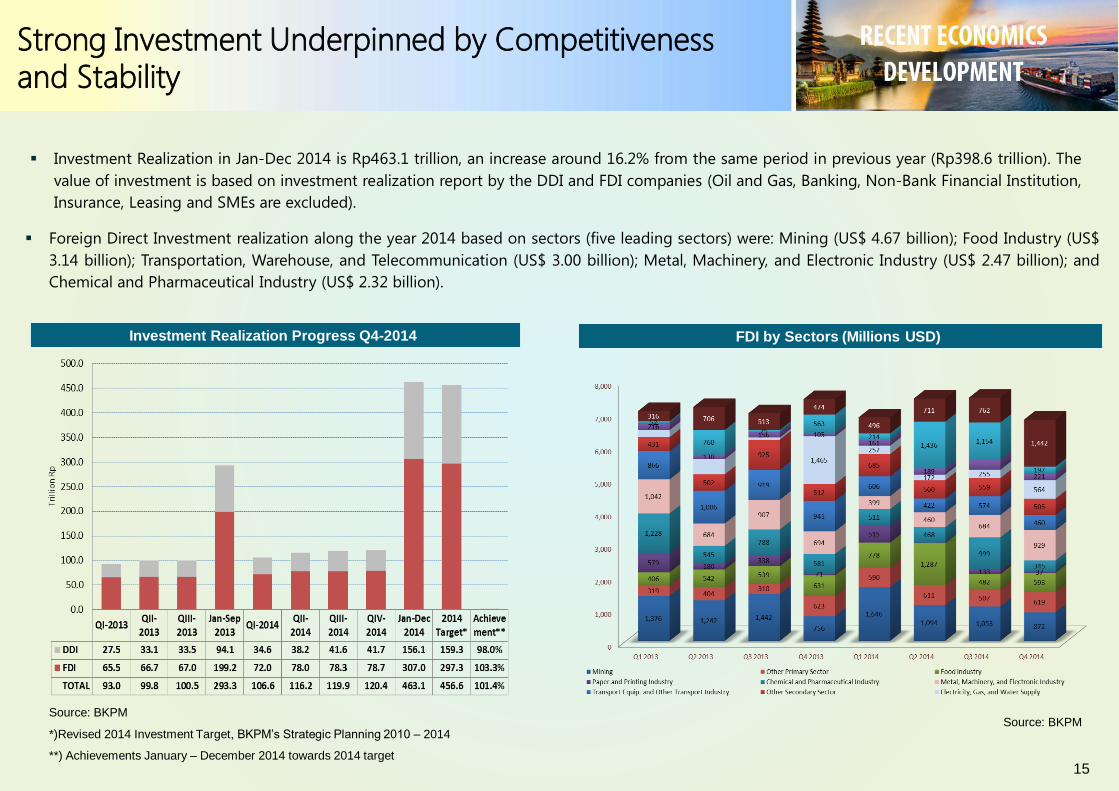
Investment Realization in Jan-Dec 2014 is Rp463.1 trillion, an increase around 16.2% from the same period in previous year (Rp398.6 trillion). The
value of investment is based on investment realization report by the DDI and FDI companies (Oil and Gas, Banking, Non-Bank Financial Institution,
Insurance, Leasing and SMEs are excluded).
Source: BKPMSource: BKPM
*)Revised 2014 Investment Target, BKPM’s Strategic Planning 2010 – 2014
**) Achievements January – December 2014 towards 2014 target
FDI by Sectors (Millions USD)
Foreign Direct Investment realization along the year 2014 based on sectors (five leading sectors) were: Mining (US$ 4.67 billion); Food Industry (US$
3.14 billion); Transportation, Warehouse, and Telecommunication (US$ 3.00 billion); Metal, Machinery, and Electronic Industry (US$ 2.47 billion); and
Chemical and Pharmaceutical Industry (US$ 2.32 billion).
15
16
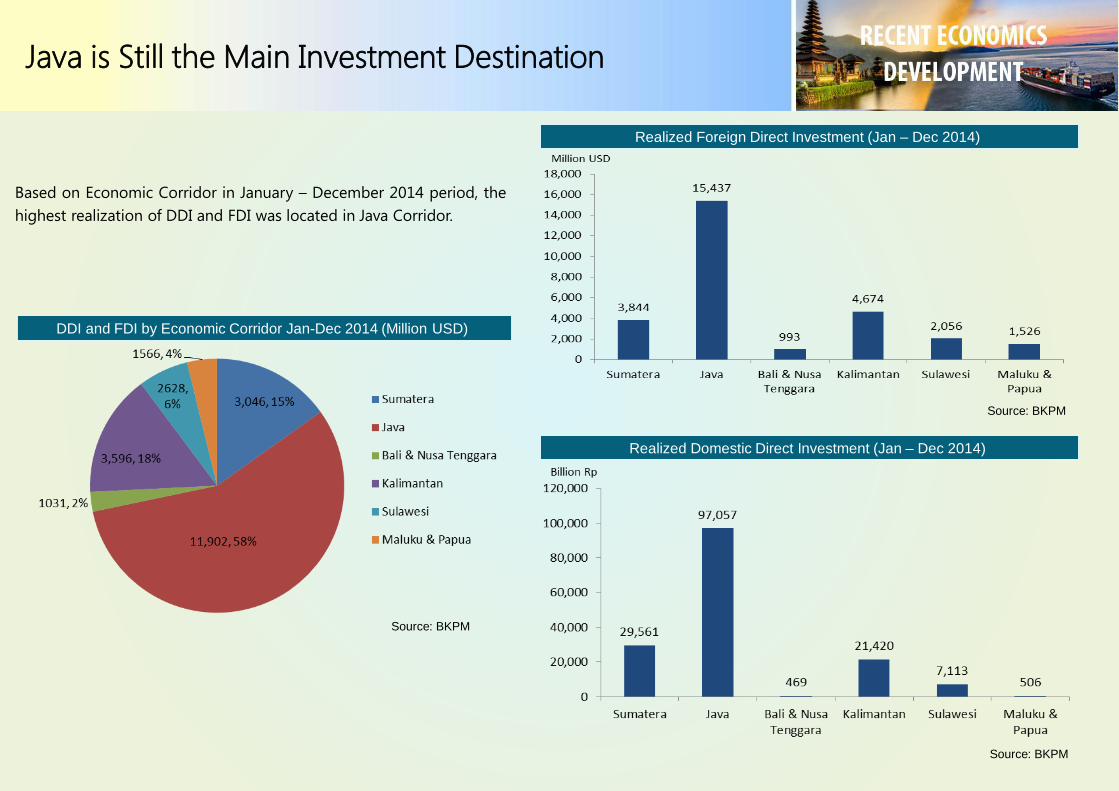
Java is Still the Main Investment Destination
Realized Foreign Direct Investment (Jan – Dec 2014)
Realized Domestic Direct Investment (Jan – Dec 2014)
Source: BKPM
Source: BKPM
DDI and FDI by Economic Corridor Jan-Dec 2014 (Million USD)
Source: BKPM
Based on Economic Corridor in January – December 2014 period, the
highest realization of DDI and FDI was located in Java Corridor.
Decreasing Pressure of Inflation
Disaggregation of Inflation
Source: BPS, Bank Indonesia
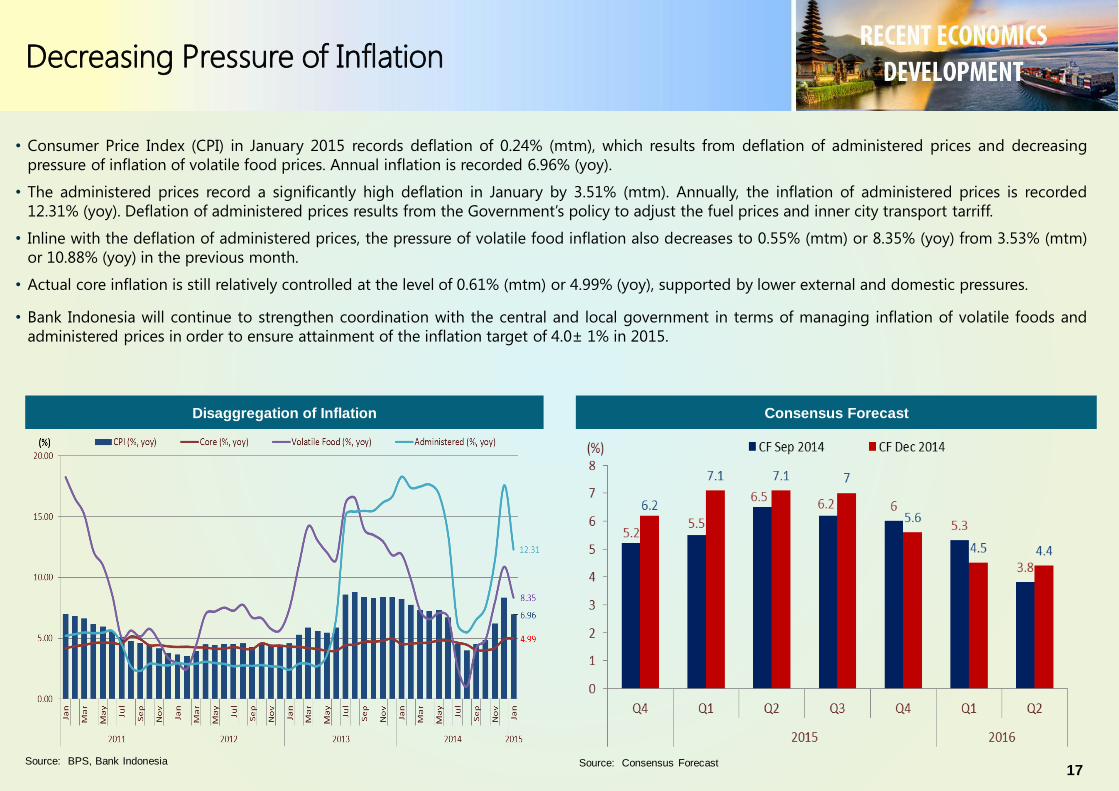
• Consumer Price Index (CPI) in January 2015 records deflation of 0.24% (mtm), which results from deflation of administered prices and decreasing
pressure of inflation of volatile food prices. Annual inflation is recorded 6.96% (yoy).
• The administered prices record a significantly high deflation in January by 3.51% (mtm). Annually, the inflation of administered prices is recorded
12.31% (yoy). Deflation of administered prices results from the Government’s policy to adjust the fuel prices and inner city transport tarriff.
• Inline with the deflation of administered prices, the pressure of volatile food inflation also decreases to 0.55% (mtm) or 8.35% (yoy) from 3.53% (mtm)
or 10.88% (yoy) in the previous month.
• Actual core inflation is still relatively controlled at the level of 0.61% (mtm) or 4.99% (yoy), supported by lower external and domestic pressures.
• Bank Indonesia will continue to strengthen coordination with the central and local government in terms of managing inflation of volatile foods and
administered prices in order to ensure attainment of the inflation target of 4.0± 1% in 2015.
Consensus Forecast
Source: Consensus Forecast17
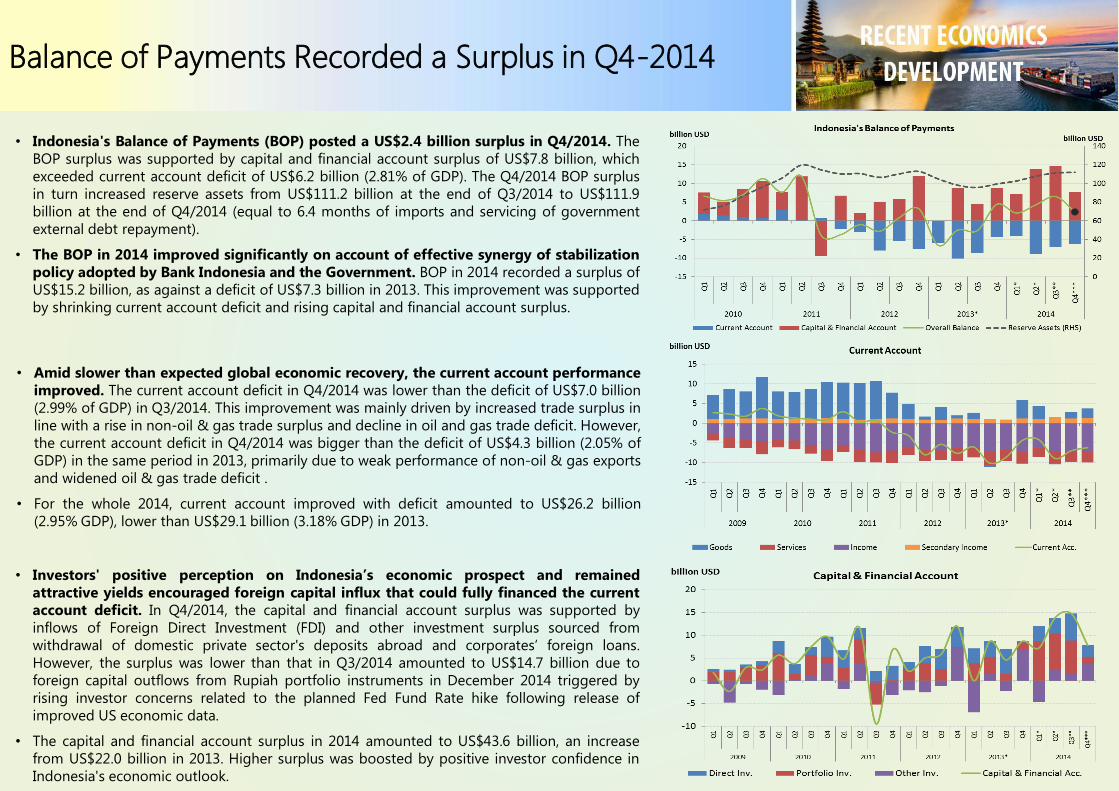
• Indonesia's Balance of Payments (BOP) posted a US$2.4 billion surplus in Q4/2014. The
BOP surplus was supported by capital and financial account surplus of US$7.8 billion, which
exceeded current account deficit of US$6.2 billion (2.81% of GDP). The Q4/2014 BOP surplus
in turn increased reserve assets from US$111.2 billion at the end of Q3/2014 to US$111.9
billion at the end of Q4/2014 (equal to 6.4 months of imports and servicing of government
external debt repayment).
• The BOP in 2014 improved significantly on account of effective synergy of stabilization
policy adopted by Bank Indonesia and the Government. BOP in 2014 recorded a surplus of
US$15.2 billion, as against a deficit of US$7.3 billion in 2013. This improvement was supported
by shrinking current account deficit and rising capital and financial account surplus.
• Amid slower than expected global economic recovery, the current account performance
improved. The current account deficit in Q4/2014 was lower than the deficit of US$7.0 billion
(2.99% of GDP) in Q3/2014. This improvement was mainly driven by increased trade surplus in
line with a rise in non-oil & gas trade surplus and decline in oil and gas trade deficit. However,
the current account deficit in Q4/2014 was bigger than the deficit of US$4.3 billion (2.05% of
GDP) in the same period in 2013, primarily due to weak performance of non-oil & gas exports
and widened oil & gas trade deficit .
• For the whole 2014, current account improved with deficit amounted to US$26.2 billion
(2.95% GDP), lower than US$29.1 billion (3.18% GDP) in 2013.
• Investors' positive perception on Indonesia’s economic prospect and remained
attractive yields encouraged foreign capital influx that could fully financed the current
account deficit. In Q4/2014, the capital and financial account surplus was supported by
inflows of Foreign Direct Investment (FDI) and other investment surplus sourced from
withdrawal of domestic private sector's deposits abroad and corporates’ foreign loans.
However, the surplus was lower than that in Q3/2014 amounted to US$14.7 billion due to
foreign capital outflows from Rupiah portfolio instruments in December 2014 triggered by
rising investor concerns related to the planned Fed Fund Rate hike following release of
improved US economic data.
• The capital and financial account surplus in 2014 amounted to US$43.6 billion, an increase
from US$22.0 billion in 2013. Higher surplus was boosted by positive investor confidence in
Indonesia's economic outlook.
Balance of Payments Recorded a Surplus in Q4-2014
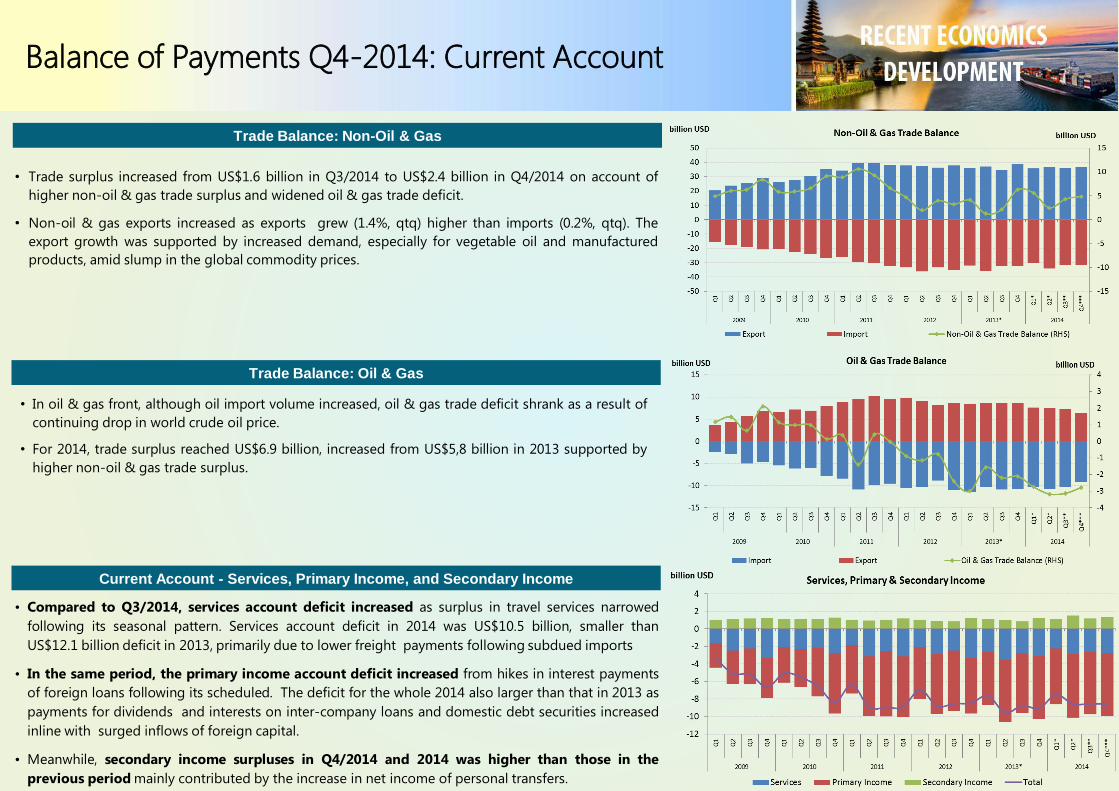
• Trade surplus increased from US$1.6 billion in Q3/2014 to US$2.4 billion in Q4/2014 on account of
higher non-oil & gas trade surplus and widened oil & gas trade deficit.
• Non-oil & gas exports increased as exports grew (1.4%, qtq) higher than imports (0.2%, qtq). The
export growth was supported by increased demand, especially for vegetable oil and manufactured
products, amid slump in the global commodity prices.
Balance of Payments Q4-2014: Current Account
• In oil & gas front, although oil import volume increased, oil & gas trade deficit shrank as a result of
continuing drop in world crude oil price.
• For 2014, trade surplus reached US$6.9 billion, increased from US$5,8 billion in 2013 supported by
higher non-oil & gas trade surplus.
Trade Balance: Non-Oil & Gas
Trade Balance: Oil & Gas
• Compared to Q3/2014, services account deficit increased as surplus in travel services narrowed
following its seasonal pattern. Services account deficit in 2014 was US$10.5 billion, smaller than
US$12.1 billion deficit in 2013, primarily due to lower freight payments following subdued imports
• In the same period, the primary income account deficit increased from hikes in interest payments
of foreign loans following its scheduled. The deficit for the whole 2014 also larger than that in 2013 as
payments for dividends and interests on inter-company loans and domestic debt securities increased
inline with surged inflows of foreign capital.
• Meanwhile, secondary income surpluses in Q4/2014 and 2014 was higher than those in the
previous period mainly contributed by the increase in net income of personal transfers.
Current Account - Services, Primary Income, and Secondary Income
20
Balance of Payments Q4-2014: Capital & Financial Account
Financial Account: Assets
Financial Account Liabilities: Direct Investment
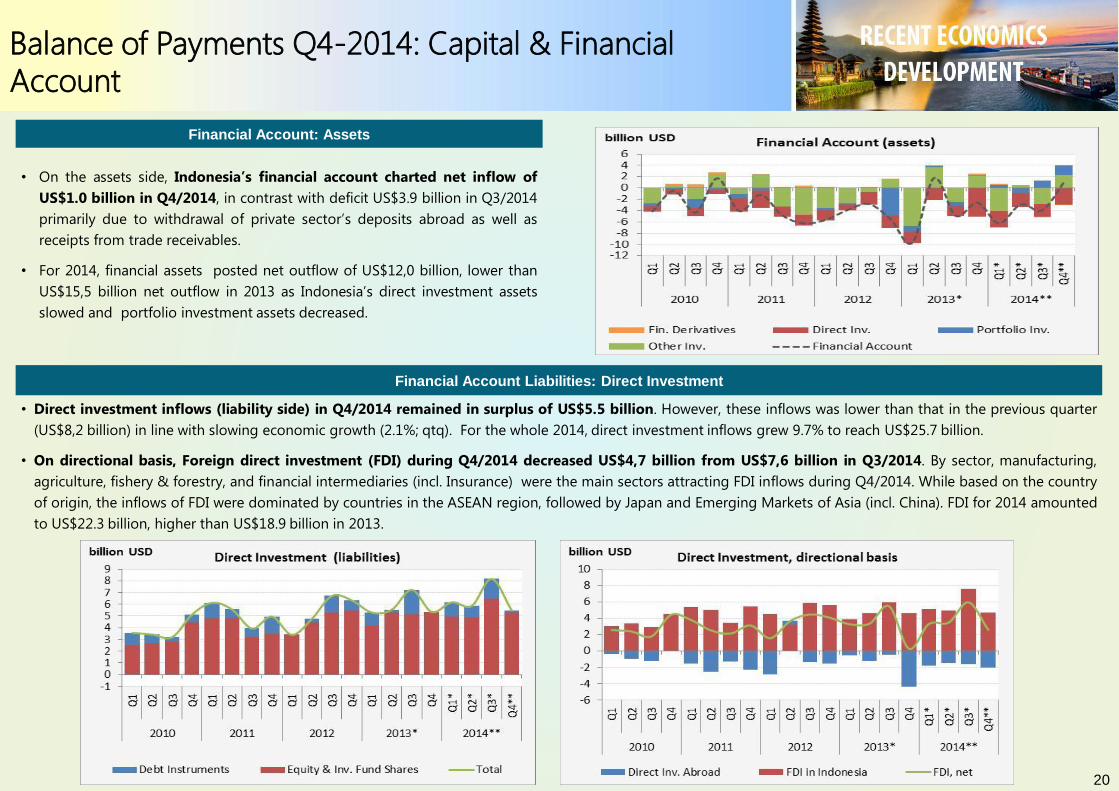
• On the assets side, Indonesia’s financial account charted net inflow of
US$1.0 billion in Q4/2014, in contrast with deficit US$3.9 billion in Q3/2014
primarily due to withdrawal of private sector’s deposits abroad as well as
receipts from trade receivables.
• For 2014, financial assets posted net outflow of US$12,0 billion, lower than
US$15,5 billion net outflow in 2013 as Indonesia’s direct investment assets
slowed and portfolio investment assets decreased.
• Direct investment inflows (liability side) in Q4/2014 remained in surplus of US$5.5 billion. However, these inflows was lower than that in the previous quarter
(US$8,2 billion) in line with slowing economic growth (2.1%; qtq). For the whole 2014, direct investment inflows grew 9.7% to reach US$25.7 billion.
• On directional basis, Foreign direct investment (FDI) during Q4/2014 decreased US$4,7 billion from US$7,6 billion in Q3/2014. By sector, manufacturing,
agriculture, fishery & forestry, and financial intermediaries (incl. Insurance) were the main sectors attracting FDI inflows during Q4/2014. While based on the country
of origin, the inflows of FDI were dominated by countries in the ASEAN region, followed by Japan and Emerging Markets of Asia (incl. China). FDI for 2014 amounted
to US$22.3 billion, higher than US$18.9 billion in 2013.
21
Balance of Payments Q4-2014: Capital & Financial Account
Financial Account Liabilities: Portfolio Investment
Financial Account Liabilities: Foreign Other Investment
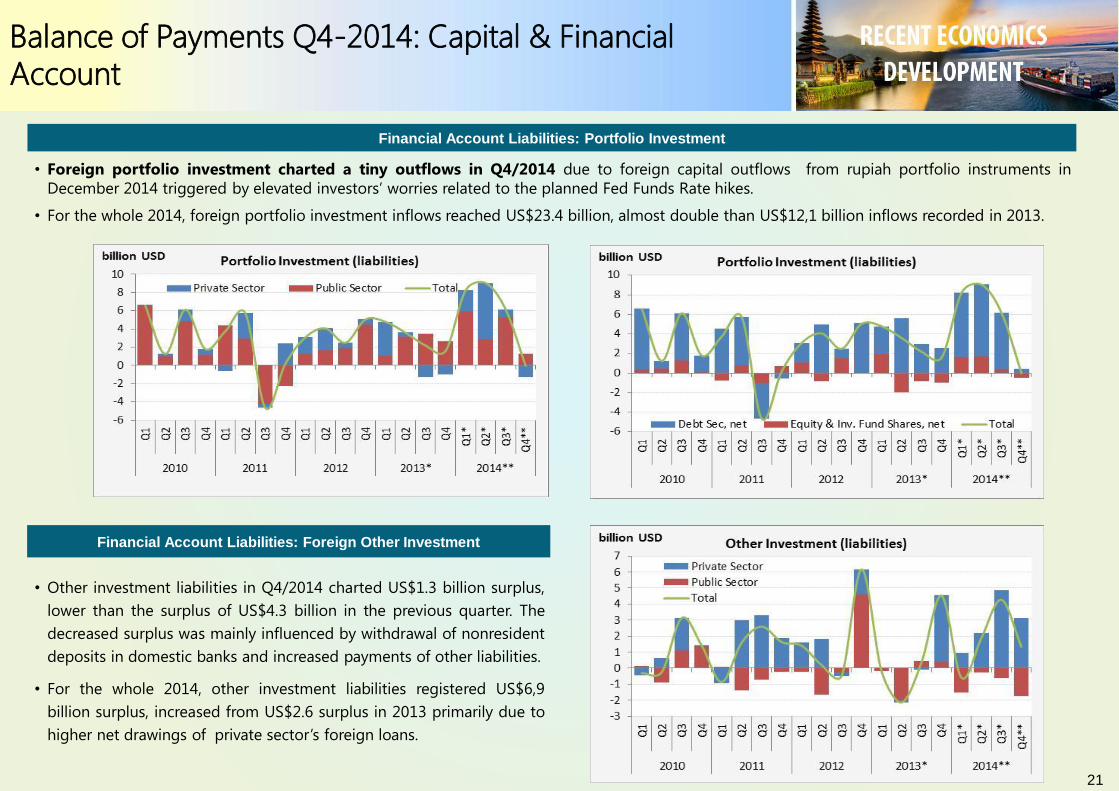
• Foreign portfolio investment charted a tiny outflows in Q4/2014 due to foreign capital outflows from rupiah portfolio instruments in
December 2014 triggered by elevated investors’ worries related to the planned Fed Funds Rate hikes.
• For the whole 2014, foreign portfolio investment inflows reached US$23.4 billion, almost double than US$12,1 billion inflows recorded in 2013.
• Other investment liabilities in Q4/2014 charted US$1.3 billion surplus,
lower than the surplus of US$4.3 billion in the previous quarter. The
decreased surplus was mainly influenced by withdrawal of nonresident
deposits in domestic banks and increased payments of other liabilities.
• For the whole 2014, other investment liabilities registered US$6,9
billion surplus, increased from US$2.6 surplus in 2013 primarily due to
higher net drawings of private sector’s foreign loans.
Exchange Rate In Line With Fundamentals
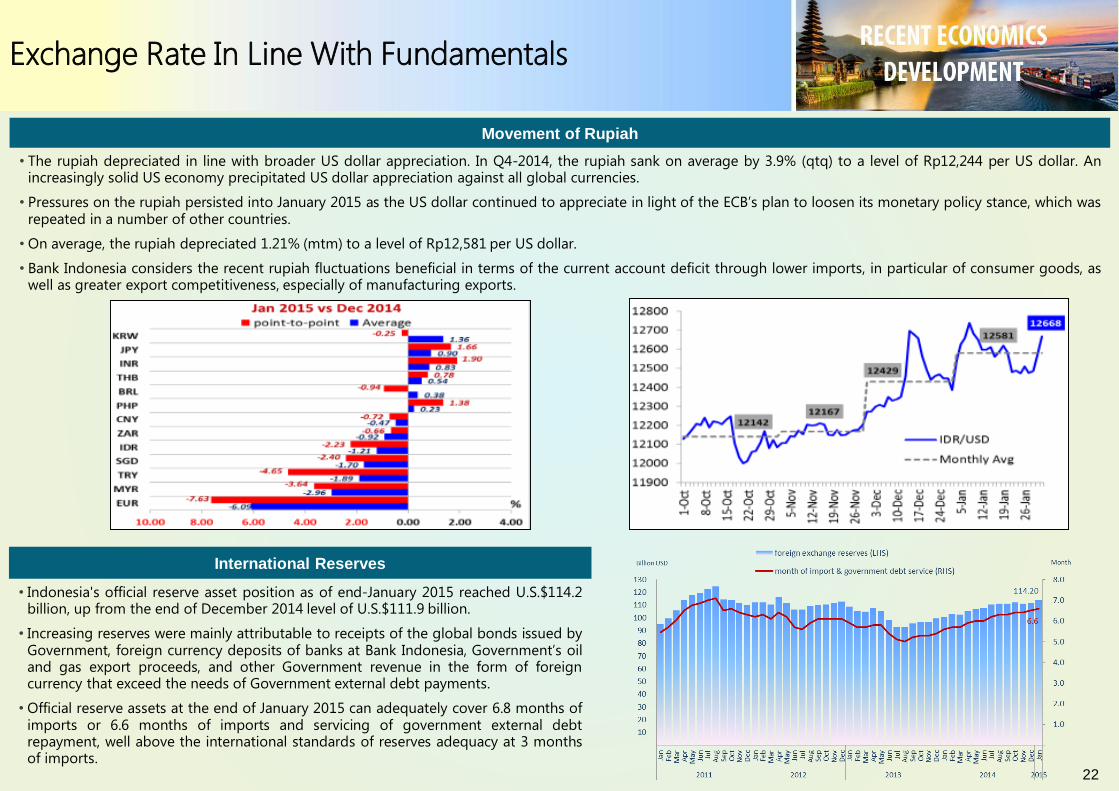
• The rupiah depreciated in line with broader US dollar appreciation. In Q4-2014, the rupiah sank on average by 3.9% (qtq) to a level of Rp12,244 per US dollar. Anincreasingly solid US economy precipitated US dollar appreciation against all global currencies.
• Pressures on the rupiah persisted into January 2015 as the US dollar continued to appreciate in light of the ECB’s plan to loosen its monetary policy stance, which wasrepeated in a number of other countries.
• On average, the rupiah depreciated 1.21% (mtm) to a level of Rp12,581 per US dollar.
• Bank Indonesia considers the recent rupiah fluctuations beneficial in terms of the current account deficit through lower imports, in particular of consumer goods, aswell as greater export competitiveness, especially of manufacturing exports.
Movement of Rupiah
International Reserves
22
• Indonesia's official reserve asset position as of end-January 2015 reached U.S.$114.2billion, up from the end of December 2014 level of U.S.$111.9 billion.
• Increasing reserves were mainly attributable to receipts of the global bonds issued byGovernment, foreign currency deposits of banks at Bank Indonesia, Government’s oiland gas export proceeds, and other Government revenue in the form of foreigncurrency that exceed the needs of Government external debt payments.
• Official reserve assets at the end of January 2015 can adequately cover 6.8 months ofimports or 6.6 months of imports and servicing of government external debtrepayment, well above the international standards of reserves adequacy at 3 monthsof imports.
Monetary Policy Stance
BI Rate
Source: Bank Indonesia
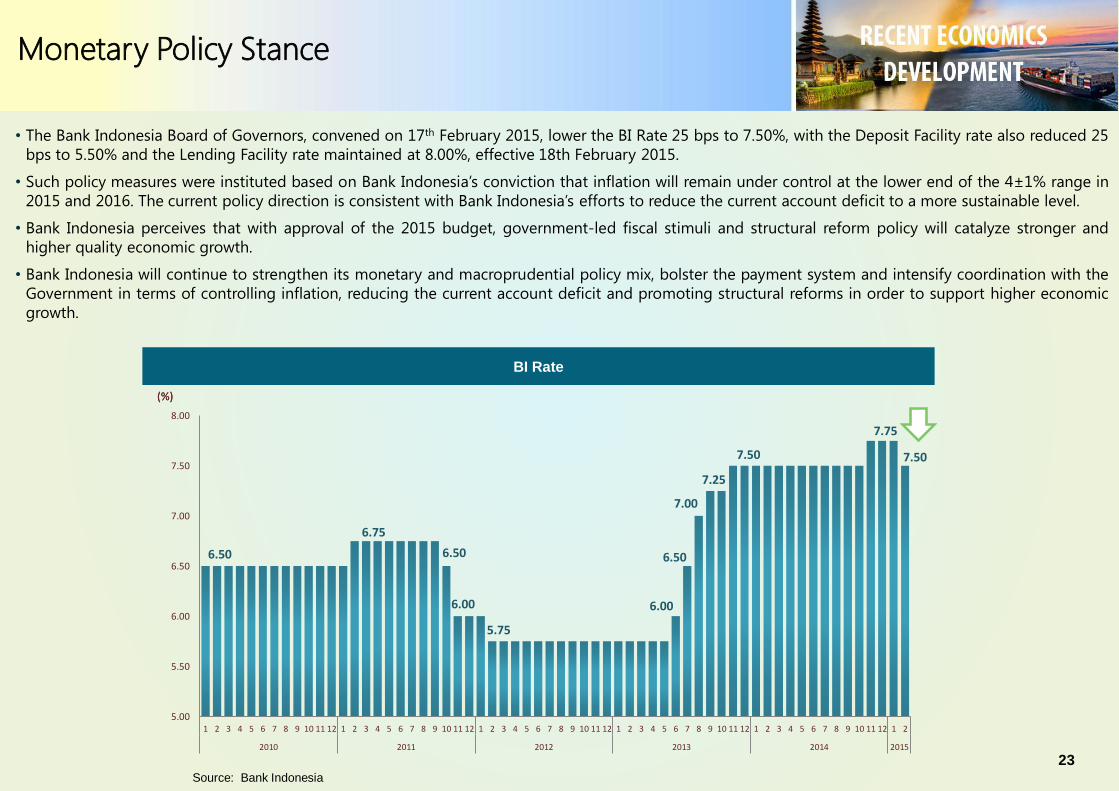
• The Bank Indonesia Board of Governors, convened on 17th February 2015, lower the BI Rate 25 bps to 7.50%, with the Deposit Facility rate also reduced 25
bps to 5.50% and the Lending Facility rate maintained at 8.00%, effective 18th February 2015.
• Such policy measures were instituted based on Bank Indonesia’s conviction that inflation will remain under control at the lower end of the 4±1% range in
2015 and 2016. The current policy direction is consistent with Bank Indonesia’s efforts to reduce the current account deficit to a more sustainable level.
• Bank Indonesia perceives that with approval of the 2015 budget, government-led fiscal stimuli and structural reform policy will catalyze stronger and
higher quality economic growth.
• Bank Indonesia will continue to strengthen its monetary and macroprudential policy mix, bolster the payment system and intensify coordination with the
Government in terms of controlling inflation, reducing the current account deficit and promoting structural reforms in order to support higher economic
growth.
23
6.50
6.75
6.50
6.00
5.75
6.00
6.50
7.00
7.25
7.50
7.75
7.50
5.00
5.50
6.00
6.50
7.00
7.50
8.00
1 2 3 4 5 6 7 8 9 10 11 12 1 2 3 4 5 6 7 8 9 10 11 12 1 2 3 4 5 6 7 8 9 10 11 12 1 2 3 4 5 6 7 8 9 10 11 12 1 2 3 4 5 6 7 8 9 10 11 12 1 2
2010 2011 2012 2013 2014 2015
(%)(%)
Solid Financial System Stability
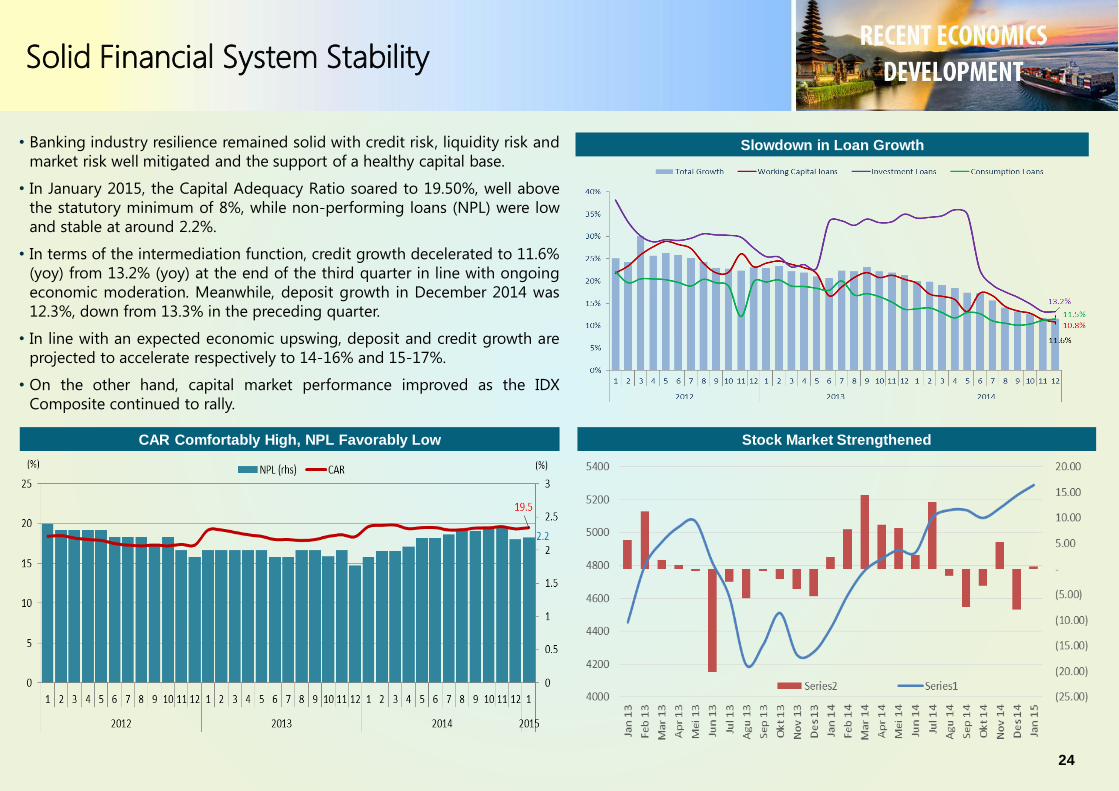
• Banking industry resilience remained solid with credit risk, liquidity risk and
market risk well mitigated and the support of a healthy capital base.
• In January 2015, the Capital Adequacy Ratio soared to 19.50%, well above
the statutory minimum of 8%, while non-performing loans (NPL) were low
and stable at around 2.2%.
• In terms of the intermediation function, credit growth decelerated to 11.6%
(yoy) from 13.2% (yoy) at the end of the third quarter in line with ongoing
economic moderation. Meanwhile, deposit growth in December 2014 was
12.3%, down from 13.3% in the preceding quarter.
• In line with an expected economic upswing, deposit and credit growth are
projected to accelerate respectively to 14-16% and 15-17%.
• On the other hand, capital market performance improved as the IDX
Composite continued to rally.
CAR Comfortably High, NPL Favorably Low
Slowdown in Loan Growth
Stock Market Strengthened
24
Prudent Fiscal Management
25

Improving Budget Structure
Manageable Fiscal Deficit
Quality of Spending
Sustainable Revenue Source
• Develop effective taxation policy and tax administration
• Focus not only on the corporate but also on personal income tax & improve value added tax system.
• Provide fiscal incentive for investment with better targeted system
• Change subsidy paradigmShift from price (commodity) subsidy to targeted subsidy system
• Reallocate budget to productive spending, such as infrastructure and direct assistance.
• Prioritize basic infrastructure to support food security, agriculture and fisheries sectors as well as job creation.
• Provide a greater room on our fiscal to anticipate the uncertainty coming from global economic development.
• Encourage private sector to help infrastructure development, among other through PPP scheme
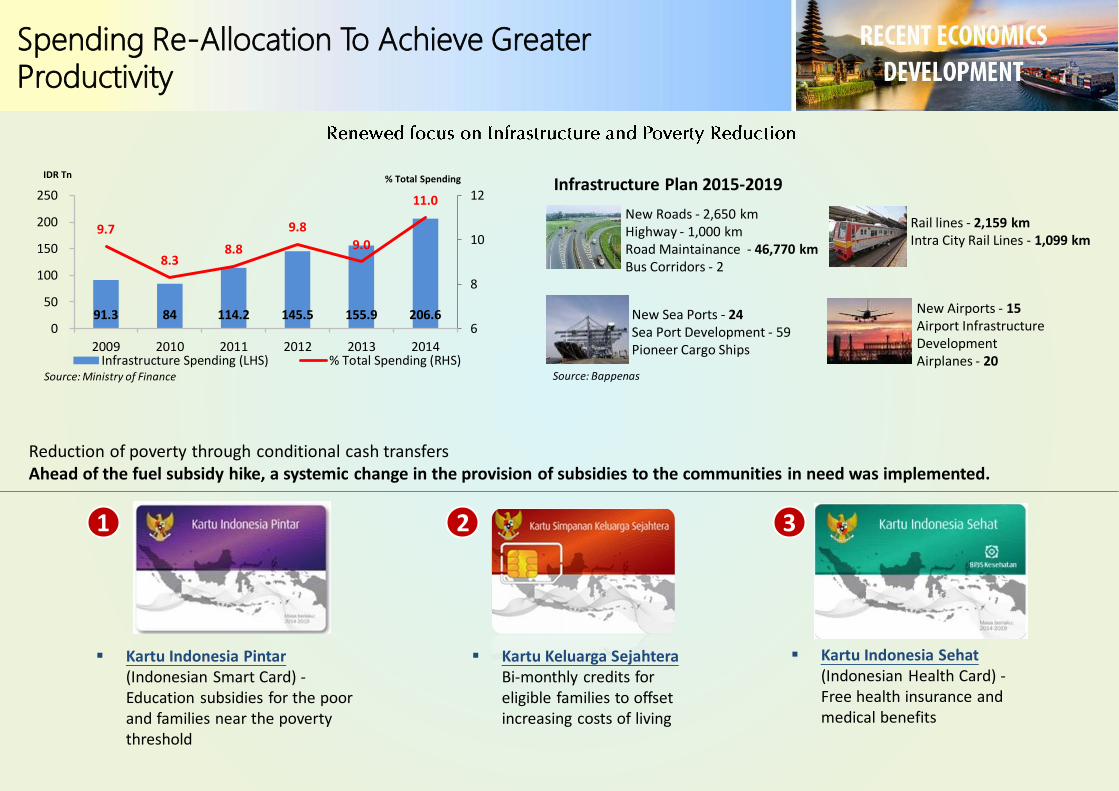
Spending Re-Allocation To Achieve Greater Productivity
Infrastructure Plan 2015-2019
New Sea Ports - 24 Sea Port Development - 59Pioneer Cargo Ships
New Airports - 15 Airport Infrastructure DevelopmentAirplanes - 20
Rail lines - 2,159 kmIntra City Rail Lines - 1,099 km
New Roads - 2,650 kmHighway - 1,000 kmRoad Maintainance - 46,770 kmBus Corridors - 2
Source: Ministry of Finance
Kartu Indonesia Pintar(Indonesian Smart Card) -Education subsidies for the poor and families near the poverty threshold
Kartu Keluarga Sejahtera Bi-monthly credits for eligible families to offset increasing costs of living
Kartu Indonesia Sehat(Indonesian Health Card) -Free health insurance and medical benefits
Reduction of poverty through conditional cash transfersAhead of the fuel subsidy hike, a systemic change in the provision of subsidies to the communities in need was implemented.
IDR Tn % Total Spending
1 2 3
91.3 84 114.2 145.5 155.9 206.6
9.7
8.38.8
9.8
9.0
11.0
6
8
10
12
0
50
100
150
200
250
2009 2010 2011 2012 2013 2014Infrastructure Spending (LHS) % Total Spending (RHS)
Source: Bappenas
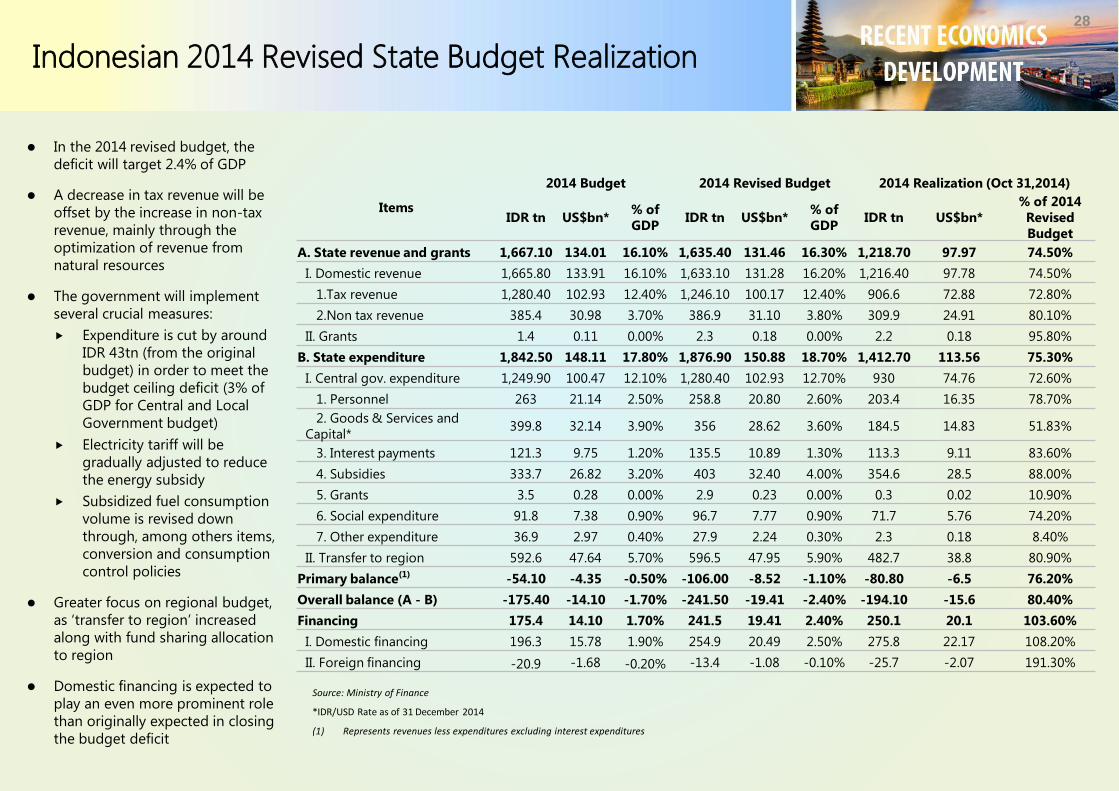
Indonesian 2014 Revised State Budget Realization
28
Source: Ministry of Finance
*IDR/USD Rate as of 31 December 2014
(1) Represents revenues less expenditures excluding interest expenditures
In the 2014 revised budget, the
deficit will target 2.4% of GDP
A decrease in tax revenue will be
offset by the increase in non-tax
revenue, mainly through the
optimization of revenue from
natural resources
The government will implement
several crucial measures:
Expenditure is cut by around
IDR 43tn (from the original
budget) in order to meet the
budget ceiling deficit (3% of
GDP for Central and Local
Government budget)
Electricity tariff will be
gradually adjusted to reduce
the energy subsidy
Subsidized fuel consumption
volume is revised down
through, among others items,
conversion and consumption
control policies
Greater focus on regional budget,
as ‘transfer to region’ increased
along with fund sharing allocation
to region
Domestic financing is expected to
play an even more prominent role
than originally expected in closing
the budget deficit
Items
2014 Budget 2014 Revised Budget 2014 Realization (Oct 31,2014)
IDR tn US$bn*% of
GDPIDR tn US$bn*
% of
GDPIDR tn US$bn*
% of 2014
Revised
Budget
A. State revenue and grants 1,667.10 134.01 16.10% 1,635.40 131.46 16.30% 1,218.70 97.97 74.50%
I. Domestic revenue 1,665.80 133.91 16.10% 1,633.10 131.28 16.20% 1,216.40 97.78 74.50%
1.Tax revenue 1,280.40 102.93 12.40% 1,246.10 100.17 12.40% 906.6 72.88 72.80%
2.Non tax revenue 385.4 30.98 3.70% 386.9 31.10 3.80% 309.9 24.91 80.10%
II. Grants 1.4 0.11 0.00% 2.3 0.18 0.00% 2.2 0.18 95.80%
B. State expenditure 1,842.50 148.11 17.80% 1,876.90 150.88 18.70% 1,412.70 113.56 75.30%
I. Central gov. expenditure 1,249.90 100.47 12.10% 1,280.40 102.93 12.70% 930 74.76 72.60%
1. Personnel 263 21.14 2.50% 258.8 20.80 2.60% 203.4 16.35 78.70%
2. Goods & Services and
Capital*399.8 32.14 3.90% 356 28.62 3.60% 184.5 14.83 51.83%
3. Interest payments 121.3 9.75 1.20% 135.5 10.89 1.30% 113.3 9.11 83.60%
4. Subsidies 333.7 26.82 3.20% 403 32.40 4.00% 354.6 28.5 88.00%
5. Grants 3.5 0.28 0.00% 2.9 0.23 0.00% 0.3 0.02 10.90%
6. Social expenditure 91.8 7.38 0.90% 96.7 7.77 0.90% 71.7 5.76 74.20%
7. Other expenditure 36.9 2.97 0.40% 27.9 2.24 0.30% 2.3 0.18 8.40%
II. Transfer to region 592.6 47.64 5.70% 596.5 47.95 5.90% 482.7 38.8 80.90%
Primary balance(1) -54.10 -4.35 -0.50% -106.00 -8.52 -1.10% -80.80 -6.5 76.20%
Overall balance (A - B) -175.40 -14.10 -1.70% -241.50 -19.41 -2.40% -194.10 -15.6 80.40%
Financing 175.4 14.10 1.70% 241.5 19.41 2.40% 250.1 20.1 103.60%
I. Domestic financing 196.3 15.78 1.90% 254.9 20.49 2.50% 275.8 22.17 108.20%
II. Foreign financing -20.9 -1.68 -0.20% -13.4 -1.08 -0.10% -25.7 -2.07 191.30%
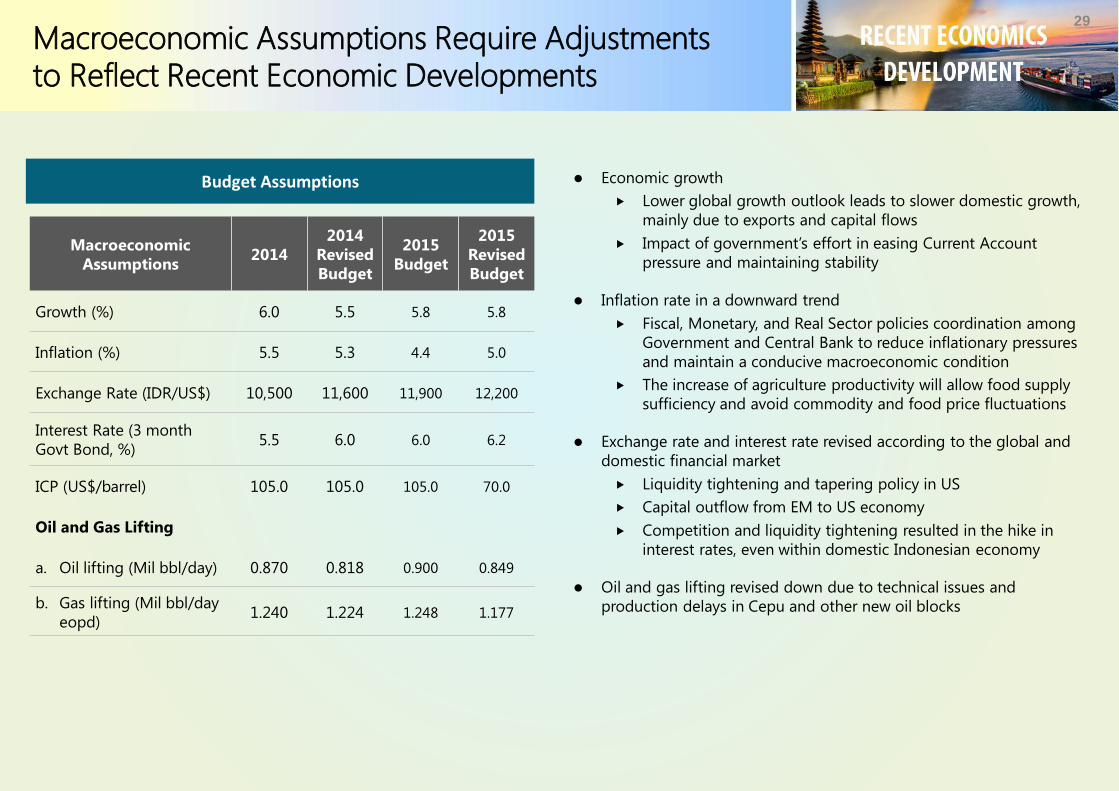
Economic growth
Lower global growth outlook leads to slower domestic growth,
mainly due to exports and capital flows
Impact of government’s effort in easing Current Account
pressure and maintaining stability
Inflation rate in a downward trend
Fiscal, Monetary, and Real Sector policies coordination among
Government and Central Bank to reduce inflationary pressures
and maintain a conducive macroeconomic condition
The increase of agriculture productivity will allow food supply
sufficiency and avoid commodity and food price fluctuations
Exchange rate and interest rate revised according to the global and
domestic financial market
Liquidity tightening and tapering policy in US
Capital outflow from EM to US economy
Competition and liquidity tightening resulted in the hike in
interest rates, even within domestic Indonesian economy
Oil and gas lifting revised down due to technical issues and
production delays in Cepu and other new oil blocks
Macroeconomic
Assumptions2014
2014
Revised
Budget
2015
Budget
2015
Revised
Budget
Growth (%) 6.0 5.5 5.8 5.8
Inflation (%) 5.5 5.3 4.4 5.0
Exchange Rate (IDR/US$) 10,500 11,600 11,900 12,200
Interest Rate (3 month
Govt Bond, %)5.5 6.0 6.0 6.2
ICP (US$/barrel) 105.0 105.0 105.0 70.0
Oil and Gas Lifting
a. Oil lifting (Mil bbl/day) 0.870 0.818 0.900 0.849
b. Gas lifting (Mil bbl/day
eopd)1.240 1.224 1.248 1.177
Macroeconomic Assumptions Require Adjustments to Reflect Recent Economic Developments
29
Budget Assumptions
In billion IDR
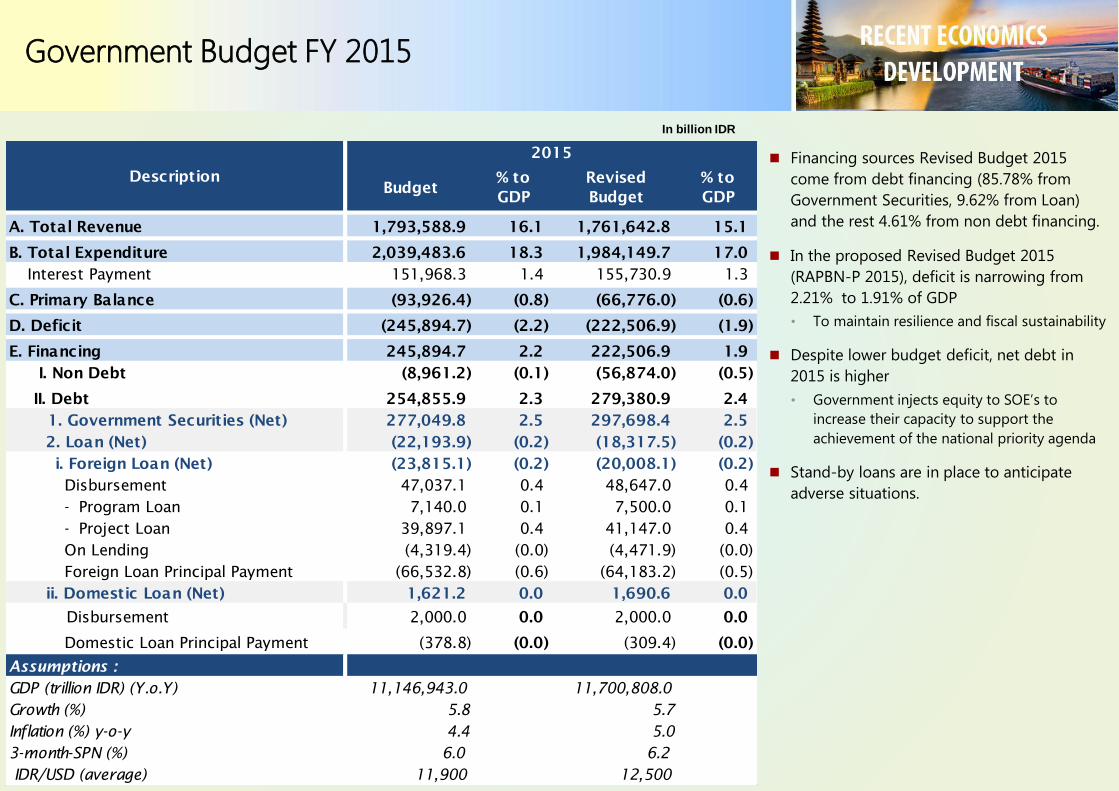
Financing sources Revised Budget 2015
come from debt financing (85.78% from
Government Securities, 9.62% from Loan)
and the rest 4.61% from non debt financing.
In the proposed Revised Budget 2015
(RAPBN-P 2015), deficit is narrowing from
2.21% to 1.91% of GDP
• To maintain resilience and fiscal sustainability
Despite lower budget deficit, net debt in
2015 is higher
• Government injects equity to SOE’s to
increase their capacity to support the
achievement of the national priority agenda
Stand-by loans are in place to anticipate
adverse situations.
A. Total Revenue 1,793,588.9 16.1 1,761,642.8 15.1
B. Total Expenditure 2,039,483.6 18.3 1,984,149.7 17.0
Interest Payment 151,968.3 1.4 155,730.9 1.3
C. Primary Balance (93,926.4) (0.8) (66,776.0) (0.6)
D. Deficit (245,894.7) (2.2) (222,506.9) (1.9)
E. Financing 245,894.7 2.2 222,506.9 1.9
I. Non Debt (8,961.2) (0.1) (56,874.0) (0.5)
II. Debt 254,855.9 2.3 279,380.9 2.4
1. Government Securities (Net) 277,049.8 2.5 297,698.4 2.5
2. Loan (Net) (22,193.9) (0.2) (18,317.5) (0.2)
i. Foreign Loan (Net) (23,815.1) (0.2) (20,008.1) (0.2)
Disbursement 47,037.1 0.4 48,647.0 0.4
- Program Loan 7,140.0 0.1 7,500.0 0.1
- Project Loan 39,897.1 0.4 41,147.0 0.4
On Lending (4,319.4) (0.0) (4,471.9) (0.0)
Foreign Loan Principal Payment (66,532.8) (0.6) (64,183.2) (0.5)
ii. Domestic Loan (Net) 1,621.2 0.0 1,690.6 0.0
Disbursement 2,000.0 0.0 2,000.0 0.0
Domestic Loan Principal Payment (378.8) (0.0) (309.4) (0.0)
Assumptions :
GDP (trillion IDR) (Y.o.Y) 11,146,943.0 11,700,808.0
Growth (%) 5.8 5.7
Inflation (%) y-o-y 4.4 5.0
3-month-SPN (%) 6.0 6.2
IDR/USD (average) 11,900 12,500
Budget% to
GDP
Revised
Budget
% to
GDP
2015
Description
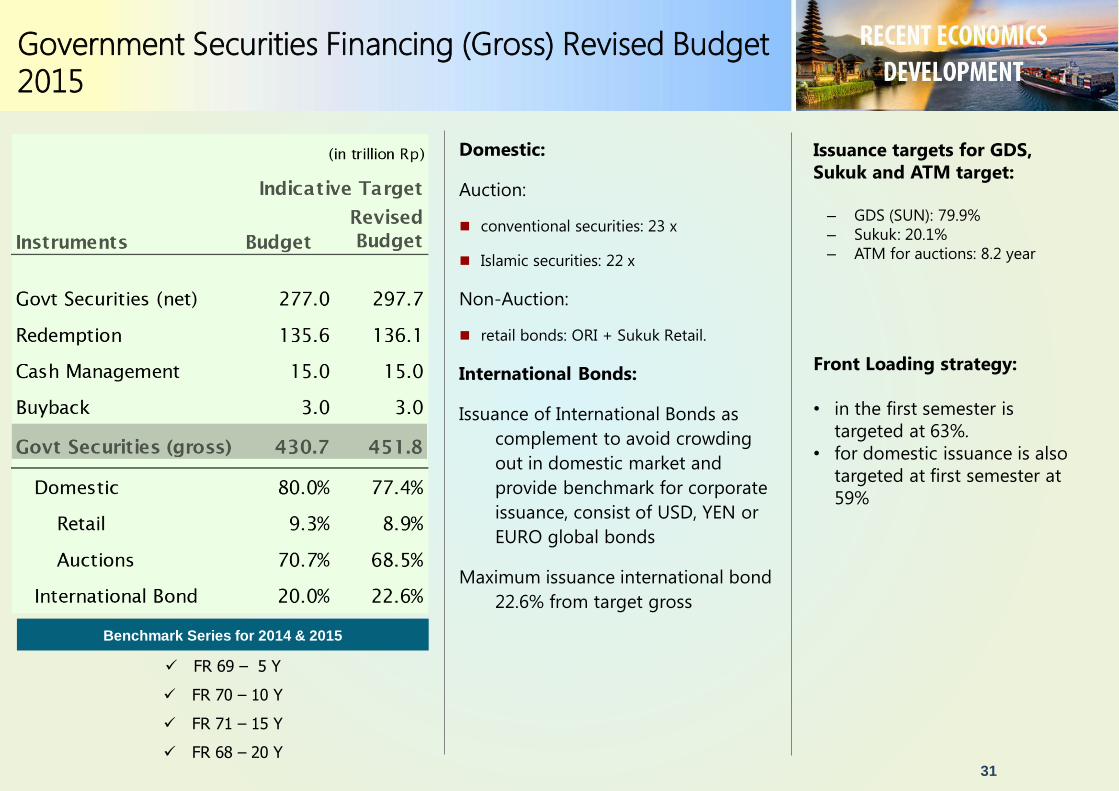
Government Budget FY 2015
31
Domestic:
Auction:
conventional securities: 23 x
Islamic securities: 22 x
Non-Auction:
retail bonds: ORI + Sukuk Retail.
International Bonds:
Issuance of International Bonds as
complement to avoid crowding
out in domestic market and
provide benchmark for corporate
issuance, consist of USD, YEN or
EURO global bonds
Maximum issuance international bond
22.6% from target gross
Issuance targets for GDS,
Sukuk and ATM target:
– GDS (SUN): 79.9%
– Sukuk: 20.1%
– ATM for auctions: 8.2 year
Front Loading strategy:
• in the first semester is
targeted at 63%.
• for domestic issuance is also
targeted at first semester at
59%
FR 69 – 5 Y
FR 70 – 10 Y
FR 71 – 15 Y
FR 68 – 20 Y
Benchmark Series for 2014 & 2015
Government Securities Financing (Gross) Revised Budget 2015
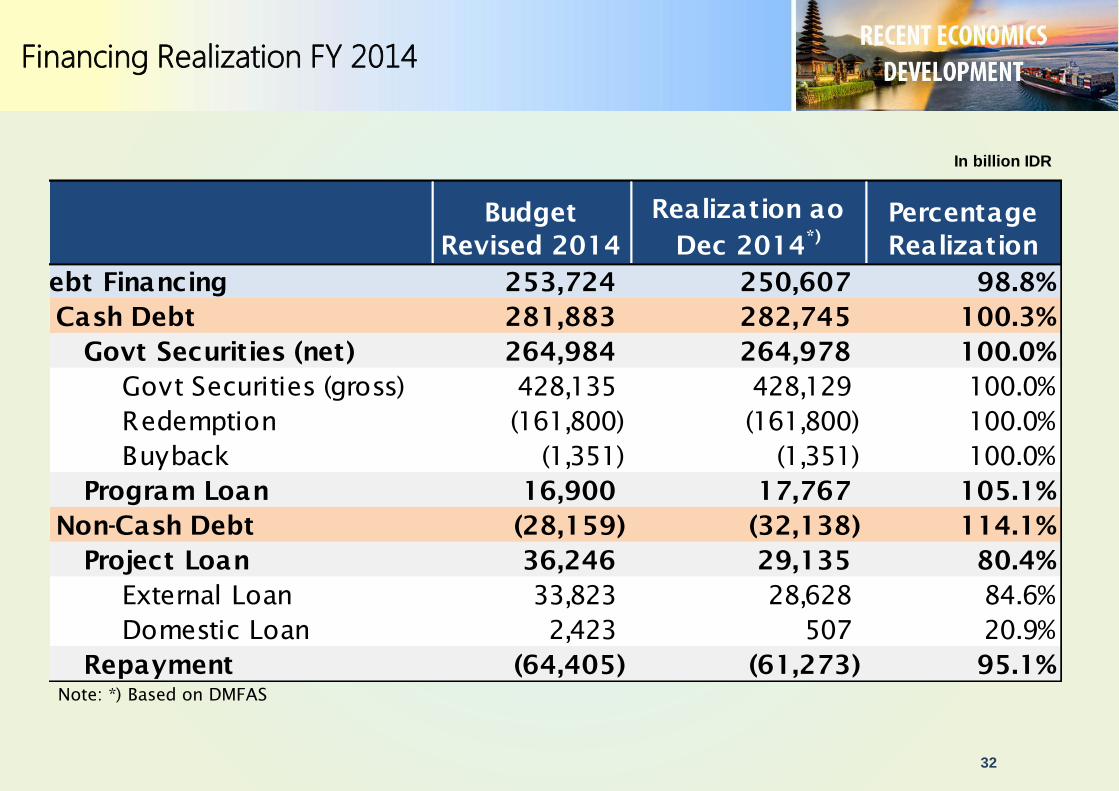
Financing Realization FY 2014
32
In billion IDR
Note: *) Based on DMFAS
Budget
Revised 2014
Realization ao
Dec 2014*)
Percentage
Realization
Debt Financing 253,724 250,607 98.8%
Cash Debt 281,883 282,745 100.3%
Govt Securities (net) 264,984 264,978 100.0%
Govt Securities (gross) 428,135 428,129 100.0%
Redemption (161,800) (161,800) 100.0%
Buyback (1,351) (1,351) 100.0%
Program Loan 16,900 17,767 105.1%
Non-Cash Debt (28,159) (32,138) 114.1%
Project Loan 36,246 29,135 80.4%
External Loan 33,823 28,628 84.6%
Domestic Loan 2,423 507 20.9%
Repayment (64,405) (61,273) 95.1%
Improved Government Debt Position
33
2468
10121416182022
Apr'0
8
Jul'0
8
Oct'0
8
Jan'0
9
Apr'0
9
Jul'0
9
Oct'0
9
Jan'1
0
Apr'1
0
Jul'1
0
Oct'1
0
Jan'1
1
Apr'1
1
Jul'1
1
Oct'1
1
Jan'1
2
Apr'1
2
Jul'1
2
Oct'1
2
Jan'1
3
Apr'1
3
Jul'1
3
Oct'1
3
Jan'1
4
Apr'1
4
Jul'1
4
Oct'1
4
Jan'1
5
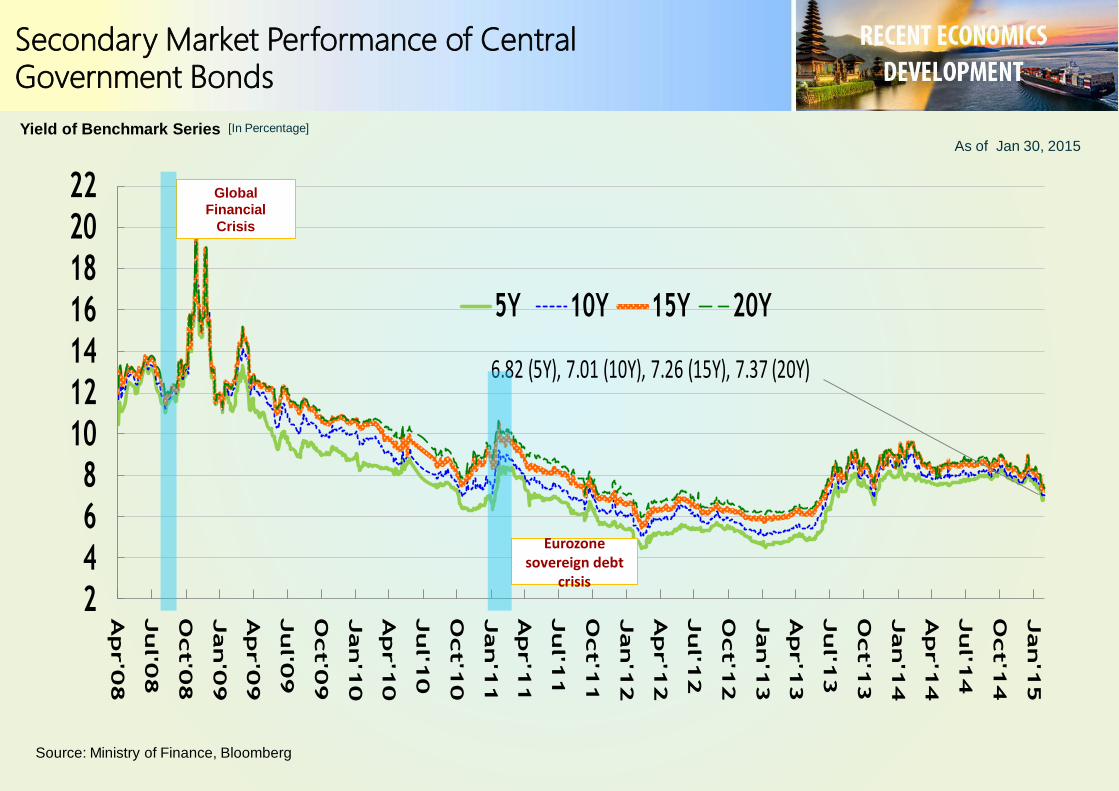
5Y 10Y 15Y 20Y
6.82 (5Y), 7.01 (10Y), 7.26 (15Y), 7.37 (20Y)
[In Percentage]
As of Jan 30, 2015 Yield of Benchmark Series
Global
Financial
Crisis
Eurozonesovereign debt
crisis
Source: Ministry of Finance, Bloomberg
Secondary Market Performance of Central Government Bonds
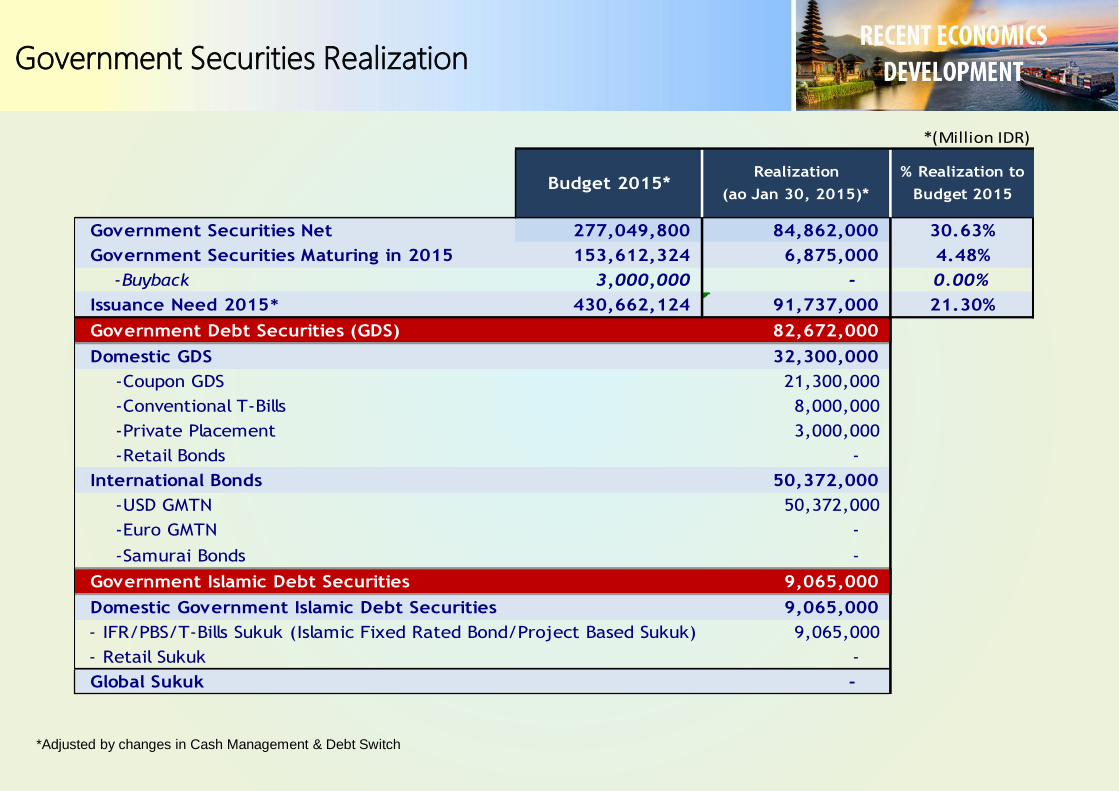
*Adjusted by changes in Cash Management & Debt Switch
*(Million IDR)
Budget 2015*Realization
(ao Jan 30, 2015)*
% Realization to
Budget 2015
Government Securities Net 277,049,800 84,862,000 30.63%
Government Securities Maturing in 2015 153,612,324 6,875,000 4.48%
-Buyback 3,000,000 - 0.00%
Issuance Need 2015* 430,662,124 91,737,000 21.30%
Government Debt Securities (GDS) 82,672,000
Domestic GDS 32,300,000
-Coupon GDS 21,300,000
-Conventional T-Bills 8,000,000
-Private Placement 3,000,000
-Retail Bonds -
International Bonds 50,372,000
-USD GMTN 50,372,000
-Euro GMTN -
-Samurai Bonds -
Government Islamic Debt Securities 9,065,000
Domestic Government Islamic Debt Securities 9,065,000
- IFR/PBS/T-Bills Sukuk (Islamic Fixed Rated Bond/Project Based Sukuk) 9,065,000
- Retail Sukuk -
Global Sukuk -
Government Securities Realization
36Source: Ministry of Finance
[in percentage]
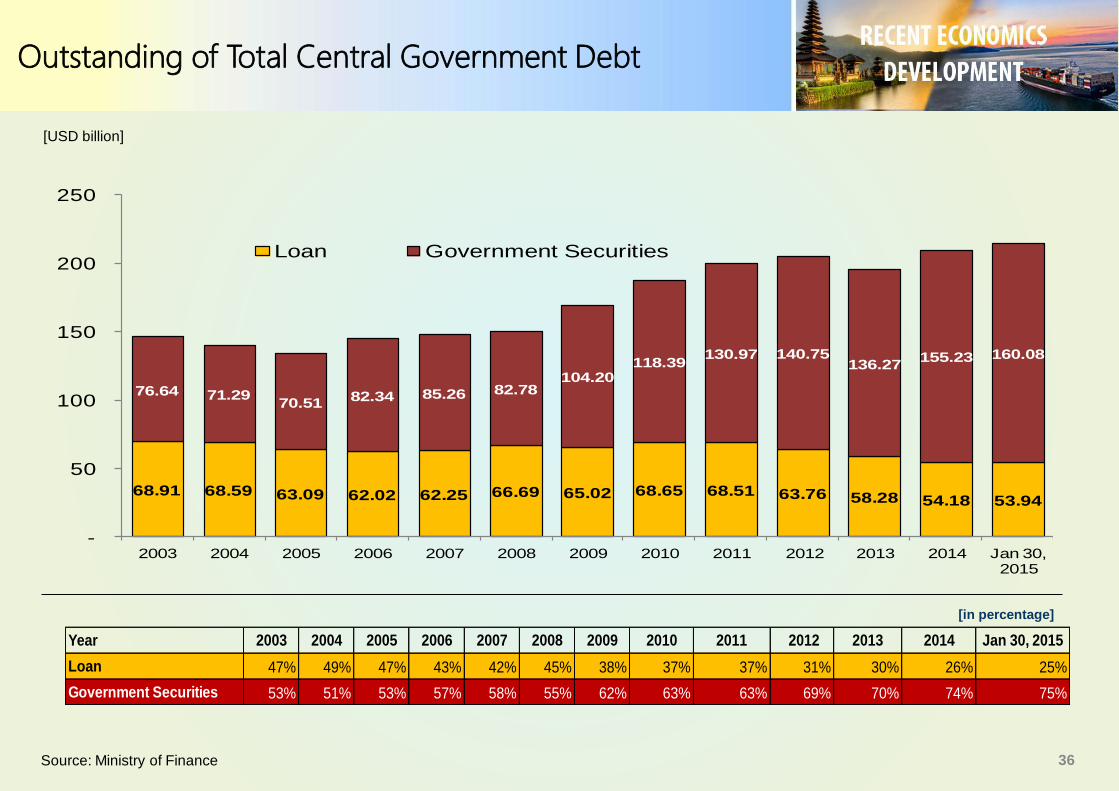
[USD billion]
68.91 68.59 63.09 62.02 62.25 66.69 65.02 68.65 68.51 63.76 58.28 54.18 53.94
76.64 71.2970.51
82.34 85.26 82.78104.20
118.39130.97 140.75
136.27155.23 160.08
-
50
100
150
200
250
2003 2004 2005 2006 2007 2008 2009 2010 2011 2012 2013 2014 Jan 30, 2015
Loan Government Securities
Year 2003 2004 2005 2006 2007 2008 2009 2010 2011 2012 2013 2014 Jan 30, 2015
Loan 47% 49% 47% 43% 42% 45% 38% 37% 37% 31% 30% 26% 25%
Government Securities 53% 51% 53% 57% 58% 55% 62% 63% 63% 69% 70% 74% 75%
Outstanding of Total Central Government Debt
37
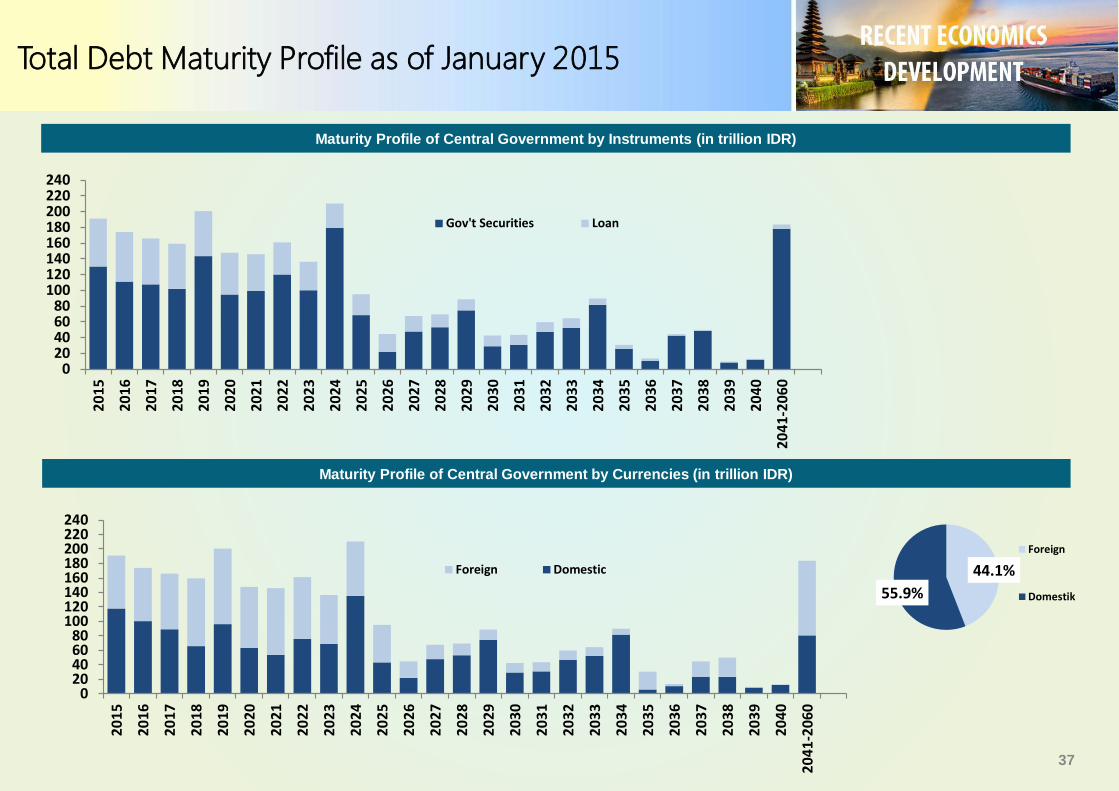
Maturity Profile of Central Government by Instruments (in trillion IDR)
Maturity Profile of Central Government by Currencies (in trillion IDR)
020406080
100120140160180200220240
20
15
20
16
20
17
20
18
20
19
20
20
20
21
20
22
20
23
20
24
20
25
20
26
20
27
20
28
20
29
20
30
20
31
20
32
20
33
20
34
20
35
20
36
20
37
20
38
20
39
20
40
20
41
-20
60
Foreign Domestic
020406080
100120140160180200220240
20
15
20
16
20
17
20
18
20
19
20
20
20
21
20
22
20
23
20
24
20
25
20
26
20
27
20
28
20
29
20
30
20
31
20
32
20
33
20
34
20
35
20
36
20
37
20
38
20
39
20
40
20
41
-20
60
Gov't Securities Loan
44.1%
55.9%
Foreign
Domestik
Total Debt Maturity Profile as of January 2015
38
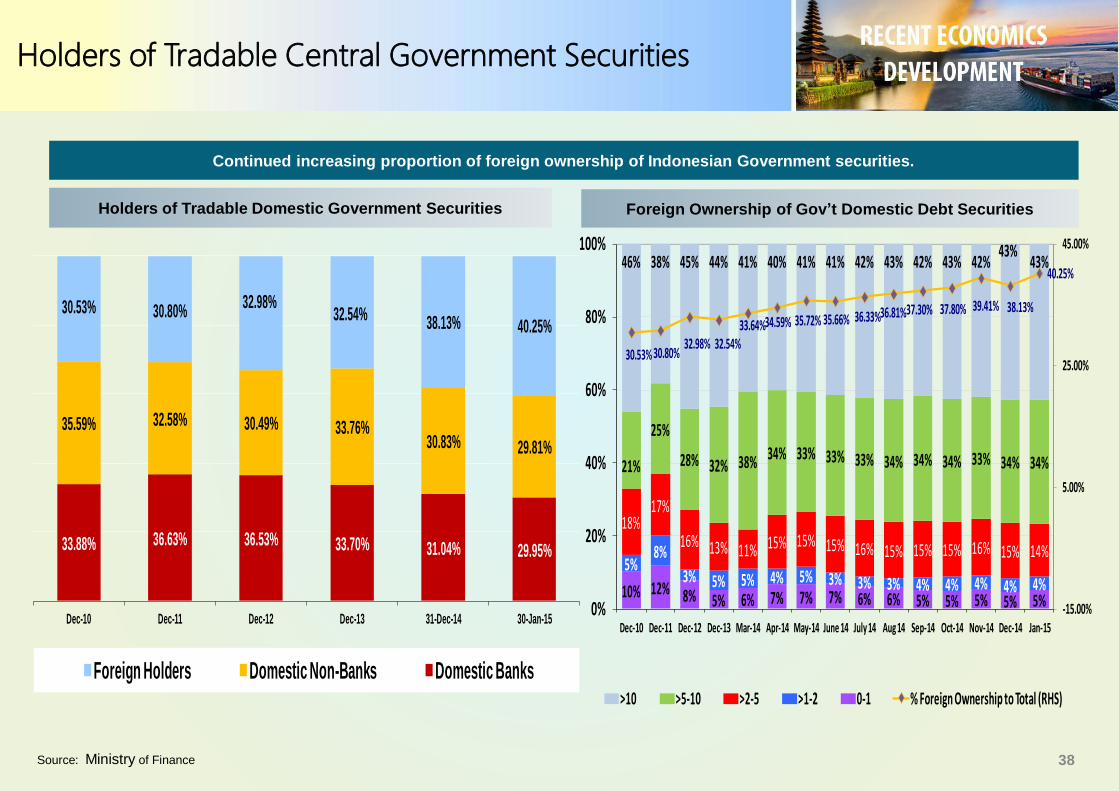
Holders of Tradable Domestic Government Securities Foreign Ownership of Gov’t Domestic Debt Securities
Source: Ministry of Finance
Continued increasing proportion of foreign ownership of Indonesian Government securities.
10% 12% 8% 5% 6% 7% 7% 7% 6% 6% 5% 5% 5% 5% 5%
5%8%
3% 5% 5% 4% 5% 3% 3% 3% 4% 4% 4% 4% 4%
18%17%
16% 13% 11% 15% 15% 15% 16% 15% 15% 15% 16% 15% 14%
21%
25%
28% 32% 38% 34% 33% 33% 33% 34% 34% 34% 33% 34% 34%
46% 38% 45% 44% 41% 40% 41% 41% 42% 43% 42% 43% 42%43%
43%
30.53% 30.80%32.98% 32.54%
33.64%34.59% 35.72% 35.66% 36.33%36.81%37.30% 37.80% 39.41% 38.13%
40.25%
-15.00%
5.00%
25.00%
45.00%
0%
20%
40%
60%
80%
100%
Dec-10 Dec-11 Dec-12 Dec-13 Mar-14 Apr-14 May-14 June 14 July 14 Aug 14 Sep-14 Oct-14 Nov-14 Dec-14 Jan-15
>10 >5-10 >2-5 >1-2 0-1 % Foreign Ownership to Total (RHS)
33.88% 36.63% 36.53% 33.70% 31.04% 29.95%
35.59% 32.58% 30.49% 33.76%30.83% 29.81%
30.53% 30.80%32.98%
32.54% 38.13% 40.25%
Dec-10 Dec-11 Dec-12 Dec-13 31-Dec-14 30-Jan-15
Foreign Holders Domestic Non-Banks Domestic Banks
Holders of Tradable Central Government Securities
39Source: Ministry of Finance
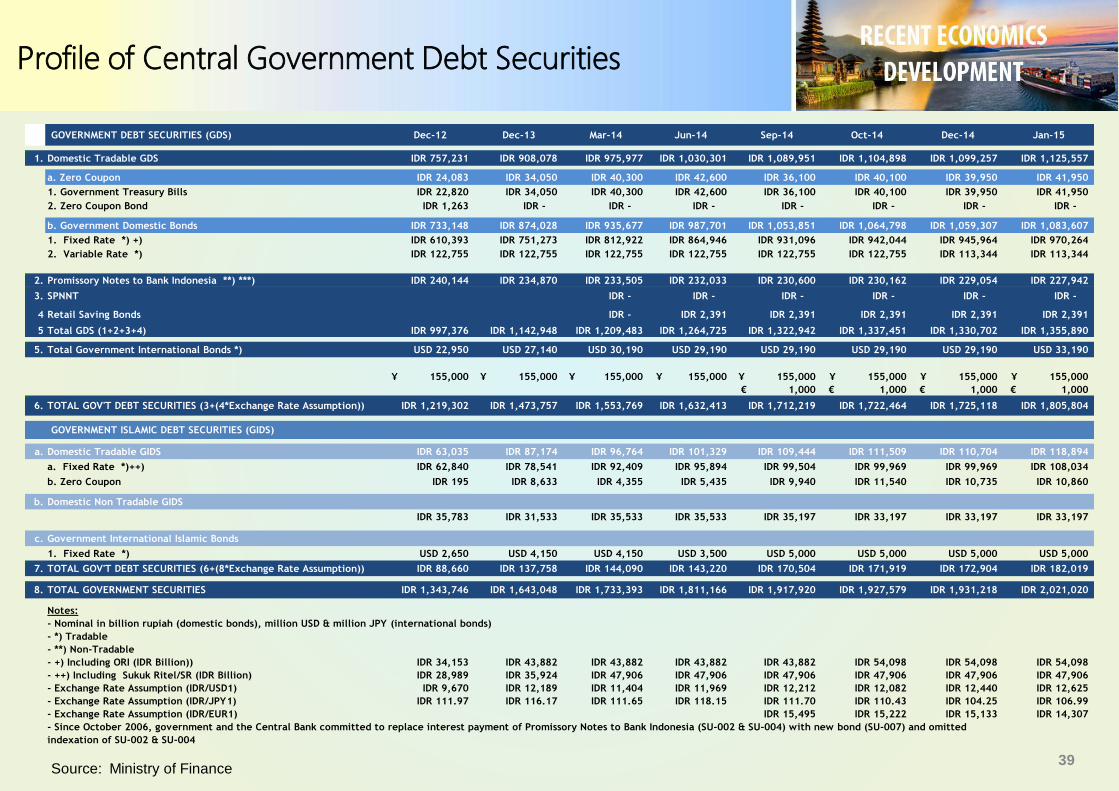
GOVERNMENT DEBT SECURITIES (GDS) Dec-12 Dec-13 Mar-14 Jun-14 Sep-14 Oct-14 Dec-14 Jan-15
1. Domestic Tradable GDS IDR 757,231 IDR 908,078 IDR 975,977 IDR 1,030,301 IDR 1,089,951 IDR 1,104,898 IDR 1,099,257 IDR 1,125,557
a. Zero Coupon IDR 24,083 IDR 34,050 IDR 40,300 IDR 42,600 IDR 36,100 IDR 40,100 IDR 39,950 IDR 41,950
1. Government Treasury Bills IDR 22,820 IDR 34,050 IDR 40,300 IDR 42,600 IDR 36,100 IDR 40,100 IDR 39,950 IDR 41,950
2. Zero Coupon Bond IDR 1,263 IDR - IDR - IDR - IDR - IDR - IDR - IDR -
b. Government Domestic Bonds IDR 733,148 IDR 874,028 IDR 935,677 IDR 987,701 IDR 1,053,851 IDR 1,064,798 IDR 1,059,307 IDR 1,083,607
1. Fixed Rate *) +) IDR 610,393 IDR 751,273 IDR 812,922 IDR 864,946 IDR 931,096 IDR 942,044 IDR 945,964 IDR 970,264
2. Variable Rate *) IDR 122,755 IDR 122,755 IDR 122,755 IDR 122,755 IDR 122,755 IDR 122,755 IDR 113,344 IDR 113,344
2. Promissory Notes to Bank Indonesia **) ***) IDR 240,144 IDR 234,870 IDR 233,505 IDR 232,033 IDR 230,600 IDR 230,162 IDR 229,054 IDR 227,942
3. SPNNT IDR - IDR - IDR - IDR - IDR - IDR -
4 Retail Saving Bonds IDR - IDR 2,391 IDR 2,391 IDR 2,391 IDR 2,391 IDR 2,391
5 Total GDS (1+2+3+4) IDR 997,376 IDR 1,142,948 IDR 1,209,483 IDR 1,264,725 IDR 1,322,942 IDR 1,337,451 IDR 1,330,702 IDR 1,355,890
5. Total Government International Bonds *) USD 22,950 USD 27,140 USD 30,190 USD 29,190 USD 29,190 USD 29,190 USD 29,190 USD 33,190
155,000¥ 155,000¥ 155,000¥ 155,000¥ 155,000¥ 155,000¥ 155,000¥ 155,000¥
1,000€ 1,000€ 1,000€ 1,000€
6. TOTAL GOV'T DEBT SECURITIES (3+(4*Exchange Rate Assumption)) IDR 1,219,302 IDR 1,473,757 IDR 1,553,769 IDR 1,632,413 IDR 1,712,219 IDR 1,722,464 IDR 1,725,118 IDR 1,805,804
GOVERNMENT ISLAMIC DEBT SECURITIES (GIDS)
a. Domestic Tradable GIDS IDR 63,035 IDR 87,174 IDR 96,764 IDR 101,329 IDR 109,444 IDR 111,509 IDR 110,704 IDR 118,894
a. Fixed Rate *)++) IDR 62,840 IDR 78,541 IDR 92,409 IDR 95,894 IDR 99,504 IDR 99,969 IDR 99,969 IDR 108,034
b. Zero Coupon IDR 195 IDR 8,633 IDR 4,355 IDR 5,435 IDR 9,940 IDR 11,540 IDR 10,735 IDR 10,860
b. Domestic Non Tradable GIDS
IDR 35,783 IDR 31,533 IDR 35,533 IDR 35,533 IDR 35,197 IDR 33,197 IDR 33,197 IDR 33,197
c. Government International Islamic Bonds
1. Fixed Rate *) USD 2,650 USD 4,150 USD 4,150 USD 3,500 USD 5,000 USD 5,000 USD 5,000 USD 5,000
7. TOTAL GOV'T DEBT SECURITIES (6+(8*Exchange Rate Assumption)) IDR 88,660 IDR 137,758 IDR 144,090 IDR 143,220 IDR 170,504 IDR 171,919 IDR 172,904 IDR 182,019
8. TOTAL GOVERNMENT SECURITIES IDR 1,343,746 IDR 1,643,048 IDR 1,733,393 IDR 1,811,166 IDR 1,917,920 IDR 1,927,579 IDR 1,931,218 IDR 2,021,020
Notes:
- Nominal in billion rupiah (domestic bonds), million USD & million JPY (international bonds)
- *) Tradable
- **) Non-Tradable
- +) Including ORI (IDR Billion)) IDR 34,153 IDR 43,882 IDR 43,882 IDR 43,882 IDR 43,882 IDR 54,098 IDR 54,098 IDR 54,098
- ++) Including Sukuk Ritel/SR (IDR Billion) IDR 28,989 IDR 35,924 IDR 47,906 IDR 47,906 IDR 47,906 IDR 47,906 IDR 47,906 IDR 47,906
- Exchange Rate Assumption (IDR/USD1) IDR 9,670 IDR 12,189 IDR 11,404 IDR 11,969 IDR 12,212 IDR 12,082 IDR 12,440 IDR 12,625
- Exchange Rate Assumption (IDR/JPY1) IDR 111.97 IDR 116.17 IDR 111.65 IDR 118.15 IDR 111.70 IDR 110.43 IDR 104.25 IDR 106.99
- Exchange Rate Assumption (IDR/EUR1) IDR 15,495 IDR 15,222 IDR 15,133 IDR 14,307
- Since October 2006, government and the Central Bank committed to replace interest payment of Promissory Notes to Bank Indonesia (SU-002 & SU-004) with new bond (SU-007) and omitted
indexation of SU-002 & SU-004
Profile of Central Government Debt Securities
40
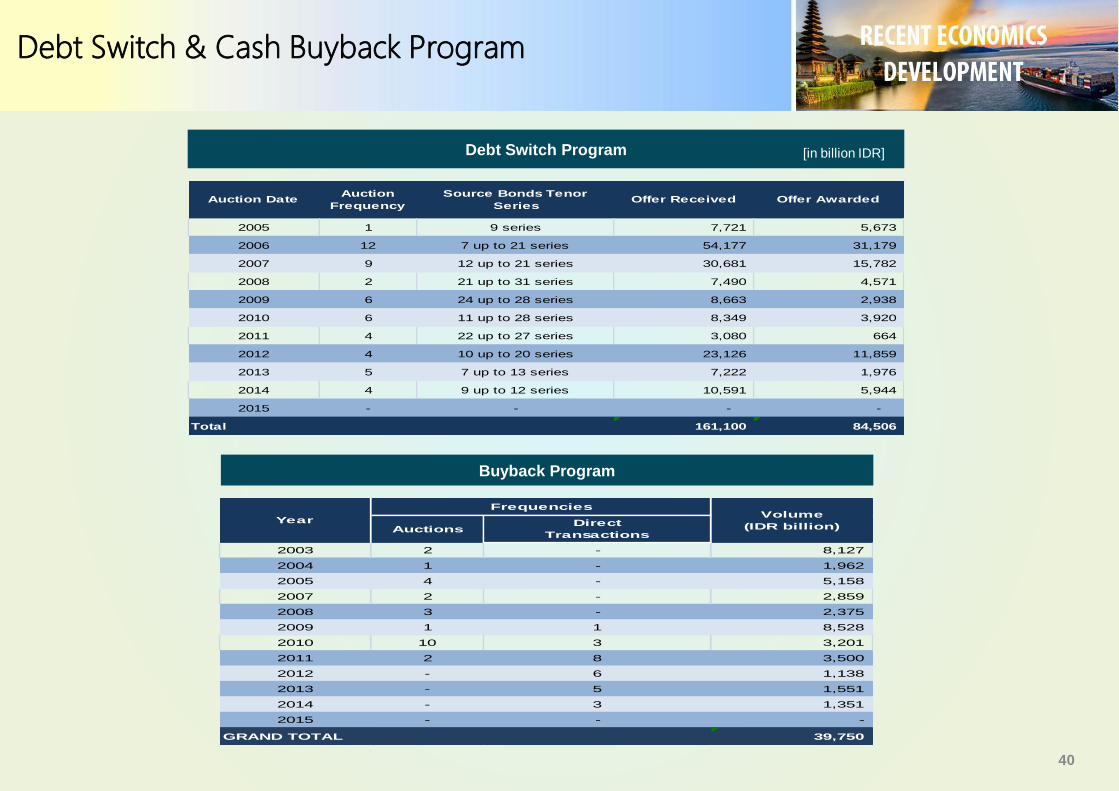
Debt Switch Program
Buyback Program
[in billion IDR]
Auction DateAuction
Frequency
Source Bonds Tenor
SeriesOffer Received Offer Awarded
2005 1 9 series 7,721 5,673
2006 12 7 up to 21 series 54,177 31,179
2007 9 12 up to 21 series 30,681 15,782
2008 2 21 up to 31 series 7,490 4,571
2009 6 24 up to 28 series 8,663 2,938
2010 6 11 up to 28 series 8,349 3,920
2011 4 22 up to 27 series 3,080 664
2012 4 10 up to 20 series 23,126 11,859
2013 5 7 up to 13 series 7,222 1,976
2014 4 9 up to 12 series 10,591 5,944
2015 - - - -
Total 161,100 84,506
AuctionsDirect
Transactions
2003 2 - 8,127
2004 1 - 1,962
2005 4 - 5,158
2007 2 - 2,859
2008 3 - 2,375
2009 1 1 8,528
2010 10 3 3,201
2011 2 8 3,500
2012 - 6 1,138
2013 - 5 1,551
2014 - 3 1,351
2015 - - -
GRAND TOTAL 39,750
Frequencies
YearVolume
(IDR billion)
Debt Switch & Cash Buyback Program
41
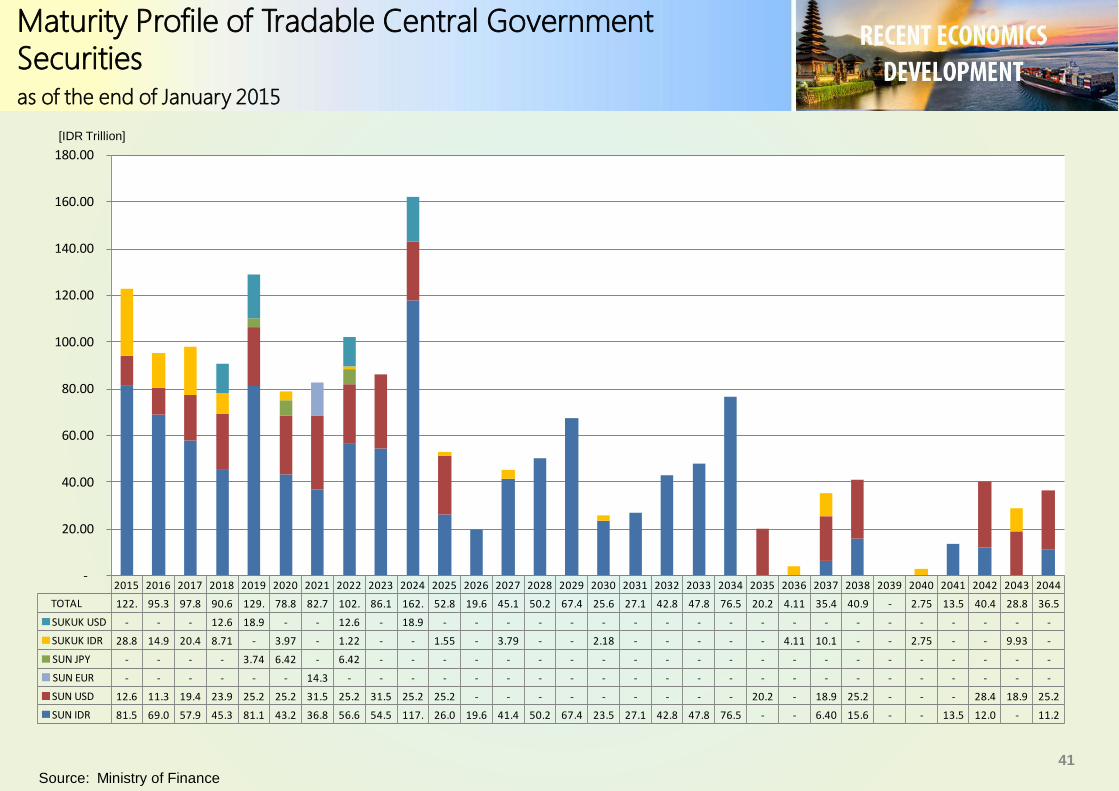
Source: Ministry of Finance
[IDR Trillion]
2015 2016 2017 2018 2019 2020 2021 2022 2023 2024 2025 2026 2027 2028 2029 2030 2031 2032 2033 2034 2035 2036 2037 2038 2039 2040 2041 2042 2043 2044
TOTAL 122. 95.3 97.8 90.6 129. 78.8 82.7 102. 86.1 162. 52.8 19.6 45.1 50.2 67.4 25.6 27.1 42.8 47.8 76.5 20.2 4.11 35.4 40.9 - 2.75 13.5 40.4 28.8 36.5
SUKUK USD - - - 12.6 18.9 - - 12.6 - 18.9 - - - - - - - - - - - - - - - - - - - -
SUKUK IDR 28.8 14.9 20.4 8.71 - 3.97 - 1.22 - - 1.55 - 3.79 - - 2.18 - - - - - 4.11 10.1 - - 2.75 - - 9.93 -
SUN JPY - - - - 3.74 6.42 - 6.42 - - - - - - - - - - - - - - - - - - - - - -
SUN EUR - - - - - - 14.3 - - - - - - - - - - - - - - - - - - - - - - -
SUN USD 12.6 11.3 19.4 23.9 25.2 25.2 31.5 25.2 31.5 25.2 25.2 - - - - - - - - - 20.2 - 18.9 25.2 - - - 28.4 18.9 25.2
SUN IDR 81.5 69.0 57.9 45.3 81.1 43.2 36.8 56.6 54.5 117. 26.0 19.6 41.4 50.2 67.4 23.5 27.1 42.8 47.8 76.5 - - 6.40 15.6 - - 13.5 12.0 - 11.2
-
20.00
40.00
60.00
80.00
100.00
120.00
140.00
160.00
180.00
Maturity Profile of Tradable Central Government Securities as of the end of January 2015
42
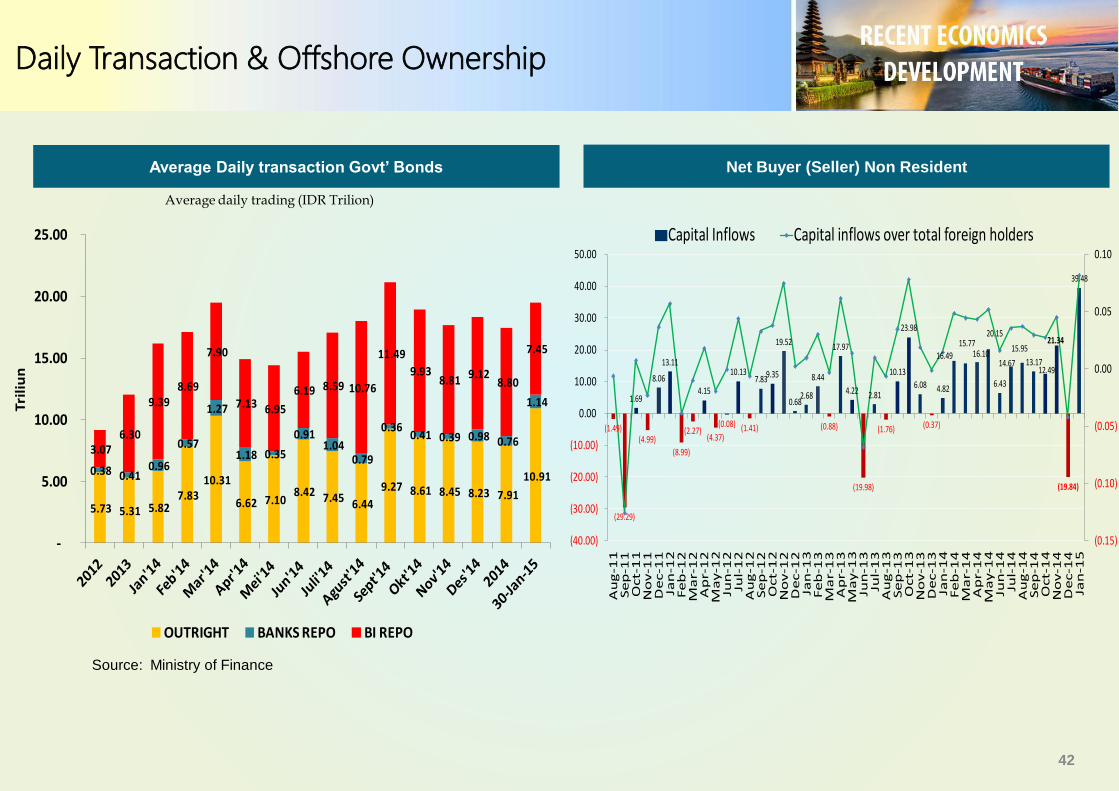
Average Daily transaction Govt’ Bonds Net Buyer (Seller) Non Resident
Source: Ministry of Finance
Average daily trading (IDR Trilion)
(1.49)
(29.29)
1.69
(4.99)
8.06
13.11
(8.99)
(2.27)
4.15
(4.37)
(0.08)
10.13
(1.41)
7.83 9.35
19.52
0.68 2.68
8.44
(0.88)
17.97
4.22
(19.98)
2.81
(1.76)
10.13
23.98
6.08
(0.37)
4.82
16.49
15.77 16.10
20.15
6.43
14.67
15.95
13.17 12.49
21.34
(19.84)
39.48
(0.15)
(0.10)
(0.05)
0.00
0.05
0.10
(40.00)
(30.00)
(20.00)
(10.00)
0.00
10.00
20.00
30.00
40.00
50.00
Au
g-1
1Se
p-1
1O
ct-
11
No
v-1
1D
ec-1
1Ja
n-1
2Fe
b-1
2M
ar-
12
Ap
r-1
2M
ay-1
2Ju
n-1
2Ju
l-1
2A
ug
-12
Se
p-1
2O
ct-
12
No
v-1
2D
ec-1
2Ja
n-1
3Fe
b-1
3M
ar-
13
Ap
r-1
3M
ay-1
3Ju
n-1
3Ju
l-1
3A
ug
-13
Se
p-1
3O
ct-
13
No
v-1
3D
ec-1
3Ja
n-1
4Fe
b-1
4M
ar-
14
Ap
r-1
4M
ay-1
4Ju
n-1
4Ju
l-1
4A
ug
-14
Se
p-1
4O
ct-
14
No
v-1
4D
ec-1
4Ja
n-1
5
Capital Inflows Capital inflows over total foreign holders
5.73 5.31 5.82 7.83
10.31
6.62 7.10 8.42 7.45 6.44
9.27 8.61 8.45 8.23 7.91
10.91 0.38 0.41 0.96
0.57
1.27
1.18 0.35
0.91 1.04
0.79
0.36 0.41 0.39 0.98 0.76
1.14
3.07 6.30
9.39 8.69
7.90
7.13 6.95
6.19 8.59 10.76
11.49
9.93 8.81 9.12
8.80
7.45
-
5.00
10.00
15.00
20.00
25.00
Tri
liu
n
OUTRIGHT BANKS REPO BI REPO
Daily Transaction & Offshore Ownership
43
Source: Ministry of Finance
(IDR Trillion)
`
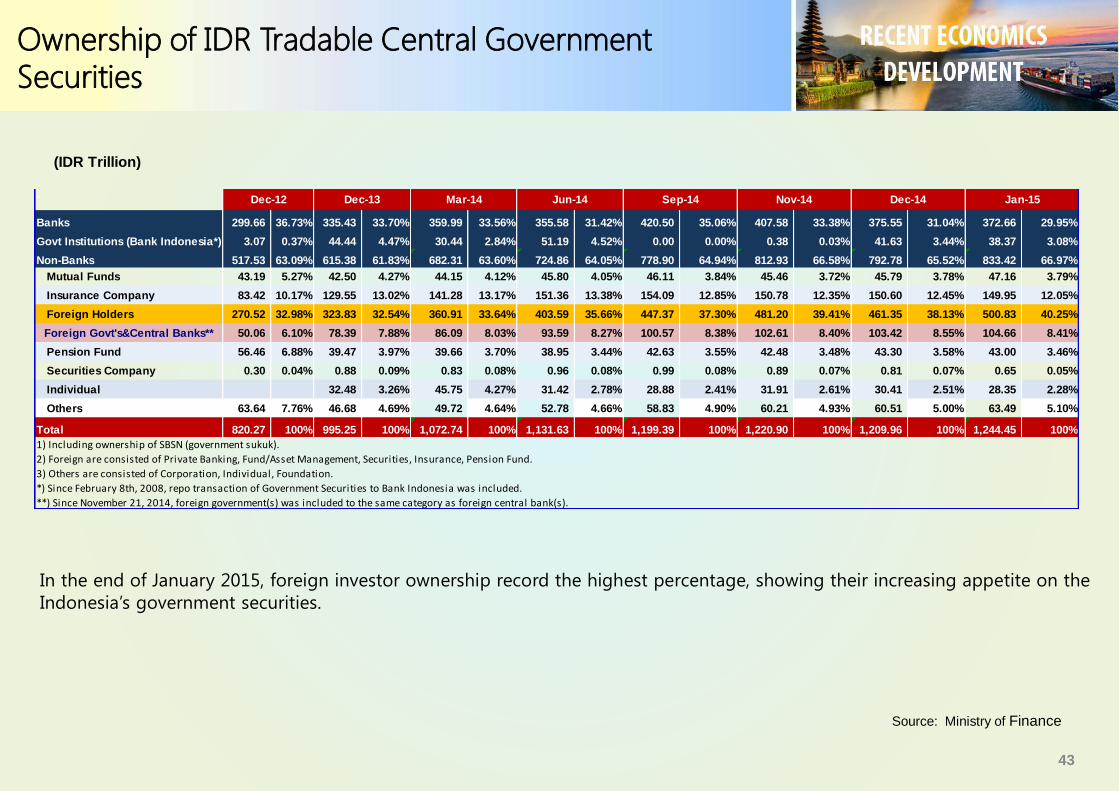
Banks 299.66 36.73% 335.43 33.70% 359.99 33.56% 355.58 31.42% 420.50 35.06% 407.58 33.38% 375.55 31.04% 372.66 29.95%
Govt Institutions (Bank Indonesia*) 3.07 0.37% 44.44 4.47% 30.44 2.84% 51.19 4.52% 0.00 0.00% 0.38 0.03% 41.63 3.44% 38.37 3.08%
Non-Banks 517.53 63.09% 615.38 61.83% 682.31 63.60% 724.86 64.05% 778.90 64.94% 812.93 66.58% 792.78 65.52% 833.42 66.97%
Mutual Funds 43.19 5.27% 42.50 4.27% 44.15 4.12% 45.80 4.05% 46.11 3.84% 45.46 3.72% 45.79 3.78% 47.16 3.79%
Insurance Company 83.42 10.17% 129.55 13.02% 141.28 13.17% 151.36 13.38% 154.09 12.85% 150.78 12.35% 150.60 12.45% 149.95 12.05%
Foreign Holders 270.52 32.98% 323.83 32.54% 360.91 33.64% 403.59 35.66% 447.37 37.30% 481.20 39.41% 461.35 38.13% 500.83 40.25%
Foreign Govt's&Central Banks** 50.06 6.10% 78.39 7.88% 86.09 8.03% 93.59 8.27% 100.57 8.38% 102.61 8.40% 103.42 8.55% 104.66 8.41%
Pension Fund 56.46 6.88% 39.47 3.97% 39.66 3.70% 38.95 3.44% 42.63 3.55% 42.48 3.48% 43.30 3.58% 43.00 3.46%
Securities Company 0.30 0.04% 0.88 0.09% 0.83 0.08% 0.96 0.08% 0.99 0.08% 0.89 0.07% 0.81 0.07% 0.65 0.05%
Individual 32.48 3.26% 45.75 4.27% 31.42 2.78% 28.88 2.41% 31.91 2.61% 30.41 2.51% 28.35 2.28%
Others 63.64 7.76% 46.68 4.69% 49.72 4.64% 52.78 4.66% 58.83 4.90% 60.21 4.93% 60.51 5.00% 63.49 5.10%
Total 820.27 100% 995.25 100% 1,072.74 100% 1,131.63 100% 1,199.39 100% 1,220.90 100% 1,209.96 100% 1,244.45 100%
1) Including ownership of SBSN (government sukuk).
2) Foreign are consisted of Private Banking, Fund/Asset Management, Securities, Insurance, Pension Fund.
3) Others are consisted of Corporation, Individual, Foundation.
*) Since February 8th, 2008, repo transaction of Government Securities to Bank Indonesia was included.
**) Since November 21, 2014, foreign government(s) was included to the same category as foreign central bank(s).
Jan-15Dec-14Nov-14Mar-14Dec-13Dec-12 Jun-14 Sep-14
In the end of January 2015, foreign investor ownership record the highest percentage, showing their increasing appetite on the
Indonesia’s government securities.
Ownership of IDR Tradable Central Government Securities


![Investor Relations - hanatourcompany.comhanatour]ir_presentation_june... · Investor Relations 1 Investor Relations Jun. 2009.(Korean) 2 ... (cf. 국내소비0.3% 증가, 자료:한국은행,2006)](https://img.pdfslide.net/doc/110x75/5a881d307f8b9a87368ecd91/investor-relations-hanatourirpresentationjuneinvestor-relations-1-investor.jpg)