Embed Size (px)
Citation preview


ABOUT THIS DOCUMENT
This document describes the methodology that National Grid Gas plc (“NGGT”) in its role as
holder of the Gas Transporter Licence in respect of the NTS (the “Licence”) has been developed
to meet the requirements of Special Condition 7D (Methodology for Network Output Measures).
The Methodology objectives are to:
facilitate the monitoring of asset performance - the monitoring of the performance in
relation to the development, maintenance, and operation of an efficient co-ordinated and
economical pipeline system for the conveyance of gas;
allow the assessment of network expenditure - the assessment of historical and forecast
network expenditure on the pipeline system of NGGT;
allow comparative analysis – comparative analysis of performance over time between:
(i) geographic areas of, and Network Assets within, the pipeline system of NGGT;
(ii) pipeline systems for the conveyance of gas within Great Britain; and
(iii) pipeline systems for the conveyance of gas in Great Britain and in other countries
communicate relevant information - the communication of relevant information regarding
the pipeline between the Authority and other interested parties in a transparent manner.

Methodology for Network Output Measures
Version 1.0 Page 3 of 45
FOREWORD
National Grid’s gas transmission network already ensures the safe and reliable transportation of
gas to 23.2 million industrial, commercial and domestic customers around Great Britain, and our
customers are asking it to do more. We are ensuring the network can meet the flexible needs of
our customers, so it can manage the changing flows, within day, and physically across the
network.
Through our proposed NOMs Methodology we aim to be able to quantify the level of performance
that our assets are delivering for customers. This will provide additional justification for the
expenditure needed to maintain and/or improve our safety, reliability and environmental
performance across our network.
We believe our new Methodology significantly improves our ability to articulate the risks we are
managing and also assists in explaining how the investments we make ensure these risks are
being managed effectively.
Anthony Green,
Head of Network Engineering
Gas Transmission

Methodology for Network Output Measures
Version 1.0 Page 4 of 45
CONTENTS
ABOUT THIS DOCUMENT 2
FOREWORD 3
CONTENTS 4
1. OBJECTIVES OF THE METHODOLOGY 5
1.1. METHODOLOGY OBJECTIVES 5
2. OVERVIEW OF THE METHODOLOGY 6
2.1. PRINCIPLES OF THE METHODOLOGY 7
2.2. APPLICATION OF THE METHODOLOGY 10
2.3. SERVICE RISK FRAMEWORK OVERVIEW 11
2.4. SERVICE RISK FRAMEWORK MEASURES 11
2.5. MECHANISMS USED FOR VALUATION 13
3. USE OF THE METHODOLOGY 14
3.1. REPORTING 14
3.2. INVESTMENT PLANNING 16
4. METHODOLOGY FOR PIPELINES 19
4.1. SCOPE OF ASSETS 19
4.2. PROBABILITY OF FAILURE 22
4.3. CONSEQUENCE OF FAILURE 24
5. METHODOLOGY FOR SITES 26
5.1. SCOPE OF SITE ASSETS 26
5.2. PROBABILITY OF FAILURE 27
5.3. CONSEQUENCE OF FAILURE 31
6. GOVERNANCE OF THE METHODOLOGY 35
6.1. ANNUAL REVIEW 35
6.2. MODIFICATIONS TO METHODOLOGY 35
6.3. DATA ASSURANCE 36
7. DOCUMENT CONTROL 36
APPENDIX A – A1. - PIPELINES EXAMPLE 37
APPENDIX A – A2. - SITE EXAMPLE 39
APPENDIX B – NETWORK OUTPUT MEASURES REPORTING ALIGNMENT 41
GLOSSARY 43

Methodology for Network Output Measures
Version 1.0 Page 5 of 45
1. OBJECTIVES OF THE METHODOLOGY
1.1. METHODOLOGY OBJECTIVES
The document details the methodology that has been developed as a modification to “Gas
Transmission – The Development and Maintenance of a Methodology for Network Output
Measures” dated May 2008 (Issue 4.0).
The methodology has been developed to better facilitate the NOMs Methodology
Objectives as set out in Special Condition 7D of the Licence. This includes improvement
to the specific Network Output Measures outlining the categories of data that are to be
used and the methodology that is to be applied to derive each of the Network Output
Measures. The objectives of the Methodology are to;
facilitate the monitoring of asset performance - the monitoring of the
performance in relation to the development, maintenance, and operation of an
efficient co-ordinated and economical pipeline system for the conveyance of
gas;
allow the assessment of network expenditure - the assessment of historical and
forecast network expenditure on the pipeline system of National Grid;
allow comparative analysis – comparative analysis of performance over time
between:
o geographic areas of, and network assets within, the pipeline system of
NGGT and associated Above Ground Installations (the ‘NTS’);
o pipeline systems for the conveyance of gas within Great Britain; and
o pipeline systems for the conveyance of gas in Great Britain and in other
countries.
Communicate relevant information - the communication of relevant information
regarding the pipeline between the Authority and other interested parties in a
transparent manner.
The new NOMs Methodology will support the evaluation of current Network Output
Measures, either directly or indirectly:
Directly, as an input to or output from the Methodology:
the Network Replacement Outputs – used to measure the asset
management performance of NGGT; and
the Network Risk Measure – the overall level of risk to the reliability of the
NTS based on the condition of the Network Assets and the
interdependencies between Network Assets.
the Network Asset Condition Measure – current condition, expected
reliability and predicted rate of deterioration in the condition of the Network
Assets.
Indirectly, as consideration when monetising network risk, but will be continued
to be reported elsewhere through the Regulatory Reporting Pack (RRP):

Methodology for Network Output Measures
Version 1.0 Page 6 of 45
the Network Performance Measure – the technical performance of assets
that have a direct impact on the reliability and cost of services provided as
part of the transportation activities; and
the Network Capability Measure – the current level of capability and
utilisation of assets required to deliver services to customers.
It should be noted that the Methodology covers the monetisation of both condition and
non-condition related failure modes. For Network Risk and Network Replacement
Measure reporting, only condition-related risk will be included. However, we propose to
use the same monetised risk approach, as detailed by this Methodology, to value the risk
reduction benefits delivered by Asset Health investments within RIIO-GT2 investment
planning. These monetised risk benefit valuations will include both condition and non-
condition related risk.
Risk valuation is an essential step towards justifying investment through Cost Benefit
Analysis (CBA); the calculated monetised risk reduction delivered through specific
investments delivers fully quantified monetised benefit values for direct use in CBA.
NGGT have developed specific Risk Trading, or Asset Investment Optimisation tools, for
the purposes of both risk monetisation and NOMs reporting and for risk trading between
asset investments.
Further detail on how the NOMs Methodology Objectives are supported by the new
Methodology can be found in Section 3.1.
2. OVERVIEW OF THE METHODOLOGY
The focus of the methodology is the calculation of the Network Risk Measure that enables
NGGT to:
report the level of Network Risk at a point in time or into the future in financial
terms(i.e. Monetised Risk); and
to assist the justification of the maintenance and replacement activities (also
referred as Asset Health investments) to deliver our customer requirements.
Our Methodology for Network Output Measures is underpinned by our Asset Management
approach. This methodology document describes how we take the information about our
assets in the context of our supply and demand obligations to derive the level of risk that
is being managed and the asset management activities that National Grid will be
undertaking to deliver a safe and reliable network.
The diagram below shows the interaction of the main elements that are used in our asset
management decision making.

Methodology for Network Output Measures
Version 1.0 Page 7 of 45
To inform the Network Risk Measure and calculate monetised risk, there are a number of
inputs required to enable the monetised risk to be quantified. These include;
NTS supply and demand data that reflects our customer current and future
needs, both shippers and downstream gas users. This can be informed by our
current Network Capability Measure that is currently part of our annual
regulatory reporting requirements; and
the current condition and performance of the assets, which assist in informing
the overall level of Network Risk that is being managed.
The calculation of Network Risk in this methodology is based on specific operational
assets contained within our Asset Register. This is underpinned by information about the
assets in terms of potential failures, consequences and costs of these failures and the
intervention unit costs to either inspect, maintain, repair, refurbish or replace the asset.
These specific elements will be explained as we describe the Methodology in detail
throughout the remainder of this document. Supporting documents are provided that go
into even greater detail as to how the following elements of the Methodology are derived:
Probability of Failure
Consequence of Failure
Service Risk Framework
2.1. PRINCIPLES OF THE METHODOLOGY
The Methodology documents and assesses the asset related events that affect the ability
of that asset base to perform its desired function and thus result in a material
consequence on the performance desired by NGGT and its stakeholders. This
performance of the asset base is valued in financial terms, i.e. Monetised Risk.
Therefore, understanding and translating the probability of initiating asset events through
to their consequences, according to the various factors involved allows the risk of the
assets to be valued.
Network Capability Measure
Supply and Demand Forecasts
Network Performance & Condition Measures
Required level of service,
performance and condition
Network Risk Measure
Level of risk to the network based
on the performance and
interdependencies between
assets
Asset Register
Unit Cost Framework
Probabilities of Failure
Consequences of Failure
Service Risk Framework
Capability
• Develop maintenance &
Replacement activities
• Whole Life Cost analysis
• Workload volumes
• Workload plans
Customer CommitmentsService
Supply & Demand
Network RiskNetwork
Replacement Outputs
Asset Base Consequence
of Failure
Probability of
FailureValue of
Failure
! £

Methodology for Network Output Measures
Version 1.0 Page 8 of 45
The methodology is based on a combination of Failure Modes Effects and Criticality
Analysis (FMECA) and Event Tree Analysis (ETA) both of which are recognised risk
assessment techniques, which facilitate the analysis and representation of the sequence
of events and consequences following an initiating asset related event.
Service Risk Framework
The foundation of the methodology is the Service Risk Framework (SRF). This consists of
a set of measures that in totality describes the service performance requirements of the
asset base from the perspective of National Grid and its stakeholders. All assets either
directly or indirectly contribute to the delivery of one or more of the measures within the
SRF.
The impact of an asset on one or more of the measures within the SRF provides a
consistent method of assessing and articulating the consequence of assets and ultimately
its monetised risk value. The event trees, which are described later in this document,
provide the linkages and factors for each asset event through to the consequence of that
event in terms of the impact on one or more of the SRF measures.
Asset Base
The Methodology applies to all the NGGT operational gas transmission assets. Specific
information about the NGGT asset base, contained within our Asset Register, drives the
Methodology. Factors such as the age, performance, work history and duty of the assets
are used to determine the probability of asset failure. Factors such as the configuration,
location and capacity of the asset base are used to derive the performance consequences
of asset failure. A list of assets covered by the Methodology is provided in the Probability
of Failure supporting document (Appendix C).
Probability of Failure
Individual assets can fail in a number of ways; these are referred to as failure modes
which are a specific deviation from the normal performance of the asset. Within the
Methodology only the failure modes that lead to a material performance consequence
have been identified and used. Understanding the factors that drive the deterioration of
the assets and how these impact the probability of failure has allowed the increasing
probability of failure, over time, for each of the assets to be assessed. The probability of
failure has been determined from a number of sources, all of which are recognised asset
management practices:
NGGT historical maintenance / asset performance data;
national and international published information; and
expert opinion and elicitation workshops.
The current and predicted probability of failure for each of the identified failure modes, for
all the individual assets on the NGGT asset base, has been determined.
Asset Base Consequence
of Failure
Probability of
FailureValue of
Failure
! £

Methodology for Network Output Measures
Version 1.0 Page 9 of 45
Consequence of Failure
The consequence of failure determines the impact that the asset will have should it fail
according to one of the identified failure modes. The consequence of the asset failure is
made up of the:
probability that an asset failure causes that consequence;
severity of the consequence; and
quantity of the consequence.
For all assets, the factors that drive the consequence have been determined and
quantified, including:
purpose of the asset and location of the asset within the network or site
geographic location and proximity to buildings and transport links;
whether the asset is Safety Integrity Level (SIL) rated and is covered by detect
and protect systems;
staff and public exposure to the assets;
The full list of factors and how they have been applied for each of the consequence
measures are provided in Sections 4 and 5. The expected consequence of failure impact
for each of the identified failure modes for all the individual assets on the NGGT asset
base has been determined.
Value of failure
The probability and consequence of failure for each asset is combined into a predicted
number of events against each of the measures in the SRF. The value of failure is
articulated through the valuation of each of the measures within the SRF.
All the measures have been valued from two perspectives; the private (or internal) value
of service to NGGT and the societal (or external) value of service to society as a whole.
Many of the measures carry both a private and societal value, others carry only one. The
valuations have been derived from a combination of sources, namely:
analysis of NGGT historical data;
nationally published valuation information; and
analysis of publically available reports to determine associated value.
valuations undertaken by regulatory economists using relevant industry case
studies
Reporting Risk Measure
The ability of the Methodology to develop an understanding of the deteriorating asset
base; its increasing probability of failure and the consequences of that failure, together
with the value of the consequence, allows the risk of the NGGT asset base to be
understood and reported in monetary terms now and in the future.
Investment Planning
In addition to reporting level of risk and monetised risk, the Methodology also supports
investment planning and decision making. Understanding the required investments,
whether inspection, maintenance, repair, refurbishment or replacement that NGGT can
make to the asset base and assessing the impact these interventions have on future asset

Methodology for Network Output Measures
Version 1.0 Page 10 of 45
performance and failure consequences, allows the monetary benefit of investments to be
determined. This monetary benefit is assessed across the life of the asset and this
assessment of whole life costs enables effective evaluation of potential investment plans.
When combined with the other decision making elements in use in National Grid, such as
historical analysis, As Low As Reasonably Possible (ALARP) considerations and other
mandatory legislative requirements, the methodology facilitates the production of future
investment requirements for our asset base.
2.2. APPLICATION OF THE METHODOLOGY
Challenges
The NGGT asset base is a large and interconnected system of physical assets that is
geographically distributed across Great Britain. It is designed and operated to be safe
and highly reliable. This presents a series of challenges for the application of the
Methodology including:
supply and demand scenarios, forecast and seasonal assumptions
asset redundancy where multiple assets of the same type are in place to
mitigate the failure of any individual asset;
service failure dependencies where assets are in place to detect and protect
against the impact of failure of other assets;
asset degradation dependencies where assets are in place to prevent or slow
the degradation of other assets; and
assets operating within a meshed network where multiple supply sources are
available to mitigate the failure of one or more assets within the network.
Our approach to these challenges is explained throughout this document and in
accompanying supporting documents.
Systemisation
For such a large and varied asset base, any monetised risk Methodology needs to be able
to be systematically applied. Systemisation is the only way that the consistency and
repeatability can be guaranteed. Systemisation also provides the efficiency and speed of
application necessary to be practical for regular reporting to our stakeholders and to use
as a basis for investment planning.
The Methodology has been developed to be completely driven from the data that NGGT
holds about its assets. Whilst this data driven approach provides the consistency and
speed of application it is dependent upon the quality of data used. NGGT is continuing to
roll-out a programme of work to improve the quality of the asset register and other data
required to support this Methodology. The Methodology also considers the sensitivity and
uncertainty analysis required to understand the impact of the data quality on monetised
risk outputs.
Modelling the Asset Base
In order to best take account of the challenges specific to the asset base and to enable
the methodology to be systematically applied to the whole asset base, the assets have
been split into two groups:
Pipelines – containing all the assets directly associated with the network of
predominantly underground pipes and associated pipe protection (e.g. Cathodic
Protection) ; and

Methodology for Network Output Measures
Version 1.0 Page 11 of 45
Sites – containing all the above ground assets (AGIs) that form the Entry
points, Exit points, Multijunctions, Block Valves and Compressor sites.
The specific application of the Methodology to the asset groups and the mechanisms used
to overcome the challenges of each is described in Section 4 for pipelines and Section 5
for sites. However, the Methodology is consistent and comparable across the two groups.
2.3. SERVICE RISK FRAMEWORK OVERVIEW
The purpose of the Service Risk Framework within the Methodology is to provide a
consistent method of assessing and articulating the consequence of that asset failure and
the service valuations. It provides a common language with which to consistently
communicate risk associated with the physical and commercial performance of the asset
base i.e. monetised risk.
The structure of the SRF has been designed in such a way so that it supports monetised
risk reporting and strategic, tactical and operational expenditure decision making for both
capital and operating investments. In doing so, there are several purposes that the
framework fulfils. It articulates how the asset base will perform and how both capital and
operating expenditure will impact upon:
the monetised risk inherent in the asset base and thereby facilitating the
mandatory reporting against the safety, environmental, reliability and financial
commitments made by NGGT as part of the regulatory agreement;
the service that customers and stakeholders expect and value, thereby
providing the basis for undertaking Cost Benefit Analysis (CBA) and identifying
future investment requirements and strategies;
the performance of NGGT against relevant regulatory or other commercial
incentives, thereby enabling the business to target the performance it is
incentivised to deliver; and
the other relevant performance metrics used to monitor performance both
internally and externally thereby enabling the measurement of performance and
the targeting of investment to deliver it.
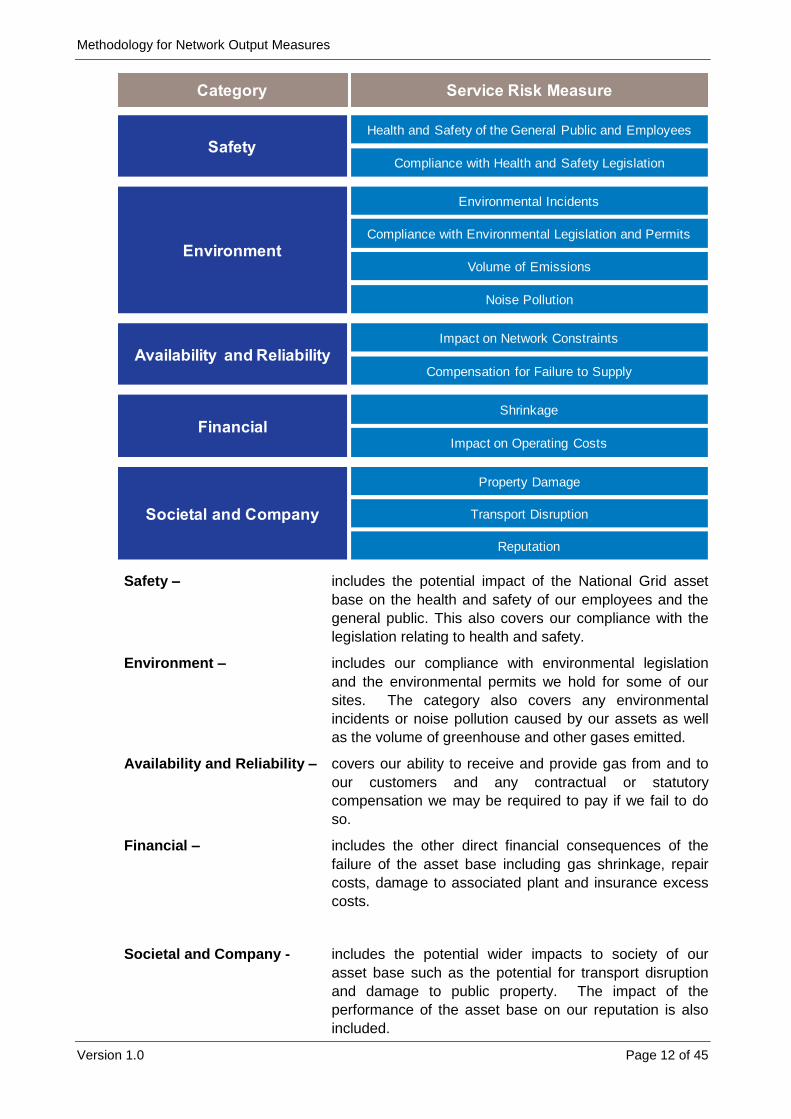
2.4. SERVICE RISK FRAMEWORK MEASURES
The SRF consists of 13 measures grouped into five categories as shown in the table
below.
Methodology for Network Output Measures
Version 1.0 Page 12 of 45
Safety – includes the potential impact of the National Grid asset
base on the health and safety of our employees and the
general public. This also covers our compliance with the
legislation relating to health and safety.
Environment – includes our compliance with environmental legislation
and the environmental permits we hold for some of our
sites. The category also covers any environmental
incidents or noise pollution caused by our assets as well
as the volume of greenhouse and other gases emitted.
Availability and Reliability – covers our ability to receive and provide gas from and to
our customers and any contractual or statutory
compensation we may be required to pay if we fail to do
so.
Financial – includes the other direct financial consequences of the
failure of the asset base including gas shrinkage, repair
costs, damage to associated plant and insurance excess
costs.
Societal and Company - includes the potential wider impacts to society of our
asset base such as the potential for transport disruption
and damage to public property. The impact of the
performance of the asset base on our reputation is also
included.
Category
Health and Safety of the General Public and Employees
Safety
Availability and Reliability
Financial
Environment
Compliance with Health and Safety Legislation
Environmental Incidents
Volume of Emissions
Noise Pollution
Societal and Company
Property Damage
Transport Disruption
Reputation
Shrinkage
Impact on Operating Costs
Compliance with Environmental Legislation and Permits
Impact on Network Constraints
Compensation for Failure to Supply
Service Risk Measure

Methodology for Network Output Measures
Version 1.0 Page 13 of 45
Each of the service risk measures is articulated in terms of a range of severities to
appropriately and consistently capture the impacts experienced. For example, in relation
to health and safety of the general public and employees the severities range from near
misses and minor injuries through to multiple fatalities with associated enforcement
notices.
Details of how each of these Categories and Measures are defined and measured are
included in the Service Risk Framework document, accompanying this Methodology
document.
2.5. MECHANISMS USED FOR VALUATION
All the measures and severities have been valued from two perspectives:
the direct costs to National Grid of the impact of the service provided – Private
(or Internal) value; and
The value to society as a whole of the service provided – Societal (or External)
value.
These societal values for service failures recognise the benefits and disbenefits of service
failures as experienced by customers, local communities and the environment. The social
valuations have been developed using the existing, publically available, literature through
a process of value transfer.
The private valuations recognise the direct costs to NGGT of the failure of service. The
private valuations have generally been developed using an analysis of NGGT data, and
where this is not available then other appropriate industry data has been used.
The methods and data sources used for determining a valuation for each of the SRF
measure, together with any considerations of overlap between societal and private
valuations, is detailed in the Service Risk Framework supporting document.
Mapping of Measures to Private and Societal Valuations
The table below shows the mapping of each of the risk measures to either Social or
Private valuations.

Methodology for Network Output Measures
Version 1.0 Page 14 of 45
3. USE OF THE METHODOLOGY
3.1. REPORTING
The existing annual Regulatory Reporting Pack (RRP) as required under Standard
Special Condition A40: Regulatory Instructions and Guidance (RIGs), already contains
information covering a number of the Network Output Measures as follows:
Network Performance Measure: Covered by worksheets 5 (or as amended post April
2017) of RIGs to enable Ofgem to monitor the performance of the network; and
Network Capability Measure: Covered by worksheets 5.3 and 5.4 (or as amended post
April 2017) of RIGs to collect information on the overall size and quality of the
transmission service together with the overall levels of capacity booked and levels of
actual demand.
The above measures will continue and be governed by RIGs. Further details are provided
in Appendix C.
The table below shows how we believe the new Methodology supports, and aligns to, the
reporting of Network Output Measures.
Reporting Asset Risk and Condition
Based on the improvements made in the calculation of risk, the methodology facilitates
the ability to report the Network Asset Condition Measure and Network Risk Measure
current status together with the predicted future risk with or without investment in
monetary terms. This can facilitate the reporting of:
Network Risk for Pipeline and Site assets, combined or separately;
the total monetised risk across the assets at a point in time or forecast future
risk without investment;
Category
Health and Safety of the General Public and Employees
Safety
Availability and Reliability
Financial
Environment
Compliance with Health and Safety Legislation
Environmental Incidents
Volume of Emissions
Noise Pollution
Societal and Company
Property Damage
Transport Disruption
Reputation
Shrinkage
Impact on Operating Costs
Compliance with Environmental Legislation and Permits
Impact on Network Constraints
Compensation for Failure to Supply
Service Risk Measure Private Social
Y Y
Y -
Y Y
- Y
Y Y
Y -
Y -
Y Y
Y -
Y -
- Y
Y -
- Y

Methodology for Network Output Measures
Version 1.0 Page 15 of 45
the frequency of asset failure that can be expected driven from the data held
about the assets; and
The monetary consequence of the asset base driven by the probability, severity
and quantity of consequence, which is valued using the Service Risk
Framework.
Bringing these measures together allows reporting of risk through an established risk
matrix approach across many industries. Typically, red zones would highlight ‘concern’ for
the assets with amber / yellow being ‘cautious’ and green being ‘comfortable’.
The aim of an Asset Manager, such as NGGT, is to manage downward away from the
concern zone. Utilising this type of metric allows NGGT stakeholders to see how the
performance of assets is being managed over time. Stakeholders would receive annual
updates as part of the RRP and this would enable the comparison of performance over
time.
Parameters for Reporting
The Methodology brings together a number of data sources, which change over time, for
example:
Pipeline and Site assets may be commissioned, modified or decommissioned
during any given year of a price control, which would be driven by our
requirement to meet customer needs or driven by our replacement activities.
The majority of changes would be driven by investment plans and therefore
predominantly would be under NGGT’s control; and
supply and demand to meet current and future requirements will change year
on year with the capacity booking process and therefore could be considered an
exogenous factor that would lead to either increase or decrease in risk at many
sites or regions of the network outside NGGT’s control. Further discussions are
required with Ofgem to understand how the impact of changes in failure
consequence arising from supply/demand variations will be treated during the
RIIO-GT2 reporting period.
For the purposes of reporting the Network Risk Measure during a price control period, and
to avoid swings in risk driven by exogenous factors, we propose that the following
elements would remain constant:
supply and demand forecasts and their impact on failure consequences; and
service valuations defined by the Service Risk Framework, at a constant price
base.
This will allow NGGT to focus on elements that are within its control and, if reduced, would
drive additional value for customers. Examples include:
improving unit costs for maintenance and replacement activities;
reducing the frequency of failure through maintenance and other potential
innovative practices; or
reducing the consequences of failure through additional protection or detection
assets or measures.

Methodology for Network Output Measures
Version 1.0 Page 16 of 45
Example of Monetised Risk Reporting
An example of how future monetised risk could be reported is shown below, which
combines the frequency and monetary consequences of failure and how they change
through investment. Actual reporting outputs will be agreed through consultation with
Ofgem and other stakeholders and must support both annual regulatory reporting and the
assessment of potential RIIO rewards and penalties.
3.2. INVESTMENT PLANNING
The Methodology will be used to support a move towards monetised risk based
investment planning for the NGGT asset base. The Methodology will be used alongside
the existing investment planning approaches, such as historic analysis, Plant Status
(significant defects) review, ALARP, quantitative risk assessment and detailed business
cases to support in the planning and justification of Asset Health investments.

Methodology for Network Output Measures
Version 1.0 Page 17 of 45
It is intended that the SRF used for the Methodology and associated valuations will be
used consistently across all of investment approaches, where appropriate to do so.
The Methodology presented in this document provides a systemised and consistent
mechanism for understanding the current and future risk of the entire NGGT asset base in
monetary terms. For specific business cases, the analysis may be more detailed and site
and location specific but will follow the same principles as this Methodology (e.g. BAT for
emissions investments).
Interventions
Considering all the different types of intervention options for every asset is a key facet of
using the Methodology for investment planning purposes. Interventions can be thought of
as ‘doing work’ on assets, which can range from routine maintenance through to full asset
replacement.
The purpose of these activities is to efficiently and effectively manage the risk and to avoid
serious detrimental impact to the capability and performance of the asset base.
Interventions can affect the different failure modes of different assets, and typically they
would be expected to reduce the likelihood of a failure occurring. Other interventions can
affect the consequences of failure and mitigate the severity or quantity of service affected.
The Methodology accounts for the consideration of proactive and reactive interventions.
As such, costs have been assigned to both, where appropriate reactive interventions may
NGGT INVESTMENT NEEDS
NO
MS
ME
TH
OD
OL
OG
Y
PLAN DELIVERABILITYREGULATORY
REPORTING
INVESTMENT PLAN
Monetised Risk
Significant
Investments
(e.g. Compressor
Strategy)
Asset Health
(subject to optimisation)
CBA
including options for wider society
FUTURE OF THE GAS TRANSMISSION NETWORK
Compliance Works
(e.g. ILI, PSSR,
DSEAR)
Service Risk
Framework
Probability of
failure
Consequence
of failure
Asset
Investment
Optimiser (AIO)

Methodology for Network Output Measures
Version 1.0 Page 18 of 45
carry a greater cost to NGGT principally driven by reactive mobilisation costs and
disruption. The costs will include both capital and operational expenditure and therefore
facilitate Totex investment planning to be undertaken.
The following intervention types are accounted for with associated cost distributions:
inspections such as surveys;
maintenance activities;
reactive interventions where defects have been identified either during routine
inspection or in an emergency and remedial activity undertaken; and
proactive intervention - refurbishment or replacement of assets.
Unit Costs to Support Interventions
For each asset a set of unit costs will be established for the potential interventions and
maintenance activities. All costs will be expressed at a common price base consistent with
the SRF price base (currently 16/17 Price Base Date).
Investment Decision Support
The Methodology has been systematically applied to allow the risk and performance of the
whole asset base to be forecasted. Asset interventions are currently being identified and
costed, which allows the whole life costs and benefits of interventions to be understood at
any point in the future. This is outside the scope of this Methodology, but it is important to
describe the relationship between monetised risk reporting and investment planning.
Intervention options will be optimised to deliver a desired level of risk, cost and
performance across the asset base or on a subset of the asset base. Simplistically, risk
monetisation can be used to identify the most cost beneficial interventions. This may not
always provide a portfolio of investments that deliver the required company level of cost,
risk and service performance. In these cases, risk and performance of the assets may be
targeted to ensure a company level of performance is achieved. Furthermore, to ensure
that individual asset risks conform to any required ALARP levels, constraints in the
decision making are applied to drive any required additional investments.
Bringing all these elements together allows plans to be developed that identify the total
investment required to deliver a level of risk and performance required by our
stakeholders over the regulatory period that take account of costs and benefits beyond a
single regulatory period.
Within a regulatory period, specific asset information, such as performance maintenance
and inspection results will allow targeting of individual assets to drive the intervention.
When considering the costs and benefits of interventions Cost Benefit Analysis (CBA)
methods are used that comply with Best Practice guidance such as the HM Treasury
Green Book.
Potential Supply and Demand Impacts
The current transmission network facilitates a significant flexibility in the supply of gas
onto the network. Under short-term planning horizons, it is relatively straightforward to
assess risk and consequence to justify an investment. Under longer-term scenarios, the
ability of shippers to vary the level of supply at Entry points can contribute to changes in
consequence of the asset failure.
To value the contributions of Above Ground Installations (AGIs, which includes
Compressors) and Pipeline sections towards NGGT NTS resilience and the avoidance of
supply loss, we recognise that the consequence of asset failure (and hence monetised

Methodology for Network Output Measures
Version 1.0 Page 19 of 45
risk associated with consequences of failure) will depend on the prevailing demand and
supply conditions.
For purposes of testing this Methodology we have considered national demand for a
winter day, in combination with credible, localised supply scenarios (within licence
obligations). Since localised supplies could be as high at summer demand levels as in this
winter scenario, this approach is appropriate for ensuring that the NTS remains resilient to
cope with a range of supply and demand conditions. See the Consequence of Failure
supporting document for further details.
Supply conditions are market-driven and we must ensure that Asset Health investments
are best targeted to maintain the flexibility to meet customer needs for the future.
When determining the scenarios and levels of resilience to be applied for future
investment planning and for future monetised risk reporting (these scenarios may not be
one and the same) work is ongoing. Any changes to the approach, if there is a material
impact on overall monetised risk, may require a change to this Methodology document
process.
For the purposes of rebasing current performance (to support the incentivisation process
ongoing with Ofgem to close out RIIO-GT1), the size of the supply/demand monetised risk
present on the NTS and the value of the supply/demand monetised risk delivered through
investment are directly proportional. As such, the actual method used to value
supply/demand monetised risk is unlikely to impact on rebased performance. This
assumption will be tested through ongoing sensitivity analysis and model validation
For RIIO-GT2 Asset Health investment planning, a suitable supply and demand scenario
will be agreed with Ofgem which can demonstrate that the costs of required investments
to control NTS risk do not unfairly disadvantage customers. NGGT will demonstrate to
customers that their required level of investment meets customer expectations for supply
resilience should assets fail in the future.
4. METHODOLOGY FOR PIPELINES
The methodology of quantifying the monetised risk of buried pipelines is based on
standard Quantitative Risk Assessment techniques (QRA)1.
4.1. SCOPE OF ASSETS
The scope of the assets included within the Pipeline elements of the methodology
includes the following assets:
Pipeline segments;
Cathodic Protection (CP) Systems and Test Posts;
Marker Posts;
Impact Protection and Nitrogen Sleeves; and
Pipe Bridges and River Crossings.
Specific Challenges
There are four specific challenges to be addressed when assessing the monetised risk of
assets of pipelines, namely:
1 IGEM - TD/2 - Edition 2– Assessing the risks from high pressure Natural Gas pipelines (amended July 2015)

Methodology for Network Output Measures
Version 1.0 Page 20 of 45
pipelines are long linear assets which by their nature have potential impact
across a large spatial area. Specific parts of a pipeline may have one type of
impact whereas others may have completely different impacts. Using average
impacts and risk across an entire pipeline does not accurately reflect the
monetised risk of that asset;
the length of pipelines and their replacement costs means that they are never
replaced as a whole, rather individual targeted interventions are undertaken on
economical sections of the pipeline that are at risk of failure;
pipelines operate as part of a system of assets within which there are
interactions where some of the assets are designed to protect the base pipeline
asset; and
the way in which pipelines are connected determines how critical they are to the
supply of gas. As a result, network considerations as to the capacity of
alternative routes when pipe segments become unavailable, along with the
Supply and Demand scenario chosen, is fundamental when assessing the risk
of individual pipe segments.
Pipeline Segmentation
In order to resolve the first two challenges the methodology has been applied at pipe
segment level. Pipelines have been split into individual pipe segments represented by a
pipe weld section of approximately 12 metres in length. This allows the specific
characteristics and impacts of each pipe segment to be understood and the monetised
risk calculated. The risk for the whole pipeline can then be aggregated from the individual
segments.
Within the methodology, interventions are identified and applied to individual pipe
segments, which closely relate to the physical delivery of the work.
From a total current length of 7,772 km of pipeline nearly 700,000 individual pipe
segments have been created. Although this significantly increases the number of base
assets, the key advantage is that each pipe segment can be assumed to be homogenous
as all asset attributes can be considered the same. Asset attributes of a linear pipe
include; material, install year, wall thickness, depth, pressure, surface type, location, and
surrounding consequence quantities such as number of houses, transportation, and other
utilities.

Methodology for Network Output Measures
Version 1.0 Page 21 of 45
Individual Pipelines within the Gas Transmission Network
Network attributes are also attached to each pipe in a hierarchical manner by way of a
connected network. Each pipe segment is aligned to other up and downstream pipe
segments and sites. Network data, such as number of customers served from a particular
part of the network, can therefore be attached to each pipe segment.
Asset Interactions
The third challenge is resolved by understanding the interactions between the assets
within the pipeline system. Pipe segments are used as the base asset and assets that
interact with pipelines treated as associated assets, namely:
Base Asset
o Pipe segments
Associated Assets
o Cathodic Protection (CP) System;
o Cathodic Protection Test Posts;
o Marker Posts;
o Impact Protection;
o Nitrogen Sleeves;
o Pipe Bridges;
o River Crossings.

Methodology for Network Output Measures
Version 1.0 Page 22 of 45
Each of the associated assets is related directly to the base pipeline asset, although there
may be a one-to-many relationship where appropriate. For example, a single CP System
is attached to many pipeline segments, representing all the pipes in the pipeline in which
the CP System provides corrosion resistance. A River Crossing is attached to all the pipes
which cross a river, while Marker Posts are attached to the closest pipe.
Each associated asset has a set of its own asset attributes such as type, install year, and
condition. In this manner, the associated asset can have an individual probability of
failure as well as interacting with the base pipe asset(s) that it is linked to. The main
consequence of failure, and hence resulting risk, is therefore calculated from the individual
risks as well as this interaction.
4.2. PROBABILITY OF FAILURE
Probability of failure is split between pipes and associated assets and the interaction
between them. Further details can be found in the Probability of Failure supporting
document. Failure modes for pipes are based on those detailed in IGEM TD/2:
Corrosion – external corrosion of the pipe resulting in reduced wall thickness
and eventual leak or rupture;
Mechanical failures - including material and weld defects created when the pipe
was manufactured or constructed;
General failure – general and other causes, e.g. due to over-pressurisation,
fatigue or operation outside design limit;
External interference – caused by third parties; and
Natural events - ground movement, either natural e.g. landslide, or man-made
e.g. excavation or mining. This could also include flooding and other natural
events.
The base failure frequency of each pipe segment is determined from the underlying pipe
attributes and a set of reduction factors are then applied to proportion this failure
frequency up or down. For example, the probability of damage caused by external
interference, increases for pipe segments with a decreased wall thickness.
The base equations are then extended to include the interaction between associated
assets where considered significant. For example, the condition of Impact Protection
affects the probability of external interference failure. Similarly, a CP System is used to
protect pipes from corrosion, and if not working results in higher rates of wall thickness
deterioration.
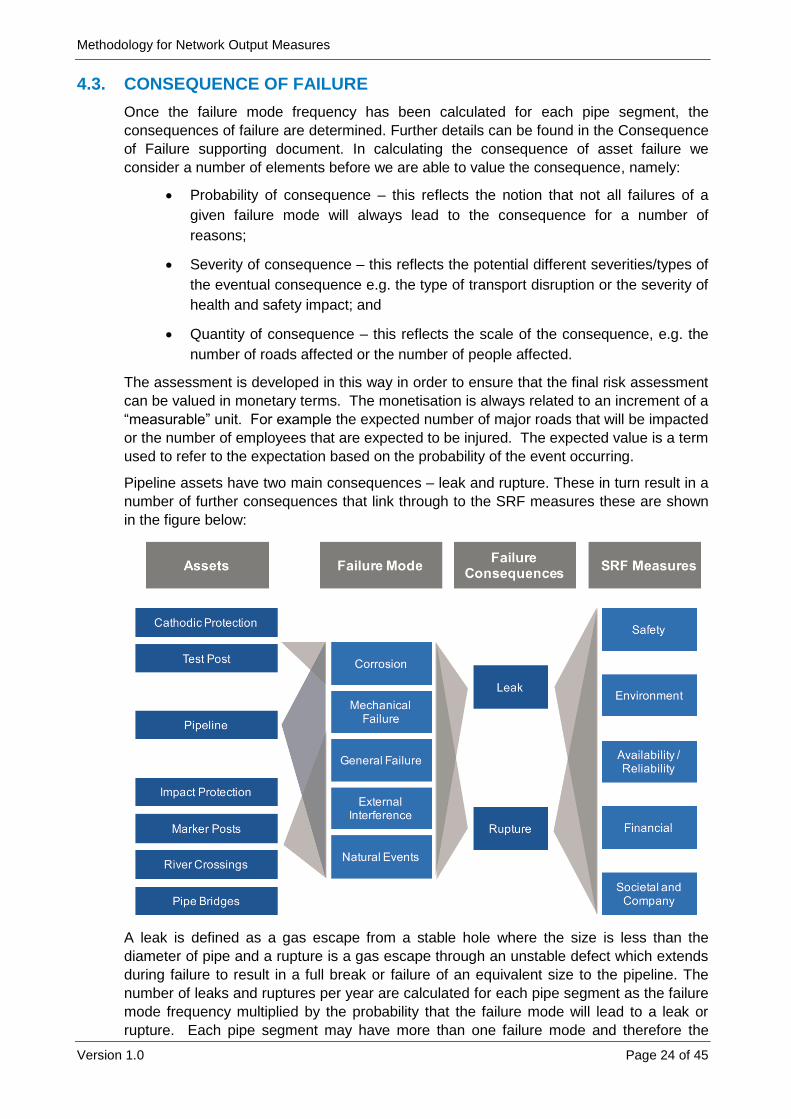
The diagram below shows the failure modes considered for the pipe together with the
failure modes that are affected by the associated assets.

Methodology for Network Output Measures
Version 1.0 Page 23 of 45
The failure model, for each failure mode, is updated with data from NGGT data sources,
such as survey and condition data. Inline Inspection (ILI) surveys are performed on a
regular basis and provide the current remaining wall thickness (metal loss), material
defects, and mechanical damage. Cathodic Protection Surveys (CIPS) are also carried
out on a regular basis and determine the voltage loss and resultant effectiveness of
corrosion protection along a pipe.
Examples of Metal Loss and CIPS Survey Results Mapped onto Pipes
After each failure model on all pipe segments has been calculated, the values from the
following EGIG and UKOPA reports have been used to validate the failure frequencies.
EGIG – Gas pipelines incidents, 9th Report of the European gas pipeline
Incident Data Group (period 1970-2013)
UKOPA Pipeline Product Loss Incidents and Faults Report (1962-2013)
Failure of the associated assets is based on asset management plans and expert
elicitation of condition deterioration and failure rate curves. The condition curves are used
to generate an effective asset age based on the current measured condition of the asset.
The effective age is then used as the starting age of the asset and a failure curve applied.
Methodology for Network Output Measures
Version 1.0 Page 24 of 45
4.3. CONSEQUENCE OF FAILURE
Once the failure mode frequency has been calculated for each pipe segment, the
consequences of failure are determined. Further details can be found in the Consequence
of Failure supporting document. In calculating the consequence of asset failure we
consider a number of elements before we are able to value the consequence, namely:
Probability of consequence – this reflects the notion that not all failures of a
given failure mode will always lead to the consequence for a number of
reasons;
Severity of consequence – this reflects the potential different severities/types of
the eventual consequence e.g. the type of transport disruption or the severity of
health and safety impact; and
Quantity of consequence – this reflects the scale of the consequence, e.g. the
number of roads affected or the number of people affected.
The assessment is developed in this way in order to ensure that the final risk assessment
can be valued in monetary terms. The monetisation is always related to an increment of a
“measurable” unit. For example the expected number of major roads that will be impacted
or the number of employees that are expected to be injured. The expected value is a term
used to refer to the expectation based on the probability of the event occurring.
Pipeline assets have two main consequences – leak and rupture. These in turn result in a
number of further consequences that link through to the SRF measures these are shown
in the figure below:
A leak is defined as a gas escape from a stable hole where the size is less than the
diameter of pipe and a rupture is a gas escape through an unstable defect which extends
during failure to result in a full break or failure of an equivalent size to the pipeline. The
number of leaks and ruptures per year are calculated for each pipe segment as the failure
mode frequency multiplied by the probability that the failure mode will lead to a leak or
rupture. Each pipe segment may have more than one failure mode and therefore the

Methodology for Network Output Measures
Version 1.0 Page 25 of 45
probability of failure is summed for all failure modes to give the total number of leaks or
ruptures. .
Environmental Impacts
A release of gas occurs as a result of a leak or rupture. The amount of gas released is
dependent on the size of hole, diameter of pipe, the operating pressure, and the duration
of the leak or rupture. This is then converted to a Greenhouse Gas (GHG) equivalent
value, expressed as tonnes of carbon dioxide equivalent (tCO2e) to calculate the emission
value.
Health and Safety and Property Damage
Leaks and ruptures have the potential to ignite. The probability of a leak igniting is based
on the size of hole and the operating pressure of the pipeline, as per IGEM TD/2. The
probability of a rupture igniting is based on the diameter and operating pressure of the
pipeline. This considers:
fireballs which occur in the event of an immediate ignition; and
crater fires which occur in the event of a delayed ignition of the gas released into
the crater formed by the release, or following the immediate ignition fireball.
Health and safety incidents can result from ignition impacts. These can differ in severity,
and the following severities have been included:
Minor injury;
Lost Time Injury;
Major injury; and
Fatality.
Property damage has also been assessed resulting from ignition impacts.
The quantity of each severity following an ignition is based around Building Proximity
Distances (BPD) and Emergency Planning Distances (EPD). These are based on
guidelines within IGEM -TD/1 - Edition 5 and the National Grid Incident Procedures.
Transport Disruption
Leaks and ruptures can result in disruption to transport services for safety reasons and
further inspection. The severity of transport disruption is split into the following bands:
Motorway;
Dual carriageway / A roads;
Minor roads;
Mainline and Underground rail services; and
Local rail services.
Transport disruption is calculated from the number of each road or railway within the EPD,
by undertaking a spatial analysis of each pipe segment.
Availability and Reliability
Availability and reliability is calculated from the number of supply interruptions resulting
from a leak or rupture.

Methodology for Network Output Measures
Version 1.0 Page 26 of 45
To gain full coverage of the whole network in the short term a desktop study has been
undertaken to build a logical model for all pipelines in the network. This takes into
account, for any individual pipe segment failure, the loss of directly connected exit or entry
points in addition to the loss of any dependent connected assets. Where an exit point site
is part of the interconnected network then the loss of directly connected exit points are
only due to a failure at that site. Where a site is situated on a spur its output consequence
applies to all upstream sites until the point at which the site is supplied by two separate
pipelines. See Consequence of Failure report (Appendix C) for further details.
5. METHODOLOGY FOR SITES
5.1. SCOPE OF SITE ASSETS
The scope of the assets included within the Site elements of the methodology includes all
operational assets on the following site types (primary asset level):
Compressor
Multi-Junction
Entry Point
Exit Point
Pipeline Block Valve
A detailed list of the asset types and failure modes included is provided in the Probability
of Failure supporting document (Appendix C).
Specific Challenges
There are four specific challenges when assessing the monetised risk of assets on a site,
namely:
there are a large number of different types of assets each with different failure
characteristics and potential service impacts;
the highly connected nature of the individual assets on each site and the variety
of functions similar asset types have means that assessing assets in isolation
does not accurately represent their risk to service performance;
at site level an additional level of complexity needs to be taken into account
which relates to the reliability of the compressor units where there is more than
one unit. This offers a level of redundancy should a unit become unavailable;
and
to accurately assess the risk of asset failure, it is critical to consider any reduction
in risk offered by Safety Instrumented System (SIS). SIS provides the ability to
detect, logically process and activate any protection systems in the event such as
a gas leak or other safety impacting event.
Determining the Service Impact of Asset Failure
Given the large variety of assets and system functions within an individual site, the
Methodology links an asset to the potential service consequences through a key principle:
the Asset Purpose. Once the purpose of the asset is known, the potential consequences
follow depending on how the asset has failed.

Methodology for Network Output Measures
Version 1.0 Page 27 of 45
A site is made up of a collection of Asset Systems designed to undertake a particular task,
i.e. its purpose. Individual assets operate within an Asset System and as such allow the
asset’s purpose to be inferred.
For each system, we determine the different types of failure modes that could occur which
would lead to one or more of the consequences in the SRF. Separately, we identify for
each asset type, when they fail, the failure modes they may exhibit and have captured this
through an asset type to failure mode mapping.
This two-step approach allows the assets that have a shared purpose defined through the
system to be determined, and then all relevant failure modes that relate to the asset type
within the context of the system they operate to be applied.
This approach can be applied across all types of assets which are serving different
purposes so that they can link to the appropriate service risk consequences and only the
failure modes that are relevant to those consequences and the asset type under
consideration.
The mapping of systems, asset types, failure modes and service consequences is
provided in the Consequence of Failure supporting document (Appendix B).
5.2. PROBABILITY OF FAILURE
Further details can be found in the Probability of Failure supporting document. The first
item to quantify is the failure mode frequency, which is made up of two elements: the
frequency of failure for each asset and the proportion of the failures that would be
expected to be of a given failure mode for that asset.
The frequency of failure is determined using a failure model that is specific to each asset
type. The failure models have been developed from two sources of information, which
are:
historical asset performance and defects data taken from the work management
system; and
expert elicitation workshops using a formal and established method for eliciting
failure characteristics of asset populations to inform a statistical model fitting
process.
The work defects data provides an asset-type specific rate of failure that reflects the
actual volumes of potential failures prevalent in the asset base. The elicited models are
developed to predict the deterioration in rate of failure for each asset type. Combining the
two sources of information, we are able to apply a failure model to a specific asset of a
given asset type to predict the current and future annual rates of failure, i.e. number of
failures per year.
Failure Mode 1
Consequence of FailureFailure Mode
H&S Env A&R Fin
Failure Mode 2
Failure Mode 2
Failure Mode 3
C&S
System
AssetAsset
Purpose
Asset Type 1
Asset Type 2
Y - Y -
- - - Y
- - - Y
- Y - -
Y
-
-
Y

Methodology for Network Output Measures
Version 1.0 Page 28 of 45
Elicitation of the Frequency of Asset Failure
To determine frequency of asset failure and its change over time we have developed
models derived from a formal expert elicitation process. We use elicited information to
supplement the data in the system as typically time-based data in systems do not present
evidence of the full life of assets and their behaviours. This is generally where assets are
replaced before the end of their useful lives. Other reasons relate to the fact that defects
data may not cover a sufficiently long observation period. In order to determine on the
basis of cost benefit and risk performance when in the future to replace or refurbish
equipment, deterioration models based on expert elicitation have been generated. A
number of key elements are vital to ensuring that the models are fit for purpose. These
are:
1. a wide variety of experience is consulted;
2. the information captured is not directly about the model form/shape, but rather
information/data points used to derive the final models;
3. the information is captured as point estimates and also with the uncertainty
around the estimates;
4. the information is provided by individuals rather than through a single consensus
– this provides the opportunity to explore where variability is arising;
5. the resultant model curves are reviewed by the group and a consensus agreed
together with the sensitivity ranges to be tested; and
6. the outputs from use of the models are benchmarked against industry models
and any significant differences are tested through further sensitivity analysis and
validated with NGGT and industry experts.
We have developed four model types from this elicitation process:
Repairable failure model versus Age – used to calculate the failure rates and the
deterioration over time that when it fails, can be restored;
Non-repairable failure model versus Age (i.e. End of Life Probability) – used
when the asset fails and cannot be restored and therefore requires replacement;
and
Asset Health versus Age model – which is used to determine the Effective Age of
assets given Asset Health
Elicited failure rate models are combined with the defects data failure rates to ensure that
the starting failure rates are reflective of the current asset base. Where failure rates are
not available from defects data, then we use the elicited models only.
The diagram below summarises the steps undertaken to derive the Elicited models for
different asset types.

Methodology for Network Output Measures
Version 1.0 Page 29 of 45
Defects Data and Derived Frequency of Potential Asset Failure
Defects data is captured against individual equipment assets. Historically captured asset
defects data has been used to define the steady state failure rate for each asset type. The
diagram below shows the way in which steady state failure rates have been calculated for
each asset type.
Combining the Elicited and Defects Data Models to Determine Frequency of
Failure
The Effective Age is the True Age of the asset for ICA (Instrumentation and Control
Assets) and Electrical assets. For all other assets the Effective Age is determined using
the Asset Health Model which is based on expert elicited information. The Effective Age is
in turn used to drive the elicited failure rate models (Repairable and End of Life). This is
represented in the diagram below.
Capture data points from experts using
formal survey
Use appropriate statistical process to
derive curve
Combine with Defect Data Model to give
resultant Failure
Frequency
End of Life Model –
Weibull Curve
Repairable Failure
Model – Bi-Weibull
Asset Health Model –
Condition Curve
Hazard rate per year of an
End of Life event
Repairable failure rate per
year
Effective Age of the asset
given Asset Health
Nr of work defects by Asset Type
Divide by Nr of Assets for each
Asset Type
Divide by Nr of years in observation period
Defects DataFailure Rate Per
Year
Asset Health Model – Condition Curve
Effective Age of the Asset given Asset Health
Time
En
d o
f L
ife
Fa
ilu
re
rate
Median Time
to Failure
Hazard Rate
Curve
True Age
Age
As
se
t H
ea
lth
gra
de
Effective Age
Age
Re
pa
ira
ble
Fa
ilu
re
rate
Deterioration point (Gamma)
Bi-Weibull
Repairable
Failure
Rate Curve
Asset Health
Curve
Calculate the
repairable failure rate
Calculate the end of
life hazard rate
Use defect data failure rate as
steady state where available
Methodology for Network Output Measures
Version 1.0 Page 30 of 45
Where models driven by actual defects data are available, these are used to replace the
elicited steady state part of the Repairable failure model which is indicated by the grey
shaded area of diagram above. The defects data failure rates are used to ensure that the
starting failure rates are reflective of the current asset base. Where failure rates are not
available from defects data, then we use the elicited models only.
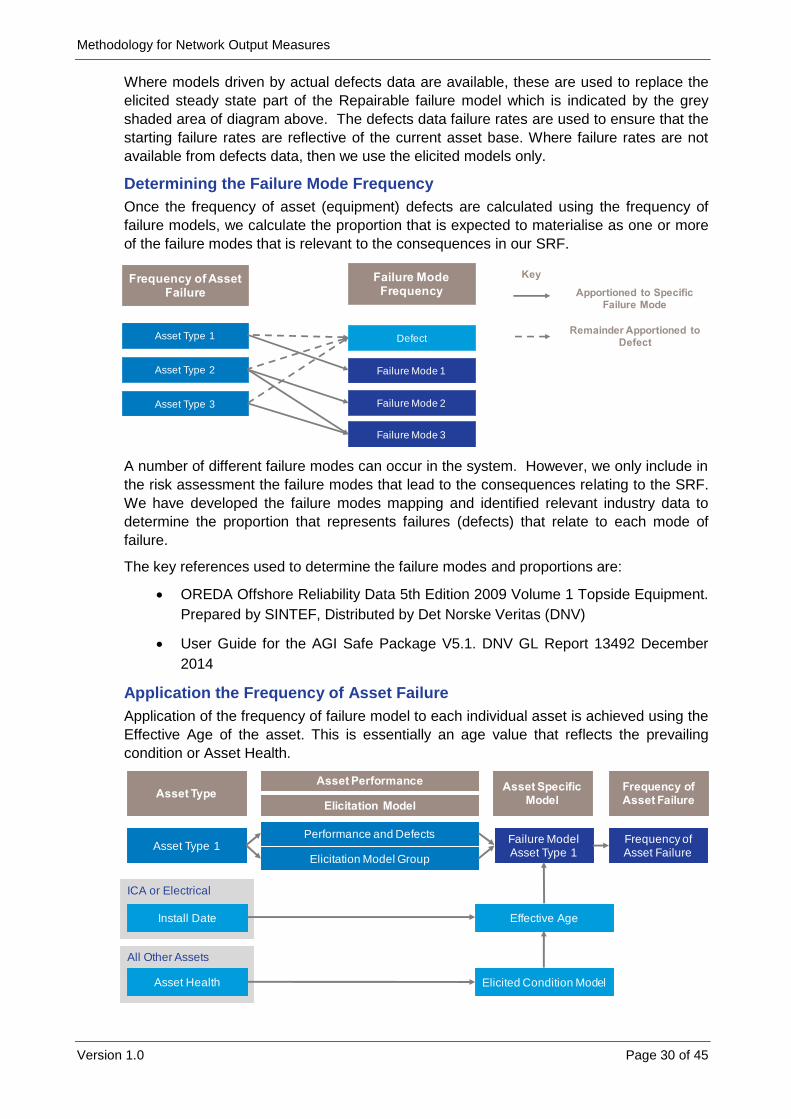
Determining the Failure Mode Frequency
Once the frequency of asset (equipment) defects are calculated using the frequency of
failure models, we calculate the proportion that is expected to materialise as one or more
of the failure modes that is relevant to the consequences in our SRF.
A number of different failure modes can occur in the system. However, we only include in
the risk assessment the failure modes that lead to the consequences relating to the SRF.
We have developed the failure modes mapping and identified relevant industry data to
determine the proportion that represents failures (defects) that relate to each mode of
failure.
The key references used to determine the failure modes and proportions are:
OREDA Offshore Reliability Data 5th Edition 2009 Volume 1 Topside Equipment.
Prepared by SINTEF, Distributed by Det Norske Veritas (DNV)
User Guide for the AGI Safe Package V5.1. DNV GL Report 13492 December
2014
Application the Frequency of Asset Failure
Application of the frequency of failure model to each individual asset is achieved using the
Effective Age of the asset. This is essentially an age value that reflects the prevailing
condition or Asset Health.
Failure Mode 2
Failure Mode 3
Asset Type 1
Asset Type 2
Asset Type 3
Failure Mode 1
Defect
Failure Mode Frequency
Frequency of Asset Failure
Key
Apportioned to Specific Failure Mode
Remainder Apportioned to Defect
All Other Assets
ICA or Electrical
Asset Type
Asset Type 1Failure Model Asset Type 1
Performance and Defects
Elicitation Model Group
Install Date
Asset Health Elicited Condition Model
Effective Age
Elicitation Model
Asset Specific Model
Asset Performance
Frequency of Asset Failure
Frequency of Asset Failure

Methodology for Network Output Measures
Version 1.0 Page 31 of 45
The Effective Age is important where assets are highly maintained or maintained to
different degrees across the asset base. In these circumstances, a better indicator of the
potential to fail is the effective age not the true age.
As an exception to using Asset Health as an indicator of Effective Age, we have
considered that ICA and Electrical equipment do not show obvious outward signs of asset
health degradation. As such, we assume the true age as the Effective Age of ICA and
Electrical equipment.
Once the Effective Age is available, we are then able to apply the full failure model to
predict the failure rate of an individual equipment asset for each year over the next 25 to
40 years. There are around 250 asset type based failure rates that are combined with 50
different Elicitation Group models.
5.3. CONSEQUENCE OF FAILURE
Further details can be found in the Consequence of Failure supporting document. Once
the failure mode frequency has been calculated for each individual item of equipment in
the asset hierarchy, the consequences of failure need to be determined. In calculating the
consequence of asset failure we consider a number of elements before we are able to
value the consequence. These are:
Probability of consequence
Severity of consequence
Quantity of consequence
The assessment is developed in this way to ensure that the final risk assessment can be
valued in monetary terms.
The consequences that result from asset failure are lined link to a relevant measure on
the SRF. For example, an asset failure that presents as a gas leak could potentially lead
to a fire. The fire in turn could lead to an injury or impact on transport.
The figure below shows how the consequential effects link to the Service Risk Framework.
The following sections describe how each of the consequential effects, their probabilities,
severities and quantities of impact are determined and applied.

Methodology for Network Output Measures
Version 1.0 Page 32 of 45
Fire and Explosion
The logic diagram below above summarises the conditions that lead to fire, and those that
lead to explosion for Sites assets.
Health and Safety
Following a fire or explosion, the methodology considers that there is the potential for
impact on health and safety of employees and members of the public. The methodology
determines this in two steps: severity of the incident, and the quantity of people potentially
affected.
Fire
Explosion
Emissions
Metering Shrinkage
Environmental
Site / Unit Unavailable
Increased Maintenance
Health and Safety
Transport Disruption
Volume of Emissions
Shrinkage
Environmental Incidents
Properties Impacted by NoiseNoise
£ Impact of Constraints
£ Impact of Increased Maintenance
Asset
Congested
Not Congested
Major Leak
Minor Leak
Delayed Ignition
Delayed Ignition
Fire
Explosion SIL System Failure
Fire
Explosion
Major Leak
Minor Leak
Immediate Ignition
Immediate Ignition
Fire
Fire
Only for
Compressor
Sites and St
Fergus
SIL System
Failure
Fre
qu
en
cy o
f F
ire
s a
nd
Exp
losio
ns
Immediate Ignition
Fire
Fire
Fire
Immediate Ignition
Fire

Methodology for Network Output Measures
Version 1.0 Page 33 of 45
Transport Disruption
In order to calculate the disruption caused to traffic from a leak, fire or explosion incident
the cordon distances within the NGGT Incident Procedures have been used. These
cordon distances have been applied to each site and the affected transport routes
identified. A time to release the cordon has been used to determine the duration of the
incident.
Availability and Reliability
For purposes of testing the Methodology we have considered national demand for a
winter day, in combination with credible, localised supply scenarios (within licence
obligations). Since localised supplies could be as high at summer demand levels as in this
winter scenario, this approach is appropriate for ensuring that the NTS remains resilient to
cope with a range of supply and demand conditions. Supply conditions are market-driven
and we must ensure that Asset Health investments are best targeted to maintain the
flexibility to meet customer needs for the future. The approach is summarised below:
Proportionate Split
Fatality
Major InjuryLost Time Injury
Near Misses
HSE Riddor Industry
Data and National Grid Data
PublicGIS / Spatial Query
Hazard Area and Occupancy
EmployeeNo’ Work Orders
Average
Duration/8
No’ of Fires
No’ of Explosions
Frequency of Consequence
Quantity of Consequence
Severity of Consequence
* See Fires / Explosions
No’ of Fires
No’ of Explosions
GIS / Spatial Query Transport Routes in
Cordon Area
Duration - Time to Release Cordon
* See Fires / Explosions
Frequency of Consequence
Quantity of Consequence
Severity of Consequence
Methodology for Network Output Measures
Version 1.0 Page 34 of 45
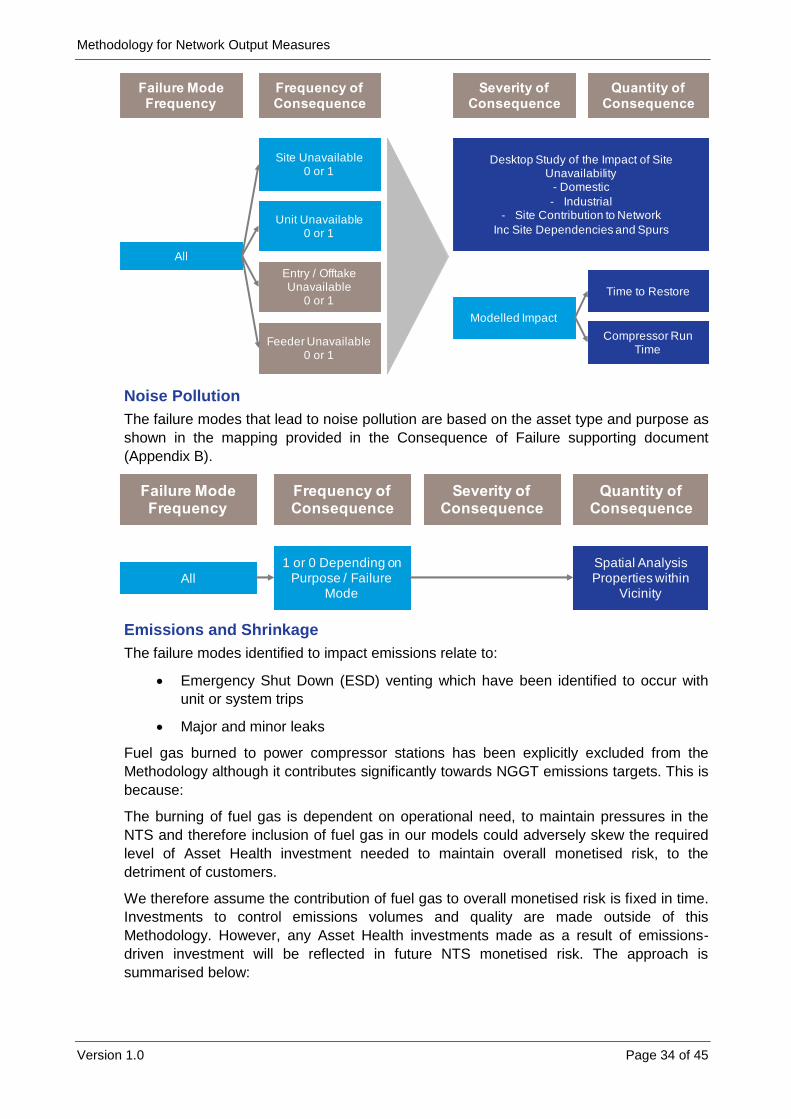
Noise Pollution
The failure modes that lead to noise pollution are based on the asset type and purpose as
shown in the mapping provided in the Consequence of Failure supporting document
(Appendix B).
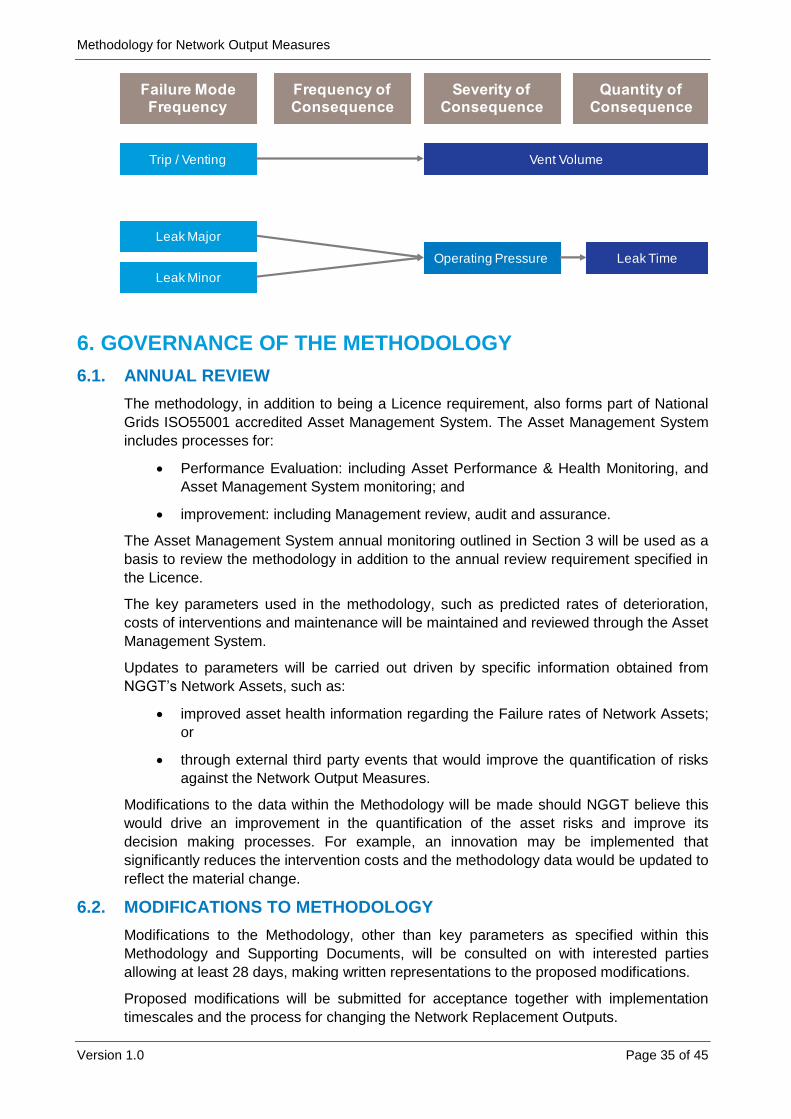
Emissions and Shrinkage
The failure modes identified to impact emissions relate to:
Emergency Shut Down (ESD) venting which have been identified to occur with
unit or system trips
Major and minor leaks
Fuel gas burned to power compressor stations has been explicitly excluded from the
Methodology although it contributes significantly towards NGGT emissions targets. This is
because:
The burning of fuel gas is dependent on operational need, to maintain pressures in the
NTS and therefore inclusion of fuel gas in our models could adversely skew the required
level of Asset Health investment needed to maintain overall monetised risk, to the
detriment of customers.
We therefore assume the contribution of fuel gas to overall monetised risk is fixed in time.
Investments to control emissions volumes and quality are made outside of this
Methodology. However, any Asset Health investments made as a result of emissions-
driven investment will be reflected in future NTS monetised risk. The approach is
summarised below:
All
Site Unavailable0 or 1
Modelled Impact
Time to Restore
Compressor Run Time
Failure ModeFrequency
Unit Unavailable0 or 1
Entry / Offtake Unavailable
0 or 1
Feeder Unavailable0 or 1
Desktop Study of the Impact of Site Unavailability
- Domestic
- Industrial- Site Contribution to Network
Inc Site Dependencies and Spurs
Frequency of Consequence
Quantity of Consequence
Severity of Consequence
1 or 0 Depending on Purpose / Failure
ModeAll
Spatial Analysis Properties within
Vicinity
Failure ModeFrequency
Frequency of Consequence
Quantity of Consequence
Severity of Consequence
Methodology for Network Output Measures
Version 1.0 Page 35 of 45
6. GOVERNANCE OF THE METHODOLOGY
6.1. ANNUAL REVIEW
The methodology, in addition to being a Licence requirement, also forms part of National
Grids ISO55001 accredited Asset Management System. The Asset Management System
includes processes for:
Performance Evaluation: including Asset Performance & Health Monitoring, and
Asset Management System monitoring; and
improvement: including Management review, audit and assurance.
The Asset Management System annual monitoring outlined in Section 3 will be used as a
basis to review the methodology in addition to the annual review requirement specified in
the Licence.
The key parameters used in the methodology, such as predicted rates of deterioration,
costs of interventions and maintenance will be maintained and reviewed through the Asset
Management System.
Updates to parameters will be carried out driven by specific information obtained from
NGGT’s Network Assets, such as:
improved asset health information regarding the Failure rates of Network Assets;
or
through external third party events that would improve the quantification of risks
against the Network Output Measures.
Modifications to the data within the Methodology will be made should NGGT believe this
would drive an improvement in the quantification of the asset risks and improve its
decision making processes. For example, an innovation may be implemented that
significantly reduces the intervention costs and the methodology data would be updated to
reflect the material change.
6.2. MODIFICATIONS TO METHODOLOGY
Modifications to the Methodology, other than key parameters as specified within this
Methodology and Supporting Documents, will be consulted on with interested parties
allowing at least 28 days, making written representations to the proposed modifications.
Proposed modifications will be submitted for acceptance together with implementation
timescales and the process for changing the Network Replacement Outputs.
Leak Major
Trip / Venting Vent Volume
Leak Minor
Operating Pressure Leak Time
Failure ModeFrequency
Frequency of Consequence
Quantity of Consequence
Severity of Consequence

Methodology for Network Output Measures
Version 1.0 Page 36 of 45
6.3. DATA ASSURANCE
Standard Special Condition A55 Data Assurance requirements (DAG) requires NGGT to
undertake processes and activities for the purpose of reducing risk, thereby managing the
subsequent impact and consequences of any inaccurate or incomplete reporting, or any
misreporting, of information to the Authority. As part of the Network Data Assurance
Report (NetDAR) submission, we measure and manage the overall risk profile of each
regulatory submission / license obligations via our annual DAG risk assessment process.
The likelihood of the data submission being inaccurate, incomplete or submitted late is
measured via the DAG Probability metric, namely:
data inherit probability: In terms of the data from core systems and / or other
sources, any data source used for the regulatory submission will be risk
assessed in terms of complexity, completeness, extent of manual intervention,
and the application of the reporting rules based on the complexity and maturity.
control framework probability: We manage the controls of the systems used,
processes and governance framework via the Control Framework risk measures,
as specified in DAG guidance document v1.3.
We will take a proactive approach in forward planning our control activities for our
reporting Network Risk Measure and Network Condition Measure under this methodology
via our DAG assessments. For example, activities on controls, procedures, method
statements and audits will be set in place to ensure probability risk on our controls are
managed and improved year on year.
7. DOCUMENT CONTROL
Version Date of Issue Notes
1.0 3rd April 2018 Version for public consultation

Methodology for Network Output Measures
Version 1.0 Page 37 of 45
APPENDIX A – A1. - PIPELINES EXAMPLE
The table below shows an example pipe segment together with results for an indicative
10km pipeline section.

Methodology for Network Output Measures
Version 1.0 Page 38 of 45
Indicative aggregated risk of a 10km pipeline

Methodology for Network Output Measures
Version 1.0 Page 39 of 45
APPENDIX A – A2. - SITE EXAMPLE
The table below shows an example for a single asset on a compressor site.

Methodology for Network Output Measures
Version 1.0 Page 40 of 45
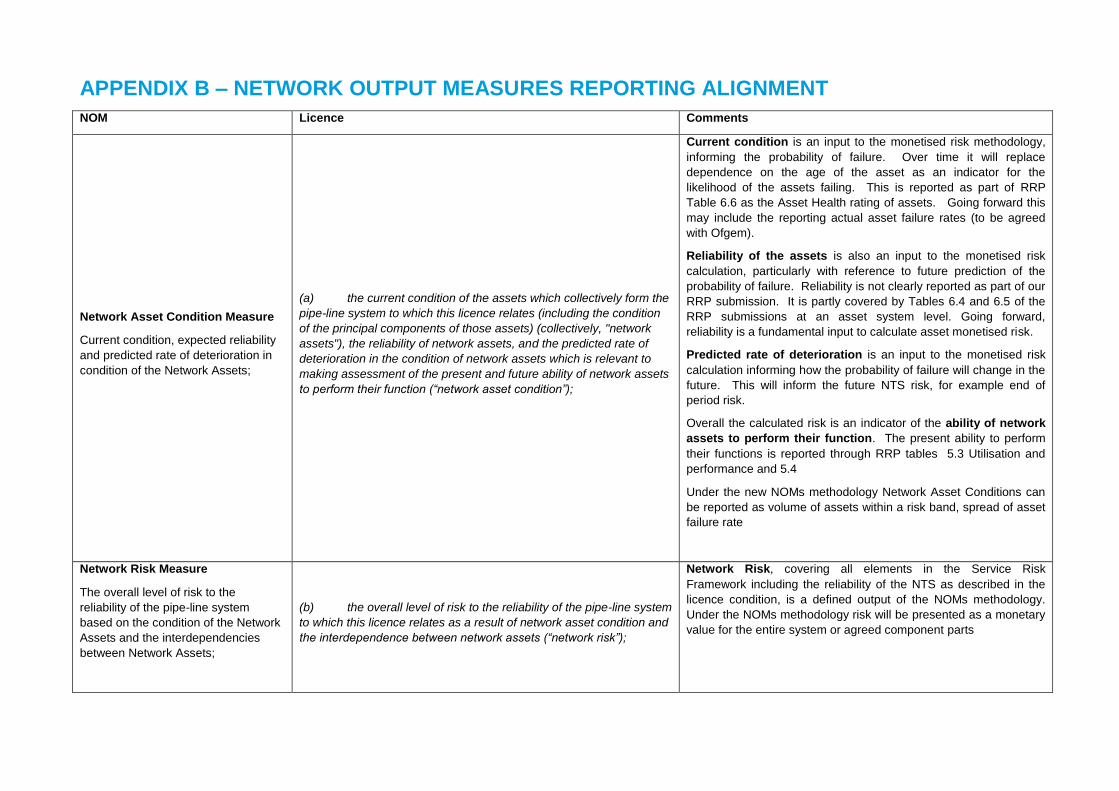
APPENDIX B – NETWORK OUTPUT MEASURES REPORTING ALIGNMENT
NOM Licence Comments
Network Asset Condition Measure
Current condition, expected reliability
and predicted rate of deterioration in
condition of the Network Assets;
(a) the current condition of the assets which collectively form the
pipe-line system to which this licence relates (including the condition
of the principal components of those assets) (collectively, "network
assets"), the reliability of network assets, and the predicted rate of
deterioration in the condition of network assets which is relevant to
making assessment of the present and future ability of network assets
to perform their function (“network asset condition”);
Current condition is an input to the monetised risk methodology,
informing the probability of failure. Over time it will replace
dependence on the age of the asset as an indicator for the
likelihood of the assets failing. This is reported as part of RRP
Table 6.6 as the Asset Health rating of assets. Going forward this
may include the reporting actual asset failure rates (to be agreed
with Ofgem).
Reliability of the assets is also an input to the monetised risk
calculation, particularly with reference to future prediction of the
probability of failure. Reliability is not clearly reported as part of our
RRP submission. It is partly covered by Tables 6.4 and 6.5 of the
RRP submissions at an asset system level. Going forward,
reliability is a fundamental input to calculate asset monetised risk.
Predicted rate of deterioration is an input to the monetised risk
calculation informing how the probability of failure will change in the
future. This will inform the future NTS risk, for example end of
period risk.
Overall the calculated risk is an indicator of the ability of network
assets to perform their function. The present ability to perform
their functions is reported through RRP tables 5.3 Utilisation and
performance and 5.4
Under the new NOMs methodology Network Asset Conditions can
be reported as volume of assets within a risk band, spread of asset
failure rate
Network Risk Measure
The overall level of risk to the
reliability of the pipe-line system
based on the condition of the Network
Assets and the interdependencies
between Network Assets;
(b) the overall level of risk to the reliability of the pipe-line system
to which this licence relates as a result of network asset condition and
the interdependence between network assets (“network risk”);
Network Risk, covering all elements in the Service Risk
Framework including the reliability of the NTS as described in the
licence condition, is a defined output of the NOMs methodology.
Under the NOMs methodology risk will be presented as a monetary
value for the entire system or agreed component parts

Methodology for Network Output Measures
Version 1.0 Page 42 of 45
NOM Licence Comments
Network Performance Measure
The technical performance of assets
that have a direct impact on the
reliability and cost of services provided
as part of the transportation activities;
(c) those aspects of the technical performance of the pipe-line
system to which this licence relates which have a direct impact on the
reliability and cost of services provided by the licensee as part of its
transportation business (“network performance”);
Network Performance relates to the current performance of the
NTS. The performance of the network will continue to be reported
through the metrics in the Tables 5.1 – 5.7 of the annual RRP
submission. Current network performance is an indicator of
effectiveness of historic asset intervention decisions.
The technical aspects that relate to risk of loss of service are
covered against the Network Asset Condition NOM.
Network Capability Measure
The current level of capability and
utilisation of assets to deliver services
to customers
(d) the level of capability and utilisation of the pipe-line system to
which this licence relates at entry and exit points and other network
capability and utilisation factors (“network capability”);
Network Capability is similarly part of the RRP reporting regime.
Changes to Network capability expressed as capacity at Entry and
Exit points are principally driven by the connected customer as we
invest to maintain the obligated capacity.
Elements of capability and utilisation inform the consequence of
failure in the new NOMs methodology. We are proposing that the
elements of the capability and utilisation that have an effect on the
system monetised risk are fixed for a regulatory period.
Network Replacement Outputs
Are used to measure the asset
management performance of National
Grid Gas Transmission (NGGT).
Network Replacement Output as a measure of asset
management will be based on demonstrating the risk reduction that
is forecast to be delivered by intervention compared with the future
risk without investment. Annual reporting of current network risk
will give an indication that the interventions are being made
sustainably to achieve the agreed risk performance.

GLOSSARY Asset Attributes - set of details about the asset such as; type, install year,
condition, etc.
Asset Base - assets that are currently included within the monetised risk calculations as outlined in the Probability of Failure supporting document (Appendix C).
Asset Management - Coordinated activity of National Grid to realise value from its assets by balancing cost, risk and performance benefits.
Asset Purpose - The functional purpose of the asset
Asset Register - National Grid core system holding the individual Asset Base and Asset Attributes.
ALARP - As Low as Reasonably Practicable
Authority - OFGEM – Office of Gas and Electricity Markets
Block Valves - to allow for maintenance and emergency isolation of pipeline sections to meet requirements of IGEM TD/1
CBA - Cost Benefit Analysis
CIPS - Close Interval Potential Survey (CIPS); A secondary validation for buried systems; it provides an indication of the performance of the cathodic protection system to identify defects on the pipeline assets.
Compressor Sites - raises gas pressure in the pipeline system such that required flows and system pressures can be achieved.
DAG - Data Assurance Guidance as specified in Standard Special Condition A55 of the Licence.
EGIG - European Gas Pipeline Incident Data Group
Entry Points - allows gas to enter the network such that gas volumes and gas quality can be measured and controlled as dictated by operational requirements.
Event Tree Analysis - logical modelling technique that explores responses through a single initiating event and plots a path for assessing probabilities of the outcomes and overall system analysis.
Exit Points - connection of the Distribution Networks or Industrial/ Power
Station customers to the Gas Transmission networks
monitors the pressure and measures the gas flowing from
the National Transmission System.
Failure Mode - a way in which a specific asset might fail.
FMECA - Failure Mode Effects and Criticality Analysis
Frequency of Failure - frequency with which an engineered system or component fails, expressed in failures per unit of time
GHG - Greenhouse Gas
HSE - Health and Safety Executive
ICA - Instrumentation and Control Assets
IGEM - Institution of Gas Engineers and Managers
ILI - In Line Inspection Survey; provides the principal validation

Methodology for Network Output Measures
Version 1.0 Page 44 of 45
for pipeline systems; it provides indications of metal loss including orientation, depth and position within the pipe wall.
Key Parameters - elements or data items that can vary either based on improved data quality, increase in historical or performance data, improved intervention & units cost data and changes to external valuation of consequences. The elements and data items of the methodology are Probability of Failure, Consequence of Failure, Intervention and Unit Costs, Service Valuations, Asset Base and Asset Attributes (All elements that are likely to change over time).
Multi-junctions - join pipelines with branched connections and are used to split flow of gas through transmission system and provide multiple routes for gas delivery.
Pipelines - transport gas from one facility to another, in a safe and reliable manner, from the entry points to the exit points at the end of the transmission system.
Proactive Investment An investment justified based on monetised risk reduction over the life of an asset. Generally, these are investments that we can choose to do (see Reactive Investment)
Probability of Consequence - the likelihood (probability) of occurrence of each consequence
Probability of Failure - Is the likelihood that a piece of equipment will fail at a given time
Quantity of Consequence - the scale or volume of the consequence
QRA - Quantitative Risk Assessment
Reactive Investment An investment undertaken based on 1) actual failure e.g. a repair 2) policy e.g. maintenance, obsolescence 3) legislation e.g. PSS. In general, we cannot choose to do these investments as they are either mandatory, to maintain an acceptable level of asset performance or meet legislative requirements to avoid prosecution.
RIG - Regulatory Instructions and Guidance as specified in Standard Special Condition A40 of the Licence
RRP - Regulatory Reporting Pack
SIL - Safety Integrity Level – referenced in IEC 61508 ‘International Standard for electronic and programmable electronic safety related systems’ which requires SIL to be set and maintained for protective systems.
SIS - Safety Instrument System
Service Risk Framework - a consistent method of assessing and articulating the consequence of that asset failure and the service valuations
Service Risk Measure - Elements of the Service Risk Framework with specified service valuations
Treasury Green Book - HM Treasury guidance for public sector bodies on how to appraise proposals before committing funds to a policy, programme or project.
UKOPA - United Kingdom Onshore Pipeline Operators’ Association
Uniform Network Code - the legal and contractual framework to supply and transport

Methodology for Network Output Measures
Version 1.0 Page 45 of 45
gas within the United Kingdom. It has a common set of rules which ensure that competition can be facilitated on level terms.
Whole Life Benefit - the total direct financial and monetised risk benefit delivered by an intervention over the life of the intervention. This is total Whole Life Cost and Whole Life Risk with and without intervention.
Whole Life Cost - the total cost of an asset over its whole life, taking account of the initial capital cost, as well as operational, maintenance, repair, upgrade and eventual disposal costs.
Whole Life Risk - the total monetised risks of an asset over its whole life, taking into account all of the value of potential consequences of the failure of the asset.


![NGET An.nn [document title] - National Grid plc](https://img.pdfslide.net/doc/110x75/623fdf194029604cc2040bbc/nget-annn-document-title-national-grid-plc.jpg)


![NGET An.nn [document title] - National Grid](https://img.pdfslide.net/doc/110x75/617c027f1d7b0172d27b341b/nget-annn-document-title-national-grid.jpg)