Embed Size (px)
Citation preview


ABRIDGED EDITION
Technical cooperation as an aid modality: Demand-led or donor-driven?
The Reality of Aid
REALITY OF AID 2016 REPORT

i
Technical cooperation as an aid modality: Demand-led or donor-driven?ABRIDGEDPublished in the Philippines in 2016 by IBON InternationalIBON Center, 114 Timog Avenue, Quezon City 1103, Philippines
Copyright © 2016 by The Reality of Aid International Coordinating Committee
Writer/Editor: Brian Tomlinson
Copy editor: Erin Ruth Palomares
Layout and Cover Design: Jennifer Padilla
Cover Photos: UN Photo/John Pierre Laffont UN Photo.flicker.com UN Photo/Ray Witlin
Printed and Bound in the Philippines by Zoom Printing Co.
Published with the assistance of:
All rights reserved
ISBN: 978-971-9657-08-8
Coalition of the Flemish North-South Movement

Contents
1 The Reality of Aid Network
3 Acknowledgments
5 Preface
7 Undermining Democratic Country Ownership:
Embedding northern development agendas through technical cooperation?
The Reality of Aid Network International Coordinating Committee
17 Global Aid Trends, 2016
Financing Agenda 2030: Where are the resources?
Brian Tomlinson, AidWatch Canada
81 Articles in the 2016 Report
83 RoA Members Directory


1
The Reality of Aid Network
The Reality of Aid Network exists to promote national and international policies that contribute to new and effective strategies for poverty eradication built on solidarity and equity. Established in 1993, the Reality of Aid is a collaborative, non-profit initiative, involving non-governmental organisations from North and South. It is in special consultative status with the United Nations Economic and Social Council (ECOSOC).
The Reality of Aid publishes regular, reliable reports on international development cooperation and the extent to which governments, North and South, address the extreme inequalities of income and the structural, social and political injustices that entrench people in poverty.
The network has been publishing reports and Reality Checks on aid and development cooperation since 1993.
These reports provide a critical analysis of how governments address the issues of poverty and whether aid and development cooperation policies are put into practice.
The Reality of Aid International Coordinating Committee is made up of regional representatives of all participating agencies.
REALITY OF AID NETWORK International Coordinating Committee (2016)
Kavaljit Singh
Chairperson
Madhyam148, Maitri Apartments, Plot #28, Patparganj I.P., Delhi, IndiaTel: 91-11-430-36919Email: [email protected] www.madhyam.org.in
Vitalice Meja
Reality of Aid Africa
Wanandege Flats Appt 4D Kirichwa Road Kilimani P.O.Box 36851 - 00200 Nairobi Kenya Tel: + 254 202345762/ 254 704353043 Email: [email protected] www.roaafrica.org

2
Yodhim dela Rosa
Reality of Aid Asia Pacific
3/F IBON Center, 114 Timog Avenue Quezon City 1103, Philippines Tel: +63 2 9277060 Telefax: +63 2 9276981 Email: [email protected]
Alberto Croce
Representing Latin American CSO members
Red Latinoamericana de Deuda, Desarrollo y Derechos (LATINDADD) Fundación SES San Martín 575 6°A Buenos Aires, Argentina Tel: +54 11 5368 8370 Email: [email protected] www.fundses.org.ar
Jeroen Kwakkenbos
Representing European Country CSO members
European Network on Debt and Development (EURODAD) Rue d’Edimbourgh 18-26 1050 Brussels, Belgium Tel: +32 2 8944645 Fax: +32 2 7919809 Email: [email protected] www.eurodad.org
Fraser Reilly-King
Representing non-European OECD CSO members
Canadian Council for International Cooperation (CCIC) 450 Rideau Street, Suite 200 Ottawa, Ontario, K1N 5Z4 Tel: +01 613 2417007 Fax: +01 613 2415302 Email: [email protected] www.ccic.ca
Erin Ruth Palomares
Global Secretariat Coordinator
3/F IBON Center, 114 Timog Avenue Quezon City 1103, Philippines Tel: +63 2 9277060 Telefax: +63 2 9276981
Email: [email protected]
www.realityofaid.org

3
Acknowledgments
The Reality of Aid 2016 Report is written by authors from civil society organisations worldwide whose research draws on knowledge and expertise from aid agencies, academia, community-based organisations and governments. We would like to thank those who have generously contributed their knowledge and advice.
Overall editorial control of the Reality of Aid 2016 Report lies with the Reality of Aid International Coordinating Committee, but the views expressed in the reports do not necessarily reflect the views of the International Coordinating Committee, or of IBON International that published this Report.
The International Coordinating Committee was assisted by Brian Tomlinson as Content Editor, and Erin Ruth Palomares as Managing Editor.
This Reality of Aid 2016 Report is published with support from 11.11.11-Coalition of the Flemish North-South Movement.


5
Preface
The Reality of Aid Reports analyze and advocate key messages relating to the performance of aid donors from a unique perspective of civil society in both donor and recipient developing countries. The RoA Reports have established themselves as a credible corrective to official publications on development assistance and poverty reduction. They have also developed a reputation as an important independent comparative reference for accountability and public awareness of development issues.
Technical cooperation remains one of the most heavily used forms of aid, accounting for between a quarter and a half of all ODA. However, to date it seems that technical cooperation remains largely insulated from donors’ efforts to improve the quality and effectiveness of their aid, largely ignoring the principles of democratic ownership and partnership.
An examination of technical cooperation should focus on the relationship between technical cooperation and capacity building initiatives by aid providers and commitments towards strengthening democratic country ownership. Policy space for democratic ownership, where people’s voices and interests can shape government development initiatives, is vital if technical assistance is to be effective in building capacity for sustainable poverty reduction. Are recipient developing countries free to decide, plan, and sequence their economic policies to fit with their own development strategies? How can technical assistance as a disguised or soft form of policy conditionality be avoided? What reforms are needed on the part of aid providers in their approaches to technical cooperation that is consistent with their commitment to ownership? How can developing countries’ governments and other recipients of technical assistance create the conditions to manage this form of cooperation in their own interests?
Contributors to this Report explored the following: role of technical assistance in bilateral donors’ and multilateral development banks’ aid, technical cooperation for trade and infrastructure development, technical cooperation and tied aid, and South-South experience in technical cooperation. Comprised of 23 contributions, this 2016 RoA Report provides analyses relating to the performance of aid donors in the provision of technical assistance from a unique perspective of civil society, in both donor and recipient developing countries, with a focus on poverty reduction.
Kavaljit Singh
ChairpersonThe Reality of Aid Network


7
The 2015 Addis Ababa Agenda for Action (AAAA) established a holistic and forward-looking framework that brings together the financial means to implement Agenda 2030 for sustainable development, including an ambitious set of Sustainable Development Goals (SDGs) to chart development progress in ways that leave no one behind. Official Development Assistance (ODA) is an essential pillar of this framework, as its resources are meant to focus on the development needs of the poorest populations and countries.
The AAAA emphasizes the importance of “continued efforts to improve the quality, impact and effectiveness of development cooperation and other international efforts in public finance, including adherence to agreed development cooperation effectiveness principles.” (§58) Central to these principles is democratic country ownership, transparency and accountability, a focus on results closely linked to partner country priorities, and untying aid from donor country economic interests.
Technical assistance, later more commonly referred to as a technical cooperation (TC), and capacity development has had a long and controversial history as a means for delivering development change through aid. Technical cooperation, whether through training programs, capacity building, or provision of donor-recruited technical expertise, has been identified as crucial to Agenda 2030. The AAAA cites technical cooperation as vital to supporting the following efforts: increases in domestic resource mobilization in developing countries (§28); building local capacities (§34); the promotion of micro, small and medium-sized enterprises (§43);the implementation of investment promotion regimes for low income countries (§46); realisation of infrastructure plans (§47); and, the fostering of aid for trade capacities (§90).
The 2016 Reality of Aid Report civil society analysts draws on a range of country case studies focusing on the continued use and scale of technical cooperation to drive donor agendas in development cooperation. A central question in these reviews was the extent to which the provision of technical cooperation is consistent with, and takes account of, development effectiveness principles, which have been agreed to over the past decade. Where does TC fit in the
context of these principles? How does it relate to new global agendas like Agenda 2030, the Paris Agreement on Climate Change or the Sendai Framework for Disaster Risk Reduction? How “fit for purpose” is technical cooperation for achieving these agendas? Several contributions have critiqued technical cooperation inside a human rights and development effectiveness framework. This overview chapter draws some lessons and conclusions based on these assessments.
1. Shifting views in donor discourse:
From technical assistance to cooperation
and capacity building
A focus on technical assistance by donors dates from the 1970s into the 1990s. In this period, donors emphasized the value of providing personnel to recipient countries with skills, know-how and advice, primarily from their donor country. Widespread gaps in basic management and skills capacities in many developing countries, particularly in the poorest post-colonial new states, were understood during this period of development cooperation to be major barriers to progress.
In this era, bilateral providers extensively employed technical assistance to prepare and implement development projects to ensure the realisation of donor-determined outcomes in service delivery or infrastructure. At the multilateral level, technical assistance was a key resource deployed by the World Bank, alongside policy conditionality, to embed neo-liberal structural adjustment programs in the 1980s and 1990s in many developing countries.
In the past twenty years, there have been many shifts in views on development and the means to achieve progress. Greater emphasis is now placed on cooperation for poverty reduction – inside a context where ‘country ownership’ of development priorities is respected. Equally important are local participation and good governance as critical pre-conditions for sustainable outcomes. Increasingly there has been an emphasis on the value of south-south and triangular exchanges for the development of relevant skills and knowledge transfers and learning. Since the
Undermining Democratic Country Ownership:
Embedding northern development agendas
through technical cooperation?
Reality of Aid Coordinating Committee 1

The Reality of Aid 2016 Report
8
1990s, technical assistance has morphed into “technical cooperation,” with a stress on training and entrenching skills’ transfers. The focus is on capacity development through which developing country actors manage their own development priorities.
According to the OECD Development Assistance Committee (DAC),
“Technical co-operation (also referred to as technical assistance) is the provision of know-how in the form of personnel, training, research and associated costs. … It comprises donor-financed:
• Activities that augment the level of knowledge, skills, technical know-how or productive aptitudes of people in developing countries; and
• Services such as consultancies, technical support or the provision of know-how that contribute to the execution of a capital project.”2
Following the 2005 Paris Declaration for Aid Effectiveness,3 the provision of technical cooperation became closely related to “capacity development” as indicated in the following quote:
“Capacity development is the responsibility of partner countries with donors playing a support role. It needs not only to be based on sound technical analysis, but also to be responsive to the broader social, political and economic environment, including the need to strengthen human resources.” [§22]
During this Paris meeting donors committed to “align their analytic and financial support with partners’ capacity development objectives and strategies, make effective use of existing capacities and harmonize support for capacity development accordingly.” [§24]
In 2006, the DAC published The Challenge of Capacity Development, Working towards good practice. This document provided an important guide for TC based on a review of technical cooperation and various forms of capacity development based on over 40 years of donor experience.4 Much of these findings and advice continue to be relevant today.
At the Accra High Level Forum in 2008, aid providers agreed that their “support for capacity development will be demand-driven and designed to support country ownership.”
5 [Accra Agenda for Action (AAA, §14] Together with partner country governments they committed in the AAA to:
“i) Jointly select and manage technical co-operation; andii) Promote the provision of technical co-operation by local and regional resources, including through South-South Co-operation.” [§14b]
Inexplicably, however, after 2010, donor commitments to reforming technical cooperation / capacity development have not been a major discussion point in donor discourse on effective development cooperation. For example, the 2011 Busan Partnership for Effective Development Cooperation, which adopted the Paris Declaration commitments, gave TC only cursory attention, identifying it as a factor in aid providers’ commitments to use partner country institutions and procurement systems in aid provision. There is no reference to demand-driven technical cooperation.
Yet technical cooperation continues to be a significant resource in ODA, and an important means for the achievement of the different SDGs over the next 15 years.
2. The scale of technical cooperation in aid
allocations
In 2014, the DAC recorded a total of US$19.5 billion in free-standing technical cooperation (TC), which made up 14% of Real ODA (ODA less debt cancellation, imputed students and refugee expenses in donor countries). As indicated in Chart One below, this represented a sharp decline from 2005 when TC accounted for 27% of Real ODA. This drop is even more striking given that ODA has increased since 2005 (see the Aid Trends chapter in this Report); yet these increases in overall ODA have seemingly not been translated into increases in free-standing technical cooperation.
It is important to note that DAC statistics do not present a complete accounting of TC inside ODA. OECD DAC statistics only track “free-standing technical cooperation” – provision of expertise for training or skills transfer (capacity development) initiatives. They therefore under-estimate total TC as DAC donors and multilateral institutions do not report on donor-provided expertise within projects (i.e. assisting in their preparation and technical implementation).

9
Undermining Democratic Country Ownership: Embedding northern development agendas through technical cooperation?
Technical cooperation delivered through multilateral institutions, particularly the International Development Association (the concessional lending window of the World Bank), has also declined as a share of total TC. In 1980 multilateral TC made up 27% of total TC, but only 11% in 2014.
This leaves bilateral aid providers who are currently the primary providers of TC. Three in particular, according to DAC statistics, have prioritized TC in their ODA. In 2014, Germany, France and Japan, among the top five DAC donors, channelled 54%, 41% and 33%, respectively, of their real bilateral assistance into TC. This compares with an average of 18% for all bilateral DAC donors.6 When excluding the United States (see footnote 6 for an explanation), TC made up approximately 25% of total real bilateral aid for all other DAC donors in 2014.
While technical cooperation remains a crucial resource of development cooperation, its use and focus, and in particular how it is implemented relative to core principles of development effectiveness, remain largely unanalyzed.7
3. Modalities and roles of technical
cooperation in ODA
Official statistics reveal little about the forms of technical cooperation. In practice TC can involve a wide range of activities, from university research to long-term foreign experts placed in developing country ministries, co-operant exchanges organized by CSOs, training courses, or short-term consultants on special assignments.8
While the forms and emphasis in technical cooperation have varied over the past four decades, its stated rationale has remained constant. TC is consistently focused on filling largely donor-perceived gaps in skills and/or institutional competences to more effectively deliver development outcomes. As noted above, the 2005 Paris Declaration’s emphasis on “aid effectiveness,” included a commitment by donors to be guided by “demand-driven” TC, gaps and institutional needs explicitly identified by developing country partners. In this policy context, TC was to be a resource to strengthen partner country ownership
Chart 1: Technical Cooperation as a Percentage of Real ODA

The Reality of Aid 2016 Report
10
of development priorities and to enhance domestic skills to ensure the achievement of country-determined development outcomes. An examination of various case studies, as outlined in this report and others, indicates that the reality has fallen far short of these ideals.
The report’s case studies identify substantive roles for TC, many which have been consistent in aid provider practices over these decades. These roles include:
• Embedding provider technical assistants (TAs) in government ministries to develop specific capacities and/or improve the technical standards for institutional processes (such as procurement or tax policies);
• Embedding provider TAs within projects to cover needed technical skills to design and build infrastructure;
• Providing policy advice, often accompanying World Bank loan conditions or WTO or regional trade agreements.
• Providing advice to influence government legislation and regulations in areas seen (by aid providers) to be critical for development progress; and
• Sharing experiences through South-South Cooperation (SSC) and/or civil society networks drawing on expertise from similar development conditions and realities.
It is difficult to measure the scale or value of these roles, relative to total TC disbursements, as there is little data available on TC projects and undertakings. Nevertheless, CSO authors in this report provided an assessment of the impact of TC through various country case studies. Their reference point is not just effective delivery of technical projects, but also people-centred development paradigms, where peoples’ interests and voice are able to shape government and civil society development initiatives.
Reality of Aid asked authors to address a number of questions to help make links between trends in the deployment of technical cooperation and aid provider commitments to the Busan principles for effective development cooperation.9 An important focus was the examination of how TC can contribute – or undermine - the space and opportunities for democratic country ownership. Specifically, the questions were:
• Is technical cooperation limiting policy space for developing countries to freely choose and implement policies to enable development strategies?
• Is technical cooperation being employed as a “soft form” of policy conditionality?
• What approaches on the part of aid providers will enable the provision of technical cooperation consistent with country ownership?
• How can the recipients of technical cooperation create conditions for developing countries to manage technical cooperation in their own interest?
The country case studies highlight the continued political role of TC within aid and development cooperation. They demonstrate that TC often promotes donor-inspired paradigms for governance, export-led development, and private sector partnerships at the expense of peoples’ rights and the strengthening of partner country policy space.
4. Trends and issues in the deployment of
technical cooperation
By 2005 academic research and institutional evaluations had documented a growing consensus, even among aid providers, that traditional technical assistance, as implemented over previous decades, had largely failed to deliver sustained change. In a damming critique written in 2005, development specialist Roger Riddell provided this assessment of World Bank’s capacity building work in Africa:
“More generally, a major ten-year review of the World Bank’s efforts at supporting capacity building in Africa … makes grim reading. Acknowledging the weaknesses and ineffectiveness of traditional approaches to capacity development, the Bank admits that its attempt to focus more directly on helping to strengthen public institutions in Africa continues to be a huge challenge, and that in its more recent efforts, a range of key weaknesses remain. … Capacity development efforts remain insufficiently led by the recipient countries, and based on insufficient knowledge about precisely what to do and how to do it.”10
According the report’s case studies, these statements are still relevant. This, despite the attention to partner-country –focused “capacity development” in more recent times. The Bangladesh chapter concludes that “country ownership, alignment and effectiveness are largely absent” in TC for Bangladesh aimed at strengthening the performance and capacity of public institutions and public procurement. The Uganda case study similarly highlights examples of TC that are generally not aligned with national

11
Undermining Democratic Country Ownership: Embedding northern development agendas through technical cooperation?
development strategies or strengthening national systems – despite aid providers’ affirmation of country ownership as a guiding principle.
Reality of Aid authors have identified three critical issues related to the goals and delivery of technical cooperation by aid providers. All three, which are described below, have the potential to undermine country ownership and the implementation of the 2011 Busan principles for effective development cooperation.11
a) The tendency to prioritize aid provider interests to realize specific donor-determined results and avoid risk in aid delivery, irrespective of the needs of partner country counterparts.
For many recipient countries, TC is largely supply-driven and organized to meet aid providers’ interests. In particular, aid providers employ TC to manage and safeguard the deployment of aid in ways that ensure implementation of donor cooperation objectives. DAC donors’ pre-occupation with the achievement of short-term results increasingly drives their aid priorities – pushed by increasing domestic political pressure to produce tangible results. TC experts and consultants are usually selected by aid providers and therefore are primarily accountable to them. Their mandate includes strong expectations to maintain control over the delivery of “outputs” as defined in the project plan. Because these consultants function inside tight contractual obligations to produce these results there is little incentive to address the often more complex capacity needs and interests of partner country counterparts.
Where developing country capacities are perceived to be weak, donors can respond to a “risky environment” with distrust in the partnership relationship. Measures to respectfully determine and assist in the development of local capacities often take second place to a reluctance to take risks if government or institutions are identified as having deficiencies. The latter concerns often translates into technical assistants and consultants taking control rather than working alongside country partners.
Rather than acting on their Busan commitments or an understanding that project objectives include (formally or informally) capacity building, donors are likely to choose strategies to avoid risks rather than the slower processes that have the potential to develop local self-reliance.
An example is provided in the Bangladesh case study of a World Bank supported, multi-year program to improve
the national procurement system. As the author points out, donors insisted on the use of donor-determined procurement rules and mechanisms, over the reformed national system. This practice, which essentially undermined local capacities, operated coincidental with the initiative of the World Bank, donors and the Bangladeshi government, to create a new law to reform the procurement system and Bangladeshi capacities to implement the new system. Even when completed, donors did not use the reformed national procurement system.
b) A tendency to promote, design and implement public private partnerships (PPPs), in ways that ignore peoples’ priorities, interests and alternatives.
Several case studies (Philippines, Sri Lanka, Kyrgyz Republic, India and Japan) document the widespread use of foreign technical cooperation to design and implement infrastructure PPPs. The emphasis has been on donor-driven technical advice, sometimes over decades, to promote the privatization of public services. Examples have included roads in the Philippines, export-oriented agriculture in Sri Lanka, or access and exploitation of natural resources in North East India.
The Sri Lankan case illustrates the critical role played by technical assistants, recruited and supported by the World Bank and the Asian Development Bank (ADB), in designing not only technical aspects of irrigation projects, but also in proposing and carrying out politically motivated reforms to privatize access to water over a 20 year period. To this day, the World Bank continues to provide advice and support towards an export-oriented agriculture strategy, ignoring issues of food production to address local and national food security.
In the case of NE India, the ADB, alongside other donors, has aggressively promoted private sector engagement in large-scale agriculture, the development of energy sources and forest exploitation. In the words of the author, “the prioritization of road projects are in areas with potential to connect trading points for business interests of multinational corporations or where there are natural resources, water, oil, and forest resources for exploitation for their profit.” The needs of communities are neglected in these plans, “where most of the roads [that would better serve and service these communities] continue to be in dilapidated condition.” TC has been embedded in various stages of infrastructural projects in the region since the 1990s.

The Reality of Aid 2016 Report
12
Donor support for infrastructural development has often marginalized affected populations, sometimes to the detriment of stated project goals. In the case of NE India, ADB guidance for technical assistants ignored issues related to indigenous peoples’ rights over land and economy, and failed to implement the free, prior and informed consent of indigenous peoples affected by infrastructure development. The Sri Lankan case documents the successful resistance of farmers to repeated schemes for the privatization of water in various irrigation schemes promoted by TC experts and government officials. The Philippines case study of TC in support of the Laguna-Lakeshore Expressway-Dike PPP highlights the so-far successful resistance of those who will be displaced to this development, in the context of documented serious ecological concerns.
In all these cases, PPPs have not promoted inclusive partnerships, nor have they allowed alternative technical advice and proposals. National experts familiar with the conditions of affected local populations and communities have been ignored or deliberately marginalized.
c) The tendency to shape or influence national development priorities through legislation and governance reform.
A little technical assistance through aid can go a long way in creating an open legal environment for exploitation of natural resources. Canada, for example, has an explicit policy to provide technical cooperation to promote “sustainable development in the area of minerals and metals,” including shaping laws governing mines and their development.12 In Honduras, Canadian aid has assisted in the drafting and passage of new mining legislation, which social and environmental organizations continue to resist on grounds that it is unconstitutional and fails to prohibit ecologically destructive open-pit extraction:
“It marginalized mining-affected communities, grassroots organizations, and environmental NGOs from being effectively heard in the process of developing the law and did not follow the legislator’s own protocol for debate and ratification of the General Mining Law. They also allege that over 20 articles in the mining law violate Honduran laws and constitution, as well as international treaties ratified by the Honduran state.”13
Similar instances of donor influence through TC in the legal and regulatory process, often with a privatization agenda, are noted in the report’s cases of the Philippines (governing
PPPs) and Sri Lanka (governing irrigation and governance of water resources). In these and other cases, TAs have often been embedded in related government ministries and institutions as part of the project implementation.
For example, in a case study presented by Euodad, technical cooperation was used to update national legislation as well as regulations on taxation. This initiative also included support for audits on taxes owed by multinational corporations (MNC), in order to strengthen domestic revenue mobilization in developing countries. Through an OECD project, Tax Inspectors without Borders, TAs from industrialized countries in which these MNCs are often based, train tax administrators in developing countries in MNC audit procedures and related issues.
While this may sound useful, Eurodad documents case studies that clearly suggest that such TC is primarily supply-driven by donor countries. In all examples there was little or no involvement of the developing country domestic revenue authorities. Technical assistants faced significant potential conflicts of interest, coming from northern countries in which there are substantial loopholes for MNCs to avoid taxation (e.g. the Netherlands). The Eurodad case study quotes the High Level Panel on Illicit Financial Flows from Africa as follows:
“It is somewhat contradictory for developed countries to continue to provide technical assistance and development aid (though at lower levels) to Africa, while at the same time maintaining tax rules that enable the bleeding of the continent’s resources through illicit financial flows.”14
These practices raise significant questions on transparency (with TAs working to influence national political processes through legislation) and processes of accountability to people and communities affected by national legislation and governance bodies.
5. Technical cooperation in South-South
Cooperation and civil society people to
people exchanges
While difficult to measure, technical cooperation plays a major role in South-South Cooperation (SSC). Some of the key SSC providers are Brazil, Mexico, Argentina and India. VANI’s chapter on India draws attention to the fact that in 2014/15 more than 8,000 Indian technical assistants were provided to 160 countries in a variety of disciplines.

13
Undermining Democratic Country Ownership: Embedding northern development agendas through technical cooperation?
The majority were part of cooperation programs with India’s immediate neighbours, such as Bhutan. A review of Argentina’s SSC in this report identifies the importance of mutual benefit and shared interests in SSC in areas such as governance, agro-industrial and service sectors, and human rights (truth, justice and reparations).
Civil society also carries out South-South technical cooperation programs through people-to-people exchanges across developing countries. In these initiative participants share skills and experiences with counterpart CSOs at the community level and to strengthen solidarity across borders (People4Change and Fortalizas chapters in this report).
Authors acknowledge that South-South exchanges can face some of the same challenges found in North-South exchanges. These include factors such as cultural misunderstanding/poor communication and a lack of attention to sustainability. But an evaluation of People4Change noted that they can also produce the highest benefits, providing not only highly relevant skills based on similar development challenges, but also inspiration at the local level in the realization that these challenges can be overcome. In the case of Fortalezas, for example:
“The bilateral exchanges were critical in sharing the value of different practices of other institutions. … They allowed for unexpected benefits as organizations discovered interesting methodologies used by their peer organizations, and were able to use and adapt them to their own environments and development plans.”
These positive initiatives in technical cooperation offer new ideas and positive directions for how technical cooperation can be strengthened and made more effective. As many note, technical cooperation has the potential to truly contribute to people-centered development outcomes, consistent with the principles for effective development cooperation.
6. Recommendations
Given the fact that technical cooperation comprises up to 25% of real bilateral aid (and more for select donors), a careful review of its benefits and limitations is critical. This, combined with the fact that technical cooperation has continued to suffer from a poor track record despite
commitments to change, aid providers and partner countries must take a hard look at existing practices. As noted in this report, many providers fall far short of best practices in terms of effective development cooperation and the principles that should guide its implementation.
Capacity development is a strong focus of Agenda 2030, the 2015 Paris Agreement on Climate Change, and in the more recent, UN-adopted 2016 Sendai Framework on Disaster Risk Reduction. These agreements, among others, create a crucial and defining moment for rethinking and reforming technical cooperation.
Development partners are structuring nationally owned action plans related to these global agreements; development actors are meeting in the Second High-Level Meeting (HLM2) of the Global Partnership for Effective Development Cooperation (GPEDC) in Nairobi in November 2016 to review progress in their long-standing commitments to effective development cooperation. A failure to look more closely at practices related to TC may seriously undermine the implementation of these core global agendas, as well as affect the credibility and effectiveness of the GPEDC and development cooperation itself.
Given the surprising lack of progress to date,
all development actors – aid providers, partner
governments, CSOs – as full partners in the Global
Partnership for Effective Development Cooperation,
should reaffirm at HLM2 the essential importance of demand-led TC fully integrated into developing
country priorities and capacity need. They should also call for its inclusion in the GPEDC’s revised Monitoring Framework for implementation post-Nairobi. To create a baseline of data and analysis of current practices, a
multi-stakeholder Global Partnership Initiative on
Technical Cooperation should come together following the Nairobi meeting to review and measure existing practices in technical cooperation against the purpose set out in HLM2, and in line with the Reality of Aid recommendations set out below.
As a core resource in development cooperation, much more attention is required to more fully understand the circumstances where technical cooperation is playing a constructive role, how it should be delivered, and how it could conform better to the Busan principles, including incentives for partner countries to lead technical cooperation efforts. Ultimately, a GPEDC-led process must ensure that by the time of the next HLM in 2018,

The Reality of Aid 2016 Report
14
technical cooperation, as an aid modality, is wholly consistent with the four Busan principles for effective development cooperation. The following recommendations propose a number of changes to technical cooperation specific to each of these four Busan principles. 15
a) Democratic country ownership
• Support country management of technical
cooperation A key determinant of effective technical cooperation is a commitment to demand-led capacity development, which includes recipient country management of the priorities and deployment of technical assistants, according to this country’s development strategies and priorities.
• Avoid TC as “soft conditionality” Technical cooperation must be understood as a means to an end – the development of full country ownership and policy space for democratically determined development alternatives. TC should never be used as a convenient and informal mechanism to promote and embed donor/World Bank conditions for financial assistance.
• Deploy regional and national expertise Providers should give priority to the support of country and regional sharing of expertise to build capacities. Part of this approach is giving priority to meaningful collaborations South-South Cooperation and triangular cooperation.
• Focus TC on skills and knowledge
transfers Aid providers should develop internal training programs for potential technical assistants. Technical expertise, sensitivity to the local context and process skills should be prioritized. Technical assistants should work as advisors not in implementation positions. Providers should develop explicit incentives to transfer knowledge and skills, rather than fill gaps and manage risks for short-term donor-determined aid results. Providers should meet their Paris Declaration commitments to avoid stand-alone project implementation units (PIUs).
• Establish dedicated country units to coordinate
and manage TAs Developing country governments and counterparts should establish and/or enhance dedicated units to:
- Coordinate country-driven analysis of capacity needs;
- Negotiate with providers’ potential technical cooperation interventions (including training and education opportunities) to meet these needs;
- Exercise leadership in the selection and deployment of TAs; and
- Monitor and assess lessons in relation to TC support for stronger and sustainable institutional capacities to address complex local development interests.
• Technical cooperation should never be a substitute for apparent reforms required for a sustainable and effective public service.
b) Focus on developing country results
• Support capacities for country-determined
results Technical cooperation should be managed jointly to ensure provider support for results derived from development priorities, plans and policies as determined by the country partners. Effectiveness is highly context specific, with impact and sustainability guided by local stakeholders.
• Have clear goals for technical cooperation initiatives Partner country counterparts should be clear about the purpose of TC in relation to specific capacities and expertise needed to realize country determined results priorities and interests.
• Create flexible and iterative technical assistants’ terms of reference for engagement Effective technical assistants in a supportive advisory role or in training programs require flexibility to respond to unique and changing realities, particularly in politically sensitive environments.
c) Respecting inclusive partnerships
• Empower non-state actors Technical cooperation should take account of the essential importance of empowering non-state actors, such a civil society organizations (CSOs), who in turn offer a range of technical capacities and knowledge at the national level towards people-centered development outcomes. A fully enabling environment for CSOs is the basis for CSO empowerment.

15
Undermining Democratic Country Ownership: Embedding northern development agendas through technical cooperation?
• Respect and implement human rights norms in
technical cooperation Technical cooperation related to the exploitation of natural resources and/or major infrastructure development should be conducted within a human rights framework, including the delivery of programs to ensure free, prior and informed consent by indigenous people, participatory assessment of impacts on communities and affected populations, and deliberate consideration of measures for the empowerment of women and girls in local development.
d) Transparency and accountability
• Be fully transparent about the provision of
their TC. Providers should publish information related to the mandate and terms of reference for their TC personnel and their expected contribution to country-determined development outcomes. This transparency should include the costs associated with donor-provided technical assistants. Such information should enable developing country counterparts to explore alternative local, regional or SSC expertise with these same resources. Developing country counterparts should never consider TC to be a “free good,” as this can only reinforce an aid dependency culture.
• Report to the OECD DAC all TC that is tied,
either formally or informally, to donor country
experts, and remove all tied TC from the DAC
calculation of Country Programmable Aid
Aid providers that report to the OECD DAC should report on the tying status of all TC, the degree to which the provision of technical support has been formally or informally tied to the provision of donor country experts.
• Until such time as the tying status of TC is known,
the DAC should remove all TC from its current
calculation of Country Programmable Aid (CPA), i.e. aid that is available to partner countries to program against their own priorities. According to the Aid Trends chapter in this report, assuming that at least 80% of free-standing technical assistance continues to be donor driven, in 2014 CPA would have fallen to less than half of Gross Bilateral ODA (41%) for that year, rather than the reported 53%.
• Be transparent about lines of accountability Providers and developing country counterparts must be clear about the lines of accountability for technical assistants within TC programs. Lines of accountability should be to developing country hosts. Mutual accountability for TC outcomes, based on an agreed evaluation framework, should be included in the agenda of inclusive country level mechanisms for mutual accountability, involving providers and all relevant stakeholders.

The Reality of Aid 2016 Report
16
9 See Reality of Aid, “The Reality of Aid 2016 Theme Statement: Technical cooperation and capacity development as an aid modality,” December 2015, accessed August 2016 at http://www.realityofaid.org/2015/11/the-reality-of-aid-2016-report-theme-statement-technical-cooperation-and-capacity-development-as-an-aid-modality/.
10 Riddell, R., Does Foreign Aid Work? Oxford: Oxford University Press, 2007, page 209
11 These Busan principles for effective development cooperation are: 1) ownership of development priorities by developing countries; 2) Focus on results (and on enhancing developing countries capacities, aligned with the priorities and policies set out by developing countries themselves); 3) Inclusive development partnerships (recognizing the complementary roles of all development actors); and 4) Transparency and accountability to each other. [§11]
12 See http://www.nrcan.gc.ca/mining-materials/policy/8690#il-d.
13 Mining Watch Canada, “Honduran organizations fight to have Canadian-backed mining law declared unconstitutional,” 26 February, 2015, accessed August 2016 at http://miningwatch.ca/blog/2015/2/26/honduran-organizations-fight-have-canadian-backed-mining-law-declared.
14 UNECA. (2014). Illicit Financial Flows: report of the high level panel on illicit financial flows from Africa http://www.uneca.org/sites/ default/files/publications/iff_main_report_english.pdf.
15 These recommendations were informed by the Reality of Aid chapters and the following documents:
1) LenCD, the Learning Network on Capacity Development, “Technical Cooperation: An Introduction,” 2010, accessible at http://www.lencd.org/topic/technical-cooperation-introduction;
2) LenCD, the Learning Network on Capacity Development, “Technical Cooperation: Reviewing the Evidence,” 2010, accessible at http://www.lencd.org/topic/technical-cooperation-reviewing-evidence;
3) Land, T. 2007. Joint Evaluation Study of Provision of Technical Assistance Personnel: What can we learn from promising experiences? (ECDPM Discussion Paper 78). Maastricht: ECDPM, accessible at http://ecdpm.org/publications/joint-evaluation-study-provision-technical-assistance-personnel/;
4) Governance and Social Development Resource Center, “Helpdesk Research Report: Changing approaches to technical assistance,” 2009, accessible at http://www.gsdrc.org/docs/open/hd586.pdf; and
5) ActionAid, Real Aid: Making technical assistance work, 2006,
http://www.actionaid.org/sites/files/actionaid/real_aid_2.pdf.
Endnotes
1 This chapter was prepared with the assistance of Brian Tomlinson, the editor for this 2016 Reality of Aid Report.
2 Quoted in OECD, “2008 Survey on Monitoring the Paris Declaration,” Organisation for Economic Co-operation and Development, http://www.oecd.org/dataoecd/58/41/41202121.pdf, p. 149. See also OECD DAC, Glossary of Key Terms and Concepts, at http://www.oecd.org/dac/dac-glossary.htm.
3 Paris Declaration, §22, accessed at h t t p : / / w w w. o e c d . o r g / d a c /e f fe c t i v e n e s s /parisdeclarationandaccraagendaforaction.htm.
4 OECD DAC, The Challenge of Capacity Development, Working towards good practice, 2006, accessed August 2016 at http://www.fao.org/fileadmin/templates/capacitybuilding/pdf/DAC_paper_final.pdf.
5 Accra Agenda for Action, §16, accessed at h t t p : / / w w w. o e c d . o r g / d a c /e f fe c t i v e n e s s /parisdeclarationandaccraagendaforaction.htm.
6 In 2014, the UK allocated 16.9% and the United States, 2.8%, of their real bilateral aid to technical cooperation. An unexplained drop in the reported allocations by the US to TC after 2006 has affected the historical trend for technical cooperation. In 2006 the US reported a total of US$9.3 billion in TC, but only US$723 million in 2007. Given the scale of US aid, this drop has accentuated the overall drop in reported TC since 2006. As a percentage of real bilateral aid, US TC was 42% in 2005, but only 3.2% in 2008. Excluding the US, in 2014, 18% of real ODA was allocated to TC, rather than 14% as recorded in Chart One.
These calculations for TC are for “stand-alone technical assistance.” They exclude technical assistance provided within an investment project, which is not reported by most donors. These latter expenditures on TC can be crucial, as described in several case studies in this Report (Sri Lanka, India, and the Philippines), and may increase as a focus on infrastructure increases in overall aid allocations.
7 The aid trends chapter in this Reality of Aid Report provides additional information on the allocation of TC. In 2014, 44% of TC went to Least Developed and Low Income Countries and more than half (51%) was allocated to countries where government revenue was less than $1500 per capita. In terms of sectors, government and civil society (28%) and education (22%) received the largest share and account for 50% of TC in that year.
8 ActionAid International, Making Technical Assistance Work, 2006, accessed August 2016 at http://www.actionaid.org/sites/files/actionaid/real_aid_2.pdf. This report is the most comprehensive overview and analysis by an international NGO on the strengths and weaknesses of technical cooperation.

17
Overview
In September 2015 the international community reached an historic agreement at the United Nations on Agenda 2030. This Agenda creates a unique and critical opportunity for all – governments, civil society and the private sector – to focus and deliver on an ambitious set of Sustainable Development Goals (SDGs). In committing to “leave no one behind” in implementing this Agenda, developed and developing countries committed to maximize the required financing to achieving the SDGs over the next 15 years.
The challenge to leave no one behind is considerable. Countries committed not only to eradicate extreme poverty (destitute people living on less than US$1.90 a day), which still affect more than 15% of the population of developing countries, but also to reduce by half those experiencing real poverty below domestic poverty lines (living on between US$1.90 and US$3.10 a day), affecting another 20% of the population of developing countries.
In total, more than 2.1 billion people live in conditions of poverty (often subsiding in the informal economy, with very limited resources for food, shelter and basic health). Poverty remains wide-spread. After more than four “development decades,” conditions of poverty (less than US$3.10 a day) continue to affect two-thirds (67%) of the population of Sub-Saharan Africa, 55% of people living in South Asia, and close to 20% of the population of China. Another 1.6 billion people are living just above domestic poverty lines, highly vulnerable to economic or climatic crises, highly susceptible to major setbacks.
In the absence of deliberate and large-scale efforts to mobilize new financial resources, with major priority given to targeting conditions of poverty and vulnerability, hundreds of millions of people are indeed in danger of being left behind.
The international community is expecting a wide range of financing to be devoted to the SDGs. But in this regard, Official Development Assistance (ODA) is a unique and critical public resource, which in comparison to other
financial flows to developing countries, can be deliberately programmed to purposes of reducing poverty and inequality.
Unfortunately, analysis in this chapter reveals that in 2016 ODA remains woefully inadequate to the tasks of contributing to the elimination of extreme poverty and significantly reduction of other forms of poverty and vulnerability. It is in urgent need of reform to meet the challenges of the SDGs.
Quantity and Quality of ODA
• Aid providers must live up to their commitments
to increase ODA volume as a critical resource for
the SDGs. The value of ODA is largely unchanged
over the past five years. At US$127.5 billion in 2015, the value of Real ODA (discounting in-donor refugee and student costs and debt cancellation) remains largely unchanged since 2010.
If aid providers had met their 2005 Gleneagles G7 Summit commitments, ODA would have increased by US$62 billion, over current levels of US$131.6 billion today. Achieving the UN target of 0.7% of donor Gross National Income (GNI) for ODA would have produced an additional US$170 billion. With these resources, ODA could truly play a catalytical role in addressing poverty, inequality and achieving the SDGs. Unfortunately signs indicate a continued pattern of levelling off of ODA and an increasing diversion of this ODA to provider self-interests.
• Aid providers must improve country ownership
for their bilateral aid. Only 53% of bilateral aid
was available to be programmed by developing
country partners in 2014. An essential measure in
this regard is to remove eligible in-country donor
costs for refugees from ODA, as currently allowed
by DAC rules. Country programmable bilateral aid has diminished slightly since 2010, but due to an expected explosive grown in in-country provider refugee costs, it is due to shrink even further. Support for refugees in provider countries is a moral and legal obligation. But the costs of refugee resettlement
Global Aid Trends, 2016
Financing Agenda 2030: Where are the resources?
Brian Tomlinson, AidWatch Canada
The Reality of Aid 2016 Report
18
should not be at the expense of people living in poverty in the developing world. A commitment to country ownership requires full direct country access to bilateral aid resources devoted to priorities determined by developing country partners.
• Aid providers must respect and promote the value
of multilateral aid as a resource for a coordinated
approach to financing the SDGs by increasing core contributions and reducing providers earmarked
contributions to the multilateral system. Earmarked contributions have increased by 93% since 2007, while core financing for multilateral institutions increased by only 23%. The former modality dramatically increases transaction costs of multilateral institutions and negates their role in coordinating financing for developing country-driven development priorities.
• Aid providers need to reduce the use of loans
in aid disbursements for low-income and lower
middle-income countries to avoid compromising
sustainable financing of SDGs in these countries. Loans as a share in real gross bilateral aid are increasing, reaching more than 20% in 2014. Loans also make up almost half of disbursements from the multilateral system. In the context of continued concerns for debt sustainability for the poorest countries, loans comprised an alarming 30% of total Real Gross ODA in 2014.
• Aid providers need to meet urgent humanitarian
assistance appeal targets, while increasing their
investment in long-term development and in
conflict affected countries. Humanitarian assistance has increased by 37% since 2010, and as a share in Real ODA reached 13.4% in 2014, devoted particularly to Sub-Saharan Africa and the Middle East. Increased allocations to humanitarian assistance are of course welcomed, but the demands for humanitarian funding is often the result of past failures in development. Without increased investment in development and climate change adaptation, humanitarian emergencies will grow in scale and in impact on human suffering, with poor and vulnerable people most affected.
• Aid providers must ramp up financing for initiatives strengthening gender equality and
women’s empowerment, including increased support for women’s rights organizations as drivers for change to achieve SDG-5 on gender
equality. Almost 70% of screened DAC donor bilateral projects in 2014 had no gender equality objectives, in marked contrast to provider rhetoric about gender equality and women’s empowerment as an essential condition for making progress in the 2030 Agenda. As a share of the value of all screened projects, support for women’s rights organizations is almost invisible at 0.4%.
• All countries must live up to and increase
commitments to measures to limit temperature
increases to less than 1.5o centigrade. Financing
for adaptation and mitigation must be additional
to provider commitments to existing and
increased ODA. Governments must agree on a clear definition of climate finance mechanisms and modalities. Climate finance for Least Developed Countries (LDCs), Low-Income Countries (LICs) and Lower Middle-Income Countries (LMICs) should be in the form of grants. It is essential to achieve a balance between mitigation and adaptation in climate finance priorities. Investment in adaptation in LICs and LMICs is critical, as poor and vulnerable people will be disproportionately affected by extreme climate events in the coming years.
The OECD DAC has documented approximately US$60 billion in climate finance, with more than 75% devoted to mitigation, mainly in middle-income countries.
Other Sources of Development Finance
• Domestic Resource Mobilization (DRM) should be given priority in all its aspects, including
recovery of illicit flows, but should not be considered by aid providers as a substitute
for meeting ambitious ODA finance targets.Developing country revenue is the key public resource for investing in the SDGs and increased domestic resource mobilization is crucial. However, large gaps will remain in public finances to SDGs obligations in all developing countries, particularly LDCs, LICs, and LMICs, where per capita government revenue is less than US$3,000 (compared to US$15,000 for developed countries). Eight-five (85) countries in all income groups, with less than US$3,000 per capita government revenue, face huge challenges with poverty levels (US$3.10 a day) of 28% or more. Most improvements in DRM to date are in Upper Middle Income Countries. Aid providers, in this context, must

19
Global Aid Trends, 2016 Financing Agenda 2030: Where are the resources
not abandon Lower Middle-Income Countries as they also rightly focus on the needs of the poorest countries.
• Traditional aid providers and South-South
providers should seek mutually agreed and
beneficial cooperation, including sharing experience and approaches to addressing
human rights standards for aid and development
effectiveness. South-South Cooperation (SSC) has increased to at least US$32.2 billion (on terms broadly equivalent to the DAC rules for ODA). But only three donors – Saudi Arabia, United Arab Emirates, and Turkey – account for 85% of the US$20 billion increase in SSC since 2012. These three donors and China make up close to 80% of all SSC flows in 2014. China and India, accounting for approximately US$5 billion in SSC, are the primary providers for SSC allocations beyond the Middle East. Recorded triangular cooperation to date has been very modest in amounts of aid involved.
• All development actors, including aid providers
and partner country governments, must maximize their efforts to reverse the shrinking and closing
space for CSOs, enabling CSOs to maximize the impact of their US$70 billion contributions to
development, as independent actors in their own
right. ODA from bilateral DAC providers, through and with CSOs, increased to US$21.6 billion in 2014, which represents 22% of Real Bilateral Aid in that year. Accurate figures are difficult, but estimates indicate that approximately US$48 billion is raised by CSOs annually from private sources. Together these sources suggest a total annual contribution of CSOs to development and humanitarian assistance of US$70 billion. CSO-channelled aid, both official and private sources, was greater than total DAC donor Real Bilateral Aid in 2014 (US$63.6 billion, net of official bilateral aid channelled through and to CSOs).
• The international community must establish
clear benchmarks and criteria, consistent with
development effectiveness principles, for the
inclusion of private sector resources in public/
private mechanisms to achieve the SDGs. The current roles and scale of the private sector as a development actor investing in achieving the SDGs seems somewhat exaggerated. UNCTAD calculates that only US$35 billion in foreign direct investment (FDI), outside of China and Hong Kong, was directed
to developing countries for material plant operation (the majority of FDI was for mergers and acquisitions). The OECD DAC records only $700 million allocated from ODA for public private partnerships (PPPs) in 2014. A study of US PPPs, not surprisingly, documents that most PPPs were closely related to existing commercial interests of the business partner. ODA directed to strengthening the domestic private sector in developing countries, with particular emphasis on small and medium enterprises and the rural economy, are the more productive avenues to create livelihood opportunities for poor and vulnerable populations.
1. Introduction
In September 2015, all member states of the United Nations unanimously adopted Agenda 2030,1 creating a unique opportunity for all – governments, civil society, and the private sector – to deliver on an ambitious set of Sustainable Development Goals (SDGs) over the next 15 years. The SDGs present both a compelling vision for the planet and its people (“leaving no one behind”) and significant challenges for their achievement. Chief amongst these challenges is financing, which some estimate will require morshe than US$1.5 to US$2.0 trillion from all sources.2 In a world in which annual productive activities were valued at US$77.8 trillion in 2014,3 this scale of investment is daunting but certainly feasible, requiring less than 2% of global GDP.
Fully financing the SDGs demands an ambitious global vision to extend and maximize development finance. It means abandoning 70 years of ‘business as usual’ approaches that have been largely driven by measures that advanced the narrow interests of the already rich and powerful. A Third Financing for Development Conference, (Addis Ababa, July 2015), was supposed to set out the financial underpinnings for delivering the SDGs. Unfortunately its outcome, the Addis Ababa Action Agenda (AAAA),4 failed to break away from ‘business as usual,’ and produced few commitments towards new funds, nor did it increase existing sources for finance. In the words of Winnie Byanyimi of Oxfam, “we must all admit that we have failed to finance the SDGs.”5
On a more positive note, at the United Nations Climate Change Conference in Paris, December 2015,more than 190 countries agreed to the Paris Agreement on Climate Change.6 This historic and legally binding agreement to limit warming to below two degree Celsius was signed in front of 36,000 delegates and observers. As a universal

The Reality of Aid 2016 Report
20
agreement to reduce greenhouse gas emissions and address the impact of climate change, in the words of Kumi Naidoo, executive director of Greenpeace, “the wheel of climate action turn slowly, but in Paris it has turned.”
The challenges are nevertheless immense. As Harjet Singh, Global Lead on Climate Change for ActionAid, noted, “As climate change continues to worsen and affect millions more, people are beginning to demand more from their governments and ask for the transformative change to secure homes, jobs and futures. .... Paris is only the beginning of the journey.”7
An important marker on that journey is climate finance for adaptation and mitigation to ensure implementation of the agreement, particularly for those on the frontline of climate change. Countries reiterated a 2008 commitment to US$100 billion in climate finance from all sources by 2020 and agreed to scale up this finance by 2025. The Agreement calls on all parties to mobilize funds, and “such mobilization of climate finance should represent a progression beyond previous efforts.” [Article 9, §3] Unfortunately, there is no re-iteration of previous agreements that climate finance should be “new and additional” to existing commitments to ODA.8
Agenda 2030 – Transforming our world: the 2030 Agenda for Sustainable Development – calls for a revitalized and enhanced global partnership, “in a spirit of global solidarity, in particular solidarity with the poorest and with people in vulnerable situations.” [§39] The means to implement this Agenda requires the mobilization of dedicated domestic resources, international public finance, multilateral organizations and significant private sector and civil society resources.
The Addis Ababa Action Agenda (AAAA) of the Third International Conference on Financing for Development (August 2015),
“… supports, complements and helps to contextualize the 2030 Agenda’s means of implementation targets. It relates to domestic public resources, domestic and international private business and finance, international development cooperation, international trade as an engine for development, debt and debt sustainability, addressing systemic issues and science, technology, innovation and capacity-building, and data, monitoring and follow-up.” [§62]
While all of these areas of finance will be crucial to the achievement of the SDGs, this chapter looks more closely at the role of aid providers and international development cooperation.
In this context, ODA providers have stated their willingness to “reaffirm their respective commitments, including the commitment by many developed countries to achieve the target of 0.7 per cent of gross national income for official development assistance (ODA/GNI) to developing countries and 0.15 per cent to 0.2 per cent of ODA/GNI to least developed countries.” [§43]
In the AAAA, the global community recognizes shared “common goals and common ambitions to strengthen international development cooperation and maximize its effectiveness, transparency, impact and results.” [§50] It re-iterates the importance of all countries meeting their commitments to increase ODA and acknowledges the EU’s commitment to “the 0.7 per cent of ODA/GNI target within the time frame of the post-2015 agenda.” [§51] The specific commitments made in the AAAA with respect to development cooperation can be found in Annex One.
These outcomes were deeply disappointing to many CSO observers. Despite coverage of areas in urgent need of additional and effective finance, the AAAA only recognizes “that funding from all sources, including public and private, bilateral and multilateral, as well as alternative sources of finance, will need to be stepped up for investments in many areas including for low-carbon and climate resilient development.” [§60]
But the AAAA sets no new targets for public finance; makes no new commitments that can be monitored; fails to acknowledge previous agreements that climate finance would be additional to ODA and creates no new measures to strengthen accountability to existing targets.
How ready are current allocations of aid resources and practices in development cooperation to meet the challenges of Agenda 2030? To examine this question, this chapter picks up from the 2014 Reality of Aid Report, which analysed aid trends in light of commitments to end poverty, trends in the quantity and allocations of ODA, measures to improve the quality of ODA, and the financing resources of other actors in an increasingly complex aid architecture.9
21
Global Aid Trends, 2016 Financing Agenda 2030: Where are the resources
2. ‘Leaving no one behind’ – Trends in Global Poverty
The elaboration of the SDGs in Transforming our world begins with the proposition that “eradicating poverty in all its forms and dimensions, including extreme poverty, is the greatest global challenge and an indispensable requirement for sustainable development.” [A/RES/70/1, Preamble, paragraph 1] The Declaration goes on to commit that “as we embark on this great collective journey, we pledge that no one will be left behind.” [A/RES/70/1, §4] UN members elaborated this commitment through 17 goals and specific objectives that are to be achieved by 2030. Moreover, they acknowledge that our world in which billions still live in poverty there also are “rising inequalities within and among countries … [with] enormous disparities of opportunity, wealth and power.” [A/RES/70/1, §14]
A commitment to end global poverty:
Sustainable Development Goal One (SDG-1) has a clear objective: “to end poverty in all its forms everywhere.” This goal is translated into several specific objectives. By 2030, the global community has committed to:
• “Eradicate extreme poverty for all people everywhere, currently measured as people living on less than US$1.25 a day [in updated 2011 PPP dollars, US$1.90 a day];
• “Reduce at least by half the proportion of men, women and children of all ages living in poverty in all its dimensions according to national definitions [emphasis added]; …
• “Ensure that all men and women, in particular the poor and the vulnerable, have equal rights to economic resources, as well as access to basic services, ownership and control over land and other forms of property, inheritance, natural resources, appropriate new technology and financial services, including Microfinance.” [A/RES/70/1, 15/35]
A commitment to reduce inequalities:
The 2030 Agenda uniquely acknowledges the importance of reducing inequalities, within and among countries, to achieve the SDGs. SDG-10 calls for the reduction of inequality within and among countries. It seeks to do so through ten specific objectives, including “progressively achieve and sustain income growth of the bottom 40 per
cent of the population at a rate higher than the national average.” It calls for countries to “progressively achieve and sustain income growth of the bottom 40 per cent of the population at a rate higher than the national average.” [A/RES/70/1, 21/35] SDG-5 focuses on achieving gender equality as an essential foundation for progress.
Addressing extreme poverty requires substantial progress in the reduction of all forms of poverty.
The elimination of extreme poverty by 2030 is a necessary and exceptionally important objective, one that will be a major challenge for the global community in the coming years. However, it needs to be achieved inside a more holistic approach to poverty.
The eradication of extreme poverty by 2030 builds on the success of the first Millennium Development Goal (MDG). It aimed to reduce by 50 percent the proportion of the population living in extreme poverty by 2015. As the 2014 Reality of Aid Report argued, however, addressing extreme poverty is only successful inside the context of policies that aim for the reduction and eventual eradication of conditions affecting the lives of all of those living in poverty, not just those living on the arbitrary measure of less than $1.25 a day [now updated by the World Bank to $1.90 a day in 2011 dollars].10 Development policy analyst, Andy Sumner, has made the point that very small changes in the global poverty line can affect many million people living in poverty, including the scale and location of global poverty.11
Are national definitions of the poverty line, as agreed in SDG1, adequate to achieve significant reductions in global poverty?
In achieving the SDGs, it is crucial to consider their inter-relationships as well as their overall impact on people living in poverty. SDGs related to ending hunger (Goal 2), ensuring healthy lives (Goal 3), guaranteeing inclusive and quality education for all (Goal 4), achieving gender equality and empowering all women and girls (Goal 6), and ensuring availability of water and sanitation for all (Goal 7), require a comprehensive approach that addresses the full scope and extent of poverty throughout the global South. The agreed objective to reduce the proportion of people living in poverty according to national definitions may be very limiting in this regard, as these lines are often highly politicized. In fact, the SDG 1 objective may create

The Reality of Aid 2016 Report
22
incentives to keep national poverty lines at unrealistic low levels in order to achieve this objective.12
Chris Hoy, a researcher with the Overseas Development Institute, has studied national poverty lines in 59 countries. Of the countries he has examined, the median national poverty line is US$1.86 a day (2005 PPP), above US$1.25 (extreme poverty), but below US$2.00, considered by many to be the minimal International Poverty Line.13 Current average measures of national poverty lines are highly dependent on the practices of China, India and Indonesia, which are artificially low and significantly lower cross-country averages. For these three countries, Hoy points out,
“These countries would have much higher national poverty lines today, given their mean consumption, if they were consistent with the cross-country trend. The national poverty line would be almost four times higher in China, around 2.5 times higher in Indonesia and more than 50% higher in India. This would result in around two thirds of the population in these countries being defined as living in national poverty.”14
Indeed, poverty lines can be set so that many people live just below these lines and then are miraculously ‘lifted out of poverty’, without much change in their actual life conditions. Sumner observes that the proportion of people living in extreme poverty in developing countries has declined from 55% to 15% between 1981 and 2012. But at the same time, those living on an income between US$1.90 and US$5.00 increased from 25% to 40% in the same period. The latter are living in highly precarious conditions where they may slip back into extreme poverty. Only at US$10 day is there a measure of security against poverty.15
Updating the World Bank’s International Poverty Line: What are the metrics for assessing global poverty?
In 2015, the World Bank launched a revision of its International Poverty Line (IPL). It updated 2005 purchasing power parity (PPP) data to new calculations of 2011 PPP (i.e. the equivalent cost in 2011 dollars of a bundle of goods across all countries). A new IPL of US$1.90 a day was established, said to be equivalent to $1.25 a day (2005 PPP), and a similar IPL of US$3.10, equivalent to US$2.00 a day (2005 PPP). Independent researchers have challenged the assumptions and credibility of these new IPLs as well as the notion that poverty is measured only in relation to the cost of a minimum basket of goods.16
While acknowledging the weakness of these World Bank sanctioned IPLs, they are, unfortunately, the only comprehensive cross-country measurements of poverty available. And despite their limitations, World Bank poverty statistics are still an urgent wake-up call for focusing the world’s attention on the depth of poverty in the majority of developing countries.
Following the trends identified in the Global Aid Trends chapter in the 2014 Reality of Aid Report, the analysis below examines the extent of poverty for the destitute (US$1.90 a day). It stresses the urgent need to address these conditions as well as the fact that the global community must take into account trends for real poverty measured at US$3.10 (2011 PPP). It must also be recognized that many more millions of people live on the margins of poverty, particularly in middle-income countries. A measure of this vulnerability is the number of people living on between US$3.10 and US$6.00 a day at 2011 PPP (approximate equivalent to US$4.00 in 2005 PPP).17 Measures to address inequalities (SDG-10) must target this population among those in the bottom 40%.
2.1 The Extent and Depth of Poverty
a) Extreme Poverty - US$1.90 a day (formerly US$1.25 a day 2005 PPP)
Extreme poverty includes those people living in destitution, at the very edge of subsistence, characterized by severe deprivation of the basics of life (food, water and sanitation, shelter and access to healthcare).
Conditions of extreme poverty continue to affect at least 15% of the population of developing countries.
According to the World Bank poverty statistics, 898 million people continue to live in extreme destitution in developing countries. This represents a substantial drop of 45%, down from 1,645 million people in 2002.
In 2012, the Bank estimated that 15% of the population in developing countries lived in severe poverty, a level that does not meet even the basic human needs for food, health and shelter. As indicated in Chart1, the majority of extremely poor people are concentrated in Sub-Saharan Africa where 43% of people are living on less than $1.90 a day and South Asia (19%). More than 40% of the population of these two regions live in these conditions of absolute destitution.
Source: Development Initiatives, Investments to End Poverty, World Bank Data, 2014

23
Global Aid Trends, 2016 Financing Agenda 2030: Where are the resources
China has had a major impact on the reduction in extreme poverty from 2000 to 2015.
It is important to note that changes in China have had a substantial impact on these statistics on extreme poverty. For example, comparing 2002 with 2012, more than half (55%) of people who are no longer living on $1.90 a day are Chinese. Over this decade, the number of people in China living in this condition declined by 410 million. Generally, the segments of China’s population who continued to live in extreme poverty as of 2012 were subsisting in rural areas.
Extreme poverty is concentrated in politically fragile and vulnerable countries.
In other parts of the world, extreme poverty tends to be concentrated in politically fragile and/or environmentally vulnerable countries. Twenty-two percent (22%) of extreme poverty is located in politically fragile countries and half of those living in extreme poverty are found in countries that are considered to be environmentally vulnerable.18 Given these conditions, reaching these people may present major challenges, compared to progress that was achieved for the MDGs.
b) Conditions of poverty – US$3.10 a day (formerly US$2.00 a day 2005 PPP)
More than 35% of the population of developing countries live in conditions of real poverty.
According to World Bank statistics, 2,100,000,000 people, or 35% of the population of developing countries, live on less than US$3.10 a day. While not officially considered destitute, those living on daily incomes of between US$1.90 a day and US$3.10 a day, are very poor. Costs for food and shelter mean there is little left over for health care or basic education of their children.
Real poverty is wide-spread across almost all developing countries and is a key challenge in realizing the SDGs.
As Chart 2 indicates, in 2012 more than half the people of South Asia and two-thirds of the people of Sub-Saharan Africa were living in conditions of real poverty. While only 6% of the population of Latin America and the Caribbean lived on less than US$1.90 a day, 12% of the population, or 72 million people, existed on less than $3.10 a day, a poverty line considered to be very low, given the
Chart 1: Percentage of Population Living in Extreme Poverty

The Reality of Aid 2016 Report
24
cost of basic goods. In Asia, nearly 20% of the population of China lives on an income of below US$3.10 a day, with 170 million people living on an income between $1.90 a day and $3.10 a day.
Poverty remains pervasive across the developing world, and it remains the key challenge in realizing the SDGs. Sixty-two of the 128 countries with World Bank poverty statistics report poverty levels at $3.10 a day for more than 25% of their population. Two-thirds (41) of these 62 countries (the majority in Sub-Saharan Africa) have poverty levels higher than 50%. So while there has been substantial progress over the past decade in the reduction of poverty, particularly in East Asia and the Pacific, much greater effort will be required to achieve the ambitious Agenda 2030.
c) Vulnerability to Poverty – US$6.00 a day (approximately $4.00 a day 2005 PPP)
Almost two-thirds of the population of developing countries (62%) are living in poverty or are still highly vulnerable to poverty.
Chart 2: Percentage of Population Living in Real Poverty
While the modest gains of the MDGs are important, they remain highly susceptible to setbacks. The vast majority of the population (62% or 3,750 million people) in the developing world are living in conditions of poverty or are highly vulnerable to poverty. Approximately 1.6 billion people are in danger of slipping back into poverty as they are living just above the US$3.10 poverty line. In many countries without social safety nets these people eke out a living inside an informal and uncertain economy, with a high degree of vulnerability against unexpected economic, climatic or household shocks. The poor and near poor constitute almost all the population of Sub-Saharan Africa and South Asia. In China, they make up 50% of the population, despite its remarkable economic successes over the past decade.
Subsequent sections will locate these poor and near poor geographically and examine the financial capacities of governments in the South to meet their SDG commitments in the context of widespread and deep poverty.
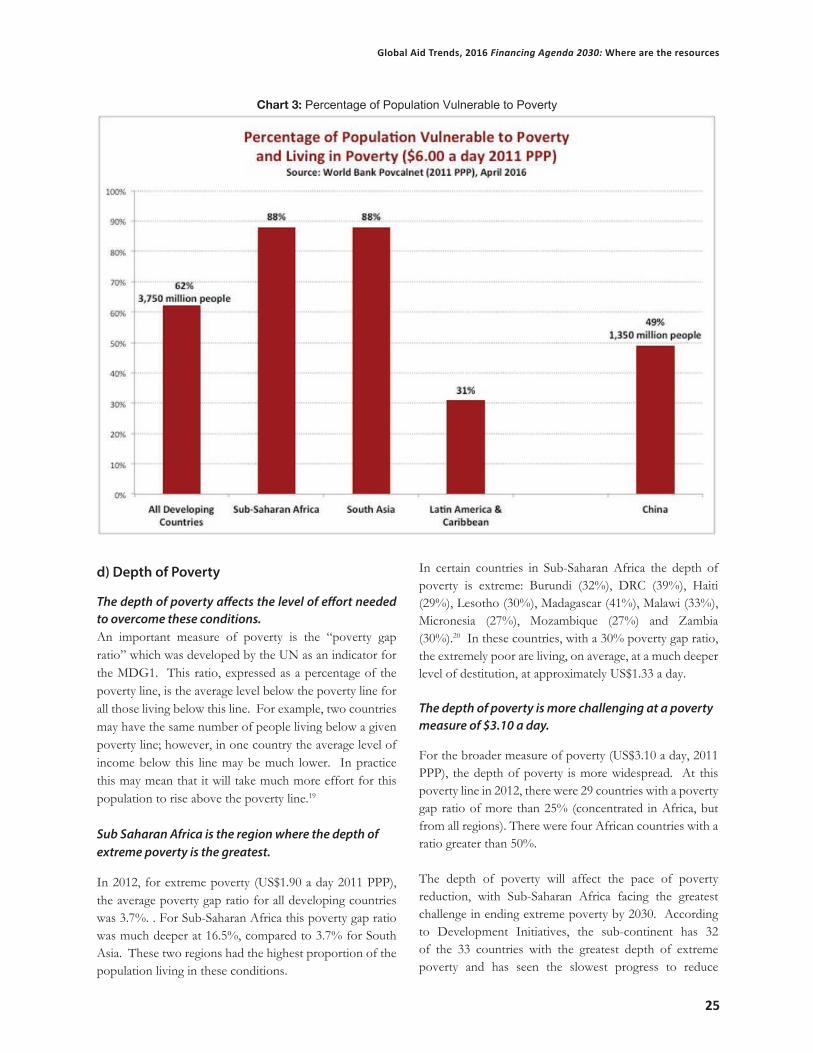
25
Global Aid Trends, 2016 Financing Agenda 2030: Where are the resources
d) Depth of Poverty
The depth of poverty affects the level of effort needed to overcome these conditions.An important measure of poverty is the “poverty gap ratio” which was developed by the UN as an indicator for the MDG1. This ratio, expressed as a percentage of the poverty line, is the average level below the poverty line for all those living below this line. For example, two countries may have the same number of people living below a given poverty line; however, in one country the average level of income below this line may be much lower. In practice this may mean that it will take much more effort for this population to rise above the poverty line.19
Sub Saharan Africa is the region where the depth of extreme poverty is the greatest.
In 2012, for extreme poverty (US$1.90 a day 2011 PPP), the average poverty gap ratio for all developing countries was 3.7%. . For Sub-Saharan Africa this poverty gap ratio was much deeper at 16.5%, compared to 3.7% for South Asia. These two regions had the highest proportion of the population living in these conditions.
Chart 3: Percentage of Population Vulnerable to Poverty
In certain countries in Sub-Saharan Africa the depth of poverty is extreme: Burundi (32%), DRC (39%), Haiti (29%), Lesotho (30%), Madagascar (41%), Malawi (33%), Micronesia (27%), Mozambique (27%) and Zambia (30%).20 In these countries, with a 30% poverty gap ratio, the extremely poor are living, on average, at a much deeper level of destitution, at approximately US$1.33 a day.
The depth of poverty is more challenging at a poverty measure of $3.10 a day.
For the broader measure of poverty (US$3.10 a day, 2011 PPP), the depth of poverty is more widespread. At this poverty line in 2012, there were 29 countries with a poverty gap ratio of more than 25% (concentrated in Africa, but from all regions). There were four African countries with a ratio greater than 50%.
The depth of poverty will affect the pace of poverty reduction, with Sub-Saharan Africa facing the greatest challenge in ending extreme poverty by 2030. According to Development Initiatives, the sub-continent has 32 of the 33 countries with the greatest depth of extreme poverty and has seen the slowest progress to reduce

The Reality of Aid 2016 Report
26
poverty over the past decade.21 While the numbers of extremely poor people in East Asia and South Asia are less than Sub-Saharan Africa, particularly in East Asia, there are additional challenges relating to the fact that the vast majority live in countries that are politically fragile and/or environmentally vulnerable.
3. Mobilizing Aid Resources for the SDGs
3.1 Official Development Assistance (ODA) as a crucial resource for the SDGs
“ODA providers reaffirm their respective ODA commitments, including the commitment by many developed countries to achieve the target of 0.7 per cent of ODA/GNI and 0.15 to 0.20 per cent of ODA/GNI to least developed countries.” [AAAA, §51]
The ambition of the SDGs, the broad scope of poverty across all developing countries, and growing inequality, demand concerted ‘game-changing’ measures to maximize the resources needed to realize Agenda 2030. Dramatic increases in targeted international concessional public finance to complement domestic finance will be essential if the barriers and conditions perpetuating poverty and inequality are to be overcome.
In Transforming our world, UN member states agreed to
“ensure significant mobilization of resources from a variety of sources, including through enhanced development cooperation, in order to provide adequate and predictable means for developing countries, in particular least developed countries, to implement programmes and policies to end poverty in all its dimensions.”
But are current aid resources, policies and practices on track to ramp up these resources, in ways that target poverty and inequality?
ODA will continue to be a relevant and essential resource for achieving the SDGs.
It is often said that the importance of Official Development Assistance (ODA) for achieving the SDGs is fading as the amount of ODA pales in comparison to the supposed growth in “resources from a variety of sources.” The latter include increased domestic resource mobilization in developing countries, growing resources from South-South Cooperation (SSC) aid providers and an expanding role for the private sector as a development actor. There is no question that such sources deserve attention, particularly in assessing and maximizing areas that demonstrably reduce poverty and inequality. But in any resourcing scenario, substantial scaling-up of development cooperation is crucial.
The modest measures to enhance development cooperation in the AAAA were discouraging and incommensurate with the ambition of Agenda 2030. Further, there is ample evidence that aid has not measured up as a resource dedicated to poverty reduction. ODA, which remain the main channel for development cooperation assistance, nevertheless is essential as a resource and public policy instrument dedicated to advance many of the SDGs. Why is this so?
ODA is a unique financial resource, whose importance for the SDGs should not be diminished or brushed aside as irrelevant.
ODA’s potential contribution should be determined, not by a comparison to other financial flows to developing countries, such as those from the private sector, but by its characteristics as a dedicated resource for development shaped by public policy choices (Box One). Clearly, these potential characteristics have not fully realized to date. This chapter analyzes the current realities for ODA in areas that must be addressed by policy makers if ODA is to realize its potential as a resource in the realization of the SDGs.

27
Global Aid Trends, 2016 Financing Agenda 2030: Where are the resources
Box One:
ODA as a Unique Resource for Achieving the SDGs
1. Sizable resource flow While clearly inadequate, ODA at US$137 billion is still a major financial resource. Its value has increased 33% since 2005. While it has not increased in value since 2010, neither has it shrunk.
2. Purpose determined by public policy Distinct from other financial flows, ODA can be fully devoted to the purposes of reduction of poverty and inequality. Its priorities and modalities are exclusively a public policy choice. Other resources flows may be important for achieving the SDGs, but they often linked to other purposes. Addressing the SDGs may be one of them, but would rarely be the primary driver that sustains and directs this resource flow.
3. A flexible resource ODA can be a flexible resource, available to development actors in ways that are responding to country-level SDG strategies, and evolving understandings of the complex conditions for making development progress for poor and vulnerable populations.
4. Catalyst in support of country-owned development As a flexible resource, in coordination with other aid providers and partner countries, ODA can and should be programmed as a catalyst to unique country-led and country-owned development strategies.
5. Predictable funding for long-term initiatives Again, as a public policy choice, ODA has the potential to contribute in ways that provide predictable resources for long-term development initiatives. This is essential to achieve real change in uncertain and complex socio-economic realities.
6. A key resource for multilateral institutions and CSOs ODA is a primary and crucial source of finance for the multilateral system. It disbursed US$63 billion in 2014 to multilateral organizations for developing countries (US$43 billion in core contributions). It is a crucial contributor to CSOs as independent development actors (US$22 billion in 2014), which in turn have raised an estimated US$48 billion in private funds for development cooperation (see section 6.2 below).
7. Reaching marginalized communities and key policy objectives (e.g. gender equality) Working with a range of development actors, and in particular civil society, ODA is a unique resource that can be targeted to marginalized communities. It can address crucial areas such as gender equality or democratic governance, which other flows for the most part cannot do.
8. An accountable resource As a public resource, with appropriate levels of transparency, it is currently the only development flow whose impact may be traceable. As well, citizens and parliaments can hold its policies, practices and allocations accountable through legislation and other democratic means.

The Reality of Aid 2016 Report
28
Chart 4: Total DAC Official Development Assistance, 2000 to 2015
3.2 Trends in the Level of Official Development Assistance since 2000
This section examines three trends in ODA since 2000: 1) recent trends in annual DAC ODA flows, 2) the comparative performance of DAC donors and 3) the prognosis for DAC ODA in the next few years.
a) Current levels of ODA
Highlights
In 2015 ODA declined by US$5.6 billion in current dollars.
In 2015, ODA was US$131.6 billion, down 4% from US$137.2 billion in 2014 (Chart 4). However, because of the changes in the value of the US dollar, the equivalent value of ODA in 2015 (in 2014 dollars) increased to US$146.7 billion, an increase of 6.9% (Chart 5). While this increase in value is notable, developing countries in reality had available only US$131.6 billion in ODA in 2015.
The value ODA (in 2014 dollars) has increased considerably since 2000, but has registered only a modest growth since 2010.
The value of ODA (in 2014 dollars) has grown considerably since 2000 - by 82.5%. In the past ten years (since 2005) it has increased by only 14.3%. In the past five years, the value of ODA has increased by even less – 8.7%. Nevertheless, ODA continues to be a very significant financial flow for development and humanitarian purposes.
In 2015, five donors contributed almost two-thirds of ODA.
Five donors– France, Germany, Japan, the UK and the US – contributed a total of US$86.1 billion in ODA (at current prices) in 2015. This amounted to 62% of total ODA for that year. The policies and trends of these five donors have a profound impact on overall ODA trends and future directions.

29
Global Aid Trends, 2016 Financing Agenda 2030: Where are the resources
Chart 5: The Value of Total DAC Official Development Assistance, 2000 to 2015
If donors had lived up to the UN ODA goal of 0.7% of Gross National Income (GNI), ODA would have been US$302 billion in 2015.
ODA remains below 50% of the UN designated target for ODA (i.e. 0.7% of GNI). If all donors had lived up to this goal there would have been $302 billion in aid resources in 2015 (or US$327.8 in 2014 dollars). With US$170 billion in additional ODA, ODA would truly play a catalytic role in addressing poverty, inequality and achieving the SDGs.
b) Trends in Real ODA since 2000
The truth is that US$131.6 billion in ODA was not actually available to developing countries in 2015.
As many civil society and academic observers have pointed out, the rules established by the DAC permit the inclusion in ODA of several expenditures that do not reach developing countries. These expenditures include the costs of refugees in the donor country for their first
year, institutional costs for students from developing countries studying in the donor country, and the full value of debt cancellation in the year that it is cancelled. While these are legitimate expenditures, they do not belong in ODA, whose purpose is resource flows for people living in poverty in developing countries. Moreover, while donors must deduct from ODA any principal repaid that year on previous ODA loans, they do not include the interest paid by the recipient country.
Real ODA therefore also subtracts these expenditures and interest payments from bilateral ODA. Removing these disbursements, imputed costs and interest payments provides a more accurate picture of the trends for what Reality of Aid has termed “Real ODA,” a resource that is actually spent on development cooperation.
Chart 6 provides the trend since 2000 in the value of Real ODA in constant 2014 dollars, in comparison with the figures shown in Chart 5.

The Reality of Aid 2016 Report
30
Highlights
Real ODA for 2015 (in 2014 dollars) was only 2.4% higher than in 2014, in contrast to the 6.9% recorded by the DAC.
Almost all the 2015 increases in the value of ODA was the result of in-donor expenditures for refugees, students and debt cancellation. When these are removed, Real ODA in 2014 dollars is US$127.5 billion, not US$146.7 billion.
In effect, developing countries had no more ODA resources available to them (in value terms) in 2015 than they did in 2010. The substantial increases in Real ODA took place before 2010.
The value of Real ODA increased significantly from 2000 to 2015, by more than 80%. However, a considerable proportion of this increase took place between 2000 and 2010 (73% increase). In the last five years (since 2010), Real ODA increased by less than 5%, from US$121.6 billion to US$127.5 billion in 2015.
c) The Generosity of Donors: Trends in the ODA Performance Ratio
With the UN ODA target of 0.7% of GNI as a benchmark, the donor members of the OECD Development Assistance Committee (DAC) have agreed to compare their relative performance as aid providers in terms of the percentage of ODA to GNI.
Highlights
At 0.30% of donor GNI, ODA performance in 2015 showed no improvement between 2013 and 2015. But Real ODA performance declined in 2015 to 0.26% from 0.27% the previous year.
ODA performance for all DAC donors was only 0.30% in 2015, unchanged from 2014 and 2013. At 0.26% in 2015, Real ODA performance declined from a high of 0.28% in 2010. It is a mere two-fifths of the 0.7% UN target for ODA. (See Chart 7)
Chart 6: Trends in Real ODA, 2000 to 2015, Constant 2014 Dollars

31
Global Aid Trends, 2016 Financing Agenda 2030: Where are the resources
Average DAC member performance has been decreasing since 2010.
The average country effort is the median performance ratio among the DAC donors. In 2010 the average country effort reached 0.50% of GNI, driven by donors that increased their ODA between 2005 and 2010. The average country effort in 2010 had improved considerably from 2004, when it was 0.42%. But by 2014 this measure had declined to 0.46% for these 22 DAC donors in 2004. It increased to 0.48% in 2015, but only due to very large in-donor expenditures on refugees in key European donor countries in 2015 (see below).
Real ODA Performance has essentially stagnated since 2005.
Improvements in Real ODA performance have stagnated since 2005. Real ODA performance improved marginally between 2005 and 2010, when it reached 0.28%, but declined each year after this high. As noted above, this performance is far below the UN target of 0.70%.
There were six donors in 2015 in the 0.7% club, but only five when in-donor refugee costs were discounted.
In 2015, there were six aid providers that met the UN target – the UK (0.71%), Denmark (0.85%), Luxembourg (0.93%), Norway (1.05%), Sweden (1.40%) and the Netherlands (0.76%). The Netherlands, historically a 0.7% donor, has been reducing its ODA since 2011 and in 2014 reported a ratio of 0.64%. The move back into the 0.7% donor club for the Netherlands in 2015 was because of large increases in refugee expenditures. If these expenditures are factored out, there were really only five 0.7% donors, as indicated in Table One. These five 0.7% donors collectively provided a small proportion of Real ODA - US$29.3 billion - or just over 25% of total DAC Real ODA in 2015.
Table One: 0.7% Donor “Club” in 2015
Donor ODA Performance
Real ODA Performance
Denmark 0.85% 0.72%Luxembourg 0.93% 0.93%Norway 1.05% 0.93%Sweden 1.40% 0.93%United Kingdom 0.71% 0.70%The Netherlands 0.76% 0.58%
Real ODA is ODA less debt cancellation, in-donor country refugee and student costs, and interest payments on previous debt.
Chart 7: DAC ODA Performance Ratio: ODA and Real ODA

The Reality of Aid 2014 Report
32
Despite significant cuts by some donors, forward projections of ODA indicate that Real ODA will continue at more or less existing levels, due to ODA increases planned by the large providers - Germany and France.
The OECD DAC releases an annual survey of forward projections for its members’ bilateral aid. The 2015 review suggests that aid will continue at the same level from 2015 until 2018, with some small fluctuations.25
Similarly, a review of current information from CSOs, government, and media reports on DAC donor ODA budget plans reveal that several large donors are expected to increase their ODA, particularly Germany and France. (See the review of expected trends in Annex Two.) Among the 18 DAC donors that were reviewed, 11 increased their ODA between 2014 and 2015, even when in-country refugee costs were excluded.
Looking to the future, it is expected that at least 10 donors will increase their ODA contributions beyond 2015. These 10 donors made up 58% of ODA in 2015. The outlook for the United States (contributing 23.6% of ODA in 2015) remains uncertain, but current projections suggest a small decrease. Reversing this decrease would substantially affect total ODA available for the SDGs in coming years.
3.3 Trends in Bilateral Aid Allocations
Bilateral ODA has remained constant at 70% of ODA since 2000
Bilateral ODA, which is development assistance delivered directly from the aid provider to the recipient government of a partner country, has averaged a constant 70% of ODA for the past 15 years. In 2015, bilateral assistance amounted to US$94.4 billion, just over 70% of ODA in that year. Real bilateral ODA, when refugees, students and debt are removed, has been approximately two-thirds of total Real ODA since 2005.
Only 53% of 2014’s bilateral aid was available for programming, under developing country ownership.
Both Transforming our world and the AAAA stress the importance of “country ownership” where developing country actors determine the priorities and most effective strategies for realizing the SDGs. Country ownership has been a guiding principle for aid effectiveness since the Paris High Level Forum in 2005. Bilateral aid is a key source
d) Missed Commitments: What directions for future DAC ODA flows?
Recently some commentators have speculated that ODA is a tired concept. They maintain that it has been in decline and is in urgent need of “modernization” to make it relevant to the financing needs of the SDGs. In response to this criticism, it must be recognized that while aid has not declined significantly since 2010, neither has it met the expectations created at the 2005 Gleneagles G7 Summit in the UK “to end poverty.”
If donors had lived up to commitments made at the 2005 G7 Summit, there would be $62 billion in additional ODA available today.
Following the Gleneagles G7 Summit, donors made ambitious commitments to increase their ODA performance by 2010 and 2015. The DAC documented these commitments in 2008.22 If the promises made by donors (including President Obama in his first term of office) had been met, ODA in 2015 would have been at least US$194 billion. This would have meant that there would have been US$62 billion more ODA – an increase of 47%.23
This additional US$62 billion would have been tangible proof that DAC donors were committed to and ready to invest in the SDGs, irrespective of domestic economic challenges.
The UK increased their ODA to meet their commitment to 0.7% (with three other EU members already at 0.7%).
Nine EU member states (all were members prior to 2002) agreed that they would reach the 0.7% by 2015, including those who were already 0.7% donors. Only the UK achieved this target, and the Netherlands, formerly a 0.7% donor, saw its aid performance fall to a low of 0.64% in 2014 (see above). Other EU members promised to reach at least 0.51% by 2010.
Despite a strong rhetoric, there is an absence of firm commitments to increase ODA to meet Agenda 2030.
At the Addis Financing for Development Conference (July 2015), the EU limited its commitments to achieving the 0.7% target by 2030, with the proviso “taking into consideration budget circumstance.” Newer member states have a target of 0.33% of their GNI.24 While these targets are stretched over a long timeframe, they can be contrasted to other DAC donors that have not set any new aid targets for themselves.

33
Global Aid Trends, 2016 Financing Agenda 2030: Where are the resources
Chart 8: Changing Value of Country Programmable Aid (CPA) as a percentage of Gross Bilateral ODA
for financing these strategies. But how much bilateral aid is actually available to be programmed by developing country partners? The DAC has developed a measure of “country programmable aid (CPA).”26 CPA represents the proportion of bilateral aid disbursements where partner country partners can have a significant say in defining the priorities for its use.
In 2014 only 53% of Gross Bilateral ODA, or US$57 billion, was actually available to developing countries to program according to their country priorities. Chart 8 indicates that CPA has been stagnant and falling slightly since 2010. Another important issue is that this amount is only potentially available to developing country partners. The DAC’s CPA calculations included all donor free-standing technical assistance, the majority of which is donor driven. So, at a realistic discount of 80% of the value of technical assistance as probably donor driven, the resulting bilateral aid available to developing country partners in 2014 was US$44.7 billion, less than half (41%) of Gross Bilateral ODA for that year.
There has been an explosive growth in donor country refugee expenditures.
In-country donor expenditures make up a growing part of bilateral ODA that is discounted in the estimation of country programmable aid. As a percentage of Gross Bilateral ODA, the value of key components that inflate aid have fluctuated from year to year, amounting to 36% in 2005, 13% in 2010, 23% in 2013, 13% in 2014, and 11% in 2015. These numbers often reflect the impact of large amounts of debt being cancelled in a particular year. 27
Dramatic increases in donor expenditures for refugees have recently become a controversial issue for some donors, particularly in Europe. Under DAC rules for ODA, these expenditures can be counted as ODA, and they have been growing considerably since 2010 (Chart 9). In 2015, they more than doubled, amounted to US$13.3 billion (2014 constant dollars) or 12.7% of Bilateral ODA, up from $6.6 billion and 7% in 2014.
!

The Reality of Aid 2016 Report
34
Assisting refugees arriving donor countries is a legal obligation. But resources for this support should not be taken from aid budgets, whose target is poor and vulnerable people in developing countries.
There were massive movements of Syrian, Afghani and Somali refugees to Europe in late 2015 and into 2016. The expectation is that these expenditures will rise sharply in 2016 to reflect the large numbers of refugees requiring assistance. In several cases donors are financing these costs through their regular ODA budgets. While assisting refugees for their first year in the donor country is a moral and legal imperative, it should not be taken from aid budgets as it inflicts the costs of refugee settlement on the backs of people living in poverty in the developing world.
In 2015, in-country refugee expenditures became a significant component of ODA for some donors. For example, these expenditures represented over 20% of ODA for five donors: Sweden – 33.8%, Austria – 26.8%, Italy – 25.5%, Netherlands – 22.8%, Greece – 20.6%.
Similar ODA expenditures on refugees can be expected from other European donors in 2016. In Denmark close
Chart 9: Donor In-Country Refugee Expenditures as a percentage of Bilateral ODA
to 30% of Danish ODA in 2016 is likely to be related to refugee settlement costs; in Norway these costs may be up to 20%; and Sweden will probably cap these costs at 30% of ODA.28 All these donors are 0.7% donors and they risk undermining the credibility and effectiveness of their ODA as a significant resource for progress in the SDGs.
At the February DAC 2016 High Level Meeting, a number of donors advocated for an extension of the inclusion of a one-year period of refugee support as ODA to two years. CSOs strongly opposed including in-donor refugee costs in ODA,29 and have raised concerns that some European donors may try to charge costs associated with preventing migrants arriving in Europe to their ODA budget, a move that is contrary to DAC rules.30 At this meeting a decision was taken to clarify the rules, i.e. “improve the consistency, comparability, and transparency of our reporting ODA-eligible in donor refugee costs.” The DAC Secretariat will collect information on current practices and the DAC’s Working Party on Statistics will bring proposals to the 2017 High Level Meeting.31 The EU and Japan have been nominated to chair a special working group on in-donor refugee costs and migration issues.

35
Global Aid Trends, 2016 Financing Agenda 2030: Where are the resources
3.4 Trends in Multilateral Aid Allocations
The value of multilateral aid for implementing SDGs by developing country governments has been weakened. It is increasingly driven by donor, rather than developing country, priorities.
Thirty percent (30%) of ODA has been disbursed annually as assessed core contributions to multilateral organizations, including international financial institutions. The value of multilateral aid (in 2014 dollars) has grown slowly from US$17.8 billion in 2000 to US$37.2 billion in 2015.
As a development resource, assessed and core financing of multilateral organizations is often seen as a quality resource. Generally it is allocated by multilateral organizations in ways that respond directly to the expressed needs of developing country governments. The growth in this core financing, however, has been unevenly distributed to different types of multilateral organizations. This has the potential to undermine a balanced and responsive approach to developing country needs and compromise the ability of the multilateral system to rise above individual donor political self-interests in priorities for bilateral aid.
Chart 10: Value of Multilateral ODA, 2000 to 2015
Uneven distribution of growth in mulitlateral funding: UN organizations fall, while World Bank IDA increases.
UN organizations will be crucial for the realization of the SDGs. Through the UNDP and UNICEF, the UN is well positioned to respond to the expressed needs of developing country partners. Despite the UN’s paramount global mandate, donor support for UN organizations has not grown as ODA has increased. Instead the value of donor support for the UN has dropped slightly from a high of US$7.8 billionin 2000 to US$6.8 billion in 2014. On the other hand, the value of donor support for the World Bank’s International Development Association (IDA) window, which has been accompanied by many Bank-determined policy conditions for recipient governments, increased by close to 70% over these years, from US$5.2 billion in 2000 to US$8.8 billion in 2014 (in 2013 dollars).32
Changing multilateral architecture – increasing attention to thematic vertical funds.
The overall architecture of the multilateral system has been changing. Donors have been able to increasingly impose

The Reality of Aid 2016 Report
36
their priorities through the the creation of specialized vertical funds. This shift can be seen in growing support for “other multilateral organizations,” where the value of annual donor disbursements to these funds has grown from US$1.8 billion in 2000 to US$7.3 billion in 2014. Examples include specialized vertical funds such as the Global Alliance for Vacines and Immunizations, the Global Fund to Fight AIDS, Tuberculosis and Malaria, or the Global Environment Facility for Least Developed Countries. While these specialized funds are often championed by individual donor interests, including northern civil society organizations, they have been criticized for how their funding distorts the provision of services, particularly in the poorest countries.33
Donor ear-marked mulitalteral funding has been rapidly growing as a preferred donor modality for financing through the multilateral system.
Donors can influence the priorities of cash-strapped multilateral organizations through the provision of ear-marked funding for donor priorities, which are then administered by these agencies. According to the OECD DAC statistics, an additional US$19.6 billion in bilateral DAC ODA was channeled through multilateral organizations in 2014, beyond the US$42.6 billion in core DAC donor support.
Earmarked contributions have increased by 93% since 2007, compared to an increase of only 23% for core financing of multilateral organizations. For UN organizations, earmarked funding makes up almost double its core resources - US$12.7 billion compared to US$6.8 billion respectively in 2014. The World Food Program, UNHCR, UNDP and UNICEF were the largest recipients of ear-marked funding. The World Bank has also received a considerable amount of ear-marked special funding – US$3.7 billion in 2014, compared to US$9.8 billion in core financing.
More than 40% of ODA is essentially delivered by multilateral organizations
If DAC donor core contributions are combined with earmarked funding, more than 40% of gross ODA in 2014 was delivered by multilateral organizations. Several donors deliver considerable proportions of their ODA to and through multilateral organizations – the UK (59%), Canada (48%), France (35%), the United States (34%), Japan (30%) and Germany (30%). In 2016 barely one sixth of UNDP’s budget of UNDP is core funding.34
Though these funds may be welcomed by a particular organization, they also entail high transaction costs as each donor has specific requirements and often closely manages the rules governing the allocation of its funds. Earmarking can result in program incoherence and ineffectiveness on the part of agencies managing these funds. In light of the financing requirements for the SDGs, the DAC suggests that “a critical mass of core resources and better quality earmarked funding will be essential going forward.” They call on the multilateral system to play
“a major role in mobilising large volumes of finance by combining and blending different instruments and sources of finance in complex financial “packages” and by deploying risk mitigation tools and developing new pooled funding mechanisms to bring in private resources from banks, institutional investors and the enterprise sector.”35
3.5 Donor Efforts to Broaden the Definition of ODA
Does the inclusion of military-related expenditures and measures to counter violent extremism preface a return to major foreign policy security influences?
Under the rhetoric of the “ODA modernizing process” a number of DAC donors at the February 2016 HLM advocated for a much broader inclusion in ODA of finance for military equipment and training for peacekeeping, as well as costs related to countering terrorism. Other donors, such as Sweden, resisted this militarization of aid, a position that was strongly promoted by CSOs prior to the meeting.36 In the end, the DAC members affirmed the developmental purpose of ODA and agreed that “financing of military equipment and services is generally excluded from ODA reporting and that development cooperation should not be used as a vehicle to promote providers’ security interests.”37
The rules for ODA support for the military and policy must be clarified.
While maintaining this restriction on “regular” military costs, the new rules allow for more inclusion of “non-coercive security related activities.” Examples of these activities could include training of partner military on human rights and sexual violence issues, civilian policy efforts to prevent criminal activities, or the extra costs involved in delivery of humanitarian services by the military, where civilian assets

37
Global Aid Trends, 2016 Financing Agenda 2030: Where are the resources
cannot deliver these goods and services in a timely and effective way (under the old rules).38
In the Communiqué, DAC donors agreed “to update and modernize the ODA reporting directives on peace and security expenditures […], to clarify the eligibility of activities involving the military and the police.” The language for this reporting directive is sometimes vague with more references to exceptional circumstances, which open the door to a more permissive approach in this area.39 Development Initiatives points out that the revised rules allowing for ODA to finance “routine policing functions” or “the provision of related non-lethal equipment” is subject to wide interpretation by donors.40
A key area of concern for the diversion of ODA resources to donor security and foreign policy interests are the new rules that allow the inclusion in ODA of activities focused on “preventing violent extremism.” According to Eurodad, “while activities focused on “perceived threats to the donor country” are excluded, a limited number of activities that are “led by partner countries [where the] purpose is primarily developmental” are allowed.”41 Given the highly political dimensions of actions against extremism, this opening requires close monitoring.
Development Initiatives points out that the use of ODA for conflict prevention, peace and security, even under the old rules has increased by 67% since 2005. Of the US$3.1 billion allocated for these activities in 2014, more than half were devoted to peacebuilding (US$1.7 billion). Security sector reform also received significant resources (US$700 million).42
ODA priorities towards donor security pre-occupations have been shifting since 2002 with increased aid to Afghanistan, Pakistan and Iraq.
Over the past decade, donor foreign policies relating to anti-terrorism have been a critical driver for the country priorities of major donors. There is no better example than the overall trends in DAC donor aid to Afghanistan, Pakistan and Iraq since 2002.
Between 2002 and 2005 aid from DAC donors to Afghanistan, Pakistan and Iraq grew from US$946 million to almost US$10 billion. It accounted for 20% of ODA in 2005 (not including humanitarian assistance and debt cancellation). While aid to these three countries has declined as a share of total ODA since 2005, it still amounted to US$8.1 billion in 2014, or 7% of total ODA for that year. (See Chart 11)
Chart 11: DAC ODA to Afghanistan, Pakistan and Iraq

The Reality of Aid 2016 Report
38
Chart 12: DAC Donors Bilateral Loans as Percentage of Real Gross Bilateral ODA
Foreign policy considerations for the United States and the United Kingdom, both large aid donors and heavily invested in the wars in Afghanistan and Iraq, played a large role in these aid allocations. Fully 90% of aid for these three countries in 2005 came from the US and the UK. While their share in this aid has declined since this 2005 peak, contributions from UK and the US still accounted for somewhat under two-thirds of the total in 2014 (57%). In 2013/14, Afghanistan remained the number one recipient of US aid, and Pakistan ranked number 5. For the UK, Pakistan was number three, and Afghanistan number six.
3.6 Increasing Use of Loans in Aid Delivery
DAC rules for counting loans as ODA
By definition, ODA is intended to be concessional transfers of resources from aid providers to partner countries in the South. Concessional loans have been a component of bilateral aid transfers by DAC donors for many decades. Under current (2016) DAC rules that define ODA
eligibility, the loan must be provided below market rates and the difference between the cost of a market loan and the ODA loan determines the concessionality or “grant” component (which has to be at least 25%).
While loans diminished as an aid modality in the early 2000s, they have become more widely used by bilateral donors since 2006.
During the 1990s donors were strongly encouraged to provide their assistance in the form of grants, particularly to low-income and lower middle-income countries, many of whom were emerging from a debt crisis that had crippled their economies. After 2000 the proportion of loans in Gross Real Bilateral ODA declined, reaching a low of 14% in 2006. But since that year, donors have increasingly used loans in the delivery of their ODA. By 2010, the proportion of loans in Gross Bilateral ODA reached 17% and it is expected to exceed 21% in 2015. Since 2010, bilateral aid loans have increased from US$16.2 billion to US$19.1 billion in 2015, an increase of 18% in five years. (See Chart 12)
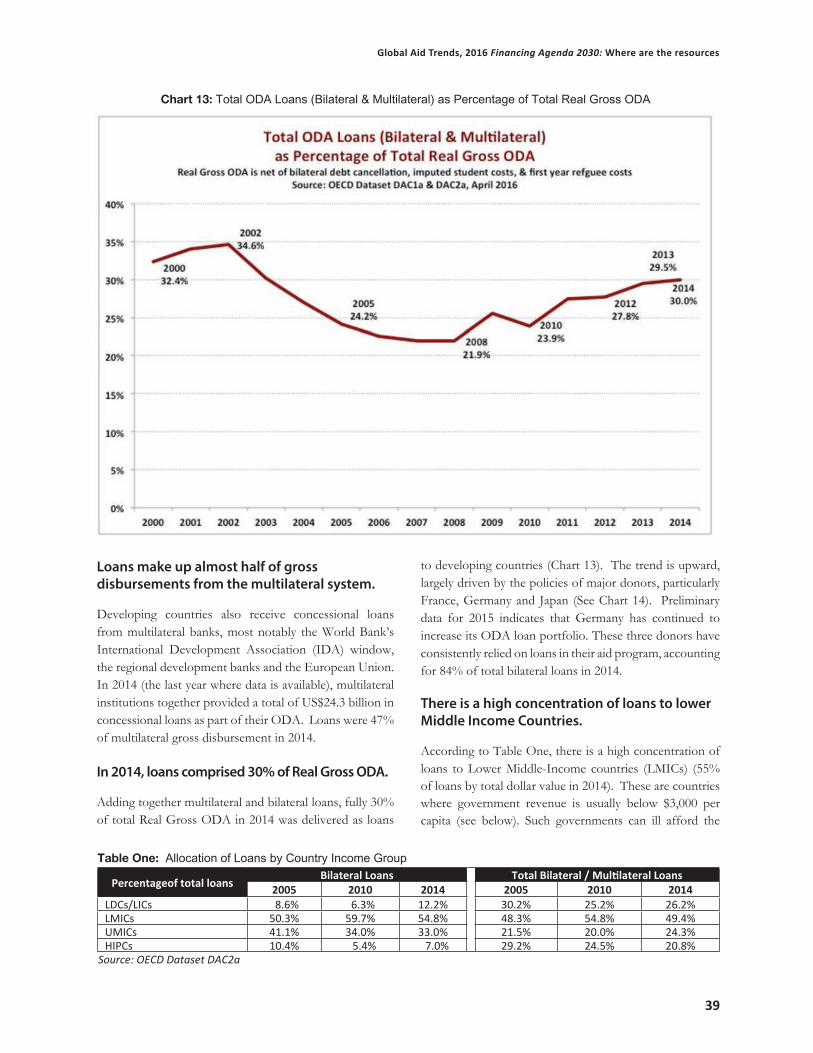
39
Global Aid Trends, 2016 Financing Agenda 2030: Where are the resources
Chart 13: Total ODA Loans (Bilateral & Multilateral) as Percentage of Total Real Gross ODA
Table One: Allocation of Loans by Country Income Group
Percentageof total loansBilateral Loans Total Bilateral / Multilateral Loans
2005 2010 2014 2005 2010 2014LDCs/LICs 8.6% 6.3% 12.2% 30.2% 25.2% 26.2%LMICs 50.3% 59.7% 54.8% 48.3% 54.8% 49.4%UMICs 41.1% 34.0% 33.0% 21.5% 20.0% 24.3%HIPCs 10.4% 5.4% 7.0% 29.2% 24.5% 20.8%
Source: OECD Dataset DAC2a
Loans make up almost half of gross disbursements from the multilateral system.
Developing countries also receive concessional loans from multilateral banks, most notably the World Bank’s International Development Association (IDA) window, the regional development banks and the European Union. In 2014 (the last year where data is available), multilateral institutions together provided a total of US$24.3 billion in concessional loans as part of their ODA. Loans were 47% of multilateral gross disbursement in 2014.
In 2014, loans comprised 30% of Real Gross ODA.
Adding together multilateral and bilateral loans, fully 30% of total Real Gross ODA in 2014 was delivered as loans
to developing countries (Chart 13). The trend is upward, largely driven by the policies of major donors, particularly France, Germany and Japan (See Chart 14). Preliminary data for 2015 indicates that Germany has continued to increase its ODA loan portfolio. These three donors have consistently relied on loans in their aid program, accounting for 84% of total bilateral loans in 2014.
There is a high concentration of loans to lower Middle Income Countries.
According to Table One, there is a high concentration of loans to Lower Middle-Income countries (LMICs) (55% of loans by total dollar value in 2014). These are countries where government revenue is usually below $3,000 per capita (see below). Such governments can ill afford the

The Reality of Aid 2016 Report
40
increasing debt payments that these loans represent. A surprising 12% of loans in 2014 were directed to Least Developed and Low Income countries, many of which were the beneficiaries of the Heavily Indebted Poor Countries Initiative (HIPC). HIPC countries received 7% of loans in 2014. Over 50% of the loans in 2014 were given to ten countries of which half were LMICs (India, Viet Nam, Morocco, Indonesia and the Philippines).
The DAC agree on new rules for the inclusion of loans in ODA.
DAC rules for ODA loan concessionality, established several decades ago, have been controversial in recent years. Persistently low interest rates have meant that an eligible ODA loan under DAC rules can have a higher interest rate than the market rate.44
At the December 2014 DAC High Level Meeting, donors agreed to reform the eligibility and treatment of these loans in terms of how they are counted as ODA.45 These new rules, which will not be fully implemented until 2018, state that only the concessional grant element of a loan will be included as ODA, and repayments of the loan principal will no longer be deducted from donor ODA. The reference interest rate for
Chart 14: Loans as a Percentage of Gross Real Bilateral ODA
the calculation of concessionality will be linked to a country’s income status. So, for example, this could mean that a higher rate might be given to Low-Income Countries (LICs), but loans to these countries would require a grant element of 45% to count as ODA. The thresholds are lower for LMICs and UMICs.46
Changes to the rules for loans are welcomed, but concerns remain that rules may incentivize the use of loans.
Changes in the rules governing loans are an important improvement. They will affect ODA reporting levels in 2018, the first year they are applied, and consequently the comparability of ODA for that year with earlier years. CSOs have raised concerns about whether the changed rules will meant that donors to will prefer loans over grants, particularly in the Least Developed, Low Income and Lower Middle-Income Countries, which face potential issues in debt sustainability. There is also the worry that DAC donors may use the new rules to broaden the inclusion of donor loans and guarantees through private sector instruments (development finance institutions, export-import banks, etc.), which may not be concessional, but could be eligible under new DAC “risk premia”, yet to be agreed.47

41
Global Aid Trends, 2016 Financing Agenda 2030: Where are the resources
3.7 Trends in Humanitarian Assistance
Humanitarian assistance has grown rapidly since 2010.
Driven by the refugee crises and conflicts in Syria, Iraq and Ukraine, serious disease epidemics, and natural disasters, humanitarian assistance is again on the rise. According to Development Initiative’s 2015 Global Humanitarian Assistance Report, US$24.5 billion was provided in international humanitarian assistance in 2014, up 19% from 2013.48 Humanitarian assistance from DAC donors has increased in value, and at US$16.6 billion in 2014, is up 37% since 2010 (Chart 15).
Humanitarian assistance is also increasing as a share of Real ODA, reaching a level that was last seen in 2005.
The value of humanitarian assistance (in constant 2014 dollars) was US$16.6 billion in 2014, the highest level since 2005 (Chart 16). As a share of Real ODA, humanitarian assistance in 2014 was 13.4% of Real ODA, up from 10% in 2010. As a share of Real ODA, it has reached the highest level since 2005, the year of the Asian Tsunami
and humanitarian crises in the Sudan and the Democratic Republic of the Congo.
Sub-Saharan Africa remains a major focus for humanitarian assistance, despite attention to the Middle East
Significant humanitarian resources continue to be allocated for Sub-Saharan Africa (40% of total humanitarian assistance in 2014, but down from 48% in 2010). Humanitarian assistance for the Middle East rose from 7% in 2010 to 25% in 2014, reflecting the needs of the Syrian/Iraq crisis (Chart 17).
Arab donors and Turkey have become substantial actors in humanitarian assistance.
In 2014, a number of Arab donors became major actors in humanitarian assistance as they contributed US$1.6 billion, up from US$760 million in 2013. Among these donors, UAE, Kuwait, Qatar, and Saudi Arabia provided US$755 million, much of it directed to the crises in the Middle East. As Turkey responded to the millions of Syrian refugees on its boarders it contributed a record US$1.8 billion in humanitarian assistance. By May 2015, Turkey had become the world’s largest refugee hosting country.49
Chart 15: Trends in Humanitarian Assistance, 2005 to 2014
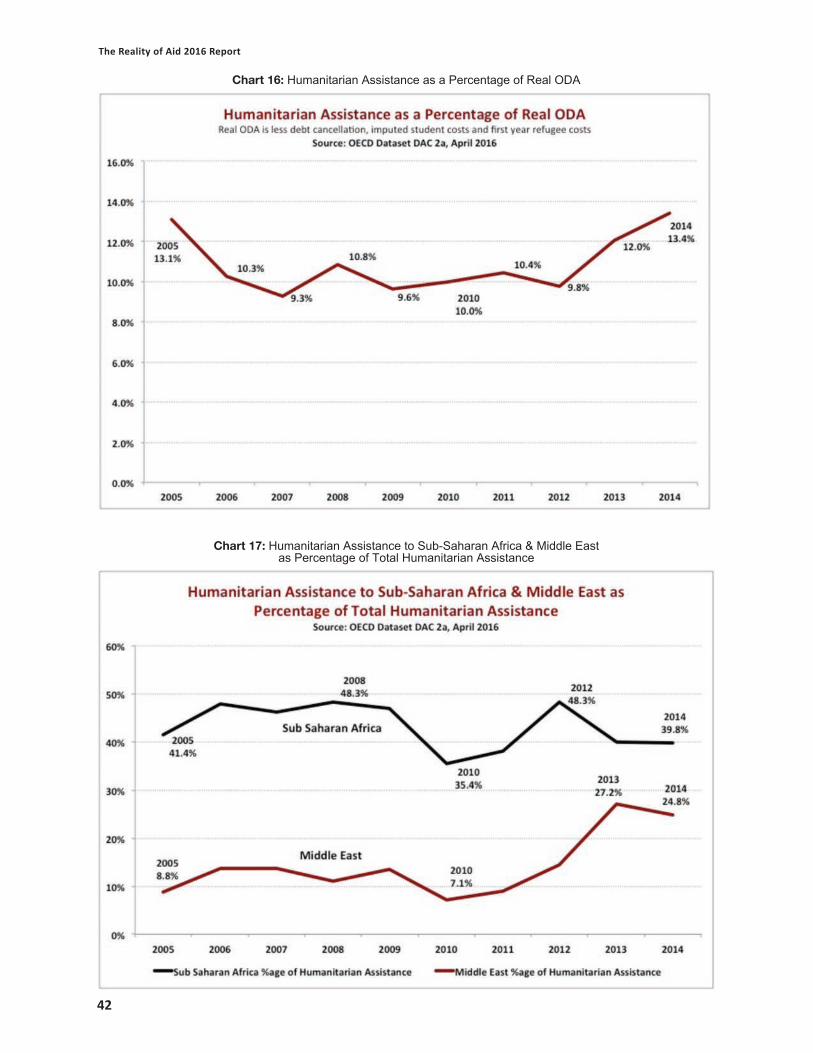
The Reality of Aid 2016 Report
42
Chart 17: Humanitarian Assistance to Sub-Saharan Africa & Middle Eastas Percentage of Total Humanitarian Assistance
Chart 16: Humanitarian Assistance as a Percentage of Real ODA

43
Global Aid Trends, 2016 Financing Agenda 2030: Where are the resources
Private donors contributed 24% of humanitarian assistance in 2014.
Private donors’ responses to humanitarian situations have been growing in recent years. While difficult to accurately measure, Development Initiatives estimates that these donors (individuals, foundations and companies) provided US$5.8 billion in 2014. These contributions are up slightly from 2013, but less than 2010, when these donors contributed US$6.1 billion (Haiti earthquake and Pakistan floods). According to Development Initiatives data, “International NGOs (INGOs) are the largest mobilisers of private funding, raising an estimated US$4.7 billion in 2013, and US$22.7 billion (89% of the total of private funding) in the five years between 2009 and 2013.”50
More than 25% of humanitarian assistance reported to the DAC in 2014 was directed to the Syrian crisis.
Donor assistance reported to the OECD DAC for people affected by the Syrian crisis living in Syria, Turkey, Lebanon and Jordan amounted to US$5.2 billion in 2014. This amount is expected to increase in 2015 and 2016. Turkey, a middle-income aid provider, provided 44% (US$2.3 billion) of the US$5.2 billion, primarily to Syrian refugee populations on its borders. The United Arab Emirates provided US$378 million for humanitarian operations in Jordan and Syria. Together the DAC donors provided US$2.1 billion in 2014, while multilateral organizations contributed US$422 million.51 For the DAC donors, Syrian related humanitarian assistance was 16% of its humanitarian assistance for that year. But their total contributions accounted for less than 50% of the humanitarian assistance provided by governments for this crisis.
The humanitarian system is in crisis.
Despite record amounts of humanitarian assistance in 2014, the United Nations has reported a funding gap of approximately US$15 billion for critical needs. This represents more than 60% of the funds raised in 2014 from all sources.52
The UN High Level Panel on Humanitarian Financing noted that many of the current humanitarian responses are for protracted crises. The Intergovernmental Panel on Climate Change projects a growth in the numbers and intensity of climate-related disasters, with costs exceeding current estimates. The High Level Panel documents the deepening ineffectiveness of the current humanitarian mechanisms:
“The global humanitarian system is overstretched and is unable to respond adequately. This gap between demands and resources is complex in nature; it is not just the result of more armed conflict, extremism, disaster, disease and displacement. Humanitarian aid’s traditional function to provide life-saving assistance— in short, to get in quickly, fix the immediate problems and leave—has evolved to include a dizzying array of additional responsibilities: from building resilience and preparedness to providing long-term basic services such as health, shelter and education.”53
The Panel pointed to the urgency of overcoming the “benign neglect” between the humanitarian and development worlds, recognizing the increasing need for inter-related interventions from humanitarian, peacekeeping and development.
The first World Humanitarian Summit, in May 2016, produces mixed results.
The international community met in Istanbul at the first World Humanitarian Summit in May 2016. In the lead-up to these meetings a wide range of proposals were made to create a common platform or management framework that brings together all the tools to address the different dimensions of a crisis. Many proposals emphasized the importance of ramping up support for local resilience.54 Not only more funding, but multi-year and less earmarked funding is required from donors, including consideration of financing packages for middle income countries that are hosting large numbers of refugees.55 With only 0.4% of ODA spent on disaster risk reduction and preparedness, the Secretary General called for a modest goal of 1% of ODA by 2020 devoted to preparedness.56
The outcomes of the Summit were described as “mixed results.” On the positive side there were commitments for greater transparency in humanitarian spending. A “Grand Bargain”, which was agreed to by 15 of the largest humanitarian donors, 16 aid agencies, including the Red Cross and three INGO consortia, set out 51 commitments in ten key areas to improve the efficiency of delivery in the humanitarian aid system.57 These commitments include increased use and coordination of cash based modalities (less donor driven food aid), improved joint and impartial needs assessments (to direct priorities in humanitarian responses), reduced ear-marking of donor contributions, harmonized reporting requirements, and enhanced engagement between humanitarian and development actors, among others.

The Reality of Aid 2016 Report
44
On the less positive side, there was no progress on measures to reduce serious breaches in humanitarian law, including bombing of hospitals, the use of civilians as shields in conflict and the need to address burden-sharing of refugees and migrants. While the Grand Bargain addressed many crucial issues for reform, specific objectives for implementation and demonstrating progress are largely missing. The United States, for example, suggested that while they are committed to the Grand Bargain, their responses to humanitarian emergencies will continue to be situation- specific, and will not be guided by “arbitrary targets.”58 The US provided 50% of all humanitarian assistance in 2014.
The Summit committed to increase access to humanitarian resources, tools and coordination mechanisms for local governments and local CSOs.
Local NGOs, national and local governments are demanding a larger share of humanitarian resources. A number of CSOs associated with the Charter4Change are calling for 20% of this funding to go directly to local implementing NGOs.59 The Grand Bargain has committed to 25% of humanitarian funding to local and national responders by 2020, greater use of funding tools such as the UN and NGO-led pooled funds, and the inclusion of local actors in coordination mechanisms. It also pledges to develop a “localization marker.” As a senior US official has pointed out, recent estimates do not account for indirect delivery of humanitarian assistance through local responders nor do they acknowledge the need to strengthen capacities for larger scale interventions by these actors.60 However, the Summit made significant progress on engaging local responders more directly in coordinated humanitarian actions.
At the same time, the Istanbul Summit largely failed to consider the deteriorating and dangerous conditions in which many CSOs are working in conflict areas. For example, the impact of counter-terrorism on humanitarian responses, particularly by civil society organizations, was not discussed. Several major organizations have pointed out that operations in high-risk jihadi run areas of Syria, for example, run the risk of being branded “supporters of terrorists” under current anti-terror legislation.61
4. What about Local Finance for SDGs: Promoting domestic resource mobilization?
“We underscore that, for all countries, public policies and the mobilization and effective use of domestic resources, underscored by the principle
of national ownership, are central to our common pursuit of sustainable development, including achieving the Sustainable Development Goals.” [Transforming our world, §60]
ODA is a crucial tool, but not the answer to resourcing sustainable human development.
At best ODA is a catalyst and a complementary resource for addressing key issues in poverty eradication and the achievement of the SDGs by 2030. Clearly, much larger allocations of ODA are required to realize this role and to focus attention on conditions for marginalized populations. Equally important is the urgent need for investment in education, primary health care, climate resilience/ adaptation and infrastructure for sustainable livelihoods for people living in or near poverty in developing countries. At the same time it must be recognized that ODA will never be sufficient to raise billions of people out of poverty, nor should it be seen as having this responsibility.
Developing country government revenue is the key public resource for investing in the SDGs.
Regardless of country income level, developing country governments are the primary source for financing sustainable progress for the SDGs, as they were for the MDGs. Governments have a clear obligation to invest in the social sectors – health, education, water and sanitation – but also to enable economic growth and improved livelihoods for all its people.
Many governments are close partners with aid providers in these efforts, especially in Low-Income Countries, but also in many Middle-Income Countries. What are the current revenue capacities for these governments to fulfill these obligations? Can an emphasis on domestic resource mobilization (DRM) compensate for the financing gaps for the SDGs in Middle-Income Countries? If not, how well is ODA complementing domestic resources to fill these gaps?
Moving beyond aid dependency is a goal of all low-income and Low/Middle-Income Countries. Domestic resources will ultimately provide the basis for achieving this end. But the low starting points for many countries, the economics of poverty and the politics of DRM, will undoubtedly require a continued and critical role for aid, with increasing levels of ODA commitments.
Increasing domestic resource mobilization (DRM) is a crucial challenge.
45
Global Aid Trends, 2016 Financing Agenda 2030: Where are the resources
The AAAA affirms that “[…] the mobilization and effective use of domestic resources, underscored by the principle of national ownership, [is] central to our common pursuit of sustainable development [...]” [§20] During the Addis Financing for Development Conference, many developed countries stressed the importance of domestic resource mobilization as the central challenge in financing for development, arguing that ODA will have an important but diminished role in the future.
National governments are best placed to establish relevant policies and initiatives to sustainably reduce poverty through domestic resource allocation – this is surely the goal for all countries. But, while accepting the challenge in marshalling these resources, the Finance Minister for Malawi, Goodall Gondwe, retorted,
“We need the space and autonomy to mobilize national resources,” … [noting that] “when differences arose and partners became supervisors, governments resented it.”
To avoid such situations, he called for “genuine equal partnership.” While welcoming domestic resource mobilization as central to the implementation of the sustainable development goals, the Minister urged States to “tread carefully” on the targeted 20 per cent of tax-to-gross domestic product ratio as a threshold above which countries were considered to have sufficient resources and not need technical assistance.”62
Developing country government must have the policy space and resources to drive country priorities for the SDGs.
Governments that are given the policy space and resources are well placed to assess country conditions and set priorities. Domestic government revenue (tax and other revenue) has indeed been increasing over the past fifteen years. This revenue has almost doubled between 2005 and 2010, and reached an estimated US$5.3 trillion in 2014.63
Development Initiatives argues, “For governments to set and drive their own poverty reduction agenda, domestic resources must become the spine around which other development finance flows are coordinated.”64 An analysis of government sector spending for the MDGs concluded, however, that most developing countries had substantially missed the spending mark in their budgets devoted to core MDGs. The study estimated these governments had allocated about 35% of their
spending to the core MDGs (agriculture, education, health, environment, social protection, and water and sanitation), when they should have been spending 57% of budgets to reach these MDG targets.65
But is this allocation realistic for countries with substantial levels of poverty? Have these resources been broadly available to governments, especially in Low-Income and Lower Middle Income Countries? Can domestic resource mobilization fill the gap for the SDGs? While governments cannot rely on aid to meet its obligations, what is the relevance of aid in this context of domestic resource deficits?
Domestic resource mobilization is not just a technical matter of improving tax collection systems and implementing a range of taxes and revenue generating policies. At the country level, entrenched elite politics and interests, as well as an often-broad lack of respect for government and its institutions fuelled by corruption, greatly affect the effectiveness of a government’s fiscal policy. In recent months, there has been irrefutable proof of massive tax evasion and illicit transfers of income at the global level. Wealthy individuals and transnational corporations have successfully avoided contributing their fair share, including many from the developing world.66
Can domestic resource mobilization fill the financing gap for the SDGs by 2030?
Building on work by Development Initiatives, this question was asked in the Aid Trends chapter of the 2014 Reality of Aid Report. 67 The following section continues this analysis by correlating current government spending per capita with levels of poverty (US$1.90 and US$3.10), and country income status (Low Income / Least Developed, Lower Middle-Income, and Upper Middle-Income). It briefly summarizes research on donor policies in support of DRM. Finally, it examines international issues inside a context where CSOs are advocating to untangle the web of illicit capital flows and tax evasion to ensure that the rich and the corporate world shoulder their responsibilities in poor countries. This is a necessary foundation for the realization of the SDGs.
4.1 Government revenue and levels of poverty
What do trends in developing country government revenue per capita suggest for financing capacities to realize SDGs in these countries?

The Reality of Aid 2016 Report
46
Development Initiatives’ excellent data hub brings together useful data on developing country government revenue per capita (net of ODA and debt disbursed to the public sector) for 124 countries.68 Revenue per capita is a strong indicator of a government’s ‘current capacities to finance the SDGs. At the same time this data provides solid proof of the importance of mobilizing new revenue sources for these governments. It is important to keep in mind that per capita government revenue must cover all government expenditures for the social sectors, as well as legitimate expenditures for institutionalizing the rule of law, upkeep of infrastructure, conduct of foreign policy, ensuring environmental protection, defence, etc.
Among 124 countries documented in Development Initiatives’ database,
• 30 had per capita government revenue of less than US$500 per person;
• 27 had per capita government revenue of between US$500 and US$1,500 per person;
• 28 had per capita government revenue of between US$1,500 and US$3,000 per person; and
• 39 had per capita government revenue of more than US$3,000 per person.
Chart 18: Government per capita Revenue and Levels of Poverty: Percentage of population living in poverty
As a point of reference, the average per capita revenue for developed countries, to cover the same set of government expenditures, is approximately US$15,000. This is over five times more than the level available for most Middle Income Countries.69 It is also important to note that governments’ of developed countries are struggling with the challenges of poverty, social and economic inclusion. With much lower revenue, how is it possible for developing countries to create favourable conditions, or even a basic set of services, for their people?
85 countries with less than US$3,000 per capita government revenue face huge challenges in poverty reduction.
In the 30 countries with less than US$500 per capita in revenue, almost half the population (47%) are living in conditions of extreme poverty. Three quarters (75%) live on less than US$3.10 a day (Chart 18). While the extent of poverty declines with higher levels of government revenue, all 85 countries with less than US$3,000 per capita government revenue face huge challenges in poverty reduction, and the concomitant financing needs by government for education, health and social protection.

47
Global Aid Trends, 2016 Financing Agenda 2030: Where are the resources
4.2 Government Revenue and Country Income Groups
Countries formally labeled “Lower Middle Income Countries” (LMICs) have very low government per capita revenue.
Not surprising, there is a close alignment between countries with per capita revenue of less than US$500 and those with Least Developed or Low-Income status (LDCs/LICs) (Chart 19). Almost all Lower Middle-Income Countries (LMICs) had per capita revenue of less than US$3,000, and 13 of these 30 LMICs had revenue less than $1,500 per person. Of the 48 Upper Middle-Income Countries, 12 of them had per capita government revenue of less than $3,000.
Donors should not ignore the development finance needs of Middle-Income Countries or withdraw ODA as source of government revenue.
With higher levels of gross national income, the potential to increase government revenue among UMICs is clearly high. Many of the increases in government revenue over the past decade have been in UMICs. LDCs, LICs and LMICs, on
Chart 19: Government per capita Revenue and Country Income Groups: Number of countries
the other hand, face considerable challenges in improving DRM, certainly to the degree needed to finance SDGs in the next fifteen years. Against this evidence of the extent and depth of poverty and very low government revenue, it is crucial that aid providers not abandon these countries as they rightly focus on the needs of the LDCs and LICs.
4.3 ODA and Domestic Resource Mobilization
In the lead-up to the Addis Conference Erik Solheim, OECD DAC Chair, called on aid providers to “agree to channel aid to those countries with the least access to other sources of finance, the greatest difficulty in attracting investors, and the weakest tax systems, [with special attention to] vulnerable groups, such as ethnic and religious minorities and indigenous rural populations struggling to break out of poverty ...”70
In recent years, ODA has focused on countries with low government revenue.
Chart 20 assesses the top 50 country recipients of DAC bilateral and multilateral ODA (a combination of LDCs,
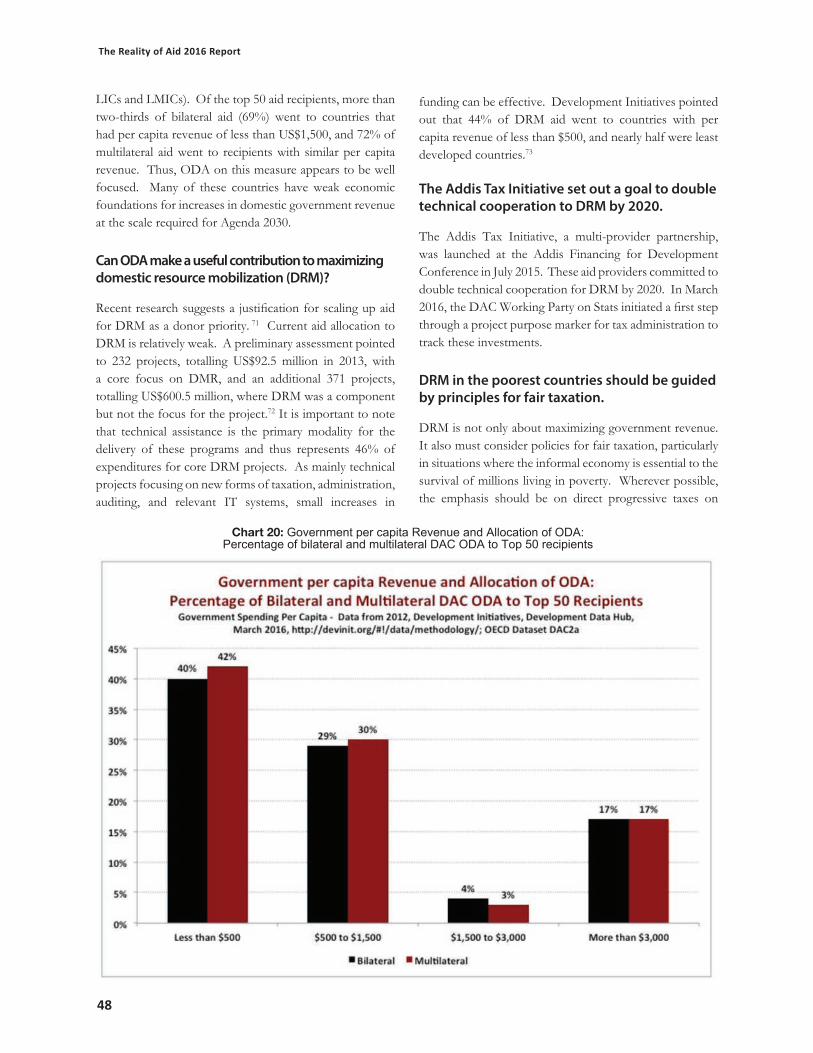
The Reality of Aid 2016 Report
48
LICs and LMICs). Of the top 50 aid recipients, more than two-thirds of bilateral aid (69%) went to countries that had per capita revenue of less than US$1,500, and 72% of multilateral aid went to recipients with similar per capita revenue. Thus, ODA on this measure appears to be well focused. Many of these countries have weak economic foundations for increases in domestic government revenue at the scale required for Agenda 2030.
Can ODA make a useful contribution to maximizing domestic resource mobilization (DRM)?
Recent research suggests a justification for scaling up aid for DRM as a donor priority. 71 Current aid allocation to DRM is relatively weak. A preliminary assessment pointed to 232 projects, totalling US$92.5 million in 2013, with a core focus on DMR, and an additional 371 projects, totalling US$600.5 million, where DRM was a component but not the focus for the project.72 It is important to note that technical assistance is the primary modality for the delivery of these programs and thus represents 46% of expenditures for core DRM projects. As mainly technical projects focusing on new forms of taxation, administration, auditing, and relevant IT systems, small increases in
Chart 20: Government per capita Revenue and Allocation of ODA: Percentage of bilateral and multilateral DAC ODA to Top 50 recipients
funding can be effective. Development Initiatives pointed out that 44% of DRM aid went to countries with per capita revenue of less than $500, and nearly half were least developed countries.73
The Addis Tax Initiative set out a goal to double technical cooperation to DRM by 2020.
The Addis Tax Initiative, a multi-provider partnership, was launched at the Addis Financing for Development Conference in July 2015. These aid providers committed to double technical cooperation for DRM by 2020. In March 2016, the DAC Working Party on Stats initiated a first step through a project purpose marker for tax administration to track these investments.
DRM in the poorest countries should be guided by principles for fair taxation.
DRM is not only about maximizing government revenue. It also must consider policies for fair taxation, particularly in situations where the informal economy is essential to the survival of millions living in poverty. Wherever possible, the emphasis should be on direct progressive taxes on

49
Global Aid Trends, 2016 Financing Agenda 2030: Where are the resources
income or assets such as land, which takes account of the income of taxpayers and their relative ability to pay. Many poor countries instead rely on indirect taxes (e.g. customs duties), as these are easier to collect. However, these indirect taxes often place a heavy burden on poor people as well as the many millions that make up ‘the working poor’, those living just above the poverty line. An important test for effective policy and technical advice for DRM is an assessment of the impact of changes in the tax regime on poor and vulnerable people.74
Donors supporting DRM need to include developing countries in pro-actively tackling the global structural factors that distort available tax resources.
Tax evasion by the rich, profit shifting by multinational businesses, tax exemptions for foreign direct investment and international illicit flows from corruption and criminal activity have all received prominent attention in recent years. Can developing country governments capture these potential revenue streams? Steps towards this goal could include better transparency in access to tax and corporate information on a country-by-country basis, greater regulation of money flowing to so-called “tax havens,” and more rigorous structuring of tax regimes for natural resource extraction.75 While attention has increasingly focused on these areas, the issues are complex in making progress.
However, the potential of these revenue sources cannot be ignored. Maya Forstater quotes IMF estimates that developing countries lose between US$100 and US$300 billion in tax revenue through various profit shifting techniques. She quotes an Action Aid study that values the tax exemptions for businesses in developing countries, often in the extractive industries, at US$138 billion. Total capital flight from developing countries (not just illicit flows) can be as high as US$1 trillion or US$60 billion for Africa.76 These are significant amounts, ones that could make a real difference to the revenues of developing countries. There is growing concern and public pressure to rein in this massive flow of capital and revenue that has, to date, been largely out of reach to the tax authorities of developing country governments.
But will LDCs and Lower Middle-Income Countries truly be the beneficiaries of a fair global tax regime?
Reversing these flows, implementing fair cross-border taxation rules, improving transparency and shuttering
international tax havens have been identified as a prime source of revenue for advancing Agenda 2030. Such measures are unquestionably important. But, with the exception of a few resource rich countries, will LDCs and Lower Middle-Income Vountries be the real beneficiaries of a fair global tax regime?
In their study, Development Initiatives noted that among resource-rich developing countries, natural resources accounted for 58% of total revenue and that this high dependency left them vulnerable to swings in international prices for these resources. Longer-term sustainability of these sources is also a critical issue.77 Forstater points out that the majority of offshore wealth is held by citizens of OECD countries and by others in upper middle-income countries in the South. Most LDCs and LMICs have limited access to foreign direct investment and therefore multinational tax revenue in their jurisdiction.78
5. Current Qualities of ODA: Fit for Purpose
for the SDGs?
If ODA is to be an essential and effective source of development finance for Agenda 2030, it must not only grow decisively in quantity, it must also improve upon its performance in several key areas.
What is the quality of ODA in affecting change for people living in poverty?
In 2011 in Busan, South Korea, donors made important and specific commitments to ensure more effective development cooperation. They did so with partner countries, non-state actors in civil society, and the private sector. In Busan, all actors affirmed four principles for effective development cooperation – respect country ownership; focus on results based on country priorities; support inclusive partnerships; and deepen transparency and mutual accountability. Through the Busan-mandated multi-stakeholder Global Partnership for Effective Development Cooperation, a monitoring round in early 2016 reported on progress on commitments that were made to implement the principles.
These results on effective development cooperation will only be available in November 2016.79 Principles for effective development cooperation were consistent with the goals of reducing poverty and inequality. This section examines ODA performance in several key areas affecting the goal of poverty reduction:

The Reality of Aid 2016 Report
50
1. Contributions to key sectors affecting the lives of people living in poverty;
2. Balanced allocations to country income groups, according to need;
3. Balanced allocations to regional groups, according to need;4. Focusing on gender equality and women’s
empowerment;5. Allocations of aid for demand-driven, not supply-led,
technical cooperation; and6. The provision of a fair share of resources for climate
change, balanced between adaptation and mitigation.
5.1 Trends in the Sector Allocation of DAC ODA: Key sectors for people living in poverty
Transforming our world sets out an ambitious agenda for achieving progress across many sectors by 2030:
By 2030, double the agricultural productivity and incomes of small-scale food producers, in particular women, indigenous peoples, family farmers, pastoralists and fishers ... [Transforming our world, SDG2.3]By 2030, reduce the global maternal mortality ratio to less than 70 per 100,000 live births [Transforming our world, SDG3.1]
By 2030, end the epidemics of AIDS, tuberculosis, malaria and neglected tropical diseases and combat hepatitis, water-borne diseases and other communicable diseases. [Transforming our world, SDG3.3]By 2030, ensure that all girls and boys complete free, equitable and quality primary and secondary education leading to relevant and effective learning outcomes [Transforming our world, SDG4.1]
Several of these goals build on the MDGs, which have obtained modest success since the Millennium Declaration of 2000. Without a dramatic shift in both the quantity and focus of ODA on key social, economic, environmental and institutional goals, the prospect for progress by 2030 will be greatly diminished. What then is the starting point for ODA sector investments going forward?
Recently there has been no growth in overall ODA sector investments.
Chart 21 demonstrates the increases in value of ODA disbursements from 2000 to 2005, 2005 to 2010, and 2010 to 2014. Almost no growth in sector allocations has occurred during the 2010 – 2014 period, with the exception of financial services (largely micro-finance).
Chart 21: Growth in Value of ODA Disbursements to Sectors since 2000

51
Global Aid Trends, 2016 Financing Agenda 2030: Where are the resources
Investments in the social sectors have shrunk since 2010.
From 2000 to 2010, ODA investment in social infrastructure and services (health, education, water etc.) was considerable. The rate of growth exceeded the overall growth in ODA, more than doubling from US$20.3 billion in 2000 to US$46.7 billion in 2010 (2014 constant dollars). But since 2010 these investments have shrunk by 7% to US$43.2 billion in 2014.
Growth in ODA support for the production sectors has been modest.
In the 2005 to 2010 period, ODA investments expanded in the productive sectors (agriculture, industry, mining, trade policy, etc.), at a similar rate to the overall growth in ODA. Since 2010 growth in ODA disbursements for these sectors have been flat at US$7.7 billion (2014 constant dollars). Note: This area was affected by special G7 initiatives in agriculture in 2009 and 2010. (See below.)
Will donors ramp up ODA investments in sectors key to realizing the SDGs?
Previous aid trends chapters in Reality of Aid documented the degree to which ODA priorities were influenced by the MDGs. Using a proxy indicator for ODA investments in the MDGs, the 2014 chapter concluded,
“…the level of ODA dedicated to the MDGs has been modest at best, with these improvements stalling after 2010. Given the failures to meet commitments in ODA quantity and in addressing the MDGs, as well as limits on government spending …, it should come as no surprise then that the MDGs remain elusive in many countries.”80
In a similar approach, trends for sector investments in health, basic education, agriculture, water and sanitation, and government and civil society capacities can serve as an indicator of intentions going forward. (See Chart 22)
The pace of large increases for health disappeared after 2010.
During the first decade of the 21st century, ODA disbursements for basic health, reproductive health, including HIV AIDS, and environmental protection expanded appreciably (Chart 22). Basic health / reproductive health increased from US$2.6 billion in 2000
to US$11.1 billion in 2010 (2014 constant dollars). But after 2010, donors failed to maintain this pace of increasing investments in these areas, which are crucial for people living in poverty.
Investments in basic education have shrunk since 2010.
From 2000 to 2010 donor ODA contributions for basic education grew by close to 120%. But since 2010 basic education seems to have declined as a priority. Contributions have decreased from US$3.7 billion in 2010 to US$3.0 billion in 2014 (2014 constant dollars). Progress was made in the 2000s towards achievement of the Education for All goals, but a major effort is needed to complete full enrollment in quality primary education. The SDGs make it clear that it is also important to focus on secondary and tertiary education objectives.
In other sectors, water and sanitation increased until 2008 to US$5 billion, but has stagnated, remaining at US$5.5 billion in 2014.
Investments in strengthening government and civil society capacities grew dramatically up until 2010 (by 335%), but recently they have declined by approximately 10%.
Strengthening government and civil society has been a strong donor focus in the 2000s. But ODA for this purpose declined by 10% after 2010 and is now down to US$12.9 billion. However, this amount is still almost 25% higher (by value in 2014 constant dollars) than a decade ago, in 2005.
Agriculture investments grew from 2005 to 2010, but since 2010 have been more or less flat.
Benefiting from the L’Aquila 2009 G7 initiative in food security and agriculture, ODA for agriculture increased by 67% to reach US$4.5 billion in 2010. Since then, increases have been modest - around 4% to US$4.7 billion in 2014 (2014 constant dollars). Billions of people still rely on small-scale agriculture for their livelihoods, which is under increasing pressure. Issues include access to fertile land, availability and use of appropriate technology and credit, and the impact of climate extremes caused by climate change.
Dramatic increases in ODA are required to meet sector goals by 2030.
There is no commitment in Transforming our world or in the AAAA in terms of the extent to which ODA will be called

The Reality of Aid 2016 Report
52
ODA providers are encouraged to consider setting a target to provide at least 0.20 per cent of ODA/GNI to least developed countries.” [Transforming our world, 17.2, A/RES/70/1, 26/35]
There has been a positive shift in the 2000s in ODA disbursements to Least Developed and Low Income Countries.
The past fifteen years have seen a positive shift in ODA disbursements to the Least Developed and Low-Income Countries. This trend is true both as a proportion of total ODA [46.4% in 2014] (Chart 23) and in the value of the ODA disbursed [US$28.3 billion in 2014] (Table Three). Unfortunately, by both measures, ODA to these countries has leveled off and even declined slightly since 2010.
The share of ODA to LDCs and LICs has leveled off and declined since 2010.
Disbursements, as a proportion of total ODA, to the Least Developed and Low Income Countries (2014 DAC list of LDCs and LICs) have been increasing since 2000 (by
upon to ramp up investments to meet the SDGs. But saying this, there is little doubt that the financial needs are enormous.
Table Two provides an overview of the scale of extra public investments required (including from additional government revenue in developing countries) in several important sectors for poor and vulnerable people. For these four sectors – education, health, agriculture and water and sanitation – the additional annual public investments total approximately US$175 billion. These estimates also presume considerable additional private sector investments. Clearly a dramatic increase in ODA is required irrespective of progress that can be made in domestic resource mobilization.
5.2 Allocation of ODA by Country Income Group
“Developed countries to implement fully their official development assistance commitments, including the commitment by many developed countries to achieve the target of … 0.15 to 0.20 per cent of ODA/GNI to least developed countries;
Chart 22: Growth in Value of ODA Disbursements to Key Sectors for the SDGs

53
Global Aid Trends, 2016 Financing Agenda 2030: Where are the resources
Sector Extra Public Spending(US$ billions annually) 2014 ODA Sector Investment
Education US$22 billion+ US$9.1 billionHealth US$51 to US$80 billion US$14.1 billionAgriculture US$51 billion US$4.9 billionWater and Sanitation US$22 to US$24 billion US$4.5 billion
Sources: Development Finance International and Oxfam, Financing the Sustainable Development Goals, Government Spending Watch Report 2015, page 31, accessed April 2015 at http://eurodad.org/files/pdf/1546383-financing-the-sustainable-development-goals-lessons-from-government-spending-on-the-mdgs.pdf; and OECD Dataset, DAC5, current dollars.
Table Two: Estimates of new investments required for key SDG social and productive sectors
36%). In 2010 they reached 49% of ODA disbursements (country allocated, not including debt cancellation). Since 2010, the share of these disbursements in ODA has fluctuated, and in 2014 it declined to 46% of ODA. The preliminary DAC figures for 2015, however, project an increase in DAC disbursement for LDCs.81
While the dollar value of ODA to these countries (in 2014 dollars) has increased by more than 50% since 2005 (Table Three), there has been a decline in its value since 2010. This trend is true for both bilateral and multilateral aid.
Aid to LMICs fell from 2000, but has been holding steady since 2010.
Disbursements to Lower Middle Income Countries (LMICs) declined slightly from 34% of ODA in 2000 to 31% in 2014. In terms of dollar value, bilateral ODA to LMICs increased by 25% since 2005, but has declined slightly since 2010. On the other hand, the value of multilateral ODA increased by close to 80% between 2005 and 2014, with an increase of 30% between 2010 and 2014. It is essential to maintain these ODA disbursements, as poverty in these countries is pervasive.
Chart 23: Disbursements of ODA by Income Group
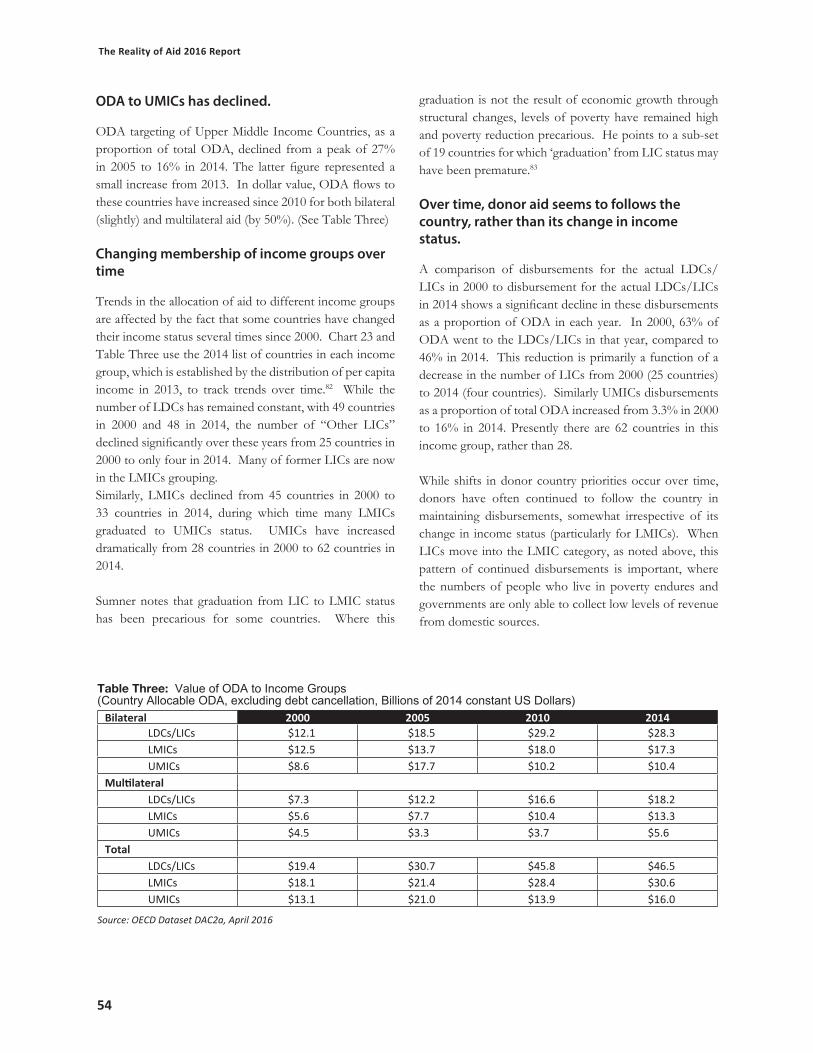
The Reality of Aid 2016 Report
54
ODA to UMICs has declined.
ODA targeting of Upper Middle Income Countries, as a proportion of total ODA, declined from a peak of 27% in 2005 to 16% in 2014. The latter figure represented a small increase from 2013. In dollar value, ODA flows to these countries have increased since 2010 for both bilateral (slightly) and multilateral aid (by 50%). (See Table Three)
Changing membership of income groups over time
Trends in the allocation of aid to different income groups are affected by the fact that some countries have changed their income status several times since 2000. Chart 23 and Table Three use the 2014 list of countries in each income group, which is established by the distribution of per capita income in 2013, to track trends over time.82 While the number of LDCs has remained constant, with 49 countries in 2000 and 48 in 2014, the number of “Other LICs” declined significantly over these years from 25 countries in 2000 to only four in 2014. Many of former LICs are now in the LMICs grouping. Similarly, LMICs declined from 45 countries in 2000 to 33 countries in 2014, during which time many LMICs graduated to UMICs status. UMICs have increased dramatically from 28 countries in 2000 to 62 countries in 2014.
Sumner notes that graduation from LIC to LMIC status has been precarious for some countries. Where this
graduation is not the result of economic growth through structural changes, levels of poverty have remained high and poverty reduction precarious. He points to a sub-set of 19 countries for which ‘graduation’ from LIC status may have been premature.83
Over time, donor aid seems to follows the country, rather than its change in income status.
A comparison of disbursements for the actual LDCs/LICs in 2000 to disbursement for the actual LDCs/LICs in 2014 shows a significant decline in these disbursements as a proportion of ODA in each year. In 2000, 63% of ODA went to the LDCs/LICs in that year, compared to 46% in 2014. This reduction is primarily a function of a decrease in the number of LICs from 2000 (25 countries) to 2014 (four countries). Similarly UMICs disbursements as a proportion of total ODA increased from 3.3% in 2000 to 16% in 2014. Presently there are 62 countries in this income group, rather than 28.
While shifts in donor country priorities occur over time, donors have often continued to follow the country in maintaining disbursements, somewhat irrespective of its change in income status (particularly for LMICs). When LICs move into the LMIC category, as noted above, this pattern of continued disbursements is important, where the numbers of people who live in poverty endures and governments are only able to collect low levels of revenue from domestic sources.
Table Three: Value of ODA to Income Groups (Country Allocable ODA, excluding debt cancellation, Billions of 2014 constant US Dollars)
Bilateral 2000 2005 2010 2014LDCs/LICs $12.1 $18.5 $29.2 $28.3LMICs $12.5 $13.7 $18.0 $17.3UMICs $8.6 $17.7 $10.2 $10.4
MultilateralLDCs/LICs $7.3 $12.2 $16.6 $18.2LMICs $5.6 $7.7 $10.4 $13.3UMICs $4.5 $3.3 $3.7 $5.6
TotalLDCs/LICs $19.4 $30.7 $45.8 $46.5LMICs $18.1 $21.4 $28.4 $30.6UMICs $13.1 $21.0 $13.9 $16.0
Source: OECD Dataset DAC2a, April 2016
55
Global Aid Trends, 2016 Financing Agenda 2030: Where are the resources
Are DAC donors meeting the AAAA target for allocation of ODA to LDCs?
DAC donors are in fact not far off the mark for the AAAA target, which calls for an allocation of 50% of ODA to Least Developed Countries, when ODA is adjusted for components that can never be assigned to a country (for example, imputed in-donor country expenditures). Only a few donors, however, have achieved the 0.15% of GNI target. If this 0.15% goal had been achieved in 2014 it would have resulted in US$69.5 billion for LDCs, instead of the US$42.5 billion disbursed, amounting to a 50% increase in disbursements to LDCs (US$23.2 billion). This shift in ODA is possible. Further, progress in donors’ realizing the 0.7% UN target would greatly facilitate meeting this AAAA GNI target for LDCs in the future.
ODA allocations need to take account of where people living in poverty are living, not just the different income groups. In fact, the majority of poor people live in Middle-Income Countries.
Targets for the allocation of aid between income groups need to take into account the actual disbursement of people living on US$1.90 a day and US$3.10 a day in these countries. Not all people living in poverty live in the Least Developed Countries.
Table Four points out that a majority of extremely poor people (those living on US$1.90 a day) actually live in Middle-Income Countries, principally LMICs. The large populations of extremely poor people in India (LMIC) and China (UMIC) are a major factor in these percentages. For the broader measure of poverty (US$3.10 a day), almost two-thirds (63%) live in Middle-Income countries. Disaggregating those living on a daily income between US$1.90 and US$3.10, (i.e. poor people on the margins of extreme poverty), fully 73% of this group live in Middle-Income Countries.
Table Four: Distribution of Poverty by Country Income Groups
US$1.90 a Day
US$3.10 a Day
Between US$1.90 and US$3.10 a Day
LDCs/LICs 48% 37% 27%
LMICs 37% 45% 52%
UMICs 15% 18% 21%
Source: World Bank PolCal Net Dataset, March 2016
5.3 Trends in Geographic and Regional Distribution of ODA
“[We] reaffirm the importance of supporting the new development framework, ‘the African Union’s Agenda 2063’, as well as its 10-year Plan of Action, as a strategic framework for ensuring a positive socio economic transformation in Africa within the next 50 years and its continental programme embedded in the resolutions of the General Assembly on the New Partnership for Africa’s Development (NEPAD). … We will enhance international cooperation, including ODA, in these areas, in particular to least developed countries, landlocked developing countries, small island developing States, and countries in Africa.” [Addis Ababa Action Agenda §8 and §120]
The proportion of ODA to Sub-Saharan Africa (44% in 2014) has remained more or less static since 2010.
Improving DAC donor allocations for development efforts in Sub-Saharan Africa was a priority in the first decade of 2000s. As noted in Chart 24, there has been some success, moving from 34% of total ODA in 2000 to 43% in 2010.But since 2010, the proportion of total ODA to the sub-continent has remained relatively constant (44% in 2014). A slightly different pattern is apparent in DAC bilateral aid. DAC bilateral aid to Sub-Saharan Africa exhibited smaller increases in the first decade, moving from 33% of total bilateral aid in 2000 to 39% in 2010. But since 2010, the proportion of bilateral aid to the sub-continent has shown a modest improvement, with 43% of bilateral assistance directed to that region in 2014 (Chart 25).
Although aid to Asia has diminished, ODA to Afghanistan is still prominent.
The proportion of total ODA to Asia has declined over the 15 years from 2000 (30%) to 2014 (24%). A similar decline is evident for bilateral assistance to the region. Afghanistan, however, is the exception. In 2000 bilateral aid to this country was negligible, but by 2005 it accounted for 16% of total bilateral aid to Asia. It showed a major increase in 2012, at 32% of total bilateral aid to Asia. The most recent figures (2014) indicate that bilateral aid to Afghanistan accounted for 23% of aid to Asia for that year.

The Reality of Aid 2016 Report
56
Chart 24: Trends in Regional Distribution of ODA
Chart 25: Trends in Regional Distribution of Bilateral ODA

57
Global Aid Trends, 2016 Financing Agenda 2030: Where are the resources
5.4 Promoting Gender Equality and Women’s Empowerment
“We reaffirm that achieving gender equality, empowering all women and girls, and the full realization of their human rights are essential to achieving sustained, inclusive and equitable economic growth and sustainable development. We reiterate the need for gender mainstreaming, including targeted actions and investments in the formulation and implementation of all financial, economic, environmental and social policies.” [Addis Ababa Action Agenda, §6]
SDG-5 affirms the importance of achieving gender equality and women’s empowerment. All countries agreed to “adopt and strengthen sound policies and enforceable legislation for the promotion of gender equality and the empowerment of all women and girls at all levels.” [Transforming our world, 5c, A/RES/70/1, 18/35] Women’s empowerment has several dimensions. Realizing gender equality rights is, of course, key but just as important is the establishment of approaches to achieve development outcomes that fully include women and girls and take into account the realities of their lives. How well has ODA contributed to these goals to date?
Measuring ODA that targets gender equality: Questions about the OECD’s gender policy marker.
The OECD DAC uses a project policy marker to track donor disbursements for gender equality and women’s empowerment. Donors are asked to screen and score their projects according to three criteria: 1) gender equality is the principal objective of the project (gender equality is the stated primary goal); 2) gender equality is a significant objective (gender equality is one of several objectives of the activity); or 3) there are no gender equality objectives in the activity.
There are several questions related to the interpretation of this system, particularly with the “significant” marker. Donors tend to employ different interpretations of the meaning of a “significant” gender objective, a problem for inter-donor comparability. But also as a policy marker, donors count the full value of the activity when an activity is deemed “significant,” even though gender equality may only be one of several objectives.84 In both cases this can produce inaccurate results, ones that exaggerate the financial commitment to gender equality and women’s empowerment.
Focusing on gender equality as a principal objective can be a proxy indicator of donor targeting gender equality in ODA.
The challenges in determining actual levels of support for gender equality in projects where gender equality is a significant objective (intended to demonstrate gender mainstreaming), requires the use of a proxy indicator. In this regard, activities where gender equality is marked as the “principal” objective can provide an indication of the importance donors give to gender equality in their aid allocations. Chart 26 only looks at DAC data for the period 2010 to 2014, as earlier years are both unreliable and incomplete.
Support for gender equality as a principal objective in projects has increased in value, but remain a very small proportion of screened bilateral ODA.
Over the past five years, allocations to projects where gender equality is a principal objective have increased slightly as a share of screened bilateral ODA, from 4% in 2010 to 4.7% in 2014. The value of this ODA (in 2013 dollars) however increased from US$3.1 billion to US$5.3 billion, a significant increase of 70%, although from a very low base of US$3.1 billion.
Five donors account for 75% of bilateral ODA activities with a gender marker of principal objective – the United States (37% of the marker total), the UK (16%), Sweden (10%), the Netherlands (6%) and Norway (6%).
There have been improvements in the coverage of the gender policy marker since 2010. However, 70% of projects that were screened had no gender equality objectives.
The percentage of bilateral aid activities that were not screened for gender equality marker has declined sharply since 2010, from 32% to 9% in 2014. In practice this means that there is currently a more comprehensive picture of DAC donors’ gender policy priorities. Only 25% of activities in 2014 were marked “significant,” implying that they involve gender mainstreaming. In that same year an alarming 70% of screened activities had no gender equality objectives.
This poor performance on allocation of aid for purposes relating to gender equality is in stark contrast to the rhetoric of donors on gender equality and women’s empowerment as an essential condition for making progress in the 2030 Agenda.

The Reality of Aid 2016 Report
58
Chart 26: DAC Bilateral ODA: Trends in the Gender Marker, 2010 to 2014
ODA with gender equality markers is concentrated in health, education and civil society projects.
Table Five sets out the sector distribution of ODA with a gender equality marker (either principal or significant). As might be expected, projects where gender equality is the principal objective are concentrated in the social sectors such as health, education or civil society. Education, health (including reproductive health), government and civil society, economic services (micro-finance), agriculture and humanitarian aid were priority sectors for gender mainstreaming (“significant objective”) in 2014.
The share of ODA toward donor support for gender equality organizations is almost invisible.
A second indicator of DAC donors’ commitment to gender equality is demonstrated by the support they provide to gender equality organizations. In 2014 this
support amounted to US$451 million, an increase of US$30 million from 2013, and the first significant increase since 2010.85 Two donors – Australia and Sweden – accounted for most of this increase. But as a share of all screened aid activities for the gender marker, support for these organizations is almost invisible at 0.4%. Even as a share the small number of activities marked “principal” for gender equality objectives, women’s rights organizations received only 8.5% of this ODA in 2014. These are the organizations that will be the main drivers of the gender equality SDG.
There is limited donor support for an enabling environment for women’s rights and empowerment.
In 2015 the Association for Women’s Rights in Development (AWID) and 1000 women’s rights organizations criticized the international community, saying that

59
Global Aid Trends, 2016 Financing Agenda 2030: Where are the resources
“[once again it had failed] to recognize the critical and unequivocal role women’s organizations, feminist organizations and women human rights defenders have played in pushing for gender equality, the human rights and empowerment of women and girls.”
This picture of the real priorities for gender equality in the allocations of donor ODA confirms this observation. In recent years, women’s rights organizations have pushed governments to “to commit to creating an enabling environment and resources to allow women’s organizations, feminist organizations and women human rights defenders to be able to do their work free from violence.”86 Their efforts have met with little success to date.
5.5 Demand-Led Technical Cooperation for Partner Countries?
Technical cooperation (TC) has been a strategic resource for donors and partner countries since the launch of aid programs in the 1960s. The dollar value of this resource increased in the early 2000s, but has been declining over the past eight years as a share in donor ODA disbursements. Donors in the 2008 Accra Agenda for Action agreed that
“Donor support for capacity development will be demand-driven and designed to support country ownership. To this end, developing countries and donors will i) jointly select and manage technical co-operation, and ii) promote the provision of technical co-operation by local and regional resources, including through South-South co-operation.”
Recognizing that it is hard to measure the degree to which technical cooperation has been lead by partner country priorities and management, this section identifies some macro trends in TC.
The value of technical cooperation has been declining since the mid-2000s.
As indicated by Chart 27, the value of technical cooperation (in 2013 dollars) has declined by more than 30% since 2006. The 2014 figure (US$17.8 billion) is below the 2000 level (US$20.2 billion). These shifts in the priority and use of TC have primarily been with bilateral donors. In contrast, the value of multilateral cooperation TA has been relatively stable since 2000.
The changing priority for TC as an aid modality for bilateral donors is apparent Chart 28, which shows the share of TC in DAC Real Bilateral ODA since 2000. TC has dropped from 24% of Real Bilateral Aid in 2010 to 19% in 2014.
As a share of Real Bilateral ODA bilateral technical cooperation, has declined significantly since its peak of 48% share in 2003. From 2007 to 2013 it maintained a level of around 24% but fell to 19% in 2014. It is difficult to predict whether this decline will continue.
Table Five: Sector Distribution of Bilateral ODA marked gender equality, 2014 Percentage of Total Marker Category (Sector allocable)
Percentage of Marker Total (Sector Allocable)
2014
Principal Significant
Social Infrastructure and Services 80.5% 65.3%
Education 11.0% 16.4%
Basic Education 6.2% 4.0%
Health 17.6% 9.1%
Basic Health 15.5% 6.5%
Reproductive Health 22.1% 8.4%
Water and Sanitation 3.6% 6.4%Government and Civil
Society 24.7% 21.0%Women’s Equality
Organizations 8.8% 0%
Conflict, Peace and Security 2.4% 4.1%Economic Infrastructure
and Services 2.7% 10.1%
Production Sectors 9.6% 11.7%
Agriculture 8.8% 8.9%
Cross Cutting, Multi-Sectors 7.2% 13.0%
Humanitarian Aid 1.8% 11.9%
Other Sectors 2.7% 10.1%
Source: OECD Dataset: Aid projects targeting gender equality and women’s empowerment, CRS

The Reality of Aid 2016 Report
60
Chart 27: Trends in the Value of Technical Cooperation, 2000 to 2014
Chart 28: Trends in Bilateral Technical Cooperation as a Percentage of Real Bilateral ODA

61
Global Aid Trends, 2016 Financing Agenda 2030: Where are the resources
The distribution of TC by country income groups indicates that almost half is allocated to LDCs/LICs.
In 2014, 44% of TC was disbursed LDCs and LICs, with 22% in LMICs and 19% in UMICs. About 15% of TC was not implemented in a specific country. Surprisingly governments with low revenue per capita are not a clear priority for this assistance. Although 51% went to countries with less than $1,500 per capita revenue, 43% went to countries with per capita revenue above $1,500 and 23% to those with per capita revenue over $3,000.
Germany, Japan and France account for 60% of bilateral TC in 2014.
As indicated by Table Six below donor countries’ share of TC in their ODA varies considerably. For example, Germany allocates close to 50% of its bilateral ODA through technical cooperation, while for United States TC was only 2.7% of bilateral ODA in 2014. Germany, Japan and France accounted for more than 60% of TC in 2014. These three donors also account for the largest share of loans in their bilateral ODA.
Six sectors receive the bulk of technical cooperation.
An interesting question is the sectors that receive the largest investments in TC. Unfortunately, there is insufficient data for a definitive answer. However, based on the 2014 disbursements of US$5.5 billion in TC (out of a total of US$15.5 billion), Table Seven provides a tentative breakdown. As indicated, government and civil society sectors received the largest share, with education
Table Six: Share of Technical Cooperation in Donor ODA (2014)Share of TC in Donor Bilateral ODA
Donor Share of TC Donor Share of TC
Germany 46.9% United Kingdom
13.4% (2013)
Austria 43.9% Sweden 13.3%
Belgium 36.9% The
Netherlands12.0%
Japan 33.2% Norway 6.2%
Australia 32.8% United States 2.7%
France 32.2% Denmark 2.6%
Source: OECD Dataset DAC2a, April 2016
not far behind. Six sectors received more than 87% of these TC disbursements.
Table Seven: Allocation of Technical Cooperation within Sectors (2014)Note: Due to data limitations this table allocates US$5.5 billion out of total bilateral TC of US$15.5 billion
Sector Share of Allocable Technical Cooperation
Government and Civil Society 27.7%
Education 21.7%
Multi-Sector 18.2%
Agriculture 9.1%
Health 6.5%
Conflict, Peace and Security 6.1%
Source: OECD Dataset DAC2a, April 2016
Peace and security, social infrastructure, basic education and public sector policy have the largest share of TC within a sector allocation of bilateral ODA.
In which sectors is TC playing the largest role? Table Eight shows the share of TC in disbursements for various sectors. Four areas utilized the greatest amount of TC resources in aid directed to this sector – 1) promoting conflict resolution, peace and security, 2) developing capacities for basic education, 3) public sector policy and administration reform, and 4) modernizing agricultural practices.
Table Eight: Allocation of Technical Cooperation with Sectors (2014)Note: Due to data limitations this table allocates US$5.5 billion out of total bilateral TC of US$15.5 billion
Sector Share of Allocable Technical Cooperation
Conflict, Peace and Security 14.0%
Other Social Infrastructure and Services 13.9%
Basic Education 12.6%
Public Sector Policy and Administration 10.3%
Agriculture 9.7%
Production Sectors 8.6%
Source: OECD Dataset DAC2a, April 2016

The Reality of Aid 2016 Report
62
5.6 Climate Finance and ODA: Balancing adaptation and mitigation
The Conference of the Parties, “decides that … developed countries intend to continue their existing collective mobilization goal [USD 100 billion per year] through 2025 in the context of meaningful mitigation actions and transparency on implementation; prior to 2025 the Conference of the Parties … shall set a new collective quantified goal from a floor of USD 100 billion per year, taking into account the needs and priorities of developing countries.” [Paris Agreement, §54]
“Decides that the Green Climate Fund and the Global Environment Facility, the entities entrusted with the operation of the Financial Mechanism of the Convention, as well as the Least Developed Countries Fund and the Special Climate Change Fund, administered by the Global Environment Facility, shall serve the Agreement.” [Paris Agreement, §59]
An ambitious Paris Agreement was reached at COP21 in December 2015.
The Conference of the Parties (COP21) to the UN Framework Convention on Climate Change (UNFCCC), in Paris (December 2015), brokered an historic, far-reaching and legally binding Paris Agreement with ambitious measures for the mitigation and adaptation to climate change. While commitments by governments reported to COP21 are still insufficient to meet the stated aim to keep global warming “well below 2o C above pre-industrial levels”, the ‘parties’ have agreed to review emission targets every five years and implement other actions to ensure that this goal is achieved. Furthermore, parties have agreed “to pursue efforts to limit the temperature increase to 1.5 °C above pre-industrial levels, recognizing that this would significantly reduce the risks and impacts of climate change.” [Annex, Article 2] Article 2 also acknowledges, “This Agreement will be implemented to reflect equity and the principle of common but differentiated responsibilities and respective capabilities, in the light of different national circumstances.”
Given these ambitious goals and actions, governments adhering to the Paris Agreement recognize “the urgent need to enhance the provision of finance … in a predictable manner, to enable enhanced pre-2020 action by developing country Parties [Paris Agreement, Preamble].”
Article 9 (in the Annex) calls on developed countries to maximize the mobilization of resources from all sources, “noting the significant role of public funds,” whereby “such mobilization of climate finance should represent a progression beyond previous efforts.”
Currently there is no agreement on what and how to count climate finance to reach the US$100 billion goal by 2020.
While Article 9 calls on developed countries to “to take the lead in mobilizing climate finance from a wide variety of sources, instruments and channels, noting the significant role of public funds,” sources for this finance are ambiguous and contested. A central question is what constitutes climate finance and how should it be measured?
After more than a decade of discussion there is no general agreement on this question. The UNFCCC Committee of Finance in 2014 put forward an initial definition:
“Climate finance aims at reducing emissions, and enhancing sinks of greenhouse gases and aims at reducing the vulnerability of, and maintaining and increasing the resilience of, human and ecological systems to negative climate change impacts.”
However, the Parties to the Convention have not formally endorsed this statement.87
What is the most appropriate modality for climate finance?
Another topic of debate is the most appropriate modality for climate finance – grants or loans. CSOs argue that grants are the appropriate modality, particularly for adaptation. They maintain that developing countries should not be put in the position of increased debt burdens to mitigate or adapt to conditions for which they bear no responsibility.88 This brings up another question: Should climate finance be measured as gross flows, including all loans, or on a net flow basis (less repayment of debt), and counting only concessional public and private finance? Even more ambiguous is the question of counting private finance and investment for mitigating and adapting to climate impacts. None of these questions have been resolved.
Will climate finance be additional to ODA?
Unfortunately, the concerns of developing countries and CSOs for “new and additional” climate finance (above commitments to ODA) all but fell off the agenda in the

63
Global Aid Trends, 2016 Financing Agenda 2030: Where are the resources
Paris meetings. Should climate related activities in ODA, where the donor performance is less than the UN target of 0.7% of GNI, be available for donors to include when measuring their contributions to the US$100 million goal? At the COP17 in Bali in 2007, Parties agreed to the principle of “additionality.” Much of the donor-sourced Fast Track Climate Finance, agreed at COP19 in Copenhagen in 2009, was not necessarily new and additional, but was drawn from and reported as ODA. In the Paris Agreement, what constitutes “progression beyond previous efforts” remains ambiguous.
The question is: How much climate finance to date, and for whom?
When it comes to accountability for financing commitments, all the above issues will inevitably affect the accuracy, credibility, and ultimately the ambition, of reported climate finance by the Parties to meet the Paris targets.
How much progress has been made to date with respect to the US$100 billion target? In a comprehensive report, the OECD suggests that private and public finance by developed countries for “climate action” in developing countries reached US$62 billion in 2014, up from US$52 billion in 2013.
For the purposes of the OECD assessment, climate actions are all investments targeting “low carbon or climate resilient development,” which do not include coal. According to the report, more than 70% of these flows were bilateral or multilateral public funding (including non-concessional loans) and 25% were private sourced funds mobilized through donor public financial activities. The small remaining funds were export credits. But the report acknowledges that the data gathering methodologies had varying degrees of coverage and consistency, as they were subject to different accounting methods among donors.89
The OEDC report also demonstrates that only one sixth of this financing went to adaptation, and that 75% targeted mitigation projects. In Paris, the Agreement calls for an improved balance: “The provision of scaled-up financial resources should aim to achieve a balance between adaptation and mitigation, taking into account country-driven strategies, and the priorities and needs of developing country Parties …” [Annex, Article 9] Poor and vulnerable people will be disproportionately affected by extreme climatic events; investment in adaptation is critical for development efforts that strengthen resilience to climate change for the most affected populations and countries.
Donor bilateral climate finance is reported to the OECD on a policy marker basis. This gives unreliable estimates of the total value of actual climate finance.
The OECD has developed an ODA policy marker for DAC donor climate finance targeting mitigation and adaption, either as a “principal” objective of a project, or as a “significant” objective (one among several other objectives). But the full value of a project is included for projects screened as “significant.” Projects may also be screened as both mitigation and adaptation.
In 2014, DAC donors marked US$18.8 billion in projects, or 14.4% of aggregate aid, as targeting mitigation (including dual targeting with adaptation). Another US$12.4 billion, or 9.9% of aggregate aid, was marked as targeting adaptation (including dual targeting with mitigation).90 The OECD estimate that approximately US$19 billion (or about 16% of Real ODA for these years) was reported to the UNFCCC as climate finance for 2013/14.91 However, this amount should be viewed with caution due to the limitations of the marker system noted above. Each donor also uses its own coefficient and methodology for determining the portion of ODA activities marked climate finance that will be reported to the UNFCCC.92
It is also interesting to note that in 2014 five donors (Germany, Japan, France, the US, and Norway) provided more than 79% of marked climate finance for mitigation. These same five donors, with the substitution of Sweden for Norway, provided 67% of adaptation finance. In terms of activities marked as climate mitigation as a principal objective, almost half were concentrated in Asia, with only 6.7% in Sub-Saharan Africa. For activities marked climate adaptation as a principal objective, 21% were focused in Sub-Saharan Africa, with another 30% concentrated in Asia.93
What climate finance commitments were made in Paris?
At the Paris Conference, donors made more than US$1.5 billion in new commitments to climate funds. These included US$260 million to the Green Climate Fund, mandated by the UNFCCC as the primary financial instrument for public climate finance. Other commitments were made to the Least Developed Countries Fund (US$252 million), the Global Climate Change Alliance (US$380 million), the Forest Carbon Partnership Facility (US$339 million), the REDD+ Early Movers Program (US$113 million), and the Adaptation Fund (US$75 million).

The Reality of Aid 2016 Report
64
Additional commitments for new initiatives were made to insurance resilience funds (more than US$2 billion in coverage), the Green Wall for the Sahara and Sahel (US$2.2 billion), and the World Bank’s Transformative Carbon Asset Facility (US$500 million), among others.94
In the lead-up to the Paris Conference, China made a major commitment of US$3.1 billion in South South Cooperation for climate finance.
The Green Climate Fund is fully operational. But what will be the sources for “new and additional” finance for climate action?
The Green Climate Fund is now the largest climate facility. It has more than US$10 billion in pledges, and US$2.9 billion in paid up funds. The first grants were allocated in September 2015 and the Fund expects to allocate US$2.5 billion by the end of 2016.95
The launch of the Green Climate Fund with sizable pledges will play a significant role in meeting the Paris Agreement’s climate action goals. However, without clarity and agreement on what constitutes targeted climate finance towards these goals, the ambition of US$100 billion for these actions by 2020 is likely to be unattainable. The World Resources Institute has set out several financing scenarios, which implies that high to medium growth in the levels of developed country climate finance for developing countries will be required.96 But will these investments be “new and additional” to ODA, or will they come at the expense of the urgent need to expand ODA financing to meet the full range of sustainable development goals?
6. Other Sources of Development
Cooperation Finance
“[A revistalized Global Partnership] will facilitate an intensive global engagement in support of implementation of all the Goals and targets, bringing together Governments, the private sector, civil society, the United Nations system and other actors and mobilizing all available resources.” [Transforming our world, §39]
“We acknowledge the role of the diverse private sector, ranging from micro-enterprises to cooperatives to multinationals, and that of civil society organizations and philanthropic organizations in the implementation of the new Agenda.” [Transforming our world, §41]
Governments are the foundation for setting the requisite policies, programs and finance to implement Agenda 2030 inside the priorities established by each country. ODA will play a crucial role in complementing government revenues for these purposes. But ODA alone is insufficient to meet the financing needs of developing countries, even if donors were to meet their 0.7% commitments on aid quantity. Other sources of financing are essential. The international community meeting in 2015 on Financing for Development, the SDG, and Climate Change identified middle-income aid providing countries through South-South Cooperation, the mobilization of citizens’ resources by CSOs, and investments by the private sector to help fill these funding gaps.
6.1 South-South Cooperation Aid Providers
“South-South cooperation is an important element of interna tional cooperation for development as a complement, not a sub stitute, to North-South cooperation. We recognize its increased importance, different history and particularities, and stress that South-South cooperation should be seen as an expres-sion of solidarity among peoples and countries of the South, based on their shared experiences and objectives. … We welcome the increased contributions of South-South coop eration to poverty eradication and sustainable development. We encourage developing countries to voluntarily step up their efforts to strengthen South-South cooperation….” [Addis Ababa Action Agenda, §56 & §57]
In the lead-up to the Special General Assembly’s adoption of the 2030 Agenda, Secretary-General Ban Ki-moon urged “the acceleration of the development momentum across the global South.” He noted the key role South-South Cooperation (SSC) can play in its implementation. Alicia Bárcena, Executive Secretary of the UN ECLAC (Economic Commission for Latin America and the Caribbean), reflected a common refrain in the international community when she recently asserted the unsustainability of “the current pattern of development.” She called for a change of paradigm, saying that “here South-South cooperation plays a central role.”97
The April 2014 High Level Meeting (HLM) for the Global Partnership for Effective Development Cooperation in Mexico welcomed,
“the initiatives undertaken by Southern partners to deepen the understanding of the nature and modalities of South-South Cooperation and the

65
Global Aid Trends, 2016 Financing Agenda 2030: Where are the resources
ways and means to enhance its development impact as well as its potential synergies with the efforts of other development cooperation partners and modalities.” [§27]
The second HML, scheduled to take place in Nairobi, November 2016, is expected to continue this focus on SSC as a key resource for the SDGs.
Concessional South-South Cooperation forms only part of an emerging parallel development finance architecture.
South-South Cooperation represents a broad range of assistance efforts between middle-income SSC providers and other developing country partners. SSC financing extends beyond the scope of concessional development finance. In an increasingly multi-polar world, several rapidly developing middle-income countries, lead by China, are creating a parallel development finance architecture. These initiatives include the recently launched the BRICS New Development Bank, the Chinese-sponsored Asia Infrastructure Development Bank, and China’s South-South Cooperation Fund.
These Southern-initiated institutions create new and alternative opportunities for country governments seeking development finance. However, some concerns and cautions have been noted. For example, when the New Development Bank made its first loans in early 2016, civil society critics expressed concern about the absence of transparency and sufficient environmental and social safeguards in the Bank’s approval processes.98
A focus on SSC concessional flows
SSC providers have been allocating highly concessional development finance (loans and grants), whose terms parallel the rules for determining ODA established by the OECD DAC. While not underestimating the medium term importance of the various institutional initiatives noted above, the focus here is on trends for SSC concessional flows. Can they be scaled-up to finance the SDGs alongside more traditional aid flows from DAC donors?
A number of SSC providers have been reporting their aid flows to the DAC, which, in turn, publishes them alongside those from DAC members. Unfortunately, other SSC providers have not regularly published up-to-date statistics for financial flows in support of development cooperation, comparable to DAC ODA. In the absence of this data, it is only possible to make informed estimates of total SSC concessional finance.
SSC aid flows increased to US$32.2 billion in 2014, but the increase since 2012 is highly concentrated among three donors – Saudi Arabia, Turkey and the UAE.
Table Nine provides an estimate for total concessional flows from SSC and other non-DAC donors. For the period of 2014/15, these flows amount to US$32.2 billion. According to OECD DAC sources, SSC flows have increased considerably since 2012, when the equivalent estimate put flows from these donors at US$12 billion.
Three donors accounted for 85% of the US$20 billion increase between 2012 and 2014/15 – Saudi Arabia,(increased by US$13.3 billion); United Arab Emirates (increased by US$3.6 billion) and Turkey (increased by US$1.4 billion). The primary focus for these donors, and the dramatic increases in SSC resources, is the ongoing crisis in the Middle East, particularly in Syria and Egypt.99
The Middle East accounted for almost 70% of SSC flows in 2014/15.
Chart 29 tracks the regional distribution of SSC and non-DAC donor flows. It is evident that the primary focus for 2014/15 flows is the Middle East and North Africa, which make up 73% of those flows distributed by region.100 Sub-Saharan Africa received only 9% of the recorded flows, most of which came from China and India. India is reported to allocate at least 80% of its concessional aid to its immediate neighbours, particularly Bhutan. While Arab aid providers are presently contributing much needed humanitarian support in the Middle East and North Africa, this is, hopefully, a time-specific urgency. So a high percentage of this aid may not be available for the 2030 Agenda, as it is likely to decline when the immediate humanitarian crises in the region subside.
China and India are the primary SSC aid providers beyond the Middle East, with approximately $5 billion in flows annually.
Among the other SSC providers, China and India (with a combined estimate of US$5 billion in concessional flows in 2014/15) are the primary providers outside the Middle East. Given the current political turmoil in Brazil, its future as a donor is unclear,101 and Mexico has not yet reported the regional distribution of its aid allocations.
For some years to come, SSC concessional aid flow targeting the SDGs is likely to be modest relative to the DAC flows.

The Reality of Aid 2016 Report
66
In terms of concessional flows, it is important to note that several SSC providers under-estimate their contributions to SSC through in-kind technical assistance. But given current realities for middle-income providers, the potential role of SSC in financing the SDGs, beyond China and India, with perhaps some contributions from Brazil, Mexico and South Africa, will be modest, when compared to current ODA allocations of DAC donors. However, the BRICS (Brazil, Russia, India, China and South Africa), as well as Mexico and Indonesia, may also provide significant non-concessional resources bilaterally or through various South-South development banks.
Triangular cooperation is modest to date.
A number of DAC donors have engaged in “triangular cooperation,” joint initiatives involving middle-income aid providers with DAC donors and partner countries in the South. These innovations in finance are often promoted at international meetings on development finance.
The OECD DAC recently completed a study that was based on a survey of actors involved in triangular
Chart 29: Distribution of South-South Cooperation and Non-DAC Donors’ Concessional Flows
cooperation. These actors were strong advocates for such efforts to build greater collaboration between development partners and to support developing country partners with innovative technical support. However, the findings also pointed to the lack of policies and guidelines for triangular cooperation. It notes, that at this stage, finance through triangular cooperation is still modest, where “most providers […] invested less than USD $10 million per year,” and “most developing countries received less than USD $5 million in total through triangular cooperation.”102
The role for China in future development cooperation in support of the SDGs is expanding.
At the end of 2015, China made a number of significant announcements regarding future initiatives for its development cooperation. At the Special Session of the UN for the SDGs in September, President Xi Jinping announced the creation of a US$2 billion fund to support South-South Cooperation. He committed to forgiving the debt owed China by relevant LDCs, landlocked developing countries, and small island developing countries.103

67
Global Aid Trends, 2016 Financing Agenda 2030: Where are the resources
Table Nine: Estimates of South South Cooperation Concessional Flows for Development (DAC ODA-like flows)
Aid Provider Concessional Assistance (millions US$) Notes a) SSC Providers Reporting to the DAC
Saudi Arabia $13,634 2014
United Arab Emirates $4,389 2015Turkey $3,913 2015Russia $1,140 2015Hungary $152 2015Israel $207 2015Kuwait $277 2014
Romania $214 2014
Chinese Taipei $274 2014
Nine (9) Other providers* $344 2014 and 2015b) SSC Providers Not Reporting to the DAC (estimates)
China $3,400 2014
India $1,600 2015Qatar $1,344 2013Brazil $500 2010
Mexico $530 2013South Africa $148 2014
Four (4) Other Providers** $174 2014
Total SSC Providers 2014/15 $32,240 (estimate) $11,952 in 2012 & $27,325 in 2013 (same sources)
Percentage of DAC Real ODA (2014) 26%Percentage of DAC Country Programmable Aid, including Humanitarian Assistance (2014) 46%
Sources: Providers reporting to the DAC: OECD Dataset DAC1a (2015 current prices);Providers not reporting to the DAC: OECD DAC Table 33a: Estimates of concessional finance for development (ODA-like flows) of key providers of development cooperation that do not report to the OECD-DAC, accessed April 2016 at http://www.oecd.org/development/stats/statisticsonresourceflowstodevelopingcountries.htm; For India, DevEx, “India’s Foreign Aid Budget: Where is the money going?,” March 9, 2015, accessed April 2016 at https://www.devex.com/news/india-s-2015-16-foreign-aid-budget-where-the-money-is-going-85666. * The nine providers are Bulgaria, Croatia, Estonia, Kazakhstan, Latvia, Liechtenstein, Lithuania, Malta, and Thailand.*** The four providers are Chile, Colombia, Costa Rica and Indonesia.
At the second Summit of the Forum on China-Africa Cooperation (December 2015), China’s President announced US$60 billion in funding for Africa over the next three years. This included:
• US$5 billion in interest free loans; • US$35 billion in preferential loans and export credit; • US$5 billion in additional capital for each of the
China-Africa Development Bank and Special Loans for the Development of African SMEs; and
• US$10 billion to support a fund for China-Africa production capacity development.104
There was no indication of the degree to which these announcements would affect the level of concessional finance (ODA-like) in future years.
6.2 Civil Society as Aid Providers
“Multi-stakeholder partnerships and the resources, knowledge and ingenuity of the private sector, civil society, the scientific community, academia,
philanthropy and foundations, parliaments, local authorities, volunteers and other stakeholders will be important to mobilize and share knowledge, expertise, technology and financial resources, complement the efforts of Governments, and support the achievement of the sustainable development goals, in particular in developing countries.” [Addis Ababa Action Agenda, §10]
While CSOs are recognized as critical actors in development, particularly in knowledge sharing and accountability, neither the AAAA nor Transforming our world put much emphasis on these organizations as important providers of development cooperation. The same can be said of the role of private foundations.
But CSOs provide significant financing for development. It is estimated that CSOs manage approximately US$70 billion in development assistance annually, primarily from DAC countries (taking into account both their privately raised funds and donor resources channeled through CSOs – see below).

The Reality of Aid 2016 Report
68
As a key partner for civil society in developing countries, CSOs are global development actors, playing multiple roles on the ground in communities. They contribute to innovative sector projects, support humanitarian assistance, and hold other development actors accountable to their commitments and good governance. At the same time, CSOs have witnessed a deteriorating enabling environment for their work in an increasing number of countries.105
ODA implemented by CSOs is increasing, reaching US$21.6 billion in 2014.
The DAC documents official aid resources channeled to CSOs (for purposes identified by CSOs) and through CSOs (for purposes identified by the donor and contracted to CSOs). In 2014, DAC donors provided US$18.7 billion to CSOs, with an additional US$2.9 billion channeled to CSOs by multilateral organizations. This makes for a total of US$21.6 billion in ODA implemented by CSOs. These amounts (in current dollars) have been slowly increasing since 2010 when US$18.6 billion of ODA was implemented by CSOs, translating into an increase of over 15% in the past four years.106
While proportions varied among DAC countries, together DAC donor bilateral ODA channeled through and to CSOs represented 22% of their Real Bilateral ODA in 2014, up from 20% in 2010.
An accurate estimate of private funds raised for development by CSOs is challenging.
Some DAC members provide estimates of private funds raised by CSOs in their country. Since 2010, these estimates have hovered around US$34 billion, with a small drop in 2014 to US$32.8 billion (mainly due to two donors not reporting in that year).107 Of this amount, US$26 billion in 2014, or more than 75%, was raised in the United States.
Given the reporting limitations, these estimates do not provide a comprehensive accounting of all private funds raised by CSOs. In 2013, the Center for Global Prosperity put total privately raised CSOs funds at US$48 billion globally, including US$370 million in Brazil, China, India and South Africa.108 The DAC also records that US$330 million was raised by CSOs in Turkey in 2014, and US$190 million in the United Arab Emirates.
Unfortunately, the Center for Global Prosperity has not produced a report on philanthropic contributions since 2013.
It is estimated that US$70 billion in development cooperation resources are raised and managed by CSOs.
While only an estimate, combining the DAC figures on ODA finance channeled through CSOs and the private financing identified by the Center for Global Prosperity, CSOs currently contribute at least US$70 billion in development cooperation.
6.3 The Private Sector, ODA and the SDGs
“Encourage and promote effective public, public-private and civil society partnerships, building on the experience and resourcing strategies of partnerships.” [Transforming our world, Goal 17.17, 27/35]
“Projects involving blended finance, including public-private partnerships, should share risks and reward fairly, include clear accountability mechanisms and meet social and environmental standards. … We also commit to holding inclusive, open and transparent discussion when developing and adopting guidelines and documentation for the use of public-private partnerships…” [AAAA, §48]
“Aid for Trade can play a major role. We will focus Aid for Trade on developing countries, in particular least developed countries, including through the Enhanced Integrated Framework for Trade-Related Technical Assistance to Least Developed Countries. We will strive to allocate an increasing proportion of Aid for Trade going to least developed countries …” [AAAA, §90]
Private sector investment is a crucial component to achieving the SDGs by 2030, particularly in areas of economic infrastructure, sustainable livelihoods and decent jobs. As a strategy to deal with the financing gap, donors have been eager to bring the business sector to the table to discuss financing options for the SDGs. At the same time, they are expanding options for using ODA as a means to increase private sector investment in support of the SDGs in the poorest countries.

69
Global Aid Trends, 2016 Financing Agenda 2030: Where are the resources
Corporate foreign investment is concentrated in the wealthy developing countries.
It is suggested that there has been a major shift towards private sector finance now available to developing countries that can be tapped for the SDGs, essentially marginalizing ODA as a development resource.
However, current allocations of private foreign direct investment (FDI) to developing countries tells a different message. Of the $690 billion in FDI directed to developing countries in 2014, 76% was invested in Upper Middle Income Countries, 17% in LMICs, and a mere 6.5% in Least Developed (LDCs) and Low Income Countries (LICs).109
Goodman and Hilton, in the Australian chapter for this Report, point to UNCTAD calculations demonstrating that foreign direct investment in physical operations (removing mergers and acquisitions) was only US$63 billion in 2014 for all developing countries, outside of China, Hong Kong, Taiwan, South Korea, Singapore and the UAE, with only US$1.5 billion to least developed countries.110 These investments of US$63 billion are just under DAC members’ total Real Bilateral ODA in that year (US$85.2 billion) – excluding in-donor student and refugee costs and debt cancellation.
Given the absence of significant investment opportunities in LDCs and LICs, the foreign private sector investment is unlikely to turn the tide with private financing for the SDGs, particularly in the poorest countries. In these countries the route to expanding opportunities for better livelihoods lies with strengthening the domestic private sector, and particularly small and medium enterprises, and the rural economy, as Reality of Aid argued in its 2012 Global Report.111
ODA support for private public partnerships (PPPs) is increasing, but remains a very small portion of ODA.
Calls for strengthening “private public partnerships” (PPPs) in support of the SDGs was a persistent refrain at both the Addis Financing for Development Conference and the SDG Special UN Session approving the SDGs in September 2015.
Indeed, several donors have devoted increasing amounts of ODA in PPPs. This support has grown from US$84.8 million in 2005 to US$700.7 million in 2014 (2014 constant dollars). (Chart 30) Five donors account for more than 85% of these PPP disbursements in 2014 – Belgium, Denmark, the Netherlands, the UK and the US. However, despite this growth, ODA directed to PPPs accounted for only 1.3% of the ODA of these five donors in that year.
Chart 30: Donor ODA to Public Private Partnerships, 2005 - 2014

The Reality of Aid 2016 Report
70
Social sectors rank high in sector distribution of allocable PPP ODA.
For DAC donors as a whole, close to 40% of ODA devoted to PPPs was directed to the social sectors in 2014. The productive sectors accounted for 20% of sector allocable PPP ODA, with agriculture making up 9.4% of this amount. Approximately 21% of sector allocable PPP ODA was directed to business support services, and 16% to multi-sectors (including 11% devoted to environmental protection).
Among PPPs supported by USAID, 89% were with business sector partners, and 83% were highly associated with the commercial interests of the business partner.
The Brookings Institute recently published an interesting study of PPPs initiated by USAID, a major promoter of engaging the private sector in USAID development efforts. The study reviewed 1,600 projects between 2001 and 2014.112 The total value of USAID’s investment in these PPP projects was US$16.5 billion, averaging US$880 million a year, with the expectation that private partners contributed at least an equal share.
A review of these projects presents a different profile that the macro picture in the DAC data:
• Only 26% (by value) targeted UMICs, while 42% targeted MICs, and 32% targeted LDCs and LICs; and
• In relation to sectors 47% (by value) was concentrated in the health sector (in part due to one very large project worth US$4.2 billion), 13% in agriculture and food security, 12% in economic growth, trade and entrepreneurship, 7% in education, and 12% were considered multi-sectoral.
The Brookings study also explored several questions on the nature of the partnerships. It found that 89% of the PPPs (by value) were with business sector partners (with the remaining 11% with NGOs). The PPPs (83% by value) were highly associated with the commercial interests of the
business partner, which can be considered an informal modality for tying US aid to US corporate interests. Technical advice and expertise represented the main resource offered by the business sector (88% of the PPPs by value). They also found that where the business sector contributed expertise, the PPP was more likely to be tied to their commercial interests. The study, unfortunately, did not assess these PPPs in terms of a sustained development impact and poverty reduction.
Allocation of ODA to key sectors targeting aid-for-trade held constant since 2005.
Aid-for-trade has been a long-standing interest of donors following the collapse of the WTO Doha Development Round of trade talks in 2005. However, an accurate assessment of aid for trade is difficult, both in terms of the amount invested and the impact of trade on development outcomes for poor and marginalized populations.113 The most recent DAC figures put ODA devoted to aid-for-trade at US$42.8 billion.114
Given the fact that the DAC does not disaggregate large allocations in the finance and production sectors, this amount appears to be a significant exaggeration of the real ODA resources devoted to strengthening the trade relations of developing countries. For example, the figure includes all ODA in support of economic infrastructure, including micro-finance, and all of agricultural investments, with unknown amounts focusing on production for trade..
Perhaps a more accurate picture is provided through an examination of the detailed DAC sector codes. The DAC CRS records $763 million in 2014 devoted to trade policy and regulation. Other elements, such as transportation and storage, business support services, mineral resources and mining, and commodities support could arguably be included. The sum of all of these components for 2015 gives a total investment of US$9 billion, far removed from the $42.8 billion claimed. It is also useful to note that these sectors have been a constant proportion of allocable sector aid resources since 2005, hovering between 10% and 12% over the decade.

71
Global Aid Trends, 2016 Financing Agenda 2030: Where are the resources
Annex One
Addis Ababa Action Agenda: Development Cooperation Commitments
1. ODA Levels: “ODA providers reaffirm their respective ODA commitments, including the commitment by many developed countries to achieve the target of 0.7 per cent of ODA/GNI and 0.15 to 0.20 per cent of ODA/GNI to least developed countries.” [§51]
2. Focus on least developed countries: “We recognize the importance of focusing the most concessional resources on those with the greatest needs and least ability to mobilize other resources,” including praise for those countries that devote at least 50% of their ODA to least developed countries. [§52]
3. Predictability and transparency: “Encourage the publication of forward-looking plans which increase clarity, predictability and transparency of future development cooperation, in accordance with national budget allocation processes.” [§53]
4. Tracking resources of gender equality: “Urge countries to track and report resource allocations for gender equality and women’s empowerment.” [§53]
5. Catalyze resources from other sources: Support domestic resource mobilization and “unlock additional finance through blended or pooled financing.” [§54]
6. Effective development cooperation: “Welcome continued efforts to improve the quality, impact and effectiveness of development cooperation and other international efforts in public finance, including adherence to agreed develop ment cooperation effectiveness principles” and will “take account of efforts in other relevant forums, such as the Global Partnership for Effective Development Cooperation, in a complementary manner.” [§58]
7. Humanitarian finance: “We recognize the need for the coher ence of developmental and humanitarian finance to ensure more timely, comprehensive, appropriate and cost-effective approaches to the management and mitigation of natural disas ters and complex emergencies. We commit to promoting inno vative financing mechanisms to allow countries to better prevent and manage risks and develop mitigation plans.” [§66]
8. Peacebuilding: “We recognize the peacebuilding financ ing gap and the role played by the Peacebuilding Fund. We will step up our efforts to assist countries in accessing financing for peacebuilding and development in the post-conflict context.” [§67]
9. Innovative finance: “We invite more coun tries to voluntarily join in implementing innovative mecha-nisms, instruments and modalities which do not unduly burden developing countries.” [§69]
10. Multilateral Development Banks: “We encourage the multilateral development finance institutions to establish a process to examine their own role, scale and func tioning to enable them to adapt and be fully responsive to the sustainable development agenda.” [§70]
11. Middle-income countries: “We recognize that middle-income countries still face signifi cant challenges to achieve sustainable development. … We also acknowledge that ODA and other concessional finance is still important for a number of these countries and has a role to play for targeted results, taking into account the specific needs of these countries.” [§71]
12. South South Cooperation (SSC): “Recognize its increased importance, different history and particularities, and stress that South-South cooperation should be seen as an expres sion of solidarity among peoples and countries of the South, based on their shared experiences and objectives. It should continue to be guided by the principles of respect for national sovereignty, national ownership and independence, equality, non-conditionality, non-interference in domestic affairs and mutual benefit.” [§56]

The Reality of Aid 2016 Report
72
13. Development Banks: “We welcome efforts by new development banks to develop safeguard systems in open consultation with stakeholders on the basis of established international standards, and encour age all development banks to establish or maintain social and environmental safeguards systems, including on human rights, gender equality and women’s empowerment, that are transpar ent, effective, efficient and time-sensitive.” [§75]
14. Strengthening health systems and universal health coverage: “We commit to strengthening the capacity of countries, in particular developing countries, for early warn ing, risk reduction and management of national and global health risks, as well as to substantially increase health financ ing and the recruitment, development, training and retention of the health workforce in developing countries, especially in least developed countries and small island developing States.” [§77]
15. Delivering quality education: “We will scale up investments and international coopera tion to allow all children to complete free, equitable, inclusive and quality early childhood, primary and secondary education, including through scaling-up and strengthening initiatives, such as the Global Partnership for Education.” [§78]
16. Climate finance: Look forward to a Paris Agreement that “reflects the principle of common but differentiated responsibilities and respective capabilities, in light of different national circumstances.” [§59] The AAAA “recognize(s) the need for transparent methodologies for reporting climate finance…” [§60] It notes the decision of the Board of the Green Climate Fund to “aim for a 50:50 balance between mitigation and adaptation over time on a grant equiva lent basis and to aim for a floor of 50 per cent of the adapta tion allocation for particularly vulnerable countries, including least developed countries, small island developing States and African countries.” [§61]

73
Global Aid Trends, 2016 Financing Agenda 2030: Where are the resources
Annex TwoFuture Trends in DAC Donor ODA
Donor Expected Trend2014 to 2015 Increase /
Decrease & Percentage of Total DAC ODA in 2015
Australia
Decrease: The May 2016 budget projected another decrease in Australian aid. From a high of AU$5,053 million in 2012-13, aid fell to AU$4,052 million in 2015-16, and is projected to be AU$3,828 million in 2016-17, AU$3,912 million in 2017-18 and AU$4,014 billion in 2018-19. Aid in 2016/17 is 24% less than in 2012-13.115
Decreased 11.1%.
2.4% of ODA in 2015
Austria
Uncertain: Planned cuts in 2015 to the Austrian Aid Agency budget were postponed at the last moment. Aid levels may rise due to debt cancellation (Sudan) and increased in-country refugee costs. Real aid may be affected, but direction of real aid uncertain.
Increased 15.4%. But declined by 7.4% excluding refugee costs.
0.9% of ODA in 2015.
BelgiumDecrease: Since 2012 aid has been cut more than €900 million. The development minister has announced further cuts of €1 billion over next five years.116
Decreased 7.8%. Declined by 12.2% excluding refugee costs.
1.4% of ODA in 2015.
Canada
Increase: Very modest increase in aid expected from 2015 to 2016; Expect modest increases thereafter.117 The increase from 2014 to 1015 was due to a special one-off loan to the Ukraine and double payments to the IFIs in the calendar year 2015.
Increased 17.1%
3.3% of ODA in 2015.
DenmarkDecrease: New government will reduce aid to 0.7%. Budget for 2016 fulfills this promise and the 2015 budget is projected to be 0.73% of GNI down from the expected level of 0.83%.118
Increased 0.8%. Declined by 6.8% excluding refugee costs.
2% of ODA in 2015.
Finland
Decrease: New conservative government in 2015. Finish ODA will decrease by 43% between 2014 and 2016, from around €1.2 billion to €715 million.119 In early 2016 the government announced an additional €25 million cut to Finland’s ODA.
Decreased 5.7%.
1% of ODA in 2015.
FranceIncrease: France’s development agency — Agence Française de Développement – annual financing capacity will rise from €8.5 billion ($9.22 billion) to €12.5 billion by 2020 and half of that increase will be directed towards climate change — raising annual climate financing from 3 billion to €5 billion by 2020.120
Increased 2.8%. Increased by 3.4% excluding refugee costs.
7% of ODA in 2015.
GermanyIncrease: In March 2015 the German government announced that German ODA would increase by €8.3 billion by 2019. This would be the highest increase in German history.
Increased 25.9%. Increased by 5.8% excluding refugee costs.
13.5% of ODA in 2015.Ireland Increase: After repeated cuts in ODA since 2011, ODA will
increase by €40 million to €640 Million in 2016.Increase by 1.9%.
0.5% of ODA in 2015.
ItalyIncrease: The government’s ambition is to reach 0.30% of GNI by 2020. In 2015 the ratio was 0.21%.
Increase by 14.2%. But increase cut to 7.5% excluding refugee costs.
2.9% of ODA in 2015.
Japan
Increase: According to the General Account Budget (the main budget), Japan’s ODA budget was increased by 1.8% for fiscal year (FY) 2016. This is first time since FY 1997 that the ODA budget has been increased.
Increase by 12.4%.
7.1% of ODA in 2015.

The Reality of Aid 2016 Report
74
Netherlands
Decrease: Total ODA levels are expected to increase, but only because of substantial increases for in-country refugee expenditures.
Increased by 24.4%. But increase 15.4% excluding refugees costs.
4.4% of ODA in 2015.
Norway
Increase: The 2016 budget proposal entails an overall increase in the ODA budget of NOK1.2 billion compared with the initial budget proposal for 2016, bringing the ODA budget for 2016 to NOK34.8 billion, which represents 1 percent of Norway’s total income (GNI).121
Increased by 8.7%. But increase reduced to 2.2% excluding refugee costs.
3.3% of ODA in 2015.
Spain
Increase: Spain has publicly announced reversing the decline in its ODA as its economy increases and has projected increases in its 2015 and 2016 budgets. However, it also failed to spend its full allocation in 2014. (DAC Peer Review, 2016).
Increased by 1.5%. But increase reduced to 0.4% excluding refugee costs.
1.2% of ODA in 2015.
Sweden
Increase: Small increase for climate finance included in ODA. A new accounting method will put Sweden below 1% of GNI in 2016.
Increased by 38.8%. But increase reduced to 9.9% excluding refugee costs.
5.4% of ODA in 2015.
Switzerland
Unchanged: The government has earmarked just over CHF11 billion ($11.2 billion) for international cooperation over the next four years, including development and humanitarian aid as well as trade promotion and other economic measures.
Increased by 6.7%.
2.7% of ODA in 2015.
United Kingdom
Increase: Tied to 0.7% of GNI. But increases will not be as large as originally expected. Because estimates of growth has been halved, the country’s aid budget, estimated in November at $23.4 billion for 2019-2020, will be about 650 million pounds ($932 million) less than expected.122 These estimates will be even further reduced with the impact of the Brexit vote. The future of the 0.7% target is also uncertain.
Increased by 3.2%.
14.2% of ODA in 2015.
United States
Decrease: ODA is projected by CSOs to be lower in 2017.Decrease by 7%.
23.6% of ODA in 2015.

75
Global Aid Trends, 2016 Financing Agenda 2030: Where are the resources
Endnotes
1 See http://www.un.org/ga/search/view_doc.asp?symbol=A/RES/70/1&Lang=E.
2 Martin, M. & Walker, Jo, 2015. Financing the Sustainable Development Goals: Lessons from government spending on the MDGs, a report prepared for Development Finance International and Oxfam, May 2015, page 31, accessed April 2016 at http://eurodad.org/files/pdf/1546383-financing-the-sustainable-development-goals-lessons-from-government-spending-on-the-mdgs.pdf.
3 World Bank, 2016. “Gross Domestic Product, 2014,” World Development Indicator Database, February 2016, accessed April 2016 at http://databank.worldbank.org/data/download/GDP.pdf.
4 See http://www.un.org/esa/ffd/wp-content/uploads/2015/08/AAAA_Outcome.pdf.
5 See Winnie Byanyimi, Executive Director, Oxfam International, “Addis Financing for Development Conference Failed in Many Ways, But the Fight for Tax Justice Continues,” Huffpost Impact, July 28, 2015, accessed at http://www.huffingtonpost.com/winnie-byanyima/addis-financing-for-devel_b_7888906.html. See also “Civil Society Response to the Addis Ababa Action Agenda on Financing for Development,” July 16, 2015, accessed at https://www.globalpolicywatch.org/blog/2015/07/16/civil-society-response-agenda-financing-development/; CSO Partnership for Effective Development Cooperation, “CPDE reaction to the Addis Ababa Action Agenda (AAAA),” July 29, 2015, accessed at http://csopartnership.org/cpde-reaction-to-the-addis-ababa-action-agenda-aaaa/; and Women’s Working Group on Financing for Development, “Reaction to the Outcome Document of the Third International Conference on Financing for Development: Addis Ababa Action Agenda,” accessed at https://wwgonffd.files.wordpress.com/2015/07/women-working-group-reaction-to-addis-ababa-action-agenda-17-july-20151.pdf.
6 See https://unfccc.int/resource/docs/2015/cop21/eng/l09r01.pdf.
7 See comments by civil society leaders at http://www.climatenetwork.org/press-release/civil-society-responds-final-paris-climate-agreement-released.
8 Roberts, T & Weikmans, Romain, 2015. “The unfinished agenda of the Paris climate talks: Finance to the global south,” Brookings Institute Blog, December, 2015, accessed April 2016 at http://www.brookings.edu/blogs/planetpolicy/posts/2015/12/22-cop21-unfinished-agenda-finance-global-south-roberts-weikmans.
9 Brian Tomlinson, 2014. “Fit for Purpose: ODA and the financing of the Post-2015 Development Agenda,” in The Reality of Aid 2014: Rethinking Partnerships in a Post 2015 World: Towards Equitable, Inclusive and Sustainable Development. Manila: Ibon, accessed April 2016 at http://www.realityofaid.org/wp-content/uploads/2014/12/1.Fit-for-Purpose.pdf.
10 See Brian Tomlinson in Reality of Aid, op. cit., pp 136 -141.
11 Summer, A., 2015. “When does One Dime = 100 Million People,” Center for Global Development Blog Post, November 5, 2015, accessed April 2016 at http://www.cgdev.org/blog/when-does-one-dime-100-million-people. He notes that “Approaches to global poverty need to be informed by a broader understanding of
the overall global consumption distribution and how very modest changes to the assumed poverty line lead to significantly different understandings of the scale and location of global poverty. It would therefore be better, we suggest, to make estimates with a range of poverty lines, probably up to at least $10 a day, so as to pay greater attention to the global distribution overall.”
12 The issues relating to national poverty lines in developing countries are both complex and controversial. See Hoy, C., 2016. “Projecting National Poverty to 2030,” Overseas Development Institute, March 2016, access April 2016 at http://www.odi.org/sites/odi.org.uk/files/resource-documents/projecting_national_poverty_to_2030_final_web.pdf. Hoy documents the poverty lines in 59 developing countries and found that approximately one third of the population or 1.2 billion people live below these national poverty lines. There is a great deal of variability across countries and regions. See also Reddy, S. & Lahoti, Rahul, 2016, “$1.90 a day: What does it say? The New International Poverty Line,” New Left Review, #106, January-February 2016. Reddy and Lahoti provide an excellent overview of the many significant issues in the Bank’s methodologies for calculating an International Poverty Line at $1.90 a day, which as they suggest calls for a new approach based on an assessment of clearly defined basic human requirements and the commodities needed to meet those requirements (with both income and non-income components.
13 Hoy, op. cit. p. 13. He found the median poverty line to be around $1.80 a day (2005 PPP) and the mean to be around $2.36 a day (2005 PPP). This result correlates with the World Bank measure of poverty at $2.00 a day (2005 PPP) or $3.10 a day (2011 PPP), which is used in this chapter as an approximate measure of both extreme poverty (absolute depravation) and highly vulnerable poor people.
14 Hoy, op. cit., p. 13.
15 Sumner, A., 2016. “The World’s New Middles – Implications for the future of development and aid,” UNU-WIDER Blog, May 2016, accessed June 2016 at https://www.wider.unu.edu/publication/world%E2%80%99s-new-middles-implications-future-development-and-aid.
16 See Reddy and Lahoti, op. cit. for a summary of these criticisms.
17 The 2014 Reality of Aid Report looked at poverty at US$1.25 a day and US$2.00 a day. It also considered “near-poverty” conditions of poverty people living on less than US$4.00 a day.
18 Strawson, et. al. 2015. Investments to End Poverty, 2015. A Report prepared by Development Initiatives, 2015, page 11. Accessed April 2016 at http://devinit.org/?dialogFeatures=protocol=http#!/post/investments-to-end-poverty-2015
19 See http://mdgs.un.org/unsd/mi/wiki/1-2-Poverty-gap-ratio.ashx?From=Indicator-1-2-Poverty-gap-ratio and Strawson op. cit. p. 10
20 World Bank, PovcalNet, http://iresearch.worldbank.org/PovcalNet/index.htm?1.
21 Strawson, op. cit., p. 11.
22 OECD DAC, 2008. Aid Targets Slipping Out of Reach, See table

The Reality of Aid 2016 Report
76
4, page 13, Accessed April 2016 at http://www.oecd.org/dac/stats/41724314.pdf. There was no goal expressed by the United States following Gleneagles. President Obama in his first campaign for Presidency promised to bring US aid to US$50 billion and in his first term postponed this goal to his second term. This goal is the one that is used here for the US. First year support for refugees is counted in 2015 in the same proportion as refugee support in 2005 for Denmark, Germany, Italy, Netherlands, Norway, Sweden, the UK and the United States.
23 Author’s calculations based on OECD DAC 2008, op. cit. [note 21], and OECD Dataset, DAC1a.
24 See Looking to the Future, Don’t Forget the Past – Aid Beyond 2015, Concord AidWatch 2015, accessed April 2016 at http://www.concord.se/wp-content/uploads/FINAL_AidWatch2015.pdf.
25 OECD DAC, “2015 Global Outlook on Aid,” Accessed April 2016 at http://www.oecd.org/dac/aid-architecture/2015%20FSS%20Survey%20flyer.pdf.
26 The DAC defines CPA as Gross Bilateral Aid less: humanitarian aid and debt relief (unpredictable aid); administrative costs, imputed student costs, development awareness, research and refugees in donor countries (no cross boarder flows); and food aid, aid from local governments, core funding to NGOs, ODA equity investment, aid through secondary agencies and aid which is not allocable by country or region (do not form part of cooperation agreements between governments).
27 These include donor country refugee and imputed student expenditures, full amount of debt cancellation for which the benefit to recipient countries are spread over decades, and interest paid to donors, not deducted with the principle in ODA loan repayments to donors. Donor administration costs and disbursements for public awareness are not included as these are legitimate expenses in managing an aid program.
28 Unpublished data collected by Concord and a network of European CSOs monitoring this issue, April 2016.
29 “Aid in 2016: Call on world leaders to help refugees - without jeopardising the world’s poorest people, CSO petition, February 2016, accessed April 2016 at http://www.eurodad.org/protectthepoorest.
30 Concord AidWatch 2015, op. cit., page 19.
31 Development Cooperation Directorate, “Follow up to Decisions at the February 2016 DAC High Level Meeting,” DCD/DAC (2016) 15, accessed April 2016 at http://www.oecd.org/officialdocuments/publicdisplaydocumentpdf/?cote=DCD/DAC%282016%2915&docLanguage=En
32 Author calculations from OECD Database, DAC1a, April 2016.
33 In Mozambique, for example, in the health sector one study concluded that “three serious concerns emerged: 1) difficulties coordinating external resources and challenges to local control over the use of resources channelled to international private organizations; 2) inequalities created within the health system produced by vertical funds channelled to specific services while other sectors remain under-resourced; and 3) the exodus of health workers from the public sector health system provoked by large disparities in salaries and work.” Mussa, A., Pfeiffer,
J., Gloyd, S, and Sherr, Kenneth, 2013. “Vertical funding, non-governmental organizations, and health system strengthening: perspectives of public sector health workers in Mozambique,” Human Resources for Health 2013 11:26, Accessed April 2016 at http://human-resources-health.biomedcentral.com/articles/10.1186/1478-4491-11-26. But it is also the case that new vertical funds are emerging, such as the Green Climate Fund, “which has a quasi-universal membership of advanced economies and developing countries with an equal voice.” OECD DAC, Multilateral Aid 2015: Better Partnerships for a Post-2015 World, July 2015, accessed April 2016 at http://www.oecd.org/dac/multilateral-aid-2015-9789264235212-en.htm.
34 McLeod Group (Canada), 2016. “UN Development System: Running on Empty,” May 31, 2016, accessed June 2016 at http://www.mcleodgroup.ca/2016/05/30/the-un-development-system-running-on-empty/.
35 OECD DAC, Multilateral Aid 2015, op cit., page 14.
36 Eurodad, “Statement to the High Level Meeting,” February 15, 2016, accessed April 2016 at http://www.eurodad.org/OECD_DAC_HLM. See also, Kwakkenbos, J. and Griffith, J., 2016. “Will reporting rule changes agreed by OECD committee undermine the credibility of aid?,” Eurodad Analysis, Accessed April 2016 at http://www.eurodad.org/OECD_DAC_HLM_ANALYSIS; Anders, M., 2016. “ODA Redefined: What you need to know,” DevEx, February 23, 2016, accessed April 2016 at https://www.devex.com/news/oda-redefined-what-you-need-to-know-87776.
37 DAC High Level Meeting, “Communiqué,” February 19, 2016, accessed April 2016 at http://www.oecd.org/dac/DAC-HLM-Communique-2016.pdf.
38 See the revised language in Annex Two of the 2016 Communiqué, op cit, pages 10-16.
39 Dalrymple, op. cit.
40 Dalrymple, op. cit.
41 Kwakkenbos, op cit.
42 Dalrymple, op. cit.
43 Tew, R. 2016. “Aid spending by Development Assistance Committee donors in 2015,” Development Initiatives, Factsheet, April 2016, p. 2, accessed April 2016 at http://devinit.org/#!/post/aid-spending-by-development-assistance-committee-donors-in-2015.
44 For an excellent discussion of ODA loans and related issues see Tew, R. 2015. “ODA Loans: Tracking a growing source of development finance,” Development Initiatives Report, June 2015, accessed April 2016 at http://devinit.org/?dialogFeatures=protocol=http#!/post/oda-loans-tracking-a-growing-source-of-development-financing. See also Colin, S., 2014. “A matter of high interest: Assessing how loans are reported as development aid,” Eurodad Report, January 2014, accessed April 2016 at http://www.eurodad.org/amatterofhighinterest.
45 DAC Final Communiqué, High Level Meeting, December 16, 2014, Annex Two, accessed April 2016 at http://www.oecd.org/dac/OECD%20DAC%20HLM%20Communique.pdf.
46 See Lonsdale, C., 2016. “Modernizing ODA loans: Impact of new

77
Global Aid Trends, 2016 Financing Agenda 2030: Where are the resources
60 Aly (May 2016), op. cit.
61 Esslemont , T., 2016. “Syrians suffer as anti-terror laws squeeze charities – survey,” Reuters Trust, February 24, 2016, accessed April 2016 at http://news.trust.org/item/20160224000357-rtjoh/?source=fiHeadlineStory.
62 ECOSOC, “As developing countries strive to enhance economic performance, developed partners should honour or surpass aid pledges, Addis Conference hears,” Plenary, 3rd & 4th Meeting Summary (AM & PM) Addis Ababa, July 14, 2015, accessed April 2016 at http://www.un.org/press/en/2015/dev3187.doc.htm.
63 Development Initiatives, Investments to End Poverty, 2015, op. cit., p. 16.
64 Ibid., p. 23.
65 Martin and Walker, 2015, op. cit., p 30.
66 See the work of UNDRIS, The Politics of Domestic Resource Mobilization for Social Development, a research project, 2011 – 2015, accessible at http://www.unrisd.org /80256B3C005BB128/%28httpProjects%29/D8BC0D08FA1BD10BC125795F004C812F?OpenDocument.
67 Development Initiatives updated this work on government revenue and poverty reduction in its report, Investments to End Poverty, 2015, op. cit., chapter three. The following analysis takes inspiration from this analysis by DI.
68 See http://devinit.org/#!/data/methodology/.
69 Development Initiatives, Investments to End Poverty, op. cit., p. 3.
70 Solheim, E, 2015. “Making the Most of More Aid,” Project Syndicate, April 10, 2015, accessed April 2016 at https://www.project-syndicate.org/commentary/development-aid-new-channels-by-angel-gurria-and-erik-solheim-2015-04.
71 Strawson, T. & Ifan, Guto, 2016. “Aiding Domestic Revenue Mobilization,” Summary Brief, page 3, Development Initiatives, April 2016, accessed April 2016 at http://devinit.org/#!/post/aiding-domestic-revenue-mobilisation. The study noted the difficulty in locating relevant projects in the DAC’s Creditor Reporting System (CRS+) as there is no DAC coding for projects with a DRM purpose.
72 Ibid.
73 Ibid, p. 5.
74 See Development Initiatives, Investments to End Poverty, 2015,
op. cit., pp 25-26.
75 See Forestater, M., 2015. “International Tax, Transparency, and Finance for Development: A Short Guide for the Perplexed,” Brief, Center for Global Development, February 12, 2016, accessed April 2016 at http://www.cgdev.org/sites/default/files/International-Tax-Transparency-Development-Finance_Short-Guide_CGD-brief.pdf. See also for example, Duncan Green, “What should Europe do about Illicit Financial Flows? Five take-aways from the African Union’s High-Level report,” Oxfam From Poverty to Power Blog, February 6, 2015, accessed at https://oxfamblogs.org/fp2p/what-should-europe-do-on-illicit-financial-flows-five-take-aways-from-
DAC reporting rules (Part 1)”, Development Initiative Blog, March 8, 2016 and Tew, R., 2016. “Modernizing ODA loans: Impact of new DAC reporting rules (Part 2)”, Development Initiative Blog, March 9, 2016, accessed April 2016 at http://devinit.org/#!/post/modernising-oda-loans-impact-of-new-dac-reporting-rules-part-2.
47 Kwakkenbos, J., and Griffiths, Jesse, 2016. “Will reporting rule changes agreed by OECD committee undermine the credibility of aid?,” Eurodad Blog, February 19, 2016, accessed April 2016 at http://www.eurodad.org/OECD_DAC_HLM_ANALYSIS.
48 Development Initiatives, 2015. Global Humanitarian Assistance Report 2015, Bristol, UK, 2015, page 19, accessed April 2016 at http://www.globalhumanitarianassistance.org/GHAreport2015/. This annual report is an excellent and definitive report on humanitarian assistance and is relied upon for many of the metrics in this section of the chapter.
49 Ibid., p. 34 & p. 38.
50 Ibid., pp 42-44.
51 OECD Dataset, DAC2a, humanitarian assistance.
52 Too Important to Fail – Addressing the humanitarian financing gap, High Level Panel on Humanitarian Financing, Report to the Secretary General, December 2015, page v, accessed April 2016 at http://www.un.org/news/WEB-1521765-E-OCHA-Report-on-Humanitarian-Financing.pdf.
53 Ibid., pp 2-3. See also Davies, R, “Too important to flail: A strategic financing mechanism for humanitarian assistance,” DevPolicy Blog, February 8, 2016, accessed April 2016 at http://devpolicy.org/too-important-to-flail-a-strategic-financing-mechanism-for-humanitarian-assistance-20160208/.
54 Aly, H., and Wall, Imogen, February 2016. “Humanitarian Reform: What’s on – and off – the table,” IRIN, February 11, 2016, accessed April 2016 at http://www.irinnews.org/analysis/2016/02/11/humanitarian-reform-whats-and-table.
55 High Level Panel, op. cit., pointed out that more than 80% of government funding for the six main UN humanitarian bodies was earmarked in 2013, compared to 15% ten years earlier.
56 Aly, February 2016, op. cit.
57 For details on the Grand Bargain, see https://c o n s u l t a t i o n s 2 . c w o r l d h u m a n i t a r i a n s u m m i t . o r g / bitcache/4334ccbd5dcb38e9f2c332f51f558616333861f2?vid=58101
58 Aly, Heba, May 2016. “Will US Aid Change?,” IRIN, May 30, 2016, accessed June 2016 at https://www.irinnews.org/interview/2016/05/30/will-us-aid-change.
59 See Charter4Change, Localization of Humanitarian Aid, accessed April 2016 at https://charter4change.org/. See also the discussion of this issue in Rowling, M., “Local groups demand bigger slice of aid pie for world’s crises,” Reuters, accessed April 2016 at http://www.reuters.com/article/us-global-humanitarian-aid-idUSKCN0WJ01K.
5&disposition=inline&op=view&utm_source=Devpolicy&utm_campaign=4a3089b1c9-RSS_EMAIL_CAMPAIGN&utm_m e d i u m = e m a i l & u t m _ t e r m = 0 _ 0 8 2 b 4 9 8 f 8 4 -4a3089b1c9-312040929.
The Reality of Aid 2016 Report
78
the-african-unions-high-level-report/ and “Reformers v lobbyists: Where have we got to on tackling corporate tax dodging?,” May 9, 2014, accessed April 2016 at https://oxfamblogs.org/fp2p/reformers-v-lobbyists-where-have-we-got-to-on-tackling-corporate-tax-dodging/.
76 Forestater, op. cit.
77 Development Initiatives, Investments to End Poverty, 2015, op. cit., p. 26.
78 For a more in-depth discussion of these and other issues in international tax and illicit capital flows for financing the SDGs, see Forstater’s longer 2015 briefing paper, Can Stopping Multinational Tax Dodging Close the Gap in Financing for Development?,
Center for Global Development, Policy Paper 15/69, October 15, 2015, accessed April 2016 at http://www.cgdev.org/publication/can-stopping-tax-dodging-multinational-enterprises-close-gap-development-finance.
79 The results of this monitoring round were not available at the time of finalizing this chapter. These results will be available November 2016. See http://effectivecooperation.org/monitoring-country-progress/explore-monitoring-data/.
80 Tomlinson, op. cit., p. 151.
81 OECD DAC, 2016. “Development aid in 2015 continues to grow despite costs for in-donor refugees,” April 13, 2016, accessed April 2016 at http://www.oecd.org/dac/stats/ODA-2015-detailed-summary.pdf.
82 Least Developed Countries are determined by resolution of the General Assembly. The current income levels for Other LICs is less than US$1,045 per capita in 2013, for LMICs, between US$1,046 and US$4,125 per capita in 2013, and for UMICs, between US$4,126 and US$12,745 per capita in 2013.
83 Sumner, A., 2016. “The World’s New Middles – Implications for the future of development and aid,” UNU-WIDER Blog, May 2016, accessed June 2016 at https://www.wider.unu.edu/publication/world%E2%80%99s-new-middles-implications-future-development-and-aid.
84 For a DAC overview of these issues see OECD DAC Network on Gender Equality (GENDERNET), 2016. “Background paper on OECD DAC members’ use of the DAC gender equality policy marker and best practices for quality assurance and control,” OECD DAC, not published on the internet.
85 DAC donor gross disbursements at current prices for DAC CRS sector code 15170.
86 Mossa, Z., 2015. “Movements, money and social change: how to advance women’s rights,” AWID, March 10, 2015, accessed April 2016 at http://www.awid.org/news-and-analysis/movements-money-and-social-change-how-advance-womens-rights.
87 Quoted in Westphal, M., Canfin, P., Ballesteros, A, and Morgan, Jennifer, 2015. “Getting to $100 billion: Climate finance scenarios and projections to 2020,” Working Paper, World Resources Institute, May 2015, page 5, accessed May 2016 at http://www.wri.org/publication/getting-100-billion-climate-finance-scenarios-and-projections-2020.
88 Ibid, page 5.
89 OECD and Climate Policy Initiative, 2015. “Climate Finance in 2013-14 and the USD 100 billion goal,” OECD October 2015, accessed June 2016 at http://www.oecd.org/environment/cc/OECD-CPI-Climate-Finance-Report.pdf. The report notes, with respect to methodology: “It is important to acknowledge that recent developments in definitions and accounting methodologies to track climate finance are a staging post on the way towards more complete and transparent estimates of climate finance. Improving the quality and coverage of data collection is an evolving multi-year process. Methodological choices made this year on refined definitions and accounting approaches represent progress but it may be some time before they can be systematically implemented and before data can be consistently and routinely collected.”
90 OECD Development Cooperation Directorate, 2015. “Climate-related development finance in 2013-14,” November 2015, accessed June 2016 at https://www.oecd.org/dac/environment-development/Climate-related-dev-finance-ENG.pdf.
91 Ibid.
92 OECD and Climate Policy Initiative, op. cit.
93 Author’s calculation based on OECD DAC CRS Dataset, aid activities targeting environmental action, June 2016.
94 See ODI, What climate finance was committed at the Paris Climate Talks?” accessed June 2016 at https://www.odi.org/sites/odi.org.uk/files/lightbox-images/cfu-cop-commitments.png.
95 “Climate Fund Update Highlights: May 2016,” Heinrich Boll Stiftung, North America, May 27, 2016, accessed June 2016 at https://blog.climatefundsupdate.org/2016/05/27/climate-funds-update-highlights-may-2016/.
96 Westphal, et al, op. cit.
97 ECLAC, “South-South Cooperation is a Key Tool for Achieving the 2030 Agenda’s Goals,” April 13, 2016, accessed April 2016 at http://www.cepal.org/en/news/south-south-cooperation-key-tool-achieving-2030-agendas-goals.
98 Santos, L.A., 2016. “Civil society call for safeguards as BRICS Bank makes first loans,”DevEx, April 18, 2016, accessed April 2016 at https://www.devex.com/news/civil-society-calls-for-safeguards-as-brics-bank-approves-first-loans-88038.
99 Author’s calculations based on reports to the OECD DAC by these donors.
100 The distribution of non-DAC donors was calculated from OECD Dataset DAC2a. For China the regional distribution is derived from Figure 2 in the Report by for the period 2010 to 2012 in “China’s Foreign Aid (2014),” Information Office of the State Council, 2014, accessed April 2016 at http://news.xinhuanet.com/english/china/2014-07/10/c_133474011.htm; India’s distribution was assumed to be 80% South Asia and 20% Africa based on various newspaper reports on the priorities for India’s development assistance; South Africa was assumed to be only distributed to Sub-Saharan Africa; and Qatar was assumed to be 85% Middle East and 15% North Africa based on a review article, https://en.wikipedia.org/wiki/Qatari_foreign_aid. Brazil has not reported any aid information since 2010, but presumably maintains a modest aid program in Africa as well as the America. See footnote 69.
101 Cabral, L., 2016. “Brazil’s Development Aid Plan Flops,” Business Day, March 18, 2016, accessed April 2016 at http://www.bdlive.co.za/opinion/2016/03/18/brazils-development-aid-plan-flops.

79
Global Aid Trends, 2016 Financing Agenda 2030: Where are the resources
102 OECD Development Cooperation Directorate, 2013. “Triangular Co-Operation: What can we learn from a survey of actors involved?” OECD Development Assistance Committee, May 2013, accessed April 2013 at https://www.oecd.org/dac/dac-global-relations/OECD%20Triangluar%20Co-operation%20Survey%20Report%20-%20June%202013.pdf.
103 Xinhua, “China pledges 2 bln USD to support South-South Cooperation,” September 26, 2015, accessed April 2016 at http://news.xinhuanet.com/english/2015-09/26/c_134663349.htm.
104 Xinhua, “Xi announces 10 major China-Africa cooperation plans for coming 3 years,” China Daily, December 4, 2015, accessed April 2016 at http://www.chinadaily.com.cn/wor ld/X iattendsPar isc l imateconference/2015-12/04/content_22631225.htm.
105 Rutzen, D., 2015. “Aid Barriers and the Rise of Philanthropic Protectionism,” International Journal of Not-For-Profit Law, Vol. 17, March 2015, accessed April 2016 at http://www.icnl.org/research/journal/vol17ss1/Rutzen.pdf. See also Brian Tomlinson, ““GPEDC Indicator Two: Civil Society Operates within an environment that maximizes its engagement in and contribution to development, An Assessment of Evidence,” Civil Society Platform for Effective Development (CPDE), June 2016, and CIVICUS, “Civil Society Watch Report,” June 2016, accessed June 2016 at http://www.civicus.org/images/CSW_Report.pdf.
106 A comprehensive review of DAC donor financing to and through CSOs can be found in the periodic review by the Development Cooperation Directorate of the DAC, which can be found at http://www.oecd.org/dac/peer-reviews/partneringwithcivilsociety.htm.
107 OECD Dataset, DAC1a, IV Net Private Grants
108 Center for Propsperity, 2013.The Index of Global Philanthrophy and Remittances, with a Special Report on Emerging Economies, Hudson Institute, p. 12, accessed April 2016 at http://www.hudson.org/content/researchattachments/attachment/1229/2013_indexof_global_philanthropyand_remittances.pdf.
109 World Bank data, accessed April 2016 at http://data.worldbank.org/indicator/BX.KLT.DINV.CD.WD/countries/1W-XN-XT-XL-XM?display=graph.
110 Goodman, J and Hilton, Matt, 2016. “Australia’s ‘New aid Paradigm’: Beyond ODA?” in Reality of Aid 2016 Report, forthcoming.
111 See Reality of Aid 2012 Report – Aid and the Private Sector – Catalyzing Poverty Reduction and Development? IBON Foundation International, accessed April 2016 at http://www.realityofaid.org/roa_report/aid-and-the-private-sector-catalysing-poverty-reduction-and-development-2/
112 Ingram, G., Johnson, A., and Moser, H. USAID Public Private Partnerships: A Data Picture and Review of Business Engagement, Brookings Institute, Global Economic and Development Working Paper 94, February 2016, accessed April 2016 at http://www.brookings.edu/~/media/research/files/papers/2016/02/usaid-public-private-partnerships-ingram-johnson-moser/wp94pppreport2016web.pdf. All the data in these two paragraphs are derived from this study.
113 Reality of Aid 2012, op. cit., p. 132.
114 Seehttps ://publ ic .tab leau.com/views/Aid_for_trade/A i d _ f o r _ t r a d e ? : e m b e d = y & : s h o w Ta b s = y & : d i s p l a y _count=no&:showVizHome=no#1.
115 http://devpolicy.org/scaled-last-aid-cuts-20160504/
116 Concord AidWatch, 2015, http://concordeurope.org/2015/11/23/aidwatch-report-looking-to-the-future-don-t-forget-the-past-aid-beyond-2015/
117 See http://ccic.ca/media/news_detail_e.php?id=402
118 Concord AidWatch 2015, op. cit.
119 Ibid.
120 Jeff Tyson, “What AFD reform means for the future of French aid,” DevEx, February 1, 2016.
121 http://www.statsbudsjettet .no/Statsbudsjettet-2016/English/?pid=70718
122 Molly Anders, “UK aid braced for $1 billion shortfall,” DevEx, March 18, 2016.

81
Articles in the 2016 Report
Political Overview
Undermining democratic country ownership: Embedding northern development agendas through technical cooperation?The Reality of Aid Network International Coordinating Committee
Chapter 1: The role of technical assistance in bilateral donors’ and multilateral institutions’ aid
Donor priorities for technical cooperation, drivers and implications of tied aidJuliet Akello, Uganda Debt Network
International financial institutions and issues in technical assistance in Manipur and North East IndiaJiten Yumnam, Centre for Research and Advocacy Manipur
Tax Inspectors Without BordersHernan Cortes and Tove Maria Ryding, European Network on Debt and Development
Technical assistance to the Kyrgyz Republic, 2016Chinara Aitbayeva, Nash Vek PF
Chapter 2: Technical cooperation for infrastructure development
Questioning the effectiveness of technical cooperation in BangladeshAhmed Swapan Mahmud and Farjana Akter, Voices for Interactive Choice and Empowerment
Technical assistance of multi-lateral donors in the water sector in Sri Lanka: A recipe for privatization?Sajeewa Chamikara, Movement for Land and Agricultural Reform
Technical, yes — but what kind of assistance? USAID COMPETE’s PPP promotion in the PhilippinesBryan Ziadie, IBON International
Chapter 3: South-South experience in technical cooperation
Horizontal South-South bilateral cooperation experiences: Good practices in Argentina and ParaguayKarina Cáceres, Fundación SES
People4Change: People to people South-South cooperationLea Sofia Simonsen, ActionAid Denmark
Triangular cooperation among civil society organizations in South America: Institutional strengthening in Argentina, Brazil, and ColombiaAlejandra Solla, Fundación SES Argentina; Rolando Kandel, Fundación SES; Ancelin Gautier, Fundación SES France
Chapter 4: Global Aid Trends, BRICS Reports, and OECD Reports
Global Aid Trends 2016Financing 2030 Agenda: Where are the resources?Brian Tomlinson, AidWatch Canada

The Reality of Aid 2014 Report
82
BRICS Reports
India
South-South experience in technical cooperation in IndiaJyotsna Mohan, Voluntary Action Network India
South Africa
Donor priorities for technical cooperation and tied aidRutendo Hadebe, University of Cape Town
OECD Chapters
EU
European UnionZuzana Sladkova, Concord Europe
Australia
Australia’s ‘New Aid Paradigm’: Beyond ODA?James Goodman, AidWatch Australia and University of Technology Sydney; Matt Hilton, AidWatch Australia
Canada
Canada: Continuity with change?Fraser Reilly-King, Canadian Council for International Co-operation
Denmark
Dramatic aid cuts and increased spending on refugees in DenmarkKira Boe, Global Focus – Danish CSOs for Development Cooperation
Italy
Development cooperation shores up efforts to rebuild Italy’s global profileLuca De Fraia, ActionAid Italy
Japan
Japan: Recent trends in aid policy and technical cooperationAkio Takayanagi, Japan NGO Center for International Cooperation
South Korea
Republic of Korea: A new model for rural development? Limits and problems of Saemaul Undong (SMU) ODAMihyeon Lee, People’s Solidarity for Participatory Democracy
United Kingdom
Aid 2.0? A new strategy for UK aidAmy Dodd, UK Aid Network
USA
The state of US foreign assistanceAlicia Phillips Mandaville and Christina Hoenow, InterAction

83
ROA Members Directory
ROA Members Directory
RoA AFRICA
Africa Leadership ForumAddress: ALF Plaza, 1 Bells Drive, Benja Village, Km 9, Idiroko road, Ota, Ogun State, Nigeria Email: [email protected] #: (234) 803 4543925 Website: www.africaleadership.org
Africa Network for Environment and Economic Justice (ANEEJ)Address: 123, First East Circular Road Benin City Edo State Nigeria, West Africa Email: [email protected] #: (234) 80 23457333 Website: www.aneej.org
African Forum and Network on Debt and Development (AFRODAD)Address: 31 Atkinson Drive, Harare, Zimbabwe Email: [email protected] #: (263) 4 778531/6 Fax #: (263) 4 747878 Website: www.afrodad.org
Center for Economic Governance and Aids in Africa (CEGAA)Address: Room 1009, Loop Street Studios, 4 Loop Street, Cape Town 8001/ P.O. Box 7004, Roggebaai, 8012 South AfricaPhone #: (27) 21 425 2852 Fax #: (27) 21 425 2852 Website: www.cegaa.org
Centre for Peacebuilding and Socio-Economic Resources Development (CPSERD)Address: Lagos, NigeriaEmail: [email protected]
Centre for Promotion of Economic and Social Alternatives (CEPAES)Address: P. O. Box 31091, Yaounde, Cameroon Email: [email protected] #: (237) 231 4407
Civil Society for Poverty Reduction (CSPR)Address: Plot No. 9169, Nanshila Road Kalundu-P/B E891 Postnet No. 302, Lusaka, Zambia Email: [email protected] #: (260) 211 290154
Economic Community of West African States Network on Debt and Development (ECONDAD)Address: 123 1st East Circular Road, Benin City, Edo State, NigeriaPhone #: (234) 52 258748
Economic Justice Network (EJN)Address: Church House 1, Queen Victoria Street, Cape Town. Republic of South Africa Email: [email protected]; [email protected] #: (27) 21 424 9563 Fax #: (27) 21 424 9564 Website: www.ejn.org.za
Forum for African AlternativesEmail: [email protected]
Forum for the Reinforcement of the Civil Society (FORCS)/ Forum pour le Renforcement de la Société Civile (FORSC)Email: [email protected]
Forum National sur la Dette et la Pauvreté (FNDP)Address: BP 585 Abidjan cidex 03 Riviera, AbijanEmail: [email protected] #: (225) 05718222
Foundation for Community Development - MozambiqueAddress: Av. 25 de Setembro, Edifícios Times Square Bloco 2 - 3º andar Email: [email protected] #: (258) 21 355300 Fax #: (258) 21 355 355 Website: www.fdc.org.mz
Foundation for Grassroots Initiatives in Africa (GrassRootsAfrica)Address: Foundation for Grassroots Inititives in Africa (GrassRootsAfrica) House Number 87 Bear Regimanuel Gray Estates, Kwabenya-Accra PMB MD 187 Madina- Accra Ghana Email: [email protected] #: (233) 21-414223 Fax #: (233)-21-414223Website: www.grassrootsafrica.org.gh
GRAIB-ONGAddress: BP 66 AZOVE BeninEmail: [email protected] #: (229) 027662; 91 62 22Fax #: (229) 46 30 48
Groupe de Recherche et d’Action pour la Promotion de l’Agriculture et du Développement (GRAPAD)Address: c/1506I Maison DJOMAKON Jean VONS Guindéhou VEDOKO, BeninEmail: [email protected] #: (229) 21380172 / 21384883Fax #: (229) 21380172
Grupo Mocambicano da Divida (GMD) / Mozambican Debt GroupAddress: Rua de Coimbra, nº 91 - Malhangalene, Maputo Email: [email protected] #: 21 419523, cel. 82 - 443 7740 Fax #: (258)21-419524Website: www.divida.org
Habitat of Peace - Congo - DRCPhone #: (243) 99811818Institute for Security Studies/Institut D‘Etudes de SecuriteAddress: PO Box 1787 Brooklyn Square Tshwane (Pretoria) 0075 South Africa Email: [email protected] #: (27) 012 346 9500/2 Fax #: (27) 012 346 9570 Website: www.iss.co.za
Institute of Development Studies (IDS) University of ZimbabweAddress: PO Box MP167, Mt Pleasant, Harare, ZimbabweEmail: [email protected] #: (263) 4 333342/3Fax #: (263) 4-333345

The Reality of Aid 2014 Report
84
ROA Members Directory
Jubilee AngolaAddress: PO Box 6095, Luanda, AngolaEmail: [email protected] #: (244) 2366729Fax #: (244)2335497
Jubilee ZambiaAddress: P.O. Box 37774, 10101, Lusaka, ZambiaEmail: [email protected] #: (260) 1 290410Fax #: (260) 1 290759Website: www.jctr.org.zm
Kenya Debt Relief Network (KENDREN)Address: C/O EcoNews Africa, Mbaruk Road,Mucai Drive, P.O. Box 76406, Nairobi, Kenya Phone #: (254) 020 2721076/99Fax #: (254) 020 2725171 Website: www.kendren.org Kenya Private Sector Alliance (KEPSA)Address: 2nd Floor, Shelter Afrique Along Mamlaka Road, Next to Utumishi Co-op House P.O. Box 3556-00100 GPO Nairobi, KenyaEmail: [email protected] #: (254) 20 2730371/2 and 2727883/936 Fax #: (254) 2 2730374Website: www.kepsa.or.ke
Malawi Economic Justice Network (MEJN)Address: Malawi Economic Justice Network, Centre House Arcade, City Centre, PO Box 20135, Lilongwe 2 MalawiEmail: [email protected] #: (265) 1 770 060 Fax #: (265) 1 770 068 Website: www.mejn.mw
Social Development Network (SODNET)Address: Methodist Ministry Center, 2nd Wing, 4th floor, Oloitoktok Road, Off Gitanga Road, Kilimani Nairobi 00619 KenyaEmail: [email protected]; [email protected] Phone #: (254) 20 3860745/6 Fax #: (254) 20 3860746 Website: www.sodnet.org
Southern African Centre for the Constructive Resolution of Disputes (SACCORD)Address: P.O. Box 37660, Lusaka, Zambia Email: [email protected] #: (260) 1 250017 Fax #: (260) 1 250027
Tanzania Association of NGOs (TANGO)Address: Off Shekilango Road, Sinza Afrika Sana Dar es Salaam P. O. Box 31147 Tanzania Email: [email protected] #: (255) 22 277 4582Fax #: (255) 22 277 4582 Website: www.tango.or.tz
Tanzania Coalition on Debt and Development (TCDD)Address: Shaurimoyo Road, Mariam Towers, 8th Floor, PO Box 9193, Dar Es-Salaam, Tanzania Email: [email protected]
Phone #: 255 (22) 2866866/713 - 608854 Fax #: (255) 22 2124404Website: www.ttcdd.org
THISDAYAddress: 35 Creek Road, Apapa, LagosEmail: [email protected]; [email protected] #: (234) 8022924721-2; 8022924485Fax #: (234) 1 4600276Website: www.thisdayonline.com
Uganda Debt NetworkAddress: Plot 424 Mawanda Road, Kamwokya Kampala / P.O. Box 21509 Kampala, Uganda Email: [email protected] #: (256) 414 533840/543974Fax #: (256) 414 534856Website: www.udn.or.ug
Uganda NGO National ForumAddress: Plot 25, Muyenga Tank Hill Rd, Kabalagala, PO Box 4636, Kampala, Uganda Email: [email protected] #: (256) 772 408 365 Fax #: (256) 312 260 372 Website: www.ngoforum.or.ug
Zimbabwe Coalition on Debt and Development (ZIMCODD)Address: 5 Orkney Road, Eastlea, Harare, Zimbabwe; P O Box 8840, Harare, Zimbabwe Email: [email protected] #: (263) 4 776830/31 Fax #: (263) 4 776830/1 Website: www.zimcodd.org.zw
RoA Asia/Pacific
Advancing Public Interest Trust (APIT)Address: 107/ Ground Floor, Sher Sha Shuri Road, Mohammadpur, Dhaka 1216 Bangladesh Email: [email protected] #: (880) 2-9121396; (880) 2-9134406 Fax #: Ext-103Website: www.apitbd.org
Aidwatch PhilippinesAddress: 114 Timog Avenue, Quezon City, 1103 PhilippinesEmail: [email protected] #: (63) 2 927 7060 to 62Fax #: (63) 2 929 2496Website: aidwatch-ph.collectivetech.org/node/2
All Nepal Peasants’ Federation (ANPFa)Address: PO Box: 273, Lalitpur, NepalEmail: [email protected] #: (977) 1-4288404Fax #: (977) 1-4288403Website: www.anpfa.org.np
ANGIKAR Bangladesh FoundationAddress: Sunibir, 25 West Nakhalpara, Tejgaon, Dhaka 1215 Bangladesh Email: [email protected] #: 881711806054 (mobile)

85
ROA Members Directory
ROA Members Directory
Arab NGO Network for Development (ANND)Address: P.O.Box: 5792/14, Mazraa: 1105 - 2070 Beirut, LebanonEmail: [email protected] #: (961) 1 319366Fax #: (961) 1 815636Website: www.annd.org
Asia Pacific Mission for Migrants (APMM)Address: c/o Kowloon Union Church, No.2 Jordan Road, Kowloon, Hong Kong SAR of ChinaEmail: [email protected] #: (852) 2723-7536 Fax #: (852) 2735-4559 Website: www.apmigrants.org
Centre for Human Rights and Development (CHRD)Address: Baga toiruu, Chingeltei district, Ulanbataar 17, MongoliaPhone #: (976) 11325721Fax #: (976) 11325721Website: www.owc.org.mn
Centre for Organisation Research and Education (CORE)Address: National Programme Office A-5 Vienna Residency Aldona Bardez 403 508, Goa, India Email: [email protected]; [email protected] #: (91) 832-228 9318 Website: www.coremanipur.org
China Association for NGO Cooperation (CANGO)Address: C-601, East Building, Yonghe Plaza, 28# Andingmen Dongdajie, Beijing, 100007, P.R.ChinaEmail: [email protected] Phone #: (86) 10 64097888 Fax #: (86)10 64097607 Website: www.cango.org
COASTAddress: House# 9/4, Road# 2, Shyamoli, Dhaka 1207 BangladeshEmail: [email protected] Phone #: (880) 2-8125181Fax #: (880) 2-9129395Website: www.coastbd.org
Coastal Development Partnership (CDP)Address: 55/2 Islampur Road, Khulna-9100, BangladeshEmail: [email protected] #: (880) 1916033444Fax #: 88 02 9564474Website: www.cdpbd.org
Cooperation Committee for Cambodia (CCC)Address: #9-11, St. 476, TTPI, Chamkarmorn, Phnom Penh, Cambodia, PO Box 885, CCC Box 73Phone #: (855 23) 216 009 or (855 -16) 900 503 Fax #: (855 23) 216 009Website: www.ccc-cambodia.org
Cordillera People’s Alliance (CPA)Address: # 2 P. Guevarra Street, West Modern Site, Aurora Hill, 2600 Baguio City, Philippines
Email: [email protected]; [email protected] #: (63) 74 304-4239 Fax #: (63) 74 443-7159 Website: www.cpaphils.org
Council for People’s Democracy and Governance (CPDG)Address: Quezon City, PhilippinesPhone #: (63) 2 3741285
East Timor Development Agency (ETDA)Address: P.O. Box 30, Bairro Pite, Dili, Timor-LesteEmail: [email protected] #: (670) 723 3674; (670) 723 3816
Ecumenical Center for Research, Education and Advocacy (ECREA)Address: 189 Rt. Sukuna Rd. G.P.O 15473 Suva Republic of Fiji Islands Phone #: (679) 3307 588Fax #: (679) 3311 248 Website: www.ecrea.org.fj
Forum LSM Aceh (Aceh NGOs Forum)Address: Jl. T. Iskandar No. 58 Lambhuk, Banda Aceh, IndonesiaEmail: [email protected]; [email protected] #: (62) 651 33619; 081514542457Fax #: (62)65125391Website: www.forumlsmaceh.org Forum of Women’s NGOs in KyrgyzstanAddress: Isanova 147, kv. 7; 720033 Bishkek, KyrgyzstanPhone #: (996) 312 214585; (996) 555 996612Website: www.forumofwomenngos.kg
Green Movement of Sri Lanka (GMSL)Address: No 9, 1st Lane, Wanatha Road, Gangodawila, Nugegoda, Sri Lanka Email: [email protected] #: (94) 11 2817156 Fax #: (94) 11 4305274 Website: www.greensl.net
IBON Foundation Inc.Address: 114 Timog Avenue, Quezon City, 1103 Philippines Phone #: (63) 2 927 6981Fax #: (63)2 927 6981 Website: www.ibon.org
INCIDIN BangladeshAddress: 9/11, Iqbal Road, Mohammadpur, Dhaka-1207 Bangladesh Phone #: (880) 2-8129733Website: www.incidinb.org
International NGO Forum on Indonesian Development (INFID)Address: JL Mampang Prapatan XI, No. 23 Jakarta 12790, Indonesia Email: [email protected] #: (62) 21 7919-6721 to 22Fax #: (62)21 794-1577 Website: www.infid.org
Law & Society Trust (LST)Address: Law & Society Trust, No. 3, Kynsey Terrace, Colombo 8, Sri Lanka

The Reality of Aid 2014 Report
86
ROA Members Directory
Email: [email protected], [email protected] #: (94) 11 2684845 / (94) 11 2691228 Fax #: (94) 11 2686843Website: www.lawandsocietytrust.org
Lok Sanjh FoundationAddress: House 494, Street 47, G-10/4, Islamabad, Pakistan Email: [email protected] #: (92) 51-2101043 Fax #: (92) 51 221 0395 Website: www.loksanjh.org
LOKOJ InstituteAddress: No. 706, Road No. 11, Adabor, Shamoli, Dhaka 1207, BangladeshEmail: [email protected]; [email protected] #: (880) 28150669Fax #: (880) 29664408Website: www.lokoj.org
Mindanao Interfaith People’s Conference (MIPC)Address: 2F PICPA Bldg., Araullo St.,Davao City 8000 PhilippinesEmail: [email protected] #: (63) 82 225 0743Fax #: (63) 82 225 0743
National Network of Indigenous Women (NNIW)Address: National Network of Indigenous Women (NNIW), Kathmandu Metropolitan- 34, Baneshwor, PO Box 7238, NepalEmail: [email protected] Phone #: (977) 1-4115590 Fax #: (977) 1-4115590 Website: www.nniw.org.np
Nepal Policy Institute (NPI)Address: 60 Newplaza Marga, Putalisadak, Kathmandu, NepalEmail: [email protected]; [email protected] #: (977) 1-4429741Fax #: (977) 1-4419610Website: npi.org.np
NGO Federation of NepalAddress: Post Box No 8973 NPC 609, New Baneshwor, Kathmandu, Nepal Email: [email protected] #: (977) 1 4782908; Cell : 977 9841212769 Fax #: (977) 1 4780559Website: www.ngofederation.org
Pacific Islands Association of Non Governmental Organisations (PIANGO)Address: 30 Ratu Sukuna Road, Nasese, Suva, Fiji Islands; Postal: P.O. Box 17780, Suva, Fiji Email: [email protected] #: (679) 330-2963 / 331-7048 Fax #: (679) 331-7046Website: www.piango.org
Pakistan Institute of Labor and Education Research (PILER)Address: Pakistan Institute of Labour Education & Research ST-001, Sector X, Sub Sector - V, Gulshan-e-Maymar, Karachi – Pakistan
Email: [email protected]; [email protected] Phone #: (92) 21 6351145-7Fax #: (92) 21 6350354Website: www.piler.org.pk
Peoples Workers UnionAddress: B-25, Bano Plaza, Garden East, Nishtar Road, Karachi, Pakistan Phone #: 92-30-02023639
ProshikaAddress: I/1-Ga, Section-2, Mirpur, Dhaka-1216, BangladeshEmail: [email protected] #: (880) 8015812; (880) 8016015Fax #: (880) 2-8015811Website: www.proshika.org
Public Interest Research Centre (PIRC)Address: 142, Maitri Apartments, Plot No. 2, Patparganj, Delhi – 110 092, India Phone #: (91) 11-43036919Fax #: (91) 11-222-4233
SEWALANKA FoundationAddress: # 432 A, 2nd Floor, Colombo Road, Boralesgamuwa, Sri Lanka Email: [email protected] #: (94) 773524410; (94) 112545362-5 Fax #: (94) 112545166Website: www.sewalanka.org
Shan Women’s Action Network (SWAN)Address: PO Box 120 Phrasing Post Office, Chiangmai 50200, Thailand Email: [email protected]; [email protected]: www.shanwomen.org
Solidarity for People’s Advocacy Network (SPAN)Address: Cebu City, PhilippinesEmail: [email protected]
South Asian Network for Social and Agricultural Development (SANSAD)Address: N-13, Second Floor Green Park Extension New Delhi India - 110016 Phone #: (91) 11-4164 4845Fax #: (91) 11-4175 8845 Website: www.sansad.org.in
Tamil Nadu Women’s ForumAddress: Kallaru, Perumuchi Village and Post Arakkonam 631 002, Vellore District, Tamil Nadu, IndiaEmail: [email protected] Phone #: (91) 041421 70702
The NGO Forum on CambodiaAddress: #9-11 Street 476, Toul Tompong, P.O. Box 2295, Phnom Penh 3, Cambodia Email: [email protected] #: (855) 23-214 429 Fax #: (855) 23- 994 063 Website: www.ngoforum.org.kh

87
ROA Members Directory
ROA Members Directory
Third World Network (TWN)Address: 131 Jalan Macalister, 10400 Penang, MalaysiaEmail: [email protected]; [email protected] #: (60) 4 2266728/2266159Fax #: (60) 42264505Website: www.twnside.org.sg
UBINIG (Policy Research for Development Alternative)Address: 22-13, Khilzee Road, Block # B, Mohammadpur, Shaymoli, Dhaka 1207, Bangladesh Email: [email protected] #: (880) 2 81 11465; 2 81 16420 Fax #: (880) 2 81 13065
Vietnam Union of Science & Technology Associations (VUSTA)Address: 53 Nguyen Du Str. - Ha Noi - Viet NamEmail: [email protected] #: (84)4 9432206Fax #: (84)4 8227593Website: www.vusta.vn
Vikas Andhyayan Kendra (VAK)Address: D-1 Shivdham, 62 Link Road, Malad (West), Mumbai 400 064 India Email: [email protected] #: (91) 22-2882 2850 / 2889 8662 Fax #: (91) 22-2889 8941Website: www.vakindia.org
Voices for Interactive Choice and Empowerment (VOICE)Address: House #67, 4th floor, Block-Ka, Pisciculture Housing Society, Shaymoli, Dhaka-1207, BangladeshEmail: [email protected] Phone #: (880) 2-8158688 Fax #: (880) 2-8158688 Website: www.voicebd.org
Wave FoundationAddress: 3/11. Block-D, Lalmatia, Dhaka 1207, BangladeshEmail: [email protected] #: (880) 2-8113383
RoA Latin America
(SUR) Centro de Estudios Sociales y EducaciónAddress: José M. Infante 85, Providencia, Santiago, ChileEmail: [email protected] #: (562)2642406 / 2360470Fax #: (562)2359091Website: www.sitiosur.cl
Asociación Arariwa para la Promoción Técnica-cultural AndinaAddress: Apartado postal 872, Cusco, Perú, Avenida Los Incas 1606, Wanchaq Cusco, Perú Email: [email protected] #: (5184) 236-6887 Fax #: (5184) 236889 Website: www.arariwa.org.pe
Asociación Civil Acción CampesinaAddress: Calle Ayuacucho oeste No. 52, Quinta Acción Campesina Los Teques, Estado Miranda, VenezuelaEmail: [email protected]
Phone #: (58 212) 3214795Fax #: (58 212) 321 59 98Website: www.accioncampesina.com.ve
Asociación Latinoamericana de Organizaciones de Promoción al Desarrollo, A.C.Address: Benjamín Franklin 186, Col. Escandón, Del. Miguel Hidalgo, México, D.F. C.P. 11800 Email: [email protected] #: (5255) 52733400 Fax #: (5255) 52733449 Website: www.alop.org.mx
Asociación para el Desarrollo de los Pueblos (ADP)Address: Apartado postal 4627, Managua C.S.T. 5 cuadras al Sur, 1 1/2; cuadra al Oeste Managua, NicaraguaEmail: [email protected] Phone #: (505) 2281360 Fax #: (505)2664878 Website: www.adp.com.ni
Base, Educación, Comunicación, Tecnología Alternativa (BASE-ECTA)Address: Avenida Defensores del Chaco, piso 1 San Lorenzo, Paraguay Código Postal 2189 San LorenzoEmail: [email protected] #: (59521) 576786/ (59521) 580239 Central Ecuatoriana de Servicios Agrícolas(CESA)Address: Apartado postal: 17-16 -0179 C.E.Q. Inglaterra N 3130 y Mariana de Jesús, Quito, EcuadorEmail: [email protected] Phone #: (593 2) 524830 / 2529896 Fax #: (5932) 503006Website: www.cesa.org.ec
Centro Andino de Acción Popular (CAAP)Address: Apartado postal 17-15 – 173 – B Martín de Utreras 733 y Selva Alegre Quito, Ecuador Email: [email protected] #: (5932) 252-763 / 523-262 Fax #: (5932) 568-452Website: www.ecuanex.net.ec/caap
Centro Cooperativista Uruguayo (CCU)Address: Edo. Víctor Haedo 2252, CP 11200 Montevideo, UruguayEmail: [email protected] #: (5982) 4012541 / 4009066 / 4001443Fax #: (5982) 4006735Website: www.ccu.org.uy
Centro de Assessoria Multiprofissional (CAMP)Address: Praca Parobé, 130-9o andar Centro 90030.170, Porto Alegre – RS Brasil Email: [email protected] #: (5551) 32126511 Fax #: (5551) 32337523 Website: www.camp.org.br
Centro de Derechos y Desarrollo (CEDAL)Address: Huayna Capac No 1372, Jesús María Lima 11, PerúEmail: [email protected] / [email protected] #: (511) 2055730

The Reality of Aid 2014 Report
88
ROA Members Directory
Fax #: (511) 2055736Website: www.cedal.org.pe
Centro de Educación Popular (QHANA)Address: Apartado postal 9989, La Paz, Calle Landaeta No. 522, La Paz, Bolivia Email: [email protected] / [email protected]: www.qhana.org.bo
Centro de Estudios y Promoción del Desarrollo (DESCO)Address: Jr León de la Fuente No. 110, Lima 17, PerúEmail: [email protected] #: (511) 613-8300 a 8307Fax #: (511 ) 613-8308Website: www.desco.org.pe
Centro de Investigación y Promoción del Campesino (CIPCA)Address: Pasaje Fabiani No. 2578 Av. 20 de Octubre / Campos y Pinilla, Casilla 5854, La Paz, BoliviaEmail: [email protected] #: (591 2) 2432272, 22432276 Fax #: (5912) 22432269Website: www.cipca.org.bo
Centro de Investigaciones (CIUDAD)Address: Calle Fernando Meneses N24-57 y Av. La Gasca, Casilla Postal 1708-8311, Quito, EcuadorEmail: [email protected] #: (5932) 2225-198 / 2227-091Fax #: (5932) 2500-322Website: www.ciudad.org.ec
Centro de Investigaciones y Educación Popular (CINEP)Address: Apartado postal 25916, Santafé de Bogotá, Carrera 5ª No. 33A-08, Bogotá, Colombia Email: [email protected] #: (571) 2456181 Fax #: (571) 2879089 Website: www.cinep.org.co
Centro Dominicano de Estudios de la Educación (CEDEE)Address: Santiago 153, Gazcue (Apdo. Postal 20307) Santo Domingo, Dominicana, Rep. Email: [email protected]; [email protected] #: (1809) 6823302; 6882966 Fax #: (1 809) 686-8727
Centro Félix Varela (CFV)Address: Calle 5ª No 720 e/ 8 y 10 El Vedado, Ciudad Habana, CubaEmail: [email protected] / [email protected] #: (537) 8367731Fax #: (53 7) 8333328Website: www.cfv.org.cu
Centro Latinoamericano de Economía Humana (CLAEH)Address: Zelmar Michelini 1220 11100 Montevideo, UruguayEmail: [email protected] #: (5982) 9007194Fax #: (5982) 9007194 ext 18Website: www.claeh.org.uy
Centro Operacional de Vivienda y Poblamiento AC (COPEVI)Address: Calle Primero de Mayo #151 Col. San Pedro de los Pinos, Del. Benito Juárez México, D.F. C.P. 03800, MéxicoEmail: [email protected] Phone #: (5255) 55159627 y 4919 Website: www.copevi.org
Centro para la Acción Legal en Derechos Humanos (CALDH)Address: 6ª. Avenida 1-71, Zona 1, Ciudad de Guatemala, Guatemala
Email: [email protected] #: (502) 2251-0555Fax #: (502) 2230-3470Website: www.caldh.org
Centro Peruano de Estudios Sociales (CEPES)Address: Av. Salaverry No. 818, Jesús María, Lima 11, PerúEmail: [email protected] #: (511) 433-6610Fax #: (511) 433-1744Website: www.cepes.org.pe
Comisión de Acción Social Menonita (CASM)Address: Barrio Guadalupe 21-22, Calle 3, Av. NE, 2114 San Pedro Sula, Cortés, Honduras Email: [email protected], [email protected] #: (504) 552 9469/70 Fax #: (504) 552 0411 Website: www.casm.hn
Coordinacion de ONG y Cooperativas (CONGCOOP)Address: 2a. Calle 16-60 zona 4 de Mixco, Residenciales Valle del Sol, Edificio Atanasio Tzul, 2do. Nivel Guatemala, Centro AmericaPhone #: (502) 2432-0966 Fax #: (502) 2433-4779 Website: www.congcoop.org.gt
Corporación de Estudios Sociales y Educación (SUR )Address: José M. Infante 85, Providencia, Santiago, ChileEmail: [email protected] #: (56) 2 235 8143; 236 0470Fax #: (56) 2 235-9091Website: www.sitiosur.cl
Corporación Juventudes para el Desarrollo y la Producción (JUNDEP)Address: Fanor Velasco 27, Santiago, Chile Email: [email protected] #: (562) 3611314 - 3611316Website: www.jundep.cl
Corporación Región para el Desarrollo y la DemocraciaAddress: Apartado postal 67146 Medellín, Calle 55 No. 41-10, Medellín, Colombia Email: [email protected] #: (574) 216-6822 Fax #: (574) 239-5544 Website: www.region.org.co
Corporación Viva la CiudadaníaAddress: Calle 54, No. 10-81, piso 7, Bogotá, ColombiaEmail: [email protected] #: (57 1) 3480781
89
ROA Members Directory
89
Fax #: (57 1) 212-0467Website: www.viva.org.co
Deca-Equipo Pueblo, ACAddress: Apartado postal 113-097 México, D.F., Francisco Field Jurado No.51, México, D.F. MéxicoEmail: [email protected] Phone #: (52 55) 5539 0055 – 5539 0015 Fax #: (52 55) 5672 7453Website: www.equipopueblo.org.mx
Enlace, Comunicación y Capacitación, AC (ENLACE)Address: Benjamín Franklin 186 Col. Escandón CP 11800, México, D.F., México Email: [email protected] #: (52 55) 52733343 – 52734648 Website: www.enlacecc.org
Federación de Órganos para Asistencia Social Educacional (FASE)Address: Rua das Palmeiras, 90 Botafogo, 22270-070 Río de Janeiro, Brasil Email: [email protected] #: (5521) 25367350 Fax #: (5521) 25367379 Website: www.fase.org.br
Fondo Ecuatoriano Populorum Progressio (FEPP)Address: Apartado postal 17-110-5202 Quito Calle Mallorca N24-275 y Coruña, Quito,Ecuador Email: [email protected] #: (5932) 2520408 – 2529372 Fax #: (5932) 250-4978Website: www.fepp.org.ec Fundación Foro Nacional por ColombiaAddress: Carrera 4 A No 27 62 Bogotá D.C., ColombiaEmail: [email protected] #: (571) 2822550Fax #: (571) 2861299Website: www.foro.org.co
Fundación Nacional para el Desarrollo (FUNDE)Address: Calle Arturo Ambrogi #411 entre 103 y 105 Av. Norte, Col. Escalón, San Salvador, El Salvador, P.O. Box 1774, Centro de GobiernoEmail: [email protected] Phone #: (503) 22095300 Fax #: (503) 22630454 Website: www.funde.org
Fundación para el Desarrollo en Justicia y Paz (FUNDAPAZ)Address: Calle Castelli 12, segundo piso “A” (C1031AAB) Buenos Aires, Argentina Email: [email protected] #: (5411) 48648587 Fax #: (5411) 48616509 Website: www.fundapaz.org.ar
Fundación Promotora de Vivienda (FUPROVI)Address: Del costado Norte de la Iglesia de Moravia 700 mts. Este, 100 mts. Norte, 100 mts. Oeste Moravia, San José, Costa RicaEmail: [email protected]
Phone #: (506) 2470000 Fax #: (506) 2365178 Website: www.fuprovi.org
Fundación Salvadoreña para la Promoción y el Desarrollo Económico(FUNSALPRODESE)Address: Apartado postal 1952 Centro de Gobierno, 27 Calle Poniente y 17 Av. Norte, No. 1434, Colonia Layco, San Salvador, El SalvadorEmail: [email protected] Phone #: (503) 22252722 / 22250414 / 0416Fax #: (503) 22255261Website: www.funsalprodese.org.sv
Fundación SES (Latindadd)Address: Avda de Mayo 1156 2º piso,Ciudad de Buenos Aires. Argentina Email: [email protected] / [email protected] #: 54-11-4381-4225/3842 Website: www.fundses.org.ar Fundación Taller de Iniciativas en Estudios Rurales (Fundación Tierra)Address: Apartado postal 8155, La Paz Calle Hermanos Manchego No. 2576 La Paz, Bolivia Email: [email protected] #: (5912) 2430145 – 2432263/2683 Fax #: (5912) 211 1216Website: www.ftierra.org
Grupo Social Centro al Servicio de la Acción Popular (CESAP)Address: San Isidro a San José de Ávila, final avenida Beralt (al lado de la Abadía), Edificio Grupo Social CESAP Caracas, VenezuelaEmail: [email protected] #: (58212) 8627423/7182 – 8616458 Fax #: (58212) 8627182Website: www.cesap.org.ve
Instituto Cooperativo Interamericano (ICI)Address: Apartado postal 0834-02794, Ciudad de Panamá, Avenida La Pulida, Pueblo Nuevo, Ciudad de Panamá, PanamáEmail: [email protected] Phone #: (507) 2246019/ 2240527Fax #: (507) 2215385Website: www.icipan.org
Instituto de Desarrollo Social y Promoción Humana (INDES)Address: Luis Sáenz Peña 277, 5to. Piso, oficina 10, 1110 Buenos Aires, Argentina Email: [email protected] [email protected] #: (5411) 43726358/ (543752) 435764 Fax #: (5411) 43726358/ (543752) 435764 Website: www.indes.org.ar
Instituto de Estudos Socioeconomicos (INESC)Address: SCS quadra 08 Bloco B-50, salas 433/441 Edificio Venáncio 2000, CEP 70333-970 Brasilia – DF, BrazilEmail: [email protected] Phone #: (55 61) 212-0200Fax #: (55 61) 226-8042 Website: www.inesc.org.br

The Reality of Aid 2014 Report
90
Instituto de Estudos, Formacao e Assessoria em Politicas Sociais (Instituto Pólis)Address: Rua Araújo, 124 Centro, Sao Paulo - SP Brazil Email: [email protected] #: (55) 11 2174-6800 Fax #: (55) 11 2174 6848 Website: www.polis.org.br Instituto Hondureño de Desarrollo Rural (IHDER)Address: Apartado postal 2214, Tegucigalpa, D.C., Honduras Colonia Presidente Kennedy, Zona No. 2, Bloque No. 37,casa #4416, Súper Manzana No. 5 Tegucigalpa, HondurasEmail: [email protected] Phone #: (504) 2300927
Juventudes para el Desarrollo y la Producción (JUNDEP)Address: Fanor Velasco 27, Santiago, ChileEmail: [email protected]; [email protected] #: (56) 3611314; 3611321Website: www.jundep.cl
La MoradaAddress: Purísima 251, Recoleta Santiago, ChileEmail: [email protected] #: (562)732 3728Fax #: (562)732 3728Website: www.lamorada.org
Productividad Biosfera Medio Ambiente - ProbiomaAddress: Equipetrol calle 7 Este No 29 Santa Cruz de la Sierra, BoliviaEmail: [email protected] #: (591) 2 3431332Fax #: (591) 2 3432098Website: www.probioma.org.bo
Programa de Promoción y Desarrollo Social (PRODESO)Address: Apartado postal 168, Santiago de Veraguas, Calle 4 Paso de las Tablas, Santiago de Veraguas, PanamáEmail: [email protected] Phone #: (507) 998-1994 Fax #: 998-6172Website: www.prodeso.org
Proyecto de Desarrollo Santiago-La Salle (PRODESSA)Address: Apartado postal 13 B, 01903, Guatemala, Km. 15 Calzada Roosevelt, Zona 7 Guatemala, GuatemalaEmail: [email protected], [email protected], [email protected] #: (502) 24353911Fax #: (502) 24353913 Website: www.prodessa.net
Red Latinoamericana sobre Deuda , Desarollo y Derechos (LATINDADD)Address: Jr. Daniel Olaechea 175, Jesús María - Perú Email: [email protected] #: (511) 261 2466Fax #: (511) 261 7619Website: www.latindadd.org
Servicio de Información Mesoamericano sobre Agricultura Sostenible (SIMAS)Address: Lugo Rent a Car 1c al lago, Esq. Sur oeste parque El
Carmen, Reparto El Carmen, Managua, NicaraguaEmail: [email protected] Phone #: (505) 22682302 Fax #: (505) 22682302 Website: www.simas.org.ni
Servicio Ecuménico de Promoción Alternativa (SEPA)Address: Apartado postal 23036 Fernando de la Mora Soldado Ovelar 604 esq. Marcos Riera, Fernando de la Mora, ParaguayEmail: [email protected] #: (59521) 515-855/ 514365
Servicio Habitacional y de Acción Social (SEHAS)Address: Bv. del Carmen 680, Villa Siburu (5003) Córdoba, Argentina Email: [email protected] #: (54 351) 480-5031 Fax #: (54 351) 489-7541 Website: www.sehas.org.ar
Servicios para la Educación Alternativa AC (EDUCA)Address: Escuadrón 201 #203 Col. Antiguo Aeropuerto, Oaxaca, México C.P. 68050 Email: direcció[email protected] #: (52 951) 5136023 – (52 951) 5025043 Website: www.edudaoaxaca.org
RoA European OECD Countries
11.11.11 - Coalition of the Flemish North-South MovementAddress: Vlasfabriekstraat 11, 1060 Brussels, BelgiumEmail: [email protected]
Phone #: (32) 2 536 11 13Fax #: (32) 2 536 19 10Website: www.11.be
Action Aid ItalyAddress: ActionAid International - via Broggi 19/A - 20129 Milano, Italy Website: www.actionaid.it
Action Aid UKAddress: Hamlyn House, Macdonald Road, Archway, London N19 5PG, UKEmail: [email protected] #: (44) 20 7561 7561Fax #: (44) 20 7272 0899Website: www.actionaid.org.uk
Alliance SudAddress: Monbijoustrasse 31, PO Box 6735 CH-3001 Berne, Switzerland Email: [email protected] #: (41) 31 390 93 33 Fax #: (41) 31 390 93 31 Website: www.alliancesud.ch
British Overseas NGOs for Development (BOND)Address: Bond Regent’s Wharf 8 All Saints Street London N1 9RL, UK Email: [email protected]; [email protected] #: (44) 20 7520 0252 Fax #: (44) 20 7837 4220 Website: www.bond.org.uk

91
ROA Members Directory
Campagna per la Riforma della Banca (CRBM)Address: Mondiale (CRBM), via Tommaso da Celano 15, 00179 Rome, Italy Email: [email protected] #: (39) 06-78 26 855 Fax #: (39) 06-78 58 100 Website: www.crbm.org
CeSPI - Centro Studi di Politica InternazionaleAddress: Via d’Aracoeli 11, 00186 Rome, ItalyEmail: [email protected] #: (39) 06 6990630Fax #: (39) 06 6784104Website: www.cespi.it
Christoffel-Blindenmission Deutschland e.V. (CBM)Address: Christian Blind Germany e.V., Nibelungen Straße 124, 64625 Bensheim, Germany Email: [email protected] #: (49) 6251 131-0 Fax #: (49) 6251 131-199Website: www.christoffel-blindenmission.de
Concern WorldwideAddress: 52-55 Lower Camden Street, Dublin 2 IrelandEmail: [email protected] #: (353) 1 417 7700; (353) 1417 8044Fax #: (353) 1 475 7362Website: www.concern.net
Coordination SUDAddress: 14 passage Dubail, 75010 Paris, FranceEmail: [email protected] #: (33) 1 44 72 93 72Fax #: (33) 1 44 72 93 73Website: www.coordinationsud.org
Diakonia-SwedenAddress: SE-172 99 Sundbyberg, Stockholm, SwedenEmail: [email protected] #: (46) 8 453 69 00Fax #: (46) 8 453 69 29Website: www.diakonia.se
European Network on Debt and Development (EURODAD)Address: Rue d’Edimbourg, 18–26 1050 Brussels BelgiumEmail: [email protected] #: (32) 2 894 46 40Fax #: (32) 2 791 98 09Website: www.eurodad.org
EurostepAddress: Eurostep AISBL, Rue Stevin 115, B-1000 Brussels, Belgium Email: [email protected] #: (32) 2 231 16 59 Fax #: (32) 2 230 37 80 Website: www.eurostep.org
Forum SydAddress: PO Box 15407, S-104 65 Stockholm, SwedenEmail: [email protected]; [email protected] #: 0046 8-506 371 62Fax #: 46 8 506 370 99Website: www.forumsyd.org
Global Responsibility Austrian Platform for Development and Humanitarian AidAddress: Berggasse 7/11, A-1090 Vienna, Austria Email: [email protected] #: (43) 1 522 44 22-0 Website: www.agez.at
IBISAddress: IBIS Copenhagen, Norrebrogade 68B, 2200 Copenhagen N, Denmark Email: [email protected] #: (45) 35358788Fax #: (45) 35350696Website: www.ibis.dk
Intermón OxfamAddress: Calle Alberto Aguilera 15, 28015 Madrid, SpainEmail: [email protected] #: (34) 902 330 331Website: www.intermonoxfam.org
KEPAAddress: Service Centre for Development Cooperation- KEPA Töölöntorinkatu 2 A, 00260 Helsinki, FinlandEmail: [email protected] Phone #: (358) 9-584 233 Fax #: (358) 9-5842 3200 Website: www.kepa.fi
MS Action Aid DenmarkAddress: MS ActionAid Denmark Fælledvej 12 2200 Kbh N., Denmark Email: [email protected] #: (45) 7731 0000 Fax #: (45) 7731 0101 Website: www.ms.dk
Networkers South-NorthAddress: Ullveien 4 (Voksenåsen), 0791 Oslo, NorwayEmail: [email protected] #: (47) 93039520Website: www.networkers.org
Norwegian Forum for Environment and Development (ForUM)Address: Storgata 11, 0155 Oslo, NorwayEmail: [email protected]; [email protected] #: (47) 2301 0300Fax #: (47) 2301 0303Website: www.forumfor.no
Novib - Oxfam NetherlandsAddress: Mauritskade 9, P.O. Box 30919, 2500 GX The Hague, The Netherlands Email: [email protected] #: (31) 70 3421777 Fax #: (31) 70 3614461 Website: www.novib.nl
OEFSE- Austrian Foundation for Development ResearchAddress: Berggasse 7, A-1090 Vienna, AustriaEmail: [email protected] #: (43)1 317 40 10 - 242
The Reality of Aid 2014 Report
92
Fax #: (43) 1 317 40 15Website: www.oefse.at
OIKOSAddress: Rua Visconde Moreira de Rey, 37 Linda-a-Pastora 2790-447 Queijas, Oeiras - Portugal Email: [email protected] #: (351) 218 823 649; (351) 21 882 3630 Fax #: (351) 21 882 3635Website: www.oikos.pt
Terre Des Hommes - GermanyAddress: Hilfe für Kinder in Not Ruppenkampstraße 11a 49084 Osnabrück, Germany Postfach 4126 49031 Osnabrück, Germany
Email: [email protected]; [email protected] Phone #: (05 41) 71 01 –0Fax #: (05 41) 71 01 –0 Website: www.tdh.de
UK Aid Network (UKAN)Address: UKAN, Action Aid, Hamyln House, London, N19 5PG, UKEmail: [email protected] #: +44 207 561 7563
RoA non-European OECD Countries
Aid/WatchAddress: 19 Eve St Erskineville NSW 2043, AustraliaEmail: [email protected] #: (61) 2 9557 8944Fax #: (61) 2 9557 9822Website: www.aidwatch.org.au
American Council for Voluntary International Action (InterAction)Address: 1400 16th Street, NW, Suite 210 | Washington, DC 20036, USA Email: [email protected] #: (1) 202 667-8227 Fax #: (1) 202 667-8236 Website: www.interaction.org
Australian Council for International Development (ACFID)Address: 14 Napier Close Deakin Australian Capital Territory (Canberra) 2600, Australia Email: [email protected] #: (61) 2 6285 1816Fax #: (61) 2 6285 1720Website: www.acfid.asn.au
Canadian Council for International Cooperation/Conseil canadien pour la coopération internationale (CCIC/CCCI)Address: 450 Rideau Street, Suite 200 Ottawa, Ontario, K1N 5Z4, Canada Email: [email protected] #: (1) 613 241-7007 Fax #: (1) 613 241-5302 Website: www.ccic.ca
Council for International Development (CID)Address: 2/F James Smith’s Building cnr. Manners Mall and Cuba St., Wellington, New Zealand/ PO Box 24 228, Wellington 6142, New ZealandEmail: [email protected] Phone #: (64) 4 4969615 Fax #: (64) 4 4969614 Website: www.cid.org.nz
Friends of the Earth (FOE) JapanAddress: International Environmental NGO, FoE Japan 3-30-8-1F Ikebukuro Toshima-ku Tokyo 171-0014, JapanEmail: [email protected]; [email protected] Phone #: (81) 3-6907-7217Fax #: (81)3-6907-7219 Website: www.foejapan.org
Japan International Volunteer Center (JVC)Address: 6F Maruko Bldg., 1-20-6 Higashiueno, Taito-ku, Tokyo 110-8605 Japan Email: [email protected]; [email protected] #: (81) 3-3834-2388 Fax #: (81) 3-3835-0519 Website: www.ngo-jvc.net
Japan ODA Reform Network-Kyoto
Japanese NGO Center for International Cooperation (JANIC)Address: 5th Floor Avaco Building, 2-3-18 Nishiwaseda, Shinjuku-ku, Tokyo 169-0051, Japan Email: [email protected] #: (81) 3-5292-2911 Fax #: (81) 3-5292-2912 Website: www.janic.org.en
ODA Watch KoreaAddress: 110-240 #503 Dong-Shin Bldg., 139-1 Anguk-dong, Jongno-gu, Seoul, Korea Email: [email protected] #: (82) 2-518-0705Fax #: (82) 2-761-0578Website: www.odawatch.net
Pacific Asia Resource Center (PARC)Address: 2, 3F Toyo Bldg., 1-7-11 Kanda-Awaji-cho, Asia Taiheiyo Shiryo Centre, Chiyoda-ku, Tokyo 101-0063, JapanEmail: [email protected] Phone #: (81) 3-5209-3455 Fax #: (81) 3-5209-3453 Website: www.parc-jp.org
People’s Solidarity for Participatory DemocracyAddress: 132 Tongin-Dong, Jongno-Gu,Seoul, 110-043, South of KoreaEmail: [email protected]/ [email protected] #: (82) 2 723 5051Fax #: (82) 2 6919 2004Website: www.peoplepower21.org/English


![Augmented Reality As a Working Aid for …ageconsearch.umn.edu/bitstream/231890/2/agris_on-line...[32] Augmented Reality As a Working Aid for Intellectually Disabled Persons for Work](https://img.pdfslide.net/doc/110x75/5c9770a309d3f2720a8c3d48/augmented-reality-as-a-working-aid-for-32-augmented-reality-as-a-working-aid-for.jpg)