Embed Size (px)
Citation preview

Absa AgriBusiness
Presenter nameSubject
Disclaimer: Although everything has been done to ensure the accuracy of the information, the Bank takes no responsibility for actions or losses that might occur due to the usage of this information.
ABSA AgriBusiness
Agric-Economic Outlook
1 October 2009

Absa AgriBusiness
Discussion agenda
1. Macro economic trends – World social spend supports agriculture
2. Agricultural insights - Golden days for agriculture is back
3. Africa the new frontier – Food security
4. Commodity outlook for Selected Agricultural commodities

Absa AgriBusiness
Economic outlook – Supply and demand

Absa AgriBusiness
Summery of world economic impact on South African Agriculture
• This lead to a shift in demand with a resulting increase in commodity prices
• The demand for bio-fuels also impacted positively on commodity prices
• Commodity prices was further supported by lower world stocks
• Food demand remain sticky
US Maize prices($/t)
-
50.0
100.0
150.0
200.0
250.0
1966 1971 1976 1981 1986 1991 1996 2001 2006 2011
• Shift in world soft commodity demand – After capitalism replaced communism as economic system in the late 90’s
world economic growth increased to more than 4.9% per annum for the four years preceding 2008
– In 2008 - 2009 world experienced a financial meltdown• World wide approximately one billion jobs will be lost during 2009 • In SA approximately 600 000 jobs is expected to be lost in 2009• If you loos your job you loos your house and your car but you do not loos the need to eat
– In a world economic crisis the poor of the poor (job less) is supported by social spend (Dole, Workmen's compensation, Food stamps, Social spend) supporting demaand.
The net result is higher commodity prices in spite of a world economic meltdown

Absa AgriBusiness
Exchange rate impact on South African Agriculture

Absa AgriBusiness
Economic outlook – Balance of Payment
• Exchange rate indicators
• The rand will continue to strengthen against the US Dollar and Chinese currencies while the dollar will tend to weaken against the Euro
• This is mainly due to the link between the US dollar and the Chinese Yuan as well as the current account deficit of the US (- 3% of GDP)
• The Rand is expected to continue to weaken against the bulk of the other currencies
Relation between Long-term capital movements and Balance on current Account (R '000 000)
Nominal exchange rates(SA cents / Fc unit)
-60,000
-40,000
-20,000
0
20,000
40,000
60,000
80,000
Ma
r-0
1
Ma
r-0
2
Ma
r-0
3
Ma
r-0
4
Ma
r-0
5
Ma
r-0
6
Ma
r-0
7
Ma
r-0
8Current accountCapital movements
10
210
410
610
810
1010
1210
1410
1610
1810
2010
Jan-00 Jan-02 Jan-04 Jan-06 Jan-08 Jan-10
Aus Dollar US Dollar UK PoundEuro Yuan
Sources: SA Reserve Bank, ABSA

Absa AgriBusiness
Economic outlook – Inflation
Pointers• Due to higher inflation in 2007 and 2008 the Reserve Bank increased interests rates in a
bid to control inflation. • All indication are that inflation is under control and it is expected that inflation will
continue to decline creating some leeway for the Reserve Bank to lower interest rates even further.
Relation between consumer price (CPI) and Producer price (PPI) index (% change)
Relation between agricultural input and output prices (%
change)
0%
5%
10%
15%
20%
25%
30%
1975 1978 1981 1984 1987 1990 1993 1996 1999 2002 2005 2008 2011
PPI All items CPI All items CPI Food CPIX
-20%
-10%
0%
10%
20%
30%
40%
50%
60%
70%
1990 1995 2000 2005 2010
Agricultural PPI
Farming requisites
Producer price
Sources: SA Reserve Bank, own calculations

Absa AgriBusiness
Discussion agenda
1. Macro economic trends – World social spend supports agriculture
2. Agricultural insights - Golden days for agriculture is back
3. Africa the new frontier – Food security
4. Commodity outlook for Selected Agricultural commodities

Absa AgriBusiness
Effective Market

Absa AgriBusiness
Primary agricultural confidence index
WEIGHTED AGRIC INDEX (2000 = 100)
50
100
150
200
250
300
Jan-2000 Jan-2001 Jan-2002 Jan-2003 Jan-2004 Jan-2005 Jan-2006 Jan-2007 Jan-2008 Jan-2009
Ag
ric
ind
ex
50
250
450
650
850
1050
NF
I In
dex
Price Indexs Cost Indexs Agri Profit Index One Year Profit Average NFI Index Linear (Agri Profit Index)
Cost index was adjusted downward to reflect percentage deferential between Gross Producer Value (GDV) and total spend on Intermediary inputs in 2000 (cost = 52% of revenue)

Absa AgriBusiness
Discussion agenda
1. Macro economic trends – World social spend supports agriculture
2. Agricultural insights - Golden days for agriculture is back
3. Africa the new frontier – Food security
4. Commodity outlook for Selected Agricultural commodities

Absa AgriBusiness

Absa AgriBusiness
12
3
45
6
7
Pool gebied
Berg gebied
Toendra / Taiga
Gematigde
Mediterreens
Droë Grassvelde
Woestyn
Subtrope
Trope
Klimaat Topografie
12
3
45
6
7
Pool gebied
Berg gebied
Toendra / Taiga
Gematigde
Mediterreens
Droë Grassvelde
Woestyn
Subtrope
Trope
Klimaat Topografie
Polar area
Mountain area
Tundra / Taiga
Moderate
Mediterranean
Dry grasslands
Desert
Subtropical
Tropical
Climatic topography
World Climatic topography

Absa AgriBusiness
Market environment – World Market growth potential (2)
Pointers• Production growth
potential for 2050 must be viewed against expected growth in demand of approximately 40 – 60 % over the same period
• This is mainly the result of an expected population growth rate of between 0,9% to 1,1% and improvements in the economic welfare of consumers due to economic growth.
• Only a portion of economic growth will impact on the growth in demand for food as food is classified as one of the basic needs.
1980
2004
Growth 1980 tot
2004
Expected Production
2050
%
North and Central America
Agricultural Land (Ha million) Arable Land (Ha million)
Coarse grain production (Ton million) Oil seed production (Ton million)
Meat production (Ton million)
624 279 337 13 31
621 272 478 23 50
-0.5% -2.3% 41.9% 79.4% 64.2%
611 278 579 38 73
-1.7% 2.0%
21.0% 66.0% 44.0%
Europe
Agricultural Land (Ha million) Arable Land (Ha million)
Coarse grain production (Ton million) Oil seed production (Ton million)
Meat production (Ton million)
227 141 258
5 39
487 304 466 16 53
114.4% 116.0%
80.6% 229.9%
33.3%
477 289 671 31 87
-2.0% -5.0% 44.0%
102.0% 66.0%
Russia
Agricultural Land (Ha million) Arable Land (Ha million)
Coarse grain production (Ton million) Oil seed production (Ton million)
Meat production (Ton million)
553 232 170
3 15
567 207 157
5 10
2.4% -10.8%
-7.8% 56.7%
-36.9%
578 217 171
8 18
2.0% 5.0% 9.0%
65.0% 88.0%
South America and Caribbean Agricultural Land (Ha million)
Arable Land (Ha million) Coarse grain production (Ton million)
Oil seed production (Ton million) Meat production (Ton million)
717 146 88 6
16
784 169 158 21 38
9.4% 16.0% 79.2%
220.8% 138.4%
831 235 253 46
101
6.0% 39.0% 59.9%
124.0% 168.0%

Absa AgriBusiness
Market environment – World market growth potential (3)
Pointers• In the short term stiff
competition in terms of production expansion will come from South America.
• The most significant untapped opportunity is Africa
• As production expansion exceed demand expectations, prices of soft commodities will remain fairly depressed forcing farmers to improve efficiencies. This is only possible if producers incorporate new technology to improve efficiencies or use efficiencies of scale.
1980
2004
Growth 1980 tot
2004
Expected Production
2050
%
Africa
Agricultural Land (Ha million) Arable Land (Ha million)
Coarse grain production (Ton million) Oil seed production (Ton million)
Meat production (Ton million)
1,077 178 73
4 7
1,111 211 128
8 12
3.2% 18.3% 75.9% 67.4% 79.9%
1,200 337 323
20 28
8.0% 60.0%
153.0% 172.0% 132.0%
Asia
Agricultural Land (Ha million) Arable Land (Ha million)
Coarse grain production (Ton million) Oil seed production (Ton million)
Meat production (Ton million)
1,153 458 632 18 29
1,684 573
1,038 66
108
46.1% 25.1% 64.2%
261.0% 277.1%
1,852 642
1,525 149 239
10.0% 12.0% 47.0%
126.0% 121.0%
Australia and New-Zeeland
Agricultural Land (Ha million) Arable Land (Ha million)
Coarse grain production (Ton million) Oil seed production (Ton million)
Meat production (Ton million)
483 44 16
0 3
447 49 31 1 4
-7.4% 10.0% 91.1%
504.2% 41.0%
429 59 61 2 7
-4.0% 22.0% 94.0%
223.0% 80.0%
World
Agricultural Land (Ha million) Arable Land (Ha million)
Coarse grain production (Ton million) Oil seed production (Ton million)
Meat production (Ton million)
4,117 1,332 1,486
43 123
4,917 1,616 2,298
117 236
19.4% 21.3% 54.6%
170.7% 91.8%
5,978 2,057 3,584
295 552
4.9% 15.3% 45.9%
114.0% 101.5%

Absa AgriBusiness
Discussion agenda
1. Macro economic trends – World social spend supports agriculture
2. Agricultural insights - Golden days for agriculture is back
3. Africa the new frontier – Food security
4. Commodity outlook for Selected Agricultural commodities

Absa AgriBusiness
Summery – every thing is market driven

Absa AgriBusiness
World maize trends
World maize price and stock trends International maize price trends (US$/ton)
0
200000
400000
600000
800000
1000000
1988 1991 1994 1997 2000 2003 2006 2009 2012
0
50
100
150
200
250
Consumption Production
Stocks Price
(US $/t)('000 ton)
60
110
160
210
260
310
360
Jan-01
Jan-03
Jan-05
Jan-07
Jan-09
Jan-11
White Yellow
FAO, USDA - Economic Research Services, USDA - Agricultural Marketing Services

Absa AgriBusiness
South African maize trends
0
2,000
4,000
6,000
8,000
10,000
12,000
14,000
16,000
18,000
83/84 86/87 89/90 92/93 95/96 98/99 01/02 04/05 '07/08'10/11
0
200
400
600
800
1000
1200
1400
1600
1800
2000
Consumption Production Stocks
Price - white Price - yellow(R/ton)('000 ton)
0
500
1,000
1,500
2,000
2,500
3,000
3,500
82/83 86/87 90/91 94/95 98/99 02/03 06/07 '10/11
White maize Yellow maize
Source: FAO, USDA, SAGIS, SAFEX
Absa AgriBusiness
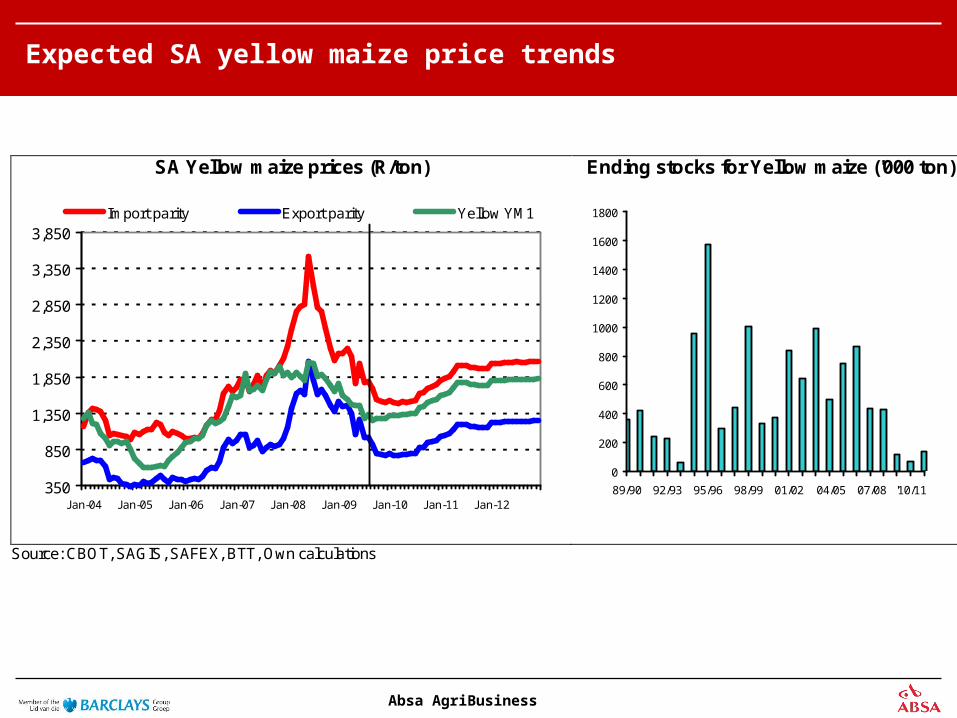
Expected SA yellow maize price trends
SA Yellow maize prices (R/ton) Ending stocks for Yellow maize ('000 ton)
350
850
1,350
1,850
2,350
2,850
3,350
3,850
Jan-04 Jan-05 Jan-06 Jan-07 Jan-08 Jan-09 Jan-10 Jan-11 Jan-12
Import parity Export parity Yellow YM1
0
200
400
600
800
1000
1200
1400
1600
1800
89/90 92/93 95/96 98/99 01/02 04/05 07/08 '10/11
Source: CBOT, SAGIS, SAFEX, BTT, Own calculations

Absa AgriBusiness
Expected SA white maize price trends
SA White maize prices (R/ton) Ending stocks for white maize ('000 ton)
200
700
1,200
1,700
2,200
2,700
3,200
3,700
4,200
Jan-04 Jan-05 Jan-06 Jan-07 Jan-08 Jan-09 Jan-10 Jan-11
Import Parity Export Parity Domestic
0
500
1000
1500
2000
2500
3000
90/91 93/94 96/97 99/00 02/03 05/06 08/09
Absa AgriBusiness
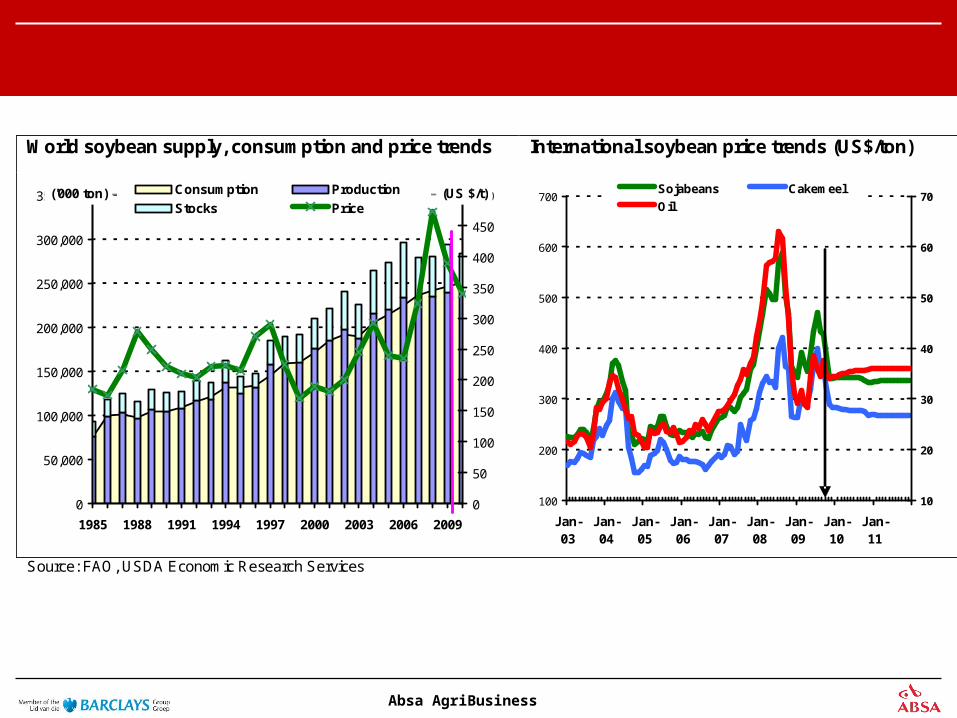
World soybean supply, consumption and price trends International soybean price trends (US$/ton)
0
50,000
100,000
150,000
200,000
250,000
300,000
350,000
1985 1988 1991 1994 1997 2000 2003 2006 2009
0
50
100
150
200
250
300
350
400
450
500Consumption Production
Stocks Price(US $/t)('000 ton)
100
200
300
400
500
600
700
Jan-03
Jan-04
Jan-05
Jan-06
Jan-07
Jan-08
Jan-09
Jan-10
Jan-11
10
20
30
40
50
60
70Sojabeans Cakemeel
Oil Oil US c/lb)US $/ton)
Source: FAO, USDA Economic Research Services

Absa AgriBusiness
Relationship between soybean supply, demand And price for South Africa
Soybean Future Prices (R/ton)
0
100
200
300
400
500
600
700
800
1985 1990 1995 2000 2005 2010
0
500
1000
1500
2000
2500
3000
3500
4000
4500Consumption ProductionImports StocksPrice
(R/ton)('000 ton)
1000
1500
2000
2500
3000
3500
4000
4500
5000
5500
6000
Jan-03 Jan-04 Jan-05 Jan-06 Jan-07 Jan-08 Jan-09
Derived Importparity SAFEX
Source: SAGIS, SA Weather Bureau, SAFEX, Own calculations

Absa AgriBusiness
SA sunflower prices (R/ton) SA sunflower ending stocks ('000 ton)
900
1900
2900
3900
4900
5900
6900
Jan-03 Jan-04 Jan-05 Jan-06 Jan-07 Jan-08 Jan-09 Jan-10 Jan-11
Sunflower Import parity Sunflower domestic
0
50
100
150
200
250
300
350
400
450
500
1996 1997 1998 1999 2000 2001 2002 2003 2004 2005 2006 2007 2008 2009
Source: USDA Agricultural Market Services, SAGIS, Own calculations
Absa AgriBusiness
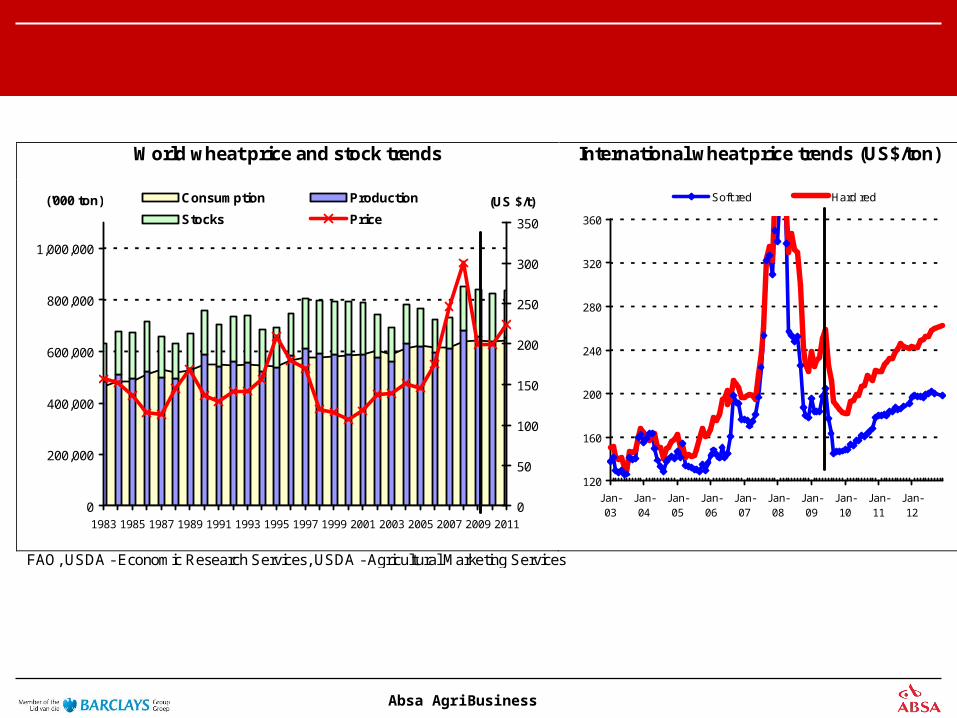
World wheat price and stock trends International wheat price trends (US$/ton)
0
200,000
400,000
600,000
800,000
1,000,000
1983 1985 1987 1989 1991 1993 1995 1997 1999 2001 2003 2005 2007 2009 2011
0
50
100
150
200
250
300
350
Consumption Production
Stocks Price
(US $/t)('000 ton)
120
160
200
240
280
320
360
Jan-03
Jan-04
Jan-05
Jan-06
Jan-07
Jan-08
Jan-09
Jan-10
Jan-11
Jan-12
Soft red Hard red
FAO, USDA - Economic Research Services, USDA - Agricultural Marketing Services

Absa AgriBusiness
Relationship between supply, demand and price for South Africa
SAFEX Futures Price Trends
0
500
1000
1500
2000
2500
3000
3500
4000
4500
1980 1983 1986 1989 1992 1995 1998 2001 2004 2007 2010
200
700
1200
1700
2200
2700
3200
Consumption Production ImportsStocks Price
(R/ton)('000 ton)
1,200
1,700
2,200
2,700
3,200
3,700
4,200
4,700
Jan-06 Jan-07 Jan-08 Jan-09 Jan-10
SAFEX
Source: SAGIS, SA Weather Bureau

Absa AgriBusiness
SA Wheat prices (R/ton) Ending stocks for wheat ('000 ton)
0
500
1,000
1,500
2,000
2,500
3,000
3,500
4,000
4,500
5,000
Jan-03 Jan-04 Jan-05 Jan-06 Jan-07 Jan-08 Jan-09 Jan-10
Import parity Export parity Domestic
0
200
400
600
800
1000
1200
1990 1994 1998 2002 2006 2010
Source: CBOT, SAGIS, SAFX, BTT, Own calculations
Absa AgriBusiness
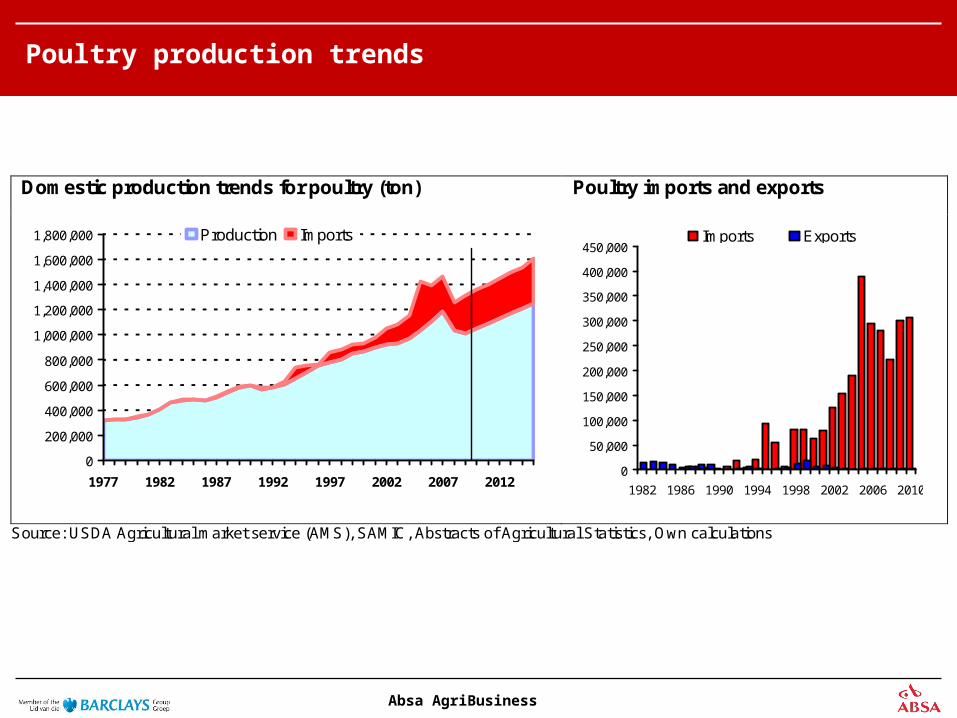
Poultry production trends
Domestic production trends for poultry (ton) Poultry imports and exports
0
200,000
400,000
600,000
800,000
1,000,000
1,200,000
1,400,000
1,600,000
1,800,000
1977 1982 1987 1992 1997 2002 2007 2012
Production Imports
0
50,000
100,000
150,000
200,000
250,000
300,000
350,000
400,000
450,000
1982 1986 1990 1994 1998 2002 2006 2010
Imports Exports
Source: USDA Agricultural market service (AMS), SAMIC, Abstracts of Agricultural Statistics, Own calculations

Absa AgriBusiness
Poultry Price trends
300
500
700
900
1100
1300
1500
1700
1900
2100
2300
Jan-04 Jan-05 Jan-06 Jan-07 Jan-08 Jan-09 Jan-10 Jan-11 Jan-12
Frozen Fresh IQF Import
4
6
8
10
12
14
16
18
20
22
Jan-04 Jan-06 Jan-08 Jan-10
200
400
600
800
1000
1200
1400
1600
1800
Poulrty / maize ratioFrozen whole birdBreakeven Ratio
(c/kg)
Source: USDA Agricultural market service (AMS), SAMIC, Abstracts of Agricultural Statistics, SAFEX, Own calculations

Absa AgriBusiness
SA Beef prices
South African Beef Price trends and the relation between Maize and Weaner Calf Prices
500.00
1,000.00
1,500.00
2,000.00
2,500.00
3,000.00
Jan-04 Jan-05 Jan-06 Jan-07 Jan-08 Jan-09 Jan-10
Class A Class C Contract A2/A3 NZ Cow
0.00
250.00
500.00
750.00
1,000.00
1,250.00
1,500.00
1,750.00
2,000.00
2,250.00
2,500.00
2,750.00
3,000.00
Jan-04
Jan-05
Jan-06
Jan-07
Jan-08
Jan-09
Jan-10
8
10
12
14
16
18
20
22
24
26
28
Beef / Maize Contract A2Weaner calf B/E Contract
(c/kg) (Ratio)
Source: SAMIC, Stock Owners, Noord Kaap Lewendehawe, selected feedlots, Own calculations

Absa AgriBusiness
Mutton Price trends
Domestic mutton prices (c/kg) Relation between mutton and maize prices
1000
1500
2000
2500
3000
3500
4000
Jan-04 Jan-05 Jan-06 Jan-07 Jan-08 Jan-09 Jan-10 Jan-11 Jan-12
SA Class A SA Class C Contract Class ANZ Lamb NZ Ewe
200
700
1,200
1,700
2,200
2,700
3,200
3,700
4,200
Jan-04
Jan-05
Jan-06
Jan-07
Jan-08
Jan-09
Jan-10
Jan-11
Jan-12
0
10
20
30
40
50
60
Meat / maize ratio Contract LambFeeder lamb Class A * 0.5Breakeven ratio
Price (c/kg) Price ratio
Source: SAMIC, SAFEX, and own calculations.

Absa AgriBusiness
Expected clean wool equivalent production and price trends for South African (SA c/kg)
0
20,000
40,000
60,000
80,000
100,000
120,000
1980 1982 1984 1986 1988 1990 1992 1994 1996 1998 2000 2002 2004 2006 2008 2010 20120
10
20
30
40
50
60
70Production (ton) Price (R/kg)
1,500.00
2,500.00
3,500.00
4,500.00
5,500.00
6,500.00
7,500.00
Jan-04 Jan-05 Jan-06 Jan-07 Jan-08 Jan-09 Jan-10 Jan-11
Australian South Africa
Source: National department of Agriculture, Cape wools, Wesfarmers Landmark, AWEX, Own calculations

Absa AgriBusiness
Producer milk price trends (c/l) Milk to maize price ratio
60
110
160
210
260
310
360
410
Jan-95 Jan-97 Jan-99 Jan-01 Jan-03 Jan-05 Jan-07 Jan-09
Brake even Producer price
0
0.5
1
1.5
2
2.5
3
3.5
Jan-00 Jan-03 Jan-06 Jan-09
0
50
100
150
200
250
300
350
400
RatioBreakeven
Producer milk price
Ratio c/l
Sources: Milk producers Association (MPO), SAFEX and Own calculations

Absa AgriBusiness
Thank you for the opportunity to share some ideas
Contact details
E JanovskyTel (011) 350 6102
Email [email protected]
Disclaimer: Although everything has been done to ensure the accuracy of the information, the Bank takes no responsibility for actions or losses that might occur due to the usage of this information.