Embed Size (px)
Citation preview
ANALYTICAL BIOCHEMISTRY 1, 402416 (1960)
Absorption Spectra of ~I”-30 -Hydroxy Steroids in
Several Sulfuric Acid Reagents
HILDEGARD WILSON
From the National Institute of Arthritis and Metabolic Diseases, National Institutes of Health, Public Health Service, United States Department of
Health, Education, and Welfare, Bethesda, Maryland
Received October 3, 1960
Sulfuric acid, both concentrated and variously diluted with ethanol and water, has been widely employed in steroid analysis. Three types of reactions with neutral steroids are: (a) development of characteristic absorption spectra at room temperature after addition to a dried sample of steroid (l-3), (5) development of a characteristic major absorption peak in the visible range after heating with the reagent and diluting (4), and (c) development of fluorescence (5-8).
The blue color given by dehydroepiandrosterone (DHA) after heating with the Allen reagent and diluting with ethanol is well known (4). Little attention has, however, been paid to the absorption spectrum developed by this and other steroids in the reagent itself, without heating or diluting. Our attention was directed to this phenomenon by the observation of a deep blue color from A5-pregnene-3P,17cY,20a-triol (5-PT) at room temperature. Other A5-3P-OH steroids were then found to give distinctive spectra with this “cold” Allen reagent. Meanwhile Oertel and Eik-Nes (3) showed that several A5-3/?-OH steroids gave an intense yellow color in a more dilute ethanolic sulfuric acid reagent.
The present communication compares absorption spectra of a number of A5-3,&OH steroids in the Allen and Oertel reagents and in concen- trated sulfuric acid. A group of other steroids has been studied with the Allen reagent alone. It is shown that spectra in the diluted reagents are useful (a) for identification purposes, (5) for quantitative determination of several steroids for which no simple method existed, and (c) as spot tests on paper chromatograms, or for testing column eluates.
MATERIALS AND METHODS
Reagents and Equipment
Concentrated Sulfuric Acid. Baker and Adamson Co., reagent grade. 402
8PECTRA OF SOME HTDROXY STEROIDS 403
Ethanol. U. S. Industrial Chemical Co. “U.&I. Absolute pure ethyl alcohol” U.S.P.-N.F. reagent quality. Negligible absorption in the visible and ultraviolet wavelengths was found when 5 ml of this ethanol was evaporated to dryness and the residue treated with sulfuric acid.
EthanoE, 90% and 95%. Prepared from absolute ethanol by adding dis- tilled water.
Allen Reagent (4). Eighty milliliters of cont. sulfuric acid was added to 20 ml of 90% ethanol, with cooling.
Oertel Reagent (3). Sixty-seven milliliters of cont. sulfuric acid was added to 33 ml of 95% ethanol, with cooling.
Spectrophotometer. Cary model 14 recording speetrophotometer. Ap- plied Physics Corp., Pasadena, Cal.
Spectrophotometer Cuvettes. One milliliter capacity, 10 mm light path. Pyrocell Mfg. Co., 207 East 84th St., New York 28, N. Y. Other brands tried have been unsuitable for use with sulfuric acid.
Steroids. The pure steroid compounds used in this study were purchased from (a) Mann Research Laboratories, 136 Liberty St., New York 6, N. Y.; (b) Nutritional Biochemicals Corp., Cleveland 26, Ohio; (c) California Foundation for Biochemical Research, 3408 Fowler St., Los Angeles 63, Calif.
Generous gifts of steroids not available commercially were received from Merck, Sharp & Dohme Co., the Upjohn Co., Ciba Pharmaceutical Products, Inc., Dr. Max N. Huffman, Dr. C. D. Kochakian, and Dr. J. J. Schneider.
Procedures
Absorption Spectra. AIiquots of ethanolic solutions of pure steroids, containing between 5 and 40 pg, were measured into 12 X 75 mm test tubes and dried in a vacuum oven. Precautions necessary for the deter- mination of sulfuric acid chromogen curves were observed (9). One milliliter of sulfuric acid or diluted reagent was added to each tube and the time noted. After thorough agitation to dissolve the dried steroid, the solution was transferred to the spectrophotometer cuvette, and the spec- trum was immediately determined. A scanning speed of 300 mp/min was usually employed, covering the region from 200 to 700 rnp. Spectra were again determined at longer intervals.
‘rHot” Allen Reaction. The original procedure of Allen et al. (4) was modified only by reducing the volume of reagents. Each steroid was dis- solved in 0.5 ml reagent in a 10 X 75 mm tube, then heated to 56O in a water bath for 12 min. After cooling, 0.75 ml of 95% ethanol was added, and the contents were mixed with a footed glass rod.
404 WILSON
Preparation of n5-Pregnene-S/3,1 7a,20/3- trio1 (2OP-5PT)
Twenty milligrams of AS-17-OH-pregnenolone (5-17PG) was dissolved in 10 ml of absolute ethanol with warming. To this solution was added 50 mg potassium borohydride in 10 ml of 60% ethanol. After standing 18 hr, the mixture was neutralized with glacial acetic acid and extracted with ethyl acetate, and the ethyl acetate was washed with water and evaporated barely to dryness. The product dissolved with difficulty in 25 ml of absolute ethanol. When chromatographed on paper it appeared to contain about 10% of the 20o1-OH isomer. Completeness of reduction was shown by the absence of any test for 5-17PG either in fractions from partition columns or on paper chromatograms. [On paper chromatograms employing Bush (10) systems, 5-17PG did not move from the origin and it streaked badly in the toluene-propylene glycol system of Burton et al. (11) .] A lo-mg portion of the reduction product was chromatographed on a partition column, and eluates containing white crystalline material of the appropriate mobility were combined. The melting point was 214-218O (Kofler micro hot stage) as compared to 226228O quoted in the literature (13). On oxidation with periodic acid, the product was exclusively de- hydroepiandrosterone, as proved by mobility on paper chromatograms and color reactions.
Preparation of As-Pregnene-S/3-17a-boa-trio1 (5-PT) from Urine Extracts
Total neutral fractions of urine extracts from three patients with adrenal carcinoma were chromatographed on a modified partition column (12). The eluate containing 5-PT was treated with digitonin, and the recovered 3p-OH fraction was chromatographed on paper in the Bush Bl system (10). The 5-PT band was located by the yellow-green color give!: when a test strip was overrun with the Allen reagent. This band was more polar than the 20,&OH isomer run on a parallel strip, and well separated from it, indicating the urinary component to be the 2Oar-OH isomer. After elution with ethanol, the material in this band was reapplied to another partition column. Fractions in the appropriate region were white and semi- crystalline. These were combined, and the compound was crystallized from absolute methanol in the cold. The melting point was 213.5-218O com- pared to 221-224O as quoted in the literature (13). The absorption spect,ra of the crystalline product in concentrated sulfuric acid and in the Allen reagent were identical with that of the 20P-OH isomer after similar puri- fication on a partition column (Fig. 1). On oxidation with periodic acid, dehydroepiandrosterone was the only product, as indicated by paper chromatography and color tests.
SPECTRA OF SOME HYDROXY STEROIDS 405
:, il I 500 4
0.11 ’ ’ ’ ’ ’ ’ ’ ’ ’ i+-. , 200 280 360 440 520 600 680
WVELENGTH , mp
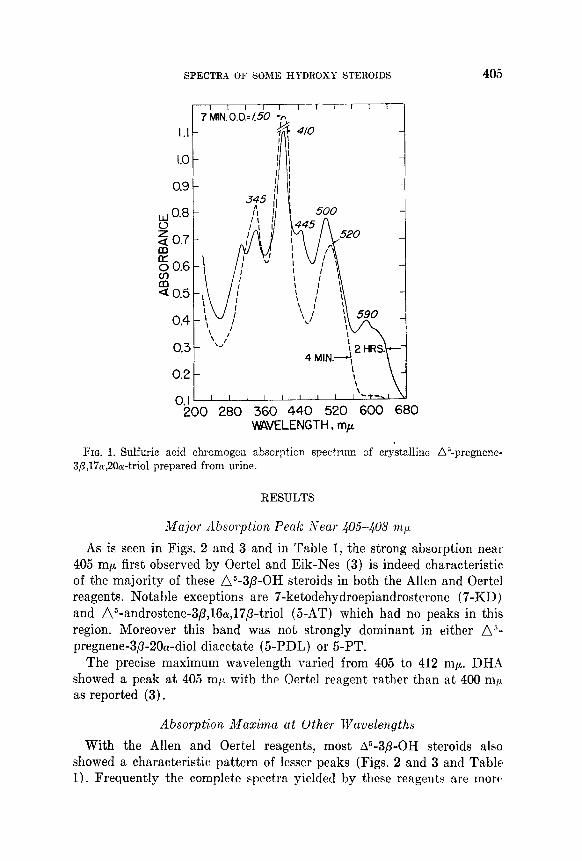
FIG. 1. Sulfuric acid chromogen absorption spectrum of crystalline A’qregnene- 3P,17a,20&riol prepared from urine.
RESULTS
Major Absorption Penk Xear 405~408 mp
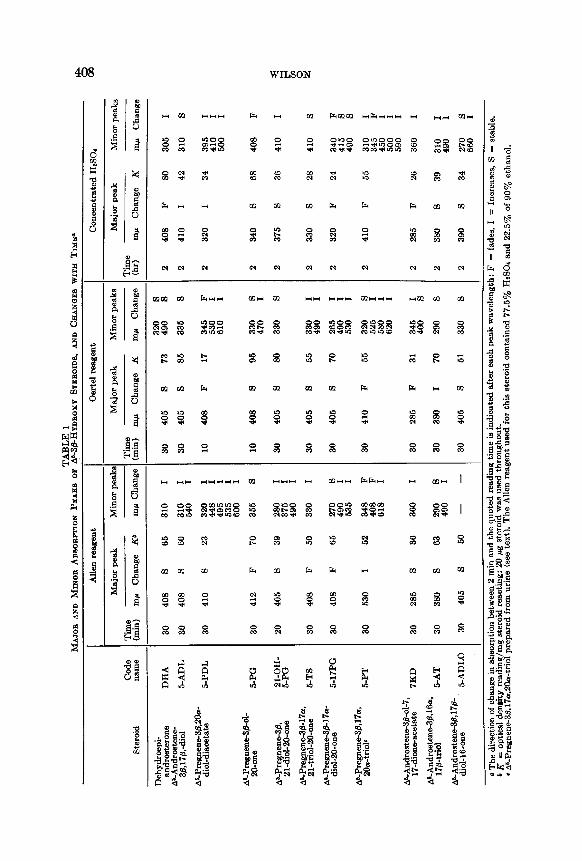
As is seen in Figs. 2 and 3 and in Table 1, the strong absorption neal 405 mp first observed by Oertel and Eik-Nes (3) is indeed characteristic of the majority of these n5-3p-OH steroids in both the Allen and Oertel reagents. Notable exceptions are 7-ketodehydroepiandrosterone (7-KD) and ~5-androstene-3P,16c,17,&triol (5-AT) which had no peaks in this region. Moreover this band was not strongly dominant in either AS- pregnene-3/3-20a-diol diacetate (5-PDL) or 5-PT.
The precise maximum wavelength varied from 405 to 412 mp. DHA showed a peak at 405 m/t with the Oertel reagent rather than at 400 m/c as reported (3).
Absorption Markmu ut Other Wavele~~gths
With the Allen and Oertel reagents, most A”-3/S-OH steroids also showed a characteristic pattern of lesser peaks (Figs. 2 and 3 and Table 1). Frequent.ly the complete spectra yielded by these reagents are mortl
406 WILSON
Dehydroepi. ondrosteronc
diol
P- Pregnene
3&2Oa;dia
-diacetate
A?- Pregnenolon
P- 21-OH-
Pregnenolone
I??- Pregnene- 3&17.,21-
trio1 -2O-one
ALLEN
I I I I xx) 400 500 600
OERTEL
300 400 500 600
CONC. H2S04
300 400 500 WAVELENGTH
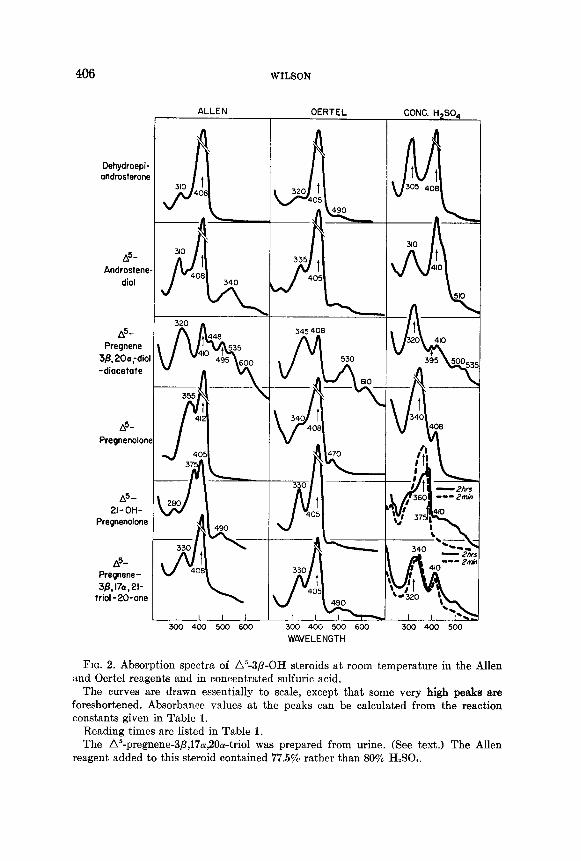
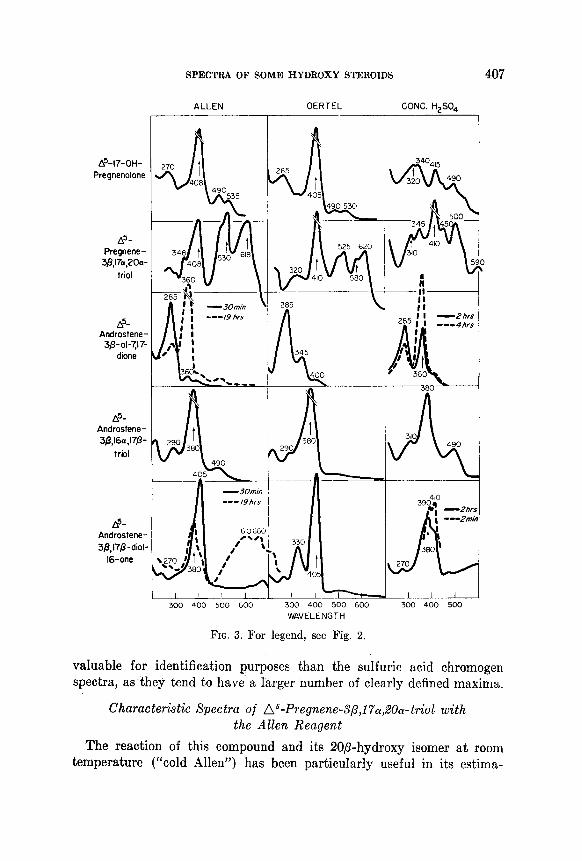
FIG. 2. Absorption spectra of A”-3,&OH steroids at room temperature in the Allen and Oertel reagents and in concentrated sulfuric acid.
The curves are drawn essentially to scale, except that some very high peaks are foreshortened. Absorbance values at the peaks can be calculated from the reaction constants given in Table 1.
Reading times are listed in Table 1. The A’-pregnene-3P,1701,2Oa-triol was prepared from urine. (See text.) The Allen
reagent added to this steroid contained 77.5% rather than 80% H&O,.
A5-l7-OH- Pregnenolone
d- Pregnene-
3&7.,20a- trio1
A5- Androstene-
3&01%;17- dione
A5- Androstene- 3/3,16a,17j3-
trio1
d- Androstene- 3&17P-diol-
16-one
SPECTRA OF SOME HYDROXY STEROIDS
ALLEN OERTEL CONC. H$O,
I I
I 310
2 490
s--- 300 400 5ccl
s k
407
WAVELENGTH
FIG. 3. For legend, see Fig. 2.
vahxable for identification purposes than the sulfuric acid chromogen spectra, as they tend to have a larger number of clearly defined maxima.
Characteristic Spectra of ~5-Pregnene-S~,170c,20driol with the Allen Reagent
The reaction of this compound and its 20,%hydroxy isomer at room ternperature (“cold Allen”) has been particularly useful in its estima-
hfnn
x AN
D M
INO
R AB
SORP
TIO
N PE
AEU
OF
Ster
oid
Code
rim
e na
me
min
) m
r Ch
ange
Kb
m
p Ch
ange
Dehy
droe
pi-
andro
steron
e AL
Andr
oste
ne-
3&17
&diol
A~Pr
egne
ne-3
&20a
- dio
l-diic
etat
e
A~Pr
egne
ne3,
8-01
- 20
-one
A~-P
re~n
en~/
3,
21-O
H-
21-d
ial-2
0-on
e 5-
PG
A~Pr
egne
ne+%
l7a,
21
-trial
-20-
one
A~Pr
e@en
43,%
17a-
dia
l-20-
one
DHA
5-AD
L
5-PD
L
5-PG
5-TS
5-17
PG
5-PT
A~An
dros
tene
-3,3
-ol-7
, 17
-dion
saoe
tate
7K
D
As-A
ndr&
ene3
,9,1
6a,
17&u
iOl
5-AT
AL-A
ndro
stene
-38,
178-
dio
l-l&on
e 5-
ADLO
Allen
re
agen
t
Maj
or
peak
M
inor
peak
a
30
30
30
30
20
30
30
30
30
30 30
408
408
410
412
405
408
408
530
285
380 405
S 8 S F S F F I 8 S S
65
GO
23
70
39
50
65
52
36
63 50
310
320
448
495
l%
355
if!
490
330
270
490
535
348
408
618
360
290
490 -
I : : I S 1 : I I ; I I ‘: -
TABL
E 1
A~~,
¶-HY
DEox
Y ST
ERO
IDS.
*N
D CH
ANG
ES
WIT
H TI
ME’
4
I , (
.- -
Oer
tel
reag
ent
Maj
or
peak
M
inor
peak
s
rime
IlliIl)
m
p Ch
ange
K
mp
Chan
ge
30
30
10
10
30
30
30
30
30
30
30
405
405
408
408
405
405
405
410
285
380
405
S S F S S S S F F I S
73
85
17
95
80
55
70
55
31
70
51
iii
335
“5::
610
330
470
330
345
400
290
330
55
Conc
entra
ted
H,SO
, M
Maj
or
peak
M
inor
peak
s
rime
hr)
mfi
Chan
ge
K m
p Ch
ange
2 2 2 2 2 2 2 2 2 2 2
410
320
340
375
330
320
410
285
390
F I I S S S F F F S S
80
305
42
310
34
395
410
500
68
408
36
410
28
410
24
55
26
360
39
34
270
660
o Th
e dir
ectio
n of
ch
ange
in
abso
rptio
n be
twee
n 2
min
an
d th
e qu
oted
re
ading
tim
e IS
mdi
cate
d af
ter
each
pe
ak
wave
leng
th:
F =
fade
s,
I =
Incr
ease
s,
S =
stable
. (I
K =
optic
al de
ndty
read
ing/
mg
stero
id re
actin
g;
20
H ste
roid
~~88
uSe
d th
roug
hout
. e
As.p
regn
ene3
B,17
P,20
-triol
pr
epar
ed
from
ur
ine
(see
te
xt).
The
Allen
re
agen
t ua
sd
for
this
stero
id co
ntain
ed
77.5
%
HBO
I an
d 22
.5%
of
90
%
etha
nol.
SPECTRA OF SOME HYDROXY STEROIDS 409
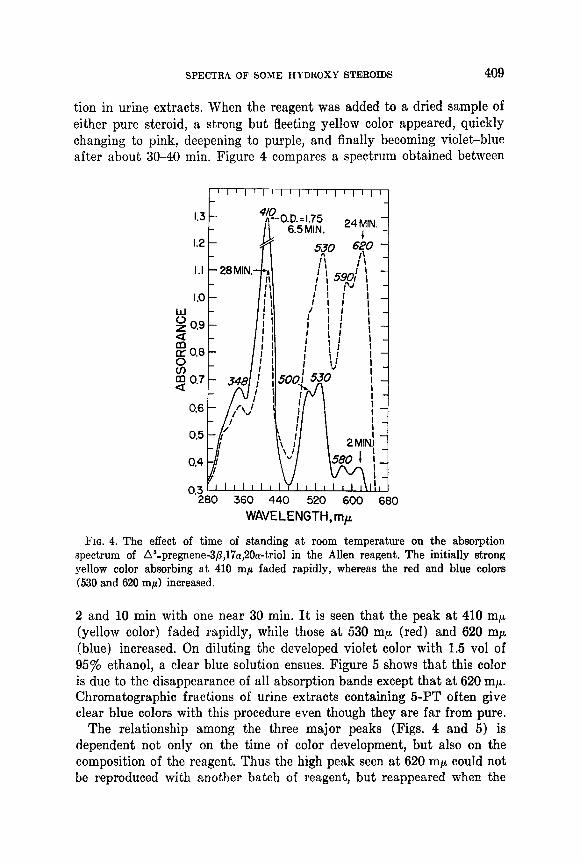
tion in urine extracts. When the reagent was added to a dried sample of either pure steroid, a strong but fleeting yellow color appeared, quickly changing to pink, deepening to purple, and finally becoming violetrblue after about 3040 min. Figure 4 compares a spectrum obtained between
1.2 - p
I. I - 28 MIN.--, ,:
360 440 520 600 680
WAVELENGTH, mp
FIG. 4. The effect of time of standing at room temperature on the absorption spectrum of A’-pregnene-3/3,17n,2Oa-trio1 in the Allen reagent. The initially strong yellow color absorbing at 410 mp faded rapidly, whereas the red and blue colors (530 and 620 rnp) increased.
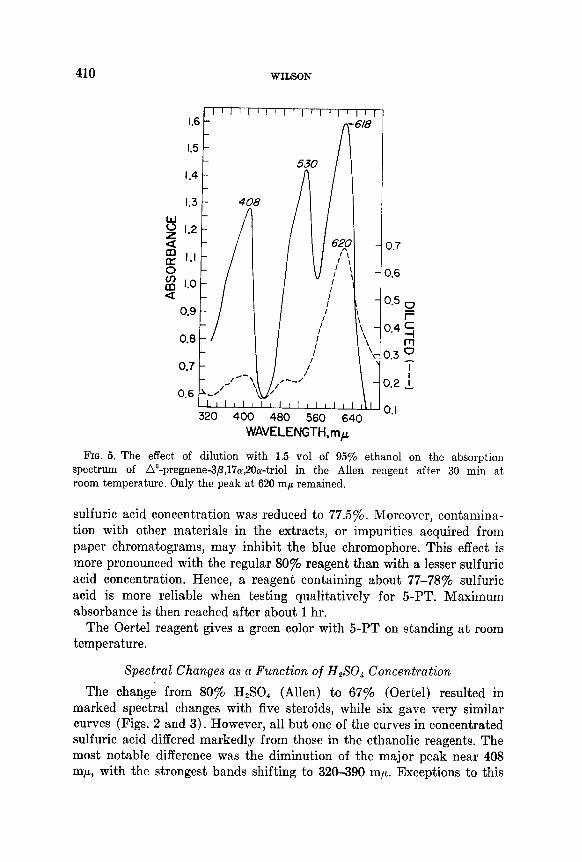
2 and 10 min with one near 30 min. It is seen that the peak at 410 mp (yellow color) faded rapidly, while those at 530 rnp (red) and 620 rnp (blue) increased. On diluting the developed violet color with 1.5 vol of 95% ethanol, a clear blue solution ensues. Figure 5 shows that this color is due to the disappearance of all absorption bands except that at 620 m,u. Chromatographic fractions of urine extracts containing 5-PT often give clear blue colors with this procedure even though they are far from pure.
The relationship among the three major peaks (Figs. 4 and 5) is dependent not only on the time of color development, but also on the composition of the reagent. Thus the high peak seen at 620 rnp could not be reproduced with another batch of reagent, but reappeared when the
410 WILSON
I.6 1’
1.4 /-
0.8
320 400 480 560 640
WAVELENGTH, mp
-C
-0
-0
-0
-0 ,
-0
,O
j.7
1.6
Fm. 5. The effect of dilution with 1.5 vol of 95% ethanol on the absorption spectrum of A6-pregnene-3P,17cu,%Ocu-triol in the Allen reagent after 30 min at, room temperature. Only the peak at 620 ma remained.
sulfuric acid concentration was reduced to 77.5%. Moreover, contamina- tion with other materials in the extracts, or impurities acquired from paper chromatograms, may inhibit the blue chromophore. This effect is more pronounced with the regular 80% reagent than with a lesser sulfuric acid concentration. Hence, a reagent containing about 77-78s sulfuric acid is more reliable when testing qualitatively for 5-PT. Maximum absorbance is then reached after about 1 hr.
The Oertel reagent gives a green color with 5-PT on standing at room temperature.
Spectral Changes as a Function of H,SO, Concentration
The change from 80% H,SO, (Allen) to 67% (Oertel) resulted in marked spectral changes with five steroids, while six gave very similar curves (Figs. 2 and 3). However, all but one of the curves in concentrated sulfuric acid differed markedly from those in the ethanolic reagents. The most notable difference was the diminution of the major peak near 408 rnp, with the strongest bands shifting to 320-390 rnp. Exceptions to this
S;PECTR:i OF SOWE HYDROXY STEItOIDS 411
rule were DHA, n”-androstene-3p,l7p-diol (SADL), 5-17PG, and SPT, which retained strong bands at 408 and 410 m/r,.
CovLparisolr of Extinction Coefficients
Table 1 lists the K values (K = optical density/mg steroid) obtained with 20 pg steroid in the several reagents. The great sensitivity of the Allen and Oertel reagents in measuring n5-3,&OH steroids absorbing strongly near 408 rnp is indicated by K values from 50 to 90. Thus 10 pg DHA had an optical density of about 0.700 in I ml of either reagent. In concentrated sulfuric acid (except for DHA), the extinction coefficients were lower or the strongest bands had shifted to another wavelength.
Changes in Spectra with Time
The heights of the absorption maxima usually varied greatly with time of standing in the reagent, though some compounds were fairly stable up to about 2 hr. Table 1 shows the direction of the changes observed between the initial scanning after 2 min and that at the quoted reading time. In general, the absorption near 408 rnp was either stable or diminishing during 30 min with either ethanolic reagent, while the lesser peaks tended to increase in height. Thus in many instances the visual color changed from yellow to reddish orange or purple. These changes are characteristic in themselves and can be used as an aid in identification. Frequently the curves at later times were less dominated by a single peak and showed additional lesser bands, making the entire spectrum more specific for a given steroid.
Proportionality of Absorbance to the Amount of Steroid; Cold Allen Reagent, Undiluted
Table 2 shows that five a5-3P-OH steroids give reasonably propor- tional corrected readings, as shown by constant K values. Absorption was measured at reaction times when the peak value was maximum and fairly stable, and when characteristic lesser bands had also appeared.
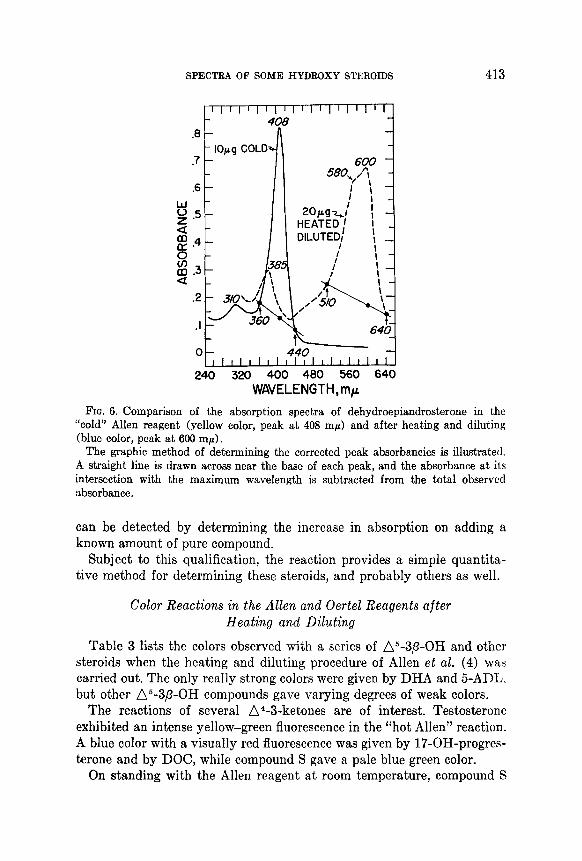
Figure 6 illustrates how the corrected maximum absorbancies were determined from the spectrophotometer recordings. A straight line was drawn across near the base of the peak; in the case of DHA, between 360 and 440 mp. The absorption where this line crosses 408 rnp was sub- tracted from the total 40%rnp reading. A similar procedure can be fol- lowed if the “hot Allen” procedure is used (Fig. 6). If point readings must be relied upon, the correction can readily be calculated or obtained graphically from readings at three appropriate wavelengths. This correc- tion, proposed by illlen (15), makes allowance for the asymmetry of many peaks.
412 WILSON
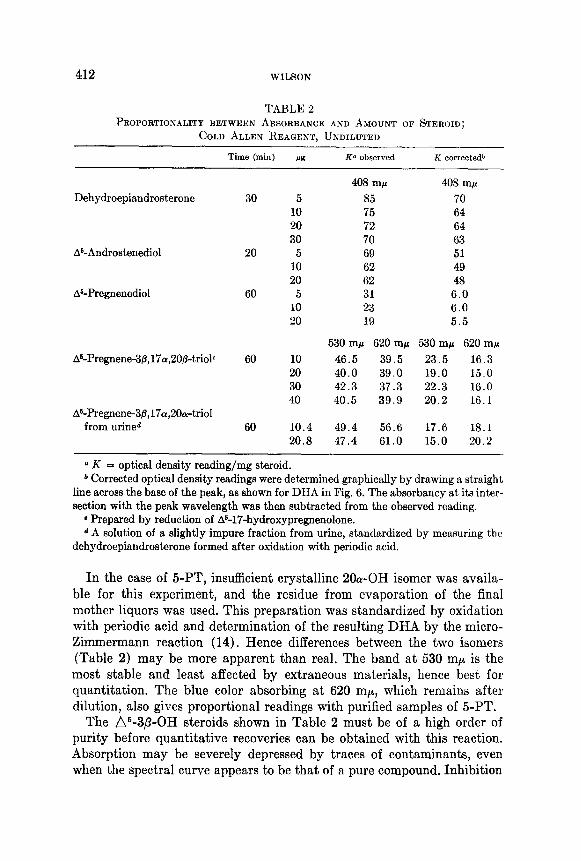
TABLE 2 PROPORTIONALITY BETWEEN ABSORBANCE AND AMOUNT OF STEROID;
COLD ALLEN REAGENT. UKDILIJTED
Time (min) pg Ka observed K correctedb
408 rnp 408 mp
Dehydroepiandrosterone 30 5 85 70 10 75 64 20 72 64 30 70 63
As-Androstenediol 20 5 69 51 10 62 49 20 62 48
A6-Pregnenediol 60 5 31 6.0 10 23 6.0 20 19 5.5
530 mp 620 mp 530 mp 620 mp
As-Pregnene&9,17cu,2O@trio~ 60 10 46.5 39.5 23.5 16.3 20 40.0 39.0 19.0 15.0 30 42.3 37.3 22.3 16.0 40 40.5 39.9 20.2 16.1
As-Pregnene-3&17a,2O&riol from urined 60 10.4 49.4 56.6 17.6 18.1
20.8 47.4 61.0 15.0 20.2
a K = optical density reading/mg steroid. b Corrected optical density readings were determined graphically by drawing a straight
line across the base of the peak, as shown for DHA in Fig. 6. The absorbancy at its int,er- section with the peak wavelength was then subtracted from the observed reading.
c Prepared by reduction of AS-17-hydroxypregnenolone. d A solution of a slightly impure fraction from urine, standardized by measuring the
dehydroepiandrosterone formed after oxidation with periodic acid.
In the case of 5-PT, insufficient crystalline 20~OH isomer was availa- ble for this experiment, and the residue from evaporation of the final mother liquors was used. This preparation was standardized by oxidation with periodic acid and determination of the resulting DHA by the micro- Zimmermann reaction (14). Hence differences between the two isomers (Table 2) may be more apparent than real. The band at 530 rnp is the most stable and least affected by extraneous materials, hence best for quantitation. The blue color absorbing at 620 rnp., which remains after dilution, also gives proportional readings with purified samples of 5-PT.
The A5-3/3-OH steroids shown in Table 2 must be of a high order of purity before quantitative recoveries can be obtained with this reaction. Absorption may be severely depressed by traces of contaminants, even when the spectral curve appears to be that of a pure compound. Inhibition
SPECTRA OF SOME HYDROXY STEROIDS 413
24C ) 320 400 480 560 640 WAVELENGTH, mp
FIQ. 6. Comparison of the absorption spectra of dehydroepiandrosterone in the “cold” Allen reagent (yellow color, peak at 408 mp) and after heating and diluting (blue color, peak at 600 mp).
The graphic method of determining the corrected peak absorbancies is illustrated. .4 straight line is drawn acrow near the base of each peak, and the absorbance at its intersection with the maximum wavelength is subtracted from the total observed absorbance.
can be detected by determining the increase in absorption on adding a known amount of pure compound.
Subject to this qualification, the reaction provides a simple quantita- tive method for determining these steroids, and probably others as well.
Color Reactions in the Allen and Oertel Reagents after Heating and Diluting
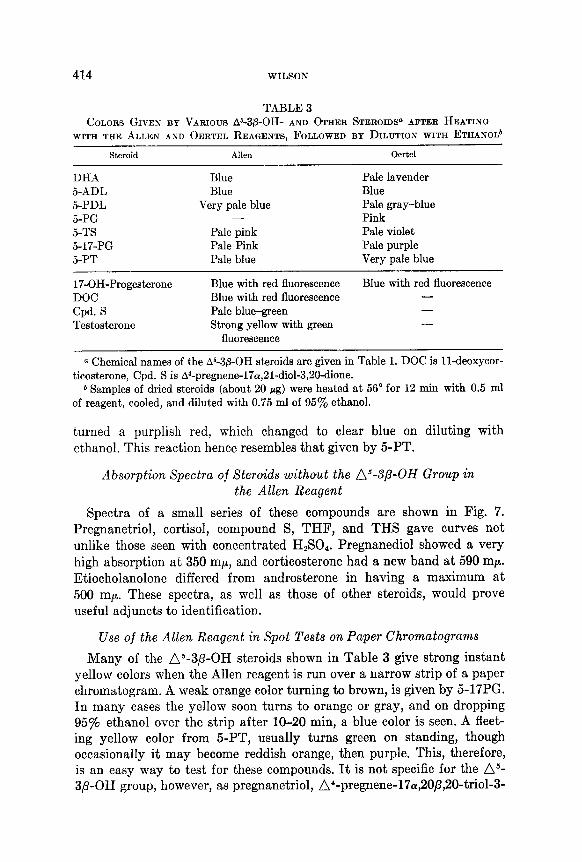
Table 3 lists the colors observed with a series of A5-3p-OH and other steroids when the heating and diluting procedure of Allen et al. (4) was carried out. The only really strong colors were given by DHA and 5-ADL. but other AS-3/?-OH compounds gave varying degrees of weak colors.
The reactions of several A*-3-ketones are of interest. Testosterone exhibited an intense yellow-green fluorescence in the “hot Allen” reaction. A blue color with a visually red fluorescence was given by 17-OH-progres- terone and by DOC, while compound S gave a pale blue green color.
On standing with the Allen reagent at room temperature, compound S
414 WILSON
TABLE 3 COLORS GIVEN BY VARIOUS Ab-a&OH- AND OTHER STEROIDS” AFTER HEATING
WITH THE ALLEN ANII OERTEL REAGENTS. FOLLOWED BY DILUTION WITH ETHANOL*
Steroid
DHA 5-ADL 5-PDL 5-PG 5-TS 5-17-PG 5-PT
Alh Oertel
Blue Pale lavender Blue Blue
Very pale blue Pale gray-blue - Pink
Pale pink Pale violet Pale Pink Pale purple Pale blue Very pale blue
17-OH-Progesterone DOC Cpd. S Testosterone
Blue with red fluorescence Blue with red fluorescence Blue with red fluorescence -
Pale blue-green - Strong yellow with green -
fluorescence
a Chemical names of the As-3p-OH steroids are given in Table 1. DOC is lldeoxycor- ticosterone, Cpd. S is A4-pregnene-17ol,21-diol3,2Odione.
* Samples of dried steroids (about 20 pg) were heated at 56” for 12 min with 0.5 ml of reagent, cooled, and diluted with 0.75 ml of 95’% ethanol.
turned a purplish red, which changed to clear blue on diluting with ethanol. This reaction hence resembles that given by 5-PT.
Absorption Spectra of Steroids without the LZ5-Sfl-OH Group in the Allen Reagent
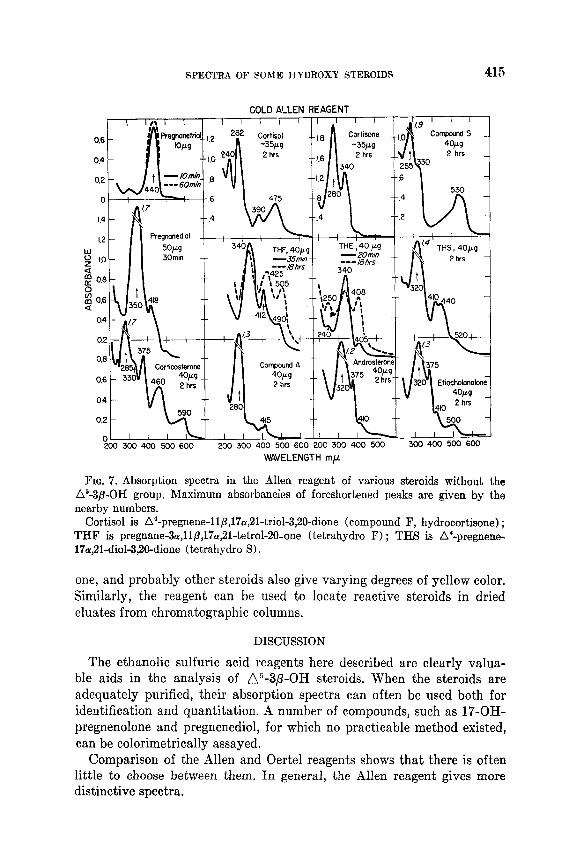
Spectra of a small series of these compounds are shown in Fig. 7. Pregnanetriol, cortisol, compound S, THF, and THS gave curves not unlike those seen with concentrated H,SO,. Pregnanediol showed a very high absorption at 350 rnp., and corticosterone had a new band at 590 mp. Etiocholanolone differed from androsterone in having a maximum at 500 rnp. These spectra, as well as those of other steroids, would prove useful adjuncts to identification.
Use of the Allen Reagent in Spot Tests on Paper Chromatograms
Many of the n5-3/3-OH steroids shown in Table 3 give strong instant yellow colors when the Allen reagent is run over a narrow strip of a paper chromatogram. A weak orange color turning to brown, is given by 5-17PG. In many cases the yellow soon turns to orange or gray, and on dropping 95% ethanol over the strip after 10-20 min, a blue color is seen. A fleet- ing yellow color from 5-PT, usually turns green on standing, though occasionally it may become reddish orange, then purple. This, therefore, is an easy way to test for these compounds. It is not specific for the AS- 3/3-OH group, however, as pregnanetriol, n4-pregnene-17a,20/3,20-triol-3-
SPECTRA OF SOME HYDROXY STEROIDS 415
COLO ALLEN REAGENT
200 300 400 500 600 200 300 400 500 600 200 300 400 500 300 400 500 600
WAVELENGTH mp
Fro. 7. Absorption spectra in the Allen reagent of various steroids without the A5-3p-OH group. Maximum absorbancies of foreshortened peaks are given by the nearby numbers.
Cortisol is A4-pregnene-ll~,17n,21-triol-3,2O-dione (compound F, hydrocortisone) ; THF is pregnane-3cy,ll,8,17a,2l-tetroI-20-one Ctetrahydro F) ; THS is A’-pregnene- 17a,21-diol-3,20-dione (tetrahydro S) .
one, and probably other steroids also give varying degrees of yellow color. Similarly, the reagent can be used to locate reactive steroids in dried eluates from chromatographic columns.
DISCUSSION
The ethanolic sulfuric acid reagents here described are clearly valua- ble aids in the analysis of n5-3,6-OH steroids. When the steroids are adequately purified, their absorption spectra can often be used both for identification and quantitation. A number of compounds, such as 17-OH- pregnenolone and pregnenediol, for which no practicable method existed, can be calorimetrically assayed.
Comparison of the Allen and Oertel reagents shows that there is often little to choose between them. In general, the Allen reagent gives more distinctive spectra.
416 WILSON
It should be emphasized that not all n5-3,C?-OH st,eroids give the strong absorption near 405 rnp (yellow color) reported by Oertel and Eik-Nes (3). However, those compounds in our series which lacked this band, had other characteristic maxima which could serve the same purpose. The conjugated n5-7-ketone of 7-ketodehydroepiandrosterone resembles con- jugated n4-3-ketones in that a strong band at 285 m,u dominates the spectrum initially.
The ethanolic reagents also give typical spectra with a number of other steroids. Their use in identification requires less rigid standards of clean- liness in glassware and reagents than are needed with concentrated sul- furic acid.
SUMMARY
Absorption spectra between 200 and 700 mp of eleven n5-3/3-OH steroids have been determined at room temperature in the Allen and Oertel ethanolic sulfuric acid reagents, and in concentrated sulfuric acid.
All but three of these steroids gave typical high peaks near 408 rnp with either ethanolic reagent. Those three had other characteristic peaks.
n5-Pregnene-3,0,17ol,20a-trio1 showed an unusual play of colors with the Allen reagent, turning deep violetrblue in 30-40 min.
The ethanolic reagents, particularly that of Allen, provide means for the simultaneous identification and determination of these n5-3P-OH steroids. Distinctive curves were given by a number of other steroids as well. The reagents are useful for locating reactive compounds on paper chromatograms and in column eluates.
REFERENCES
1. ZAFFARONI, A., J. Am. Chem. Sot. 72, 3828 (1950). 2. BERNSTEIN, S., AND LENHARD, R. H., J. Org. Chem. 18, 1146 (1953). 3. OERTEL, G. W., AND EIK-NES, K., Anal. Chem. 31, 98 (1959). 4. ALLEN, W. M., HAYWARD, S. J., AND PINTO, A., J. Clin. Endocrinol. 10, 54 (1950). 5. KALANT, H., Biochem. J. 69,79 (1958). 6. SWEAT, M. L., Anal. Chem. 26,773 (1954). 7. PETERSON, R. E., J. Biol. Chem. 225, 25 (1957). 8. KALANT, H., Biochem. J. 69,93 (1958). 9. WILSON, H., FAIRBANKS, R., SCIALABBA, D., MCEWEN, C., AND ZIFF, M., J. C&n.
Endocrinol. and Metabolism 16, 86 (1956). 10. BUSH, I. E., Biochem. J. 50, 370 (1952). 11. BURTON, R. B., ZAFFARONI, A., AND KEUTMANN, E. H., J. Biol. Chem. 188, 763
(1951). 12. WILSON, H., LIPSETT, M. B., AND BUTLER, L. C., J. Clin. Endocrinol. and Metabo-
lism 20, 534 (1960). 13. HIRSCHMANN, H., AND HIRSCHMANN, F. B., J. Biol. Chem. 187, 137 (1950). 14. WILSON, H., Arch. Biochem. Biophys. 52,217 (1954). 15. ALLEN, W. M., J. Clin. Endocrinol. lo,71 (1950).